
Tuning Transport Phenomena in Agarose Gels for the Control of Protein Nucleation Density and Crystal Form


1
Department of Applied Science and Technology, Politecnico di Torino, 24 Corso Duca degli Abruzzi, 10129 Torino, Italy
2
Molecular Biology Institute of Barcelona, Carrer Baldiri Reixac 4-8 (Science Park), 08028 Barcelona, Spain
3
Laboratorio de Estudios Cristalográficos, Instituto Andaluz de Ciencias de la Tierra (Consejo Superior de Investigaciones Científicas-Universidad de Granada), Avenida de las Palmeras 4, 18100 Armilla, Spain
*
Author to whom correspondence should be addressed.
Crystals 2021, 11(5), 466; https://doi.org/10.3390/cryst11050466
Submission received: 30 March 2021
/
Revised: 20 April 2021
/
Accepted: 20 April 2021
/
Published: 22 April 2021
(This article belongs to the Special Issue Nonclassical Nucleation—Role of Metastable Intermediate Phase on Crystal Nucleation)
Abstract
:Agarose gels provide the ideal environment for studying the nucleation step of complex biomacromolecules under diffusion-controlled conditions. In the present paper, we characterized the influence of agarose on the nucleation of three model proteins, i.e., lysozyme, insulin, and proteinase K, as a function of the agarose concentration using a batch method set-up inside flat capillaries. By using this set-up, we were able to directly count the number of crystals in a given volume and correlate it with the amount of agarose and with the average crystal size. We also studied the crystallization behavior of proteinase K with free-interface diffusion so that batch conditions were achieved through slow diffusion of the precipitant. Thanks to the control over the protein mass transport imposed by the network, a previously unknown crystal form, P212121, was obtained, and the three-dimensional structure was determined at a 1.6 Å resolution. Overall, the versatility of agarose gels makes them ideal candidates for the preparation of microcrystalline suspensions of biopharmaceuticals with precise and reproducible crystal attributes or for the exploration of the existence of different polymorphs.
1. Introduction
Protein crystals are vital for the structural analysis of biomacromolecules and the understanding of their biological activity. At the same time, proteins in the form of crystalline materials are rapidly gaining pharmaceutical interest. Differently from the variety of platforms available for small-molecule drugs [1,2], the delivery and the controlled release of biopharmaceuticals still represent technological challenges [3]. Starting from the first successful application of injectable insulin microcrystals for treatment of diabetes, a number of crystalline formulations of other therapeutic proteins are currently under investigation. The administration of proteins as a microcrystalline suspension potentially displays several advantages over the dissolved form. Among these, the increased stability of the protein against external stresses and the tuning of dissolution rates are of outstanding importance. The latter property, together with other physico-chemical attributes of the crystals, such as color and brittleness, depends on the specific polymorph and crystal morphology obtained after the protein crystallization. In vitro release tests demonstrated that rod-like amylase crystals promoted faster release of the protein compared to the grain-shaped crystals [4]. The dissolution rate, in turn, dictates the drug uptake and the bioavailability in the human body. In addition, the delivery of biopharmaceuticals as a crystalline material may rely on highly concentrated formulations with low viscosity and increased biointegrity from the processing stage to the delivery to the patients. Protein crystals may also be incorporated inside in situ formable gels that can be injected and act as depots for the sustained release of therapeutics [5]. Very recently, the use of Fmoc-dipeptide and agarose hydrogels was shown to produce two novel thermally stable insulin formulations with different release profiles using non-modified human insulin [6]. However, the scale-up of crystal attributes to large-scale production and the constraints imposed over the selection of accepted excipients by regulatory agencies have limited the commercialization of crystalline formulations of biopharmaceuticals [7]. Recent advances using agarose gels have demonstrated the potential of using gels to produce reasonably homogeneous crystal size distributions in batches combined with easy scalability [8].
In a parallel fashion, the use of polysaccharide-based biomaterials for drug delivery purposes is undergoing rapid growth [9]. Among these materials, agarose is being increasingly employed to design scaffolds for the protection and the controlled release of therapeutic agents. The neutral surface charge of agarose limits the formation of the protein corona on nanodevices, ensuring a more efficient delivery process [10]. The material can be gelled thanks to physical cross-linking without the need for chemical reactions. At the same time, it can easily be functionalized due to the switchable chemical reactivity. In addition, agarose is a biocompatible and water-soluble polysaccharide with excellent mechanical properties [11]. Due to their features, agarose gels have been employed for protein crystallography studies, as a medium for promoting and optimizing the crystallization of proteins [12,13,14,15], or for delivering crystals for serial crystallography at synchrotrons [16]. In addition, agarose gels have recently been employed for studying the laser-induced nucleation of proteins [17] and for promoting the appearance of unknown morphologies of glycine crystals [18].
The studies on nucleation require tightly controlled conditions, as we will see in this issue [19]. For example, the impact of self-assembled surface functionalization on drug nucleation was studied by confining crystallization to thin films to maximize the surface action [20]. As far as more complex macromolecules are concerned, the gelification of the crystallization medium is ideal for the study of nucleation and crystal growth because it establishes a diffusion-controlled environment [21]. From this perspective, agarose gels represent an ideal medium for investigating the nucleation step. Inside the agarose gel, the locus of nucleation corresponds to the locus of growth, as the sedimentation of the growing crystals is hindered, thus avoiding buoyancy-induced convective flows. In addition, the depletion zone around the corners of the crystals is eliminated thanks to the constant supply of macromolecules by diffusion, leading to conditions that resemble the microgravity environment [22,23,24]. Agarose provides a neutral support for nucleation in terms of both net charge and chemical interaction with the proteins. In our previous publication [25], we employed agarose gels to grow protein crystals with tailored sizes depending on the agarose concentration. The inducing action of the gel on the nucleation processes was attributed to the favorable physical interactions with the crystallization environment.
In the present article, agarose gels are presented as a versatile platform for investigating several aspects of the nucleation of proteins. Firstly, we evaluated the nucleation density of three model proteins crystallized inside flat capillaries loaded with agarose gels. A correlation was found between the nucleation density and the agarose concentration. Then, agarose gels were employed to support the screening of the crystallization conditions of proteins. Lastly, we propose agarose gels for the study of protein polymorphism under free-interface diffusion conditions. A previously unknown crystal form of proteinase K was obtained, and the three-dimensional structure was determined and deposited in the PDB.
2. Materials and Methods
2.1. Materials
Lysozyme obtained from hen egg white (62971, HEWL, three-times crystallized powder), proteinase K (A3830, lyophilized), and human insulin (11376497001, lyophilized) were purchased from Sigma-Aldrich (Madrid, Spain), PanReac AppliChem (Barcelona, Spain), and Roche Diagnostics GmbH (Mannheim, Germany), respectively. All of the proteins were directly dissolved in their corresponding buffers (Table 1). The protein concentrations were measured spectrophotometrically at 280 nm. OmniPur agarose (2120) was obtained from Calbiochem (San Diego, CA, USA).
2.2. Crystallization of Proteins
The crystallization of three commercially available proteins was studied in the presence of different amounts of agarose gel. All of the solutions were passed through 0.22 µm syringe filters prior to use. All of the experiments were performed in triplicate and kept at 20 °C in an incubator.
2.2.1. Batch Crystallization in Flat Capillaries
The dissolution of agarose in MilliQ water was carried out at 95 °C using a thermoblock. After complete dissolution, the agarose sol was kept at 45 °C. As a first step, stock solutions of precipitant, protein, and agarose were mixed together inside PCR vials at 45 °C, keeping the same order of addition. The ratio between the various solutions was dictated by the final concentration of each species in the crystallization batch, as listed in Table 1. Proteinase K, HEWL, and insulin were selected as model proteins. A total of 6.0 mg/mL of proteinase K buffered in 50 mM HEPES (pH 7.0) was crystallized with 0.5 M sodium nitrate, 25 mM sodium citrate, and agarose concentrations ranging from 0 to 1.9% (w/v). As regards insulin, each batch was made of 4.0 mg/mL of protein in 25 mM HCl, 5 mM ZnCl2, 35.2 mM Na citrate (pH 7.0), and 5% (v/v) acetone. Lastly, 22.0 mg/mL of HEWL buffered in 50 mM sodium acetate (pH 4.5) was crystallized with 0.75 M NaCl. For HEWL and insulin, the agarose concentration ranged from 0 to 2.1% (w/v). The hot mixtures were then loaded into pre-heated flat capillaries (60 mm long and 0.3 mm path length, VitroCom, NJ, USA). The ends of the capillaries were plugged with sealing paste and covered with a layer of nail enamel to avoid drying. The capillaries were then incubated at 20 °C and periodically inspected with an optical microscope (AZ100 Nikon, Alzenau, Germany).
For the quantification of nucleation, each capillary was divided into 12 segments of 0.5 cm each. Three segments were analyzed per sample, and the position of the selected segments was maintained for all of the samples. For experiments containing a high number of crystals, i.e., >103, images were taken at three different focal planes and merged to detect all of the crystals within the defined volume. For samples characterized by fewer and larger crystals, a single focal plane was used. The collected images were processed with the ImageJ [26] software (version 1.52) for the evaluation of the crystal density. For each segment, a grid was created whose mesh size depended on the number and the size of the crystals. Crystals were counted inside each mesh; their number was averaged and then divided by the considered volume to get the nucleation density.
2.2.2. Free-Interface Diffusion Crystallization in Capillaries and PCR Vials
Free-interface diffusion (FID) crystallization experiments were set up inside capillaries to study the crystallization of proteinase K with variable amounts of agarose. Agarose sols were prepared as previously described and mixed with stock solutions of the protein at 45 °C. The final composition of the mixture was 25 mg/mL of proteinase K in 50 mM HEPES pH 7.0 and 0.1–1.5% (w/v) agarose. The mixture was loaded inside the capillary and cooled down to room temperature to trigger agarose gelification. Then, the capillaries were immersed in 50 µL of 3 M (NH4)2SO4 in 0.1 M Tris pH 8.0. The samples were incubated at 20 °C and periodically inspected with optical microscopy. Analogous FID experiments were performed using 15 mg/mL of proteinase K in 50 mM HEPES pH 7.0 and 0.5% (w/v) agarose, as well as 2.5 M (NH4)2SO4 in 0.1 M Tris pH 8.0.
Additional experiments were performed to investigate the polymorphism of proteinase K. FID was performed inside PCR vials. The final composition of the mixture was 13 mg/mL of proteinase K in 50 mM HEPES pH 7.0 and 0.5% (w/v) agarose. A total of 50 µL of the mixture was dispensed inside the vial and cooled down to room temperature to trigger agarose gelification. Once the gelification was completed, 50 µL of 1.8 M (NH4)2SO4 in 0.1 M Tris pH 8.0 was added on top of the gel. The samples were incubated at 20 °C and periodically inspected with an optical microscope.
2.3. Data Collection and Structure Determination
Proteinase K crystals grown according to the protocol for FID crystallization in PCR vials presented in Section 2.2.2 were diffracted at the BL13-XALOC beamline at ALBA, the Spanish synchrotron radiation source (Barcelona, Spain). Firstly, needle crystals of proteinase K were recovered from the precipitant compartment using a pipette (200 µL) with the tip end cut and were deposited over a plastic Petri dish in drops of 5 to 10 µL of the recovered precipitant solution. After that, isometric crystals were extracted from the agarose gel using the same tip and deposited in the dish. With the help of microtools (Hampton Research, Laguna Niguel, CA, USA) and a paintbrush, crystals were cleaned from the rest of the agarose, although no special care was taken to remove it completely because it did not affect the diffraction. Drops of 1.0 µL of the precipitant supplemented with 20% v/v glycerol as a cryo-protectant were used to soak individual crystals for 10 s with the help of a LithoLoop (Molecular Dimensions Inc., Apopka, FL, USA) prior to flash cooling them in liquid nitrogen and storing for data collection.
X-ray diffraction data were collected at 100 K using a Pilatus 6M photon-counting detector (DECTRIS, Baden, Switzerland). Several datasets were collected from the regularly shaped and needle crystals of proteinase K. Diffraction data were indexed and integrated using iMosFLM [27], scaled, and reduced with AIMLESS [28] from the CCP4 suite [29]. The crystal structure of proteinase K was determined by the molecular replacement method with MOLREP [30] and using the 3D structural model PDB ID. 2V8B as the search model. Refinement was done with phenix.refine [31] and Refmac [32] with cycles of manual rebuilding using COOT [33] and was finalized using several cycles of refinement by applying TLS parameterization [34]. The final refined model was checked with Molprobity [35]. The data collection and refinement statistics are summarized in Table 2. The coordinates and structure factors were deposited in the protein data bank with accession codes ID. 7NUZ and 7NUY.
3. Results and Discussion
3.1. Agarose Gel as a Supporting Medium for Nucleation Studies
Agarose gels allow the study of protein crystallization in diffusive environments thanks to the suppression of the convective mass and heat transport [36]. In our previous publication [25], a correlation between the protein crystal size measured at equilibrium and the agarose concentration was identified and was found to be independent of the protein’s nature. All the evidence pointed out the ability of agarose gels to induce crystallization due to the physical interaction with the protein. However, direct information on the nucleation step was missing because the experimental set-up did not allow for the direct tackling of nucleation. In order to gain further insight into the nucleation phenomena inside gelled media, an alternative approach is presented here. Batch crystallization was performed inside flat capillaries, facilitating the observation of crystals and allowing for the quantification of the exact number of crystals within a predetermined volume. Hence, the nucleation density could directly be evaluated. The crystallization conditions of three model proteins—namely, proteinase K, insulin, and HEWL—were carefully tailored in order to deal with a wide range of densities and sizes of crystals as a function of the agarose concentration. The three proteins were selected because they significantly differed in their isoelectric point, charge distribution, and molecular weight. In this way, the role of agarose in governing protein nucleation could be generalized. The average crystal size progressively increased from proteinase K to insulin and HEWL, as shown in Figure 1, ranging from a few to hundreds of µm. The average size of the crystals decreased as a function of the agarose concentration, resulting in progressively denser crystal populations.
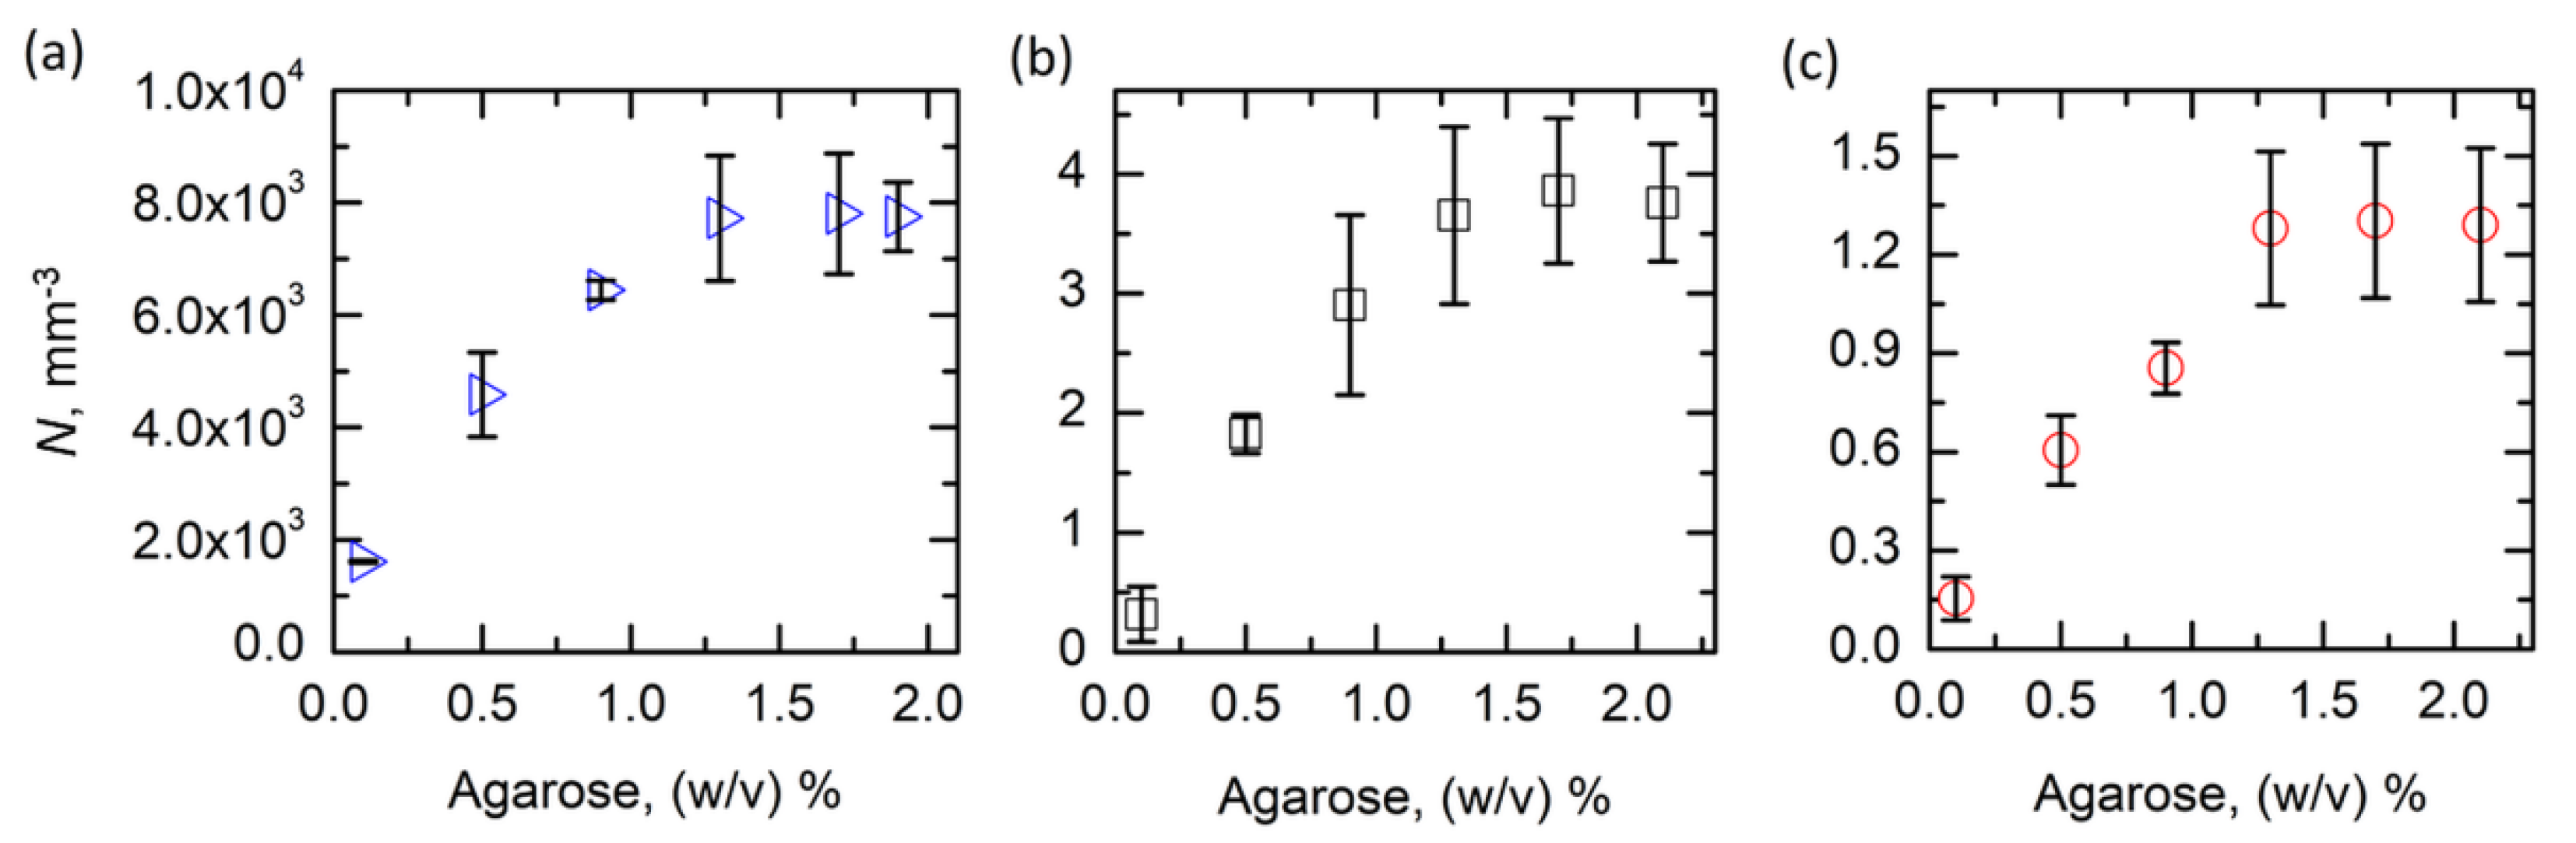
Thanks to the easy visualization with optical microscopy of all of the crystals in a selected volume of the flat capillaries, the number of nuclei per unit volume, i.e., the nucleation density, N, was evaluated. N was taken as the number of crystals per unit volume, as all of the analyses were performed after reaching equilibrium, i.e., a constant number of grown nuclei. Thanks to the tuning of the crystallization conditions and the crystal size, different orders of magnitude of N could have been explored—namely 103, 100, and 10−1 for proteinase K, insulin, and HEWL, respectively. In this way, a generalization of the results over a wide length scale could be obtained. Figure 2 reports the trends of N as a function of the agarose concentration in the system for the three selected proteins. The investigation was carried out in the viscoelastic region of the gel, i.e., agarose ≥0.1% (w/v) [36], to avoid the transitory effects on nucleation due to the gel physics. Overall, proteinase K resulted in the highest nucleation density, together with the smallest crystal size. N was successfully tuned from 1.8 to 7.9·103 crystals/mm3. Similar behaviors were observed for insulin and HEWL, although the nucleation density was reduced by more than three and four orders of magnitude, respectively. Generally, N sharply increased from 0.1 to 1.3% (w/v) agarose, and then stabilized on a plateau for higher gel contents. The standard deviation of data was higher in systems that were more concentrated in agarose because samples with a larger numbers of crystals were most affected by the sampling method.
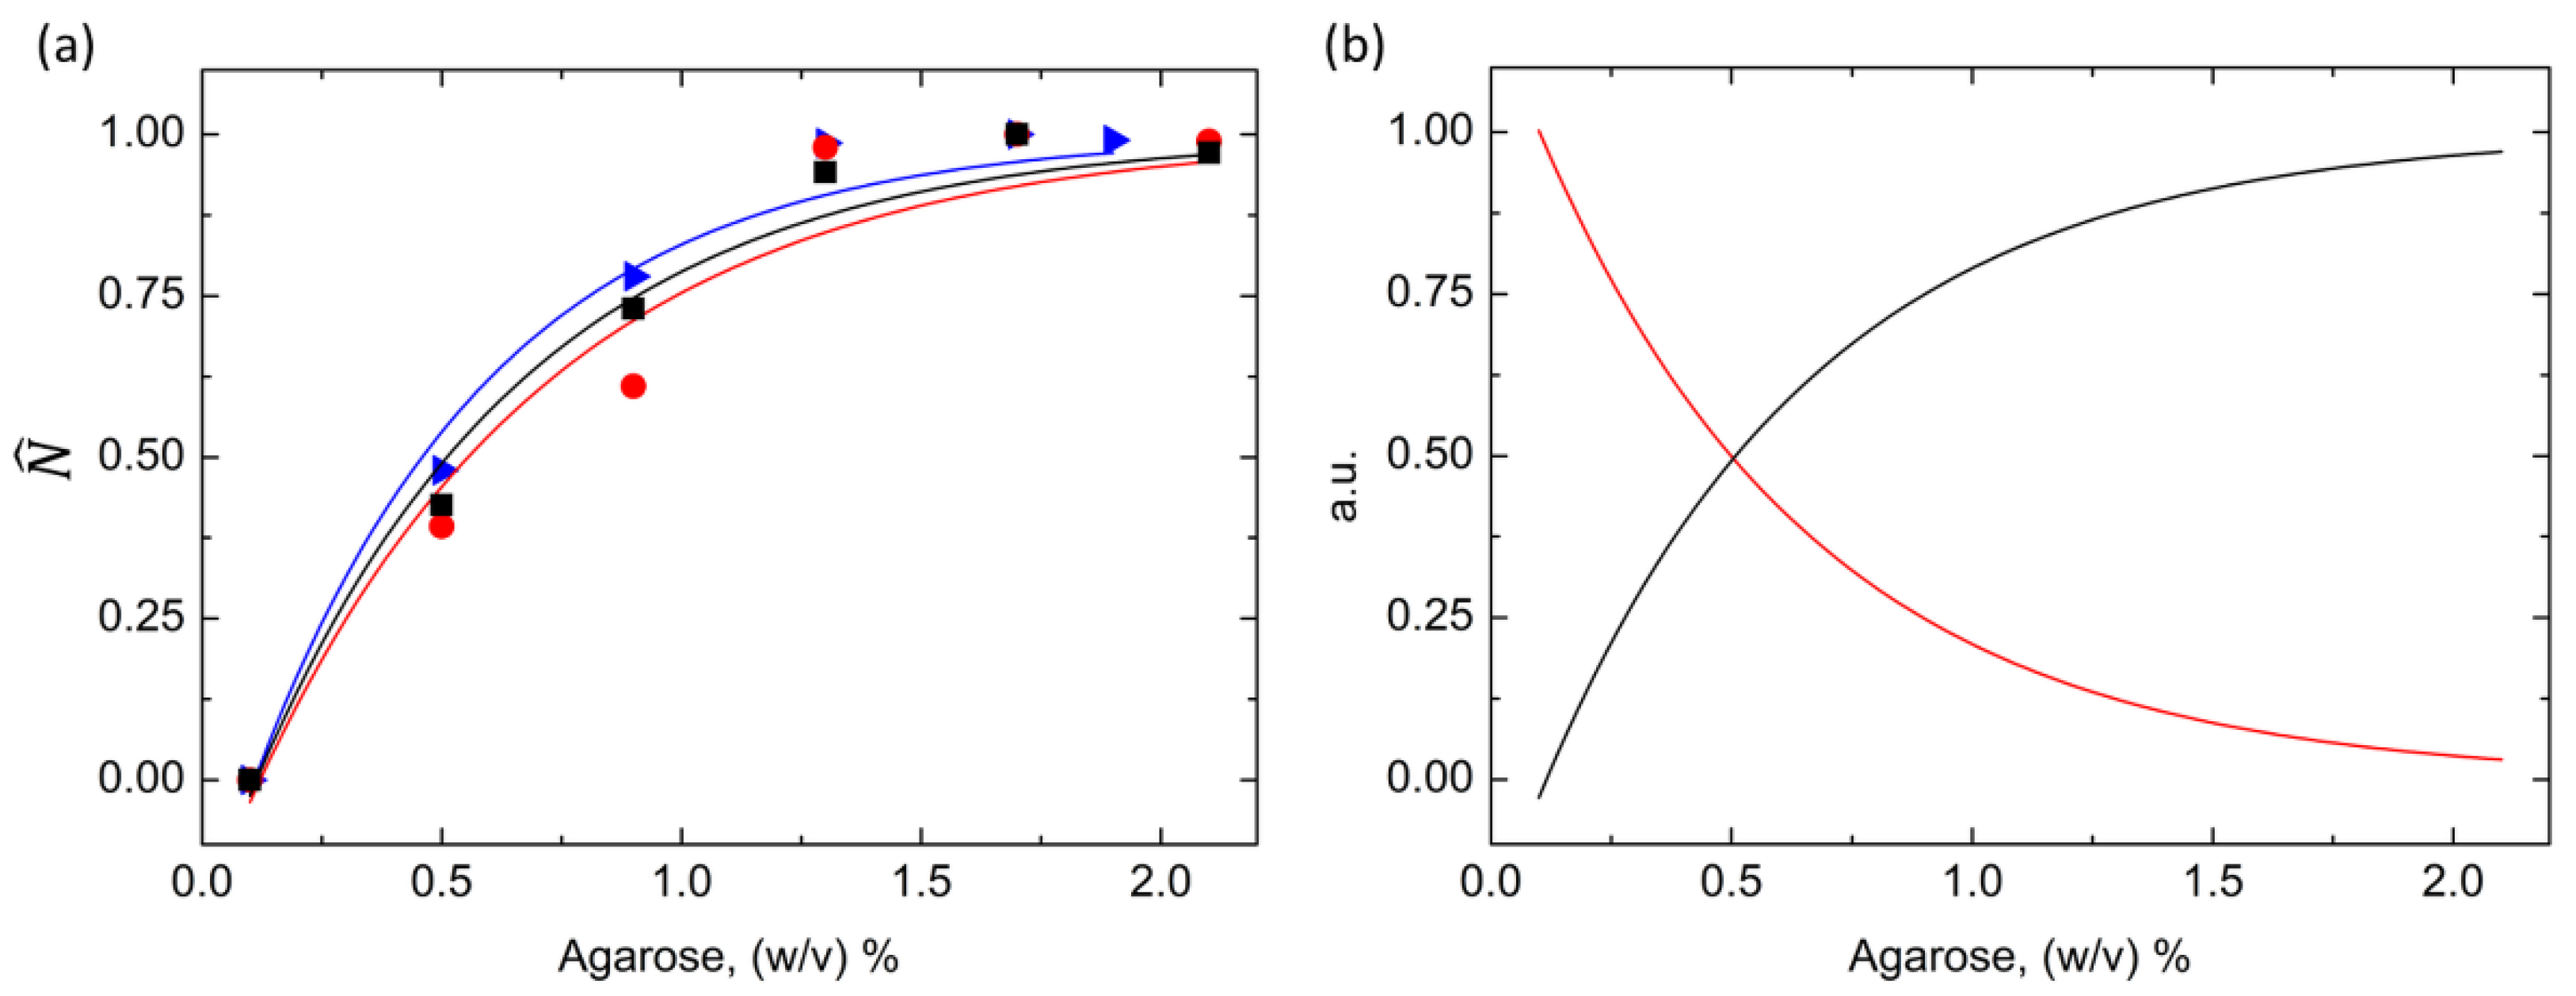
The nucleation densities of the three proteins were divided by their respective plateau values to obtain the normalized nucleation density, . The experimental trends were successfully fitted (R2 > 0.98) with a single exponential law in the form:
where AN and BN were two fitting parameters, and Caga was the agarose concentration in the system. As reported in Figure 3a, the normalized nucleation density of the three model proteins, although showing markedly different values, could be described by a unique mathematical model. The pre-exponential factors and the decay constants are listed in Table S1, and they did not show significant variations with respect to the protein’s nature. In addition, a comparison between the general laws describing the normalized nucleation density and the normalized crystal size,
, as a function of the agarose concentration was carried out. The crystal size data were already reported in our previous publication [25]. The model parameters were obtained by averaging the fitting parameters calculated for the three proteins. The general laws turned out to be:
and are represented in Figure 3b. The effect of the agarose network on the nucleation density and the crystal size was analogous, as highlighted by the good agreement between the fitting parameters of the two laws. More specifically, and underwent the same initial alteration imposed by the gel, and the action of the gel was fulfilled for the same agarose concentration, i.e., 1.3%.
The results demonstrated that the nucleation density and the final size of the crystals grown in agarose gels are correlated. A very similar trend was obtained for the evolution of the homogenous nucleation rate of NaCl in aqueous solutions as a function of supersaturation, as obtained with molecular dynamics simulations [37]. This parallelism suggests that the increment in the agarose concentration can be assimilated with an increment in the effective supersaturation of the system. Such a result further supports the hypothesized mechanism for the nucleation-induction ability of agarose gels based on the entrapment of water by the agarose fibers and the consequent decrease in water activity in the protein solution. However, other experiments showed that, in many systems, the nucleation rate goes through a maximum as the supersaturation increases [38].
The implications of this first part of the study are manifold. From a modeling point of view, the finding enables the a priori prediction of the crystallization outcome in gels. Thus, only a few initial trials would be necessary to build the model and set up the crystallization conditions to obtain protein crystals that meet a target size and even a target density. Such an approach can support and make the sample preparation for X-ray free-electron laser (XFEL) and serial millisecond crystallography (SMX) much easier. In addition, the results demonstrated that the nucleation phenomena in agarose gels are directly correlated with the final crystal size. Thus, if the nucleation step had to be investigated, it would be enough to study the size of the crystals, which is far easier and less time consuming and can be carried out in any kind of system, e.g., vials, tubes, and round capillaries, or can even be automatically set-up.
3.2. Exploring the Low Supersaturation Regime Using Agarose Gels
The use of capillaries and gel membranes for slow equilibration is the origin of the free-interface diffusion (FID) technique [39], from which the counter-diffusion technique was derived to extend the screening conditions in a single experiment [40]. Both Zeppezauer [39] and Salemme [41] explored different set-ups of FID to produce protein crystals at a time when micro-methods were far from being standard in crystallization. Their set-ups are very advantageous because they reduce the protein consumption, limit convection, and, therefore, provide an enhanced tool for growing larger and better-quality crystals. It is clear that crystal size has become a relevant issue for neutron diffraction, and this was our motivation for exploring the use of agarose at low supersaturation.
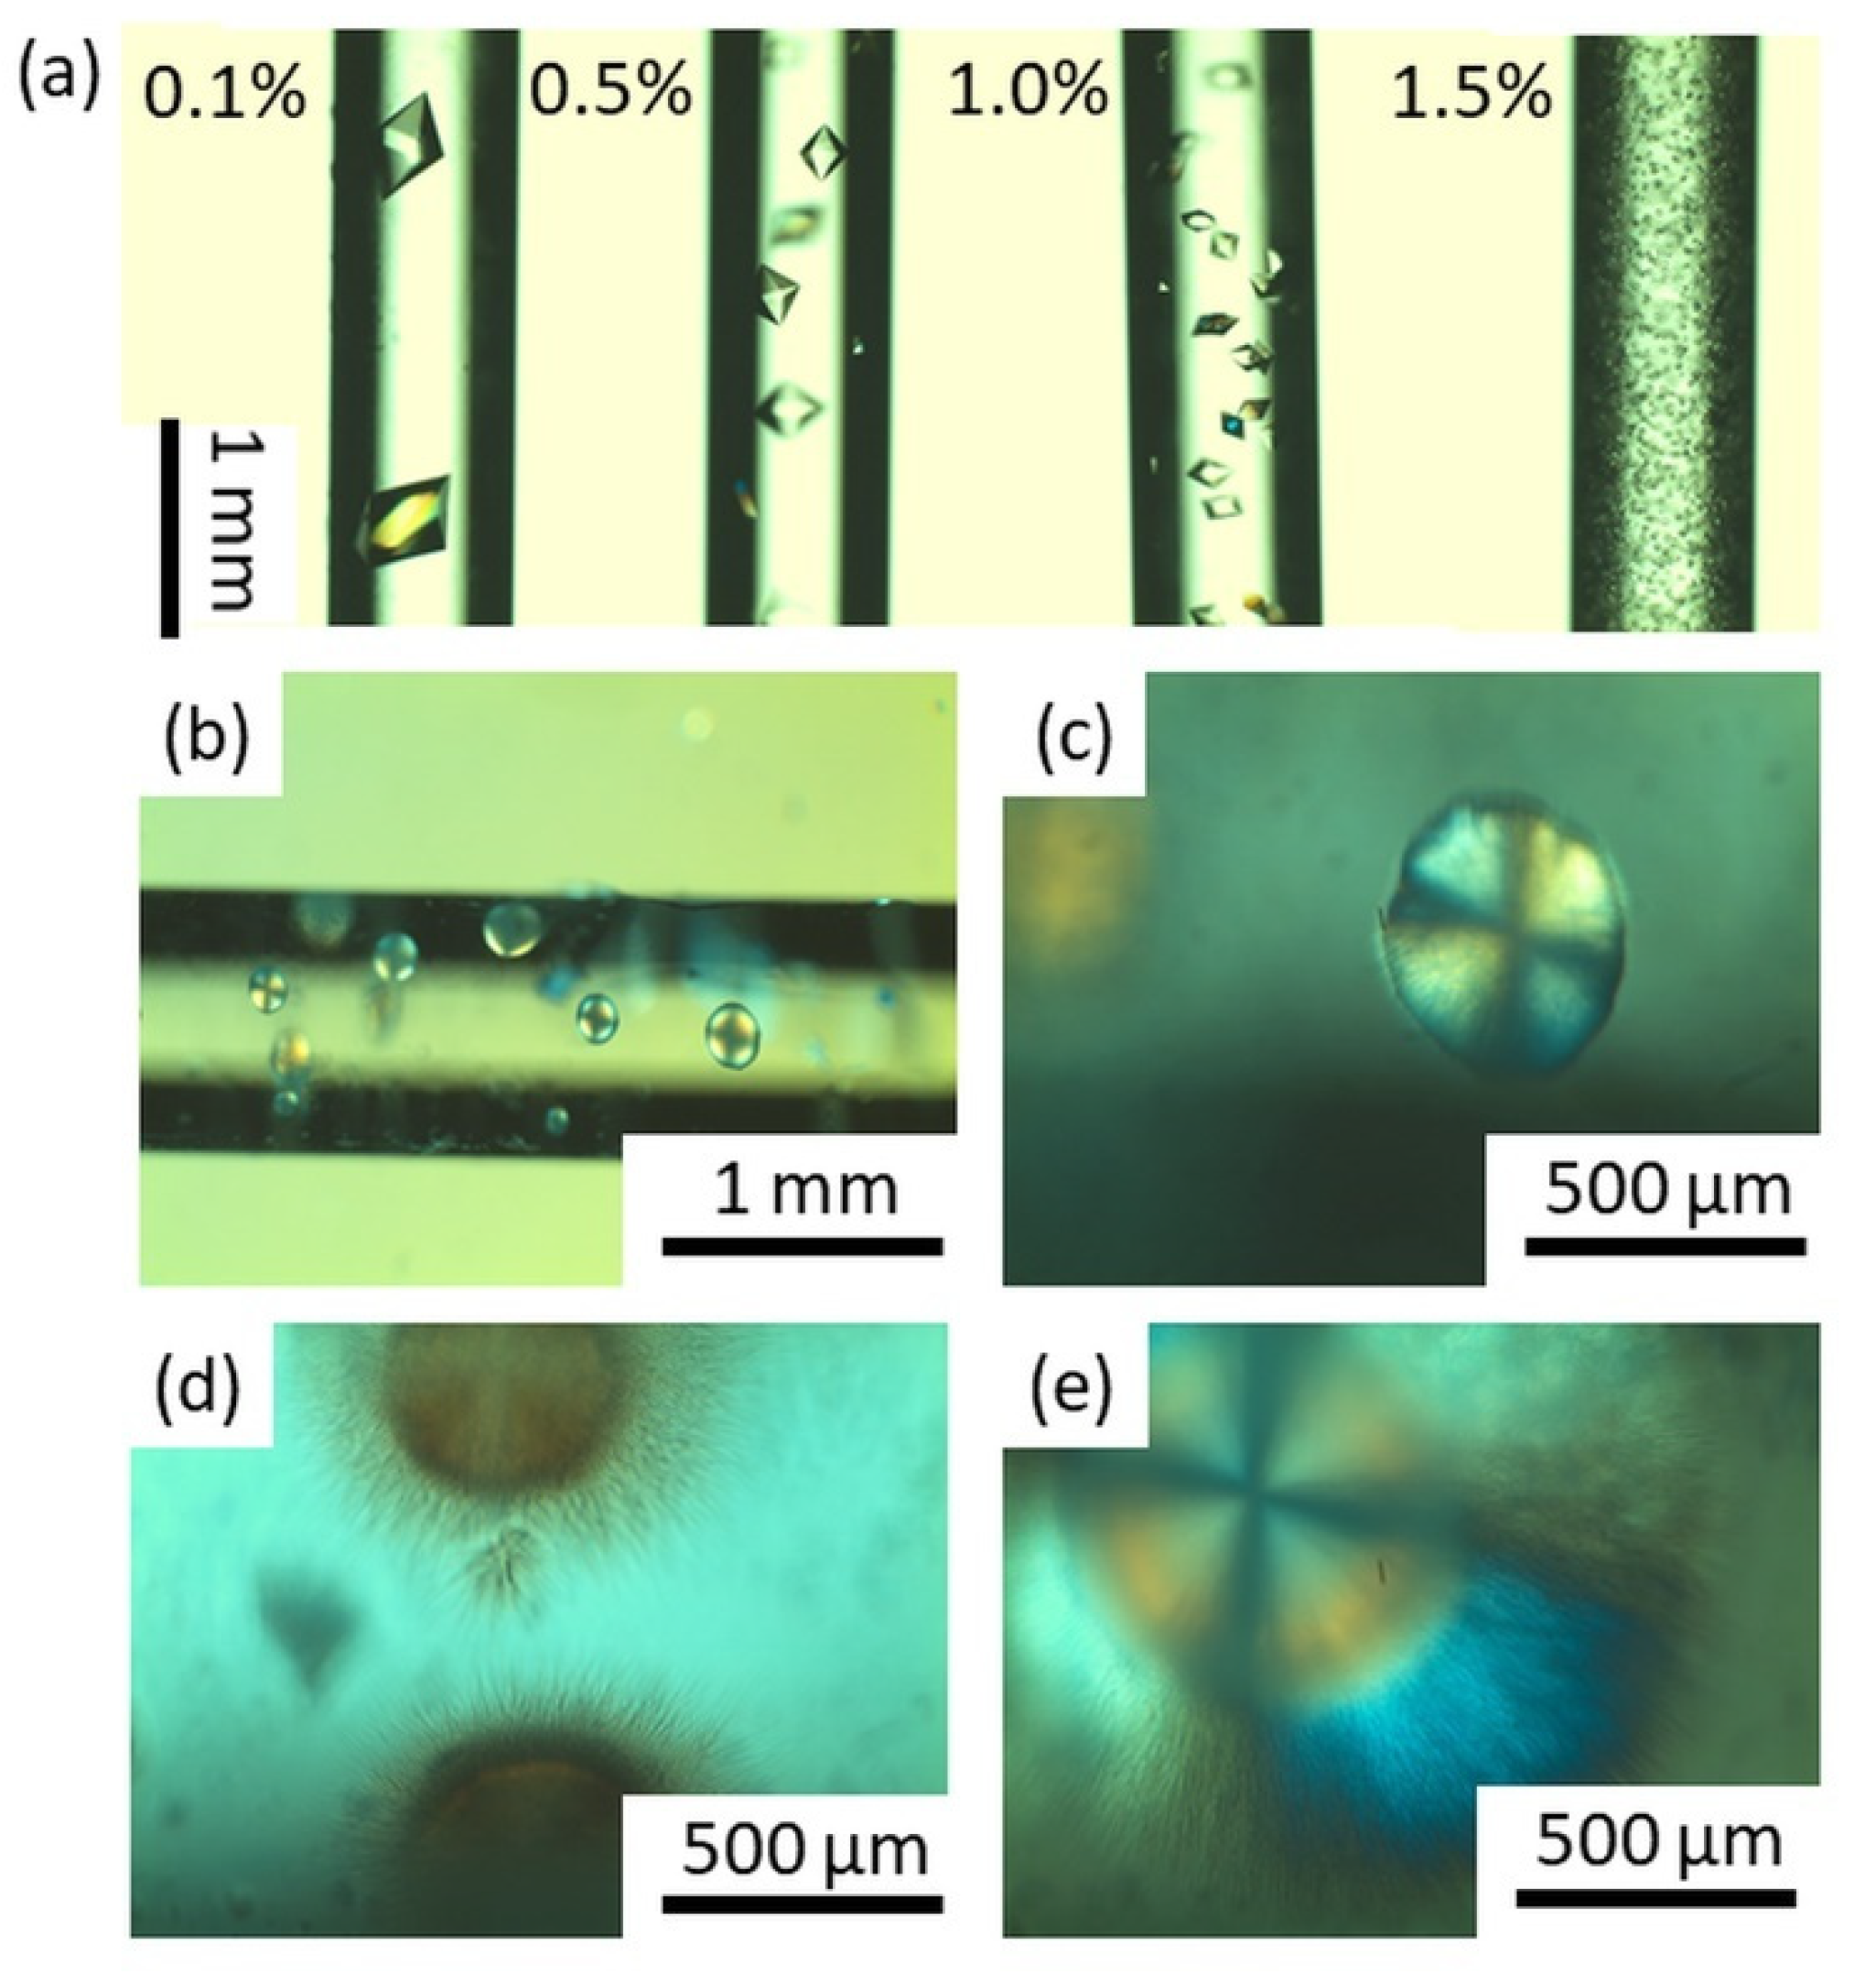
We selected proteinase K because, as reported in our previous work, it can be crystallized under several crystallization conditions [25]. An initial screening was performed using the hanging drop vapor diffusion method, which, under selected conditions, produced single crystals bigger than 500 µm (Figure S1). Thereafter, we set up FID crystallization of proteinase K in capillaries. The protein was immobilized in the gel phase inside the capillary, which was immersed in the precipitant solution. Initially, the protein and salt concentrations were set at 25 mg/mL in 50 mM HEPES pH 7.0 and 3 M (NH4)2SO4 in 0.1 M Tris pH 8.0, respectively. The agarose concentration varied between 0.1 and 1.5% (w/v). As expected, the nucleation density increased with the agarose concentration (Figure 2a). The average crystal size was constant along the capillary, denoting the absence of gradients in the precipitant concentration, and the biggest crystal, almost 1 mm, was obtained with the lowest agarose concentration. When pushing this concept further by lowering the protein (15 mg/mL) and the precipitant (2.5 M) concentrations while keeping a high agarose concentration of 0.5% (w/v), the system produced a singular crystallization outcome (Figure 4b).
Different morphologies, probably corresponding to a different polymorph, were observed along the capillary. Near the end of the capillary, in contact with the precipitant solution, spherulites of approximately 400 μm were obtained (Figure 4c). In the central zone of the capillary, most of the spherulites were completed with a corona of needle-like crystals (Figure 4d), growing progressively larger when moving towards the opposite end of the capillary (Figure 4e). In contrast with the FID crystallization of proteinase K reported in Figure 4a, the morphology of the crystals along the capillary suggested the presence of a gradient of supersaturation and coupled growth. Near the interface with the precipitant compartment, the nucleation events were strongly promoted, and only spherulites were observed. Moving away from the interface, the growth of needle crystals became competitive with the nucleation step, and a corona was formed. The needle corona was thus attributed to the competitive growth of the crystals forming the spherulite.
We can consider that not only do the supersaturation ratio play a role in nucleation and growth, but protein concentration may also be relevant in the polymorph selection. High supersaturation levels promoted the nucleation and the growth of crystals under FID conditions because of the boost in nucleation kinetics and the large amount of protein readily available to form nuclei. On the other hand, low supersaturation levels revealed the presence of a gradient of crystallization conditions along the capillary and the appearance of uncommon crystal morphologies.
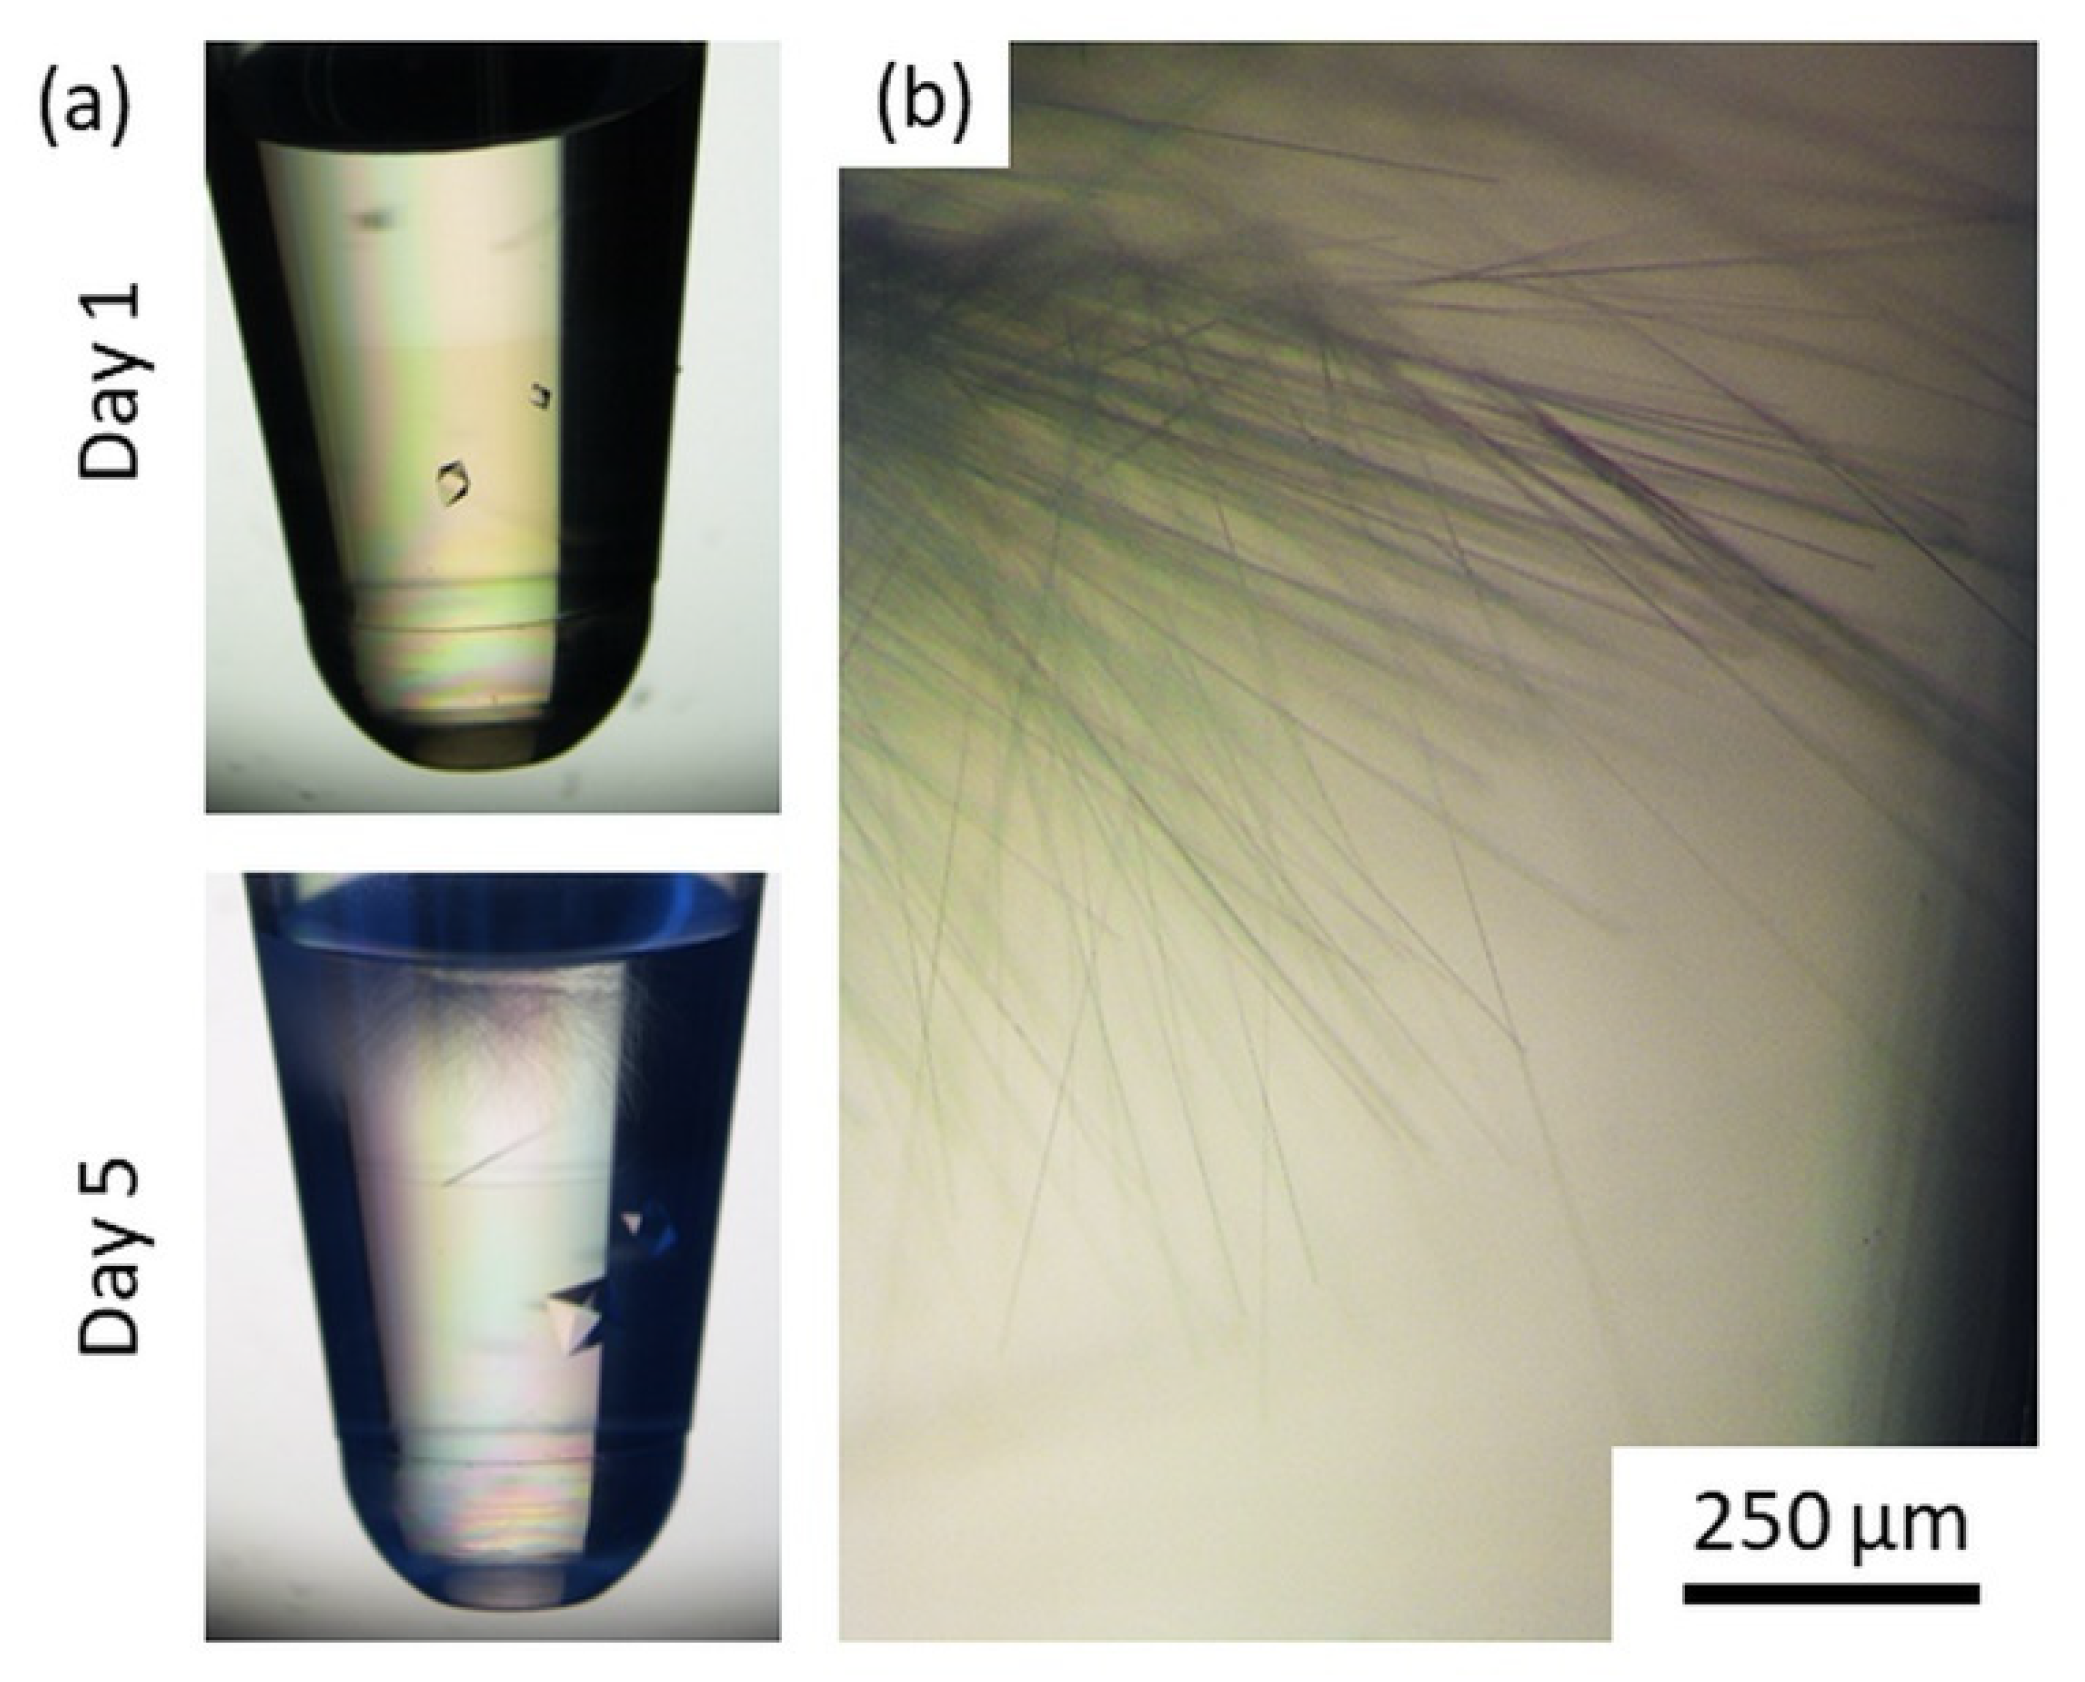
In parallel, and to eliminate the constraints imposed by the capillary diameter, we set up FID experiments in PCR tubes (Figure 5). The proteinase K was kept at 13 mg/mL in 0.5% (w/v) agarose and the precipitant concentration was further reduced to 1.8 M (NH4)2SO4. Identical volumes of gel protein and precipitant were employed. Because the diffusion of the precipitant was more than one order of magnitude faster than that of the protein, the first nucleation event was observed in the agarose gel layer after 24 h (Figure 5a). Regular isometric crystals grew to a size bigger than 1 mm. Nonetheless, as a result of the slow release of proteinase K from the gel matrix, crystals with a different morphology were observed after five days in the precipitant compartment. As highlighted in Figure 5b, acicular proteinase K crystals were obtained, probably corresponding to the same crystal form of the spherulites obtained in the capillaries.
The small isometric crystal—approximately 400 μm—and the needle crystals were cryoprotected, and X-ray data were collected at synchrotron source. The biggest crystals correspond to the already reported P43212 space group [42,43,44], while the needles belong to the P212121 space group (see Table 2 for details). Interestingly, the crystal grown in 0.5% agarose gel diffracted X-ray to a 1.09 Å resolution, while the orthorhombic needle grown in solution diffracted to a 1.6 Å resolution.
The growth of new polymorphs in gel media has been previously reported for proteins, when using peptide hydrogels [45,46], and for inorganic crystals grown in agarose [47], but in our case, the nucleation of a distinct crystal form was obtained due to the slow release of the protein from the agarose network into the precipitant compartment. We believe that the tuning of the protein mass transport imposed by the agarose gel played a pivotal role in the early stabilization of pre-nucleation clusters characterized by a different spatial arrangement of the macromolecules. The formation of a nucleus represents a transient—rather than steady-state—process. By employing agarose gels as a reservoir for the slow and controlled release of macromolecules, we could modify the kinetic interplay between the selective nucleation and the mass transport of the protein in solution. In conclusion, diffraction-quality crystals of a metastable form could have been grown and analyzed.
4. Conclusions
In this work, we demonstrated the potential of using agarose in protein crystallization. We corroborated the direct correlation between agarose concentration and increase in nucleation density, which is inversely correlated with crystal size. This mathematical correlation is independent of the protein’s nature and is therefore applicable for the prediction of both nucleation density and final crystal size with minimal requirements for experimental data. The nucleation induction effect can be further exploited to reduce the amount of protein required to obtain a crystal or to ensure nucleation under low-supersaturation conditions to grow big crystals. Finally, this provides a way to explore kinetically inaccessible regions of the phase diagrams by using other crystallization techniques.
Supplementary Materials
The following are available online at https://www.mdpi.com/article/10.3390/cryst11050466/s1, Table S1: The fitting parameters of the exponential law used to fit the experimental data of the nucleation density vs. agarose gel trend, Figure S1: Single proteinase K crystals grown with the HDVD crystallization method.
Author Contributions
Conceptualization, F.A., A.C., and J.A.G.; methodology, F.A. and J.A.G.; formal analysis, F.A. and J.A.G.; experimental investigation, F.A.; data collection and structure determination, J.A.G.; writing—original draft preparation, F.A.; writing—review and editing, F.A. and J.A.G.; supervision, R.P. and J.A.G.; funding acquisition, J.A.G. All authors have read and agreed to the published version of the manuscript.
Funding
This research was funded by the project BIO2016-74875-P (MINECO), Spain, co-funded by the Fondo Europeo de Desarrollo Regional (FEDER funds), European Union.
Institutional Review Board Statement
Not applicable.
Informed Consent Statement
Not applicable.
Data Availability Statement
The 3D coordinates and structure factors have been deposited in the PDB with ID 7NUZ and 7NUY for the tetragonal and orthorhombic polymorphs, respectively.
Acknowledgments
We are very grateful to the Spanish Synchrotron Radiation Facility (ALBA) for their provision of synchrotron radiation facilities, and we would like to thank the XALOC staff for their assistance and support during the data collection.
Conflicts of Interest
The authors declare no conflict of interest.
References
- Artusio, F.; Bazzano, M.; Pisano, R.; Coulon, P.E.; Rizza, G.; Schiller, T.; Sangermano, M. Polymeric nanocapsules via interfacial cationic photopolymerization in miniemulsion. Polymers 2018, 139, 155–162. [Google Scholar] [CrossRef]
- Artusio, F.; Ferri, A.; Gigante, V.; Massella, D.; Mazzarino, I.; Sangermano, M.; Barresi, A.; Pisano, R. Synthesis of high payload nanohydrogels for the ecapsulation of hydrophilic molecules via inverse miniemulsion polymerization: Caffeine as a case study. Drug Dev. Ind. Pharm. 2019, 45, 1862–1870. [Google Scholar] [CrossRef] [PubMed]
- Mitragotri, S.; Burke, P.A.; Langer, R. Overcoming the challenges in administering biopharmaceuticals: Formulation and delivery strategies. Nat. Rev. Drug Discov. 2014, 13, 655–672. [Google Scholar] [CrossRef] [PubMed] [Green Version]
- Artusio, F.; Pisano, R. Surface-induced crystallization of pharmaceuticals and biopharmaceuticals: A review. Int. J. Pharm. 2018, 547. [Google Scholar] [CrossRef] [PubMed]
- Pechenov, S.; Shenoy, B.; Yang, M.X.; Basu, S.K.; Margolin, A.L. Injectable controlled release formulations incorporating protein crystals. J. Control Release 2004, 96, 149–158. [Google Scholar] [CrossRef]
- Contreras-Montoya, R.; Arredondo-Amador, M.; Escolano-Casado, G.; Mañas-Torres, M.C.; González, M.; Conejero-Muriel, M.; Bhatia, V.; Díaz-Mochón, J.J.; Martínez-Augustin, O.; de Medina, F.S.; et al. Insulin Crystals Grown in Short-Peptide Supramolecular Hydrogels Show Enhanced Thermal Stability and Slower Release Profile. ACS Appl. Mater. Interfaces 2021, 13, 11672–11682. [Google Scholar] [CrossRef]
- Basu, S.K.; Govardhan, C.P.; Jung, C.W.; Margolin, A.L. Protein crystals for the delivery of biopharmaceuticals. Expert Opin. Biol. Ther. 2004, 4, 301–317. [Google Scholar] [CrossRef]
- Fernández-Penas, R.; Verdugo-Escamilla, C.; Martínez-Rodríguez, S.; Gavira, J.A. Production of Cross-Linked Lipase Crystals at a Preparative Scale. Cryst. Growth Des. 2021, 21, 1698–1707. [Google Scholar] [CrossRef]
- Ganguly, K.; Chaturvedi, K.; More, U.A.; Nadagouda, M.N.; Aminabhavi, T.M. Polysaccharide-based micro/nanohydrogels for delivering macromolecular therapeutics. J. Control Release 2014, 193, 162–173. [Google Scholar] [CrossRef]
- Nguyen, V.H.; Lee, B.J. Protein corona: A new approach for nanomedicine design. Int. J. Nanomed. 2017, 12, 3137–3151. [Google Scholar] [CrossRef] [Green Version]
- Khodadadi Yazdi, M.; Taghizadeh, A.; Taghizadeh, M.; Stadler, F.J.; Farokhi, M.; Mottaghitalab, F.; Zarrintaj, P.; Ramsey, J.D.; Seidi, F.; Saeb, M.R.; et al. Agarose-based biomaterials for advanced drug delivery. J. Control Release 2020, 326, 523–543. [Google Scholar] [CrossRef] [PubMed]
- Vidal, O.; Robert, M.C.; Boué, F. Gel growth of lysozyme crystals studied by small angle neutron scattering: Case of agarose gel, a nucleation promotor. J. Cryst. Growth 1998, 192, 257–270. [Google Scholar] [CrossRef]
- Biertümpfel, C.; Basquin, J.; Suck, D.; Sauter, C. Crystallization of biological macromolecules using agarose gel. Acta Crystallogr. 2002, 58, 1657–1659. [Google Scholar] [CrossRef] [Green Version]
- Lorber, B.; Sauter, C.; Théobald-Dietrich, A.; Moreno, A.; Schellenberger, P.; Robert, M.C.; Capelle, B.; Sanglier, S.; Potier, N.; Giegé, R. Crystal growth of proteins, nucleic acids, and viruses in gels. Prog. Biophys. Mol. Biol. 2009, 101, 13–25. [Google Scholar] [CrossRef]
- Moreno, A.; Mendoza, M.E. Crystallization in Gels. In Handbook of Crystal Growth: Bulk Crystal Growth, 2nd ed.; Elsevier: Amsterdam, The Netherlands, 2015; Volume 2, pp. 1277–1315. ISBN 9780444633064. [Google Scholar]
- Nam, K.H. Sample delivery media for serial crystallography. Int. J. Mol. Sci. 2019, 20, 1094. [Google Scholar] [CrossRef] [Green Version]
- Yoshikawa, H.Y.; Murai, R.; Sugiyama, S.; Sazaki, G.; Kitatani, T.; Takahashi, Y.; Adachi, H.; Matsumura, H.; Murakami, S.; Inoue, T.; et al. Femtosecond laser-induced nucleation of protein in agarose gel. J. Cryst. Growth 2009, 311, 956–959. [Google Scholar] [CrossRef]
- Tasnim, T.; Goh, A.; Gowayed, O.; Hu, C.T.; Chen, T.Y.; Aber, J.E.; Garetz, B.A. Dendritic growth of glycine from nonphotochemical laser-induced nucleation of supersaturated aqueous solutions in agarose gels. Cryst. Growth Des. 2018, 18, 5927–5933. [Google Scholar] [CrossRef]
- Zhang, F.; Gavira, J.A.; Lee, G.W.; Zahn, D. Nonclassical Nucleation—Role of Metastable Intermediate. Crystals 2021, 11, 174. [Google Scholar] [CrossRef]
- Artusio, F.; Fumagalli, F.; Valsesia, A.; Ceccone, G.; Pisano, R. Role of Self-Assembled Surface Functionalization on Nucleation Kinetics and Oriented Crystallization of a Small-Molecule Drug: Batch and Thin-Film Growth of Aspirin as a Case Study. ACS Appl. Mater. Interfaces 2021, 13, 15847–15856. [Google Scholar] [CrossRef] [PubMed]
- Otálora, F.; Gavira, J.A.; Ng, J.D.; García-Ruiz, J.M. Counterdiffusion methods applied to protein crystallization. Prog. Biophys. Mol. Biol. 2009, 101, 26–37. [Google Scholar] [CrossRef] [PubMed]
- McPherson, A.; Delucas, L.J. Microgravity protein crystallization. NPJ Microgravity 2015, 1, 1–20. [Google Scholar] [CrossRef]
- Lorber, B.; Sauter, C.; Robert, M.C.; Capelle, B.; Giegé, R. Crystallization within agarose gel in microgravity improves the quality of thaumatin crystals. Acta Crystallogr. 1999, 55, 1491–1494. [Google Scholar] [CrossRef] [Green Version]
- Gavira, J.A.; Otálora, F.; González-Ramírez, L.A.; Melero, E.; van Driessche, A.E.S.; García-Ruíz, J.M. On the quality of protein crystals grown under diffusion mass-transport controlled regime (i). Crystals 2020, 10, 68. [Google Scholar] [CrossRef] [Green Version]
- Artusio, F.; Castellví, A.; Sacristán, A.; Pisano, R.; Gavira, J.A. Agarose Gel as a Medium for Growing and Tailoring Protein Crystals. Cryst. Growth Des. 2020, 20, 5564–5571. [Google Scholar] [CrossRef]
- Schneider, C.A.; Rasband, W.S.; Eliceiri, K.W. NIH Image to ImageJ: 25 years of image analysis. Nat. Methods 2012, 9, 671–675. [Google Scholar] [CrossRef]
- Battye, T.G.G.; Kontogiannis, L.; Johnson, O.; Powell, H.R.; Leslie, A.G.W. iMOSFLM: A new graphical interface for diffraction-image processing with MOSFLM. Acta Crystallogr. 2011, 67, 271–281. [Google Scholar] [CrossRef] [Green Version]
- Evans, P.R.; Murshudov, G.N. How good are my data and what is the resolution? Acta Crystallogr. 2013, 69, 1204–1214. [Google Scholar] [CrossRef]
- Project, C.C. The CCP4 suite: Programs for protein crystallography. Acta Crystallogr. 1994, 50, 760–763. [Google Scholar] [CrossRef]
- Vagin, A.; Teplyakov, A. Molecular replacement with MOLREP. Acta Crystallogr. 2010, 66, 22–25. [Google Scholar] [CrossRef]
- Adams, P.D.; Afonine, P.V.; Bunkóczi, G.; Chen, V.B.; Davis, I.W.; Echols, N.; Headd, J.J.; Hung, L.W.; Kapral, G.J.; Grosse-Kunstleve, R.W.; et al. PHENIX: A comprehensive Python-based system for macromolecular structure solution. Acta Crystallogr. 2010, 66, 213–221. [Google Scholar] [CrossRef] [PubMed] [Green Version]
- Murshudov, G.N.; Skubak, P.; Lebedev, A.A.; Pannu, N.S.; Steiner, R.A.; Nicholls, R.A.; Winn, M.D.; Long, F.; Vagin, A.A.; Skubák, P.; et al. REFMAC5 for the refinement of macromolecular crystal structures. Acta Crystallogr. 2011, 67, 355–367. [Google Scholar] [CrossRef] [Green Version]
- Emsley, P.; Lohkamp, B.; Scott, W.G.; Cowtan, K. Features and development of Coot. Acta Crystallogr. 2010, 66, 486–501. [Google Scholar] [CrossRef] [Green Version]
- Painter, J.; Merritt, E.A. TLSMD web server for the generation of multi-group TLS models. J. Appl. Crystallogr. 2006, 39, 109–111. [Google Scholar] [CrossRef] [Green Version]
- Chen, V.B.; Arendall, W.B.; Headd, J.J.; Keedy, D.A.; Immormino, R.M.; Kapral, G.J.; Murray, L.W.; Richardson, J.S.; Richardson, D.C. MolProbity: All-atom structure validation for macromolecular crystallography. Acta Crystallogr. 2010, 66, 12–21. [Google Scholar] [CrossRef] [Green Version]
- García-Ruiz, J.; Novella, M.; Moreno, R.; Gavira, J. Agarose as crystallization media for proteins. J. Cryst. Growth 2001, 232, 165–172. [Google Scholar] [CrossRef]
- Jiang, H.; Haji-Akbari, A.; Debenedetti, P.G.; Panagiotopoulos, A.Z. Forward flux sampling calculation of homogeneous nucleation rates from aqueous NaCl solutions. J. Chem. Phys. 2018, 148, 1–17. [Google Scholar] [CrossRef] [PubMed] [Green Version]
- Frenkel, D.; Auer, S. Prediction of absolute crystal-nucleation rate in hard-sphere colloids. Nature 2001, 409, 1020–1023. [Google Scholar]
- Zeppezauer, M.; Eklund, H.; Zeppezauer, E.S. Micro diffusion cells for the growth of single protein crystals by means of equilibrium dialysis. Arch. Biochem. Biophys. 1968, 126, 564–573. [Google Scholar] [CrossRef]
- Gavira, J.A. Current trends in protein crystallization. Arch. Biochem. Biophys. 2016, 602, 3–11. [Google Scholar] [CrossRef] [PubMed]
- Salemme, F.R. A free interface diffusion technique for the crystallization of proteins for X-ray crystallography. Arch. Biochem. Biophys. 1972, 151, 533–539. [Google Scholar] [CrossRef]
- Masuda, T.; Suzuki, M.; Inoue, S.; Song, C.; Nakane, T.; Nango, E.; Tanaka, R.; Tono, K.; Joti, Y.; Kameshima, T.; et al. Atomic resolution structure of serine protease proteinase K at ambient temperature. Sci. Rep. 2017, 7, 1–11. [Google Scholar] [CrossRef] [PubMed] [Green Version]
- Betzel, C.; Gourinath, S.; Kumar, P.; Kaur, P.; Perbandt, M.; Eschenburg, S.; Singh, T.P. Structure of a serine protease proteinase K from Tritirachium album limber at 0.98 Å resolution. Biochemistry 2001, 40, 3080–3088. [Google Scholar] [CrossRef] [PubMed]
- Singh, T.P.; Sharma, S.; Karthikeyan, S.; Betzel, C.; Bhatia, K.L. Crystal structure of a complex formed between proteolytically-generated lactoferrin fragment and proteinase K. Proteins Struct. Funct. Genet. 1998, 33, 30–38. [Google Scholar] [CrossRef]
- Conejero-Muriel, M.; Contreras-Montoya, R.; Díaz-Mochón, J.J.; Álvarez de Cienfuegos, L.; Gavira, J.A. Protein crystallization in short-peptide supramolecular hydrogels: A versatile strategy towards biotechnological composite materials. CrystEngComm 2015, 17, 8072–8078. [Google Scholar] [CrossRef] [Green Version]
- Conejero-Muriel, M.; Gavira, J.A.; Pineda-Molina, E.; Belsom, A.; Bradley, M.; Moral, M.; de Durán, J.D.G.-L.; Luque González, A.; Díaz-Mochón, J.J.; Contreras-Montoya, R.; et al. Influence of the chirality of short peptide supramolecular hydrogels in protein crystallogenesis. Chem. Commun. 2015, 51, 3862–3865. [Google Scholar] [CrossRef] [Green Version]
- Song, S.; Wang, L.; Yao, C.; Wang, Z.; Xie, G.; Tao, X. Crystallization of Sulfathiazole in Gel: Polymorph Selectivity and Cross-Nucleation. Cryst. Growth Des. 2020, 20, 9–16. [Google Scholar] [CrossRef]
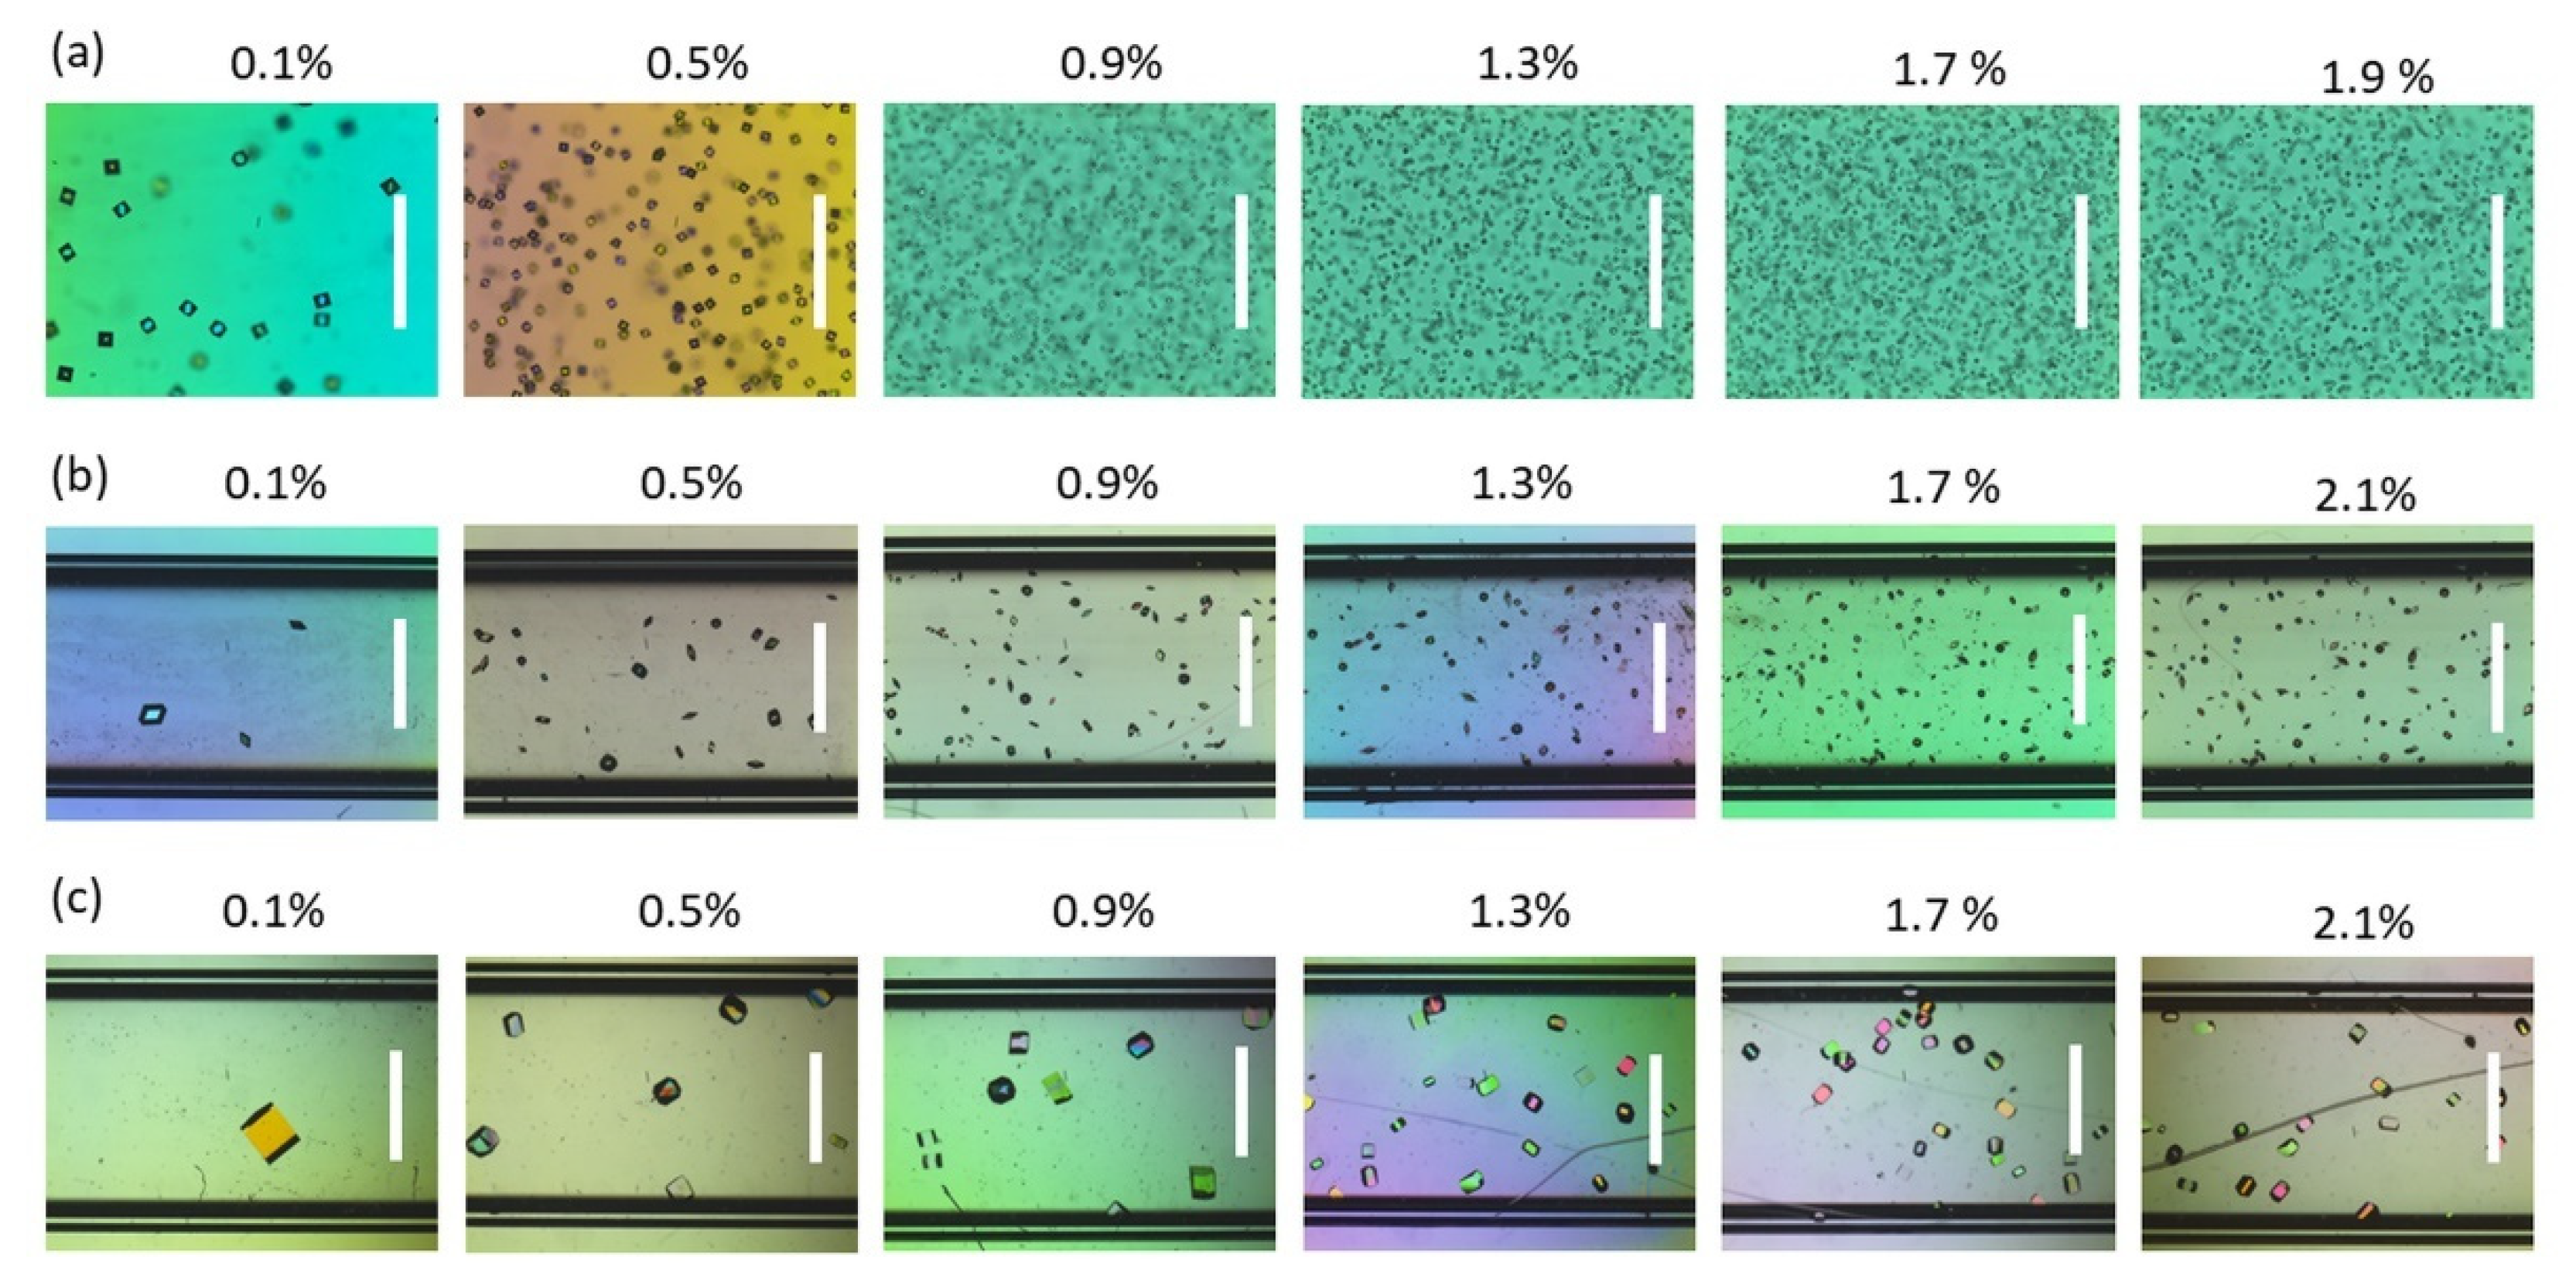
Figure 1.
Flat capillaries containing (a) proteinase K, (b) insulin, and (c) HEWL crystals obtained with increasing concentrations of agarose. The scale bar is 250 µm for the proteinase K series and 500 µm elsewhere.
Figure 1.
Flat capillaries containing (a) proteinase K, (b) insulin, and (c) HEWL crystals obtained with increasing concentrations of agarose. The scale bar is 250 µm for the proteinase K series and 500 µm elsewhere.

Figure 2.
The nucleation density, N, as a function of the agarose concentration for (a) proteinase K, (b) insulin, and (c) HEWL. Error bars refer to the standard deviation.
Figure 2.
The nucleation density, N, as a function of the agarose concentration for (a) proteinase K, (b) insulin, and (c) HEWL. Error bars refer to the standard deviation.

Figure 3.
(a) The normalized nucleation density as a function of the agarose concentrations of proteinase K (blue triangle), insulin (black square), and HEWL (red circle). The experimental data were fitted with single exponential laws. (b) The normalized crystal size (red curve) and the normalized nucleation density (black curve) vs. agarose concentration. The parameters of the two curves were obtained from the average of the corresponding parameters calculated for the three proteins.

Figure 4.
(a) Proteinase K crystals grown inside capillaries loaded with 0.1, 0.5, 1.0, and 1.5% (w/v) agarose gels under FID conditions. The protein concentration was 25 mg/mL in 50 mM HEPES pH 7.0, and 3 M (NH4)2SO4 in 0.1 M Tris pH 8.0 was employed as a precipitant solution. (b) Proteinase K crystals grown inside capillaries loaded with 0.5% (w/v) agarose gels under FID conditions. The protein concentration was 15 mg/mL in 50 mM HEPES pH 7.0, and 2.5 M (NH4)2SO4 in 0.1 M Tris pH 8.0 was employed as a precipitant solution. Enlarged images of crystals grown near the interface with the precipitant solution, in the middle, and at the end of the capillary are reported in (c), (d), and (e), respectively.

Figure 5.
Optical micrographs of (a) FID crystallization of proteinase K carried out inside PCR vials after 1 and 5 days and (b) enlargement of the acicular crystals obtained in the precipitant compartment. The protein was confined inside 0.5% (w/v) agarose gel.
Figure 5.
Optical micrographs of (a) FID crystallization of proteinase K carried out inside PCR vials after 1 and 5 days and (b) enlargement of the acicular crystals obtained in the precipitant compartment. The protein was confined inside 0.5% (w/v) agarose gel.


Table 1.
Batch crystallization conditions inside flat capillaries for the three model proteins, including protein concentration and buffer, precipitation cocktail, and agarose concentration range.
Table 1.
Batch crystallization conditions inside flat capillaries for the three model proteins, including protein concentration and buffer, precipitation cocktail, and agarose concentration range.
| Protein | Protein (mg/mL) | Protein Buffer | Precipitant | Agarose (% w/v) |
|---|---|---|---|---|
| Proteinase K | 6.0 | 50 mM HEPES (pH 7.0) | 0.5 M NaNO3 0.025 M Na citrate (pH 6.5) | 0–1.9 |
| Insulin | 4.0 | 25 mM HCl, 5 mM ZnCl2 | 35.2 mM Na citrate (pH 7.0), 5% (v/v) acetone | 0–2.1 |
| HEWL | 22.0 | 50 mM Na acetate (pH 4.5) | 0.75 M NaCl | 0–2.1 |
Table 2.
Data collection and refinement statistics (values in parentheses are for the highest-resolution shell).
Table 2.
Data collection and refinement statistics (values in parentheses are for the highest-resolution shell).
| Protein | Proteinase K | |
|---|---|---|
| PDB ID | 7NUZ | 7NUY |
| Space group | P43212 | P212121 |
| Unit cell a, b, c (Å) | 67.83, 67.83, 107.00 | 38.50, 70.96, 78.75 |
| Number of molecules in ASU | 1 | 1 |
| Resolution (Å) * | 43.77–1.09 (1.13–1.09) | 52.72–1.65 (1.71–1.65) |
| Rmerge (%) * | 6.4 (46.9) | 11.6 (47.4) |
| I/σI * | 15.4 (4.0) | 7.4 (3.0) |
| Completeness (%) * | 99.48 (98.99) | 90.2 (81.6) |
| Unique reflections * | 103836 (10150) | 23985 (4427) |
| Multiplicity | 9.0 (8.3) | 4.0 (4.2) |
| Wilson B-factor | 8.63 | 8.30 |
| CC (1/2) * | 0.987 (0.867) | 0.942 (0.553) |
| Refinement | ||
| Rwork/Rfree (%) | 17.07/19.13 | 17.23/22.05 |
| No. atoms | 2784 | 2587 |
| Protein | 2279 | 2139 |
| Ligands | 30 | 20 |
| Solvent | 475 | 428 |
| B-factor (Å2) | 13.25 | 13.10 |
| R.m.s deviations | ||
| Bond lengths (Å) | 0.012 | 0.002 |
| Bond angles (°) | 1.33 | 0.51 |
| Ramachandran (%) | ||
| Favored | 97.11 | 97.47 |
| Outliers | 0 | 0 |
* Statistics for the highest-resolution shell are shown in parentheses.
Publisher’s Note: MDPI stays neutral with regard to jurisdictional claims in published maps and institutional affiliations. |
© 2021 by the authors. Licensee MDPI, Basel, Switzerland. This article is an open access article distributed under the terms and conditions of the Creative Commons Attribution (CC BY) license (https://creativecommons.org/licenses/by/4.0/).
Share and Cite
MDPI and ACS Style
Artusio, F.; Castellví, A.; Pisano, R.; Gavira, J.A. Tuning Transport Phenomena in Agarose Gels for the Control of Protein Nucleation Density and Crystal Form. Crystals 2021, 11, 466. https://doi.org/10.3390/cryst11050466
AMA Style
Artusio F, Castellví A, Pisano R, Gavira JA. Tuning Transport Phenomena in Agarose Gels for the Control of Protein Nucleation Density and Crystal Form. Crystals. 2021; 11(5):466. https://doi.org/10.3390/cryst11050466
Chicago/Turabian StyleArtusio, Fiora, Albert Castellví, Roberto Pisano, and José A. Gavira. 2021. "Tuning Transport Phenomena in Agarose Gels for the Control of Protein Nucleation Density and Crystal Form" Crystals 11, no. 5: 466. https://doi.org/10.3390/cryst11050466
Note that from the first issue of 2016, this journal uses article numbers instead of page numbers. See further details here.