
Magnetic Properties and SAR for Gadolinium-Doped Iron Oxide Nanoparticles Prepared by Hydrothermal Method


1
Physics Department, Faculty of Science, Ain Shams University, El-Khalyfa El-Mamoun Street, Cairo 11566, Egypt
2
Academy of Scientific Research and Technology (ASRT), 101 Elkasr Alini St., Cairo 11516, Egypt
3
Department of Physics and Astoronmy, University of Padova, Via Marzolo 8, 35131 Padova, Italy
*
Author to whom correspondence should be addressed.
Crystals 2021, 11(10), 1153; https://doi.org/10.3390/cryst11101153
Submission received: 30 August 2021
/
Revised: 14 September 2021
/
Accepted: 16 September 2021
/
Published: 22 September 2021
(This article belongs to the Topic Structure and Properties Modification in Additive Manufacturing)
Abstract
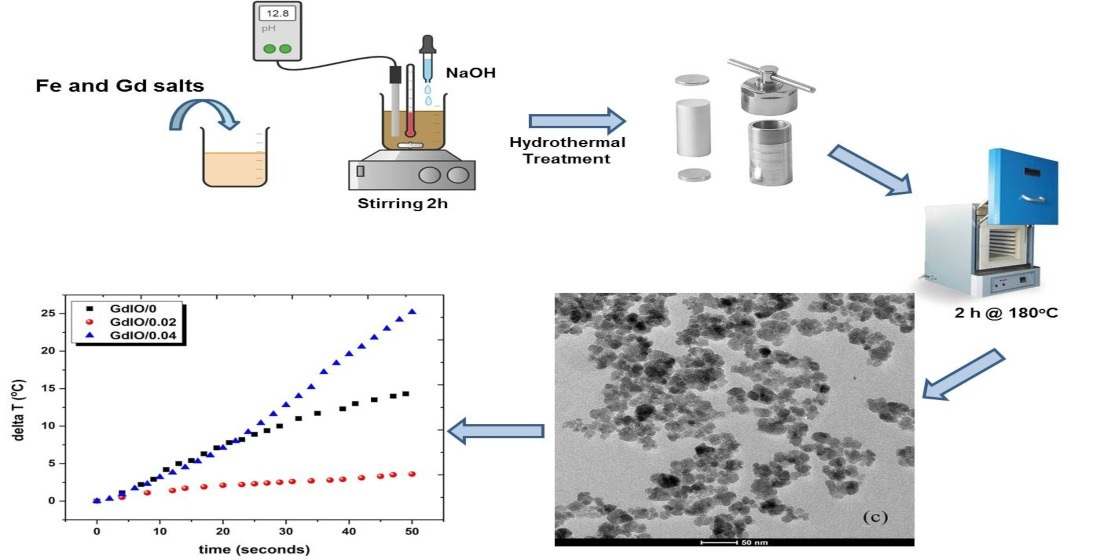
:This study is an attempt to produce gadolinium-doped iron oxide nanoparticles for the purpose of utilization in magnetic fluid hyperthermia (MFH). Six gadolinium-doped iron oxide samples with varying gadolinium contents ( were prepared using the hydrothermal method and high vapor pressure to incorporate gadolinium ions in the iron oxide structure. The samples were indexed as , with varying from 0.0 to 0.1. The results reveal that gadolinium ions have a low solubility limit in the iron oxide lattice (x = 0.04). The addition of gadolinium caused distortion in the produced maghemite phase and formation of other phases. Based on X-ray diffraction (XRD) analysis and photoelectron spectroscopy (XPS), it was observed that gadolinium mostly crystalized as gadolinium hydroxide, for gadolinium concentrations above the solubility limit. The measured magnetization values are consistent with the formed phases. The saturation magnetization values for all gadolinium-doped samples are lower than the undoped sample. The specific absorption rate (SAR) for the pure iron oxide samples was measured. Sample GdIO/0.04, pure iron oxide doped with gadolinium, showed the highest potential to produce heat at a frequency of 198 kHz. Therefore, the sample is considered to hold great promise as an MFH agent.

1. Introduction
Magnetic nanoparticles have been utilized for decades in various biomedical applications [1,2,3,4,5] including MFH for cancer therapy [6,7,8], drug delivery [9] and as contrast agents for magnetic resonance imaging (MRI) [10,11] and as biosensors [12]. The particles can also be utilized in radiotherapy when conjugated with radioactive isotopes [13] as well as dual therapy with hyperthermia combined with X-ray therapy [14].
Magnetic fluid hyperthermia involves localized increase in tissue temperature; this increase is either moderate, to about 45 °C (hyperthermia), or extreme (thermoablation) and is mainly for the purpose of cancer treatment [15]. Unlike thermoablation, a moderate temperature rise is generally used in conjunction with other therapeutic modalities such as chemotherapy [16] and radiotherapy [17]. In both cases, the magnetic nanoparticles are designed to function as tiny antennas that couple the energy from the alternating magnetic field to produce heat. This potential is quantified in terms of the specific absorption rate (SAR) value, which is defined as the heating power generated per unit mass and measured in W/g [18]. Magnetic nanoparticles with high SAR values are desired so as to confer efficient therapy without excessive exposure to electromagnetic fields or the administration of large doses of nanoparticles.
Superparamagnetic iron oxide nanoparticles (SPIONs) are used extensively in these applications, owing to their proven biocompatibility, as various species with various dopants are approved by the food and drug administration (FDA) [4]. Nevertheless, there is a strong demand to enhance their magnetic properties without diminishing their biocompatibility. Gadolinium is selected as a dopant in this work, owing to its proven biocompatibility [19] and large magnetic moment (7.12 ) per atom [20]. Gadolinium ferrite has been efficiently used as an MFH agent [8], MRI [19,21] contrast agent and in theranostics [22,23,24]. The spin coupling of results in modification of the various magnetic properties of the iron oxide nanoparticles [25]. These changes are interesting and need further investigation. The versatile properties and the continuously emerging potential biomedical applications of gadolinium-doped iron oxide species make the optimization of the synthesis techniques and the thorough investigation of the properties of the obtained samples a persistent requirement.
Several techniques have been utilized for the synthesis of iron oxide nanoparticles. The sol–gel route [26] produces dry particles. Therefore, wet chemical methods are becoming more promising. One of the techniques that produces dispersed ultrafine nanoparticles capped with organic agents is thermal decomposition [27]. Unfortunately, the replacement of this nonpolar capping agent with a polar counterpart is a challenging process. Other techniques include sonochemical synthesis [28,29], the coprecipitation method [30], polyol synthesis [31], solvothermal synthesis [32] and hydrothermal synthesis [33], which is used in this study. The high vapor pressure and temperature attained by the hydrothermal route, which creates a supercritical environment, are assumed to assist the formation of the desired phase. In this environment, Ostwald ripening is favored, and relatively large particles are formed with enhanced crystallinity [34] compared to their counterparts prepared by the coprecipitation method.
Iron oxide nanoparticles crystallize in various compounds based on their oxidation states [35,36]. The main compounds are: ,, (goethite), (lepidocrocite) and [37]. Among those five structures, only magnetite contains both and ions; the remaining four compounds contain only ions. The symbol denotes that all the trivalent iron ions are octahedrally coordinated, whereas denotes that only ions are octahedrally coordinated and the rest are tetrahedrally coordinated [38]. Upon oxidation, magnetite changes to maghemite, which then changes into hematite [39], and finally into goethite and lepidocrocite [40]. The latter is a less stable form than goethite and is generally not observed in the final product. Goethite is mostly yellow in color [29] and adopts an orthorhombic crystal structure with space group Pbnm [39,41]. Hematite is reddish brown and exhibits a hexagonal lattice with space group [41]. Magnetite is black and maghemite is brown [42]; they both crystallize in a face-centered cubic structure (FCC) [42,43] giving almost identical X-ray diffraction patterns [44]. Magnetite has an FCC crystal structure belonging to the space group [45]. It is considered as an inverse spinel with all the divalent iron ions occupying the octahedral (B) sites and ions equally divided between both tetrahedral [A] sites and octahedral [B] sites [32]. The net magnetization is caused by the divalent cations in the B site [46]. The electronic configuration of and are and , respectively; therefore, ideally, magnetite has a magnetization of /molecule. In this study, gadolinium is added at the expense of ions. The large radius of the gadolinium ions (0.938 Å) compared to ions (0.67 Å) hinders their incorporation into the iron oxide lattice [24].
The various oxidation states and the large number of potentially formed crystal phases [47] render the process of determining the obtained structure very challenging. This is in addition to the fact that there are very few successful attempts in the literature to produce gadolinium-doped ferrite nanoparticles and, consequently, scarce few studies about its feasibility as an MFH agent [48]. This work focuses on the determination of the various obtained phases upon the addition of gadolinium to iron oxide precursors produced using the hydrothermal method. XPS is used as an analytical technique that effectively complements XRD to accurately investigate the produced structures. The magnetic parameters of the samples are measured and correlated to the obtained structures. Finally, the ability of the samples to produce heat upon exposure to AMF is tested.
2. Experimental Section
2.1. Materials
Analytical grade chemicals were used for synthesis. Ferric chloride , ferrous chloride , sodium hydroxide and polyethylene glycol (PEG) were purchased from Loba Chemie, Mumbai, India. Gadolinium nitrate was purchased from Alfa Aeser, Carlsbad, CA, USA.
2.2. Synthesis
The conventional hydrothermal method was employed for the synthesis of with values of 0, 0.02, 0.04, 0.06, 0.08 and 0.1. Stoichiometric quantities of metal salts were dissolved in water independently; then, all salts were added together and the pH was immediately raised to 12.8 using 10 M . The samples were transferred to Teflon-lined stainless steel sealed containers. The samples were heated for 2 h to , at which they were incubated for 15 h and then allowed to cool. The samples were then washed several times with deionized water. The six obtained samples were indexed as , with varying from 0.0 to 0.1. For SAR measurement, the samples were functionalized by stirring overnight in a PEG solution and then collected by magnetic decantation and washed.
2.3. Characterization
Phase identification of the prepared samples was performed using X-ray powder diffraction (XRD). The X-ray powder diffraction patterns of the samples were collected on a Philips diffractometer (X’pert MPD) with Cu-Kα radiation. Step-scan mode was utilized to collect diffraction intensities (step size 2θ = 0.02°; counting time 2 s) in the angular range 20–80°. Quantification of the produced phases was carried out according to the Rietveld profile method using the MAUD software package (L. Lutterotti, Maud 2.33) [49].
The X-ray photoelectron spectra were measured using a Thermo Fisher Scientific XPS instrument utilizing a monochromatic AlKα X-ray source in the energy range 1350–0 eV. Pressure in the analysis chamber was kept at 10−9 mbar with full spectrum pass energy, 200 eV, and at narrow spectrum, 50 eV. Magnetization curves were obtained using a vibrating sample magnetometer (VSM; Lakeshore 7400-S Series) with a magnetic field intensity up to 3.1T. High-resolution transmission electron micrographs were obtained (HR-TEM, Tecnai G20, FEI, The Netherlands) to image particles and determine the morphology and particle size.
The specific absorption rates for the six samples were obtained using DW-VHF (10 kW, China). The working coil was the coil of the parallel tank circuit. It was a three-turn coil cooled by a water current. The operating frequency of the self-oscillating resonator is given by the resonance condition using Equation (1):
where and are the inductance and capacitance, respectively. The maximum value of the AC current in the coil was calculated using Equation (2):
where is the root mean square value of the voltage across the coil. The calibration curve for the magnetic field versus current was obtained using a DC Teslameter (Phywe Teslameter 13610-93) for DC currents up to 6 Amp.
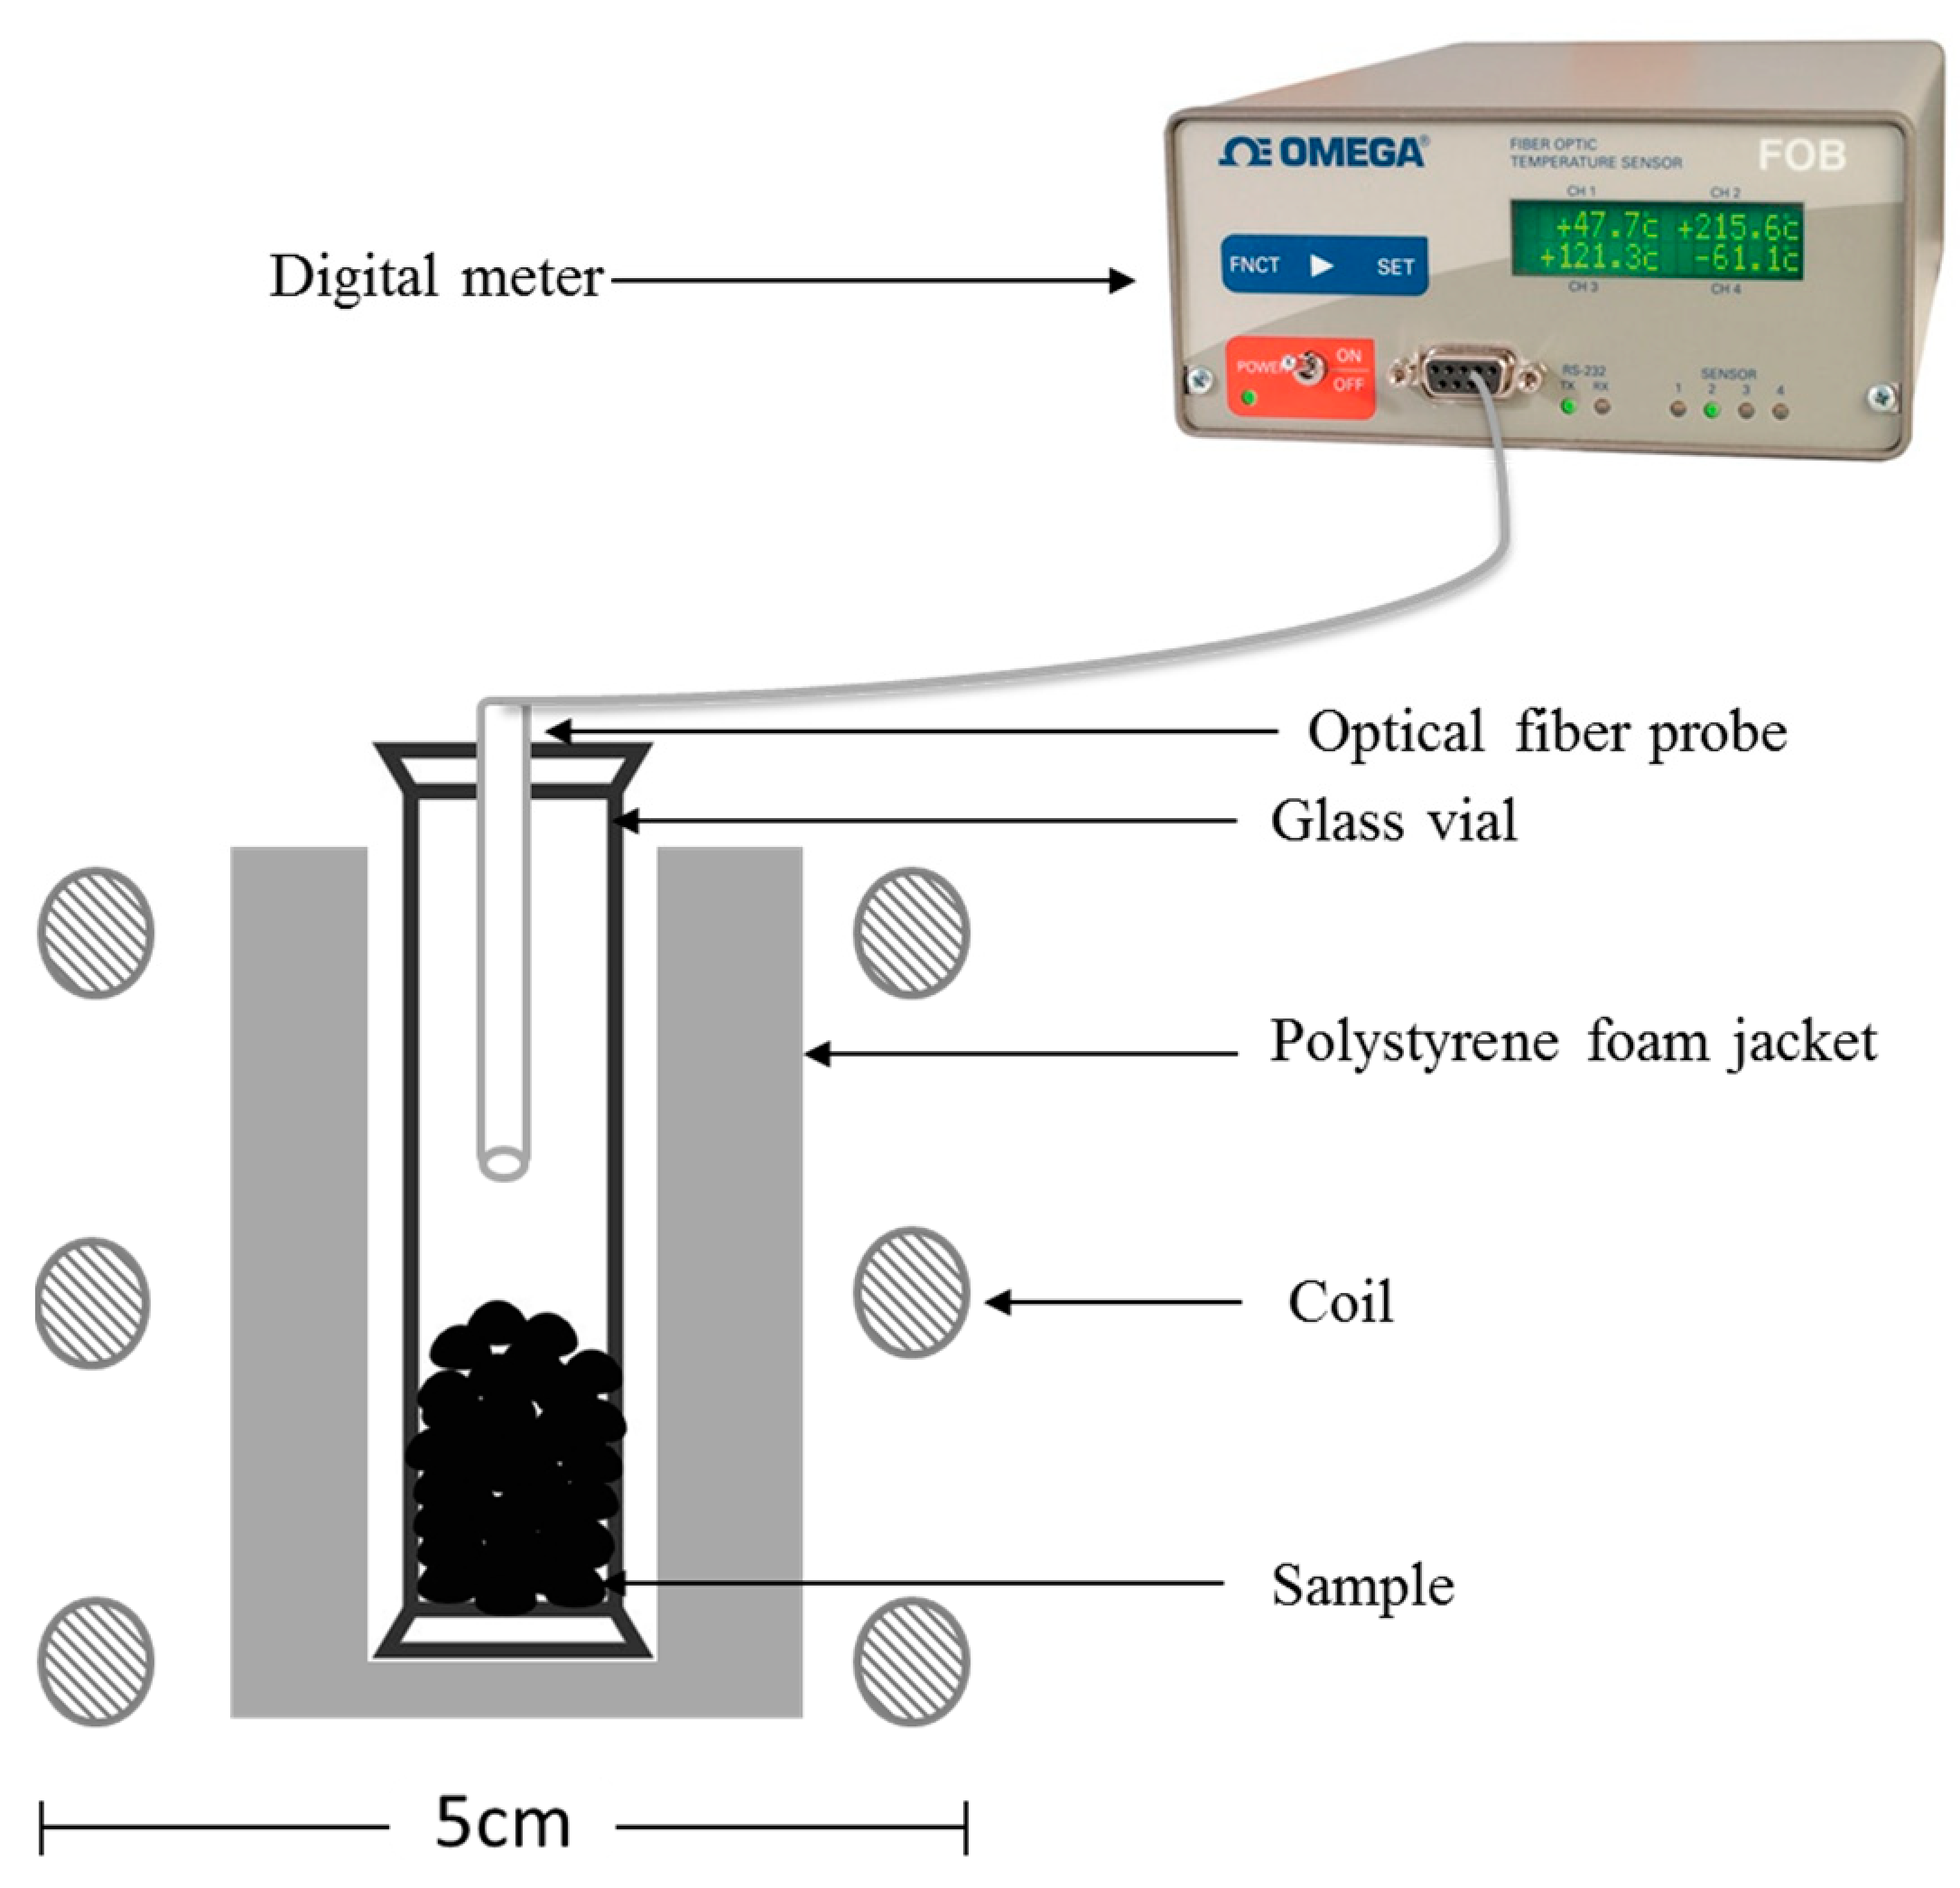
The powder samples were contained in a glass vial in a polystyrene foam jacket inserted axially in the working coil, as shown in Figure 1. The temperature was measured using an optical fiber probe (FOBS-2) connected to a digital meter (OMEGA-FOB101).
3. Results and Discussion
3.1. Structural Characterization
3.1.1. XRD Analysis
To thoroughly investigate the obtained phases, X-ray diffraction was used to determine the crystal structure of the powdered samples. The MAUD software package [49] was utilized for phase identification and quantitative analysis. The obtained diffraction patterns are shown in Figure 2.
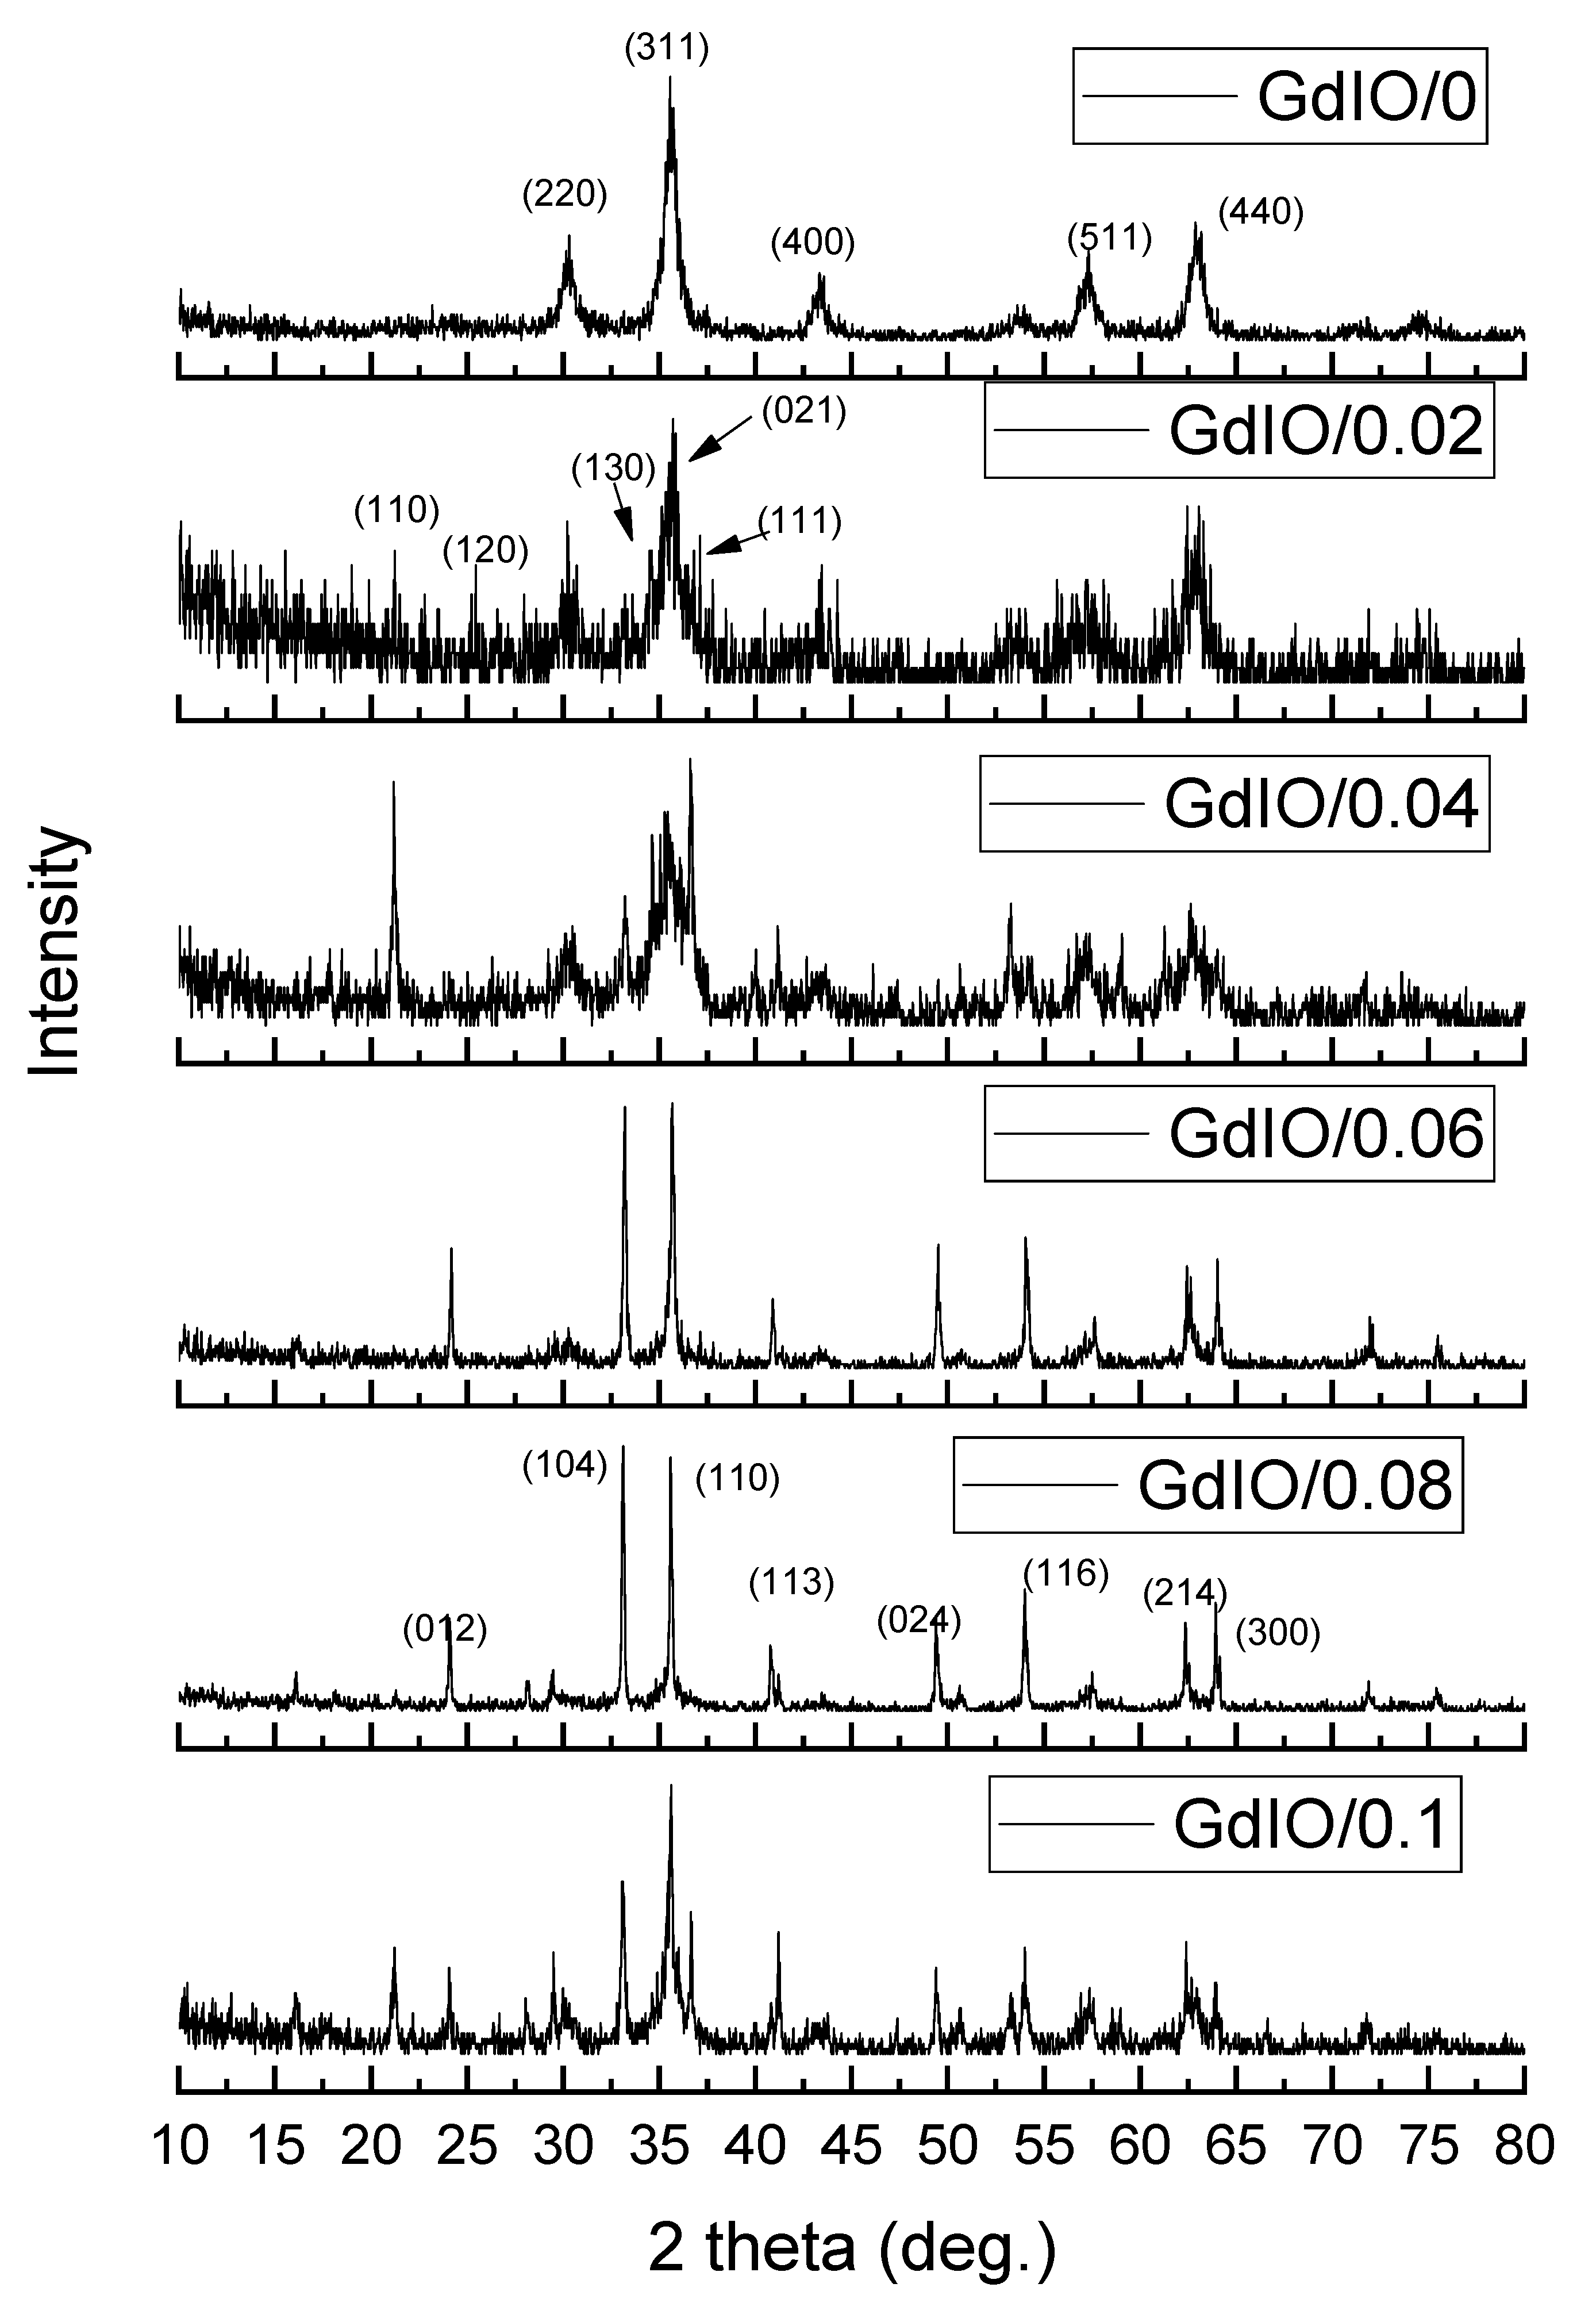
The obtained results of the powder X-ray diffraction indicate that all samples are crystalline, as shown in Figure 2. The refinement of the diffraction patterns shows that each of the six samples is made up of one or more of the detected four phases. The phases are as follows: an FCC phase with a space group () assigned to magnetite and maghemite [45], a hexagonal phase (space group ) assigned to hematite [50], an orthorhombic phase (Pbnm) assigned to goethite [41] and another hexagonal phase (space group P63/m) assigned to gadolinium hydroxide [51]. The main peaks indicating the FCC structure, goethite and hematite are depicted in the patterns corresponding to samples GdIO/0, GdIO/0.02 and GdIO/0.04.
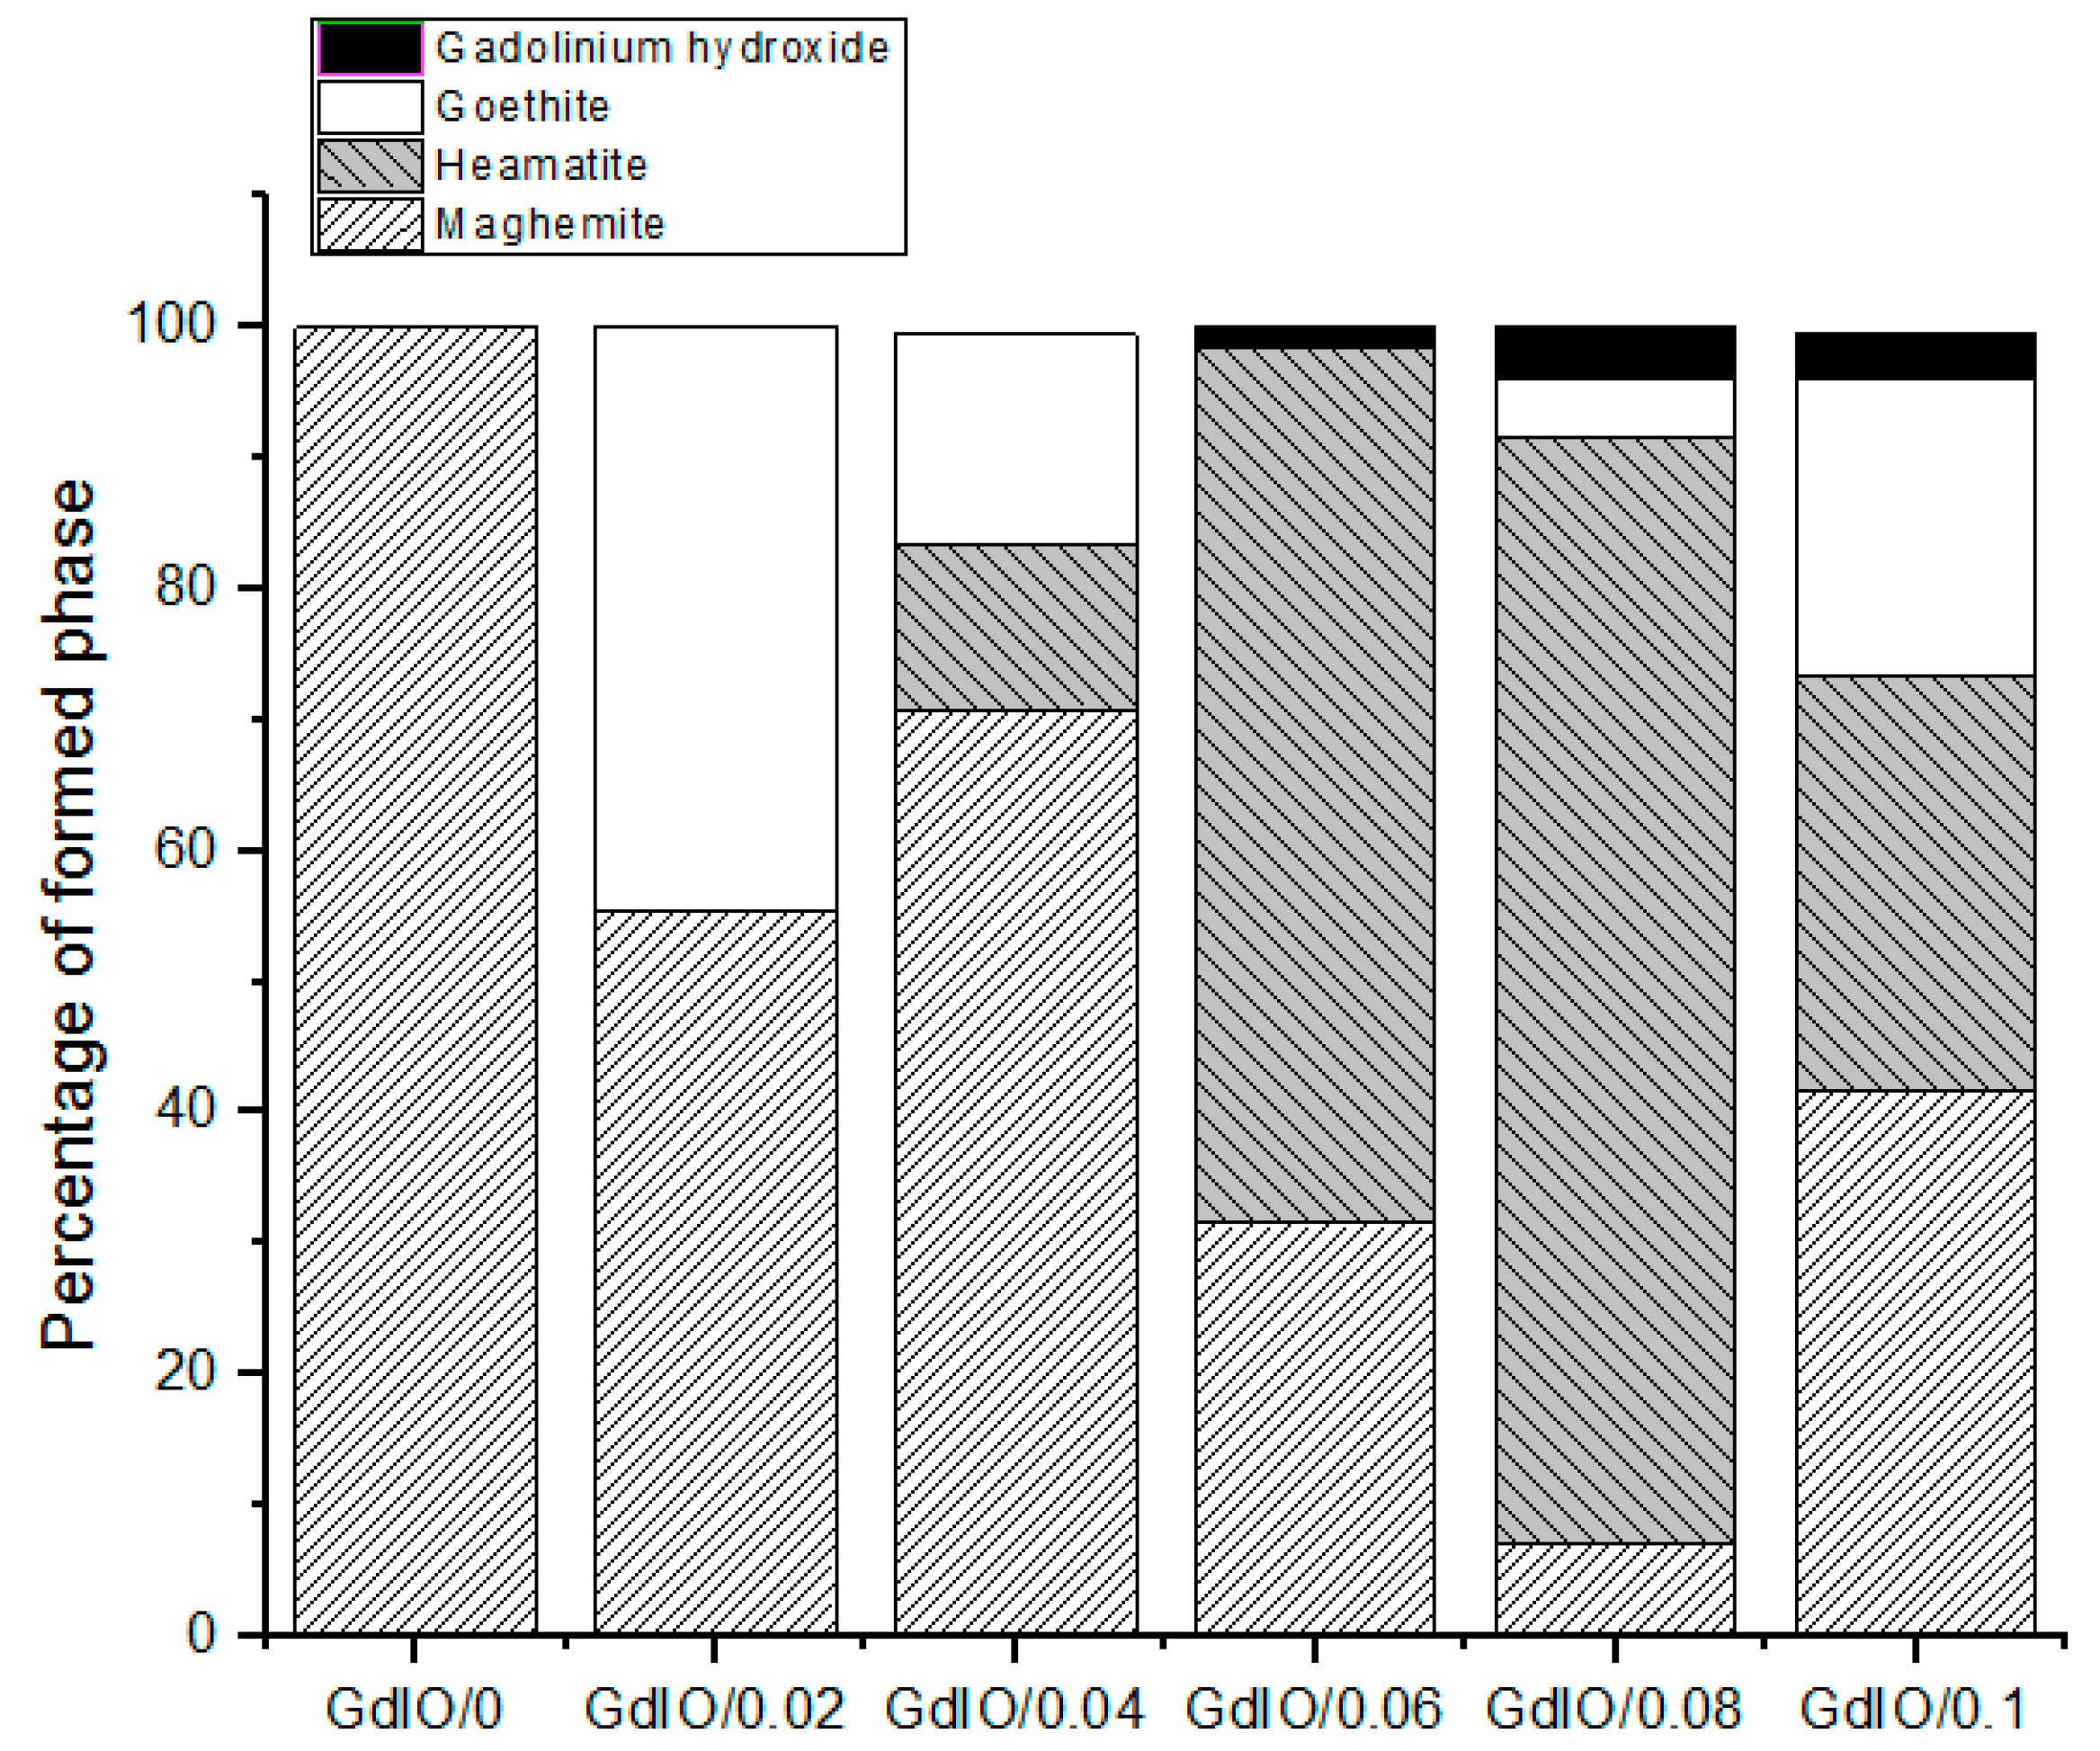
A pure FCC structure is obtained for sample GdIO/0. For GdIO/0.02, a distorted FCC phase is obtained along with the orthorhombic phase of goethite. For GdIO/0.04, hematite is also observed. The hexagonal phase characteristic for gadolinium hydroxide appears for the first time for GdIO/0.06, whereas the hematite phase disappears. The four phases are observed for samples GdIO/0.08 and GdIO/0.1. The percentages of the obtained phases are shown in Table 1 along with the values of the standard deviation and that judge the quality of refinement [52].
Therefore, samples x = 0, 0.02 and 0.04 are pure iron oxide samples in which Gd ions are incorporated into the iron oxide lattice. x = 0.04 can be considered as the solubility limit of Gd ions in iron oxide. The further increment of Gd ions is observed to be segregated as Gd(OH)3, likely at the grain boundaries.
Magnetite crystallizes in an FCC structure that is very difficult to distinguish from maghemite using only XRD. For this purpose, XPS is used mainly to investigate the presence of based on its characteristic binding energy. The two techniques were effectively used to determine and quantify the presence of gadolinium either incorporated into the iron oxide structure in one of the possible phases or forming a separate oxide or hydroxide phase.
3.1.2. XPS Spectra
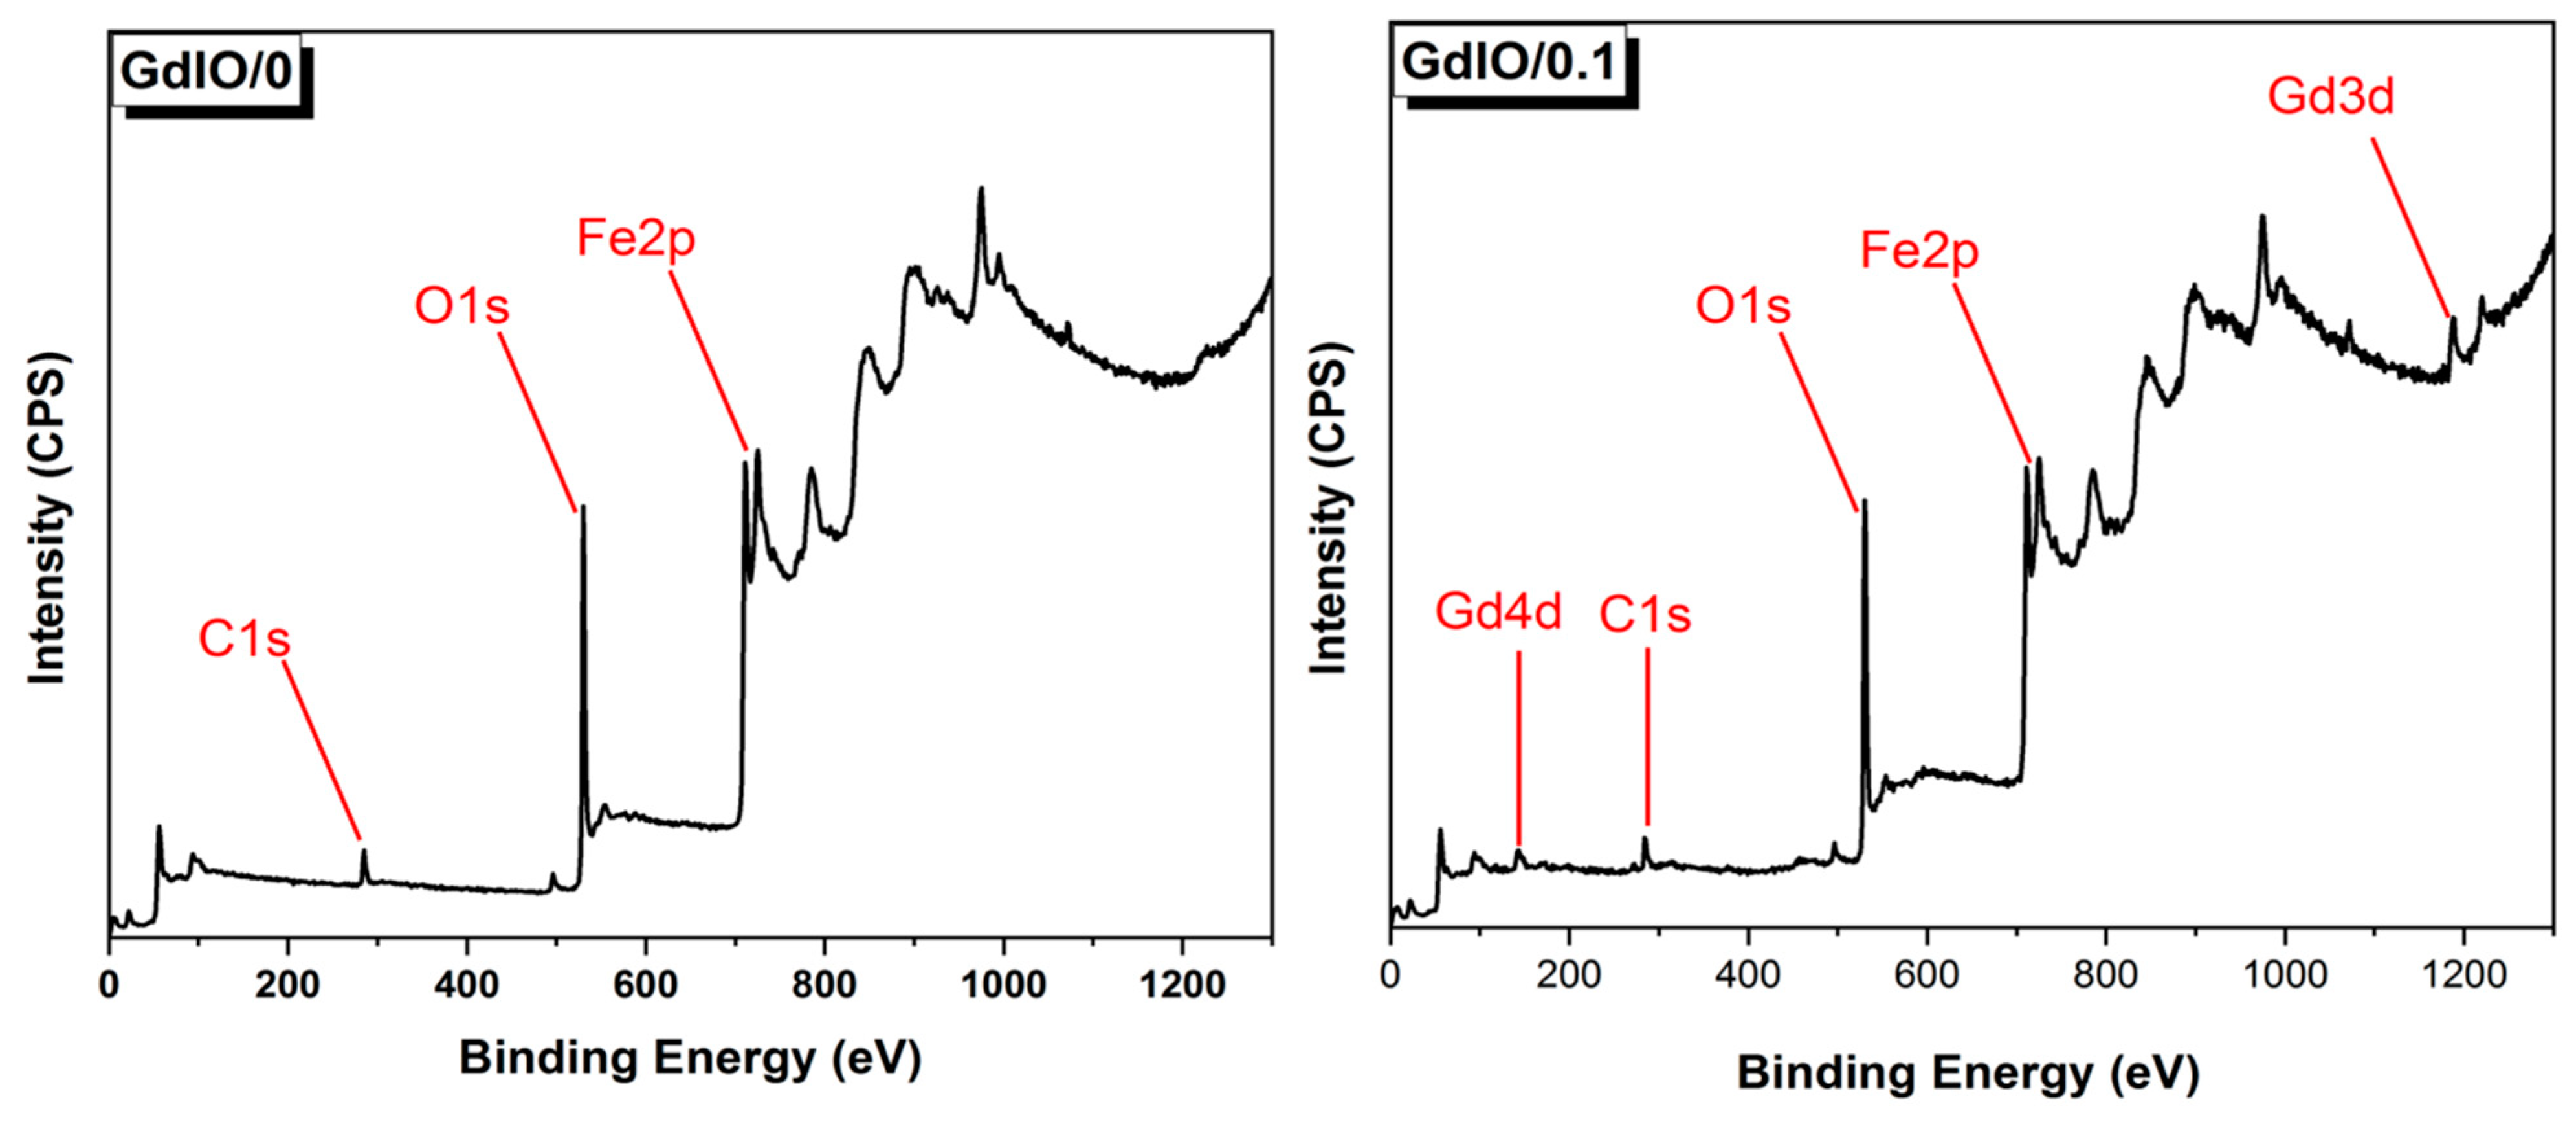
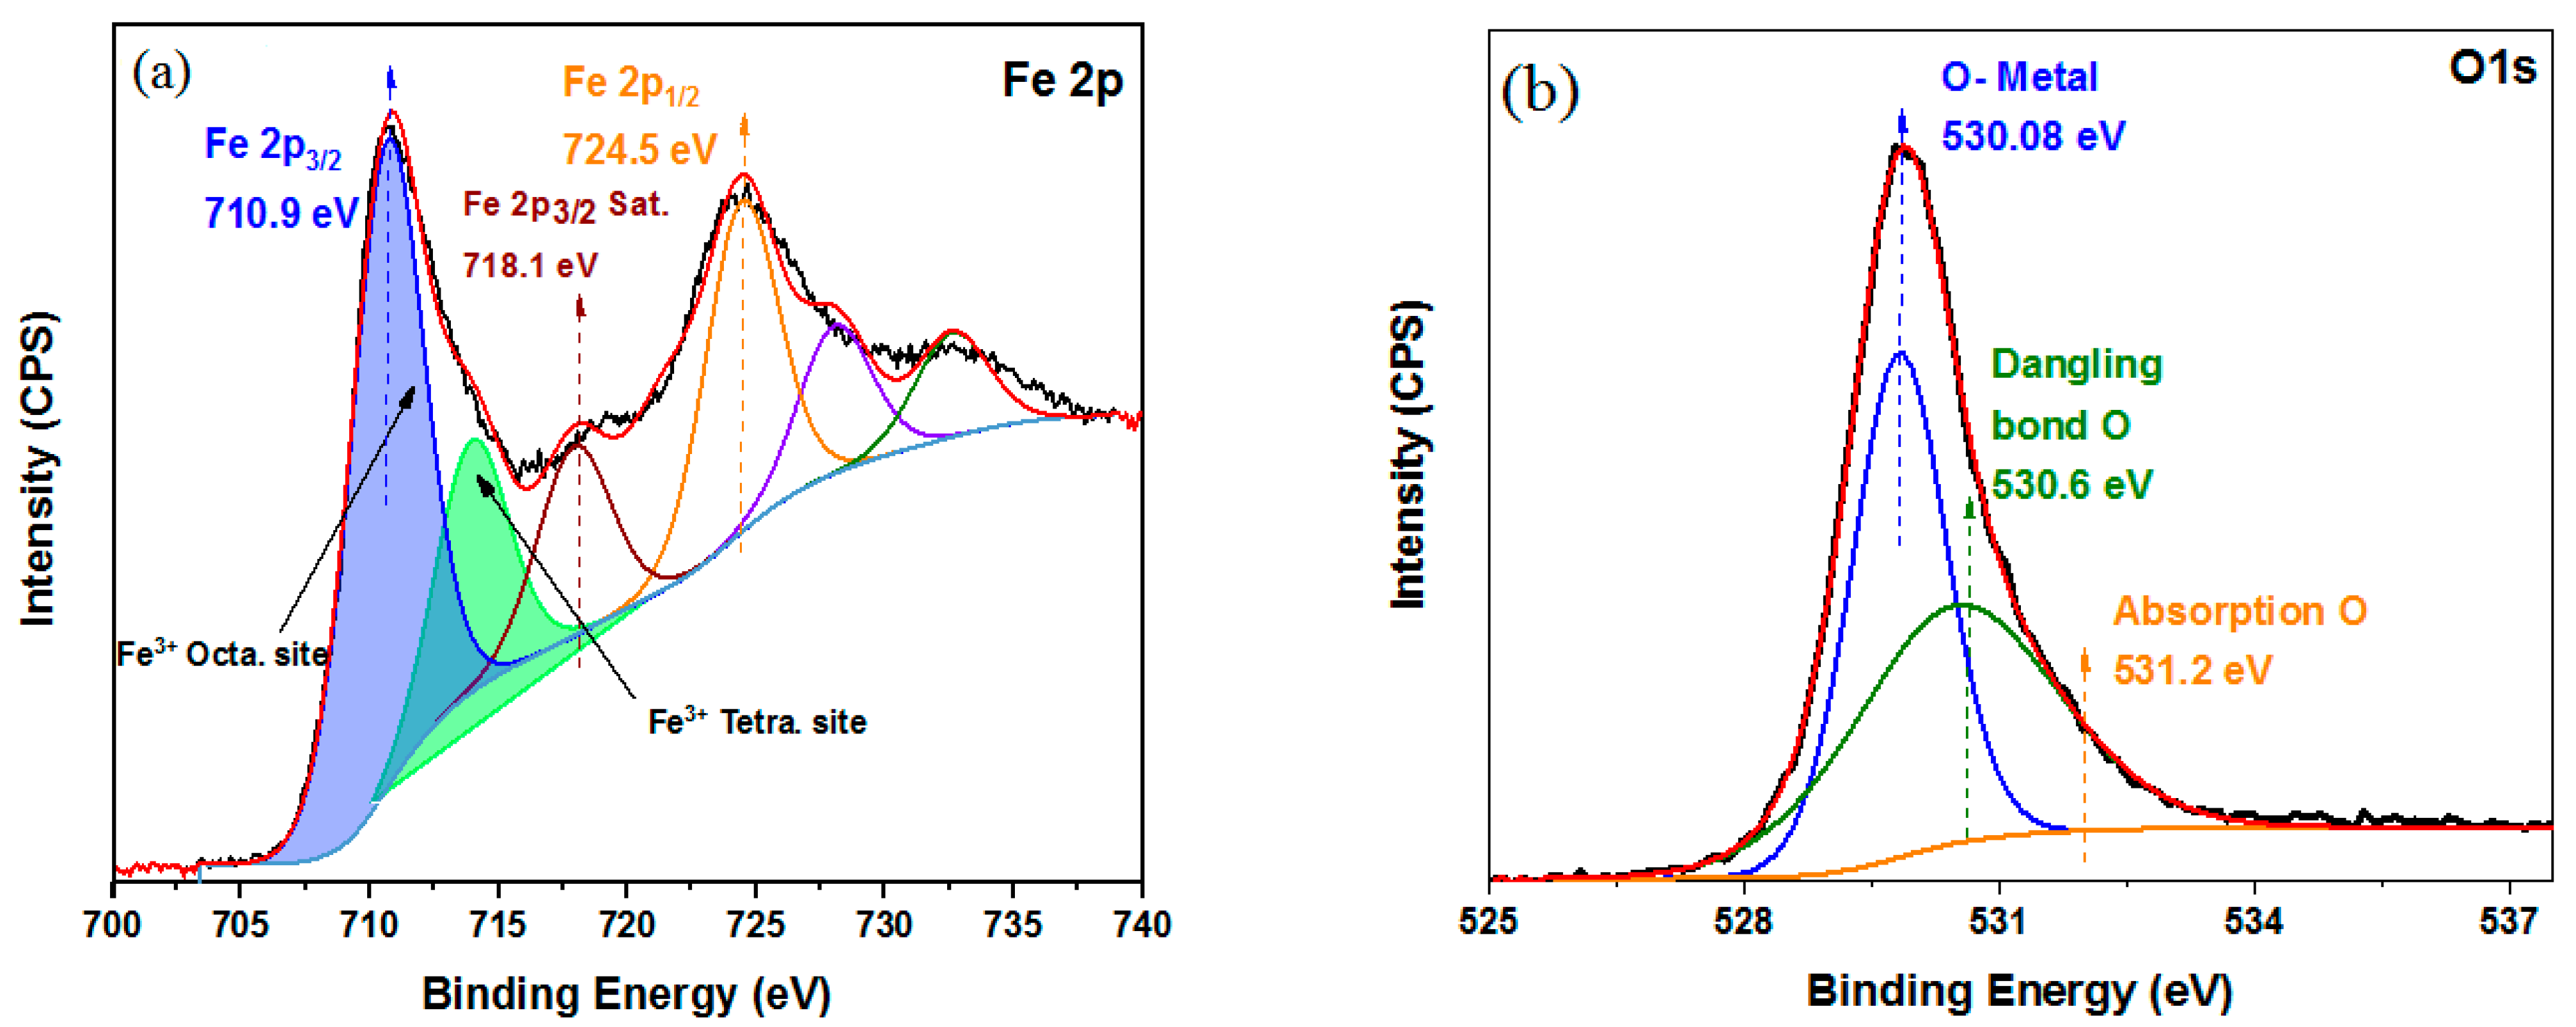
Elemental analysis, oxidation states and cation distribution are determined from XPS analysis. XPS spectra for only two samples (GdIO/0 and GdIO/0.1) are shown in Figure 3, and the significant peaks are indexed. For sample GdIO/0, iron ions in Figure 4a show two 2p peaks due to spin orbit coupling. The high energy peak at 08 eV is the Fe 2p3/2 peak. The low energy main peak for 2p1/2 appeared at 711.14 eV and was deconvoluted into two peaks. The peaks are at 710.79 and 714.08 eV, representing Fe3+ ions occupying the octahedral and tetrahedral sites, respectively. The Fe 2p1/2 peak is accompanied by a satellite peak at 718.1 eV. The presence of the satellite peak implies that the formed phase is maghemite with all the iron content oxidized to Fe3+ ions [53]. For magnetite, the Fe 2p1/2 peak appears at slightly lower energies [54]. This resolves the structural controversy as the results rule out the formation of magnetite due to the lack of evidence for the presence of in any of the compounds. Thus, it verifies that maghemite is the only FCC phase produced in all samples. Calculation of the integral areas corresponding to the occupation of the tetrahedral and octahedral sites revealed that 73.61% of occupies the octahedral site and 26.39% occupies the tetrahedral site with a ratio that is very close to the characteristic ratio for ideal .
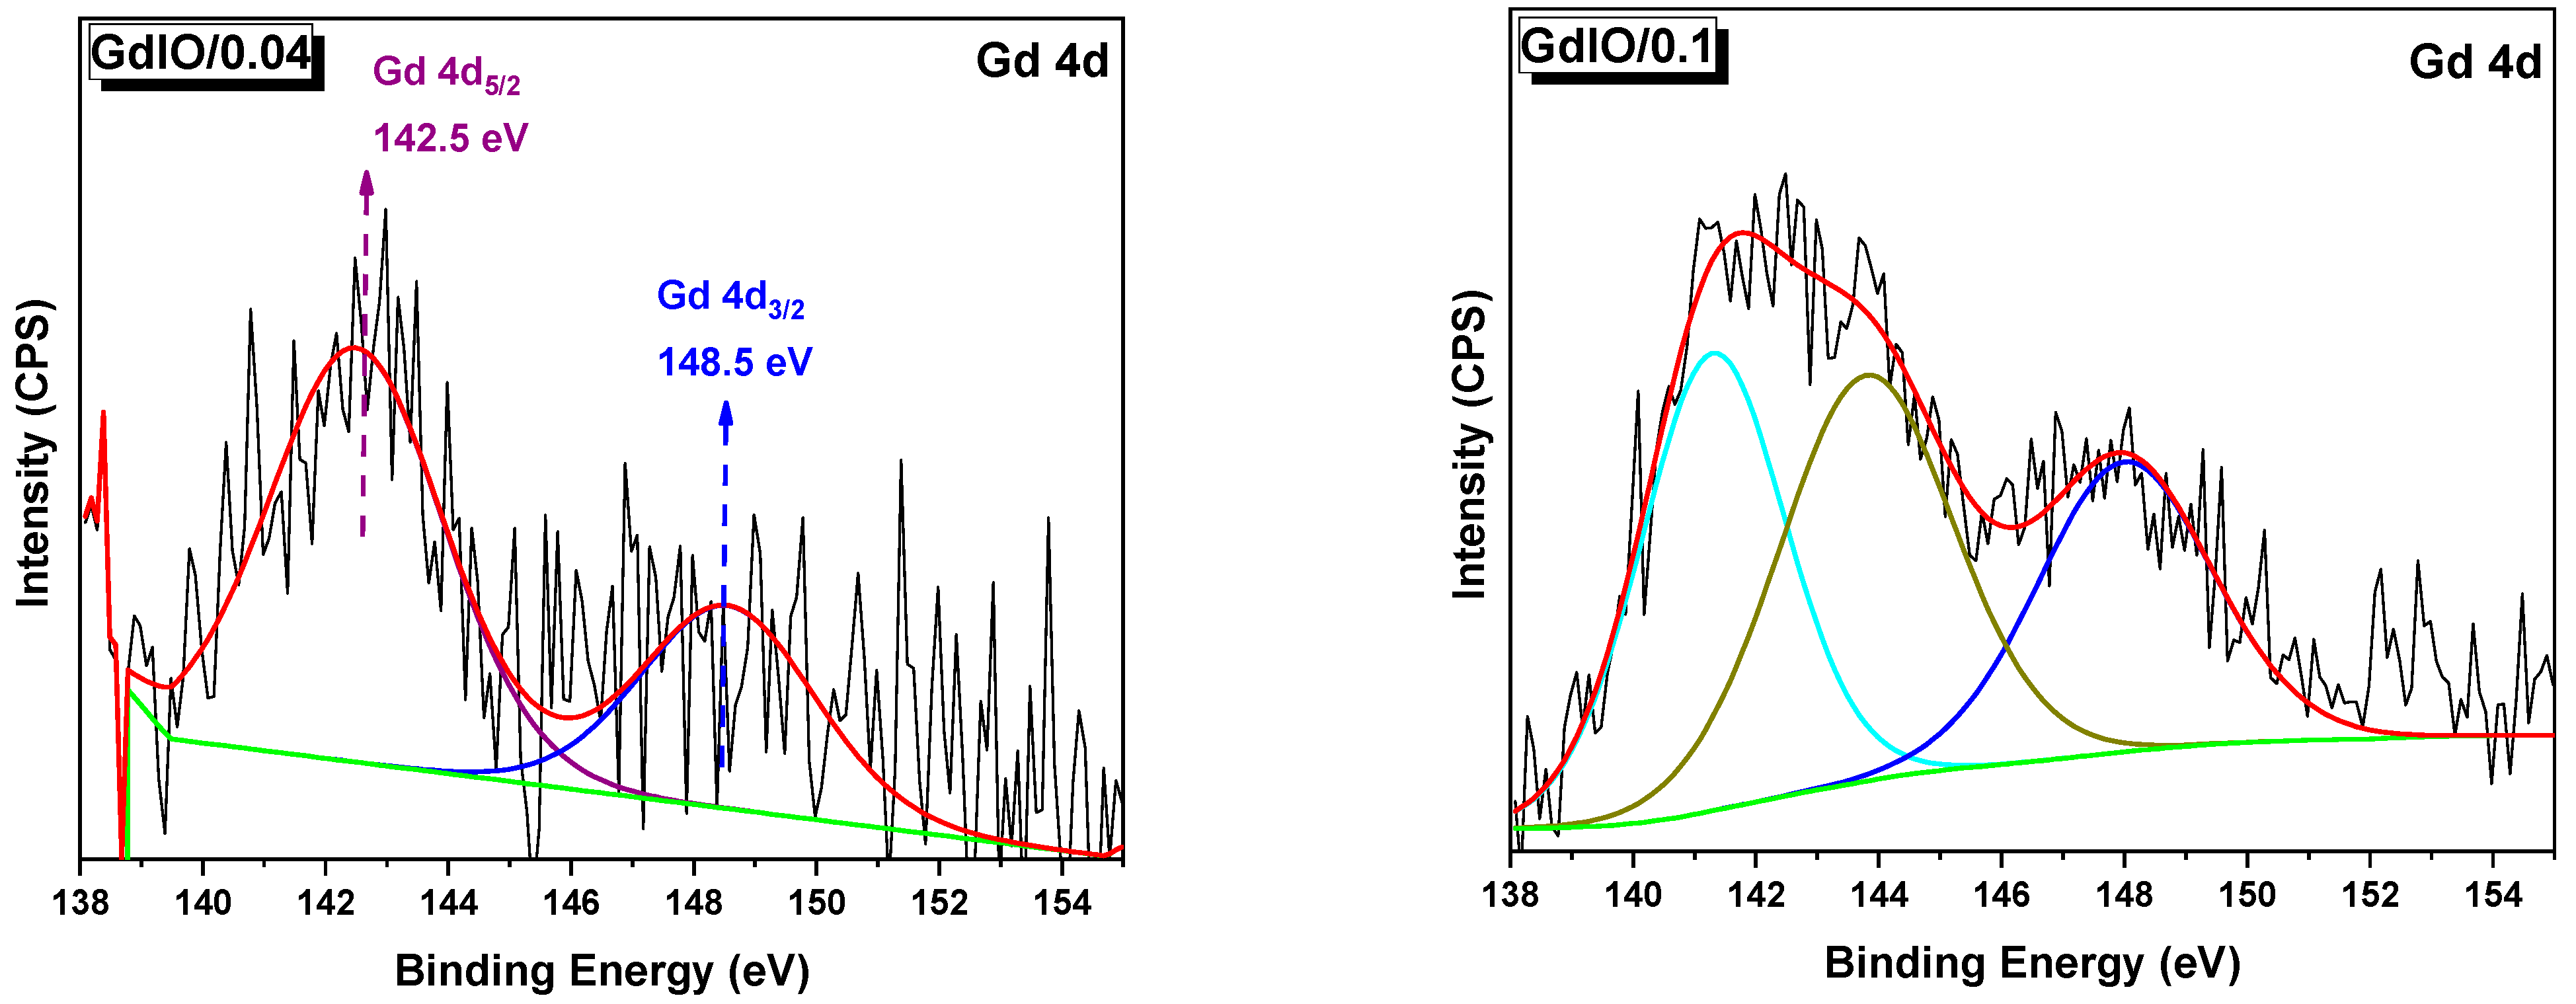
The main peak for O2− in sample GdIO/0 is represented in Figure 4b. It occurs at 530.08 eV [32,55]. The peak is deconvoluted and indexed according to Zhang et al. [56]. It is produced by the oxygen incorporated into the lattice, oxygen in the dangling bonds at the surface of the particles and the adsorbed oxygen. Gadolinium was detected using XPS spectroscopy for samples GdIO/0.04, GdIO/0.06, GdIO/0.08 and GdIO/0.1. Figure 5 is a high-resolution plot for the peaks of in samples GdIO/0.04 and GdIO/0.1. The high energy peak (Gd 3d5/2) is observed at 1185.6 eV for sample GdIO/0.04, and the low energy peak (Gd 4d p) appears at 142.5 and 148.5 eV for Gd 4d5/2 and Gd 4d3/2, respectively. Correlating this result with the performed phase analysis verifies that gadolinium exists as for samples GdIO/0.06, GdIO/0.08 and GdIO/0.1. The gadolinium content detected for sample GdIO/0.04 proved not to form or else it would otherwise have been detected using XRD. This implies that it could have been incorporated into the iron oxide lattice.
It is customary to obtain various secondary phases upon attempting to dope spinel ferrites with rare earth elements. In a very recent work by Serga et al. [57], the extraction pyrolytic method was used to produce gadolinium-doped iron oxide nanocrystals. The results showed that attempts to incorporate gadolinium into the iron oxide lattice resulted in the formation of more than one phase of iron oxide and that gadolinium oxide phases were formed at high concentrations of gadolinium.
In addition, a study aiming to produce gadolinium-doped cobalt ferrite () using the hydrothermal method [33] showed the presence of hematite and gadolinium hydroxide as secondary phases in the product for high gadolinium concentrations. The polyol [58], coprecipitation [59], sonication-assisted coprecipitation [46] and thermal decomposition routes [48] were used for the synthesis of gadolinium-doped iron oxide without strong evidence for the incorporation of gadolinium into the iron oxide lattice.
In another study [24], gadolinium was suggested to replace Fe in the A site upon preparation using the polyol method; was detected in the iron oxide lattice by other authors who also utilized the polyol method [19]. Gadolinium-doped iron oxide was synthesized by microwave-assisted polyol synthesis [23], and the orthorhombic goethite phase was also observed for some gadolinium concentrations. When the hydrothermal method was modified by adding polyethyleneimine [21], gadolinium ions were detected in the form of gadolinium hydroxide. In general, a small amount of gadolinium ions are incorporated into the iron oxide cubic lattice. This may be attributed to the large size of the gadolinium ions compared to iron ions and the higher energy of the bond between Gd3+ and O2− than the energy of the bond between Fe3+ and O2− [60,61].
3.2. Magnetic Measurements
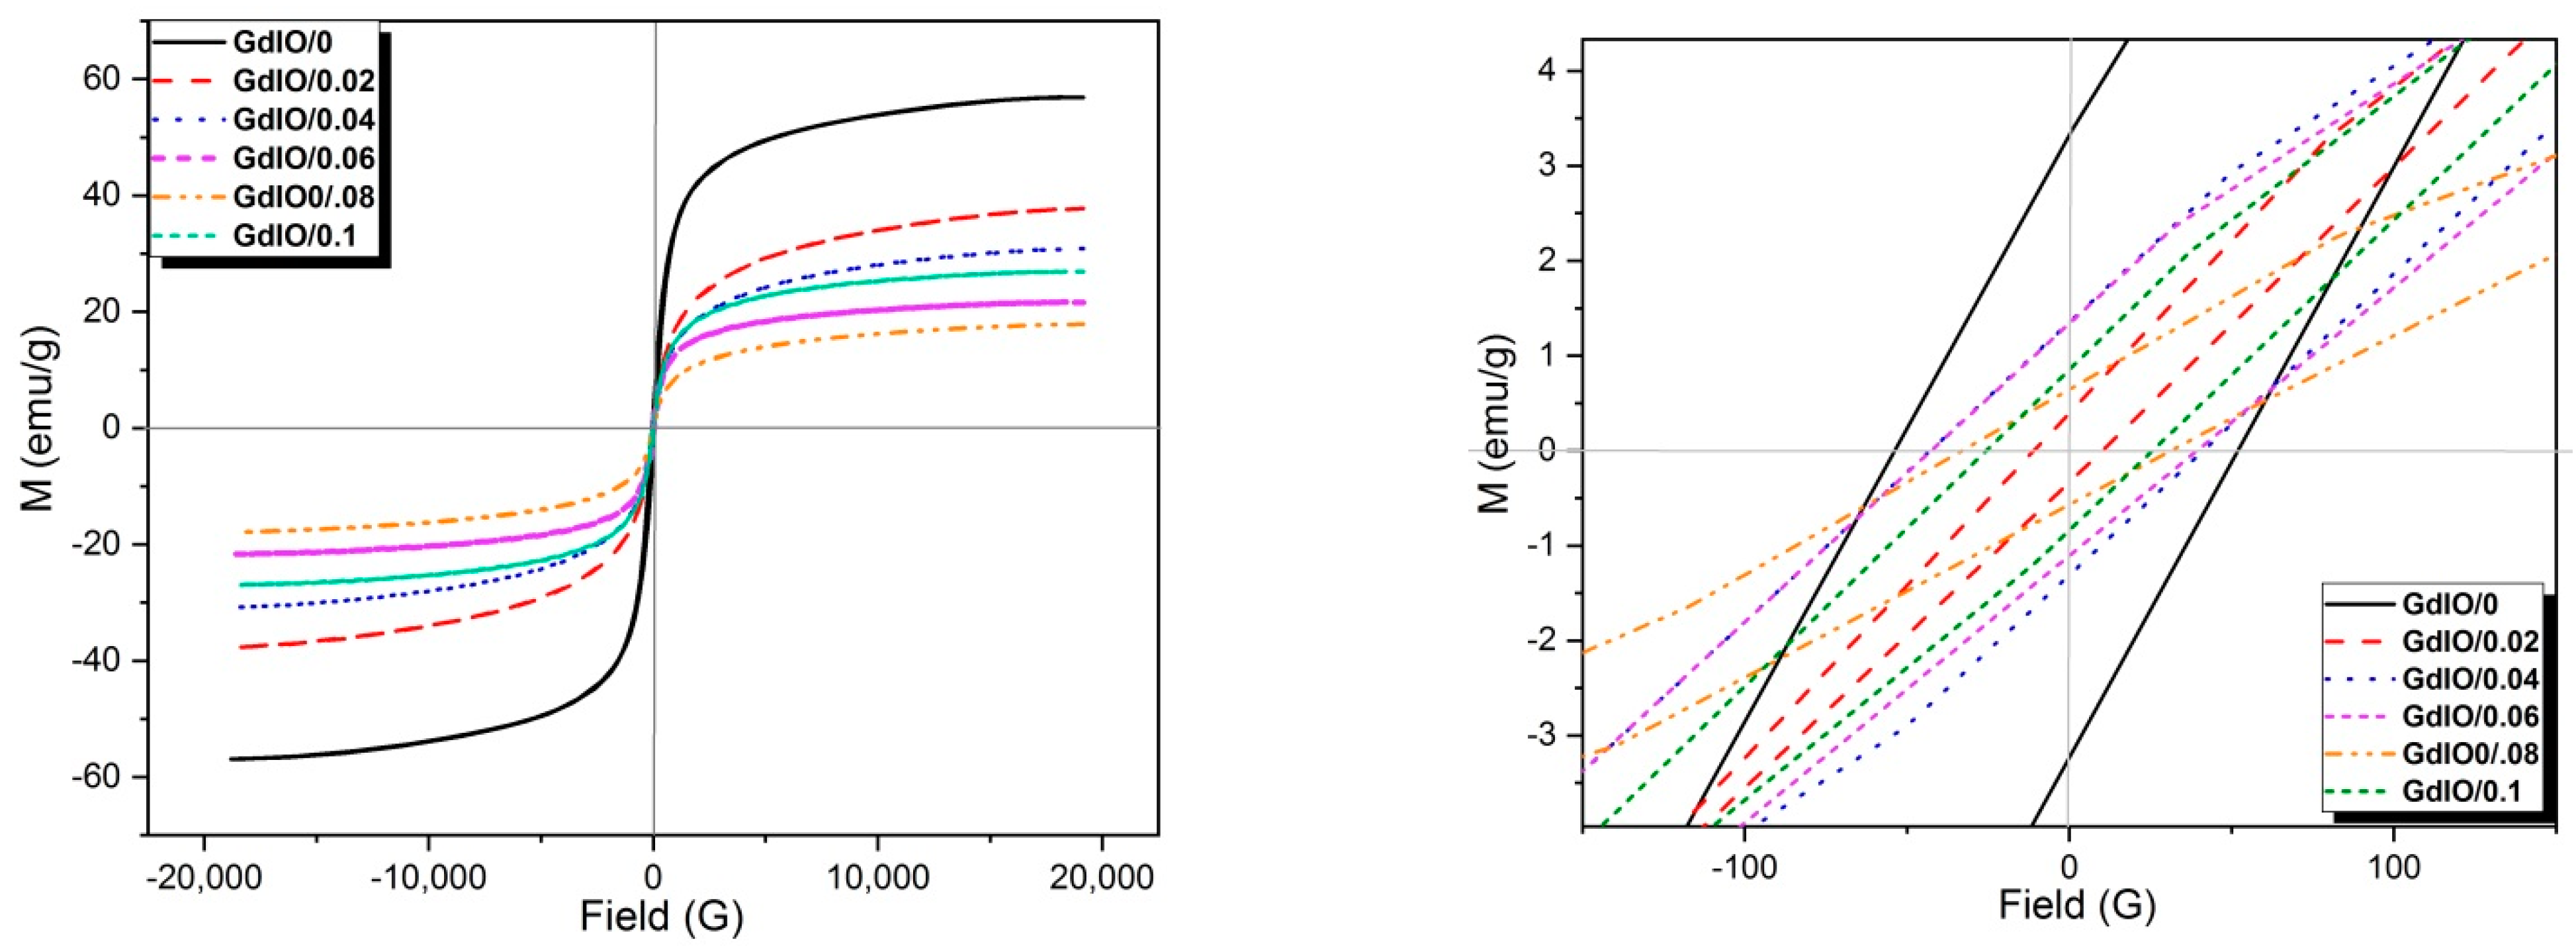
The magnetization curves for the six samples are shown in Figure 6. The curves reveal the superparamagnetic nature of the samples. The values of saturation magnetization can be understood on the basis of the obtained crystal phases. Sample GdIO/0 gives the highest magnetization as it is formed of pure maghemite, which possesses the highest magnetization. Hematite has a lower magnetization, whereas goethite and gadolinium hydroxide are nonmagnetic phases [62].
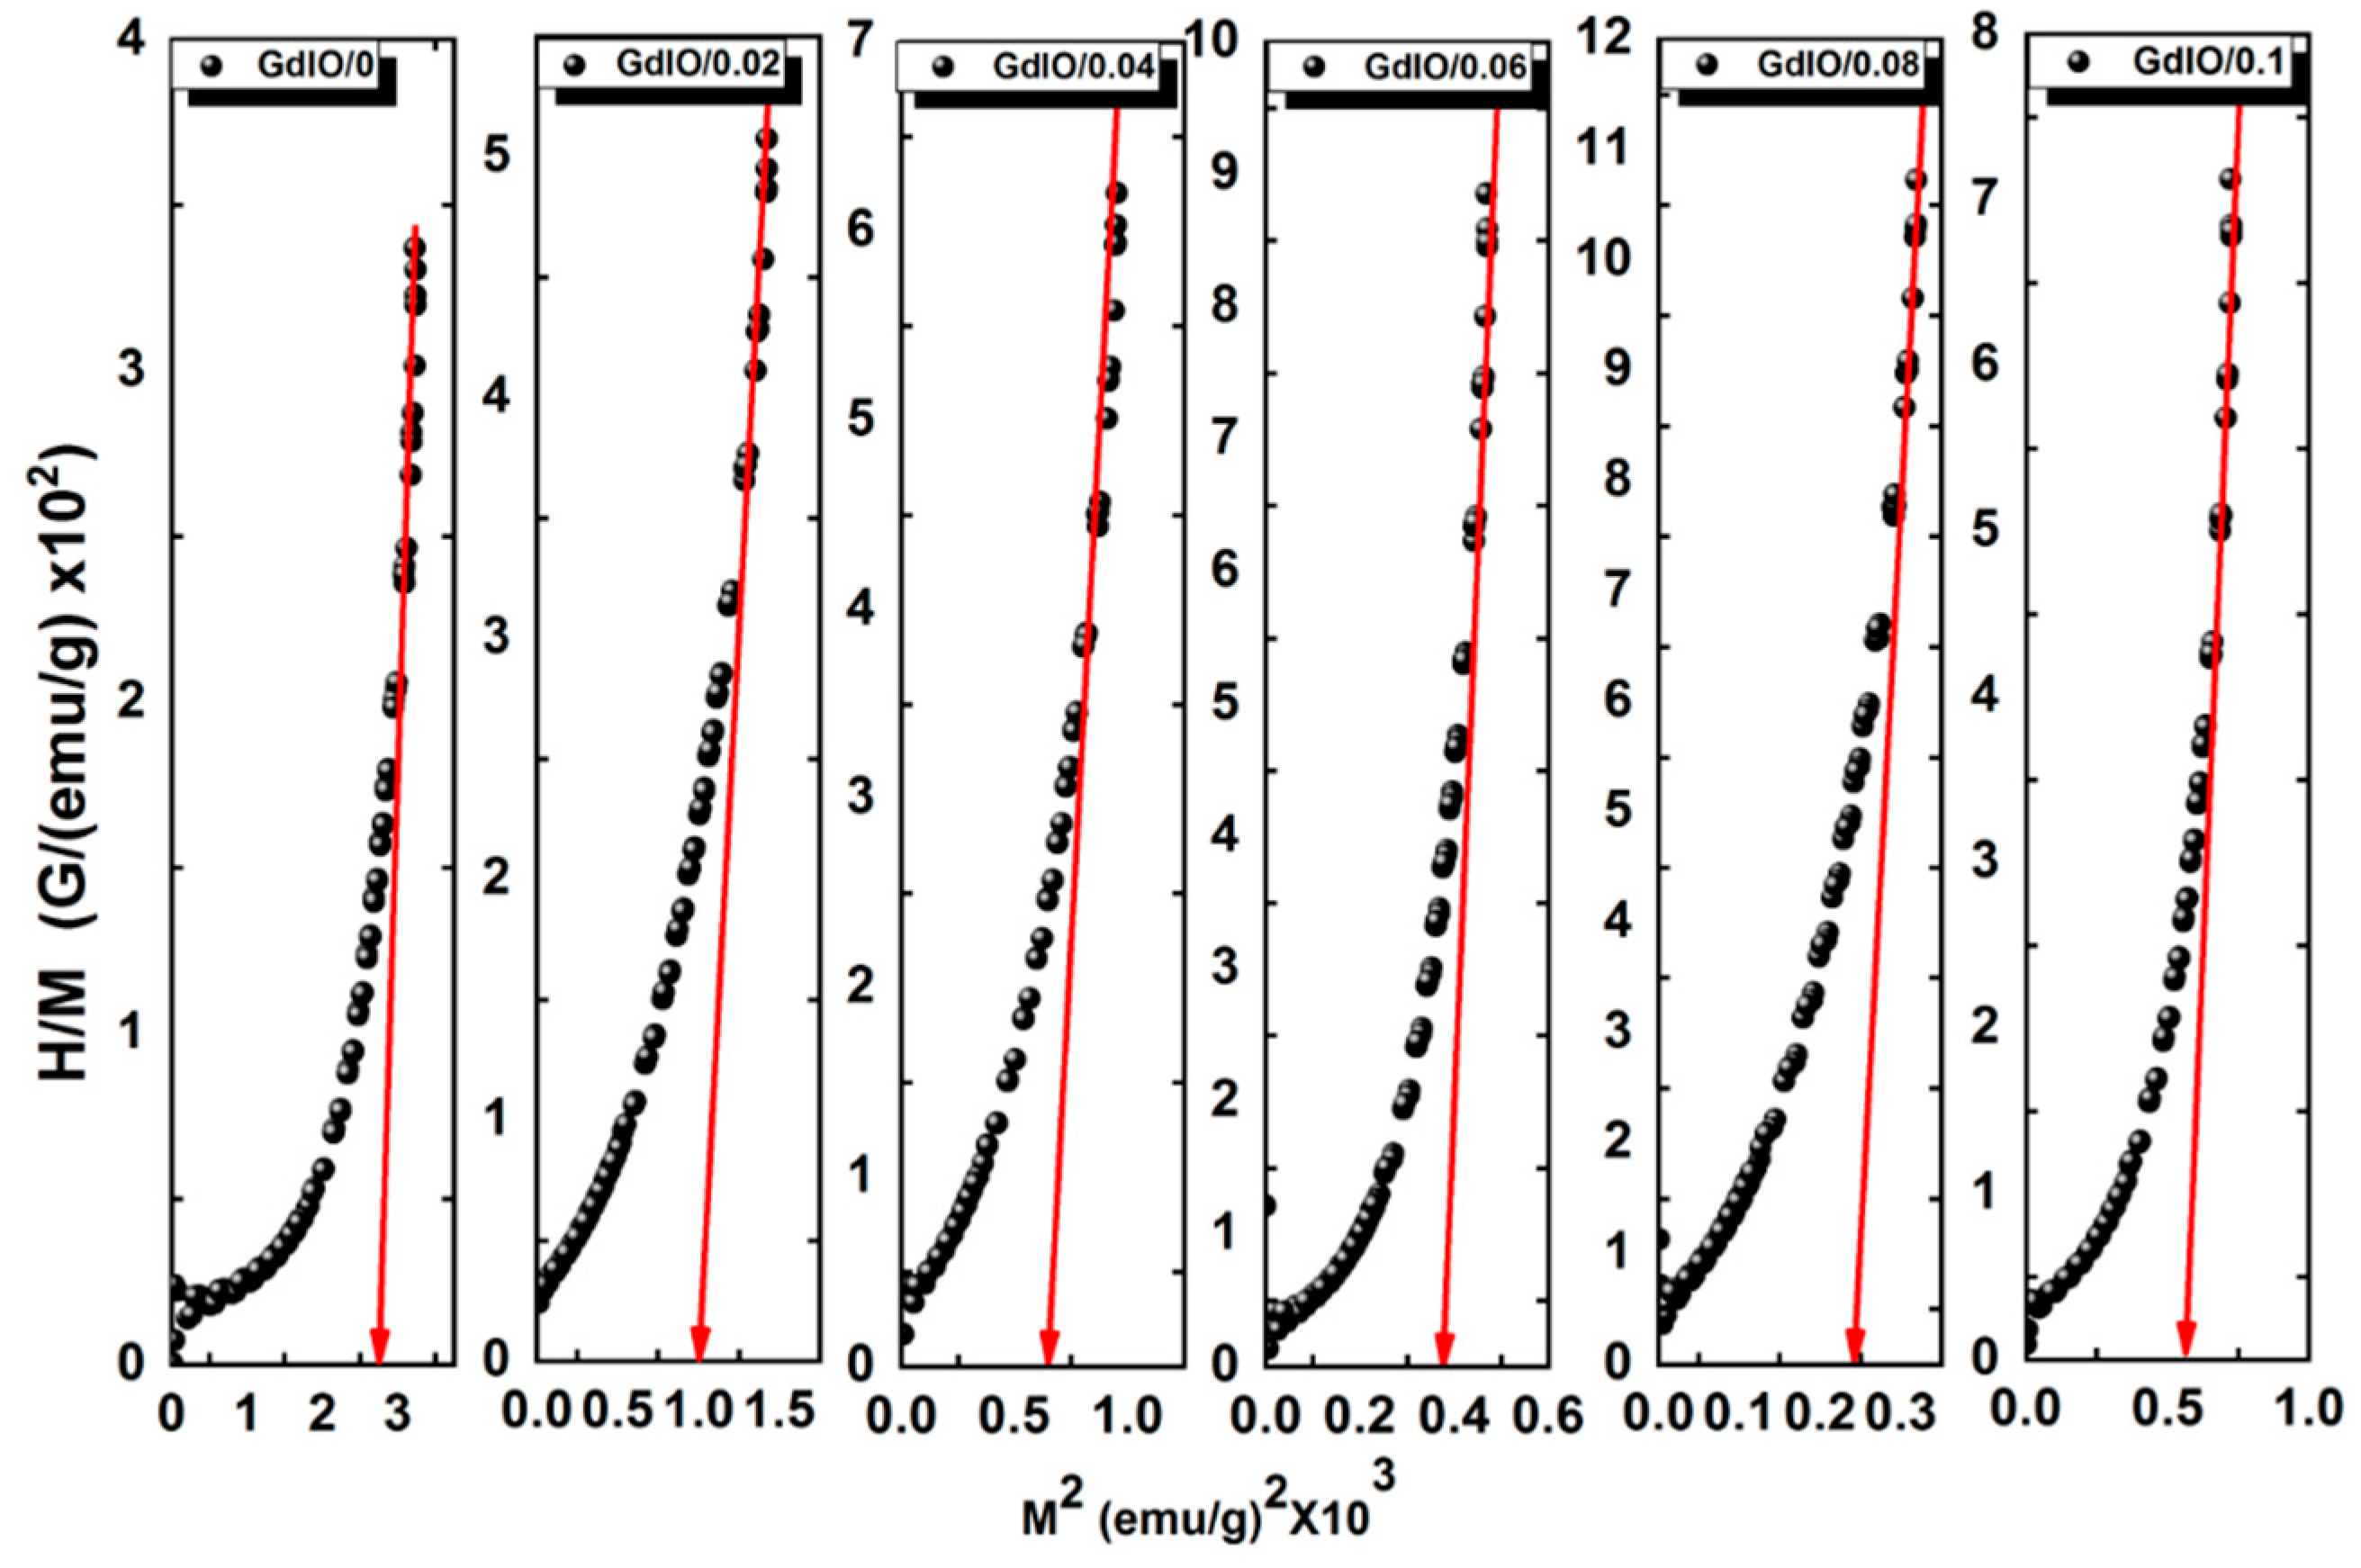
To obtain more accurate magnetization values, Arrott plots (H/M versus M2 curve) were plotted to analyze the magnetic behavior for all investigated samples, which are shown in Figure 7. From the Arrott plots, Ms was determined through the linear extrapolation of the high field magnetization data, which is indicated by the dashed lines [63]. The obtained Ms values from the Arrott plots are listed in Table 2, along with the measured magnetization values and coercivities for all samples.
Sample GdIO/0 is pure maghemite, and samples GdIO/0.02 and GdIO/0.04 are formed of gadolinium-doped iron oxide. Consequently, only these three samples will be subject to further investigation.
The contribution of the various phases to the obtained samples is graphically represented in Figure 8. The bars representing the two magnetic phases, maghemite and hematite, are patterned. The saturation magnetization of bulk maghemite is 60 emu/g [35], whereas hematite is weakly ferromagnetic at room temperature [64]. Taking into account the lowering in magnetization that occurs due to the evolution of a dead magnetic layer on the surface of the particles at the nanoscale [65], it is observed that the magnetization is consistent with the crystal structure of the samples.
3.3. Measurement of Particle Size
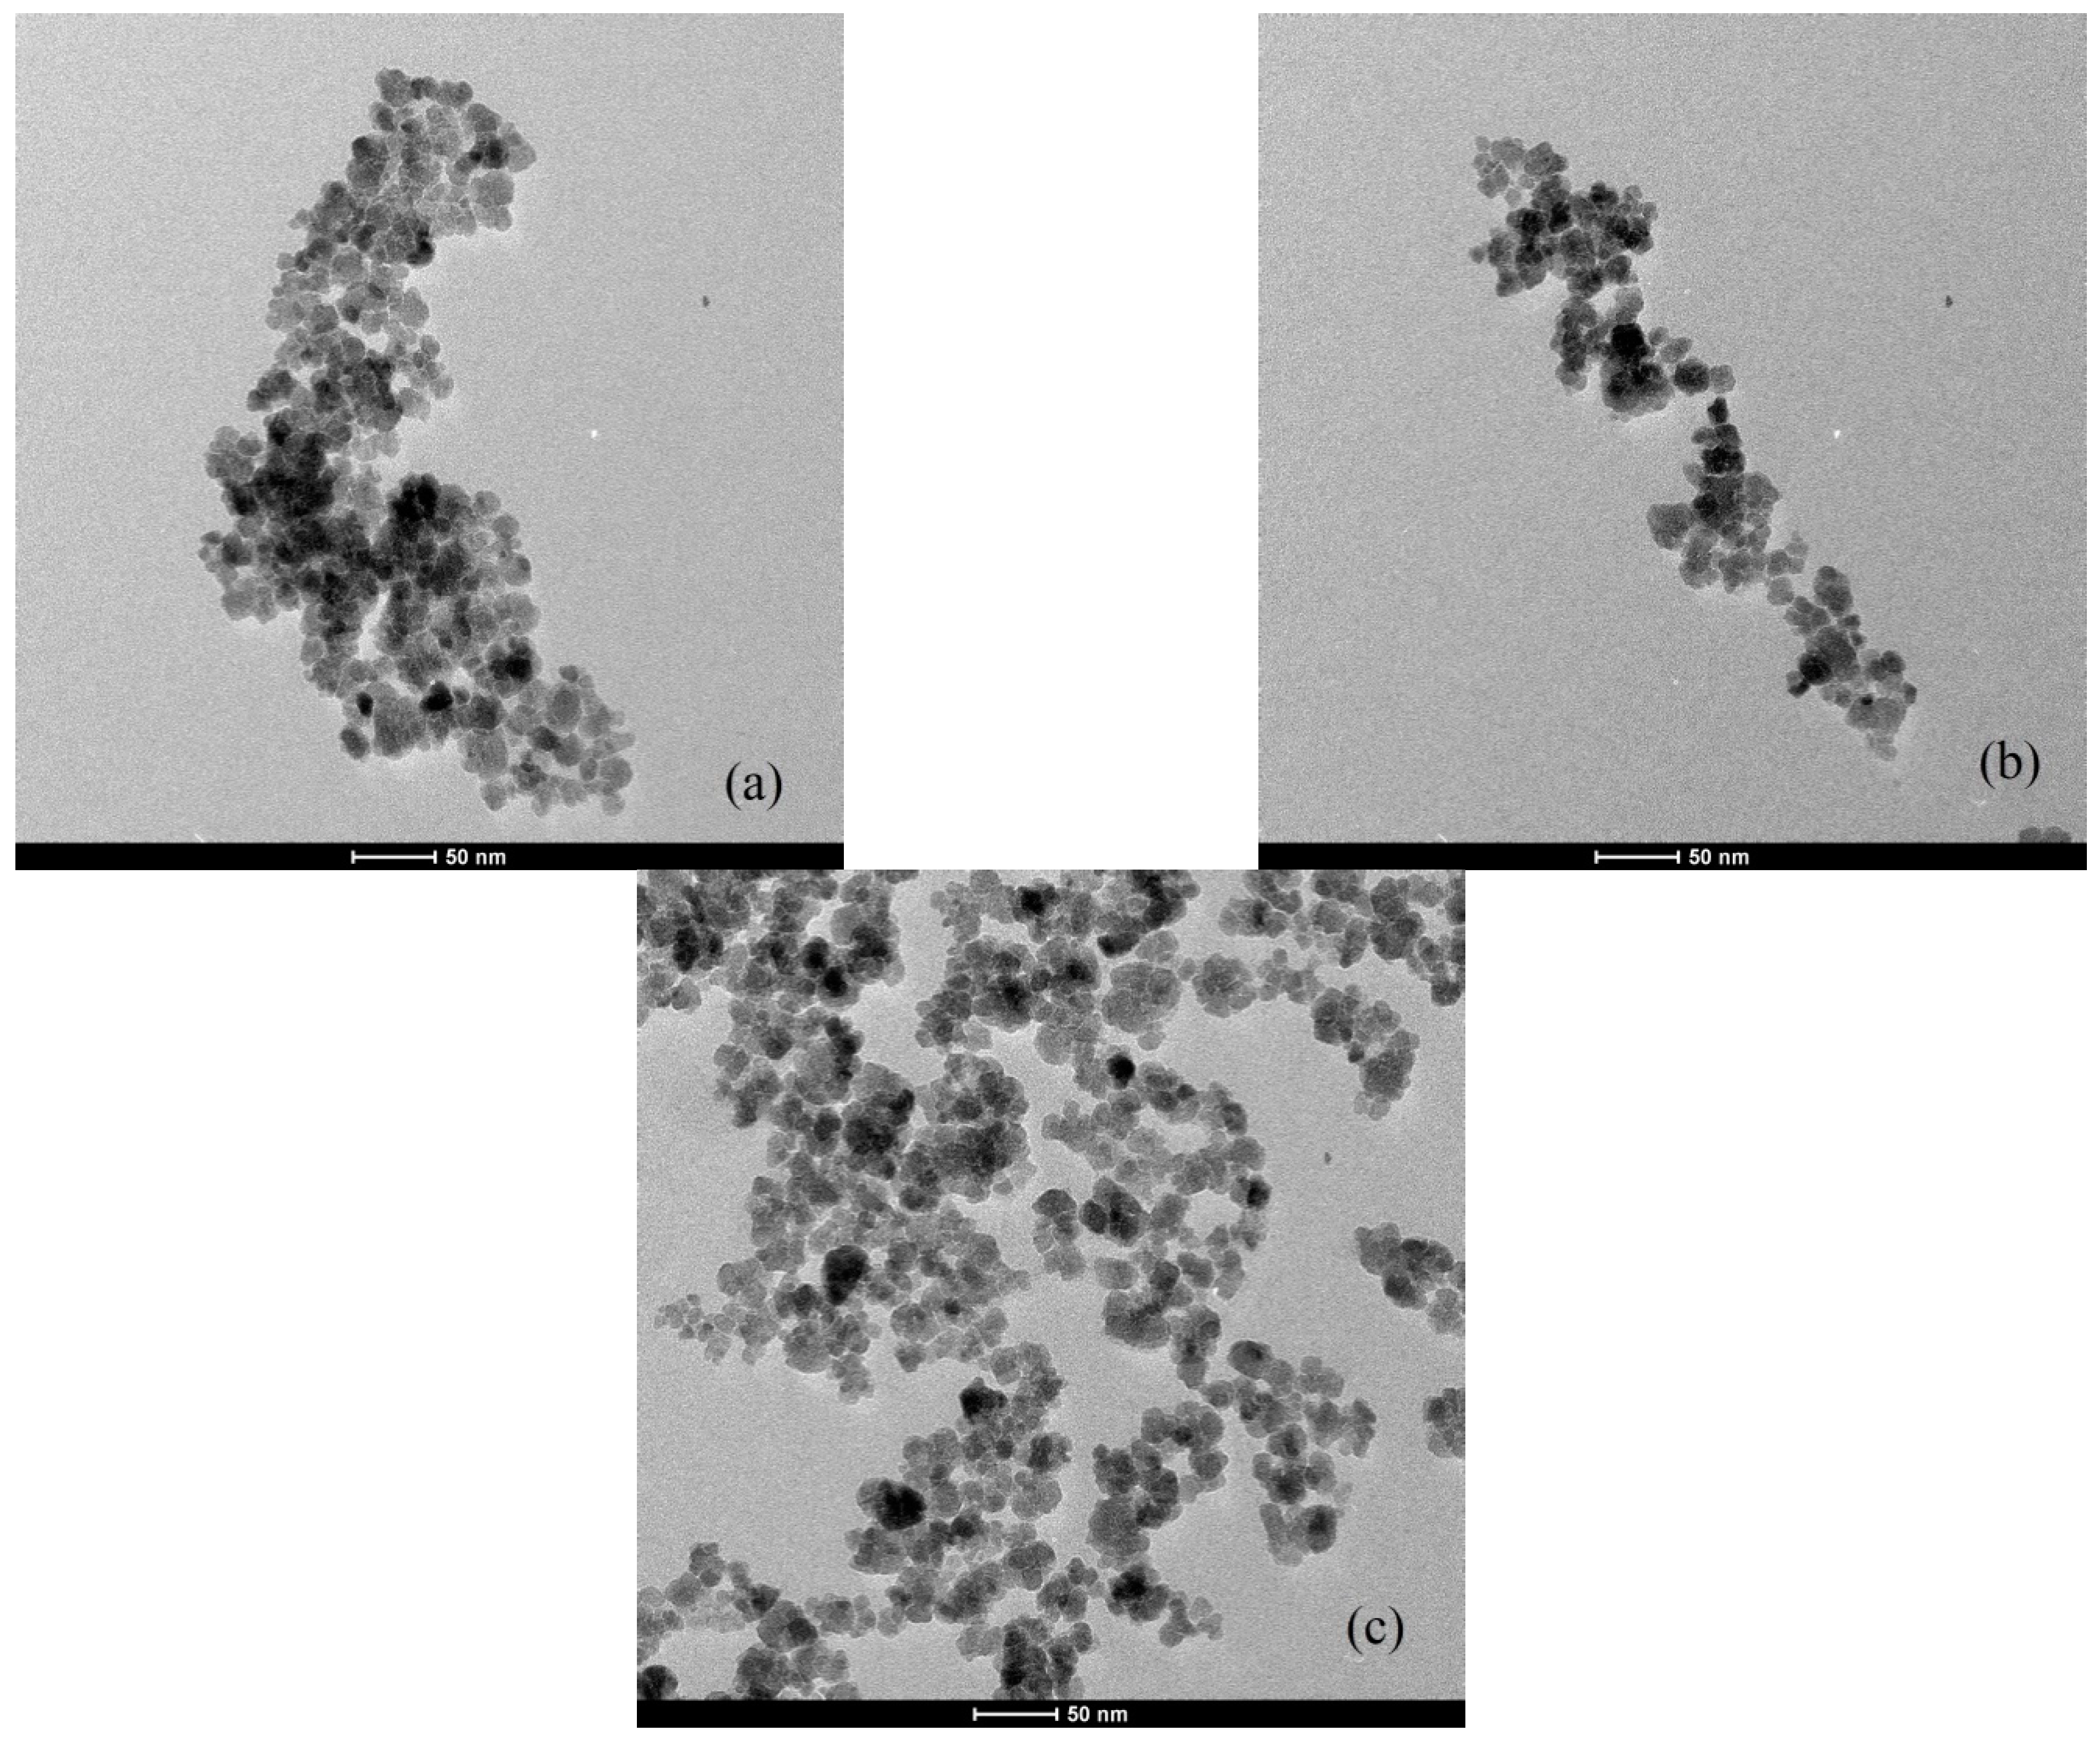
TEM micrographs of the samples GdIO/0, GdIO/0.02, and GdIO/0.04 are shown in Figure 9. The micrographs show that all three samples are formed of almost spherical particles and no considerable variation in size among samples is observed. The calculated average sizes of samples GdIO/0, GdIO/0.02, and GdIO/0.04 are 13.6 ± 1.2 nm, 12.8 ± 1.4 nm and 13.9 ± 1.6 nm, respectively.
3.4. Assessment of SAR
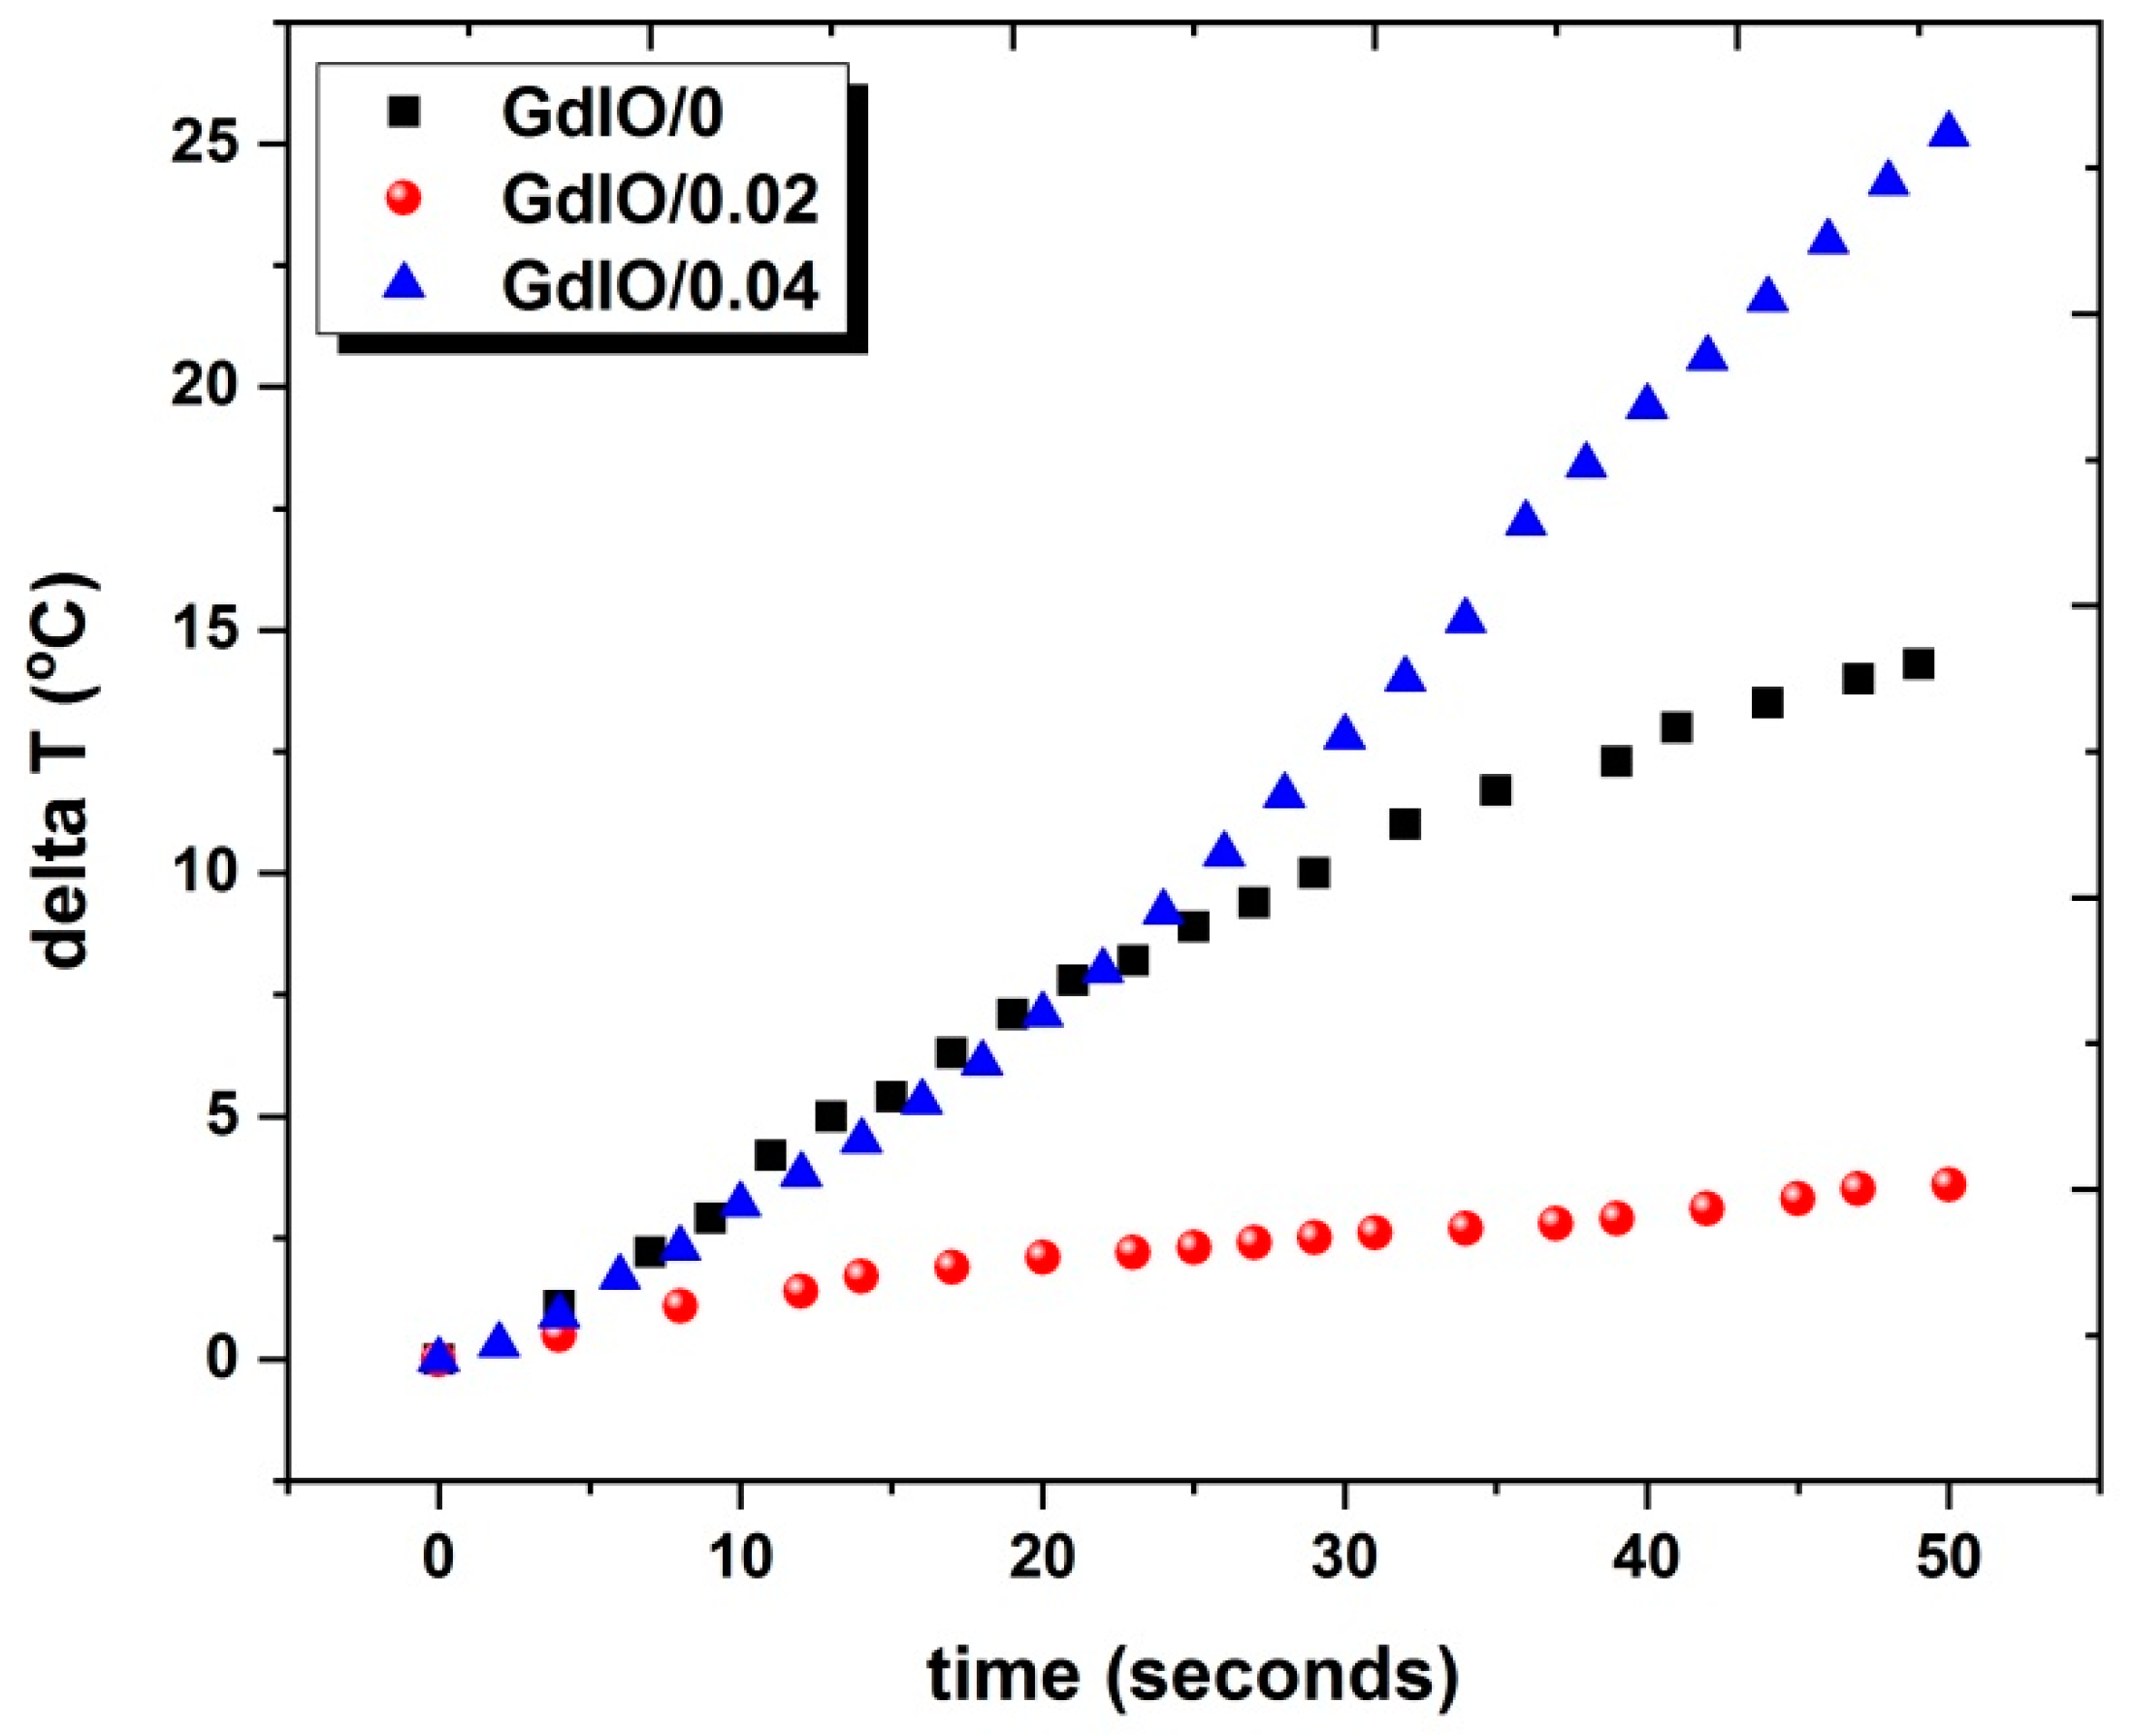
In this section, SAR values will be determined only for the maghemite sample GdIO/0 and the two samples with gadolinium ions incorporated into the iron oxide lattice, namely GdIO/0.02 and GdIO/0.04. The exposure frequency was 198 kHz, and the field intensity was 9.27 kA/m. The temperature rise versus exposure time (50 s) for the three samples is depicted in Figure 10. SAR values are determined from Equation (3) [65].
where cw, cIO and mw, mIO are the specific heat and mass of water and iron oxide particles, respectively.
The highest obtained value of SAR is 97.0 W/g for GdIO/0.04 followed by 67.4 W/g for GdIO/0 and finally, 16.64 W/g for GdIO/0.02. Thus, GdIO/0.04 gave almost a sixfold enhancement in SAR value compared with GdIO/0.
For superparamagnetic particles with , where V is the particle volume and and T are the Boltzmann constant and temperature, respectively, two relaxation mechanisms contribute to the AC loss of the particle: the Neel relaxation and the Brown rotation. The time constant for the Brownian relaxation [66] is given by
where is the viscosity coefficient of the fluid, is Boltzmann’s constant, T is the absolute temperature and is the hydrodynamic volume of the particle. It is the volume of the core and the adsorbed surfactant layer of thickness , [67]. The time constant for the Neel relaxation [68] is given by
where is the effective anisotropy and the term represents the energy barrier to the magnetization reversal. The exponent is the ratio between the anisotropy barrier and the thermal energy possessed by the particle at a specific temperature. is the characteristic time in the order of [69].
For relaxation loss to be the major loss mechanism and hysteresis loss to be ignored, the particles should exhibit superparamagnetic behavior. In such a state, the ambient temperature T should be above the blocking temperature TB of the particles [70]. It is worth noting that the values of coercivity for all samples are relatively low, as shown in Table 2. TB can be further lowered by application of an external magnetic field according to Bruvera et al. [71].
where and and is inversion time of the particles that can be considered as equivalent to the measurement time.
In addition, the particles in the sample exhibit a size distribution, as shown by the TEM micrographs. Because the small particles exhibit lower blocking temperature values, they subsequently heat up first, raising the temperature of the solution and resulting in the transfer of the larger blocked particles to the superparamagnetic state.
Since both mechanisms take place in parallel, the shorter time prevails. The effective relaxation time [72] is given by
The power dissipation density for a monodisperse sample [68] is given by
are the equilibrium susceptibility and is the amplitude and frequency of the applied. The power dissipation reaches its maximum when . The equation shows that conducting the measurement away from resonance results in an underestimation of the loss capability of the magnetic specificities in question.
Comparing the measured SAR values with those of previously conducted studies proves difficult as there is no consensus about measurement conditions. As mentioned above, the selection of the frequency is very crucial, and increasing the field may also lead to an enormous increase in the SAR value [73]. It is also important to consider whether the mass involved in an SAR calculation is the mass of the entire particle or only that of the iron content. Nevertheless, some of the previously obtained SAR values are stated herein. Maghemite uncoated nanoparticles with a diameter of 13 nm dispersed in agar gave 56 W/gFe at a frequency of 522.3 kHz and a field of 7.5 kA/m [73]. Cobalt ferrite nanoparticles (13.56 nm) were also heated by a field of 9.4 kA/m at 198 kHz and gave an SAR value of 82.6 W/g [8]. Another study on 35 nm manganese ferrite nanoparticles of concentration 3 mg/mL at a field intensity of 350 G and a frequency of 765.95 kHz showed that the particles gave an SAR value of 70 W/g [74], while Muhammad Nauman et al. studied gadolinium silicide nanoparticles and calculated an SAR value of 3.7 W/g for 43 nm particles at a field of 171 Oe and a frequency of 327 kHz [75]. Finally, a recent study using nanoparticles of different diameters based on La-Sr manganites, and with a low Curie temperature, gave SAR values ranging from 5.6 to 30 W/g [70].
Comparing the obtained results with those reported in the literature shows that sample GdIO/0.04 can be efficiently used for hyperthermia without violating the safety criteria [76] and that the SAR value of maghemite was enhanced by gadolinium doping.
4. Conclusions
This work attempts to utilize the hydrothermal method for the synthesis of gadolinium-doped magnetite. Being a wet method, it is suitable for preparing samples used in biomedical applications. The samples can be easily functionalized and dispersed. A thorough investigation of the obtained phases revealed the low solubility limit of the gadolinium ions in the iron oxide lattice (x = 0.04) prepared using this method. Increasing the gadolinium concentration merely resulted in a disturbed maghemite phase and the evolution of other phases in most of the samples. Gadolinium is observed to form a gadolinium hydroxide phase that is likely aggregated at the grain boundaries. The study showed that the magnetization values depend on the formed phases. GdIO/0.04 showed a sixfold enhancement in its ability to produce heat at 198 kHz. This allows the utilization of the sample as an MFH agent without the violation of safety guidelines.
Author Contributions
H.K. (Conceptualization, Investigation, Data curation, Formal analysis, Funding acquisition, Methodology, Software and Writing—original draft), A.F. (Investigation, Data curation, Formal analysis and Methodology), H.E.-S. (Conceptualization, Data curation and Writing—review and editing), A.A.-S. (Funding acquisition, Project administration and Software). All authors have read and agreed to the published version of the manuscript.
Funding
This research was funded by the Academy of Scientific Research and Technology (ASRT), grant number 6488 and “The APC was funded by the Academy of Scientific Research and Technology (ASRT)”.
Acknowledgments
Authors show their gratitude for the Academy of Scientific Research and Technology (ASRT) for funding this work.
Conflicts of Interest
The authors declare no conflict of interest.
References
- Bohara, R.A.; Thorat, N.D.; Pawar, S.H. Role of functionalization: Strategies to explore potential nano-bio applications of magnetic nanoparticles. RSC Adv. 2016, 6, 43989–44012. [Google Scholar] [CrossRef]
- Thorat, N.D.; Bohara, R.A.; Malgras, V.; Tofail, S.A.M.; Ahamad, T.; Alshehri, S.M.; Wu, K.C.; Yamauchi, Y. Multimodal Superparamagnetic Nanoparticles with Unusually Enhanced Specific Absorption Rate for Synergetic Cancer Therapeutics and Magnetic Resonance Imaging. ACS Appl. Mater. Interfaces 2016, 8, 14656–14664. [Google Scholar] [CrossRef] [PubMed]
- Cai, H.; An, X.; Cui, J.; Li, J.; Wen, S.; Li, K.; Shen, M.; Zheng, L.; Zhang, G.; Shi, X. Facile hydrothermal synthesis and surface functionalization of polyethyleneimine-coated iron oxide nanoparticles for biomedical applications. ACS Appl. Mater. Interfaces 2013, 5, 1722–1731. [Google Scholar] [CrossRef] [PubMed]
- Cortajarena, A.L.; Ortega, D.; Ocampo, S.M.; Gonzalez-García, A.; Couleaud, P.; Miranda, R.; Belda-Iniesta, C.; Ayuso-Sacido, A. Engineering Iron Oxide Nanoparticles for Clinical Settings. Nanobiomedicine 2014, 1, 2. [Google Scholar] [CrossRef] [PubMed] [Green Version]
- Miguel-Sancho, N.; Bomatí-Miguel, O.; Colom, G.; Salvador, J.P.; Marco, M.P.; Santamaría, J. Development of stable, water-dispersible, and biofunctionalizable superparamagnetic iron oxide nanoparticles. Chem. Mater. 2011, 23, 2795–2802. [Google Scholar] [CrossRef]
- Tishin, A.; Shtil, A.; Pyatakov, A.; Zverev, V. Developing Antitumor Magnetic Hyperthermia: Principles, Materials and Devices. Recent Pat. Anticancer. Drug Discov. 2016, 11, 360–375. [Google Scholar] [CrossRef] [PubMed]
- Hergt, R.; Andrae, W.; d’Ambly, C.G.; Hilger, I.; Kaiser, W.A.; Richter, U.; Schmidt, H.G. Physical limits of hyperthermia using magnetite fine particles. IEEE Trans. Magn. 1998, 34, 3745–3754. [Google Scholar] [CrossRef]
- Kahil, H.; El_Sayed, H.M.; Elsayed, E.M.; Sallam, A.M.; Talaat, M.; Sattar, A.A. Effect of in Vitro Magnetic Fluid Hyperthermia Using Citrate Coated Cobalt Ferrite Nanoparticles on Tumor Cell Death. Rom. J. Biophys. 2015, 25, 1–16. [Google Scholar]
- Roy, E.; Patra, S.; Madhuri, R.; Sharma, P.K. Stimuli-responsive poly(N-isopropyl acrylamide)-co-tyrosine@gadolinium: Iron oxide nanoparticle-based nanotheranostic for cancer diagnosis and treatment. Colloids Surfaces B Biointerfaces 2016, 142, 248–258. [Google Scholar] [CrossRef]
- Li, J.; Zheng, L.; Cai, H.; Sun, W.; Shen, M.; Zhang, G.; Shi, X. Facile one-pot synthesis of Fe3O4@Au composite nanoparticles for dual-mode MR/CT imaging applications. ACS Appl. Mater. Interfaces 2013, 5, 10357–10366. [Google Scholar] [CrossRef]
- Thorat, N.D.; Lemine, O.M.; Bohara, R.A.; Omri, K.; El Mir, L.; Tofail, S.A.M. Superparamagnetic iron oxide nanocargoes for combined cancer thermotherapy and MRI applications. Phys. Chem. Chem. Phys. 2016, 18, 21331–21339. [Google Scholar] [CrossRef] [PubMed]
- Koh, I.; Josephson, L. Magnetic Nanoparticle Sensors. Sensors 2009, 9, 8130–8145. [Google Scholar] [CrossRef] [PubMed]
- Pellico, J.; Llop, J.; Fernández-Barahona, I.; Bhavesh, R.; Ruiz-Cabello, J.; Herranz, F. Iron Oxide Nanoradiomaterials: Combining Nanoscale Properties with Radioisotopes for Enhanced Molecular Imaging. Contrast Media Mol. Imaging 2017, 2017, 1–24. [Google Scholar] [CrossRef] [PubMed] [Green Version]
- Davydov, A.S.; Belousov, A.V.; Krusanov, G.A.; Kolyvanova, M.A.; Kovalev, B.B.; Komlev, A.S.; Krivoshapkin, P.V.; Morozov, V.N.; Zverev, V.I. Promising magnetic nanoradiosensitizers for combination of tumor hyperthermia and X-ray therapy: Theoretical calculation. J. Appl. Phys. 2021, 129, 033902. [Google Scholar] [CrossRef]
- Hilger, I. In vivo applications of magnetic nanoparticle hyperthermia. Int. J. Hyperth. 2013, 29, 828–834. [Google Scholar] [CrossRef] [PubMed]
- Taylor, A.; Krupskaya, Y.; Krämer, K.; Füssel, S.; Klingeler, R.; Büchner, B.; Wirth, M.P. Cisplatin-loaded carbon-encapsulated iron nanoparticles and their in vitro effects in magnetic fluid hyperthermia. Carbon N. Y. 2010, 48, 2327–2334. [Google Scholar] [CrossRef]
- Lin, M.; Zhang, D.; Huang, J.; Zhang, J.; Xiao, W.; Yu, H.; Zhang, L.; Ye, J. The anti-hepatoma effect of nanosized Mn-Zn ferrite magnetic fluid hyperthermia associated with radiation in vitro and in vivo. Nanotechnology 2013, 24, 255101. [Google Scholar] [CrossRef]
- Wildeboer, R.R.; Southern, P.; Pankhurst, Q.A. On the reliable measurement of specific absorption rates and intrinsic loss parameters in magnetic hyperthermia materials. J. Phys. D Appl. Phys. 2014, 47, 495003. [Google Scholar] [CrossRef]
- Xiao, N.; Gu, W.; Wang, H.; Deng, Y.; Shi, X.; Ye, L. T1-T2 dual-modal MRI of brain gliomas using PEGylated Gd-doped iron oxide nanoparticles. J. Colloid Interface Sci. 2014, 417, 159–165. [Google Scholar] [CrossRef] [PubMed]
- Tahar, L.B.; Smiri, L.S.; Artus, M.; Joudrier, A.L.; Herbst, F.; Vaulay, M.J.; Ammar, S.; Fiévet, F. Characterization and magnetic properties of Sm- and Gd-substituted CoFe2O4 nanoparticles prepared by forced hydrolysis in polyol. Mater. Res. Bull. 2007, 42, 1888–1896. [Google Scholar] [CrossRef]
- Cai, H.; An, X.; Wen, S.; Li, J.; Zhang, G.; Shi, X.; Shen, M. Facile Synthesis of Gd(OH)3-Doped Fe3O4 Nanoparticles for Dual-Mode T1- and T2-Weighted Magnetic Resonance Imaging Applications. Part. Part. Syst. Charact. 2015, 32, 934–943. [Google Scholar] [CrossRef]
- Zhang, G.; Du, R.; Zhang, L.; Cai, D.; Sun, X.; Zhou, Y.; Zhou, J.; Qian, J.; Zhong, K.; Zheng, K.; et al. Gadolinium-Doped Iron Oxide Nanoprobe as Multifunctional Bioimaging Agent and Drug Delivery System. Adv. Funct. Mater. 2015, 25, 6101–6111. [Google Scholar] [CrossRef]
- Budnyk, A.P.; Lastovina, T.A.; Bugaev, A.L.; Polyakov, V.A.; Vetlitsyna-Novikova, K.S.; Sirota, M.A.; Abdulvakhidov, K.G.; Fedorenko, A.G.; Podlesnaya, E.O.; Soldatov, A. V Gd3+-Doped Magnetic Nanoparticles for Biomedical Applications. J. Spectrosc. 2018, 2018, 1–9. [Google Scholar] [CrossRef] [Green Version]
- Thorat, N.D.; Bohara, R.A.; Yadav, H.M.; Tofail, S.A.M. Multi-modal MR imaging and magnetic hyperthermia study of Gd doped Fe3O4 nanoparticles for integrative cancer therapy. RSC Adv. 2016, 6, 94967–94975. [Google Scholar] [CrossRef]
- Yadav, R.S.; Havlica, J.; Kuřitka, I.; Kozakova, Z.; Palou, M.; Bartoníčková, E.; Boháč, M.; Frajkorová, F.; Masilko, J.; Kalina, L.; et al. Magnetic Properties of Dysprosium-Doped Cobalt Ferrite Nanoparticles Synthesized by Starch-Assisted Sol-Gel Auto-combustion Method. J. Supercond. Nov. Magn. 2015, 28, 2097–2107. [Google Scholar] [CrossRef]
- Murugesan, C.; Chandrasekaran, G. Impact of Gd3+ substitution on the structural, magnetic and electrical properties of cobalt ferrite nanoparticles. RSC Adv. 2015, 5, 73714–73725. [Google Scholar] [CrossRef]
- Kim, B.H.; Lee, N.; Kim, H.; An, K.; Park, Y.I.; Choi, Y.; Shin, K.; Lee, Y.; Kwon, S.G.; Na, H.B.; et al. Large-Scale Synthesis of Uniform and Extremely Small-Sized Iron Oxide Nanoparticles for High-Resolution T1 Magnetic Resonance Imaging Contrast Agents. J. Am. Chem. Soc. 2011, 133, 12624–12631. [Google Scholar] [CrossRef] [PubMed]
- Zhang, S.; Zhang, Y.; Wang, Y.; Liu, S.; Deng, Y. Sonochemical formation of iron oxide nanoparticles in ionic liquids for magnetic liquid marble. Phys. Chem. Chem. Phys. 2012, 14, 5132–5138. [Google Scholar] [CrossRef]
- Ghanbari, D.; Salavati-Niasari, M.; Ghasemi-Kooch, M. A sonochemical method for synthesis of Fe3O4 nanoparticles and thermal stable PVA-based magnetic nanocomposite. J. Ind. Eng. Chem. 2014, 20, 3970–3974. [Google Scholar] [CrossRef]
- Awwad, A.M.; Salem, N.M. A Green and Facile Approach for Synthesis of Magnetite Nanoparticles. Nanosci. Nanotechnol. 2013, 2, 208–213. [Google Scholar] [CrossRef] [Green Version]
- Cai, W.; Wan, J. Facile synthesis of superparamagnetic magnetite nanoparticles in liquid polyols. J. Colloid Interface Sci. 2007, 305, 366–370. [Google Scholar] [CrossRef] [PubMed]
- Wilson, D.; Langell, M.A. XPS analysis of oleylamine/oleic acid capped Fe3O4 nanoparticles as a function of temperature. Appl. Surf. Sci. 2014, 303, 6–13. [Google Scholar] [CrossRef]
- Peng, J.; Hojamberdiev, M.; Xu, Y.; Cao, B.; Wang, J.; Wu, H. Hydrothermal synthesis and magnetic properties of gadolinium-doped CoFe2O4 nanoparticles. J. Magn. Magn. Mater. 2011, 323, 133–137. [Google Scholar] [CrossRef]
- Périgo, E.A.; Hemery, G.; Sandre, O.; Ortega, D.; Garaio, E.; Plazaola, F.; Teran, F.J. Fundamentals and advances in magnetic hyperthermia. Appl. Phys. Rev. 2015, 2, 041302. [Google Scholar] [CrossRef] [Green Version]
- Guivar, J.A.R.; Martínez, A.I.; Anaya, A.O.; Valladares, L.D.L.S.; Félix, L.L.; Dominguez, A.B. Structural and Magnetic Properties of Monophasic Maghemite (γ-Fe2O3) Nanocrystalline Powder. Adv. Nanoparticles 2014, 03, 114–121. [Google Scholar] [CrossRef] [Green Version]
- Ruíz-Baltazar, A.; Esparza, R.; Rosas, G.; Pérez, R. Effect of the Surfactant on the Growth and Oxidation of Iron Nanoparticles. J. Nanomater. 2015, 2015, 1–8. [Google Scholar] [CrossRef]
- Predoi, D.; Kuncser, V.; Filoti, G. Magnetic Behaviour of Maghemite Nanoparticles Studied By Mössbauer Spectroscopy. Rom. Reports Phys. 2004, 56, 373–378. [Google Scholar]
- Grosvenor, A.P.; Kobe, B.A.; Biesinger, M.C.; McIntyre, N.S. Investigation of multiplet splitting of Fe 2p XPS spectra and bonding in iron compounds. Surf. Interface Anal. 2004, 36, 1564–1574. [Google Scholar] [CrossRef]
- Hou, Y.; Xu, Z.; Sun, S. Controlled synthesis and chemical conversions of FeO nanoparticles. Angew. Chemie—Int. Ed. 2007, 46, 6329–6332. [Google Scholar] [CrossRef] [PubMed]
- Ahn, T.; Kim, J.H.; Yang, H.M.; Lee, J.W.; Kim, J.D. Formation pathways of magnetite nanoparticles by coprecipitation method. J. Phys. Chem. C 2012, 116, 6069–6076. [Google Scholar] [CrossRef]
- Liang, X.; Wang, X.; Zhuang, J.; Chen, Y.; Wang, D.; Li, Y. Synthesis of nearly monodisperse iron oxide and oxyhydroxide nanocrystals. Adv. Funct. Mater. 2006, 16, 1805–1813. [Google Scholar] [CrossRef]
- Legodi, M.A.; de Waal, D. The preparation of magnetite, goethite, hematite and maghemite of pigment quality from mill scale iron waste. Dye. Pigment. 2007, 74, 161–168. [Google Scholar] [CrossRef]
- Friák, M.; Schindlmayr, A.; Scheffler, M. Ab initio study of the half-metal to metal transition in strained magnetite. New J. Phys. 2007, 9, 5. [Google Scholar] [CrossRef]
- Mohammad-beigi, H.; Yaghmaei, S.; Roostaazad, R.; Bardania, H.; Arpanaei, A. Effect of pH, citrate treatment and silane-coupling agent concentration on the magnetic, structural and surface properties of functionalized silica-coated iron oxide nanocomposite particles. Phys. E Low-Dimensional Syst. Nanostructures 2011, 44, 618–627. [Google Scholar] [CrossRef]
- Rowan, A.D.; Patterson, C.H.; Gasparov, L.V. Hybrid density functional theory applied to magnetite: Crystal structure, charge order, and phonons. Phys. Rev. B—Condens. Matter Mater. Phys. 2009, 79, 205103. [Google Scholar] [CrossRef] [Green Version]
- Kim, Y.-I.; Im, W.B.; Jeon, M.K.; Lee, Y.-H.; Kim, K.-B.; Ryu, K.-S. Preferential site of Gd in Gd-doped Fe3O4 nanopowder. J. Nanosci. Nanotechnol. 2011, 11, 810–814. [Google Scholar] [CrossRef]
- Li, Z.; Kawashita, M.; Araki, N.; Mitsumori, M.; Hiraoka, M.; Doi, M. Preparation of magnetic iron oxide nanoparticles for hyperthermia of cancer in a FeCl2-NaNO3-NaOH aqueous system. J. Biomater. Appl. 2011, 25, 643–661. [Google Scholar] [CrossRef] [PubMed]
- Douglas, F.J.; MacLaren, D.A.; Maclean, N.; Andreu, I.; Kettles, F.J.; Tuna, F.; Berry, C.C.; Castro, M.; Murrie, M. Gadolinium-doped magnetite nanoparticles from a single-source precursor. RSC Adv. 2016, 6, 74500–74505. [Google Scholar] [CrossRef] [Green Version]
- Matthies, S.; Lutteroti, L.; Wenk, H.R. Advances in Texture Analysis from Diffraction Spectra. J. Appl. Crystallogr. 1997, 30, 31–42. [Google Scholar] [CrossRef]
- Lee, J.B.; Kim, H.J.; Lužnik, J.; Jelen, A.; Pajić, D.; Wencka, M.; Jagličić, Z.; Meden, A.; Dolinšek, J. Synthesis and magnetic properties of hematite particles in a “nanomedusa” morphology. J. Nanomater. 2014, 2014, 1–9. [Google Scholar] [CrossRef]
- Beall, G.W.; Milligan, W.O.; Wolcott, H.A. Structural trends in the lanthanide trihydroxides. J. Inorg. Nucl. Chem. 1977, 39, 65–70. [Google Scholar] [CrossRef]
- Al-Jubouri, S.M.; Waisi, B.I.; Holmes, S.M. Rietveld texture refinement analysis of linde type a zeolite from X-ray diffraction data. J. Eng. Sci. Technol. 2018, 13, 4066–4077. [Google Scholar]
- Yamashita, T.; Hayes, P. Analysis of XPS spectra of Fe2+ and Fe3+ ions in oxide materials. Appl. Surf. Sci. 2008, 254, 2441–2449. [Google Scholar] [CrossRef]
- Shen, L.H.; Bao, J.F.; Wang, D.; Wang, Y.X.; Chen, Z.W.; Ren, L.; Zhou, X.; Ke, X.B.; Chen, M.; Yang, A.Q. One-step synthesis of monodisperse, water-soluble ultra-small Fe3O4 nanoparticles for potential bio-application. Nanoscale 2013, 5, 2133–2141. [Google Scholar] [CrossRef] [PubMed]
- Wang, W.P.; Yang, H.; Xian, T.; Jiang, J.L. XPS and magnetic properties of CoFe2O4 nanoparticles synthesized by a polyacrylamide gel route. Mater. Trans. 2012, 53, 1586–1589. [Google Scholar] [CrossRef] [Green Version]
- Zhang, N.; Chen, D.; Niu, F.; Wang, S.; Qin, L.; Huang, Y. Enhanced visible light photocatalytic activity of Gd-doped BiFeO3 nanoparticles and mechanism insight. Sci. Rep. 2016, 6, 1–11. [Google Scholar] [CrossRef]
- Serga, V.; Burve, R.; Maiorov, M.; Krumina, A.; Skaudžius, R.; Zarkov, A.; Kareiva, A.; Popov, A.I. Impact of Gadolinium on the Structure and Magnetic Properties of Nanocrystalline Powders of Iron Oxides Produced by the Extraction-Pyrolytic Method. Materials 2020, 13, 4147. [Google Scholar] [CrossRef] [PubMed]
- Choi, E.S.; Xu, W.; Baek, M.J.; Park, J.Y.; Kim, J.H.; Chang, Y.; Kim, T.J.; Lee, G.H. Gd(III) doping effect on magnetization and water proton relaxivities in ultra small iron oxide nanoparticles. AIP Adv. 2013, 3, 072101. [Google Scholar] [CrossRef]
- Drake, P.; Cho, H.J.; Shih, P.S.; Kao, C.H.; Lee, K.F.; Kuo, C.H.; Lin, X.Z.; Lin, Y.J. Gd-doped iron-oxide nanoparticles for tumour therapy via magnetic field hyperthermia. J. Mater. Chem. 2007, 17, 4914–4918. [Google Scholar] [CrossRef]
- Sena, N.C.; Castro, T.J.; Garg, V.K.; Oliveira, A.C.; Morais, P.C.; Silva, S.W. Gadolinium ferrite nanoparticles: Synthesis and morphological, structural and magnetic properties. Ceram. Int. 2017, 43, 4042–4047. [Google Scholar] [CrossRef]
- Yadav, R.S.; Kuřitka, I.; Vilcakova, J.; Havlica, J.; Kalina, L.; Urbánek, P.; Machovsky, M.; Skoda, D.; Masař, M.; Holek, M. Sonochemical synthesis of Gd3+ doped CoFe2O4 spinel ferrite nanoparticles and its physical properties. Ultrason. Sonochem. 2018, 40, 773–783. [Google Scholar] [CrossRef] [Green Version]
- Martin-Hernandez, F.; García-Hernández, M.M. Magnetic properties and anisotropy constant of goethite single crystals at saturating high fields. Geophys. J. Int. 2010, 181, 756–761. [Google Scholar] [CrossRef] [Green Version]
- Sattar, A.A.; Elsayed, H.M.; Faramawy, A.M. Comparative study of structure and magnetic properties of micro- and nano-sized GdxY3-xFe5O12 garnet. J. Magn. Magn. Mater. 2016, 412, 172–180. [Google Scholar] [CrossRef]
- Wan, H.; Rong, P.; Liu, X.; Yang, L.; Jiang, Y.; Zhang, N.; Ma, R.; Liang, S.; Wang, H.; Qiu, G. Morphological Evolution and Magnetic Property of Rare-Earth-Doped Hematite Nanoparticles: Promising Contrast Agents for T1-Weighted Magnetic Resonance Imaging. Adv. Funct. Mater. 2017, 27, 1606821. [Google Scholar] [CrossRef]
- Inukai, A.; Sakamoto, N.; Aono, H.; Sakurai, O.; Shinozaki, K.; Suzuki, H.; Wakiya, N. Synthesis and hyperthermia property of hydroxyapatiteferrite hybrid particles by ultrasonic spray pyrolysis. J. Magn. Magn. Mater. 2011, 323, 965–969. [Google Scholar] [CrossRef] [Green Version]
- Umut, E.; Coşkun, M.; Pineider, F.; Berti, D.; Güngüneş, H. Nickel ferrite nanoparticles for simultaneous use in magnetic resonance imaging and magnetic fluid hyperthermia. J. Colloid Interface Sci. 2019, 550, 199–209. [Google Scholar] [CrossRef]
- Rosensweig, R.E. Heating magnetic fluid with alternating magnetic field. J. Magn. Magn. Mater. 2002, 252, 370–374. [Google Scholar] [CrossRef]
- Worm, H.-U. On the superparamagnetic-stable single domain transition for magnetite, and frequency dependence of susceptibility. Geophys. J. Int. 1998, 133, 201–206. [Google Scholar] [CrossRef]
- Mamani, J.B.; Costa-Filho, A.J.; Cornejo, D.R.; Vieira, E.D.; Gamarra, L.F. Synthesis and characterization of magnetite nanoparticles coated with lauric acid. Mater. Charact. 2013, 81, 28–36. [Google Scholar] [CrossRef]
- Ferreira, M.C.; Pimentel, B.; Andrade, V.; Zverev, V.; Gimaev, R.R.; Pomorov, A.S.; Pyatakov, A.; Alekhina, Y.; Komlev, A.; Makarova, L.; et al. Understanding the dependence of nanoparticles magnetothermal properties on their size for hyperthermia applications: A case study for la-sr manganites. Nanomaterials 2021, 11, 1826. [Google Scholar] [CrossRef]
- Bruvera, I.J.; Mendoza Zélis, P.; Pilar Calatayud, M.; Goya, G.F.; Sánchez, F.H. Determination of the blocking temperature of magnetic nanoparticles: The good, the bad, and the ugly. J. Appl. Phys. 2015, 118, 184304. [Google Scholar] [CrossRef]
- Hervault, A.; Thanh, N.T.K. Magnetic nanoparticle-based therapeutic agents for thermo-chemotherapy treatment of cancer. Nanoscale 2014, 6, 11553–11573. [Google Scholar] [CrossRef] [PubMed] [Green Version]
- de la Presa, P.; Luengo, Y.; Multigner, M.; Costo, R.; Morales, M.P.; Rivero, G.; Hernando, A. Study of Heating Efficiency as a Function of Concentration, Size, and Applied Field in γ-Fe2O3 Nanoparticles. J. Phys. Chem. C 2012, 116, 25602–25610. [Google Scholar] [CrossRef]
- Narayanaswamy, V.; Al-Omari, I.A.; Kamzin, A.S.; Issa, B.; Tekin, H.O.; Khourshid, H.; Kumar, H.; Mallya, A.; Sambasivam, S.; Obaidat, I.M. Specific absorption rate dependency on the Co2+ distribution and magnetic properties in coxmn1-xFe2O4 nanoparticles. Nanomaterials 2021, 11, 1231. [Google Scholar] [CrossRef]
- Nauman, M.; Alnasir, M.H.; Hamayun, M.A.; Wang, Y.; Shatruk, M.; Manzoor, S. Size-dependent magnetic and magnetothermal properties of gadolinium silicide nanoparticles. RSC Adv. 2020, 10, 28383–28389. [Google Scholar] [CrossRef]
- Hergt, R.; Dutz, S. Magnetic particle hyperthermia—biophysical limitations of a visionary tumour therapy. J. Magn. Magn. Mater. 2007, 311, 187–192. [Google Scholar] [CrossRef]
Figure 1.
Exposure setup AMF using the induction heater. The optical fiber thermometer, sample holder, polystyrene foam jacket and coil dimensions are shown.
Figure 1.
Exposure setup AMF using the induction heater. The optical fiber thermometer, sample holder, polystyrene foam jacket and coil dimensions are shown.

Figure 2.
X-ray diffraction pattern for samples GdIO/0, GdIO/0.02, GdIO/0.04, GdIO/0.06, GdIO/0.08 and GdIO/0.1 arranged from top to bottom.
Figure 2.
X-ray diffraction pattern for samples GdIO/0, GdIO/0.02, GdIO/0.04, GdIO/0.06, GdIO/0.08 and GdIO/0.1 arranged from top to bottom.

Figure 3.
XPS spectra for GdIO/0 (left) and GdIO/0.1 (right).

Figure 4.
High resolution XPS for sample GdIO/0 showing (a) the iron ion peak, and (b) the oxygen peak.
Figure 4.
High resolution XPS for sample GdIO/0 showing (a) the iron ion peak, and (b) the oxygen peak.

Figure 5.
High resolution XPS plots showing the peaks for gadolinium ions for samples GdIO/0.04 (left) and GdIO/0.1 (right).
Figure 5.
High resolution XPS plots showing the peaks for gadolinium ions for samples GdIO/0.04 (left) and GdIO/0.1 (right).

Figure 6.
Magnetization curves for samples GdIO/0, GdIO/0.02, GdIO/0.04, GdIO/0.06, GdIO/0.08 and GdIO/0.1 (left) and magnetization for the small applied field to show the coercivity of samples (right).
Figure 6.
Magnetization curves for samples GdIO/0, GdIO/0.02, GdIO/0.04, GdIO/0.06, GdIO/0.08 and GdIO/0.1 (left) and magnetization for the small applied field to show the coercivity of samples (right).

Figure 7.
Arrott plots for samples GdO/0, GdIO/0.02, GdIO/0.04, GdIO/0.06, GdIO/0.08 and GdIO/0.1 from left to right.
Figure 7.
Arrott plots for samples GdO/0, GdIO/0.02, GdIO/0.04, GdIO/0.06, GdIO/0.08 and GdIO/0.1 from left to right.

Figure 8.
The percentages of the various phases in samples GdIO/0, GdIO/0.02, GdIO/0.04, GdIO/0.6, GdIO/0.8 and GdIO/0.1 from left to right. The patterned bars represent the magnetic phases.
Figure 8.
The percentages of the various phases in samples GdIO/0, GdIO/0.02, GdIO/0.04, GdIO/0.6, GdIO/0.8 and GdIO/0.1 from left to right. The patterned bars represent the magnetic phases.

Figure 9.
TEM micrographs for samples (a) GdIO/0, (b) GdIO/0.02, and (c) GdIO/0.04.

Figure 10.
Temperature rise versus time for the three samples: GdIO/0, GdIO/0.02 and GdIO/0.04.


Table 1.
The obtained phases and their percentages for each sample along with the refinement parameters.
Table 1.
The obtained phases and their percentages for each sample along with the refinement parameters.
| Sample Code | Formed Phase | Lattice Parameters (Å) | |||
|---|---|---|---|---|---|
| GdIO/0.00 | 0 | FCC 100% | 8.36 | 0.697 | 1.43 |
| GdIO/0.02 | 0.02 | Orthorhombic 55.43%(Goethite) | 4.42, b = 10.07, c = 2.95 | 0.712 | 1.39 |
| FCC 44.56% | 8.39 | ||||
| GdIO/0.04 | 0.04 | FCC 70.832% | 8.41 | 0.967 | 1.03 |
| Goethite 16.21% | 4.68, b =10.08, c = 2.95 | ||||
| Hematite 12.45% | 4.919, c = 14.05 | ||||
| GdIO/0.06 | 0.06 | Hematite 66.99% | 5.04, c = 13.76 | 0.746 | 1.339 |
| FCC 31.52% | 8.41 | ||||
| Hexagonal 1.474%Gd(OH)3 | 6.33, c = 3.63 | ||||
| GdIO/0.08 | 0.08 | Hematite 84.609% | 5.04, c = 13.77 | 0.905 | 1.104 |
| FCC 7.122% | 8.40 | ||||
| Goethite 4.32% | 4.63, b = 9.97, c = 3.01 | ||||
| Gd(OH)3 3.942% | 6.33, c = 3.63 | ||||
| GdIO/0.1 | 0.1 | FCC 41.720% | 8.42 | 0.865 | 1.156 |
| Hematite 31.583% | 5.04, c = 13.77 | ||||
| Goethite 22.92% | 4.59, b = 9.96, c = 3.02 | ||||
| Gd(OH)3 3.772% | 6.329, c = 3.631 |
Table 2.
Magnetization and coercivity values for samples GdIO/0, GdIO/0.02, GdIO/0.04, GdIO/0.06, GdIO/0.08 and GdIO/0.1.
Table 2.
Magnetization and coercivity values for samples GdIO/0, GdIO/0.02, GdIO/0.04, GdIO/0.06, GdIO/0.08 and GdIO/0.1.
| Sample Code | Measured Magnetization (emu/g) | Magnetization Calculated from Arrott Plots (emu/g) | Coercivity (G) |
|---|---|---|---|
| GdIO/0 | 56.9 | 52.9 | 52.87 |
| GdIO/0.02 | 37.7 | 31.6 | 10.5 |
| GdIO/0.04 | 30.9 | 25.9 | 42.05 |
| GdIO/0.06 | 21.7 | 15.9 | 40.986 |
| GdIO/0.08 | 17.9 | 15.8 | 32.172 |
| GdIO/0.1 | 26.9 | 23.8 | 25.6 |
Publisher’s Note: MDPI stays neutral with regard to jurisdictional claims in published maps and institutional affiliations. |
© 2021 by the authors. Licensee MDPI, Basel, Switzerland. This article is an open access article distributed under the terms and conditions of the Creative Commons Attribution (CC BY) license (https://creativecommons.org/licenses/by/4.0/).
Share and Cite
MDPI and ACS Style
Kahil, H.; Faramawy, A.; El-Sayed, H.; Abdel-Sattar, A. Magnetic Properties and SAR for Gadolinium-Doped Iron Oxide Nanoparticles Prepared by Hydrothermal Method. Crystals 2021, 11, 1153. https://doi.org/10.3390/cryst11101153
AMA Style
Kahil H, Faramawy A, El-Sayed H, Abdel-Sattar A. Magnetic Properties and SAR for Gadolinium-Doped Iron Oxide Nanoparticles Prepared by Hydrothermal Method. Crystals. 2021; 11(10):1153. https://doi.org/10.3390/cryst11101153
Chicago/Turabian StyleKahil, Heba, Ahmed Faramawy, Hesham El-Sayed, and Adel Abdel-Sattar. 2021. "Magnetic Properties and SAR for Gadolinium-Doped Iron Oxide Nanoparticles Prepared by Hydrothermal Method" Crystals 11, no. 10: 1153. https://doi.org/10.3390/cryst11101153
Note that from the first issue of 2016, this journal uses article numbers instead of page numbers. See further details here.