The Effects of Ultrasound on Crystals: Sonocrystallization and Sonofragmentation

Department of Chemistry, University of Illinois at Urbana-Champaign, 600 S. Mathews Av., Urbana, IL 61801, USA
*
Author to whom correspondence should be addressed.
Crystals 2018, 8(7), 280; https://doi.org/10.3390/cryst8070280
Submission received: 11 June 2018
/
Revised: 27 June 2018
/
Accepted: 2 July 2018
/
Published: 4 July 2018
(This article belongs to the Special Issue Advances in Ultrasound Stimulated Crystallization)
Abstract
:When ultrasound is applied to a solution for crystallization, it can affect the properties of the crystalline products significantly. Ultrasonic irradiation decreases the induction time and metastable zone and increases the nucleation rate. Due to these effects, it generally yields smaller crystals with a narrower size distribution when compared with conventional crystallizations. Also, ultrasonic irradiation can cause fragmentation of existing crystals which is caused by crystal collisions or sonofragmentation. The effect of various experimental parameters and empirical products of sonocrystallization have been reported, but the mechanisms of sonocrystallization and sonofragmentation have not been confirmed clearly. In this review, we build upon previous studies and highlight the effects of ultrasound on the crystallization of organic molecules. In addition, recent work on sonofragmentation of molecular and ionic crystals is discussed.

1. Introduction
Ultrasound is an oscillating sound pressure wave over a frequency range of 15 kHz to 10 MHz [1]. When ultrasonic waves pass through a liquid with sufficient amplitude, the negative pressure exceeds the local tensile strength of the liquid and bubbles are created [2,3,4]. Bubbles are typically generated near pre-existing impurities (e.g., gas-filled crevices in dust motes), which oscillate and grow during cycles of compression and expansion. When the growing bubbles reach a specific resonant size, they efficiently absorb energy from ultrasound waves during a single compression-expansion cycle [1,5,6]. The resonant size depends on the frequency of the irradiated ultrasound, and is approximately 170 μm for a 20 kHz ultrasound [1]. At the resonant size, bubbles grow rapidly during a single cycle of ultrasound waves due to efficient energy absorption. Since bubbles cannot be sustained without absorption of energy, they implosively collapse after reaching the resonant size. This process is referred to as acoustic cavitation.
There are both chemical and physical effects of acoustic cavitation. Ultrasonic wavelengths in liquid vary from approximately 1 mm to 10 cm, which is much larger than the molecular size scale. Thus, the chemical and physical effects of ultrasound do not occur by direct interactions between ultrasound and chemical species, but by the process of acoustic cavitation [2,4,7]. The collapse of bubbles produces hot spots, which have intense local temperatures (~5000 K) and pressures (~1000 atm) and a rapid heating and cooling rate (>1010 K·s−1) [8,9,10,11], and shockwaves. Shockwaves have velocities as high as ~4000 m/s and high-pressure amplitudes of 106·kPa [12].
The physical effects of ultrasound are more diverse in heterogeneous systems (solid-liquid systems) than in homogeneous systems. When a bubble collapses near a significantly larger surface or particle, the bubble no longer collapses spherically and a high-speed liquid stream with a velocity >100 m/s is generated (i.e., a microjet) [13,14]. The liquid moves toward the surface of the solid material, which deforms it or changes its chemical composition [1,15]. Additionally, shockwaves generated from acoustic cavitation cause high-velocity collisions between micron-sized solid particles (i.e., interparticle collisions) [16,17,18]. Shockwaves can also directly interact with particles and induce breakage (i.e., sonofragmentation) [19].
Sonocrystallization is crystallization induced by ultrasound, and was first reported by Richards and Loomis in 1927 [20]. In that report, the author investigated the ultrasonic effects of crystallization, among other diverse physical and chemical influences. From the 1950s to the 1970s, sonocrystallization was actively studied in the former Soviet Union [21,22,23,24]. Since that time, sonocrystallization of various materials and the modification of diverse experimental parameters have been reported [25,26,27]. The industrial use of sonocrystallization increased during the 1980s due to advances in ultrasonic equipment, and, currently, sonocrystallization is common for generating crystals in the pharmaceutical and fine chemicals sectors [28,29,30]. Despite considerable research, a fundamental understanding of sonocrystallization, especially the mechanism of action, remains incomplete.
2. Effect of Ultrasound on Crystallization
2.1. Induction Time and Metastable Zone Width
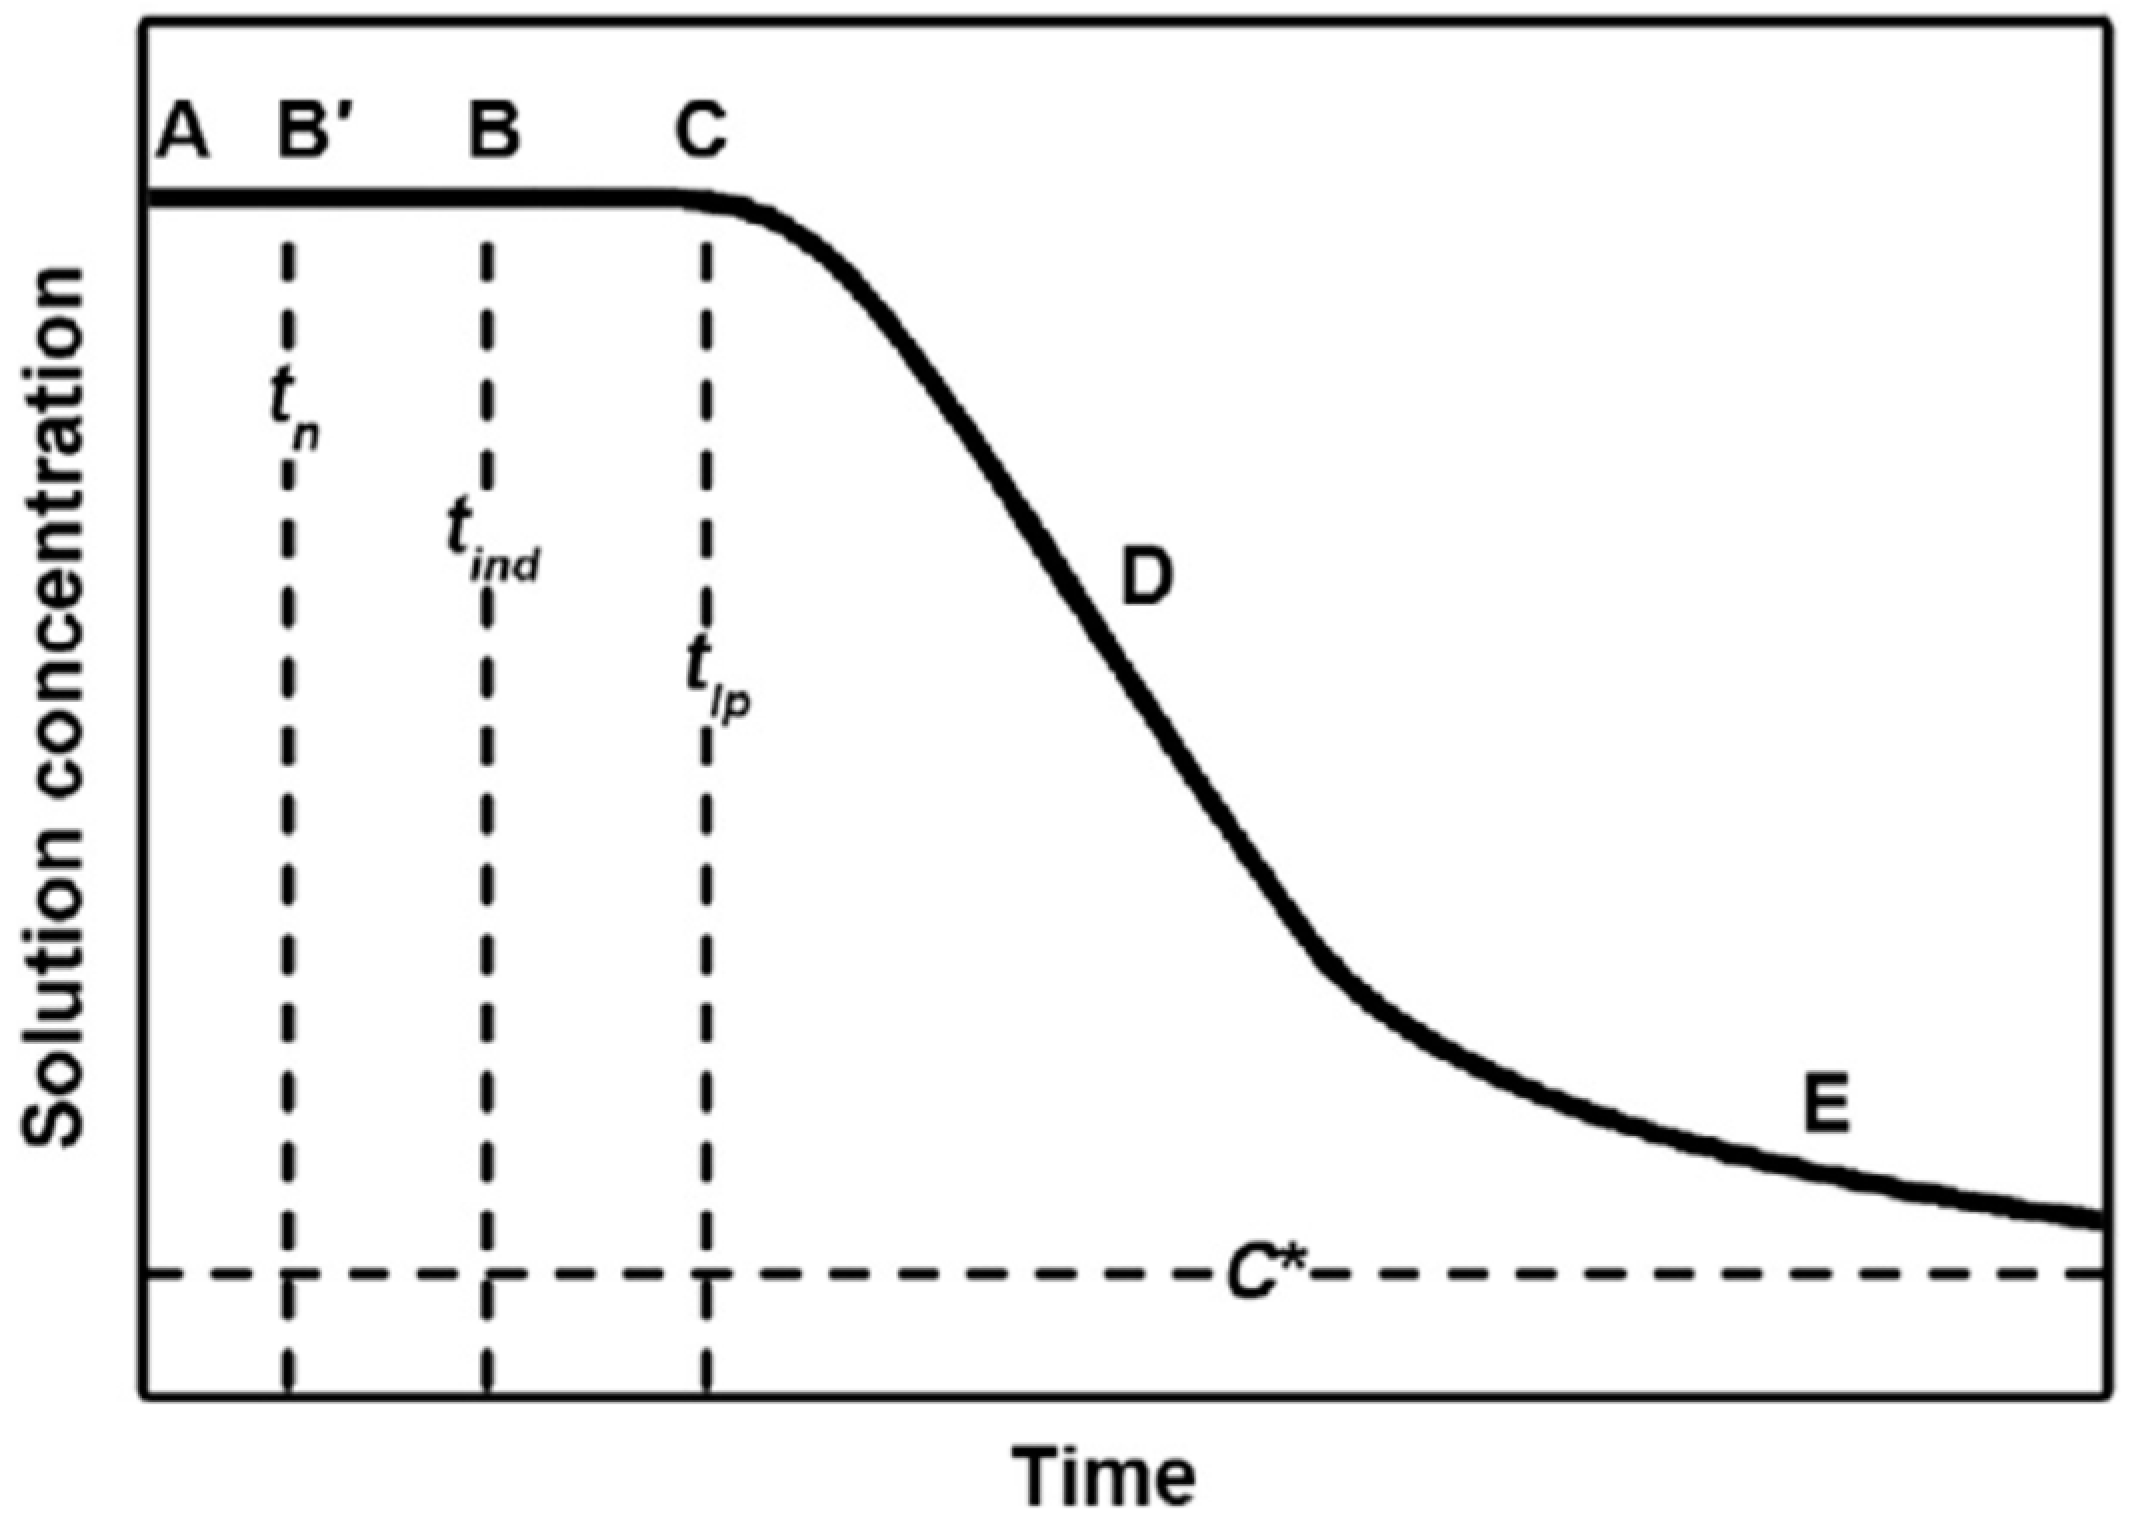
Induction time (tind) is the elapsed time between supersaturation and the appearance of crystals (Figure 1) [31]. It is composed of three parts, including the relaxation time (tr), stable nucleus time (tn), and nucleus growing time (tg). The relaxation time is the time required for the crystallized solution to achieve a quasi-steady-state distribution of molecular clusters, while the stable nucleus time and nucleus growing time are the times required for the formation of a stable nucleus and its growth to a detectable size, respectively. In some systems, especially those with a low degree of supersaturation, massive nucleation occurs following a latent period (tlp). The concentration of the crystallized solution remains relatively constant during the induction time and latent period. Following the latent period, widespread crystal growth occurs and the concentration of the solution changes rapidly and significantly. Induction time is measured by visual observation or analytical techniques that utilize conduction measurements or laser light scattering. There are several factors that affect induction time measurements greatly such as agitation, impurities, solution viscosity, level of supersaturation, etc.
Ultrasonic irradiation reduces induction time due to the improved micro-scale mixing and turbulence caused by acoustic cavitation. When the induction time decreases, the rate of appearance of crystals accelerates. Thus, the number of produced crystals increases, while their sizes decrease.
The effect of ultrasound on the induction time for crystallization has previously been reported [32,33,34]. Z. Guo et al. studied the effects of ultrasound on induction time using saturated roxithromycin solutions [33]. In this study, saturated roxithromycin solutions were mixed with water (antisolvent) under ultrasonic irradiation and the induction time was assessed using a He–Ne laser recorder. Notably, induction time was reduced when sonocrystallization was performed (Figure 2). Additionally, the difference in induction time between sonocrystallization and stirring crystallization increased as the supersaturated ratio of the solution decreased.
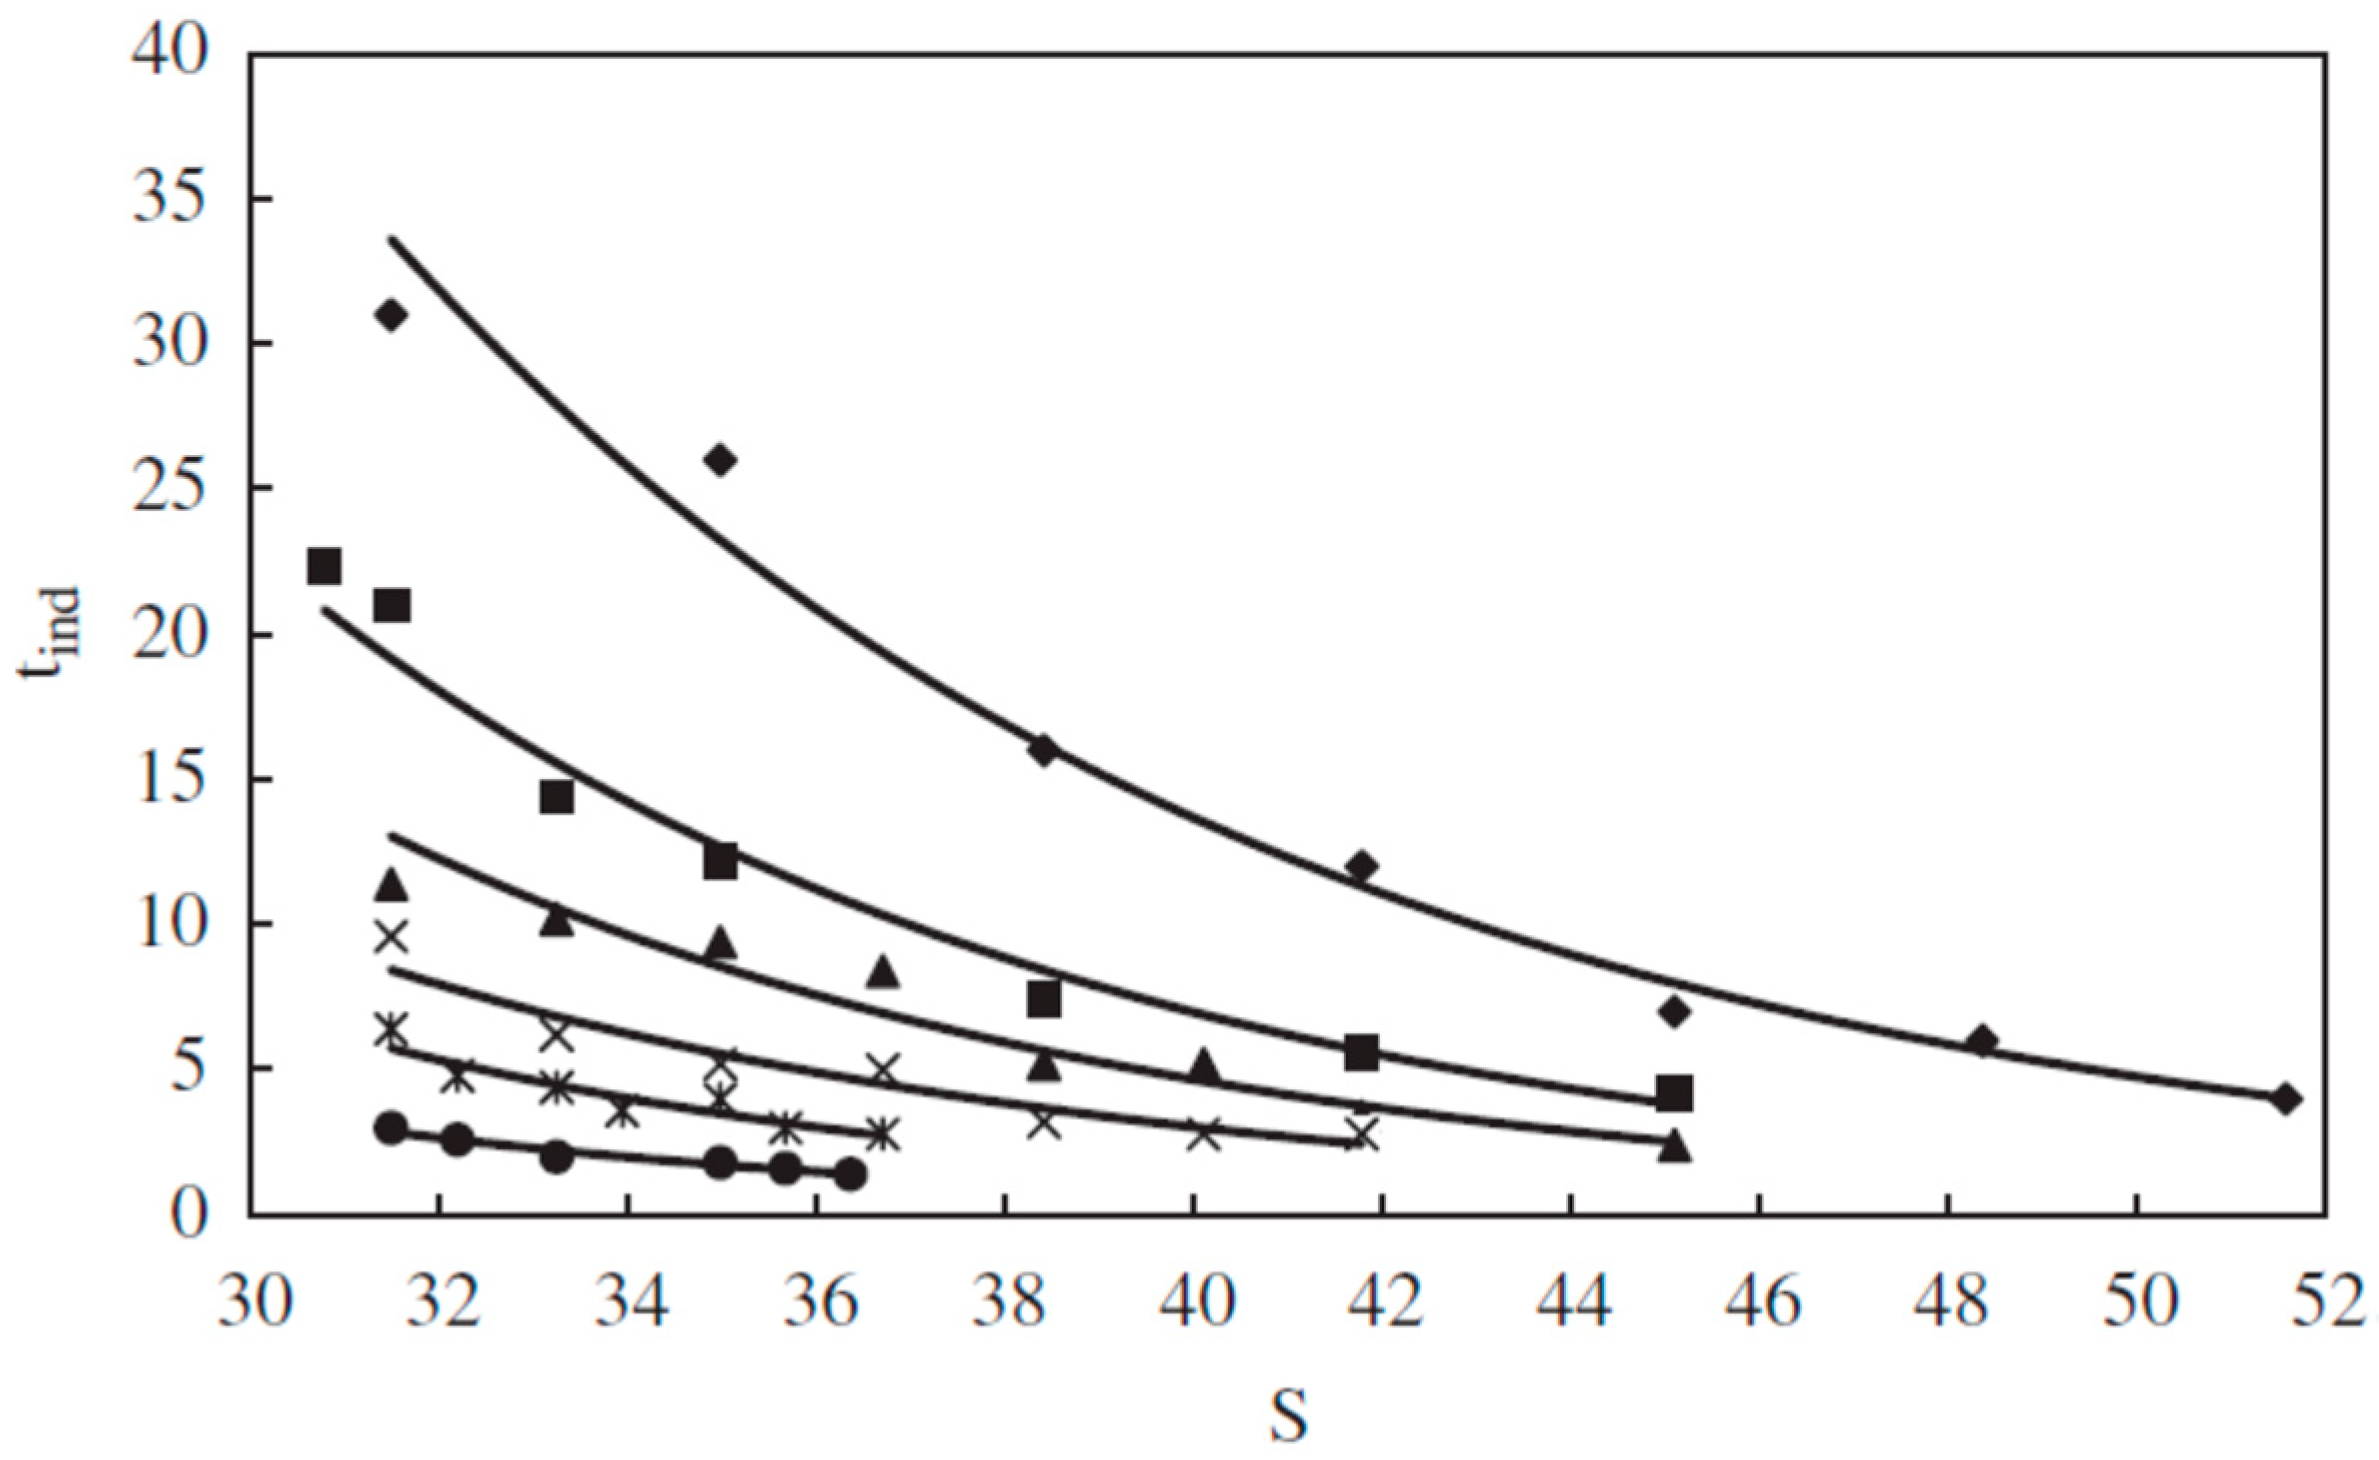
Those authors also assessed the induction time of BaSO4 under ultrasonic irradiation and found that the induction time of sonocrystallization was shorter than that for stirring crystallization [35]. Furthermore, it was confirmed that sonication with high-amplitude ultrasound waves decreased induction time more than sonication with low-amplitude waves (Figure 3).
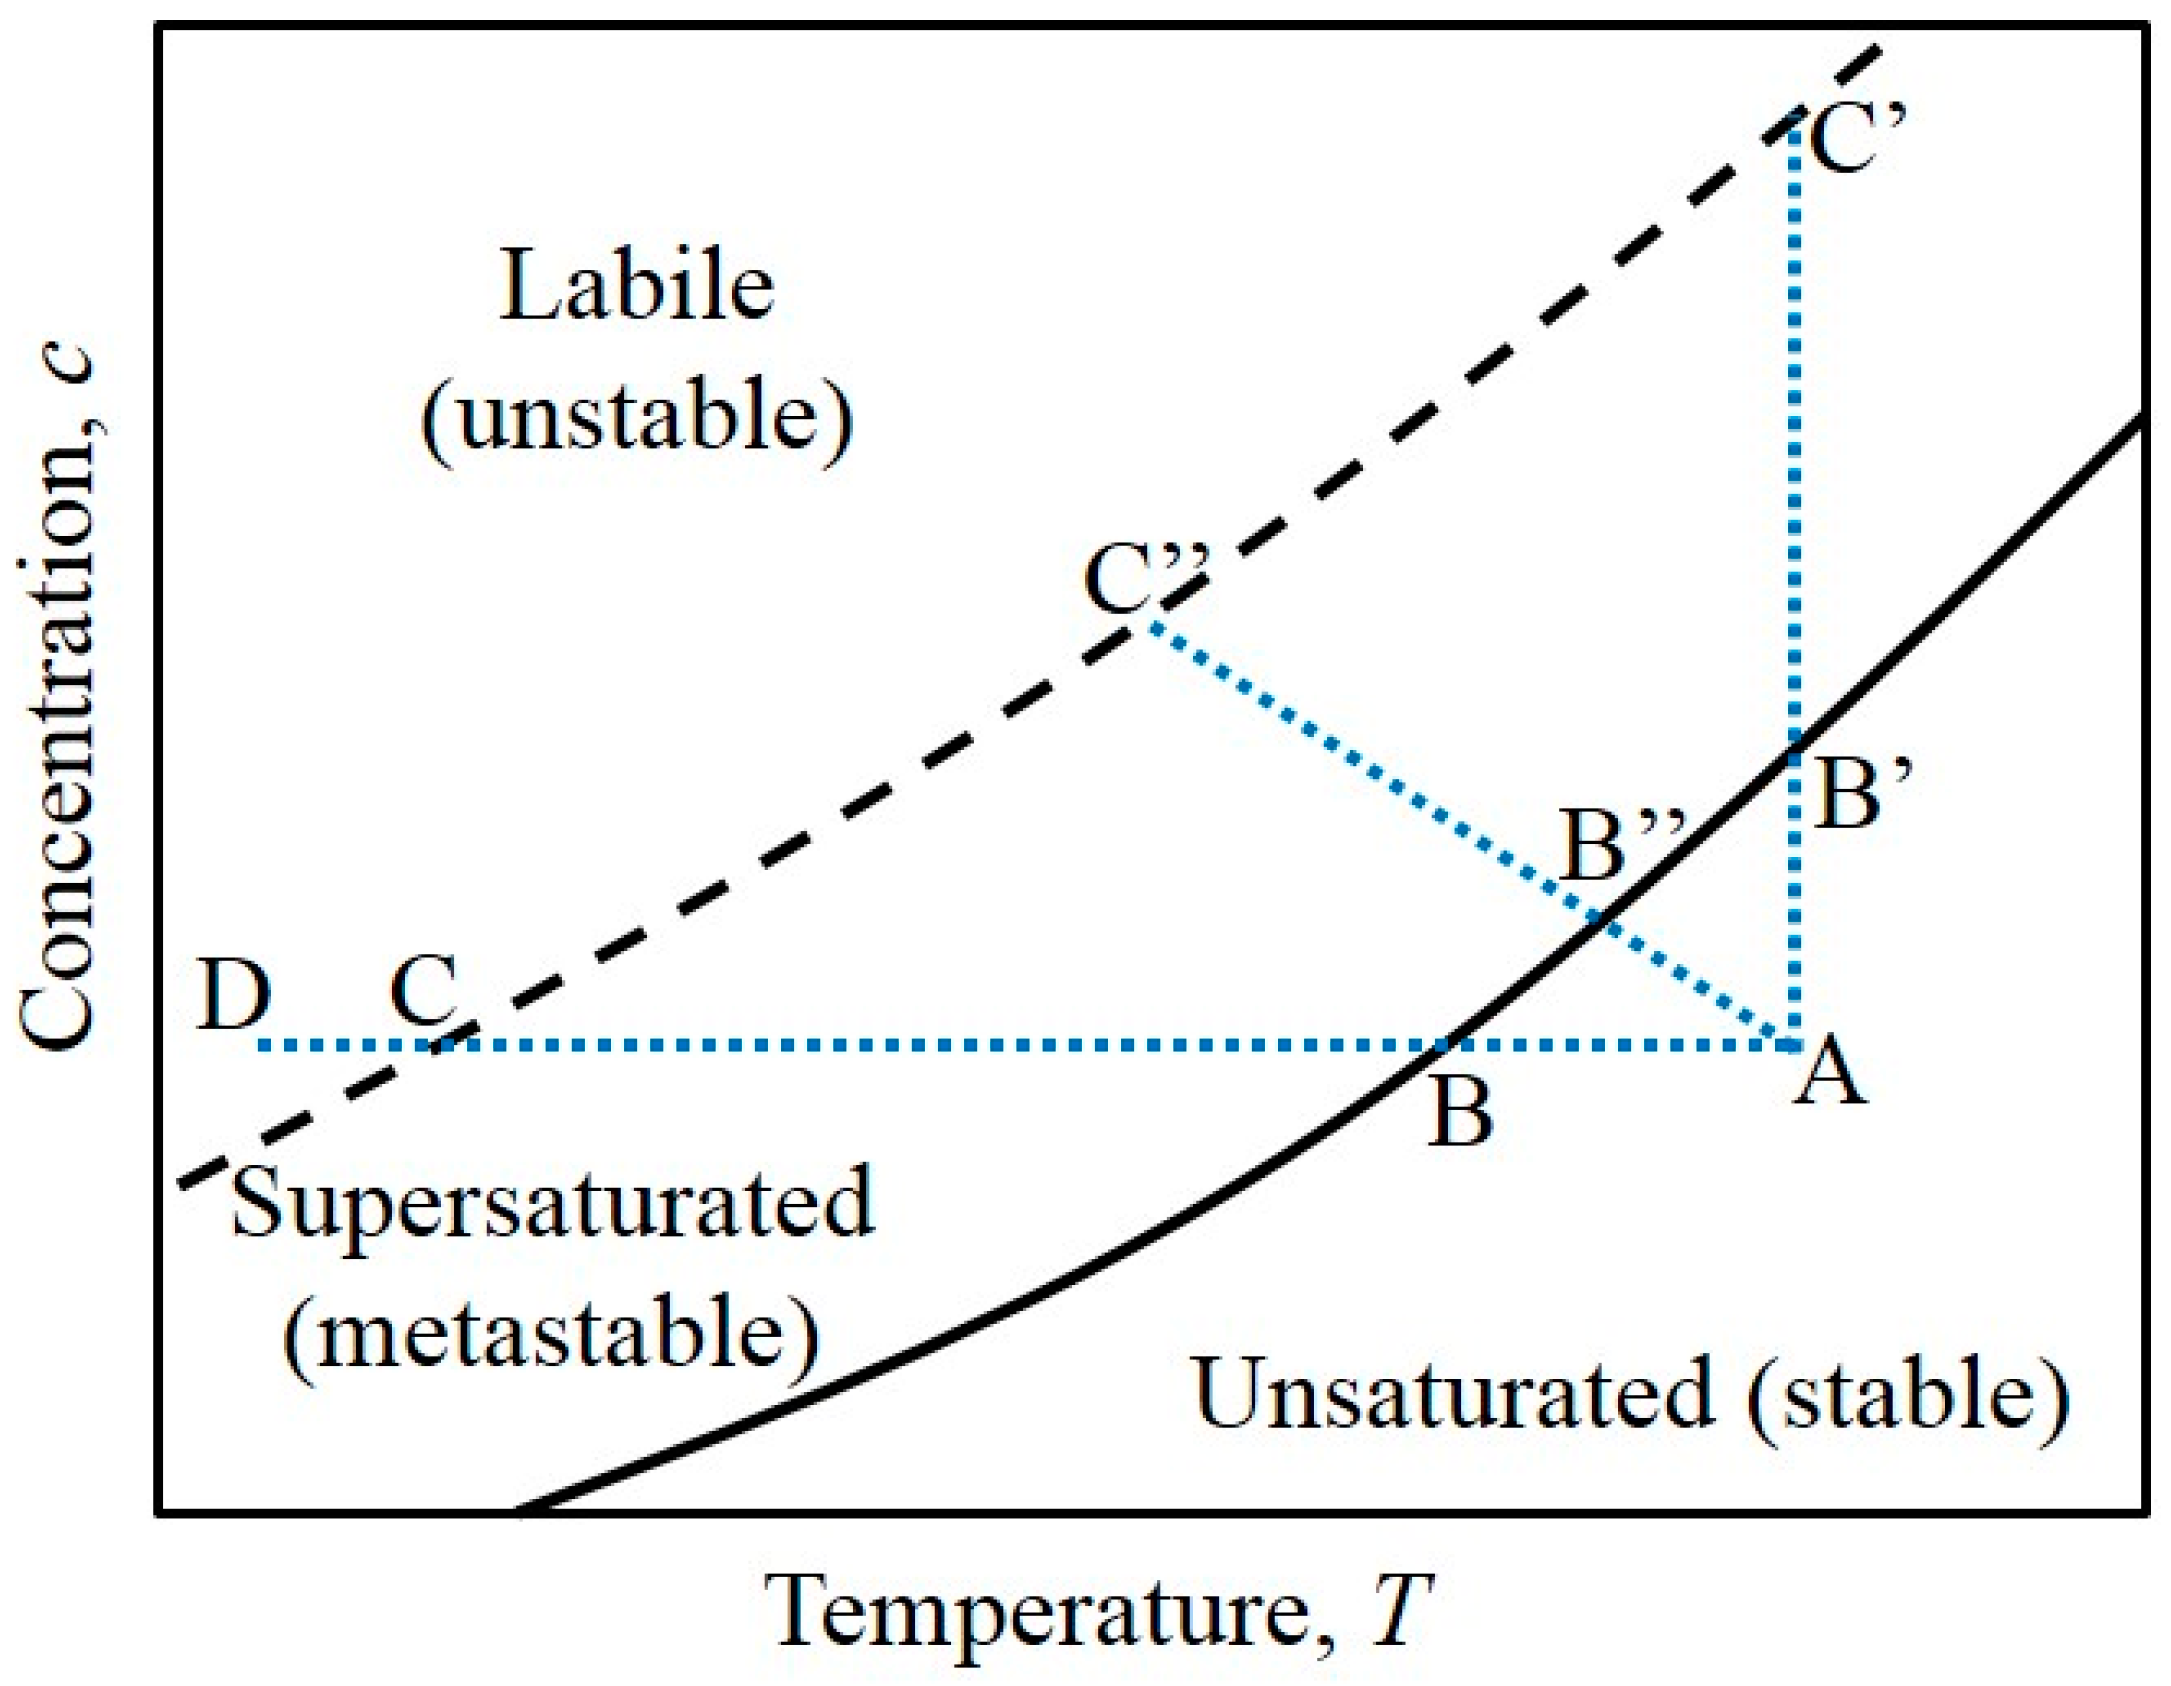
The metastable zone width (MZW) is the area between an equilibrium saturation curve and the experimentally observed supersaturation point at which nucleation occurs spontaneously (Figure 4) [31]. For the generation of crystals, the status of a solution changes from stable to metastable to labile (unstable). There are several ways to generate crystals, including cooling (ABCD line), evaporation or addition of an antisolvent (AB’C’ line), a combination of cooling and evaporation, or cooling and the addition of an antisolvent (AB’’C’’ line).
When a solution is ultrasonically irradiated, the MZW decreases. During sonocrystallization, gas-filled crevices surrounding dust motes behave as new nucleation sites causing an increase in the rate of nucleation [36,37]. Additionally, microscale mixing and turbulence improves from the collapse of bubbles during sonocrystallization [38,39,40,41]. They accelerate diffusion of solutes and increase the nucleation rate. Due to such increased nucleation sites and improved mixing efficiency, sonocrystallization reduces the MZW. Mixing efficiency can be formulated in terms of the Richardson flux constant [42], a dimensionless number defined as the ratio of buoyancy to shear terms in turbulence kinetic energy equations. Lewis Fry Richardson is also familiar for his observation that turbulence can be described as
- Big whorls have little whorls
- That feed on their velocity,
- And little whorls have lesser whorls
- And so on to viscosity [43].
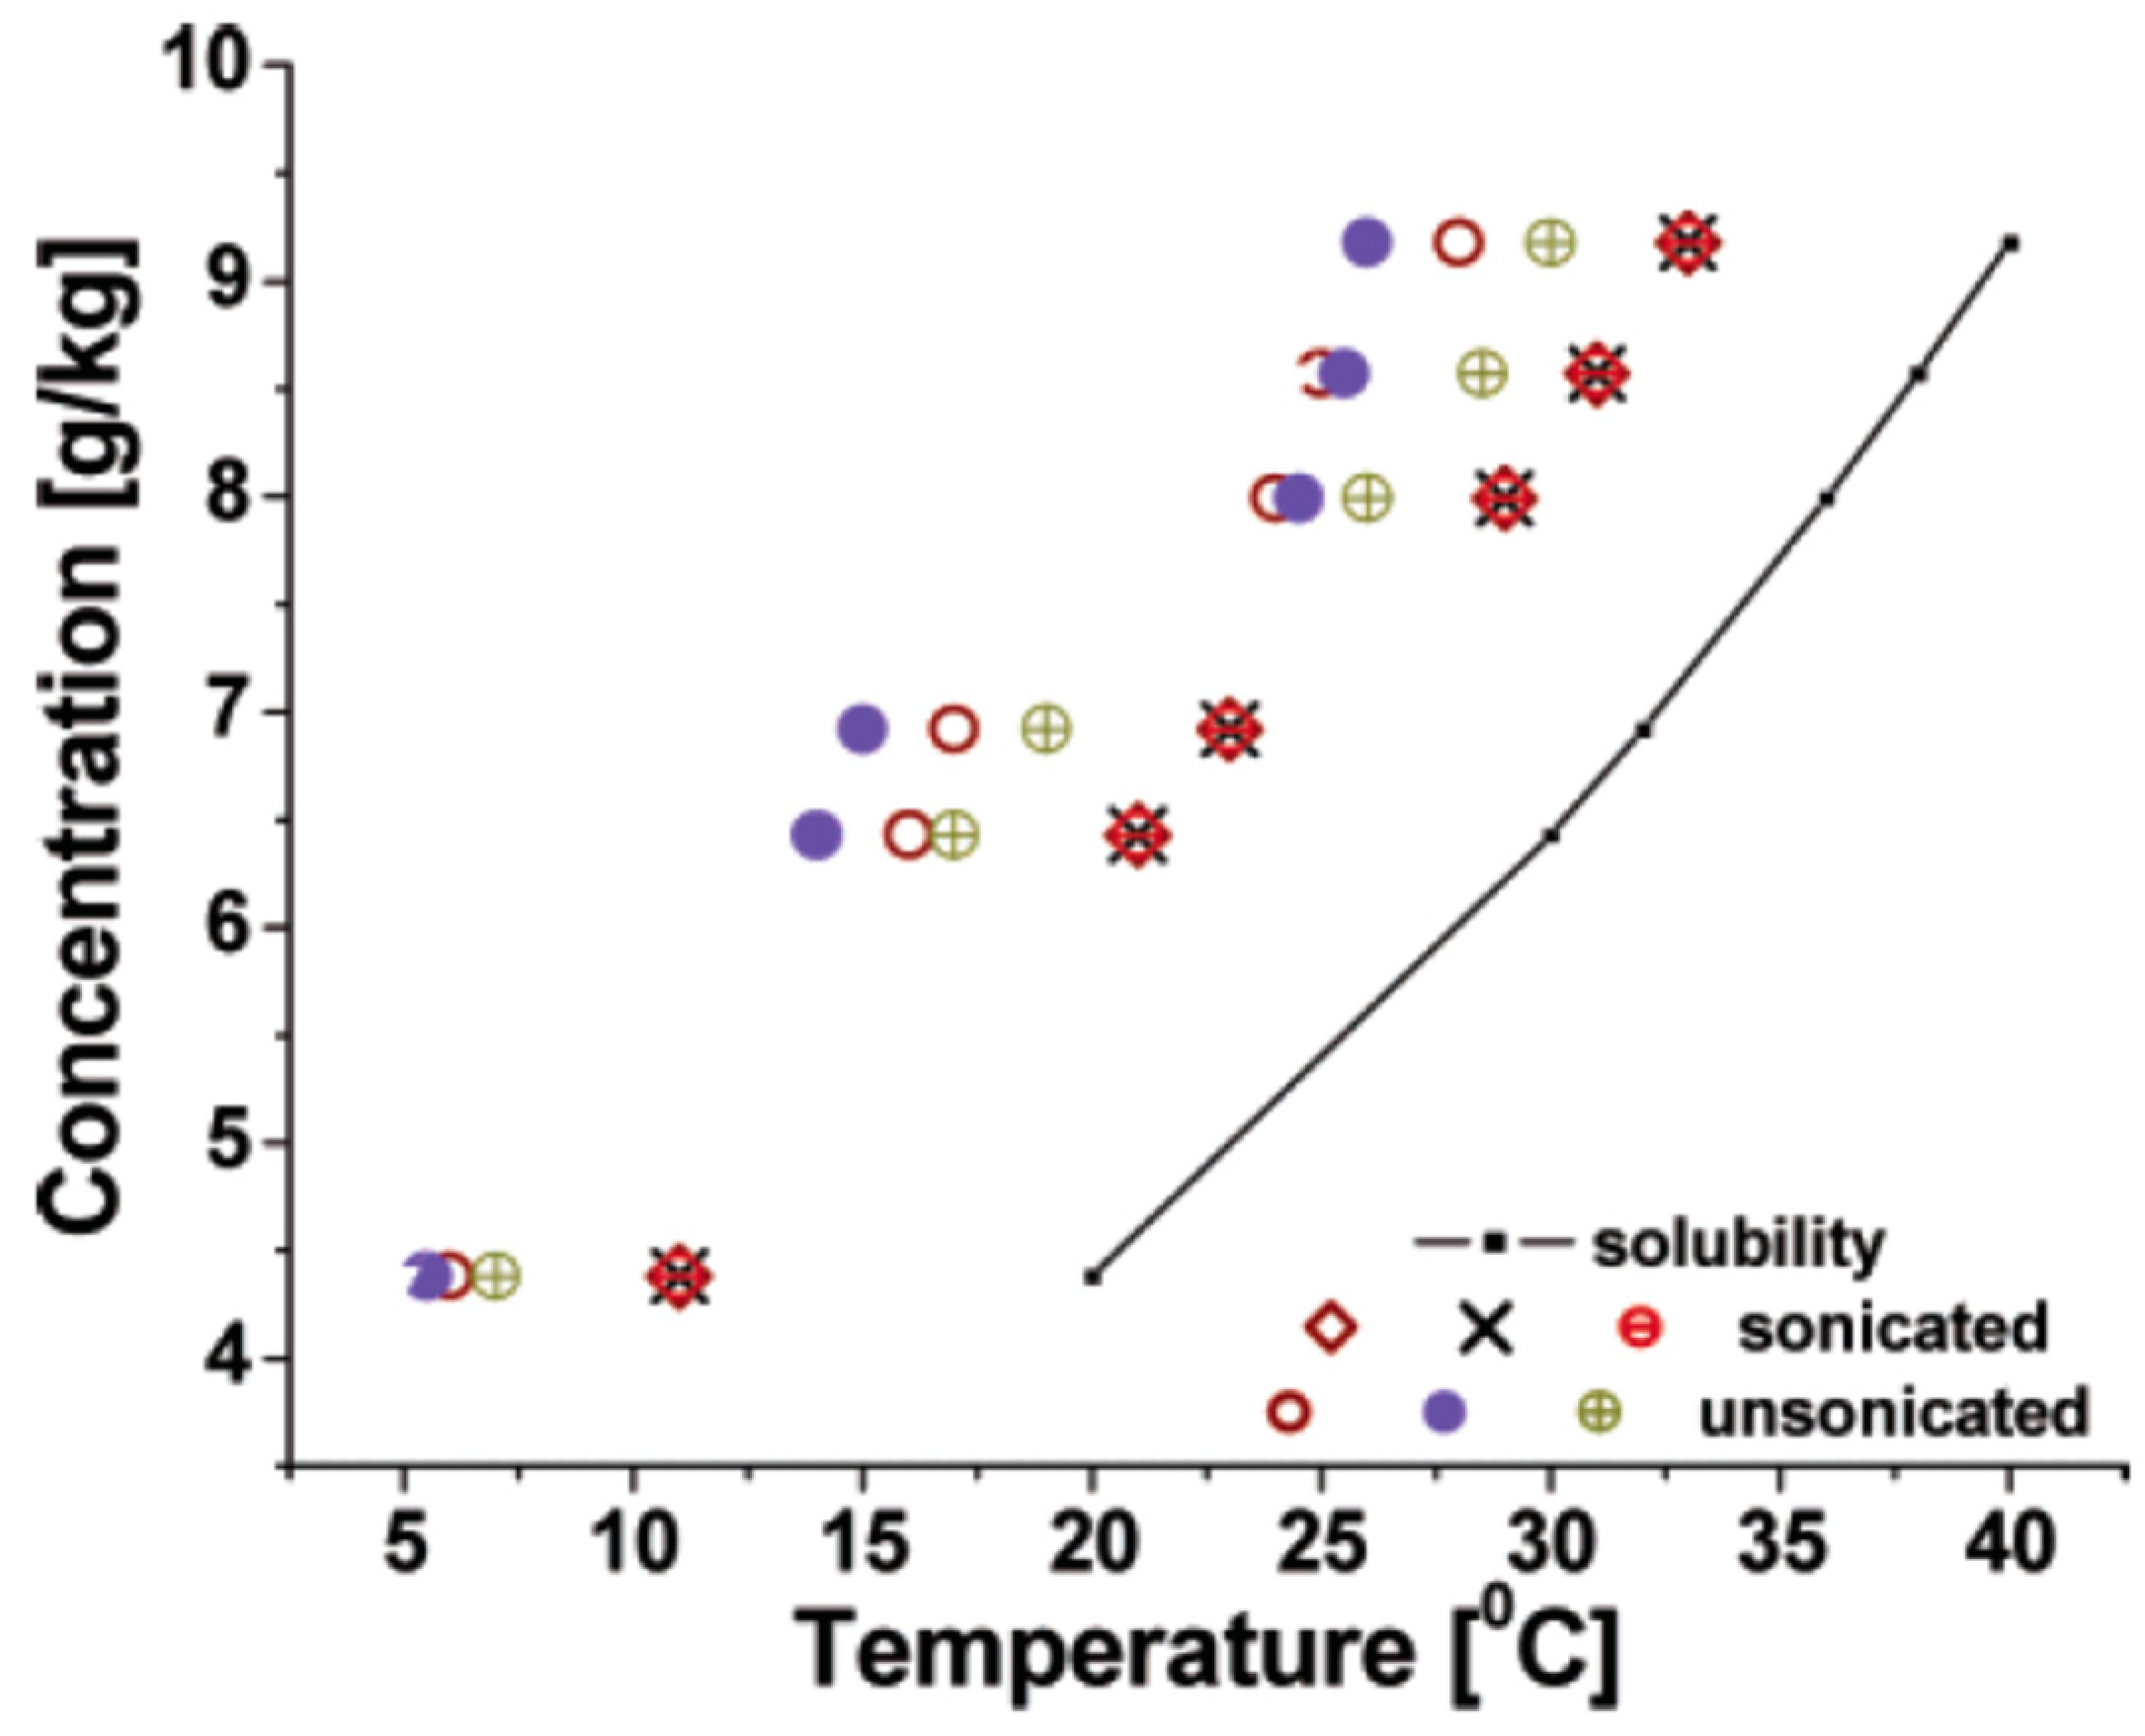
The effects of ultrasound on the MZW were confirmed during the crystallization of p-aminobenzoic acid (PABA) [44]. Cooling crystallization of PABA was performed at a constant cooling rate of 1 °C/min during sonication or with stirring. The nucleation temperature was determined by detecting the appearance of the first crystals becoming visible to the naked eye. As shown in Figure 5, nucleation occurred at lower levels of saturation during sonication compared to stirring.
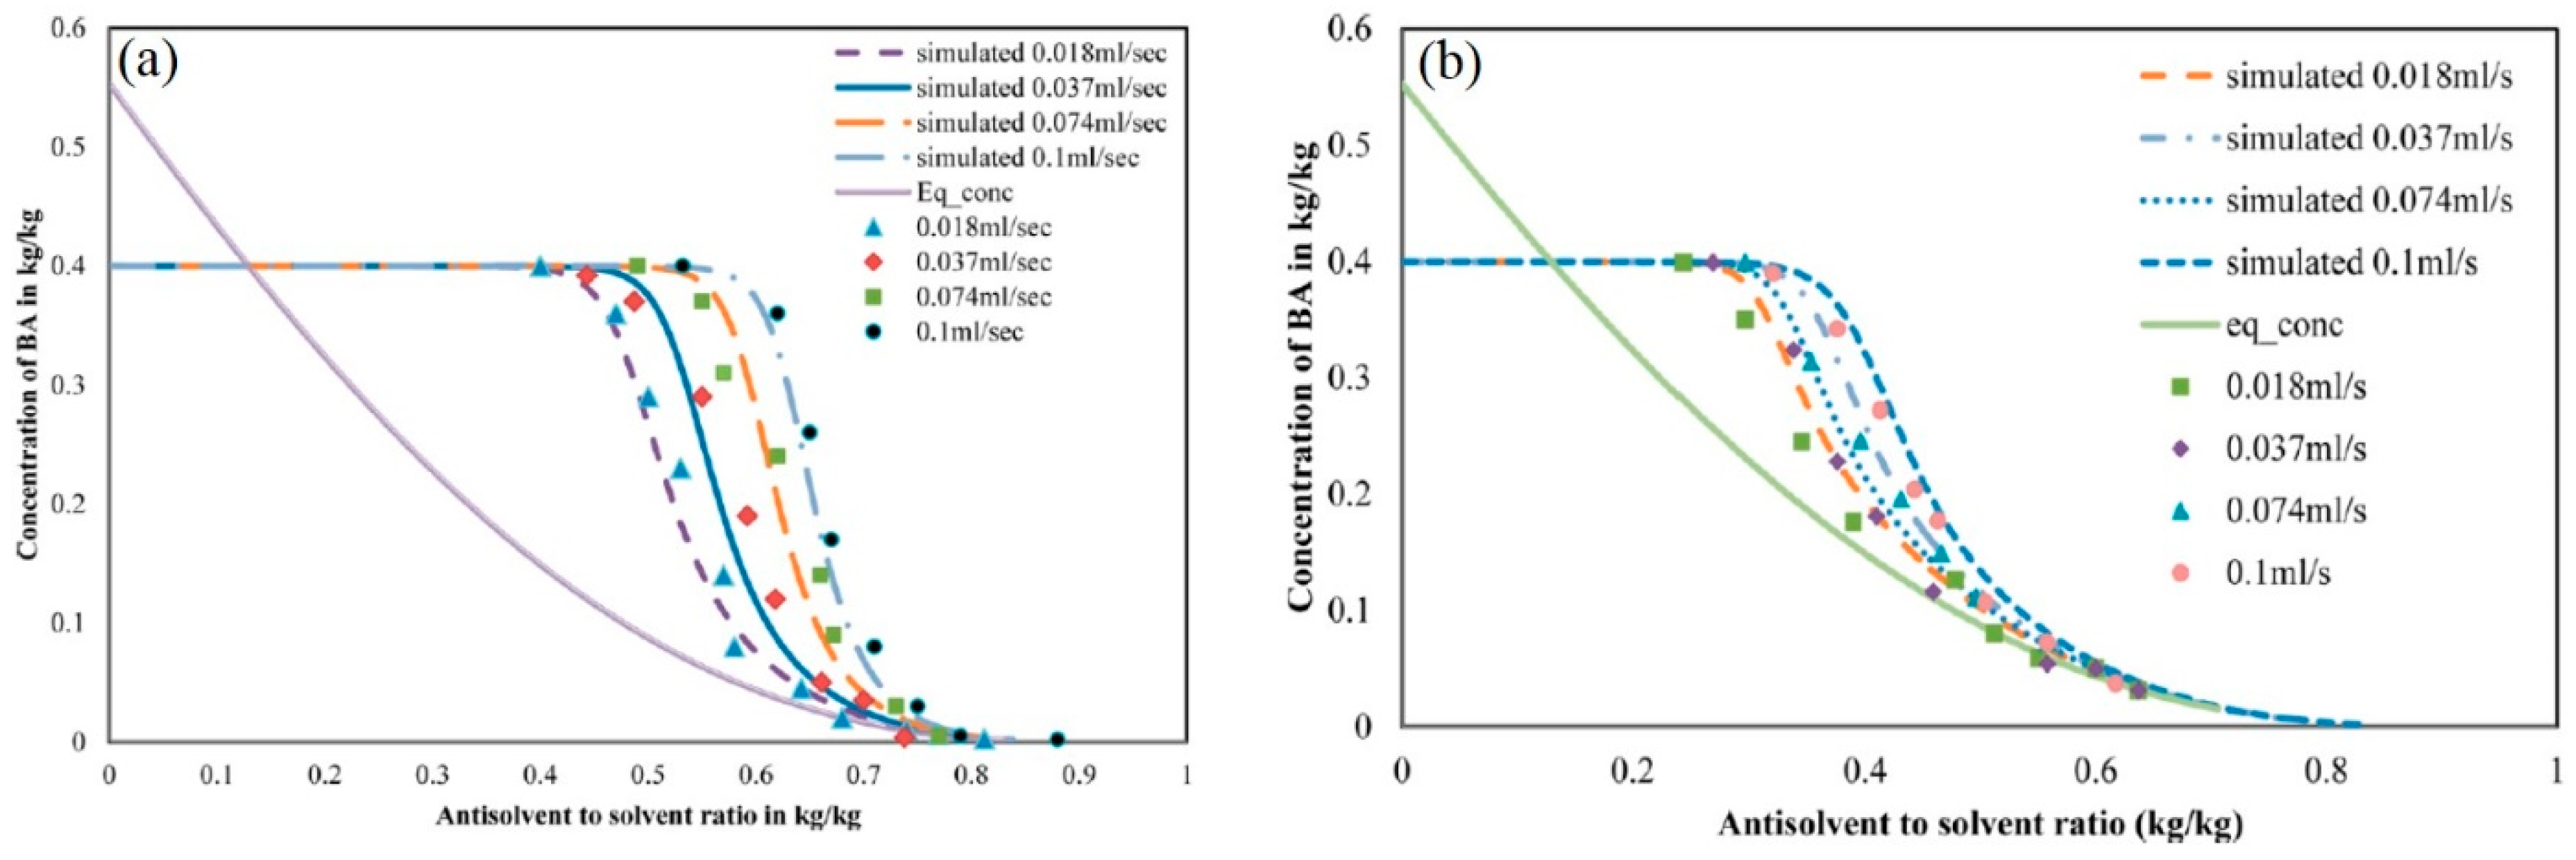
Another example of a reduction in MZW under sonication is the antisolvent crystallization of benzoic acid [45]. A saturated benzoic acid solution was prepared using absolute ethanol, and mixed with water (antisolvent) by either conventional magnetic stirring or ultrasonic irradiation at room temperature. As shown in Figure 6, the MZW decreases significantly on ultrasonic irradiation of the benzoic acid solution.
2.2. Nucleation Rate
Ultrasound may promote nucleation by reducing the critical excess free energy (ΔGcrit). When ultrasound is irradiated to a solution, bubbles are generated [2,3,4]. At the bubble–solution interface, half a solute molecule is solvated by the solvent, while the other half is not due to contact with the bubble. Such contacts decrease the solvation rate. Re-dissolution of the solute molecule is then prevented, increasing the coagulation of molecules in the solution [46]. Thus, the critical excess free energy (ΔGcrit) for nucleation is reduced, while the nucleation rate increases [31,37].
Also, ultrasound increases the rate of secondary nucleation by affecting the number of secondary nucleation sites. Under ultrasonic irradiation, the crystals generated from primary nucleation collide or interact with shockwaves [47,48,49]. Due to these occurrences, pre-existing crystals are fragmented and become sites of secondary nucleation [36,50].
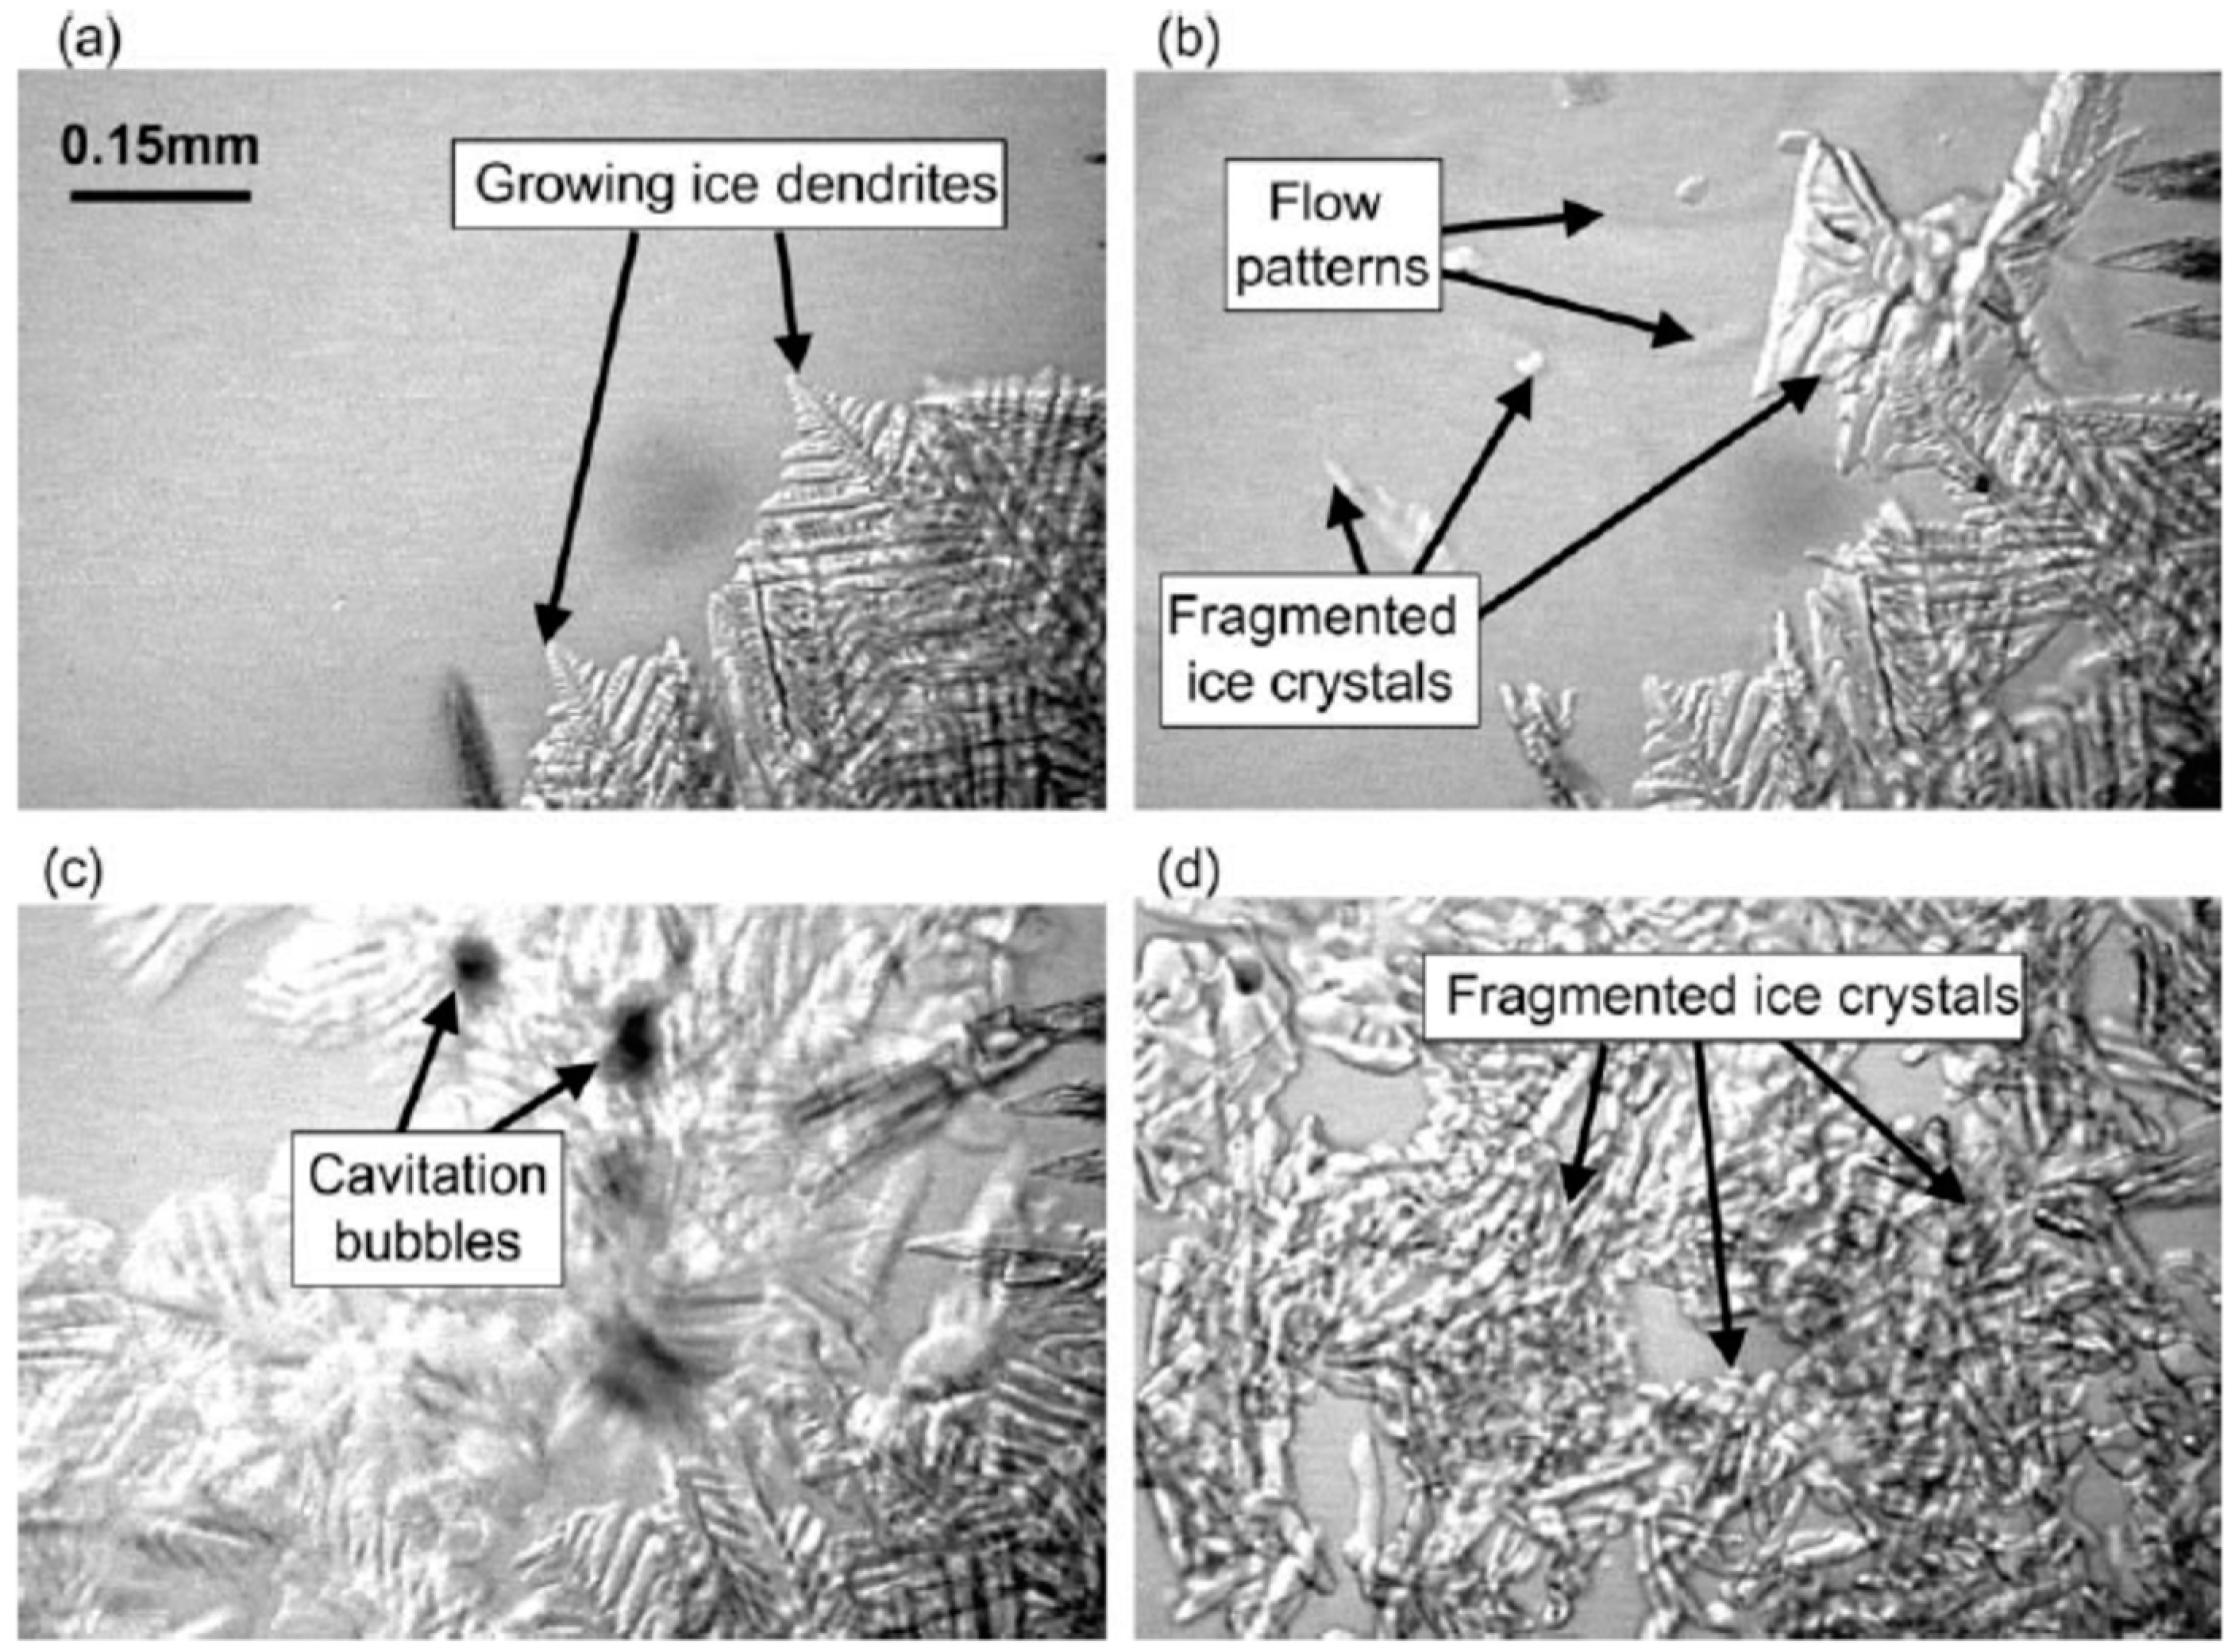
Chow et al. investigated sonocrystallization of ice crystals in sucrose solution, which formed ice dendrites (Figure 7) [51,52,53]. Primary nucleation produced the ice dendrites, which subsequently fragmented due to continuous sonication. During prolonged sonication, secondary nucleation occurred around the fragmented crystals and cavitation spots. From corresponding images of these events, it was confirmed that ultrasound affected primary and secondary nucleation events.
2.3. Polymorphism
Polymorphisms can be effected by sonocrystallization. Polymorphism is the ability of a solid material to exist in more than one form or structure [54]. Polymorphs have different stabilities under certain conditions, and the preferred form depends on the condition in which the polymorphs are formed or stored. It is unknown how ultrasound controls the polymorphism of a material [55,56,57].
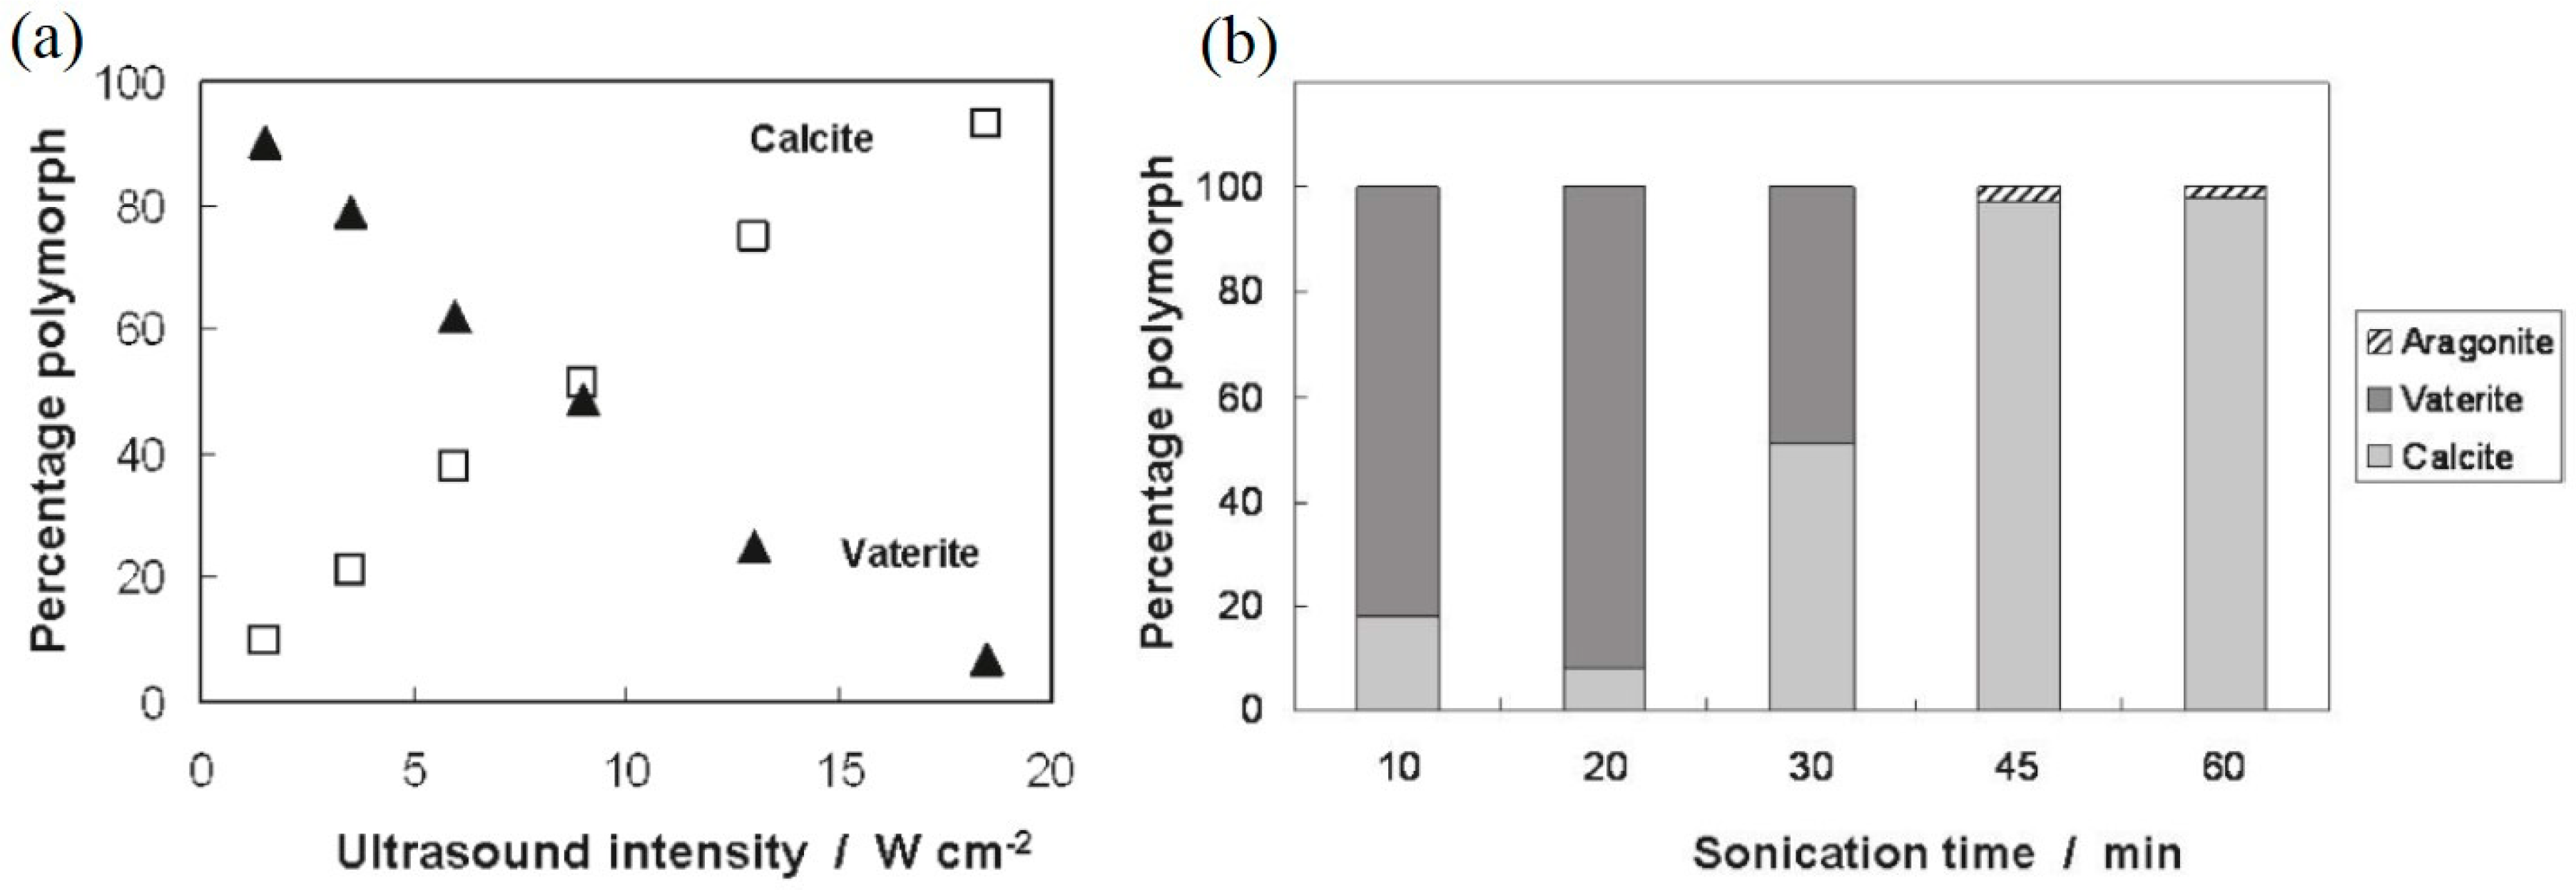
Sonocrystallization generally converts crystals from their kinetically favored form to one that is thermodynamically favored. A typical example is that of calcium carbonate, which exists in three different forms including calcite (the most stable form under ambient conditions), aragonite (metastable), and vaterite (the least stable form) [58]. Without sonication, vaterite, which is the kinetically favored form, was generated. However, the percentage of calcite, which is the thermodynamically favored form, increased as sonication time or intensity increased (Figure 8) [58]. Thus, more intense or extended periods of sonication might promote the ground-state polymorph due to the improved mass transport and local heating from acoustic cavitation. Another example of sonocrystallization for controllable polymorphism is p-aminobenzoic acid [44]. Rasmuson et al. reported that p-aminobenzoic acid polymorphs were selectively crystallized by adjusting the degree of supersaturation and ultrasonic irradiation. Above ~25 °C, p-aminobenzoic acid is in its α-polymorph which is its energetically favored form. Sonocrystallization of p-aminobenzoic acid significantly reduced the induction time, narrowed the MZW, and produced the β-polymorph above 25 °C with a low initial supersaturation.
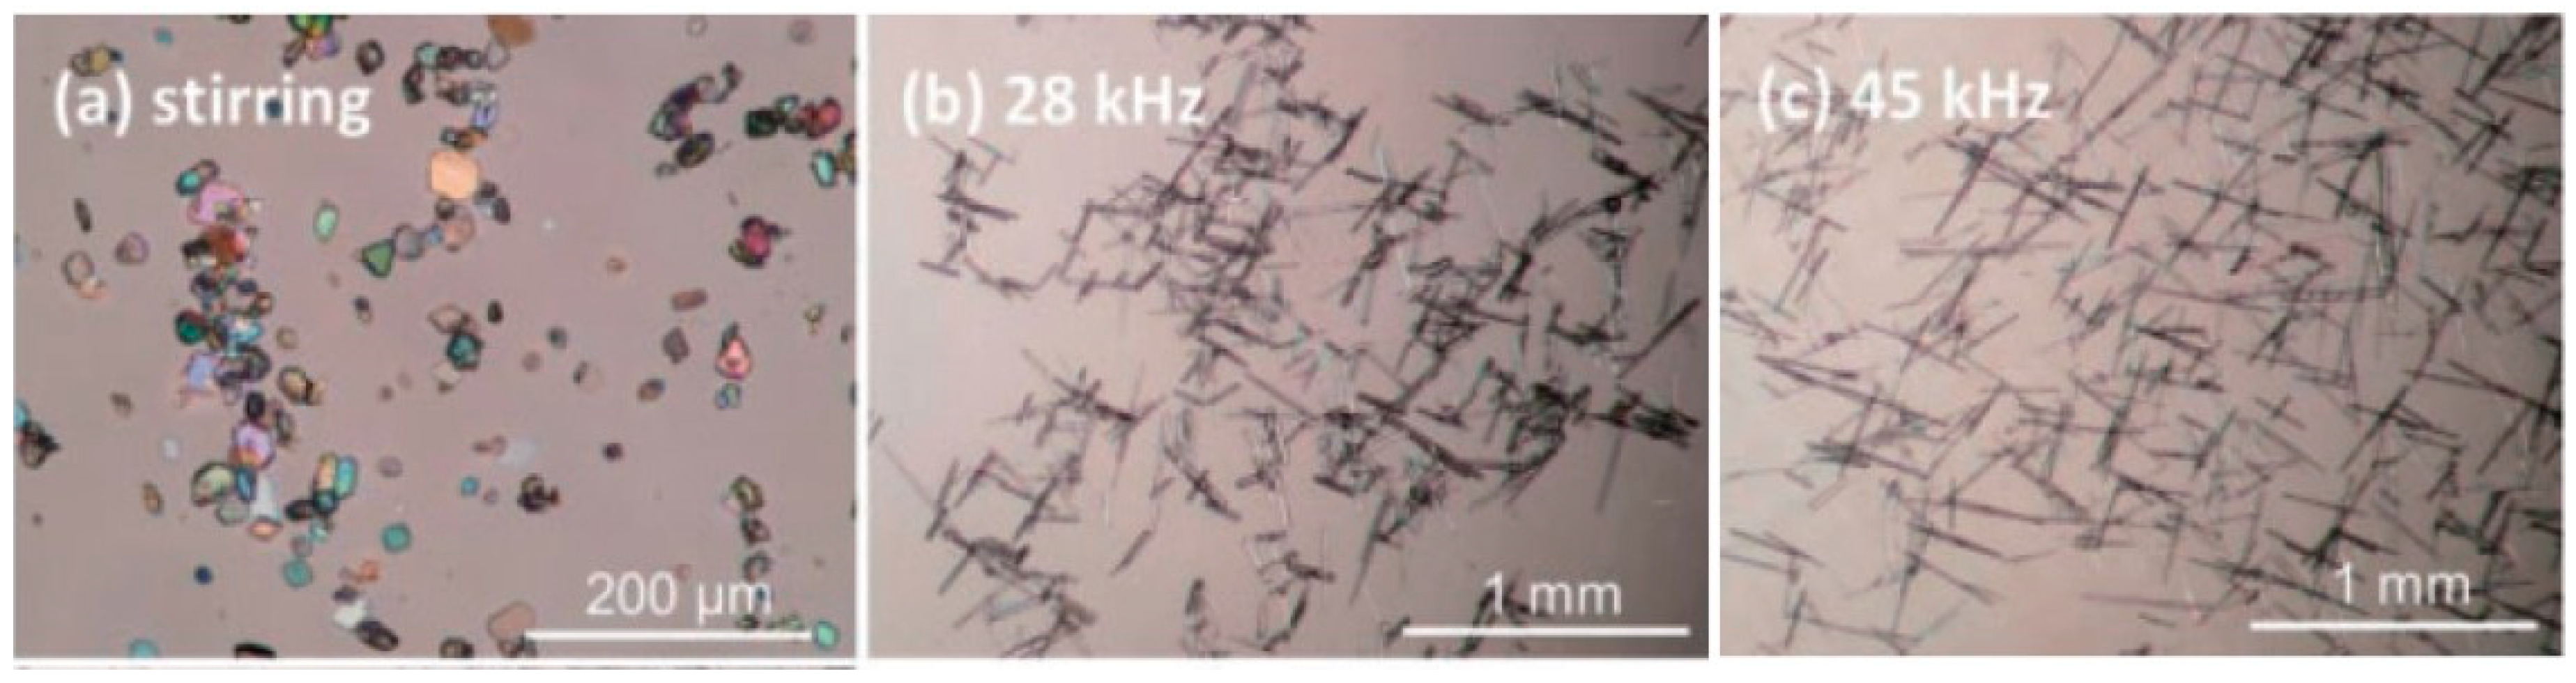
Conversely, sonocrystallization can sometimes produce a less thermodynamically stable polymorph. Paracetamol exists as either form I (stable) or form II (metastable), and given the difference in stability between the forms, form II has higher solubility [59]. When a supersaturated paracetamol solution was cooled without sonication, plate-like crystals (form I) were generated. However, with sonication, needle-like crystals (form II) were formed (Figure 9). The generation of less stable forms from sonocrystallization has been reported; however, until now, no clear explanations were provided [59,60,61,62,63,64].
3. Various Parameters of Sonocrystallization
3.1. Frequency of Ultrasound
Changes in ultrasound frequencies affect the bubble dynamics [65]. At low ultrasonic frequencies (<100 kHz), cavitation bubbles experience positive and negative pressure ultrasound waves for extended periods of time because wavelengths increase as frequencies decrease. Thus, the bubble oscillation amplitude is large since the size of the bubble differs substantially during compression and expansion periods [32,66]. Conversely, high ultrasonic frequencies (>200 kHz) shorten the wavelength of the ultrasound and the lifetime of the cavity is reduced. In all cases, there are generally dense clouds of cavitation bubbles, and the power of collapse from each bubble is dependent on their size: stronger for large bubbles at low frequencies, weaker for small bubbles at high frequencies [67,68]. While not generally recognized in the literature, the number of cavitating bubbles is not controllable, and so it is exceedingly difficult to compare different frequencies due to changes in the number of cavitating bubbles, which are highly dependent on the specific apparatus used.
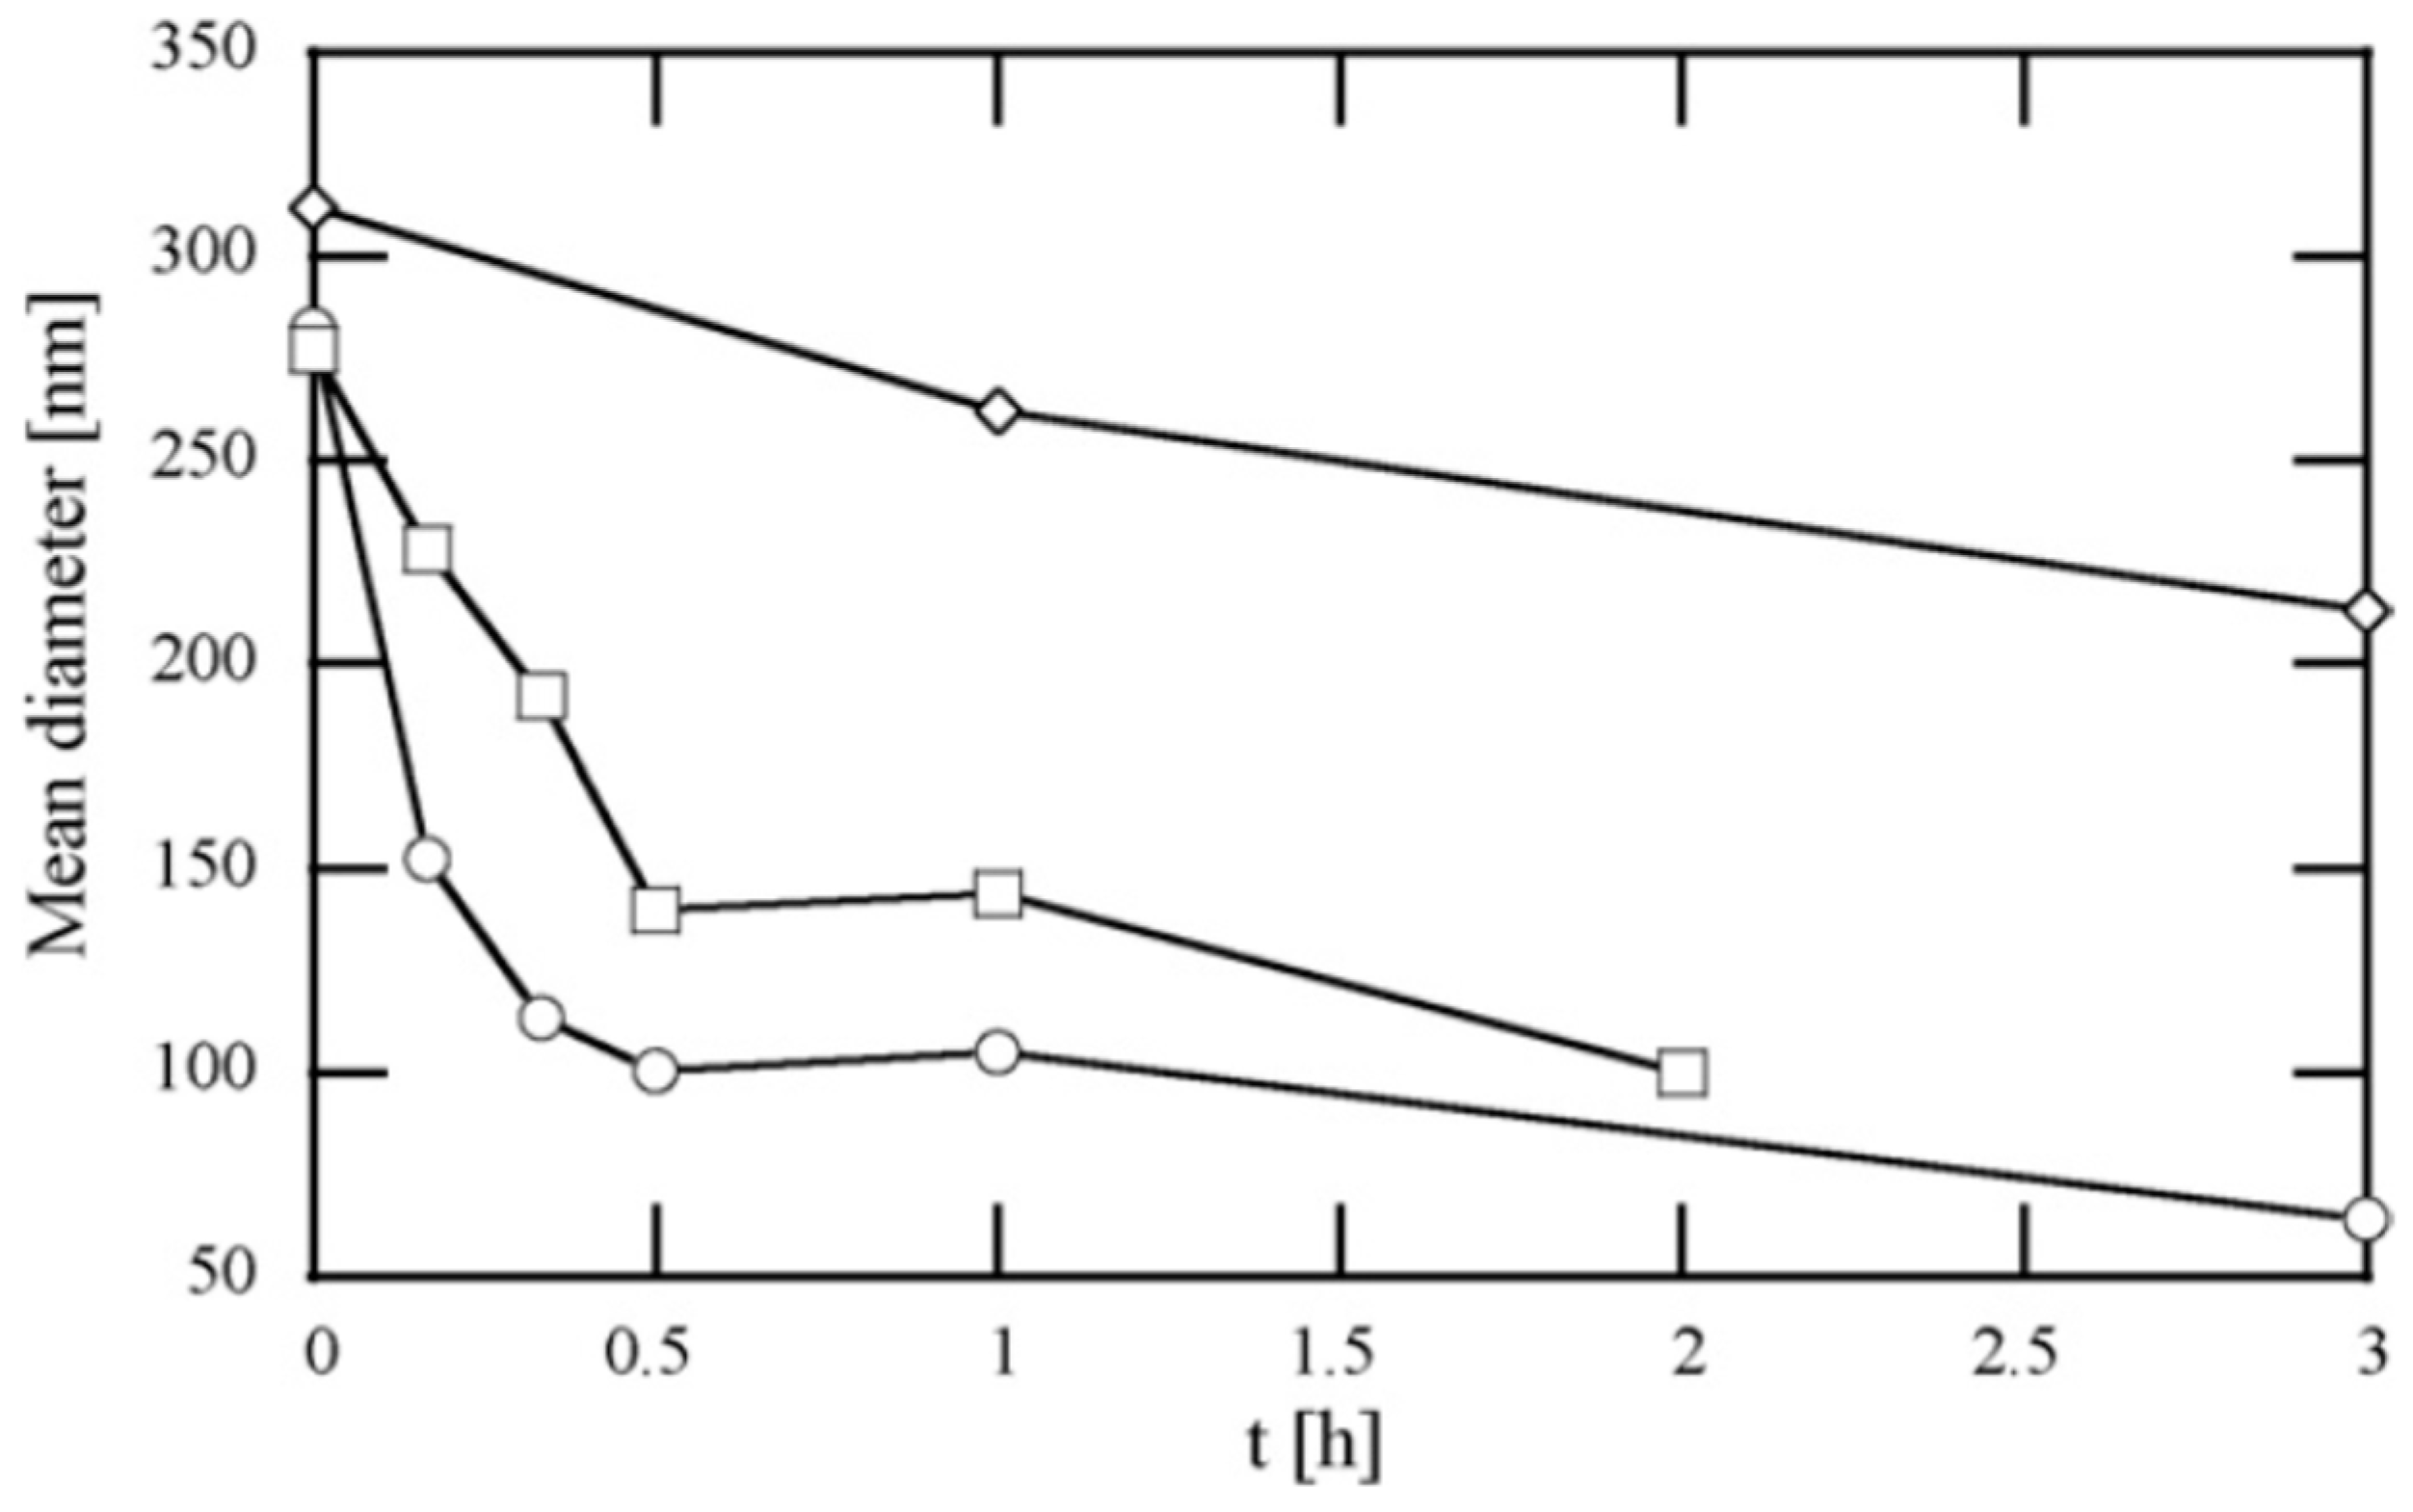
Koda et al. produced liposomes under ultrasonic irradiation and assessed the effects of irradiation frequency on their size. Three different frequencies (43, 143, and 480 kHz) were applied at a fixed intensity (8 W/cm2). It was observed that the size of the liposomes decreased as the sonic frequency decreased, due to changes in bubble dynamics (Figure 10) [69].
Another study investigated the effects of the frequency of ultrasound waves on the MZW [70]. Cooling crystallization of paracetamol was tested without or with ultrasonic irradiation at multiple frequencies (from 41 to 1140 kHz), and the MZW was calculated as the difference between the nucleation temperature and the saturation temperature. When the frequency of the ultrasound increased, the MZW decreased (Figure 11).
3.2. Intensity of Ultrasound
When ultrasound intensities increase, the size of generated crystals decreases. Increased sonication intensities cause more vigorous microscale mixing and turbulence, which causes solutes to diffuse more rapidly [71]. Due to the accelerated diffusion of the solute, the induction time and MZW are reduced and the nucleation rate increases. Also, the vigorous microscale mixing and turbulence helps to prevent crystals from agglomerating [72]. The effect of ultrasound intensity was investigated during sonocrystallization of roxithromycin [73]. The intensity was adjusted from 5 to 15 W/cm2, which caused the average crystal length to decrease from ~60 µm to ~15 µm during 10 min sonications.
3.3. Sonication Time
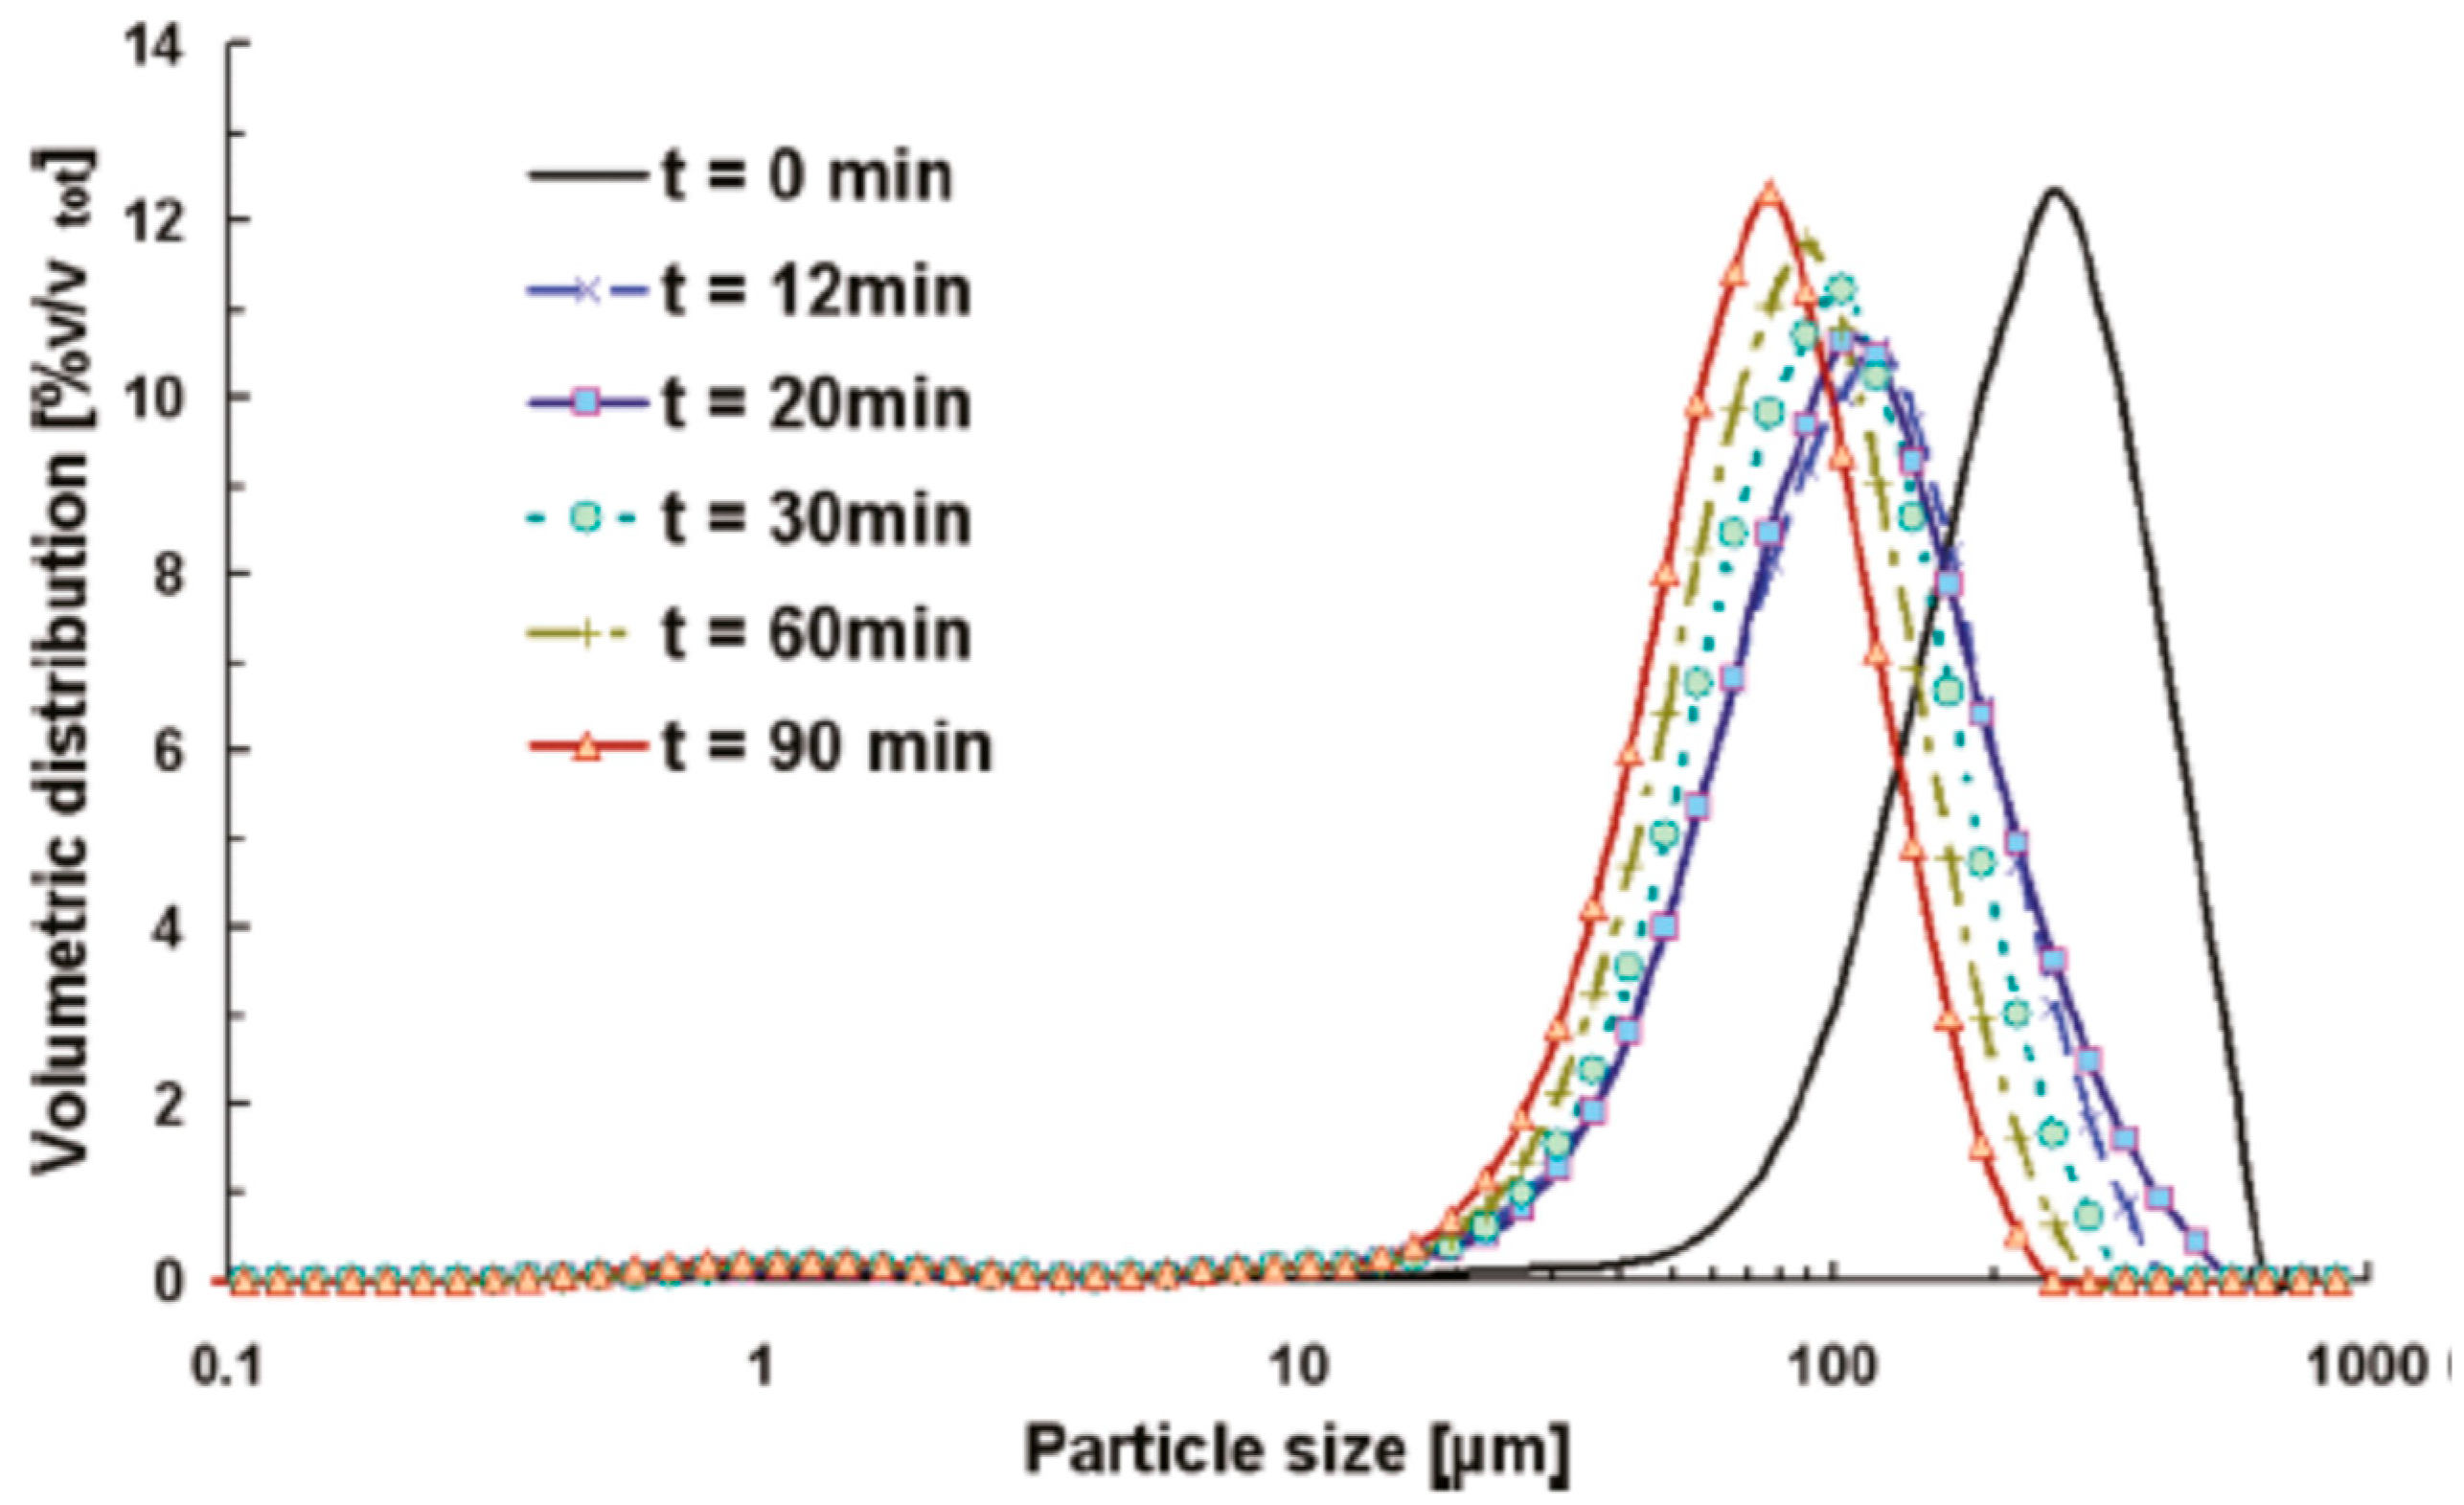
As sonication time increases, crystal sizes decrease and become more uniform. For short sonication times, solution and precipitants are not mixed uniformly [32]. The generated crystals from the solution are irregularly shaped and of various sizes. Thus, prolonged sonication time improves mixing and prevents crystals from aggregating [74,75]. Kougoulos et al. investigated the effects of sonication duration on crystal size using adipic acid and found a significant difference in crystal size according to whether sonication was applied or not (Figure 12) [76]. Furthermore, crystal size was reduced as sonication duration increased. As we will see, this is often due to sonofragmentation of the crystals formed.
3.4. Types of Ultrasound Generator and Configurations for Sonocrystallization
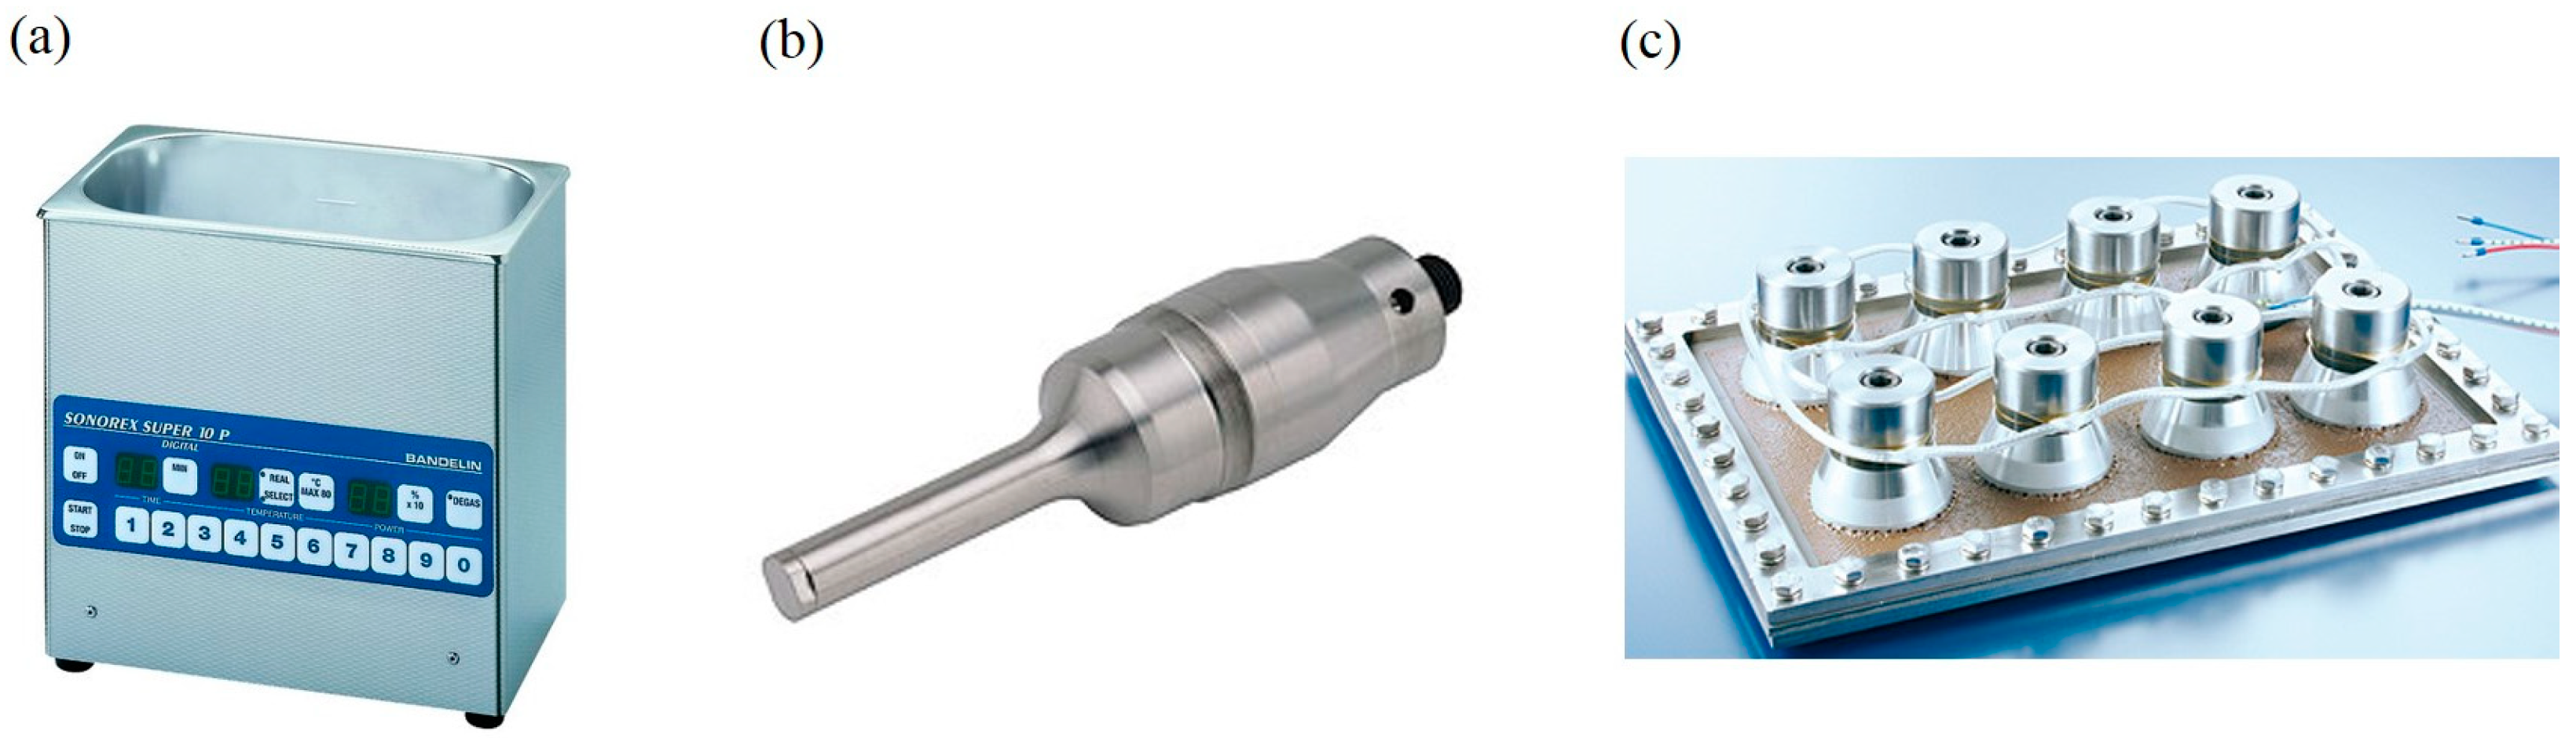
Multiple types of ultrasonic generators exist and provide many different experimental configurations for sonocrystallization. Ultrasound generators are typically ultrasonic baths, horns, and plate transducers (Figure 13).
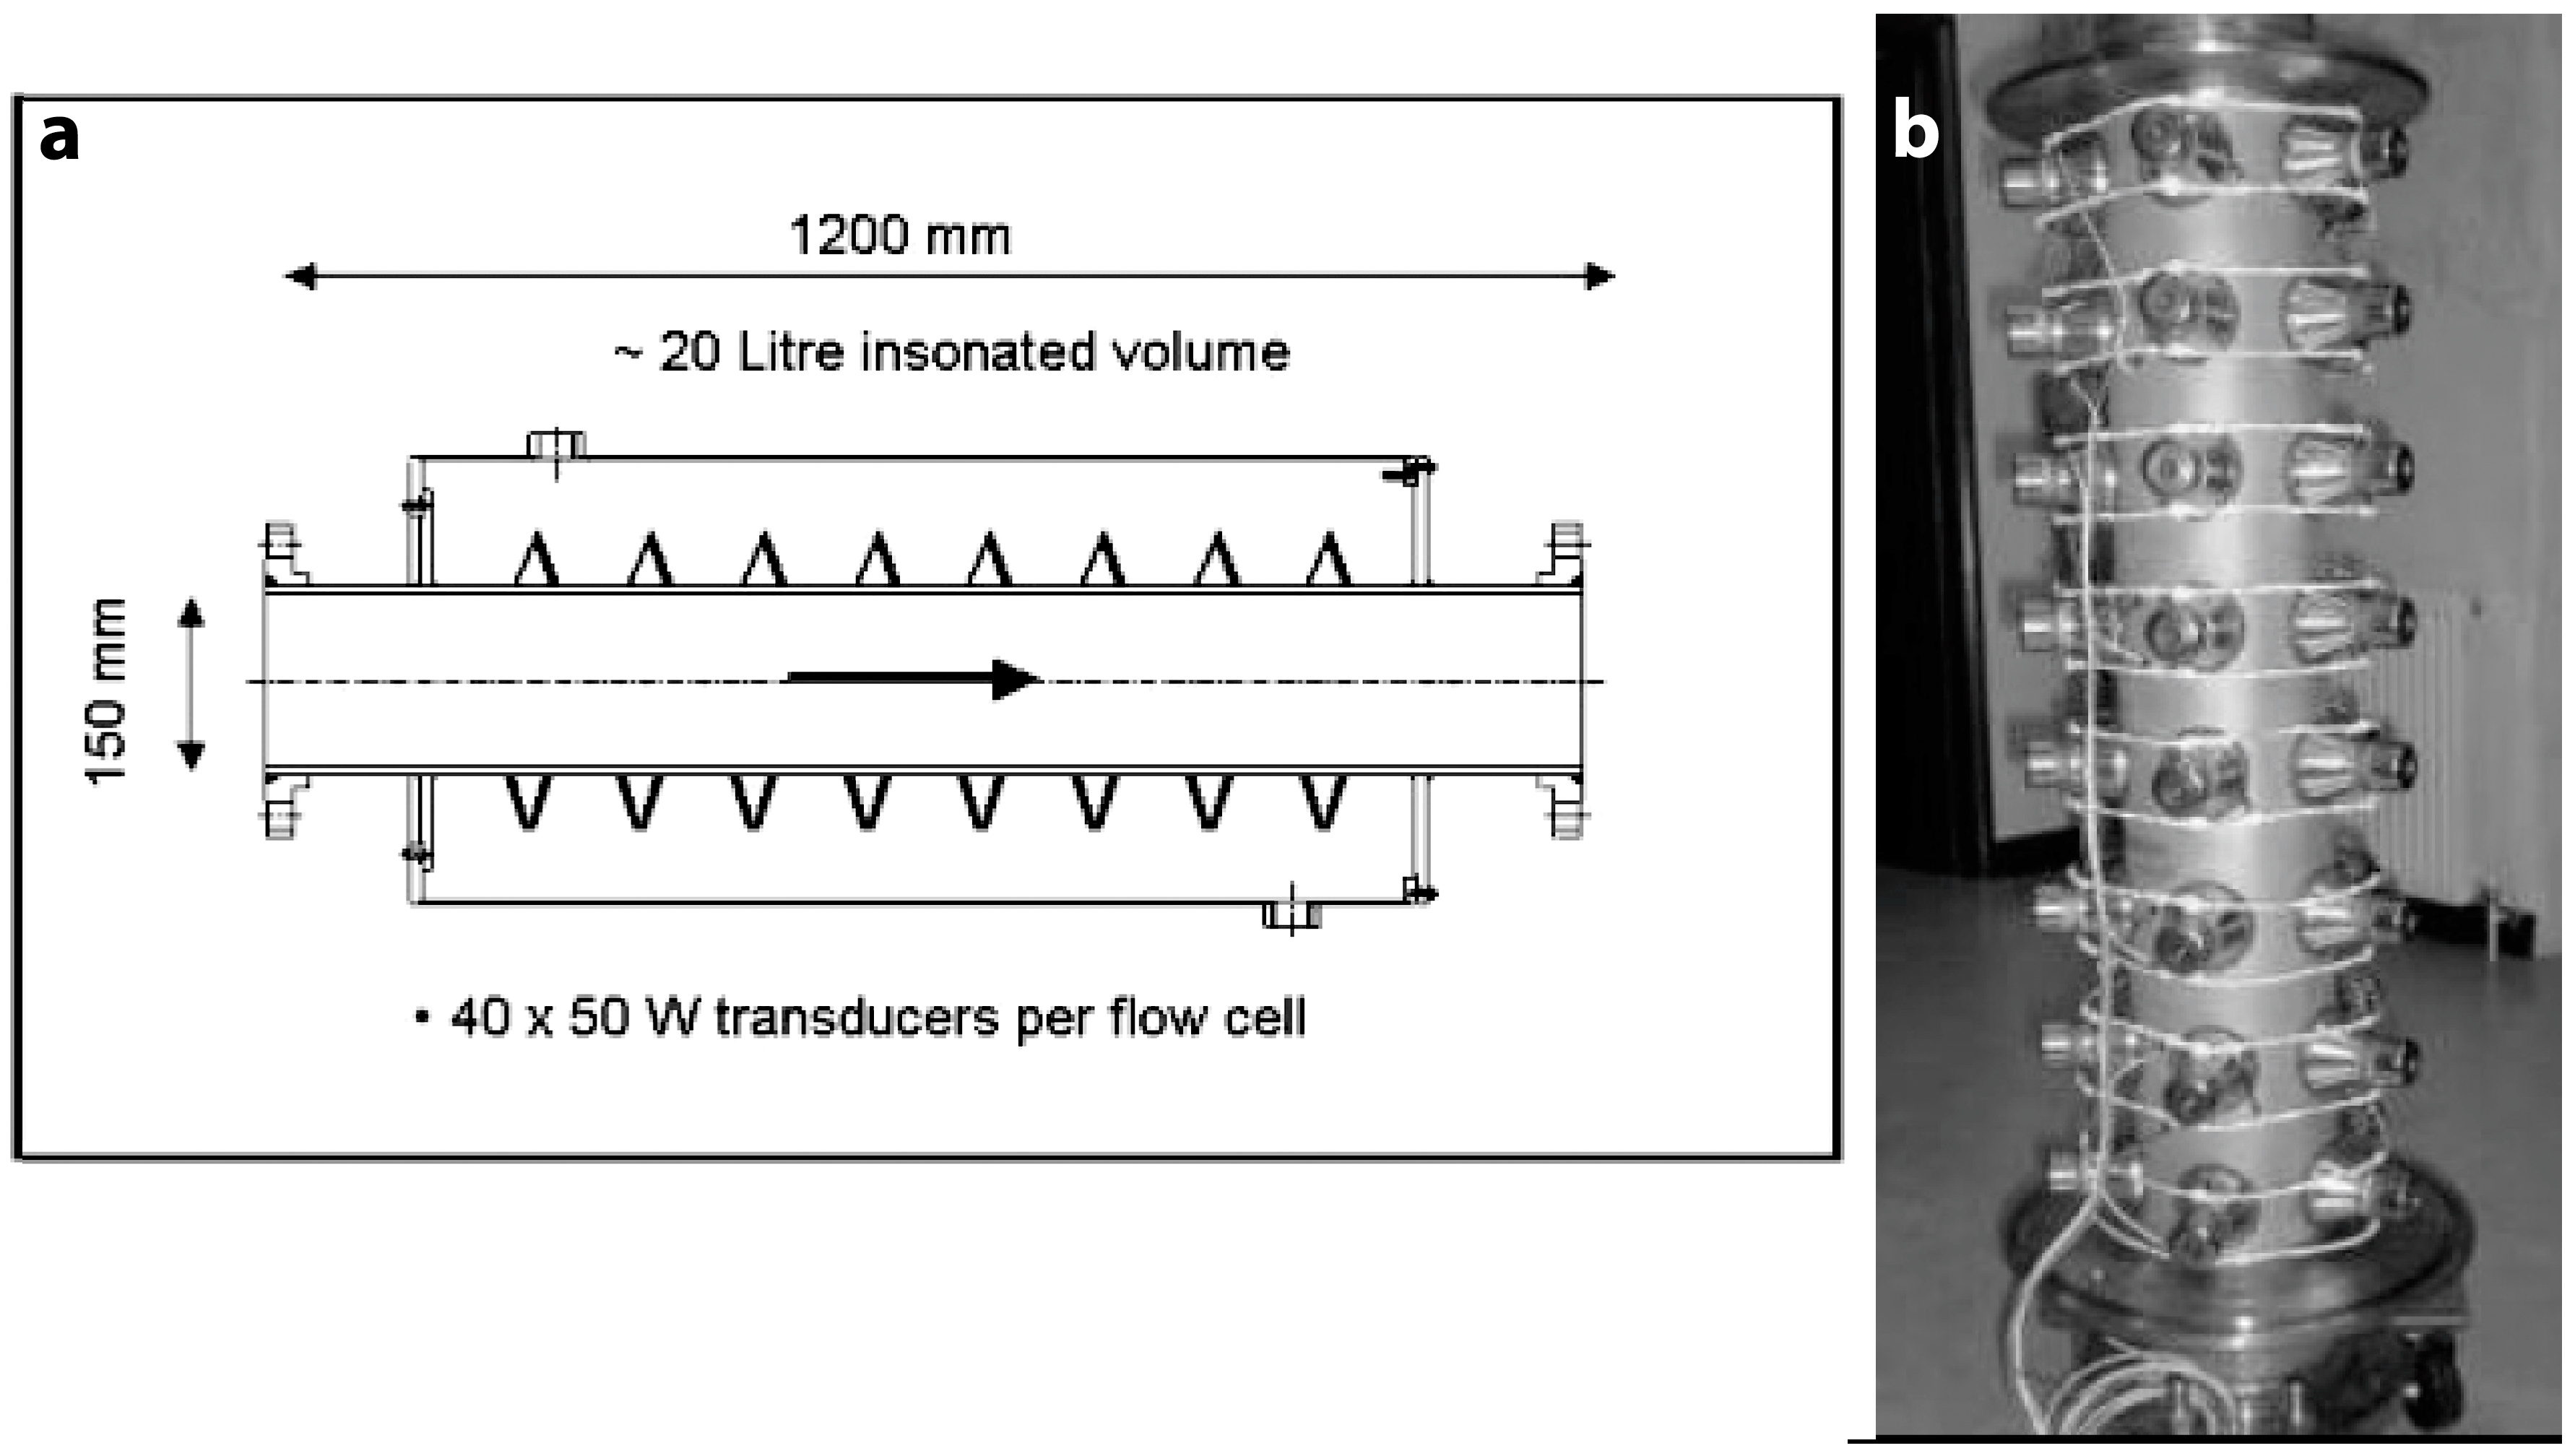
Sonicating baths are standard laboratory equipment and are typically used to disperse particles in liquid. Such sonicators are easily accessed, but are only available in batch configurations [80,81]. Ultrasonic horns are also used to perform sonocrystallization and offer batch or flow-through configurations [45,71,82,83,84,85,86]. Scale-up to large tubular flow-through reactors has also been commercialized, as shown in Figure 14 [29]. Another type of ultrasound generator is the plate transducer, which generates a wide range of ultrasound frequencies. It is essential for sonocrystallization when high frequencies (>100 kHz) are required [87]. With the ultrasonic plate transducer, a batch configuration is typically used for crystallization.
4. Ultrasound in Slurries, Inter-Particle Collisions, Shockwaves, and Sonofragmentation
In a liquid–solid mixture, acoustic cavitation causes various physical phenomena. If a bubble grows near a solid particle larger than the resonant size of the bubble, the bubble is deformed due to the asymmetric environment [1,6]. This asymmetry causes the bubble to collapse asymmetrically, and a fast-moving stream of liquid (i.e., a microjet) is formed [13,14]. The microjet moves toward the solid particles and causes surface deformation or changes in the chemical composition of the surface [1,15].
When solid particles in the mixture are smaller than the resonant size of the bubble, the shockwave that is generated by acoustic cavitation causes interparticle collisions [17,18,88]. Also, shockwaves interact directly with solid particles, causing sonofragmentation [19,89,90]. Interparticle collisions and sonofragmentation affect the average particle size and size distribution, both by reducing the size of existing crystals and by creating secondary nucleation sites [91].
The effect of the shockwaves generated by acoustic cavitation in liquid–solid systems depends on the properties of the solids in the system, most notably their malleability versus their friability (brittleness) [16]. For malleable materials (e.g., metal powders), ultrasonic irradiation leads to agglomeration from interparticle collisions [17,18]. The velocity of the colliding particles is sufficient at the point of impact between particles to cause intense localized heating, plastic deformation, spot-welding, and melting (Figure 15) of various low-melting-point metals (e.g., Zn, Ni, Co, Mo). Very-high-melting-point metals (e.g., W), however, are not affected to the same extent, as one might expect [18]. Similarly, there is an optimal particle size for such impacts that depends on the particle density, but is generally in the 0.5 to 50 µm range [18].
Sonication of molecular crystals causes sonofragmentation by means of direct interactions between particles and shockwaves. Suslick et al. explored the sonication of an aspirin slurry under multiple experimental conditions [19]. They suggested four possible mechanisms of particle breakage under sonication, including interparticle collision, particle-horn collision, particle-wall collision, and direct interaction between particles and shockwaves (i.e., sonofragmentation). As shown in Figure 16, interparticle collisions rarely affect particle breakage. Additionally, particle-horn and particle-wall collisions were negligible contributors to fragmentation. Thus, the authors concluded that direct interactions between particles and shockwaves were the main causes of fragmentation.
Ionic crystals are also broken due to the direct interaction between shockwaves and crystals [92]. Suslick et al. investigated the mechanism of sonofragmentation of slurries of various ionic crystals under multiple experimental conditions. In addition, they quantitatively studied the relationship between material properties (i.e., Vickers hardness and Young’s modulus) and the patterns of sonofragmentation. There was strong correlation of the rate of fragmentation with thermodynamic properties of ionic crystals: the size of fragmented crystals decreased exponentially with increase of sonication time (Figure 17). It is a mechanochemical extension of the Bell-Evans-Polanyi Principle or Hammond’s Postulate: activation energies for solid fracture correlate with binding energies of solids.
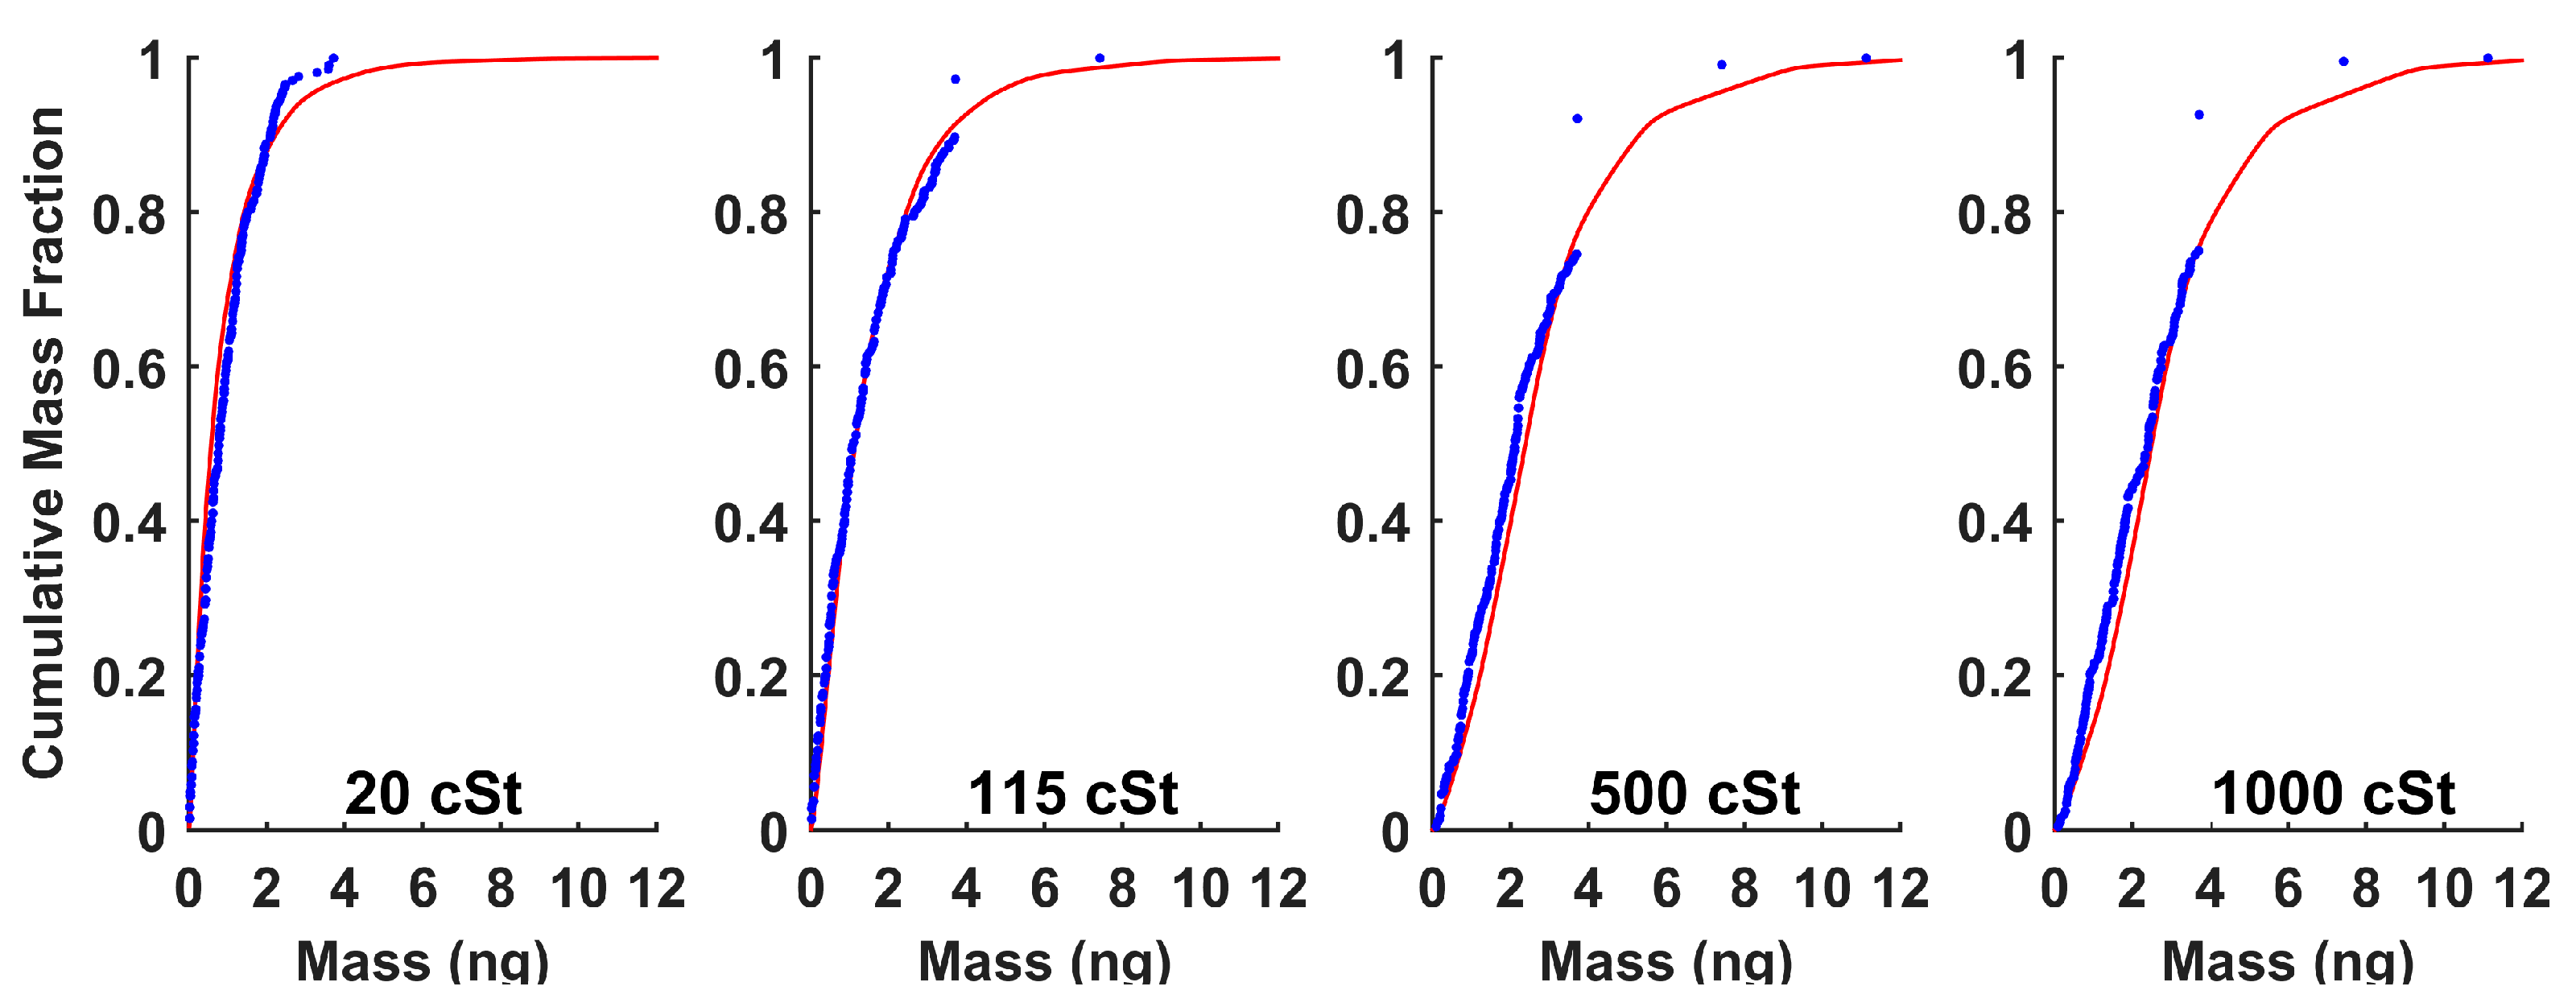
As we have discussed, the effects of ultrasound on crystals have been heavily investigated experimentally. Mathematical simulations of the sonofragmentation process using population balance models that describe the effects of all physical parameters such as solution viscosity and applied power on the crystal size distribution have been lacking. Braatz, Suslick, and coworkers have recently presented detailed population balance models for describing the crystal breakage that results from ultrasound [93]. Aspirin crystals dispersed in various solvents—dodecane and silicone oils of known viscosity—were subjected to ultrasound and the kinetics of the resulting sonofragmentation quantitatively measured. Population balance models were developed for binary breakage events and cavitation rate proportional to the applied power and exponentially related to solvent viscosity. As shown in Figure 18, a simple 2-parameter population balance model that assumes binary breakage into equal fragments was tested against the experimental data and describes the breakage process accurately: the influences of sonication time, ultrasonic intensity, and liquid viscosity are quantitatively incorporated into this simple model. The statistical analysis supports the breakage model in which cavitation bubbles cause the aspirin crystals to break into two equal-sized particles.
5. Application
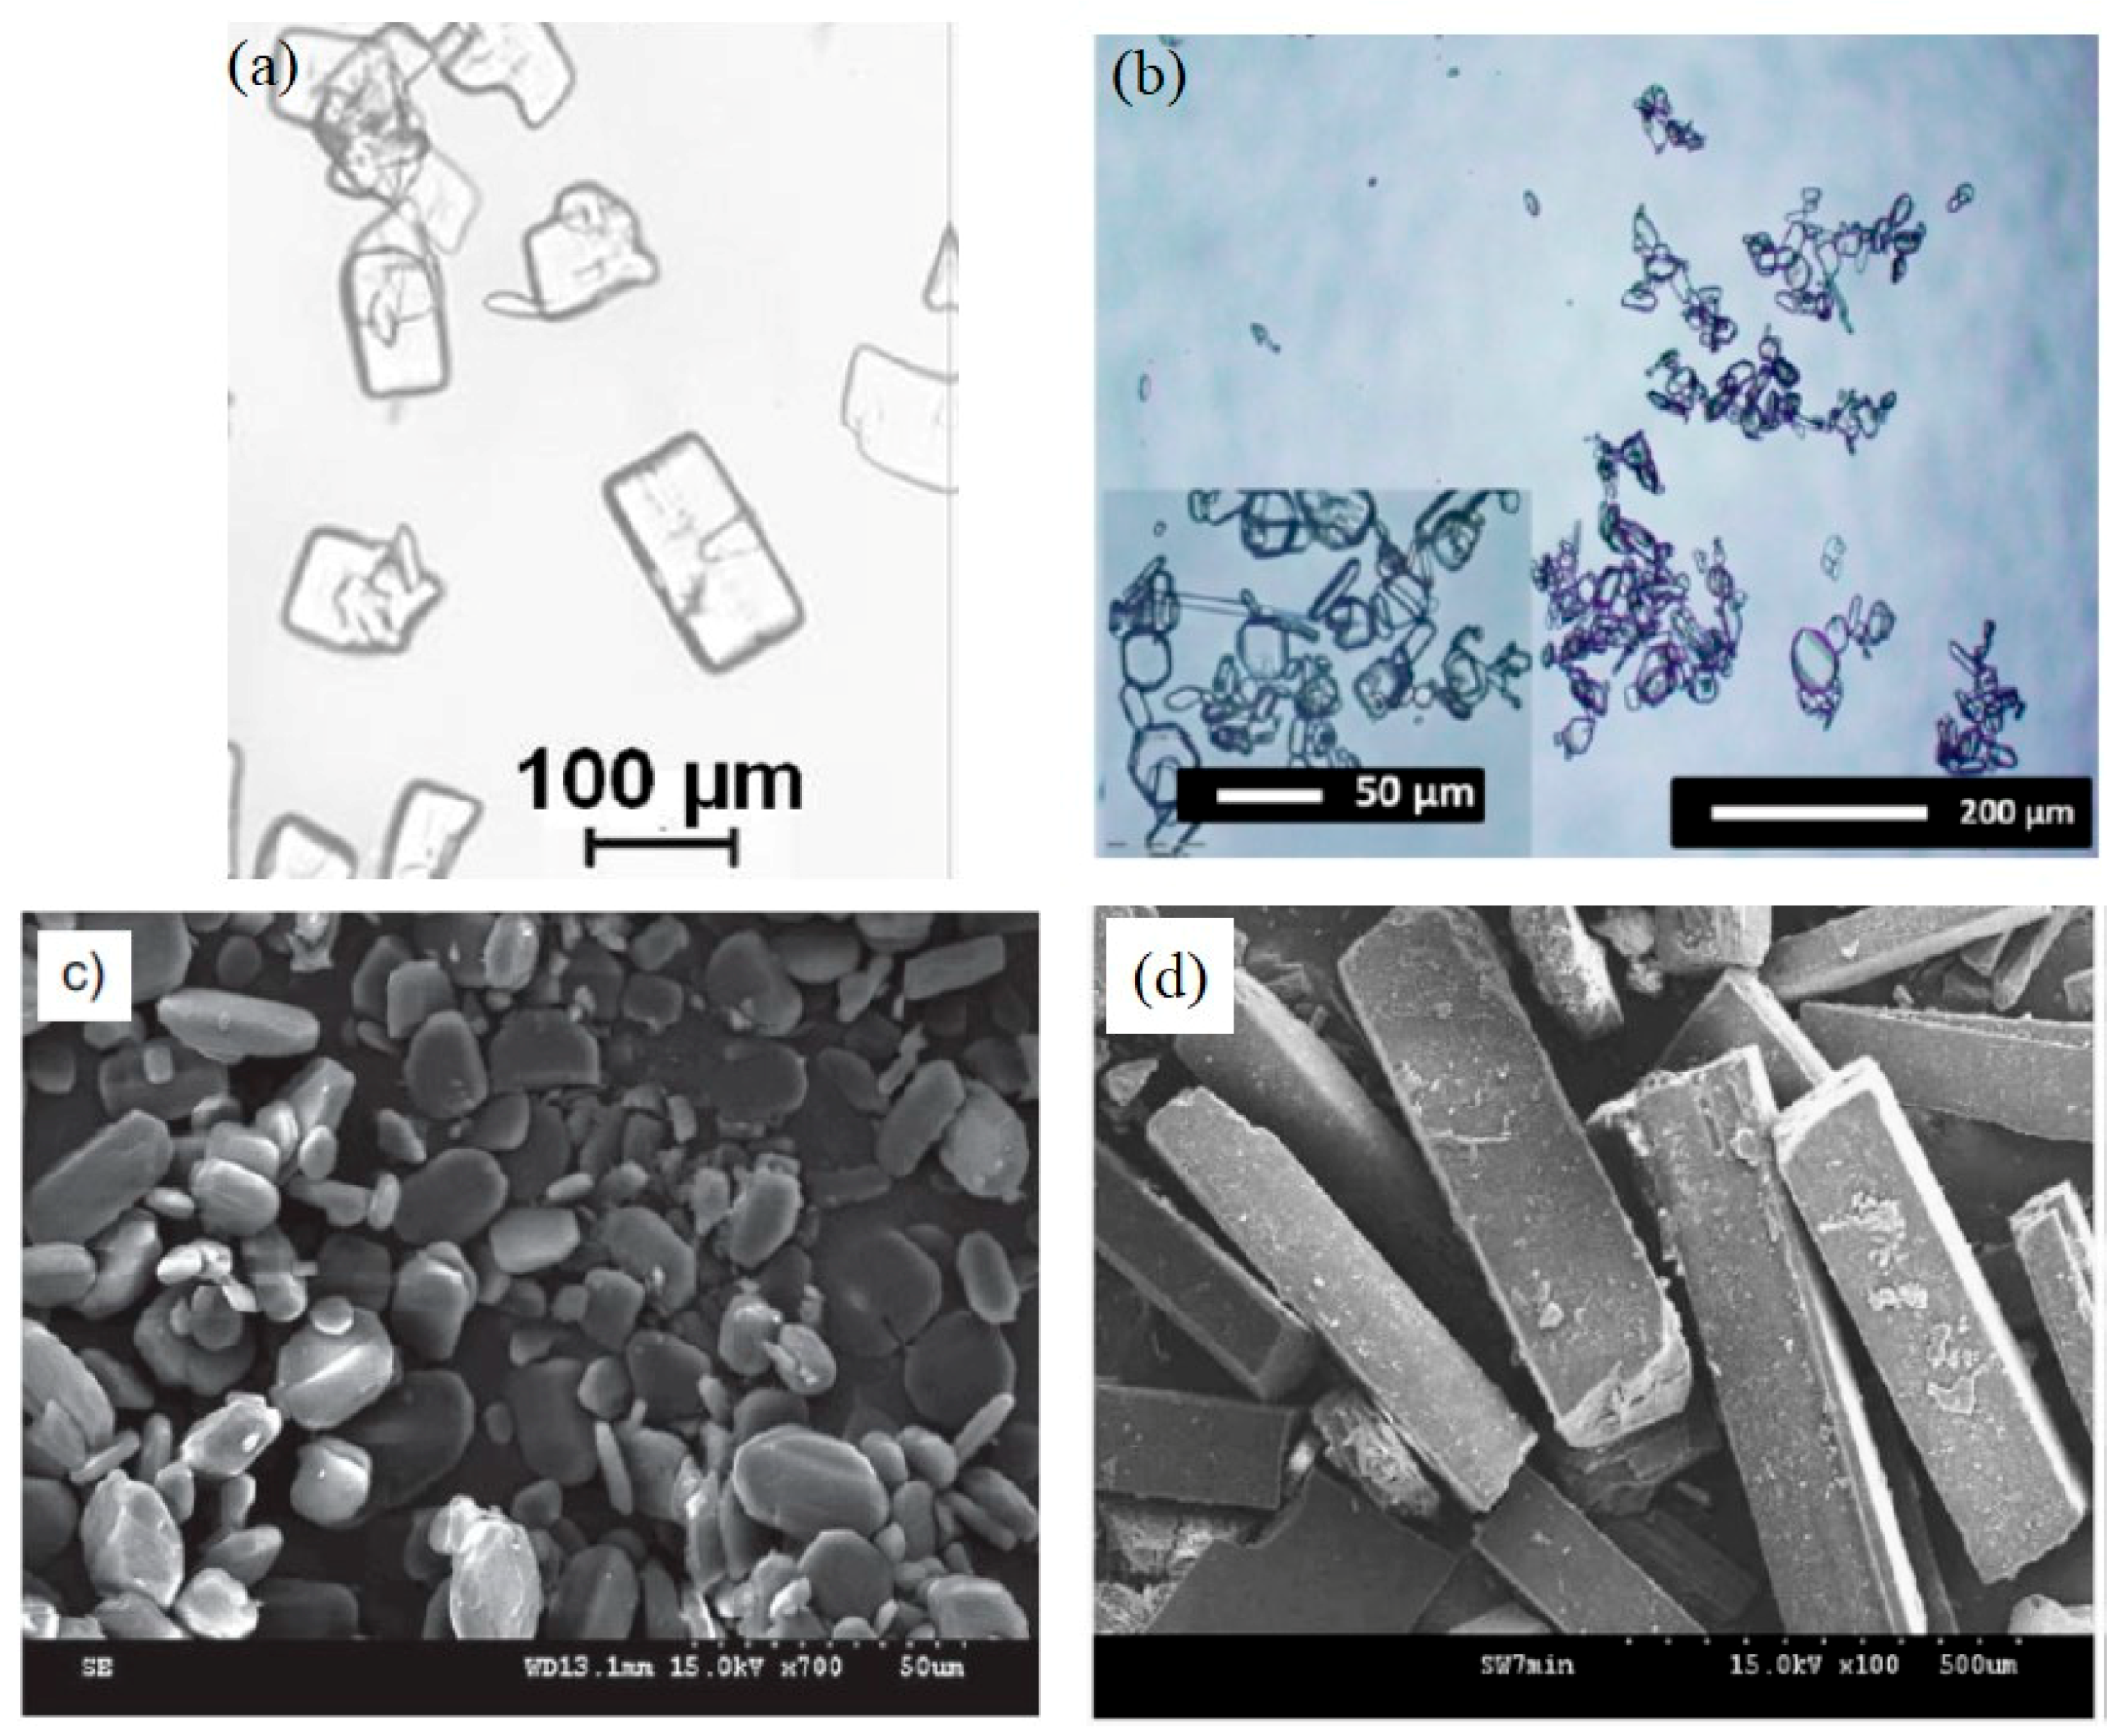
Sonocrystallization generates various materials with a wide range of sizes and diverse structures. One of the fields in which sonocrystallization is used widely is to produce pharmaceutical agents (PAs), since it can control crystal sizes, distributions, and polymorphisms [25,28,29,30]. Reductions in PA size increase the dissolution rate and solubility, especially for nanocrystals [94,95,96,97]. Also, control of polymorphisms decreases the probability of side effects [98,99]. For PAs, control of such properties (i.e., size and polymorphism) is important because they directly affect delivery to target organs and work to treat a disease. In fact, multiple PAs, including acetylsalicylic acid, paracetamol, phenacetin, carbamazepine, etc., have been generated via sonocrystallization to decrease size and size distributions, and/or to control polymorphism (Figure 19) [59,60,70,72,100,101,102,103].
Another application of sonocrystallization is for the generation of nanocrystals and nanostructures [104,105,106,107,108,109,110]. Qian et al. reported ultrasonic irradiation as a new method for generating zinc oxide nanocrystals [111]. The conventional method was time-consuming, taking 2 days; sonication (20 kHz), however, generated nanocrystals in 3 min. Moreover, nanocrystals were formed using ultrasonic irradiation without the addition of heptane in 25 min (Figure 20).
It is possible to produce a variety of nanostructures via sonocrystallization. Li et al. produced nanofibers and fibrillar networks using ultrasonic irradiation [112]. N-lauroyl-l-glutamic acid di-n-butylamide (GP-1) was dissolved in octanol or propylene glycol at 120 °C and quenched to room temperature in an ultrasonic water bath (35 kHz, 1–4 W/cm2) for 0–2 min. Using sonication, the product was a nanofiber network structure and without sonication, spherulitic particles were formed (Figure 21). The network structure exhibited an enhanced storage modulus and gelation capability compared with the spherulitic particles.
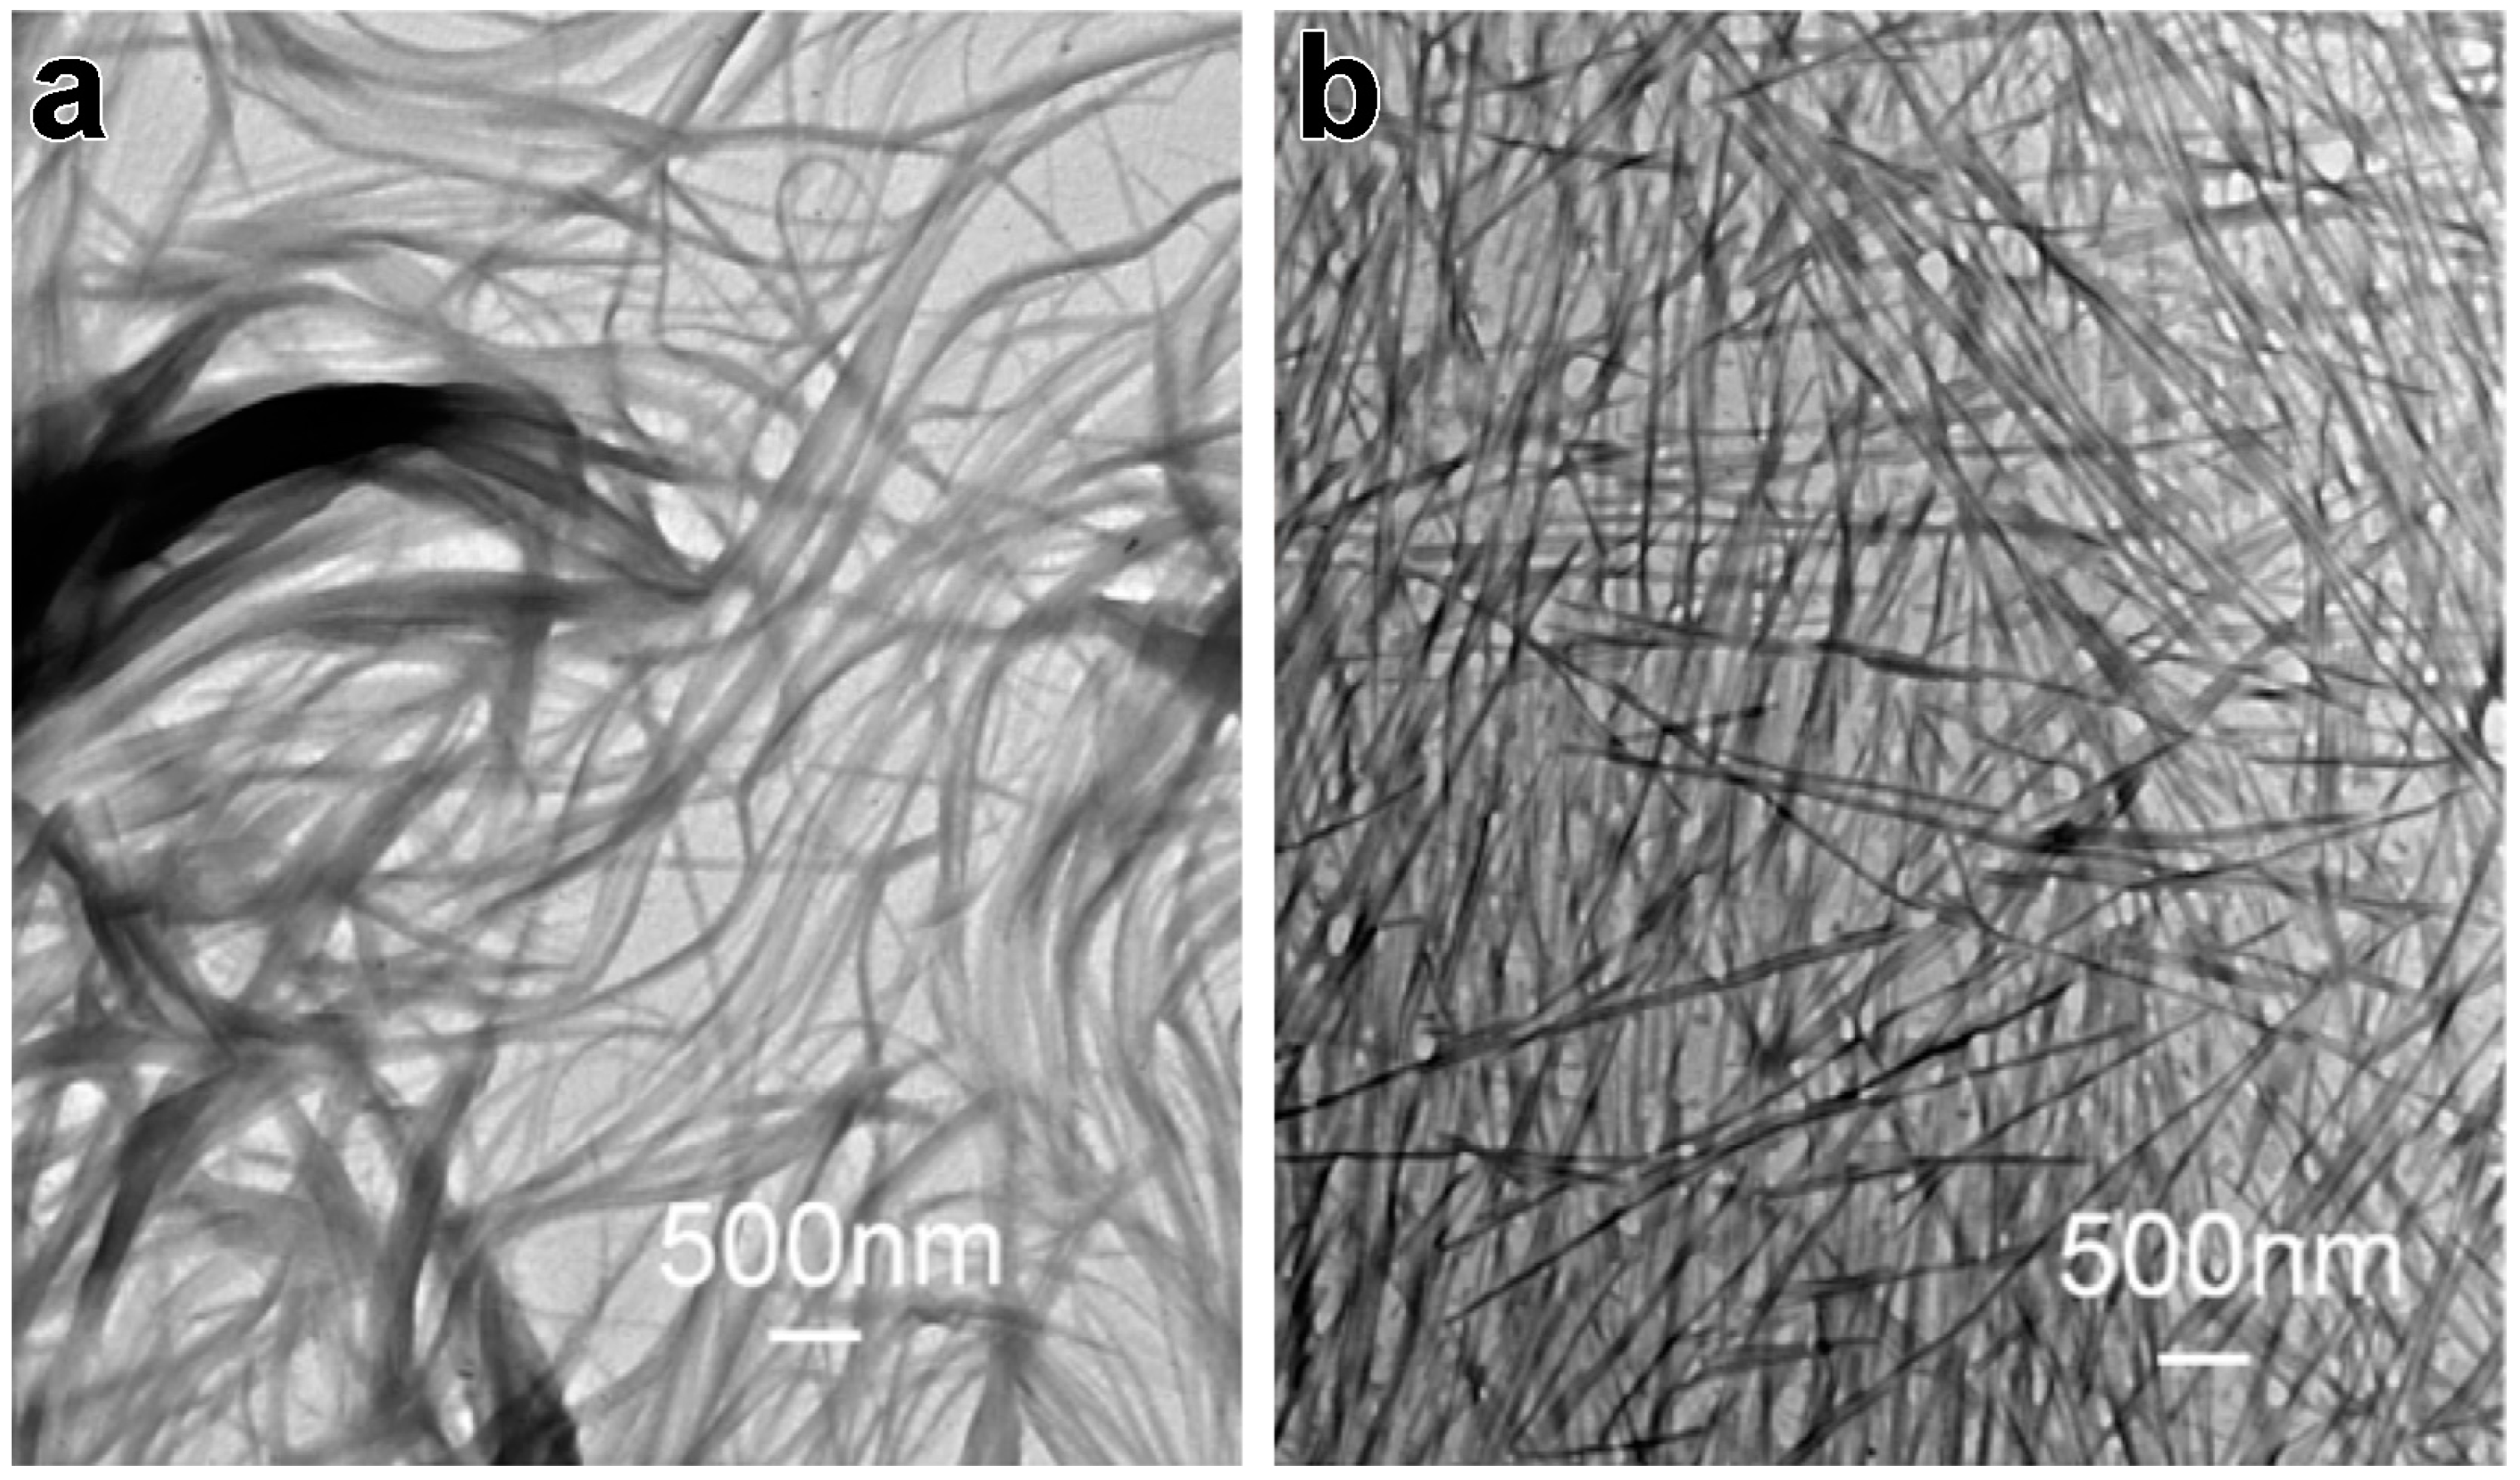
Hayward et al. reported on the generation of perylene diimide (PDI) nanowires using sonocrystallization [113]. PDI and poly(3-hexylthiophene) were dissolved in 1,2-dicholorobenzene at 120 °C and cooled to 20 °C with or without sonication. Notably, sonocrystallization produced narrower, straighter, and less agglomerated PDI nanowires than the cooling crystallization without sonication (Figure 22, left). The relatively good control of sonocrystallized nanowire sizes allowed for the preparation of smooth films (Figure 22, right).
6. Conclusions
Sonocrystallization is an important method for the controlled preparation of crystals with desired size and size distribution. In solutions undergoing crystallization, acoustic cavitation and its physical effects reduce the induction time and the metastable zone width and increase the nucleation rates of crystal formation. Various control variables have been modified to produce micro- and nano-crystals that are of special interest to the pharmaceutical industry due to the enhanced bioavailability associated with particle size reduction. The effect of breakage of pre-existing crystals under ultrasonic irradiation has provided useful insights into the effects of ultrasonic irradiation during sonocrystallization. There have been numerous reports on empirical results from sonocrystallization. While the mechanisms of action attributed to sonocrystallization and sonofragmentation have been increasing well delineated, the relative importance of these various mechanisms (bubble interface nucleation, reduction of MZW, sonofragmentation, etc.) remains, however, an open question that will depend heavily on specific systems and configurations.
Funding
This research was supported by the US AFOSR, grant FA9550-16-1-0042.
Conflicts of Interest
The authors declare no conflict of interest.
References
- Suslick, K.S. Sonochemistry. Science 1990, 247, 1439–1445. [Google Scholar] [CrossRef] [PubMed]
- Leighton, T.G. The Acoustic Bubble; Academic Press: Cambridge, MD, USA, 1994. [Google Scholar]
- Jones, S.F.; Evans, G.M.; Galvin, K.P. Bubble nucleation from gas cavities—A review. Adv. Colloid Interface Sci. 1999, 80, 27–50. [Google Scholar] [CrossRef]
- Brennen, C.E. Cavitation and Bubble Dynamics; Cambridge University Press: Cambridge, UK, 2014. [Google Scholar]
- Suslick, K.S. Ultrasound: Its Chemical, Physical and Biological Effects; VCH: New York, NY, USA, 1988. [Google Scholar]
- Leong, T.; Ashokkumar, M.; Kentish, S. The fundamentals of power ultrasound—A review. Acoust. Aust. 2011, 39, 54–63. [Google Scholar]
- Suslick, K.S. The chemical effects of ultrasound. Sci. Am. 1989, 260, 80–86. [Google Scholar] [CrossRef]
- McNamara, W.B.; Didenko, Y.T.; Suslick, K.S. Sonoluminescence temperatures during multi-bubble cavitation. Nature 1999, 401, 772–775. [Google Scholar] [CrossRef]
- McNamara, W.B.; Didenko, Y.T.; Suslick, K.S. Pressure during sonoluminescence. J. Phys. Chem. B 2003, 107, 7303–7306. [Google Scholar] [CrossRef]
- Flannigan, D.J.; Suslick, K.S. Plasma formation and temperature measurement during single-bubble cavitation. Nature 2005, 434, 52–55. [Google Scholar] [CrossRef] [PubMed]
- Suslick, K.S.; Flannigan, D.J. Inside a collapsing bubble: Sonoluminescence and the conditions during cavitation. Annu. Rev. Phys. Chem. 2008, 59, 659–683. [Google Scholar] [CrossRef] [PubMed]
- Pecha, R.; Gompf, B. Microimplosions: Cavitation collapse and shock wave emission on a nanosecond time scale. Phys. Rev. Lett. 2000, 84, 1328–1330. [Google Scholar] [CrossRef] [PubMed]
- Lauterborn, W.; Vogel, A. Morden optical techniques in fluid mechanics. Annu. Rev. Fluid Mech. 1984, 16, 223–244. [Google Scholar] [CrossRef]
- Blake, J.R.; Keen, G.S.; Tong, R.P.; Wilson, M. Acoustic cavitation: The fluid dynamics of non-spherical bubbles. Philos. Trans. R. Soc. A Math. Phys. Eng. Sci. 1999, 357, 251–267. [Google Scholar] [CrossRef]
- Suslick, K.S. Application of ultrasound to materials chemistry. MRS Bull. 1995, 20, 29–34. [Google Scholar] [CrossRef]
- Suslick, K.S.; Price, G.J. Applications of ultrasound to materials chemistry. Annu. Rev. Mater. Sci. 1999, 29, 295–326. [Google Scholar] [CrossRef]
- Doktycz, S.J.; Suslick, K.S. Interparticle collisions driven by ultrasound. Science 1990, 247, 1067–1069. [Google Scholar] [CrossRef] [PubMed] [Green Version]
- Prozorov, T.; Prozorov, R.; Suslick, K.S. High velocity interparticle collisions driven by ultrasound. J. Am. Chem. Soc. 2004, 126, 13890–13891. [Google Scholar] [CrossRef] [PubMed]
- Zeiger, B.W.; Suslick, K.S. Sonofragmentation of molecular crystals. J. Am. Chem. Soc. 2011, 133, 14530–14533. [Google Scholar] [CrossRef] [PubMed]
- Richards, W.T.; Loomis, A.L. The chemical effects of high frequency sound waves I. A preliminary survey. J. Am. Chem. Soc. 1927, 49, 3086–3100. [Google Scholar] [CrossRef]
- Kapustin, A. The Effects of Ultrasound on the Kinetics of Crystallization; Springer Science & Business Media: Berlin, Germany, 2012. [Google Scholar]
- Polotski, I.G.; Ovsiyenk, D.Y.; Khodov, Z.L.; Sosnina, Y.G.; Baselyuk, G.Y.; Kushnir, V.K. Effect of an ultrasound on perfection of melt-grown aluminium single crystals. Phys. Met. Metallogr. 1966, 21, 81. [Google Scholar]
- Belyaev, V.K.; Reshetny, II. Effect of ultrasound on growth and dissolution of single crystals in a drop of solution. Sov. Phys. Acoust. USSR 1967, 12, 312. [Google Scholar]
- Vasilev, B.P.; Vinograd, K.N. Amplification of high-intensity ultrasound in cadmium sulfide single crystals. Sov. Phys. Solid State USSR 1967, 9, 1052–1054. [Google Scholar]
- De Castro, M.L.; Priego-Capote, F. Ultrasound-assisted crystallization (sonocrystallization). Ultrason. Sonochem. 2007, 14, 717–724. [Google Scholar]
- Sander, J.R.G.; Zeiger, B.W.; Suslick, K.S. Sonocrystallization and sonofragmentation. Ultrason. Sonochem. 2014, 21, 1908–1915. [Google Scholar] [CrossRef] [PubMed]
- Gajendragadkar, C.N.; Gogate, P.R. Intensified recovery of valuable products from whey by use of ultrasound in processing steps—A review. Ultrason. Sonochem. 2016, 32, 102–118. [Google Scholar] [CrossRef] [PubMed]
- Cains, P.W.; Martin, P.D.; Price, C.J. The use of ultrasound in industrial chemical synthesis and crystallization. 1. Applications to synthetic chemistry. Org. Process Res. Dev. 1998, 2, 34–48. [Google Scholar] [CrossRef]
- Ruecroft, G.; Hipkiss, D.; Ly, T.; Maxted, N.; Cains, P.W. Sonocrystallization: The use of ultrasound for improved industrial crystallization. Org. Process Res. Dev. 2005, 9, 923–932. [Google Scholar] [CrossRef]
- Castillo-Peinado, L.D.; de Castro, M.D.L. The role of ultrasound in pharmaceutical production: Sonocrystallization. J. Pharm. Pharmacol. 2016, 68, 1249–1267. [Google Scholar] [CrossRef] [PubMed]
- Mullin, J.W. Crystallization; Butterworth-Heinemann: Oxford, UK, 2001. [Google Scholar]
- Li, H.; Wang, J.K.; Bao, Y.; Guo, Z.C.; Zhang, M.Y. Rapid sonocrystallization in the salting-out process. J. Cryst. Growth 2003, 247, 192–198. [Google Scholar] [CrossRef]
- Guo, Z.; Zhang, M.; Li, H.; Wang, J.; Kougoulos, E. Effect of ultrasound on anti-solvent crystallization process. J. Cryst. Growth 2005, 273, 555–563. [Google Scholar] [CrossRef]
- Kurotani, M.; Miyasaka, E.; Ebihara, S.; Hirasawa, I. Effect of ultrasonic irradiation on the behavior of primary nucleation of amino acids in supersaturated solutions. J. Cryst. Growth 2009, 311, 2714–2721. [Google Scholar] [CrossRef]
- Guo, Z.; Jones, A.G.; Li, N. The effect of ultrasound on the homogeneous nucleation of BaSO4 during reactive crystallization. Chem. Eng. Sci. 2006, 61, 1617–1626. [Google Scholar] [CrossRef]
- Zhang, Z.; Sun, D.W.; Zhu, Z.W.; Cheng, L.N. Enhancement of crystallization processes by power ultrasound: Current state-of-the-art and research advances. Compr. Rev. Food Sci. Food Saf. 2015, 14, 303–316. [Google Scholar] [CrossRef]
- Beckmann, W. Crystallization: Basic Comcepts and Industrial Applications; John Wiley & Sons: New York, NY, USA, 2013. [Google Scholar]
- Parvizian, F.; Rahimi, M.; Faryadi, M. Macro- and micromixing in a novel sonochemical reactor using high frequency ultrasound. Chem. Eng. Process. 2011, 50, 732–740. [Google Scholar] [CrossRef]
- Jordens, J.; Bamps, B.; Gielen, B.; Braeken, L.; Van Gerven, T. The effects of ultrasound on micromixing. Ultrason. Sonochem. 2016, 32, 68–78. [Google Scholar] [CrossRef] [PubMed]
- Monnier, H.; Wilhelm, A.M.; Delmas, H. The influence of ultrasound on micromixing in a semi-batch reactor. Chem. Eng. Sci. 1999, 54, 2953–2961. [Google Scholar] [CrossRef]
- Monnier, H.; Wilhelm, A.M.; Delmas, H. Effects of ultrasound on micromixing in flow cell. Chem. Eng. Sci. 2000, 55, 4009–4020. [Google Scholar] [CrossRef]
- Lozovatsky, I.D.; Fernando, H.J.S. Mixing efficiency in natural flows. Philos. Trans. R. Soc. A Math. Phys. Eng. Sci. 2013, 371. [Google Scholar] [CrossRef] [PubMed]
- Richardson, L.F. Weather Prediction by Numerical Process; Cambridge University Press: Cambridge, UK, 1922. [Google Scholar]
- Gracin, S.; Uusi-Penttila, M.; Rasmuson, A.C. Influence of ultrasound on the nucleation of polymorphs of p-aminobenzoic acid. Cryst. Growth Des. 2005, 5, 1787–1794. [Google Scholar] [CrossRef]
- Ramisetty, K.A.; Pandit, A.B.; Gogate, P.R. Ultrasound-assisted antisolvent crystallization of benzoic acid: Effect of process variables supported by theoretical simulations. Ind. Eng. Chem. Res. 2013, 52, 17573–17582. [Google Scholar] [CrossRef]
- Vekilov, P.G. Nucleation. Cryst. Growth Des. 2010, 10, 5007–5019. [Google Scholar] [CrossRef] [PubMed]
- Guo, Z.; Jones, A.G.; Li, N.; Germana, S. High-speed observation of the effects of ultrasound on liquid mixing and agglomerated crystal breakage processes. Powder Technol. 2007, 171, 146–153. [Google Scholar] [CrossRef]
- Raman, V.; Abbas, A. Experimental investigations on ultrasound mediated particle breakage. Ultrason. Sonochem. 2008, 15, 55–64. [Google Scholar] [CrossRef] [PubMed]
- Wagterveld, R.M.; Boels, L.; Mayer, M.J.; Witkamp, G.J. Visualization of acoustic cavitation effects on suspended calcite crystals. Ultrason. Sonochem. 2011, 18, 216–225. [Google Scholar] [CrossRef] [PubMed]
- Agrawal, S.G.; Paterson, A.H.J. Secondary nucleation: Mechanisms and models. Chem. Eng. Commun. 2015, 202, 698–706. [Google Scholar] [CrossRef]
- Chow, R.; Blindt, R.; Chivers, R.; Povey, M. The sonocrystallisation of ice in sucrose solutions: Primary and secondary nucleation. Ultrasonics 2003, 41, 595–604. [Google Scholar] [CrossRef] [PubMed]
- Chow, R.; Blindt, R.; Kamp, A.; Grocutt, P.; Chivers, R. The microscopic visualisation of the sonocrystallisation of ice using a novel ultrasonic cold stage. Ultrason. Sonochem. 2004, 11, 245–250. [Google Scholar] [CrossRef] [PubMed]
- Chow, R.; Blindt, R.; Chivers, R.; Povey, M. A study on the primary and secondary nucleation of ice by power ultrasound. Ultrasonics 2005, 43, 227–230. [Google Scholar] [CrossRef] [PubMed]
- Nangia, A. Conformational polymorphism in organic crystals. Acc. Chem. Res. 2008, 41, 595–604. [Google Scholar] [CrossRef] [PubMed]
- Louhi-Kultanen, M.; Karjalainen, M.; Rantanen, J.; Huhtanen, M.; Kallas, J. Crystallization of glycine with ultrasound. Int. J. Pharm. 2006, 320, 23–29. [Google Scholar] [CrossRef] [PubMed]
- Kurotani, M.; Hirasawa, I. Polymorph control of sulfamerazine by ultrasonic irradiation. J. Cryst. Growth 2008, 310, 4576–4580. [Google Scholar] [CrossRef]
- Hatakka, H.; Alatalo, H.; Louhi-Kultanen, M.; Lassila, I.; Haeggstrom, E. Closed-loop control of reactive crystallization part II: Polymorphism control of l-glutamic acid by sonocrystallization and seeding. Chem. Eng. Technol. 2010, 33, 751–756. [Google Scholar] [CrossRef]
- Price, G.J.; Mahon, M.F.; Shannon, J.; Cooper, C. Composition of calcium carbonate polymorphs precipitated using ultrasound. Cryst. Growth Des. 2011, 11, 39–44. [Google Scholar] [CrossRef]
- Mori, Y.; Maruyama, M.; Takahashi, Y.; Ikeda, K.; Fukukita, S.; Yoshikawa, H.Y.; Okada, S.; Adachi, H.; Sugiyama, S.; Takano, K.; et al. Selective crystallization of metastable phase of acetaminophen by ultrasonic irradiation. Appl. Phys. Express 2015, 8, 65501. [Google Scholar] [CrossRef]
- Bhangu, S.K.; Ashokkumar, M.; Lee, J. Ultrasound assisted crystallization of paracetamol: Crystal size distribution and polymorph control. Cryst. Growth Des. 2016, 16, 1934–1941. [Google Scholar] [CrossRef]
- Lee, Y.L.; Ristic, R.I.; DeMatos, L.L.; Martin, C.M. Crystallisation pathways of polymorphic triacylglycerols induced by mechanical energy. In XIV International Conference on Small-Angle Scattering; Ungar, G., Ed.; IOP Publishing: Bristol, UK, 2010; Volume 247, p. 12049. [Google Scholar]
- Tripathi, R.; Biradar, S.V.; Mishra, B.; Paradkar, A.R. Study of polymorphs of progesterone by novel melt sonocrystallization technique: A technical note. AAPS PharmSciTech 2010, 11, 1493–1498. [Google Scholar] [CrossRef] [PubMed]
- Sarkar, A.; Ragab, D.; Rohani, S. Polymorphism of progesterone: A new approach for the formation of form II and the relative stabilities of form I and form II. Cryst. Growth Des. 2014, 14, 4574–4582. [Google Scholar] [CrossRef]
- Hermanto, M.W.; Yeoh, A.; Soh, B.; Chow, P.S.; Tan, R.B.H. Robust crystallization process development for the metastable delta-form of pyrazinamide. Org. Process Res. Dev. 2015, 19, 1987–1996. [Google Scholar] [CrossRef]
- Nalajala, V.S.; Moholkar, V.S. Investigations in the physical mechanism of sonocrystallization. Ultrason. Sonochem. 2011, 18, 345–355. [Google Scholar] [CrossRef] [PubMed]
- Lee, J.; Ashokkumar, M.; Kentish, S.E. Influence of mixing and ultrasound frequency on antisolvent crystallisation of sodium chloride. Ultrason. Sonochem. 2014, 21, 60–68. [Google Scholar] [CrossRef] [PubMed]
- Ichitsubo, T.; Matsubara, E.; Kai, S.; Hirao, M. Ultrasound-induced crystallization around the glass transition temperature for Pd40Ni40P20 metallic glass. Acta Mater. 2004, 52, 423–429. [Google Scholar] [CrossRef]
- Nii, S.; Takayanagi, S. Growth and size control in anti-solvent crystallization of glycine with high frequency ultrasound. Ultrason. Sonochem. 2014, 21, 1182–1186. [Google Scholar] [CrossRef] [PubMed]
- Yamaguchi, T.; Nomura, M.; Matsuoka, T.; Koda, S. Effects of frequency and power of ultrasound on the size reduction of liposome. Chem. Phys. Lipids 2009, 160, 58–62. [Google Scholar] [CrossRef] [PubMed]
- Jordens, J.; Gielen, B.; Braeken, L.; Van Gerven, T. Determination of the effect of the ultrasonic frequency on the cooling crystallization of paracetamol. Chem. Eng. Process. 2014, 84, 38–44. [Google Scholar] [CrossRef] [Green Version]
- Nishida, I. Precipitation of calcium carbonate by ultrasonic irradiation. Ultrason. Sonochem. 2004, 11, 423–428. [Google Scholar] [CrossRef] [PubMed]
- Su, C.S.; Liao, C.Y.; Jheng, W.D. Particle size control and crystal habit modification of phenacetin using ultrasonic crystallization. Chem. Eng. Technol. 2015, 38, 181–186. [Google Scholar] [CrossRef]
- Park, M.W.; Yeo, S.D. Antisolvent crystallization of roxithromycin and the effect of ultrasound. Sep. Sci. Technol. 2010, 45, 1402–1410. [Google Scholar] [CrossRef]
- Li, J.Q.; Bao, Y.; Wang, J.K. Effects of sonocrystallization on the crystal size distribution of cloxacillin benzathine crystals. Chem. Eng. Technol. 2013, 36, 1341–1346. [Google Scholar] [CrossRef]
- Belkacem, N.; Salem, M.A.S.; AlKhatib, H.S. Effect of ultrasound on the physico-chemical properties of poorly soluble drugs: Antisolvent sonocrystallization of ketoprofen. Powder Technol. 2015, 285, 16–24. [Google Scholar] [CrossRef]
- Narducci, O.; Jones, A.G.; Kougoulos, E. An assessment of the use of ultrasound in the particle engineering of micrometer-scale adipic acid crystals. Cryst. Growth Des. 2011, 11, 1742–1749. [Google Scholar] [CrossRef]
- Bandelin. Available online: http://bandelin.com (accessed on 3 July 2018).
- Sonics. Available online: http://www.sonics.com (accessed on 3 July 2018).
- Weber Ultrasonics. Available online: http://www.weber-ultrasonics-america.com (accessed on 3 July 2018).
- Crespo, R.; Martins, P.M.; Gales, L.; Rocha, F.; Damas, A.M. Potential use of ultrasound to promote protein crystallization. J. Appl. Crystallogr. 2010, 43, 1419–1425. [Google Scholar] [CrossRef]
- Kiani, H.; Zhang, Z.H.; Delgado, A.; Sun, D.W. Ultrasound assisted nucleation of some liquid and solid model foods during freezing. Food Res. Int. 2011, 44, 2915–2921. [Google Scholar] [CrossRef]
- Hatkar, U.N.; Gogate, P.R. Process intensification of anti-solvent crystallization of salicylic acid using ultrasonic irradiations. Chem. Eng. Process. 2012, 57–58, 16–24. [Google Scholar] [CrossRef]
- Bhoi, S.; Sarkar, D. Modelling and experimental validation of ultrasound assisted unseeded batch cooling crystallization of l-asparagine monohydrate. Crystengcomm 2016, 18, 4863–4874. [Google Scholar] [CrossRef]
- Jiang, M.; Papageorgiou, C.D.; Waetzig, J.; Hardy, A.; Langston, M.; Braatz, R.D. Indirect ultrasonication in continuous slug-flow crystallization. Cryst. Growth Des. 2015, 15, 2486–2492. [Google Scholar] [CrossRef]
- Shirsath, S.R.; Sonawane, S.H.; Saini, D.R.; Pandit, A.B. Continuous precipitation of calcium carbonate using sonochemical reactor. Ultrason. Sonochem. 2015, 24, 132–139. [Google Scholar] [CrossRef] [PubMed]
- Jamshidi, R.; Rossi, D.; Saffari, N.; Gavriilidis, A.; Mazzei, L. Investigation of the effect of ultrasound parameters on continuous sonocrystallization in a millifluidic device. Cryst. Growth Des. 2016, 16, 4607–4619. [Google Scholar] [CrossRef]
- Wohlgemuth, K.; Ruether, F.; Schembecker, G. Sonocrystallization and crystallization with gassing of adipic acid. Chem. Eng. Sci. 2010, 65, 1016–1027. [Google Scholar] [CrossRef]
- Suslick, K.S.; Casadonte, D.J.; Doktycz, S.J. The effects of ultrasound on nickel and copper powders. Solid State Ion. 1989, 32–33, 444–452. [Google Scholar] [CrossRef]
- Gopi, K.R.; Nagarajan, R. Advances in nanoalumina ceramic particle fabrication using sonofragmentation. IEEE Trans. Nanotechnol. 2008, 7, 532–537. [Google Scholar] [CrossRef]
- Jordens, J.; Appermont, T.; Gielen, B.; Van Gerven, T.; Braeken, L. Sonofragmentation: Effect of ultrasound frequency and power on particle breakage. Cryst. Growth Des. 2016, 16, 6167–6177. [Google Scholar] [CrossRef]
- Myerson, A.S. Handbook of Industrial Crystallization; Butterworth-Heinemann: Oxford, UK, 2002. [Google Scholar]
- Kim, H.N.; Suslick, K.S. Sonofragmentation of Ionic Crystals. Chem. A Eur. J. 2017, 23, 2778–2782. [Google Scholar] [CrossRef] [PubMed]
- Rasche, M.L.; Zeiger, B.W.; Suslick, K.S.; Braatz, R.D. Mathematical modelling of the evolution of the particle size distribution during ultrasound induced breakage of aspirin crystals. Chem. Eng. Res. Des. 2018, 132, 170–177. [Google Scholar] [CrossRef]
- Buckton, G.; Beezer, A.E. The relationship between particle size and solubility. Int. J. Pharm. 1992, 82, R7–R10. [Google Scholar] [CrossRef]
- Wu, W.J.; Nancollas, G.H. A new understanding of the relationship between solubility and particle size. J. Solut. Chem. 1998, 27, 521–531. [Google Scholar] [CrossRef]
- Kesisoglou, F.; Panmai, S.; Wu, Y.H. Nanosizing—Oral formulation development and biopharmaceutical evaluation. Adv. Drug Deliv. Rev. 2007, 59, 631–644. [Google Scholar] [CrossRef] [PubMed]
- O’Mahony, M.; Leung, A.K.; Ferguson, S.; Trout, B.L.; Myerson, A.S. A process for the formation of nanocrystals of active pharmaceutical ingredients with poor aqueous solubility in a nanoporous substrate. Org. Process Res. Dev. 2015, 19, 1109–1118. [Google Scholar] [CrossRef]
- Lu, J.; Rohani, S. Polymorphism and crystallization of active pharmaceutical ingredients (APIs). Curr. Med. Chem. 2009, 16, 884–905. [Google Scholar] [CrossRef] [PubMed]
- Beckmann, W. Crystallization of pharmaceutical compounds polymorphs, pseudo-polymorphs and particle formation. Eng. Life Sci. 2003, 3, 113–120. [Google Scholar] [CrossRef]
- Eder, R.J.P.; Schrank, S.; Besenhard, M.O.; Roblegg, E.; Gruber-Woelfler, H.; Khinast, J.G. Continuous sonocrystallization of acetylsalicylic acid (ASA): Control of crystal size. Cryst. Growth Des. 2012, 12, 4733–4738. [Google Scholar] [CrossRef]
- Park, M.W.; Yeo, S.D. Antisolvent crystallization of carbamazepine from organic solutions. Chem. Eng. Res. Des. 2012, 90, 2202–2208. [Google Scholar] [CrossRef]
- Bucar, D.K.; Elliott, J.A.; Eddleston, M.D.; Cockcroft, J.K.; Jones, W. Sonocrystallization yields monoclinic paracetamol with significantly improved compaction behavior. Angew. Chem. Int. Ed. 2015, 54, 249–253. [Google Scholar] [CrossRef] [PubMed]
- Thorat, A.A.; Dalvi, S.V. Solid-state phase transformations and storage stability of curcumin polymorphs. Cryst. Growth Des. 2015, 15, 1757–1770. [Google Scholar] [CrossRef]
- Xu, M.; Lu, Y.N.; Liu, Y.F.; Shi, S.Z.; Qian, T.S.; Lu, D.Y. Sonochemical synthesis of monosized spherical BaTiO3 particles. Powder Technol. 2006, 161, 185–189. [Google Scholar] [CrossRef]
- Dang, F.; Kato, K.; Imai, H.; Wada, S.; Haneda, H.; Kuwabara, M. Growth of BaTiO3 nanoparticles in ethanol-water mixture solvent under an ultrasound-assisted synthesis. Chem. Eng. J. 2011, 170, 333–337. [Google Scholar] [CrossRef]
- Schoenitz, M.; Joseph, S.; Bunjes, H.; Scholl, S. Application of ultrasound in a micro heat exchanger for crystallization of solid lipid nanoparticles. Chem. Eng. Technol. 2013, 36, 1075–1079. [Google Scholar] [CrossRef]
- Kim, H.N.; Sander, J.R.G.; Zeiger, B.W.; Suslick, K.S. Spray Sonocrystallization. Cryst. Growth Des. 2015, 15, 1564–1567. [Google Scholar] [CrossRef]
- Suslick, K.S.; Zeiger, B.W.; Kim, H.N. Ultrasonic Method and Apparatus for Producing Particles Having a Controlled Size Distribution. U.S. Patent 09,855,538, 2 January 2018. [Google Scholar]
- Xu, H.; Zeiger, B.W.; Suslick, K.S. Sonochemical synthesis of nanomaterials. Chem. Soc. Rev. 2013, 42, 2555–2567. [Google Scholar] [CrossRef] [PubMed] [Green Version]
- Hinman, J.J.; Suslick, K.S. Nanostructured Materials Synthesis Using Ultrasound. Top. Curr. Chem. 2017, 375, 12. [Google Scholar] [CrossRef] [PubMed]
- Qian, D.; Jiang, J.Z.; Hansen, P.L. Preparation of ZnO nanocrystals via ultrasonic irradiation. Chem. Commun. 2003, 1078–1079. [Google Scholar] [CrossRef]
- Wang, R.Y.; Liu, X.Y.; Li, J.L. Engineering molecular self-assembled fibrillar networks by ultrasound. Cryst. Growth Des. 2009, 9, 3286–3291. [Google Scholar] [CrossRef]
- Bu, L.J.; Dawson, T.J.; Hayward, R.C. Tailoring ultrasound-induced growth of perylene diimide nanowire crystals from solution by modification with poly(3-hexyl thiophene). ACS Nano 2015, 9, 1878–1885. [Google Scholar] [CrossRef] [PubMed]
Figure 1.
A desupersaturation curve. There is lag time between the points of supersaturation (A) and nucleation (B’). Initial nuclei grow until they are a detectable size (B). The concentration of the solution remains relatively constant for some time (C) and then it changes dramatically (D) due to rapid crystal growth. Finally, it reaches the equilibrium concentration (E). C* = equilibrium saturation, tn = nucleation time, tind = induction time, and tlp = latent period [31].

Figure 2.
Influence of ultrasound on the induction time (tind) of roxithromycin solutions with different supersaturated ratios (S) in the presence (▲) and absence (■) of ultrasound [33]. Ultrasonic frequency was unspecified, but an ultrasonic horn was used, so one must assume ~20 kHz.
Figure 2.
Influence of ultrasound on the induction time (tind) of roxithromycin solutions with different supersaturated ratios (S) in the presence (▲) and absence (■) of ultrasound [33]. Ultrasonic frequency was unspecified, but an ultrasonic horn was used, so one must assume ~20 kHz.

Figure 3.
Influence of ultrasound on the induction time (tind) of BaSO4 solutions with different supersaturated ratios (S). The amplitude of an 750 W ultrasonic processor was modified to 0% (♦, no ultrasound), 21% (■), 31% (▲), 41% (×), 51% (*), and 61% (●) [35]. Ultrasonic frequency was unspecified, but an ultrasonic horn was used, so one must assume ~20 kHz.

Figure 4.
Solubility–supersaturation diagram. Solid line is a solubility curve of a solution. Dashed line is a supersaturation curve which represents temperatures and concentrations at which uncontrolled spontaneous crystallization occurs [31].
Figure 4.
Solubility–supersaturation diagram. Solid line is a solubility curve of a solution. Dashed line is a supersaturation curve which represents temperatures and concentrations at which uncontrolled spontaneous crystallization occurs [31].

Figure 5.
Effect of ultrasound on the metastable zone width (MZW) of p-aminobenzoic acid crystallization. For sonocrystallization, 20 kHz and 2.1 W/cm2 of ultrasound was used. For the unsonicated cases, a magnetic stirring bar was used to stir the solution at 300 rpm [44].
Figure 5.
Effect of ultrasound on the metastable zone width (MZW) of p-aminobenzoic acid crystallization. For sonocrystallization, 20 kHz and 2.1 W/cm2 of ultrasound was used. For the unsonicated cases, a magnetic stirring bar was used to stir the solution at 300 rpm [44].

Figure 6.
Simulated and experimental results of MZW change of benzoic acid with various addition rates of antisolvent (a) with stirring (a magnetic bar, 400 rpm) and (b) under sonication (20 kHz, 8 W/cm2). For each graph, the Eq conc line is the solubility curve of benzoic acid [45].
Figure 6.
Simulated and experimental results of MZW change of benzoic acid with various addition rates of antisolvent (a) with stirring (a magnetic bar, 400 rpm) and (b) under sonication (20 kHz, 8 W/cm2). For each graph, the Eq conc line is the solubility curve of benzoic acid [45].

Figure 7.
Optical micrographs of sonocrystallization and sonofragmentation of ice dendrites in a 15 wt % sucrose solution using 67 kHz ultrasound in a custom optical microscope chamber. (a) Primary nucleation and crystal growth (no ultrasound), (b) flow patterns and breakage of ice dendrites after 1.36 s of sonication, (c) sonofragmentation of ice crystals after 2.38 s of sonication, and (d) secondary nucleation and crystal growth after 17.38 s of sonication [51].

Figure 8.
Variation of composition of CaCO3 polymorphs under sonication (20 kHz): (a) the effect of intensity of ultrasound with 30 min of sonication, and (b) the effect of sonication time with 13 W/cm2 of sonication [58].
Figure 8.
Variation of composition of CaCO3 polymorphs under sonication (20 kHz): (a) the effect of intensity of ultrasound with 30 min of sonication, and (b) the effect of sonication time with 13 W/cm2 of sonication [58].

Figure 9.
Optical microscopic images of paracetamol polymorphs: (a) form I produced by stirring (150 rpm), (b) form II generated via ultrasonic irradiation with 28 kHz, and (c) form II crystallized via ultrasonic irradiation with 45 kHz [59].
Figure 9.
Optical microscopic images of paracetamol polymorphs: (a) form I produced by stirring (150 rpm), (b) form II generated via ultrasonic irradiation with 28 kHz, and (c) form II crystallized via ultrasonic irradiation with 45 kHz [59].

Figure 10.
The effect of frequency of ultrasound on crystal size of liposomes. The ultrasonic power was 8 W/cm2, and the frequencies were 43 kHz (○), 133 kHz (□), and 480 kHz (◊) [69].
Figure 10.
The effect of frequency of ultrasound on crystal size of liposomes. The ultrasonic power was 8 W/cm2, and the frequencies were 43 kHz (○), 133 kHz (□), and 480 kHz (◊) [69].

Figure 11.
The effect of ultrasound frequency on reduction of the MZW of paracetamol. The amount of reduced MZW is the difference of MZW of cooling crystallization of paracetamol without and with sonication (8 W/cm2). The cooling crystallization and cooling sonocrystallization experiments were performed at least three times for each frequency. The dots are the average reduction of MZW and the error bars are the standard deviations [70].

Figure 12.
Effect of sonication time on particle size and size distribution of adipic acid. For sonication experiments, the adipic acid solution was sonicated at 20 kHz and 8.5 W/cm2. For the control experiment, stirring was performed with a magnetic stirring bar (200 rpm) [76].
Figure 12.
Effect of sonication time on particle size and size distribution of adipic acid. For sonication experiments, the adipic acid solution was sonicated at 20 kHz and 8.5 W/cm2. For the control experiment, stirring was performed with a magnetic stirring bar (200 rpm) [76].

Figure 13.
Different types of ultrasound generators: (a) ultrasonic bath [77], (b) ultrasonic horn [78], and (c) ultrasonic plate transducer [79].

Figure 14.
Large-scale tubular flow-through ultrasonic reactors have been in use commercially. (a) Schematic of the design of a flow reactor and (b) photograph of a 20-L flow cell with 40 bonded transducers from C3 Technology [29].
Figure 14.
Large-scale tubular flow-through ultrasonic reactors have been in use commercially. (a) Schematic of the design of a flow reactor and (b) photograph of a 20-L flow cell with 40 bonded transducers from C3 Technology [29].

Figure 15.
SEM image of zinc particles after sonication. 20 wt % of zinc slurry was sonicated by an ultrasonic horn (20 kHz and 50 W/cm2) for 30 min. Localized melting was caused by high-velocity interparticle collisions and particles were agglomerated [16,17].

Figure 16.
Effect of quantity of particle loading on final particle size after sonication for 10 s. Ultrasound was 20 kHz and 5.5 W/cm2. All masses were dispersed in 5 mL of dodecane [19].
Figure 16.
Effect of quantity of particle loading on final particle size after sonication for 10 s. Ultrasound was 20 kHz and 5.5 W/cm2. All masses were dispersed in 5 mL of dodecane [19].

Figure 17.
Relationship between (a) Vickers hardness (Hv) and the time necessary to halve the initial crystal size (τ1/2) and between (b) Young’s modulus (E) and the time necessary to halve the initial crystal size (τ1/2). The dashed lines are linear fits [92].
Figure 17.
Relationship between (a) Vickers hardness (Hv) and the time necessary to halve the initial crystal size (τ1/2) and between (b) Young’s modulus (E) and the time necessary to halve the initial crystal size (τ1/2). The dashed lines are linear fits [92].

Figure 18.
Experimental (•) and simulated (—) cumulative mass fractions for trials of one minute of sonication of aspirin crystals using silicone oils of different viscosities, as labeled [93].
Figure 18.
Experimental (•) and simulated (—) cumulative mass fractions for trials of one minute of sonication of aspirin crystals using silicone oils of different viscosities, as labeled [93].

Figure 19.
Microscopic images of several pharmaceutical agents generated by sonocrystallization. Optical microscopic images of (a) acetylsalicylic acid [100] and (b) paracetamol [60]. SEM images of (c) phenacetin [72] and (d) carbamazepine [101].

Figure 20.
Characterizations of zinc oxide nanocrystals produced by sonocrystallization: particle size distribution, electron diffraction pattern, and TEM images [111].
Figure 20.
Characterizations of zinc oxide nanocrystals produced by sonocrystallization: particle size distribution, electron diffraction pattern, and TEM images [111].

Figure 21.
N-lauroyl-l-glutamic acid di-n-butylamide (GP-1) nanostructures generated without sonication or with sonication: SEM images of GP-1 (a) spherulitic structures produced without sonication and (b) 3D interconnected fiber network structures with 1 min of sonication, and (c) storage modulus of the 2 wt % GP-1/polypropylene glycol gels formed without ultrasound (□) and with ultrasound (■), respectively. Scale bars are 500 nm [112].

Figure 22.
(Left) SEM images of perylene diimide (PDI) nanowire produced by (a) cooling crystallization without ultrasonic irradiation and (b) sonocrystallization in the presence of ultrasound; for the sonocrystallization, the PDI solution was irradiated with 35 kHz of ultrasound for 2 h [113].
Figure 22.
(Left) SEM images of perylene diimide (PDI) nanowire produced by (a) cooling crystallization without ultrasonic irradiation and (b) sonocrystallization in the presence of ultrasound; for the sonocrystallization, the PDI solution was irradiated with 35 kHz of ultrasound for 2 h [113].

© 2018 by the authors. Licensee MDPI, Basel, Switzerland. This article is an open access article distributed under the terms and conditions of the Creative Commons Attribution (CC BY) license (http://creativecommons.org/licenses/by/4.0/).
Share and Cite
MDPI and ACS Style
Kim, H.N.; Suslick, K.S. The Effects of Ultrasound on Crystals: Sonocrystallization and Sonofragmentation. Crystals 2018, 8, 280. https://doi.org/10.3390/cryst8070280
AMA Style
Kim HN, Suslick KS. The Effects of Ultrasound on Crystals: Sonocrystallization and Sonofragmentation. Crystals. 2018; 8(7):280. https://doi.org/10.3390/cryst8070280
Chicago/Turabian StyleKim, Hyo Na, and Kenneth S. Suslick. 2018. "The Effects of Ultrasound on Crystals: Sonocrystallization and Sonofragmentation" Crystals 8, no. 7: 280. https://doi.org/10.3390/cryst8070280
Note that from the first issue of 2016, this journal uses article numbers instead of page numbers. See further details here.