The Model for Early COvid-19 Recognition (MECOR) Score: A Proof-of-Concept for a Simple and Low-Cost Tool to Recognize a Possible Viral Etiology in Community-Acquired Pneumonia Patients during COVID-19 Outbreak

 , , , , , , , , , ,
  add
Show full author list
add
Show full author list
Abstract
:
1. Introduction
2. Materials and Methods
2.1. Inclusion Criteria
2.2. Exclusion Criteria
2.3. Patient Data Collection
2.4. Statistical Analysis
3. Results
3.1. Model Analysis
3.2. MECOR Score Application in the Validation Cohort
3.3. Online Calculator
4. Discussion
4.1. Behind the Pathophysiology of COVID-19 White Blood Cell Signature
4.2. Study Limitations
4.3. The MECOR Score in Real-Life and Study Strenghts
5. Conclusions
Author Contributions
Funding
Conflicts of Interest
Abbreviations
| AIC | Akaike Information criterion |
| AUROC | Area Under Receiver-Operating Curve |
| BAL | Broncho-Alveolar Lavage |
| BIC | Bayesian Information Criterion |
| CAP | Community-Acquired Pneumonia (CAP) |
| COVID-19 | COronaVirus Disease 2019 |
| EOS | Eosinophils |
| ER | Emergency Rooms (ER) |
| HRCT | High-Resolution Computed Tomography |
| LP | Linear predictor |
| LR | Likehood Ratio |
| LYM | Lymphocytes |
| MECOR | Model for Early COvid-19 Recognition |
| MON | Monocytes |
| MPO | Myeloperoxidase |
| NET | Neutrophil Extracellular Trap |
| NEUT | Neutrophils |
| NLR | Neutrophil-to-Lymphocyte Ratio (NLR) |
| NPV | Negative Predictive Value |
| PLT | platelets |
| PPV | Positive Predictive Value |
| RT-PCR | real-time reverse-transcription polymerase chain reaction |
| SARS-CoV-2 | Severe Acute Respiratory Syndrome-CoronaVirus 2 |
| VIC | Cariance inflaction factor |
| WBC | White Blood Cells |
| WHO | World Health Organization |
References
- Lai, C.C.; Liu, Y.H.; Wang, C.Y.; Wang, Y.H.; Hsueh, S.C.; Yen, M.Y.; Ko, W.C.; Hsueh, P.R. Asymptomatic carrier state, acute respiratory disease, and pneumonia due to severe acute respiratory syndrome coronavirus 2 (SARS-CoV-2): Facts and myths. J. Microbiol. Immunol. 2020, 53, 404–412. [Google Scholar] [CrossRef] [PubMed]
- Winichakoon, P.; Chairwarith, R.; Liwsrisakun, C.; Salee, P.; Goonna, A.; Limsukon, A.; Kaewpoowat, Q. Negative Nasopharyngeal and Oropharingeal swabs do not rule out COVID-19. J. Clin. Microbiol. 2020, 58, e00297-20. [Google Scholar] [CrossRef] [PubMed] [Green Version]
- Yang, Y.; Yang, M.; Shen, C.; Wang, F.; Yuan, J.; Li, J.; Zhang, M.; Wang, Z.; Xing, L.; Wei, J.; et al. Evaluating the Accuracy of Different Respiratory Specimens in the Laboratory Diagnosis and Monitoring the Viral Shedding of 2019-nCoV Infections. Available online: https://www.medrxiv.org/content/10.1101/2020.02.11.20021493v2.full.pdf (accessed on 26 June 2020).
- Zhang, W.; Du, R.H.; Li, B.; Zheng, X.S.; Yang, X.S.; Hu, B.; Wang, Y.Y.; Ziao, G.F.; Yan, B.; Shi, Z.L.; et al. Molecular and serological investigation of 2019-nCoV infected patients: Implication of multiple shedding routes. Emerg. Microbes Infect. 2020, 17, 386–389. [Google Scholar] [CrossRef] [PubMed] [Green Version]
- De Jager, C.P.C.; Wever, P.C.; Gemen, E.F.A.; Kusters, R.; Van Gageldonk-Lafeber, A.B.; Van Der Poll, T.; Laheij, R.J.F. The Neutrophil-Lymphocyte Count Ratio in Patients with Community-Acquired Pneumonia. PLoS ONE 2012, 7, e46561. [Google Scholar] [CrossRef] [PubMed]
- Uslu, A.U.; Kucuk, A.; Sahin, A.; Ugan, Y.; Yilmaz, R.; Gungor, T.; Bagcaci, S.; Kucuksen, S. Two new inflammatory markers associated with disease activity Score-28 in patients with rheumatoid arthritis: Neutrophil-lymphocyte ratio and platelet-lymphocyte ratio. Int. J. Rheum. Dis. 2015, 18, 731–735. [Google Scholar] [CrossRef]
- Hasselbalch, I.C.; Sondergaard, H.B.; Koch-Henriksen, N.; Olsson, A.; Ullum, H.; Sellebjerg, F.; Oturai, A.B. The Neutrophil-to-lymphocyte ratio is associated with multiple sclerosis. Mult. Scler. J. Exp. Transl. Clin. 2018, 4, 2055217318813183. [Google Scholar] [CrossRef] [Green Version]
- Yayla, M.E.; Ilgen, U.; Okatan, I.E.; Uslu Yurteri, E.; Torgutalp, M.; Kelesoglu Dincer, A.B.; Aydemir Guloksuz, E.G.; Sezer, S.; Turgay, T.M.; Kinikli, G.; et al. Association of simple haematological parameters with disease manifestations, activity, and severity in patients with systemic sclerosis. Clin. Rheumatol. 2020, 39, 77–83. [Google Scholar] [CrossRef]
- Cataudella, E.; Giraffa, C.M.; Di Marca, S.; Pulvirenti, A.; Alaimo, S.; Pisano, M.; Terranova, V.; Corriere, T.; Ronsisvalle, M.L.; Di Quattro, R.; et al. Neutrophil-to-Lymphocyte Ratio: An emerging marker predicting prognosis in elderly adults with Community-Acquired Pneumonia. J. Am. Geriatr. Soc. 2017, 65, 1796–1801. [Google Scholar] [CrossRef]
- Corriere, T.; Di Marca, S.; Cataudella, E.; Pulvirenti, A.; Alaimo, S.; Stancanelli, B.; Malatino, L. Neutrophil-to-Lymphocyte Ratio is a strong predictor of atherosclerotic carotid plaques in older adults. Nutr. Metab. Cardiovasc. Dis. 2018, 28, 23–27. [Google Scholar] [CrossRef]
- Banna, G.L.; Di Quattro, R.; Malatino, L.; Fornarini, G.; Addeo, A.; Maruzzo, M.; Urzia, V.; Rungo, F.; Lipari, H.; De Giorgi, U.; et al. Neutrophil-to-lymphocyte ratio and lactate dehydrogenase as biomarkers for urothelial cancer treated with immunotherapy. Clin. Transl. Oncol. 2020. [Google Scholar] [CrossRef]
- Yang, A.P.; Liu, J.; Tao, W.Q.; Li, H.M. The diagnostic and predictive role of NLR, d-NLR and PLR in COVID-19 patients. Int. Immunopharmacol. 2020, 84, 106504. [Google Scholar] [CrossRef] [PubMed]
- Liu, F.; Xu, A.; Zhang, Y.; Xuan, W.; Yan, T.; Pan, K.; Yu, W.; Zhang, J. Patients of COVID-19 may benefit from sustained lopinavir-combined regimen and the increase of eosinophil may predict the outcome of COVID-19 progression. Int. J. Infect. Dis. 2020, 95, 183–191. [Google Scholar] [CrossRef] [PubMed]
- Tan, L.; Wang, Q.; Zhang, D.; Ding, J.; Huang, Q.; Tang, Y.Q.; Wang, Q.; Miao, H. Lymphopenia predicts disease severity of COVID-19: A descriptive and predictive study. Signal Transduct. Target Ther. 2020, 5, 33. [Google Scholar] [CrossRef] [PubMed]
- Zhang, J.J.; Dong, X.; Cao, Y.Y.; Yuan, Y.D.; Yang, Y.B.; Yan, Y.Q.; Akdis, C.A.; Gao, Y.D. Clinical characteristics of 140 patients infected with SARS-CoV-2 in Wuhan, China. Allergy 2020, 75, 1730–1741. [Google Scholar] [CrossRef] [PubMed]
- Pencina, M.J.; Demler, O.V. Novel metrics for evaluating improvement in discrimination: Net reclassification and integrated discrimination improvement for normal variables and nested models. Stat. Med. 2012, 31, 101–113. [Google Scholar] [CrossRef] [Green Version]
- Harrel, F.E.; Lee, K.L.; Mark, D.B. Multivariable prognostic models: Issues in developing models, evaluating assumptions and adequacy, and measuring and reducing errors. Stat. Med. 1996, 15, 361–387. [Google Scholar] [CrossRef]
- Rogerson, P.A. Statistical Methods for Geography; SAGE Publications Ltd.: London, UK, 2001; ISBN -13 978-1446295731. [Google Scholar]
- Hanley, J.A.; McNeil, B.J. The meaning and use of the area under a receiver operating characteristic (ROC) curve. Radiology 1982, 143, 29–36. [Google Scholar] [CrossRef] [Green Version]
- Youden, W.J. Index for rating diagnostic tests. Cancer 1950, 3, 32–35. [Google Scholar] [CrossRef]
- Fu, J.; Kong, J.; Wang, W.; Wu, M.; Yao, L.; Wang, Z.; Jin, J.; Wu, D.; Yu, X. The clinical implication of dynamic Neutrophil to lymphocyte ratio and D-dimer in COVID-19: A retrospective study in Suzhou China. Thromb. Res. 2020, 192, 3–8. [Google Scholar] [CrossRef]
- Huang, K.J.; Su, I.J.; Theron, M.; Wu, Y.C.; Lai, S.K.; Liu, C.C.; Lei, H.Y. An Interferon-gamma-related cytokine storm in SARS patients. J. Med. Virol. 2005, 75, 185–194. [Google Scholar] [CrossRef]
- De Bruin, A.M.; Buitenhuis, M.; Van der Sluijs, K.F.; Van Gisbergen, K.P.; Boon, L.; Nolte, M.A. Eosinophil differentiation in the bone marrow is inhibited by T cell-derived IFN-gamma. Blood 2010, 116, 2559–2569. [Google Scholar] [CrossRef] [PubMed] [Green Version]
- Zhou, Y.G.; Fu, B.Q.; Zheng, X.H.; Wang, D.S.; Zhao, C.C.; Qi, Y.J.; Sun, R.; Tian, Z.G.; Xu, X.L.; Wei, H.M. Pathogenic T cells and inflammatory monocytes incite inflammatory storm in severe COVID-19 patients. Natl. Sci. Rev. 2020, 7, 998–1002. [Google Scholar] [CrossRef] [Green Version]
- Fu, B.; Xu, X.; Wei, H. Why tocilizumab could be an effective treatment for severe COVID-19? J. Transl. Med. 2020, 18, 164. [Google Scholar] [CrossRef] [PubMed] [Green Version]
- Pascutti, M.F.; Erkelens, M.N.; Nolte, M.A. Impact of viral infections on hematopoiesis: From beneficial to detrimental effects on bone marrow output. Front. Immunol. 2016, 7, 364. [Google Scholar] [CrossRef] [Green Version]
- Yang, M.; Ng, M.H.; Li, C.K. Thrombocytopenia in patients with severe acute respiratory syndrome (review). Hematology 2005, 10, 101–105. [Google Scholar] [CrossRef] [Green Version]
- Zini, G.; Bellesi, S.; Ramundo, F.; D’Onofrio, G. Morphological anomalies of circulating blood cells in COVID-19. Am. J. Hematol. 2020, 95, 870–872. [Google Scholar] [CrossRef] [Green Version]
- Zuo, Y.; Yalavarthi, S.; Shi, H.; Gockman, K.; Zuo, M.; Madison, J.A.; Blair, C.N.; Weber, A.; Barnes, B.J.; Egeblad, M.; et al. Neutrophil extracellular traps in COVID-19. JCI Insight 2020, 5, e138999. [Google Scholar] [CrossRef] [Green Version]
- Del Papa, N.; Sambataro, G.; Minniti, A.; Pignataro, F.; Caporali, R. Novel COronaVIrus Disease 2019 (COVID-19) epidemic: What are the risks for systemic sclerosis patients? Autoimmun. Rev. 2020, 19, 102558. [Google Scholar] [CrossRef]
- Jain, S.; Self, W.H.; Wunderink, R.G.; Fakhran, S.; Balk, R.; Bramley, A.M.; Reed, C.; Grijalva, C.G.; Anderson, E.J.; Courtney, D.M.; et al. Community-acquired Pneumonia requiring Hospitalization among U.S. adults. N. Eng. J. Med. 2015, 373, 415–427. [Google Scholar] [CrossRef] [Green Version]
- Skipper, C.; Pastick, K.A.; Engen, N.W.; Bangdiwala, A.S.; Abassi, M.; Lofgren, S.M.; Williams, D.A.; Okafor, E.C.; Pullen, M.F.; Nicol, M.R.; et al. Hydroxychloroquine in Nonhospitalized Adults With Early COVID-19: A Randomized Trial. Ann. Intern. Med. 2020. [Google Scholar] [CrossRef]
- Mei, X.; Lee, H.C.; Diao, K.Y.; Huang, M.; Lin, B.; Liu, C.; Xie, Z.; Ma, Y.; Robson, P.M.; Chung, M.; et al. Artificial Intelligence-enabled rapid diagnosis of patients with COVID-19. Nat. Med. 2020, 26, 1224–1228. [Google Scholar] [CrossRef] [PubMed]
- Woloshin, S.; Patel, N.; Kesselheim, A.S. False Negative Tests for SARS-CoV-2 Infection- Challenges and Implications. N. Eng. J. Med. 2020, 383, e38. [Google Scholar] [CrossRef] [PubMed]
- Giuffrè, M.; Macor, D.; Masutti, F.; Abazia, C.; Tinè, F.; Bedogni, G.; Tiribelli, C.; Crocè, L.S. Spleen Stiffness Probability Index (SSPI): A simple and accurate method to detect esophageal varices in patients with compensated liver cirrhosis. Ann. Hepatol. 2020, 19, 53–61. [Google Scholar] [CrossRef] [PubMed]


| Training Cohortn n = 525 | Validation Cohortn n = 250 | Significance | |
|---|---|---|---|
| Gender, Male (n, %) | 331 (63%) | 164 (65.6%) | NS |
| Age (years), Median (IQR) | 64 (52–77) | 63 (53–77) | NS |
| SARS-CoV-2 Positive Individuals, (n, %) | 283 (53.9%) | 135 (54%) | NS |
| CAP Pathogen | NE | ||
| Nonidentified | 138 (57.1%) | 69 (60%) | |
| Streptococcus. pneumoniae | 35 (14.5%) | 15 (13%) | |
| Klebsiella pneumoniae | 20 (8.3%) | 8 (7%) | |
| Mycoplasma pneumoniae | 14 (5.8%) | 6 (5.2%) | |
| Influenza | 12 (5%) | 7 (6%) | |
| Mycobaterium tuberculosis | 6 (2.5%) | 3 (2.6%) | |
| Legionella. pneumophila | 5 (2%) | 2 (1.7%) | |
| Metapneumovirus | 3 (1.2%) | 1 (0.9%) | |
| Chlamydia spp. | 2 (0.82%) | 1 (0.9%) | |
| Haemophiluls influenzae | 2 (0.82%) | 1 (0.9%) | |
| Staphilococcus aureus | 2 (0.82%) | 1 (0.9%) | |
| Pseudomonas aeruginosa | 2 (0.82%) | 1 (0.9%) | |
| Adenovirus | 1 (0.41%) | 0 (0%) | |
| WBC (cells/mm3), Median (IQR) | 7900 (5400–12,080) | 7800 (5300–11,800) | NS |
| NEUT (cells/mm3), Median (IQR) | 6000 (3720–9520) | 5910 (3600–9630) | NS |
| LYM (cells/mm3), Median (IQR) | 970 (640–1470) | 1010 (630–1495) | NS |
| MON (cells/mm3), Median (IQR) | 510 (340–840) | 530 (350–830) | NS |
| EOS (cells/mm3), Median (IQR) | 0 (0–50) | 0 (0–60) | NS |
| PLT (cells/µL), Median (IQR) | 221,000 (159,000–295,000) | 210,000 (156,000–294,000) | NS |
| Training Cohort | |||
| SARS-CoV-2 Negative n = 242 | SARS-CoV-2 Positive n = 283 | Significance | |
| Gender, Male (n, %) | 154 (63.6%) | 177 (62.5%) | NS |
| Age (years), Median (IQR) | 66 (50–79) | 68 (57–77) | NS |
| WBC (cells/mm3), Median (IQR) | 11,465 (8205–15,475) | 5930 (4305–80,100) | p < 0.001 |
| Patients with WBC < 4000 (cells/mm3), (n, %) | 7 (2.9%) | 60 (21.2%) | p < 0.001 |
| NEUT (cells/mm3), Median (IQR) | 8925 (5985–12,675) | 4300 (2980–6415) | p < 0.001 |
| Patients with NEUT < 1500 (cells/mm3), (n, %) | 5 (2.1%) | 9 (3.2%) | NS |
| LYM (cells/mm3), Median (IQR) | 1185 (820–1768) | 830 (505–1200) | p < 0.001 |
| Patients with LYM < 1000 (cells/mm3), (n, %) | 92 (38%) | 178 (62.9%) | p < 0.001 |
| MON (cells/mm3), Median (IQR) | 755 (450–1048) | 430 (300–600) | p < 0.001 |
| Patients with MON < 200 (cells/mm3), (n, %) | 11 (4.5%) | 18 (6.4%) | NS |
| EOS (cells/mm3), Median (IQR) | 20 (0–98) | 0 (0–10) | p < 0.001 |
| Patients with EOS < 50 (cells/mm3), (n, %) | 151 (62.4%) | 237 (83.7%) | p < 0.001 |
| PLT (cells/µL), Median (IQR) | 251,000 (191,000–330,000) | 186,000 (144,500–258,000) | p < 0.001 |
| Patients with PLT < 150,000 (cells/µL), (n, %) | 33 (13.6%) | 77 (27.2%) | p = 0.001 |
| Validation Cohort | |||
| SARS-Co-2V Negative n = 115 | SARS-CoV-2 Positive n = 135 | Significance | |
| Gender, Male (n, %) | 74 (64.3%) | 90 (66.6%) | NS |
| Age (years), Median (IQR) | 67 (55–77) | 70 (54–78) | NS |
| WBC (cells/mm3), Median (IQR) | 11,480 (8545–15,595) | 5800 (4345–7600) | p < 0.001 |
| Patients with WBC < 4000 (cells/mm3), (n, %) | 2 (1.7%) | 28 (20.7%) | p < 0.001 |
| NEUT (cells/mm3), Median (IQR) | 9190 (6325–12,865) | 4180 (2995–5900) | p < 0.001 |
| Patients with NEUT < 1500 (cells/mm3), (n, %) | 3 (2.6%) | 5 (3.7%) | NS |
| LYM (cells/mm3), Median (IQR) | 1190 (780–1810) | 880 (505–1200) | p < 0.001 |
| Patients with LYM < 1000 (cells/mm3), (n, %) | 44 (38.3%) | 78 (57.7%) | p = 0.002 |
| MON (cells/mm3), Median (IQR) | 770 (420–110) | 430 (305–600) | p < 0.001 |
| Patients with MON < 200 (cells/mm3), (n, %) | 9 (7.8%) | 9 (6.6%) | NS |
| EOS (cells/mm3), Median (IQR) | 30 (0–100) | 0 (0–20) | p < 0.001 |
| Patients with EOS < 50 (cells/mm3), (n, %) | 67 (58.2%) | 108 (80%) | p = 0.001 |
| PLT (cells/µL), Median (IQR) | 238,000 (184,500–317,000) | 181,000 (144,000–251,000) | p < 0.001 |
| Patients with PLT < 150,000 (cells/µL), (n, %) | 18 (15.6) | 37 (27.4%) | p = 0.025 |
| Univariate Analysis Training Set | (M1) WBC | (M2) NEUT | (M3) LYM | (M4) MON | (M5) EOS | (M6) PLT |
|---|---|---|---|---|---|---|
| Intercept (β0) | 3.04 | 2.28 | 1.25 | 1.57 | 0.48 | 1.59 |
| Intercept (β0)—Standard Error | 0.28 | 0.23 | 0.19 | 0.19 | 0.1 | 0.24 |
| Intercept (β0)—Significance | p < 0.001 | p < 0.001 | p < 0.001 | p < 0.001 | p < 0.001 | p < 0.001 |
| Coefficient (β1) | −3.24 × 10⁻⁴ | −3.04 × 10⁻⁴ | −9.65 × 10⁻⁴ | −2.18 × 10⁻³ | −8 × 10⁻³ | −6 × 10⁻⁶ |
| Coefficient (β1)—Standard Error | 3.1 × 10⁻⁵ | 3.1 × 10⁻⁵ | 1.53 × 10⁻⁴ | 2.9 × 10⁻⁴ | 2 × 10⁻³ | 9.48 × 10⁻⁷ |
| Coefficient (β1)—Significance | p < 0.001 | p < 0.001 | p < 0.001 | p < 0.001 | p < 0.001 | p < 0.001 |
| AUROC | 0.82 (0.78–0.87) | 0.80 (0.76–0.83) | 0.68 (0.64–0.73) | 0.72 (0.67–0.76) | 0.71 (0.66–0.75) | 0.67 (0.66–0.75) |
| Nagelkerke Pseudo-R2 | 0.410 | 0.350 | 0.140 | 0.190 | 0.011 | 0.120 |
| Hosmer–Lemeshow p-Value | 0.032 | 0.178 | 0.782 | 0.090 | <0.001 | 0.450 |
| AIC | 538 | 572 | 668 | 649 | 684 | 679 |
| BIC | 546 | 580 | 677 | 657 | 692 | 689 |
| Multivariate Model | Variable 1 | Variable 2 | Variable 3 |
|---|---|---|---|
| VIF | 1.72 | 1.05 | 1.80 |
| Coefficient | −3.23 | −0.76 | 11.94 |
| Coefficient—Standard Error | 0.34 | 0.18 | 3.88 |
| Coefficient—Significance | p < 0.001 | p = 0.001 | p = 0.002 |
| Intercept | 18.47 | ||
| Intercept—Standard Error | 3.92 | ||
| Intercept—Significance | p < 0.001 | ||
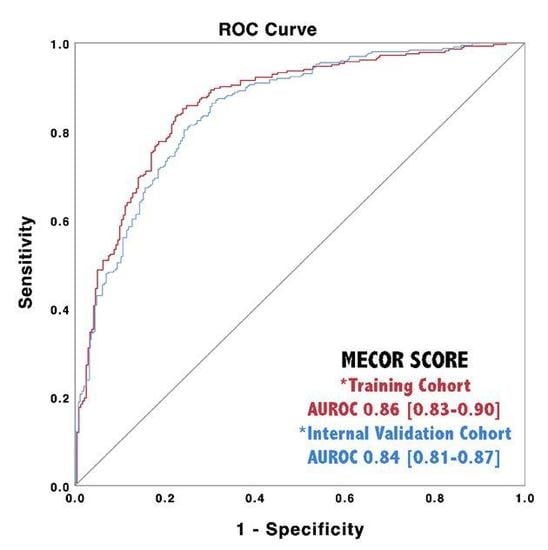
| AUROC | 0.86 (0.83; 0.90) | ||
| Nagelkerke Pseudo-R2 | 0.5 | ||
| Hosmer-Lemeshow p-Value | 0.9 | ||
| AIC | 516 | ||
| BIC | 533 | ||
| Cut-Off Parameter | Maximize Sensitivity ≤ −2.54 | Maximize Specificity ≥ +4 | Youden’s Index ≥ −0.13 | |||
|---|---|---|---|---|---|---|
| Training | Validation | Training | Validation | Training | Validation | |
| Sensitivity | 100 (99–100)% | 100 (92–100)% | 2 (0.5–5)% | 2 (0.5–7)% | 84 (78–88)% | 88 (81–93)% |
| Specificity | 10 (6–15)% | 12 (7–20)% | 100 (99–100)% | 100 (99–100)% | 72 (67–77)% | 73 (64–81)% |
| PPV | 56 (55–57)% | 58 (55–59)% | 100% | 100% | 78 (74–81)% | 79 (74–84)% |
| NPV | 100% | 100 % | 47 (46–48)% | 47 (45–48)% | 79 (73–83)% | 84 (76–90)% |
| +LR | 1.11 (1.06–1.16) | 1.14 (1.06–1.22) | 0 | 0 | 2.92 (2.38–3.59) | 3.27 (2.41–4.45) |
| −LR | 0 | 0 | 0.98 (0.97–1) | 0.98 (0.95–1) | 0.23 (0.18–0.31) | 0.16 (0.10–0.26) |
| Accuracy | 59 (54–63)% | 60 (60–66)% | 47 (42–52)% | 47 (40–54)% | 80 (76–84)% | 81 (76–86)% |
© 2020 by the authors. Licensee MDPI, Basel, Switzerland. This article is an open access article distributed under the terms and conditions of the Creative Commons Attribution (CC BY) license (http://creativecommons.org/licenses/by/4.0/).
Share and Cite
Sambataro, G.; Giuffrè, M.; Sambataro, D.; Palermo, A.; Vignigni, G.; Cesareo, R.; Crimi, N.; Torrisi, S.E.; Vancheri, C.; Malatino, L.; et al. The Model for Early COvid-19 Recognition (MECOR) Score: A Proof-of-Concept for a Simple and Low-Cost Tool to Recognize a Possible Viral Etiology in Community-Acquired Pneumonia Patients during COVID-19 Outbreak. Diagnostics 2020, 10, 619. https://doi.org/10.3390/diagnostics10090619
Sambataro G, Giuffrè M, Sambataro D, Palermo A, Vignigni G, Cesareo R, Crimi N, Torrisi SE, Vancheri C, Malatino L, et al. The Model for Early COvid-19 Recognition (MECOR) Score: A Proof-of-Concept for a Simple and Low-Cost Tool to Recognize a Possible Viral Etiology in Community-Acquired Pneumonia Patients during COVID-19 Outbreak. Diagnostics. 2020; 10(9):619. https://doi.org/10.3390/diagnostics10090619
Chicago/Turabian StyleSambataro, Gianluca, Mauro Giuffrè, Domenico Sambataro, Andrea Palermo, Giovanna Vignigni, Roberto Cesareo, Nunzio Crimi, Sebastiano Emanuele Torrisi, Carlo Vancheri, Lorenzo Malatino, and et al. 2020. "The Model for Early COvid-19 Recognition (MECOR) Score: A Proof-of-Concept for a Simple and Low-Cost Tool to Recognize a Possible Viral Etiology in Community-Acquired Pneumonia Patients during COVID-19 Outbreak" Diagnostics 10, no. 9: 619. https://doi.org/10.3390/diagnostics10090619