Evaluation of the Performance of 18F-Fluorothymidine Positron Emission Tomography/Computed Tomography (18F-FLT-PET/CT) in Metastatic Brain Lesions


Abstract
:1. Introduction
2. Materials and Methods
2.1. Patients
2.2. 18F-FLT-PET/CT
2.3. Statistical Analysis
3. Results
4. Discussion
5. Conclusions
Author Contributions
Acknowledgments
Conflicts of Interest
References
- Crippa, F.; Alessi, A.; Serafini, G.L. PET with radiolabeled aminoacid. Quat. J. Nucl. Med. Mol. Imaging 2012, 56, 151–162. [Google Scholar]
- Tsitsia, V.; Svolou, P.; Kapsalaki, E.; Theodorou, K.; Vassiou, K.; Valotassiou, V.; Georgoulias, P.; Fezoulidis, I.; Tsougos, I. Multimodality-multiparametric brain tumors evaluation. Hell. J. Nucl. Med. 2017, 20, 57–61. [Google Scholar]
- Wang, W.; Hu, Y.; Lu, P.; Li, Y.; Chen, Y.; Tian, M.; Yu, L. Evaluation of the diagnostic performance of magnetic resonance spectroscopy in brain tumors: A systematic review and meta-analysis. PLoS ONE 2014, 9, e112577. [Google Scholar] [CrossRef]
- Mertens, K.; Slaets, D.; Lambert, B.; Acou, M.; De Vos, F.; Goethals, I. PET with (18)F-labelled choline-based tracers for tumour imaging: A review of the literature. Eur. J. Nucl. Med. Mol. Imaging 2010, 37, 2188–2193. [Google Scholar] [CrossRef]
- Quartuccio, N.; Asselin, M.C. The validation path of hypoxia PET imaging: Focus on brain tumours. Curr. Med. Chem. 2018, 25, 3074–3095. [Google Scholar] [CrossRef]
- Idema, A.J.; Hoffmann, A.L.; Boogaarts, H.D.; Troost, E.G.; Wesseling, P.; Heerschap, A.; van der Graaf, W.T.; Grotenhuis, J.A.; Oyen, W.J. 3′-Deoxy-3′-18F-fluorothymidine PET-derived proliferative volume predicts overall survival in high-grade glioma patients. J. Nucl. Med. 2012, 53, 1904–1910. [Google Scholar] [CrossRef]
- Nikaki, A.; Angelidis, G.; Efthimiadou, R.; Tsougos, I.; Valotassiou, V.; Fountas, K.; Prasopoulos, V.; Georgoulias, P. 18F-fluorothymidine PET imaging in gliomas: An update. Ann. Nucl. Med. 2017, 31, 495–505. [Google Scholar] [CrossRef]
- Muzi, M.; Spence, A.M.; O’Sullivan, F.; Mankoff, D.A.; Wells, J.M.; Grierson, J.R.; Link, J.M.; Krohn, K.A. Kinetic analysis of 3′-deoxy-3′-18F-fluorothymidine in patients with gliomas. J. Nucl. Med. 2006, 47, 1612–1621. [Google Scholar]
- Shinomiya, A.; Kawai, N.; Okada, M.; Miyake, K.; Nakamura, T.; Kushida, Y.; Haba, R.; Kudomi, N.; Yamamoto, Y.; Tokuda, M.; et al. Evaluation of 3′-deoxy-3′-[18F]-fluorothymidine (18F-FLT) kinetics correlated with thymidine kinase-1 expression and cell proliferation in newly diagnosed gliomas. Eur. J. Nucl. Med. Mol. Imaging 2013, 40, 175–185. [Google Scholar] [CrossRef]
- Ferdová, E.; Ferda, J.; Baxa, J.; Tupý, R.; Mraček, J.; Topolčan, O.; Hes, O. Assessment of grading in newly-diagnosed glioma using 18F-fluorothymidine PET/CT. Anticancer Res. 2015, 35, 955–959. [Google Scholar]
- Yamamoto, Y.; Ono, Y.; Aga, F.; Kawai, N.; Kudomi, N.; Nishiyama, Y. Correlation of 18F-FLT uptake with tumor grade and Ki-67 immunohistochemistry in patients with newly diagnosed and recurrent gliomas. J. Nucl. Med. 2012, 53, 1911–1915. [Google Scholar] [CrossRef]
- Jeong, S.Y.; Lee, T.H.; Rhee, C.H.; Cho, A.R.; Il Kim, B.; Cheon, G.J.; Choi, C.W.; Lim, S.M. 3′-Deoxy-3′-[(18)F]fluorothymidine and O-(2-[(18)F]fluoroethyl)-L-tyrosine PET in patients with suspicious recurrence of glioma after multimodal treatment: Initial results of a retrospective comparative study. Nucl. Med. Mol. Imaging 2010, 44, 45–54. [Google Scholar] [CrossRef]
- Chalkidou, A.; Landau, D.B.; Odell, E.W.; Cornelius, V.R.; O’Doherty, M.J.; Marsden, P.K. Correlation between Ki-67 immunohistochemistry and 18F-fluorothymidine uptake in patients with cancer: A systematic review and meta-analysis. Eur. J. Cancer 2012, 48, 3499–3513. [Google Scholar] [CrossRef]
- Chen, W.; Delaloye, S.; Silverman, D.H.; Geist, C.; Czernin, J.; Sayre, J.; Satyamurthy, N.; Pope, W.; Lai, A.; Phelps, M.E.; et al. Predicting treatment response of malignant gliomas to bevacizumab and irinotecan by imaging proliferation with [18F] fluorothymidine positron emission tomography: A pilot study. J. Clin. Oncol. 2007, 25, 4714–4721. [Google Scholar] [CrossRef]
- Peat, J.; Burton, B. Categorical and continuous variables: Diagnostic statistics. In Medical Statistics: A Guide to Data Analysis and Critical Appraisal; Blackwell Publishing: Hoboken, NY, USA, 2005; pp. 278–295. [Google Scholar]
- O’Sullivan, C.C.; Lindenberg, M.; Bryla, C.; Patronas, N.; Peer, C.J.; Amiri-Kordestani, L.; Davarpanah, N.; Gonzalez, E.M.; Burotto, M.; Choyke, P.; et al. ANG1005 for breast cancer brain metastases: Correlation between 18F-FLT-PET after first cycle and MRI in response assessment. Breast Cancer Res. Treat. 2016, 160, 51–59. [Google Scholar] [CrossRef]
- Hoshikawa, H.; Kishino, T.; Mori, T.; Nishiyama, Y.; Yamamoto, Y.; Mori, N. The value of 18F-FLT PET for detecting second primary cancers and distant metastases in head and neck cancer patients. Clin. Nucl. Med. 2013, 38, e318–e323. [Google Scholar] [CrossRef]
- Dittmann, H.; Dohmen, B.M.; Paulsen, F.; Eichhorn, K.; Eschmann, S.M.; Horger, M.; Wehrmann, M.; Machulla, H.J.; Bares, R. [18F]FLT PET for diagnosis and staging of thoracic tumours. Eur. J. Nucl. Med. Mol. Imaging 2003, 30, 1407–1412. [Google Scholar] [CrossRef]
- van der Hiel, B.; Haanen, J.B.A.G.; Stokkel, M.P.M.; Peeper, D.S.; Jimenez, C.R.; Beijnen, J.H.; van de Wiel, B.A.; Boellaard, R.; van den Eertwegh, A.J.M.; REPOSIT study group. Vemurafenib plus cobimetinib in unresectable stage IIIc or stage IV melanoma: Response monitoring and resistance prediction with positron emission tomography and tumor characteristics (REPOSIT): Study protocol of a phase II, open-label, multicenter study. BMC Cancer 2017, 17, 649. [Google Scholar] [CrossRef]
- Tixier, F.; Vriens, D.; Cheze-Le Rest, C.; Hatt, M.; Disselhorst, J.A.; Oyen, W.J.; de Geus-Oei, L.F.; Visser, E.P.; Visvikis, D. Comparison of tumor uptake heterogeneity characterization between static and parametric 18F-FDG PET images in non-small cell lung cancer. J. Nucl. Med. 2016, 57, 1033–1039. [Google Scholar] [CrossRef]
- Wahl, R.L.; Jacene, H.; Kasamon, Y.; Lodge, M.A. From RECIST to PERCIST: Evolving considerations for PET response criteria in solid tumors. J. Nucl. Med. 2009, 50, 122S–150S. [Google Scholar] [CrossRef]
- Jung, T.Y.; Kim, I.Y.; Lim, S.H.; Park, K.S.; Kim, D.Y.; Jung, S.; Moon, K.S.; Jang, W.Y.; Kang, S.R.; Cho, S.G.; et al. Optimization of diagnostic performance for differentiation of recurrence from radiation necrosis in patients with metastatic brain tumors using tumor volume-corrected 11C-methionine uptake. EJNMMI Res. 2017, 7, 45. [Google Scholar] [CrossRef]
- Yomo, S.; Oguchi, K. Prospective study of 11C-methionine PET for distinguishing between recurrent brain metastases and radiation necrosis: limitations of diagnostic accuracy and long-term results of salvage treatment. BMC Cancer 2017, 17, 713. [Google Scholar] [CrossRef]
- Unterrainer, M.; Galldiks, N.; Suchorska, B.; Kowalew, L.C.; Wenter, V.; Schmid-Tannwald, C.; Niyazi, M.; Bartenstein, P.; Langen, K.J.; Albert, N.L. 18F-FET PET uptake characteristics in patients with newly diagnosed and untreated brain metastasis. J. Nucl. Med. 2017, 58, 584–589. [Google Scholar] [CrossRef]
- Nguyen, N.C.; Yee, M.K.; Tuchayi, A.M.; Kirkwood, J.M.; Tawbi, H.; Mountz, J.M. Targeted therapy and immunotherapy response assessment with F-18 Fluorothymidine positron-emission tomography/magnetic resonance imaging in melanoma brain metastasis: A pilot study. Front. Oncol. 2018, 8, 18. [Google Scholar] [CrossRef]
- Heinzel, A.; Müller, D.; Yekta-Michael, S.S.; Ceccon, G.; Langen, K.J.; Mottaghy, F.M.; Wiesmann, M.; Kocher, M.; Hattingen, E.; Galldiks, N. O-(2-18F-fluoroethyl)-L-tyrosine PET for evaluation of brain metastasis recurrence after radiotherapy: An effectiveness and cost-effectiveness analysis. Neuro Oncol. 2017, 19, 1271–1278. [Google Scholar] [CrossRef]
- Romagna, A.; Unterrainer, M.; Schmid-Tannwald, C.; Brendel, M.; Tonn, J.C.; Nachbichler, S.B.; Muacevic, A.; Bartenstein, P.; Kreth, F.W.; Albert, N.L. Suspected recurrence of brain metastases after focused high dose radiotherapy: Can [18F]FET-PET overcome diagnostic uncertainties? Radiat. Oncol. 2016, 11, 139. [Google Scholar] [CrossRef]
- Rottenburger, C.; Hentschel, M.; Kelly, T.; Trippel, M.; Brink, I.; Reithmeier, T.; Meyer, P.T.; Nikkhah, G. Comparison of C-11 methionine and C-11 choline for PET imaging of brain metastases: A prospective pilot study. Clin. Nucl. Med. 2011, 36, 639–642. [Google Scholar] [CrossRef]


| Characteristics | No. |
|---|---|
| M/F | 9/5 |
| Age (y) (average, range) | 64, 40–83 |
| Primary disease | |
| (Per examination analysis) | |
| Lung | 9 |
| Breast | 7 |
| Melanoma | 2 |
| Thymoma | 2 |
| Treatments | |
| (per examination analysis) | |
| CMTx | 11 |
| RT | 16 |
| Surgical excision after RT | 1 |
| RT naive | 3 |
| Surgical excision | 6 |
| Treatment naive | 0 |
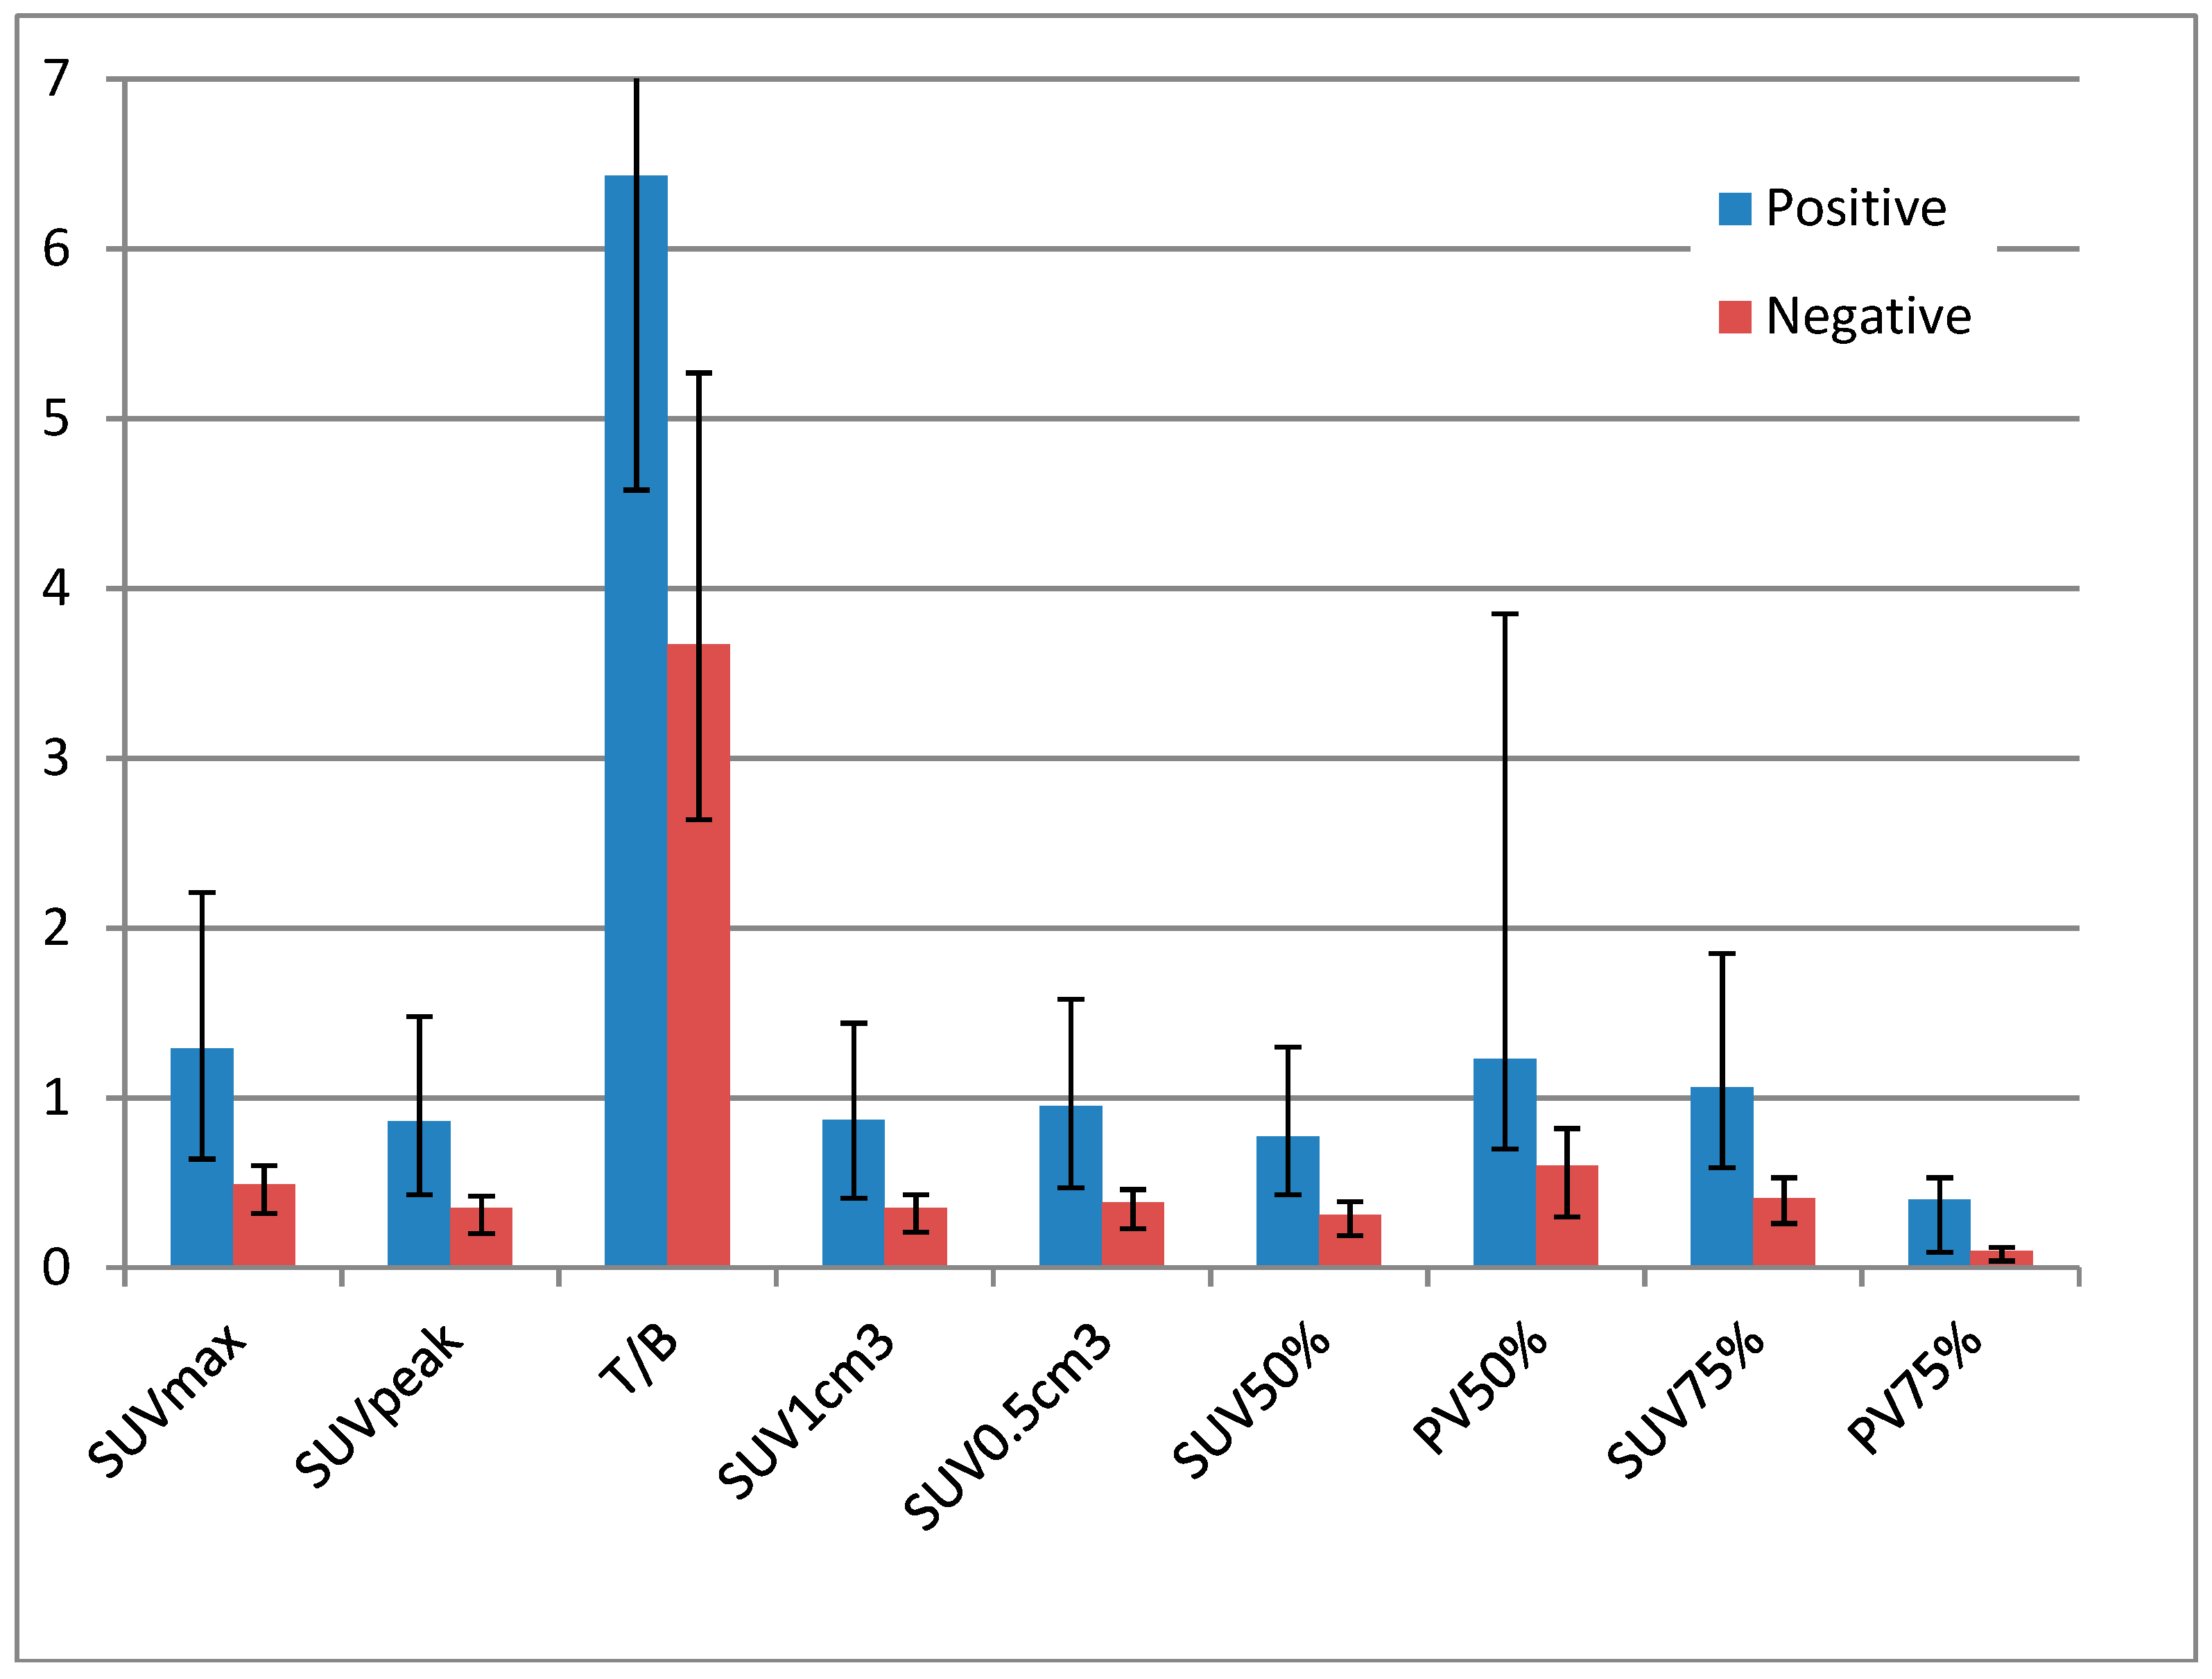
| Mean (SD) | p-Value (t-Test) | ||
|---|---|---|---|
| Negative | Positive | ||
| SUVmax | 0.625 (0.48) | 1.78 (1.57) | 0.003 |
| SUVpeak | 0.45 (0.41) | 1.17 (1.04) | 0.013 |
| T/B | 4.55 (2.76) | 9.88 (9.25) | 0.017 |
| SUV1cm3 | 0.46 (0.41) | 1.18 (1.08) | 0.014 |
| SUV0.5cm3 | 0.5 (0.43) | 1.34 (1.24) | 0.009 |
| SUV50% | 0.39 (0.3) | 1.13 (1.06) | 0.004 |
| PV50% | 1.85 (3.36) | 2.89 (3.75) | 0.52 |
| SUV75% | 0.52 (0.39) | 1.48 (1.33) | 0.003 |
| PV75% | 0.31 (0.58) | 0.56 (0.74) | 0.384 |
| Median (IQR) | Kruskall-Wallis | ||
|---|---|---|---|
| Negative | Positive | p-Value | |
| SUVmax | 0.49 (0.32–0.6) | 1.29 (0.635–2.21) | 0.017 |
| SUVpeak | 0.345 (0.2–0.42) | 0.86 (0.425–1.475) | 0.017 |
| T/B | 3.665 (2.64–5.27) | 6.43 (4.58–11.66) | 0.045 |
| SUV1cm3 | 0.35 (0.21–0.43) | 0.87 (0.41–1.435) | 0.032 |
| SUV0.5cm3 | 0.385 (0.23–0.46) | 0.95 (0.47–1.575) | 0.018 |
| SUV50% | 0.31 (0.19–0.39) | 0.77 (0.425–1.3) | 0.02 |
| PV50% | 0.604 (0.304–0.823) | 1.2284 (0.6991–3.85) | 0.123 |
| SUV75% | 0.41 (0.26–0.53) | 1.06 (0.59–1.85) | 0.02 |
| PV75% | 0.099 (0.036–0.1176) | 0.4 (0.09–0.53) | 0.112 |
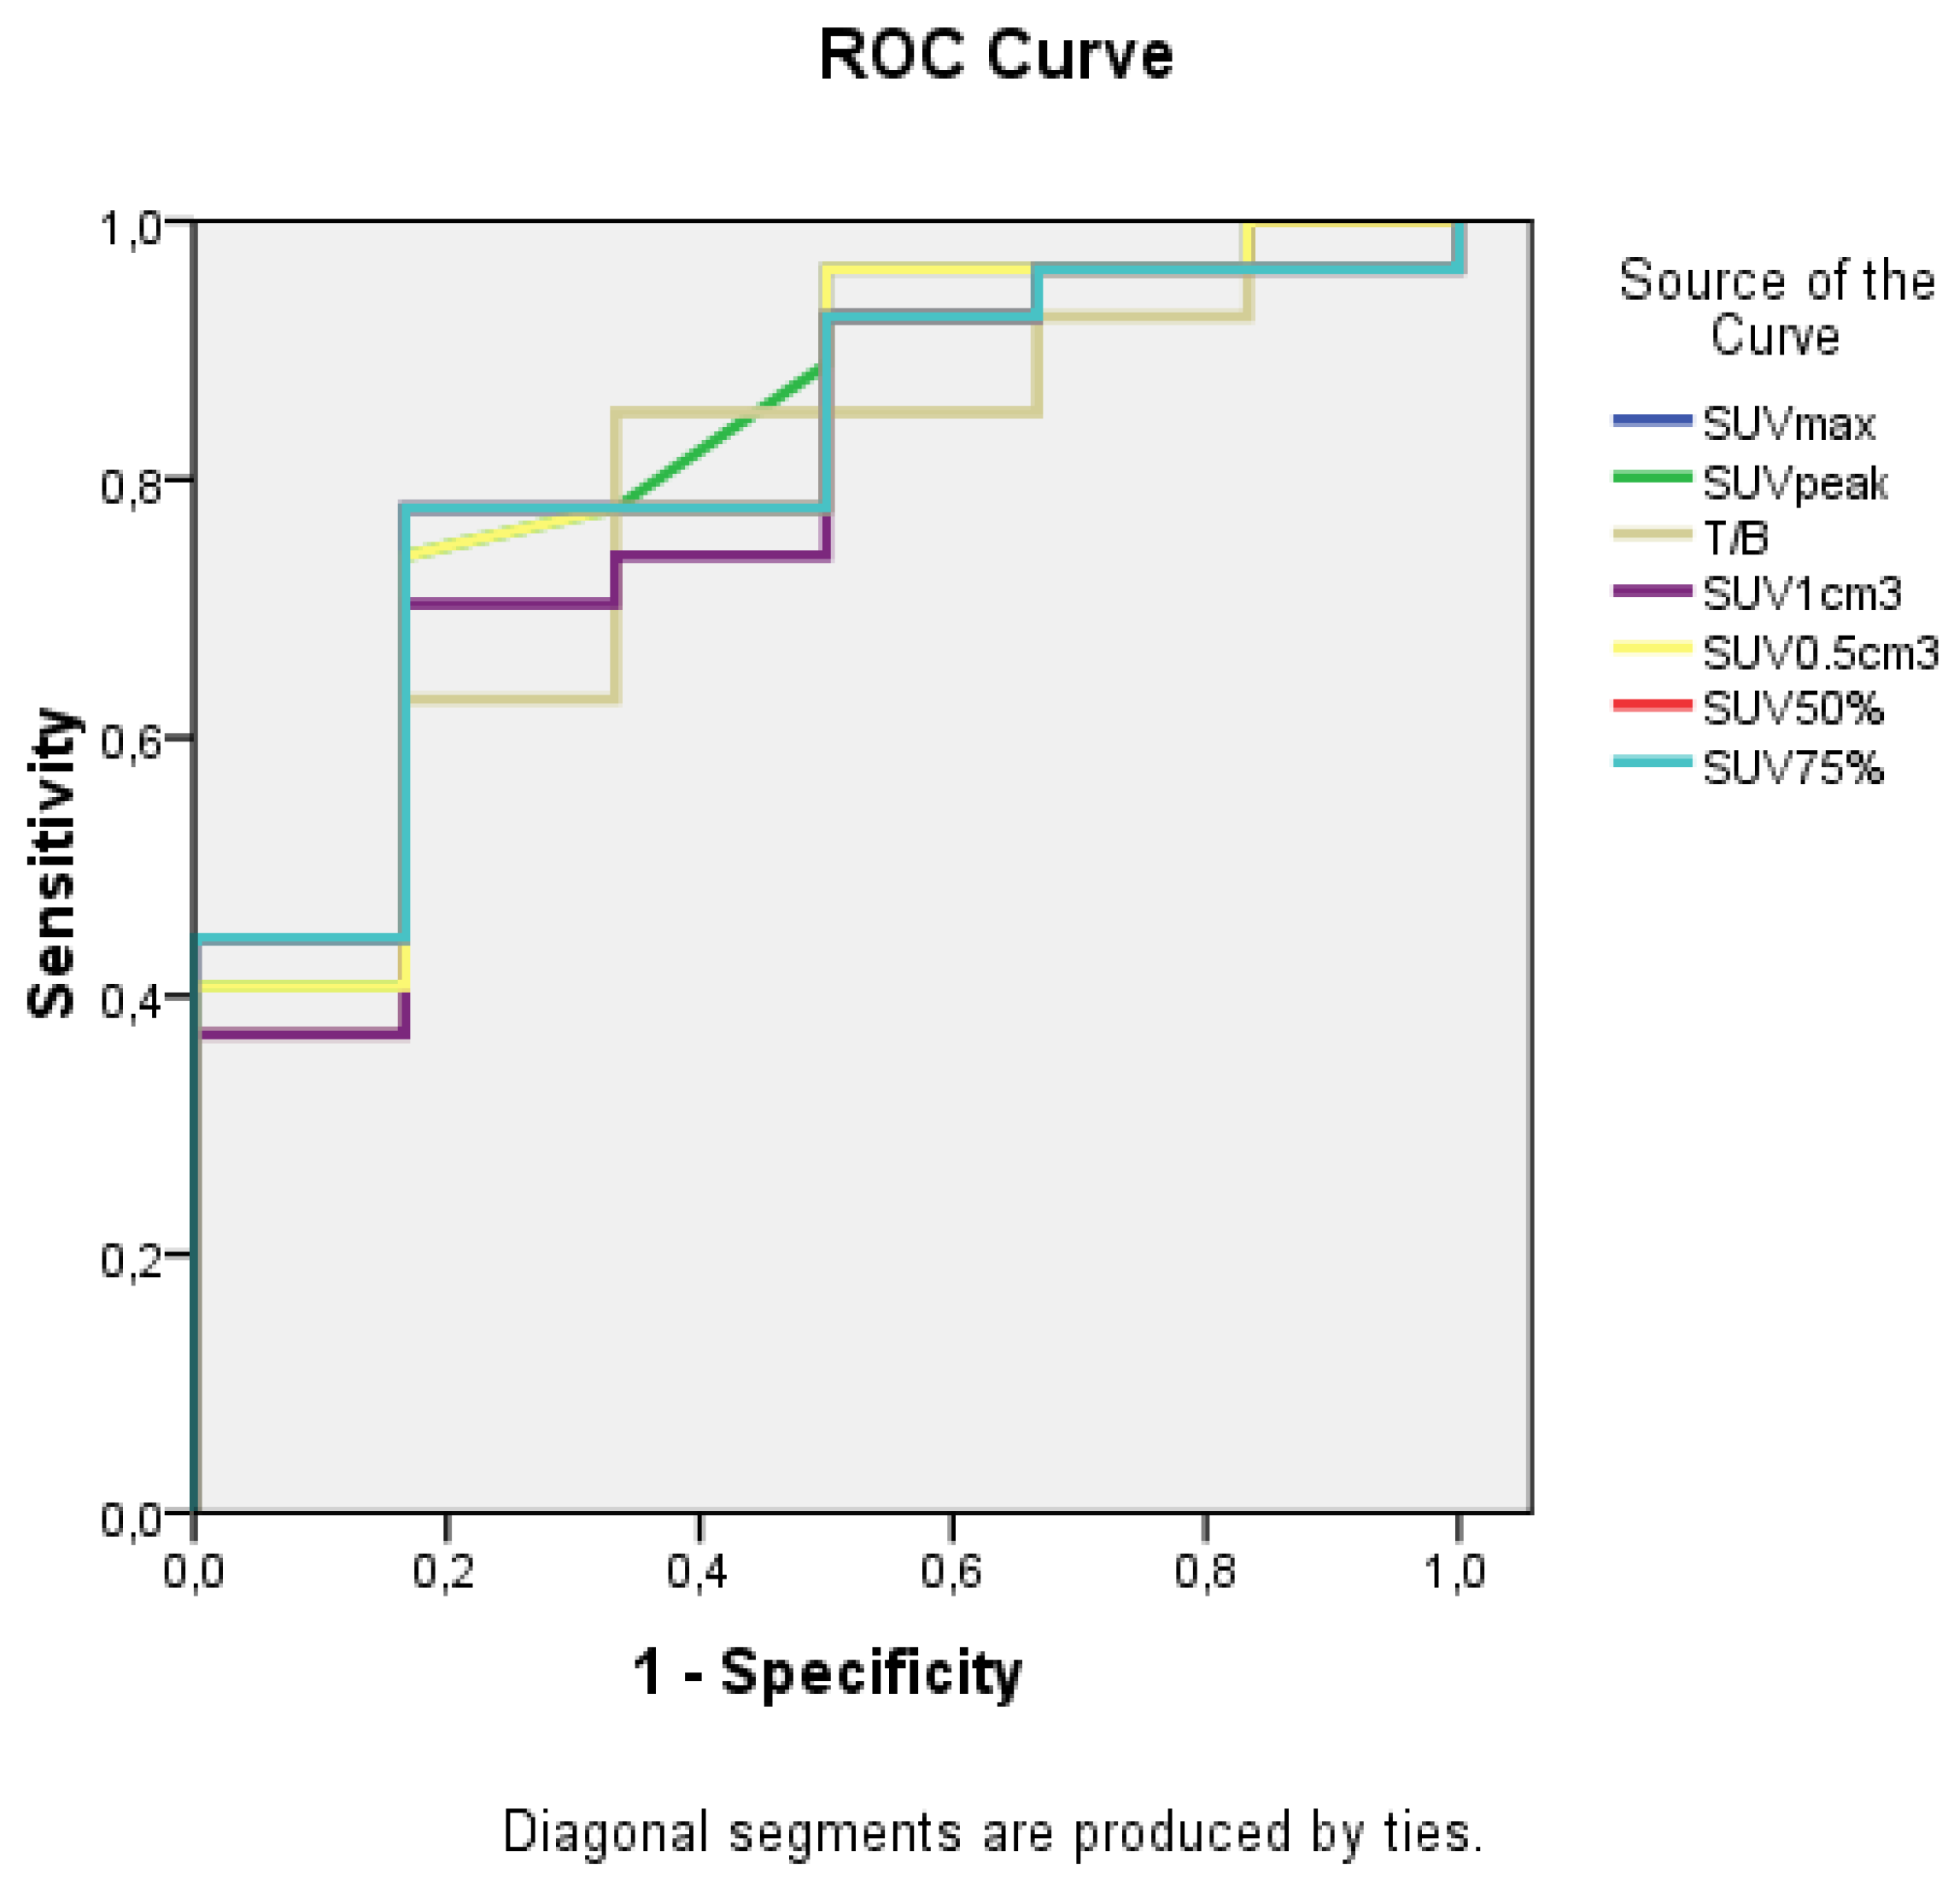
| Test | AUC | 95% Confidence Interval | p-Value |
|---|---|---|---|
| SUVmax | 0.815 | 0.637–0.993 | 0.017 |
| SUVpeak | 0.815 | 0.631–0.999 | 0.017 |
| T/B | 0.765 | 0.568–0.963 | 0.045 |
| SUV1cm3 | 0.784 | 0.586–0.982 | 0.032 |
| SUV0.5cm3 | 0.812 | 0.625–0.999 | 0.018 |
| SUV50% | 0.809 | 0.632–0.986 | 0.02 |
| SUV75% | 0.809 | 0.632–0.986 | 0.02 |
| OC | SUVmax ≥ 0.615 | SUVpeak ≥ 0.425 | T/B ≥ 4.21 | SUV1cm3 ≥ 0.455 | SUV0.5cm3 ≥ 0.47 | SUV50% ≥ 0.405 | SUV75% ≥ 0.535 |
|---|---|---|---|---|---|---|---|
| FP (No.) | 1 | 1 | 2 | 1 | 1 | 1 | 1 |
| FN (No.) | 6 | 7 | 4 | 8 | 7 | 6 | 6 |
| Sensitivity | 77.8% | 74.1% | 85.2% | 70.4% | 74.1% | 77.8% | 77.8% |
| Specificity | 83.3% | 83.3% | 66.7% | 83.3% | 83.3% | 83.3% | 83.3% |
| Accuracy | 78.8% | 75.8% | 81.8% | 72.7% | 75.8% | 78.8% | 78.8% |
© 2019 by the authors. Licensee MDPI, Basel, Switzerland. This article is an open access article distributed under the terms and conditions of the Creative Commons Attribution (CC BY) license (http://creativecommons.org/licenses/by/4.0/).
Share and Cite
Nikaki, A.; Papadopoulos, V.; Valotassiou, V.; Efthymiadou, R.; Angelidis, G.; Tsougos, I.; Prassopoulos, V.; Georgoulias, P. Evaluation of the Performance of 18F-Fluorothymidine Positron Emission Tomography/Computed Tomography (18F-FLT-PET/CT) in Metastatic Brain Lesions. Diagnostics 2019, 9, 17. https://doi.org/10.3390/diagnostics9010017
Nikaki A, Papadopoulos V, Valotassiou V, Efthymiadou R, Angelidis G, Tsougos I, Prassopoulos V, Georgoulias P. Evaluation of the Performance of 18F-Fluorothymidine Positron Emission Tomography/Computed Tomography (18F-FLT-PET/CT) in Metastatic Brain Lesions. Diagnostics. 2019; 9(1):17. https://doi.org/10.3390/diagnostics9010017
Chicago/Turabian StyleNikaki, Alexandra, Vassilios Papadopoulos, Varvara Valotassiou, Roxani Efthymiadou, George Angelidis, Ioannis Tsougos, Vassilios Prassopoulos, and Panagiotis Georgoulias. 2019. "Evaluation of the Performance of 18F-Fluorothymidine Positron Emission Tomography/Computed Tomography (18F-FLT-PET/CT) in Metastatic Brain Lesions" Diagnostics 9, no. 1: 17. https://doi.org/10.3390/diagnostics9010017