Article

Permutation Entropy and Its Main Biomedical and Econophysics Applications: A Review

by
Massimiliano Zanin
1,2,3,*,
Luciano Zunino
4,5,
Osvaldo A. Rosso
6,7 and
David Papo
1
1
Centre for Biomedical Technology, Polytechnic University of Madrid, Pozuelo de Alarcón, 28223 Madrid, Spain
2
Faculdade de Ciências e Tecnologia, Departamento de Engenharia Electrotécnica, Universidade Nova de Lisboa, 2829-516 Caparica, Portugal
3
Innaxis Foundation & Research Institute José Ortega y Gasset 20, 28006 Madrid, Spain
4
Centro de Investigaciones Ópticas (CONICET La Plata - CIC) C.C. 3, 1897 Gonnet, Argentina
5
Departamento de Ciencias Básicas, Facultad de Ingeniería, Universidad Nacional de La Plata (UNLP), 1900 La Plata, Argentina
6
LaCCAN/CPMAT - Instituto de Computação, Universidade Federal de Alagoas, BR 104 Norte km 97, 57072-970 Maceió, Alagoas, Brazil
7
Laboratorio de Sistemas Complejos, Facultad de Ingeniería, Universidad de Buenos Aires, 1063 Av. Paseo Colón 840, Ciudad Autónoma de Buenos Aires, Argentina
*
Author to whom correspondence should be addressed.
Entropy 2012, 14(8), 1553-1577; https://doi.org/10.3390/e14081553
Submission received: 1 July 2012 / Revised: 10 August 2012 / Accepted: 21 August 2012 / Published: 23 August 2012
(This article belongs to the Special Issue Concepts of Entropy and Their Applications)

Abstract

:
Entropy is a powerful tool for the analysis of time series, as it allows describing the probability distributions of the possible state of a system, and therefore the information encoded in it. Nevertheless, important information may be codified also in the temporal dynamics, an aspect which is not usually taken into account. The idea of calculating entropy based on permutation patterns (that is, permutations defined by the order relations among values of a time series) has received a lot of attention in the last years, especially for the understanding of complex and chaotic systems. Permutation entropy directly accounts for the temporal information contained in the time series; furthermore, it has the quality of simplicity, robustness and very low computational cost. To celebrate the tenth anniversary of the original work, here we analyze the theoretical foundations of the permutation entropy, as well as the main recent applications to the analysis of economical markets and to the understanding of biomedical systems.

1. Introduction

Given a system, be it natural or man-made, and given an observable of such system whose evolution can be tracked through time, a natural question arises: how much information is this observable encoding about the dynamics of the underlying system? The information content of a system is typically evaluated via a probability distribution function (PDF) P describing the apportionment of some measurable or observable quantity, generally a time series X ( t ) . Quantifying the information content of a given observable is therefore largely tantamount to characterizing its probability distribution. This is often done with the wide family of measures called information entropies [1].
Entropy is a basic quantity with multiple field-specific interpretations: for instance, it has been associated with disorder, state-space volume, or lack of information [2]. When dealing with information content, the Shannon entropy is often considered as the foundational and most natural one [3,4]. Given any arbitrary discrete probability distribution P = { p i : i = 1 , , M } , with M degrees of freedom, Shannon’s logarithmic information measure reads:
S [ P ] = i = 1 M p i ln ( p i )
This can be regarded as a measure of the uncertainty associated to the physical process described by P. For instance, if S [ P ] = S m i n = 0 , we are in position to predict with complete certainty which of the possible outcomes i, whose probabilities are given by p i , will actually take place. Our knowledge of the underlying process described by the probability distribution is maximal in this instance. In contrast, our knowledge is minimal for a uniform distribution ( P e = { 1 / M , i = 1 , , M } ) and the uncertainty is maximal, i.e., S [ P e ] = S m a x = ln M .
Since Shannon’s seminal paper [3], his entropy has been used in the characterization of a great variety of systems. Yet, this traditional method presents a number of drawbacks.
First and most importantly, Shannon’s and other classical measures neglect temporal relationships between the values of the time series, so that structure and possible temporal patterns present in the process are not accounted for [5]. In other words, if two time series are defined as X 1 = { 0 , 0 , 1 , 1 } and X 2 = { 0 , 1 , 0 , 1 } , it holds that S [ P ( X 1 ) ] = S [ P ( X 2 ) ] . More generally, this occurs when one merely assigns to each time point of the series X , a symbol from a given finite alphabet A , thus creating a symbolic sequence that can be regarded as a non-causal coarse grained description of the time series under consideration. As a consequence, order relations and the time scales of the dynamics are lost. The usual histogram-technique corresponds to this kind of assignment. Causal information may be duly incorporated if information about the past dynamics of the system is included in the symbolic sequence, i.e., symbols of alphabet A are assigned to a (phase-space) trajectory’s portion.
Second, classical entropy measures suppose some prior knowledge about the system; specifically, in using quantifiers based on Information Theory, a probability distribution associated to the time series under analysis should be provided beforehand. The determination of the most adequate PDF is a fundamental problem because the PDF P and the sample space Ω are inextricably linked. Many methods have been proposed for a proper selection of the probability space ( Ω , P ) . Among others, we can mention frequency counting [6], procedures based on amplitude statistics [7], binary symbolic dynamics [8], Fourier analysis [9], or wavelet transform [10]. Their applicability depends on particular characteristics of the data, such as stationarity, time series length, variation of the parameters, level of noise contamination, etc. In all these cases the dynamics’ global aspects can be somehow captured, but the different approaches are not equivalent in their ability to discern all the relevant physical details. One must also acknowledge the fact that the above techniques are introduced in a rather “ad-hoc fashion" and they are not directly derived from the dynamical properties themselves of the system under study. Therefore, a question naturally arises: is there a way to define a PDF that is more general and system independent?
Third, classical methods are often best designed to deal with linear systems, and only poorly describe highly nonlinear chaotic regimes.
Figure 1. Evolution of the number of citations for the Bandt and Pompe seminal paper [11], from 2002 to 2011. Information extracted from the Scopus bibliographic database (http://www.scopus.com/home.url accessed on March 12, 2012.)
Entropy 14 01553 g001
Bandt and Pompe [11] addressed these issues by introducing a simple and robust method that takes into account time causality by comparing neighboring values in a time series. The appropriate symbol sequence arises naturally from the time series, with no prior knowledge assumed. “Partitions” are naturally devised by comparing the order of neighboring relative values, rather than by apportioning amplitudes according to different levels. Based on this symbolic analysis, a permutation entropy is then built. Bandt and Pompe’s approach for generating PDFs is a simple symbolization technique that incorporates causality in the evaluation of the PDF associated to a time series. Its use has been shown to yield a clear improvement on the quality of Information theory-based quantifiers (see, e.g., [12,13,14,15] and references therein). The power and usefulness of this approach has been validated in many subsequent papers, as shown by the evolution in the number of citations of the cornerstone paper [11] through time—see Figure 1.
We review the principles behind permutation entropy, present methods derived from Bandt and Pompe’s original idea, and describe several applications drawn from the fields of econophysics and biology.

2. The Permutation Entropy

At each time s of a given a time series X = { x t : t = 1 , , N } , a vector composed of the D-th subsequent values is constructed:
s ( x s , x s + 1 , , x s + ( D 2 ) , x s + ( D 1 ) )
D is called the embedding dimension, and determines how much information is contained in each vector. To this vector, an ordinal pattern is associated, defined as the permutation π = ( r 0 r 1 r D 1 ) of ( 01 D 1 ) which fulfills
x s + r 0 x s + r 1 x s + r D 2 x s + r D 1
In other words, the values of each vector are sorted in an ascending order, and a permutation pattern π is created with the offset of the permuted values. A numerical example may help clarifying this concept. Take, for example, the time series X = { 3 , 1 , 4 , 1 , 5 , 9 } . For D = 3 , the vector of values corresponding to s = 1 is ( 3 , 1 , 4 ) ; the vector is sorted in ascending order, giving ( 1 , 3 , 4 ) , and the corresponding permutation pattern is then π = ( 102 ) . For s = 2 , the vector of values is ( 1 , 4 , 1 ) , leading to the permutation π = ( 021 ) . Notice that, if two values are equal (here, the first and the third elements), they are ordered according to the time of their appearance.
Graphically, Figure 2 illustrates the construction principle of the ordinal patterns of length D = 2 , 3 and 4 [16,17]. Consider the value sequence { x 0 , x 1 , x 2 , x 3 } . For D = 2 , there are only two possible directions from x 0 to x 1 , up and down. For D = 3 , starting from x 1 (up) the third part of the pattern can be above x 1 , below x 0 , or between x 0 and x 1 . A similar situation can be found starting from x 1 (down). For D = 4 , for each one of the 6 possible positions for x 2 , 4 possible localizations exist for x 3 , giving D ! = 4 ! = 24 different ordinal patterns. In the diagram of Figure 2, with full circles and continuous line we represent the sequence values x 0 < x 2 < x 3 < x 1 , which lead to the pattern π = ( 0231 ) . A graphical representation of all possible patterns corresponding to D = 3 , 4 and 5 can be found in Figure 2 of [17].
Equation 2 can be further extended by considering an embedding delay τ:
s ( x s , s s + τ , , x s + τ ( D 2 ) , x s + τ ( D 1 ) )
when τ is greater than one, the values composing the permutations are taken non-consecutively, thus mapping the dynamics of the system at different temporal resolutions.
Figure 2. Illustration of the construction-principle for ordinal patterns of length D [16,17]. If D = 4 , full circles and continuous lines represent the sequence values x 0 < x 2 < x 3 < x 1 which lead to the pattern π = ( 0231 ) .
Entropy 14 01553 g002
The idea behind permutation entropy is that patterns may not have the same probability of occurrence, and thus, that this probability may unveil relevant knowledge about the underlying system. An extreme situation is represented by the forbidden patterns, that is, patterns that do not appear at all in the analyzed time series.
There are two reasons behind the presence of forbidden patterns. The first, and most trivial one, is due to the finite length of any real time series, thus leading to finite-size effects. Going back to the previous example, the permutation π = ( 210 ) does not appears in the sequence { 3 , 1 , 4 , 1 , 5 , 9 } , i.e., there is not triplet of consecutive values ordered in a descending order. The second reason is related to the dynamical nature of the systems generating the time series. If a time series is constructed using a perfect random number generator, all possible sequences of numbers should be expected, and no forbidden pattern should appear. On the contrary, suppose that we are studying the output of the logistic map [18], defined as:
x t + 1 = α x t ( 1 x t )
for all x included between [ 0 , 1 ] . Figure 3(left) shows the behavior of such map for α = 4 , corresponding to chaotic dynamics; the black line represents all the possible initial values x 0 [ 0 , 1 ] , the red curve the corresponding outputs after one iteration (i.e, x 1 ), and the green curve those after the second ( x 2 ). The ordering of these curves graphically represents the corresponding permutation pattern; for instance, for x 0 = 0 . 1 , from bottom to top we find the black, red and green curves: thus, x 0 < x 1 < x 2 (that is, 0 < 0 . 36 < 0 . 9216 ), resulting in π = ( 012 ) . The reader may notice that 5 different permutations can be generated by this map, identified by the 5 regions enclosed by vertical dashed lines, while the number of possible permutations for an embedding dimension of 3 are 3 ! = 6 : in other words, the permutation π = ( 210 ) is forbidden by the own dynamics of the system.
Figure 3. (Left) Behavior of the logistic map [18] with α = 4 . The plot represents the evolution of x 1 (red curve) and x 2 (green curve) for all possible value of x 0 (black line); (Right) Number of forbidden patterns, for D = 3 , found in different time series (1000 realizations) generated through the logistic map with α = 4 , as a function of the length of the series. Each point corresponds to the mean value of forbidden patterns, and vertical bars to the corresponding standard deviation.
Entropy 14 01553 g003
In Figure 3(right), the mean number of forbidden patterns found in a time series created with Equation 5, along with its standard deviation, are represented as a function of the length of the series, thus representing both factors at the same time.
The relevance of this method is then clear: by assessing the presence, or absence, of some permutation patterns of the elements of a time series, it is possible to derive information about the dynamics of the underlying system. Even if all patterns eventually appear, the probability with which each one is present can unveil relevant information about this dynamics. More generally, to each time series it is possible to associate a probability distribution Π, whose elements π i are the frequencies associated with the i possible permutation patterns - therefore, i = 1 , , D ! . The Permutation Entropy, P E , is then defined as the Shannon entropy associated to such distribution:
P E = i = 1 D ! π i ln π i
In order to assess the quantity of information encoded by such distribution, the logarithm is usually in base 2. Furthermore, by noticing that P E [ 0 , log 2 D ! ] , a normalized Permutation Entropy can be defined:
P E n o r m = 1 log 2 D ! i = 1 D ! π i log 2 π i
A very related information measure, 1 P E n o r m , called normalized Kullback-Leibler entropy (KLE) was introduced in [19]. It quantifies the distance between the ordinal pattern probability distribution and the uniform distribution.
Equation 4 indicates that the resulting probability distribution has two main parameters: the dimension D and the embedding delay τ. The former plays an important role in the evaluation of the appropriate probability distribution, since D determines the number of accessible states, given by D ! . Moreover, to achieve a reliable statistics and proper discrimination between stochastic and deterministic dynamics, it is necessary that N D ! [13,20]. For practical purpose, the authors in [11] suggested to work with 3 D 7 with a time lag τ = 1 . Nevertheless, other values of τ might provide additional information, related with the intrinsic time scales of the system [21,22,23,24].

3. Applying Permutation Entropy

3.1. Distinguishing Noise from Chaos

In order to model a system, it is necessary to identify the underlying dynamics. Stochastic or chaotic (deterministic) classification is essential to achieve the modeling goal.
This is not always an easy task. Consider, for example, the time series generated by the logistic map of Equation 5. The time series takes values in the interval [ 0 , 1 ] , and for α = 4 the dynamics is chaotic [18]. In this regime, the logistic map exhibits an almost flat PDF-histogram, with peaks at x = 0 and x = 1 . This histogram-PDF constitutes an invariant measure of the system [18]. Thus, if we use this PDF, we obtain a value for the Shannon entropy close to its corresponding maximum S m a x : the logistic map is almost indistinguishable from uncorrelated random noise.
This problem can be solved if the time-causality (in the series’ values) is duly taken into account when extracting the associated PDF from the time series, something that one gets automatically from the Bandt and Pompe methodology [11]. Specifically, in the case of unconstrained stochastic process (uncorrelated process) every ordinal pattern has the same probability of appearance [25,26,27,28]. That is, if the data set is long enough, all the ordinal patterns will eventually appear.
Amigó and co-workers [25,26] proposed a test that uses this last property, i.e., the number of missing ordinal patterns, in order to distinguish determinism (chaos) from pure randomness in finite time series contaminated with observational white noise (uncorrelated noise). The test is based on two important practical properties: their finiteness and noise contamination. These two properties are important because finiteness produces missing patterns in a random sequence without constrains, whereas noise blurs the difference between deterministic and random time-series. The methodology proposed by Amigó et al. [26] consists in a graphic comparison between the decay of the missing ordinal patterns (of length D) of the time series under analysis as a function of the series length N, and the decay corresponding to white Gaussian noise.
Stochastic process could also present forbidden patterns [14]. However, in the case of either uncorrelated or some correlated stochastic processes, it can be numerically ascertained that no forbidden patterns emerge. Moreover, analytical expressions can be derived [29] for some stochastic processes (i.e., fractional Brownian motion for PDF’s based on ordinal patterns with length 2 D 4 ). The methodology of Amigó was recently extended by Carpi et al. [30] for the analysis of such stochastic processes: specifically, fractional Brownian motion (fBm), fractional Gaussian noise (fGn), and noises with f k power spectrum and ( k 0 ). More precisely, they analyzed the decay rate of missing ordinal patterns as a function of pattern-length D (embedding dimension) and of time series length N. Results show that for a fixed pattern length, the decay of missing ordinal patterns in stochastic processes depends not only on the series length but also on their correlation structures. In other words, missing ordinal patterns are more persistent in the time series with higher correlation structures. Carpi et al. [30] also have shown that the standard deviation of the estimated decay rate of missing ordinal patterns decreases with increasing D. This is due to the fact that longer patterns contain more temporal information and are therefore more effective in capturing the dynamics of time series with correlation structures.

3.2. The Statistical Complexity and the Complexity-Entropy Plane

It is widely known that an entropic measure does not quantify the degree of structure or patterns present in a process [5]. Moreover, it was recently shown that measures of statistical or structural complexity are necessary for a better understanding of chaotic time series because they are able to capture their organizational properties [31]. This specific kind of information is not revealed by randomness measures. The opposite extreme perfect order (like a periodic sequence) and maximal randomness (e.g., fair coin toss) possess no complex structure and exhibit zero statistical complexity. Between these extremes, a wide range of possible degrees of physical structure exists, which should be quantified by the statistical complexity measure. An effective statistical complexity measure (SCM) was introduced to detect essential details of the dynamics and differentiate different degrees of periodicity and chaos [32]. This measure provides additional insight into the details of the system’s probability distribution, which is not discriminated by randomness measures like the entropy [13,31]. It can also help to uncover information related to the correlational structure between the components of the physical process under study [33,34].
This measure is a function of the probability distribution function P associated to a time series, and is defined as the product of the normalized Shannon entropy and another term called disequilibrium. The use of the ordinal patterns PDF naturally results in several advantages, viz. the inclusion of the temporal relationships between the elements of the time series and the invariance with respect to non-linear monotonous transformation.
More formally, following [35], the MPR-statistical complexity measure is defined as the product
C J S [ P ] = Q J [ P , P e ] · H [ P ]
of (i) the normalized Shannon entropy and (ii) the so-called disequilibrium Q J , which is defined in terms of the extensive (in the thermodynamical sense) Jensen–Shannon divergence J [ P , P e ] that links two PDFs [36]. The Jensen–Shannon divergence, which quantifies the difference between two (or more) probability distributions, is especially useful to compare the symbol-composition of different sequences [37]. Furthermore, the complexity-entropy plane, H × C J S , which represents the evolution of the complexity of the system as a function of its entropy, has been used to study changes in the dynamics of a system originated by modifications of some characteristic parameters (see, for instance, [12,15,38,39,40] and references therein). The complexity measure constructed in this way has the intensive property found in many thermodynamic quantities [32]. We stress the fact that the statistical complexity defined above is a function of two normalized entropies (the Shannon entropy and Jensen–Shannon divergence), but such function is not trivial, in that it depends on two different probability distributions, i.e., the one corresponding to the state of the system, P, and the uniform distribution, P e , taken as reference state.

3.3. Identification of Time Scales

Often, when first studying a complex physical or biological system, the first almost mandatory step in its investigation involves determining its characteristic dimensions.
Classically, this issue has been tackled by means of autocorrelation functions or Delayed Mutual Information (see, for instance, [41,42]). Recently, the PE has been proposed as an alternative approach. Specifically, the idea is that the entropy associated with a time series should be minimal, that is, the underlying dynamics should be more predictable and simple, when the value of the embedding delay τ (see Equation 4 is equal to the characteristic time delay of the system.
This approach has been checked by Zunino and coworkers [22] with time series generated by a Mackey–Glass oscillator [43]. Results indicate that the permutation entropy exhibits a minimum in correspondence with the delay of the system, along with other secondary minima corresponding to harmonics and subharmonics of such delay. Furthermore, it is also shown that this method is able to recover the characteristics of the system even when more than one delay is used or when the time series is contaminated by noise. In [23] this technique is also applied to time series generated by chaotic semiconductor lasers with optical feedback, enabling the identification of three important features of the system: feedback time delay, relaxation oscillation period, and pulsing time scale. Similar applications can be also found in [24,44,45].

3.4. Dependences between Time Series

The identification of the presence of relationships between the dynamics of two or more time series is a relevant problem in many fields of science, among them in economics and biophysics. Several techniques have been proposed in the past, but they usually require previous knowledge of the probability distribution from which the time series have been drawn. The model-independence of PE makes it an ideal tool to tackle this problem.
A test based on permutation patterns for independence between time series was proposed by Matilla-García and Ruiz Marín [46]. Specifically, given a two-dimensional time series W = ( X , Y ) and an embedding dimension D, to each subset of W a bidimensional permutation pattern π = ( ( x 0 , x 1 , , x D 1 ) , ( y 0 , y 1 , , y D 1 ) ) is assigned. Notice that, due to the dimension of the time series, the number of possible patterns grows from D ! to D ! 2 .The appearance probability of all π i generates a global probability distribution Π. When the two components of the time series are independent, it is demonstrated that the Shannon entropy calculated on Π follows asymptotically a χ 2 distribution. Thanks to the use of permutation patterns, this method has the advantages of not requiring any model assumption (i.e., it is nonparametric) and of being suitable for the analysis of nonlinear processes.
Several papers have expanded the work of Matilla-García and Ruiz Marín [46]. For instance, in [47] a method for spatial independence test is proposed; in [48] the permutation entropy is used to detect spatial structures, and specifically of the order of contiguity; also, in [49] the symbolic entropy is used to assess the presence of lineal and non-linear spatial causality.
Cánovas et al. [50] proposed an alternative approach for the analysis of the dependence of two time series, based on the construction of contingency tables, i.e., matrices where the frequency of co-appearance of two patterns in two different time series at the same time is reported. Once a contingency table has been constructed, the independence of both series can be checked with standard statistical tests, including Pearson’s chi-square, G-test, or the Fisher–Freeman–Halton test [51].
Finally, it is worth noticing the work of Bahraminasab et al. [52], in which the permutation entropy is used along with the Conditional Mutual Information for the assessment of causal (or driver-response) relationships between two time series. The method is tested with van der Pol oscillators, demonstrating a good tolerance to external noise.

3.5. Some Improvements on the PE Definition

The original definition of PE presents two main drawbacks, for which solutions have been recently proposed.
First, it is clear that the magnitude of the difference between neighboring values is not taken into consideration when the time series is symbolized by using the Bandt–Pompe recipe. Consequently, vectors of very different appearance are mapped to the same symbol. Liu and Wang introduced the fine-grained PE (FGPE), in which a factor is added in the permutation type for discriminating these different vectors [53]. It is shown that the FGPE allows for a more sensitive identification of the dynamical change of time series and approximates more closely to the Lyapunov exponent for chaotic time series. Obviously, the time needed for estimating the FGPE is slightly larger in comparison with the time needed for calculating the conventional PE.
Second, by assuming that the time series under study has a continuous distribution, Bandt and Pompe [11] neglected equal values and consider only inequalities between the data. Moreover, these authors proposed to rank possible equalities according to their order of emergence or to eliminate them by adding small random perturbations to the original time series. Bian et al. [54] have recently proposed the modified permutation entropy (mPE) method for improving the symbolization of equal values. They have shown that the probability of equal values can be very high when the observed time series is digitized with lower resolution. In this situation, the original recipe to deal with equalities can introduce some bias in the results. By mapping equal values to the same symbol, the mPE allows for a better characterization of the system states. Complexity of heart rate variability related to three different groups (young, elderly and congestive heart failure) is better characterized with this improved version, reaching a more clear discrimination between the groups.

4. Biomedical Applications

Over the last few years, permutation entropy and related metrics have emerged as particularly appropriate complexity measures in the study of time series from biological systems, such as the brain or the heart. The reasons for this increasing success are manifold.
First, biological systems are typically characterized by complex dynamics, with rich temporal structure even at rest [55]. For instance, spontaneous brain activity encompasses a set of dynamically switching states, which are continuously re-edited across the cortex [56], in a non-random way [57,58]. On the other hand, various pathologies are associated with the appearance of highly stereotyped patterns of activity [59]. For instance, epileptic seizures are typically characterized by ordered sequences of symptoms. Permutation entropy seems particularly well equipped to capture this structure in both healthy systems and in pathological states.
Second, while over the last decades a wealth of linear and more recently nonlinear methods for quantifying this structure from time series have been devised [60,61], most of them, in addition to making restrictive hypotheses as to the type of underlying dynamics, are vulnerable to even low levels of noise. Even when mostly deterministic, biological time series typically contain a certain degree of randomness, e.g., in the form of dynamical and observational noise. Therefore, analyzing signals from such systems implies methods that are model-free and robust. Contrary to most nonlinear measures, permutation entropy and derived metrics can be calculated for arbitrary real-world time series and are rather robust to noise sources and artifacts [11,62].
Finally, real time applications for clinical purposes require computationally parsimonious algorithms that can provide reliable results for relatively short and noisy time series. Most existing methods require long, stationary and noiseless data. Permutation entropy, on the contrary, is extremely fast and robust, and seems particularly advantageous when there are huge data sets and no time for preprocessing and fine-tuning of parameters.
In what follows, we give a brief overview of applications of ordinal time series analysis to studies of brain (electrical) activity, namely in epilepsy research [63,64,65,66,67,68,69], in anesthesiology [70,71,72,73,74], and cognitive neuroscience [75,76]. All the studies reviewed below investigated brain electrical activity, recorded with electroencephalographic (EEG) techniques. We also review studies of heart rate rhythms using various methods derived from the original Bandt and Pompe’s method [17,19,52,54,77].

4.1. Epilepsy Studies

Epilepsy is one of the most common neurological disorders, with a prevalence of approximately 1% of the world’s population. Epilepsy presents itself in seizures, which result from abnormal, hyper-synchronous brain activity. The sudden and often unforeseen occurrence of seizures represents one of the most disabling aspects of the disease. In many patients suffering from epilepsy, seizures are well controlled with anti-epileptic drugs. However, approximately 30% of patients do not respond to available medication. For these patients, neurosurgical resection of epileptogenic brain tissue may represent a solution. Typically, surgeons strive to identify this tissue by implanting intracranial electrodes in the patients’ brain. Correctly identifying the presence of epileptic activity, characterizing the spatio-temporal patterns of the corresponding brain activity, and predicting the occurrence of seizures are major challenges the efficient solution of which could significantly improve the quality of life for epilepsy patients.

4.1.1. Classification

In biomedical studies, it is often very important to be able to classify different conditions, for instance for diagnostic purposes. In the case of epilepsy, discriminating between normal and pathological electroencephalographic recording often represents a non-trivial task. Ordinal pattern distributions have been proving a valuable tool for classifying and discriminating dynamical states of various biological systems. Veisi et al. [65] illustrated the ability of permutation entropy for classifying normal and epileptic EEG. The results of classification performed using discriminant analysis indicated that permutation entropy measures can distinguish normal and epileptic EEG signals with an accuracy of more than 97% for clean and more than 85% for highly noisy EEG signals.

4.1.2. Determinism Detection

Often, epileptic seizures manifest in a highly stereotypical ordered sequences of symptoms and signs with limited variability. Schindler et al. [59] conjectured that this stereotype may imply that ictal neuronal dynamics might have deterministic characteristics, and that this would presumably be enhanced in the ictogenic regions of the brain. To test this hypothesis, the authors used the time-varying average number of forbidden patterns of multichannel recordings of periictal EEG activity in 16 patients. Results for intracranial EEG demonstrated a spatiotemporally limited shift of neuronal dynamics toward a more deterministic dynamic regime, specifically pronounced during the seizure-onset period. While the mean number of forbidden patterns did not significantly change during seizures, the maximum number of forbidden patterns across electrodes typically increased significantly during the first third of the seizure period and then gradually decreased toward and beyond seizure termination. Interestingly, for patients who became seizure free following surgery, the maximal number of forbidden patterns during seizure onset tended to be recorded from within the seizure-onset zones identified by visual inspection.

4.1.3. Detection of Dynamic Change

Detection of dynamical changes is one of the most important problems in physics and biology. Indeed, in clinical studies, accurate detection of transitions from normal to pathological states may improve diagnosis and treatment. This is particularly evident in the case of epilepsy, as seizure detection is a necessary precondition for diagnosis. During the last two decades, a number of numerical methods have been proposed to detect dynamical changes. However, most of these methods are computationally expensive, as they involve inspecting the underlying dynamics in the system’s phase space. Cao et al. [63] used permutation entropy to identify the various phases of epileptic activity in the intracranial EEG signals recorded from three patients suffering from intractable epilepsy. The authors found a sharp PE drop after the seizure, followed by a gradual increase, indicating that the dynamics of the brain first becomes more regular right after the seizure, then its irregularity increases as it approaches the normal state. Ouyang et al. [68] calculated the distribution of ordinal patterns for the detection of absence seizures in rats. A dissimilarity measure between two EEG series was then used to distinguish between interictal, preictal and ictal states, i.e., respectively far away, close to and during an epileptic seizure, leading to the successful detection of the preictal state prior to their onset in 109 out of 168 seizures (64.9%). Nicolaou and Georgiou [78] investigated the use of permutation entropy as a feature for automated epileptic seizure detection. A support vector machine was used to classify segments of normal and epileptic EEG, yielding an average sensitivity of 94.38% and average specificity of 93.23%. Perfect sensitivity and specificity were obtained in single-trial classifications. Finally, a cautionary note on the scope for the use of permutation entropy in seizure detection comes from the study of Bruzzo et al. [69], where the scalp EEG data recorded from three epileptic patients were considered. With a receiver operating characteristics analysis, the authors evaluated the separability of amplitude distributions of ordinal patterns resulting from preictal and interictal phases. While a good separability of interictal and preictal phase was found, the changes in permutation entropy values during the preictal phase and at seizure onset coincided with changes in vigilance state, restricting its possible use for seizure prediction on scalp EEG. On the other hand, this finding suggested the possible usefulness for an automated classification of vigilance states.

4.1.4. Prediction

Over and above the very occurrence of epileptic seizures and their frequency, their sudden and incontrollable character is probably the single most important factor negatively affecting the life of patients. Thus, methods capable of reliably predicting the occurrence of seizures could significantly improve the quality of life for these patients and pave the way for new therapeutic strategies. Li et al. [79] proved, for a population of rats, that permutation entropy can be used not only to track the dynamical changes of EEG data, but also to successfully detect pre-seizure states. A threshold for detecting pre-ictal state was determined by calculating the mean value and standard deviation of the permutation entropy and another commonly used metric, i.e., sample entropy variations, from the respective rat. The method was successful in detecting 169 out of 314 seizures from 28 rats, with an average anticipation time of approximately 5 seconds, faring better than sample entropy (3.7 seconds). Ouyang et al. [67] studied the statistics of forbidden patterns for the EEG series of genetic absence epilepsy rats. The results showed that the number of forbidden patterns grew significantly from an interictal to an ictal state via a preictal state. In addition to indicating increases in deterministic dynamics in the transition from interictal to ictal states, these results suggested that forbidden patterns may represent a predictor of absence seizures.

4.1.5. Spatio-Temporal Dynamics

While the emphasis of most studies in epilepsy has long been on the identification of local epileptogenic foci, it is now widely recognized that seizure dynamics is an essentially spatially-extended phenomenon [80]. One fundamental issue is then the assessment of the relationship between dynamics observed in different parts of the system. Keller et al. [64] proposed a method for visualizing time-dependent similarities and dissimilarities between the components of a high-dimensional time series. The method, derived from correspondence analysis, essentially counts pattern type frequencies. At each time, the method quantifies how inhomogeneous the set of time series components is and provides a one-dimensional representation of this system. The method was shown to be able to quantify long-term qualitative changes and local differences in scalp EEG activity for children with epileptic disorders. Similarities and dissimilarities between the channels were calculated in terms of a scaling parameter, allowing discriminating the components with respect to a specific weighting of the pattern frequencies.
A related issue, when dealing with inherently multivariate data sets, is the evaluation of coupling direction between subparts of the considered system (see Section 3.4). Staniek et al. [81] combined transfer and permutation entropy, to analyze electroencephalographic recordings from 15 epilepsy patients. The results showed that the derived metric could reliably identify the hemisphere containing the epileptic focus, without observing actual seizure activity. Finally, Li et al. [82] proposed a methodology based on permutation analysis and conditional mutual information to estimate directionality of coupling between two neuronal populations. Simulations showed that this method outperformed conditional mutual information and Granger causality in a neuronal mass model, and in assessing the coupling direction between neuronal populations in a hippocampal rat model of focal epilepsy. This coupling direction estimation method also allowed tracing the propagation direction of the seizure events.
In summary, the studies reviewed above point at various ways in which permutation entropy can fruitfully be employed to tackle various fundamental theoretical and clinical issues associated with epilepsy. From a theoretical point of view, results using forbidden pattern statistics hint at a deterministic nature of the dynamics associated with epilepsy. From a clinical point of view, these results indicate that permutation entropy and particularly forbidden pattern statistics can be used not only to detect seizure onset but also to predict upcoming seizures before they actually occur. Furthermore, in spite of the conceptual similarity between forbidden ordinal patterns and standard EEG analysis based on visual inspection, forbidden ordinal patterns may provide additional information that is difficult to detect by visual inspection alone. Its clinical relevance, particularly in pre-surgical evaluation, is underscored for instance by Schindler et al.’s finding that the maximal number of forbidden patterns tended to occur more rarely in EEG signals recorded from the visually identified seizure-onset zone in patients who were not rendered seizure free by resection of that zone [59].

4.2. Anesthesia

Anesthetic drugs mainly exert their effects on the central nervous system. Thus, EEG technology can be used to assess the effects of anesthesia. Electroencephalogram-based monitors represent a supplement to standard anesthesia monitoring, the main aim of which is that of reducing the risk of awareness during surgery. Electroencephalogram-based parameters typically aim at reducing the complex observed electroencephalographic pattern to a single value associated with the anesthetic drug effect and clinical patient status, e.g., consciousness and unconsciousness. These issues were examined in various studies [70,72,73,74,79], which consistently showed that permutation entropy can be used to efficiently discriminate between different levels of consciousness during anesthesia, providing an index of the anesthetic drug effect.
Biological systems, such as the brain or the cardio-respiratory system, typically show activity over multiple time scales. Even at rest, the interplay between different regulatory systems ensures constant information exchange across these scales. Thus, a correct description should be more accurate when accounting for activity not just at one particular scale, but across all or most of the relevant scales at which the system operates. This intuition received important confirmations in two studies assessing the depth of anesthesia. Li et al. [83] proposed a multiscale permutation measure, called composite multi-scale permutation entropy (CMSPE), to quantifying the anesthetic drug effect on EEG recordings during sevoflurane anesthesia. Three sets of simulated EEG series during awake, light and deep anesthesia were examined. The results showed that the single-scale permutation entropy was blind to subtle transitions between light and deep anesthesia, while the CMSPE index tracked these changes accurately. Around the time of loss of consciousness, CMSPE responded significantly more rapidly than the single-scale permutation entropy. In addition, the prediction probability was slightly higher for CMSPE and correlated well with the level of anesthesia. These results were consistent with those of a recent study [74], where promising results in terms of evaluation of depth of anesthesia were found with both single-scale permutation and multiscale permutation entropy.

4.3. Cognitive Neuroscience

Understanding brain activity has an interest that goes beyond the clinical domain. For instance, cognitive neuroscience studies the biological substrates, mainly brain activity, underlying cognition. A typical cognitive neuroscience study involves averaging the brain (electrical or hemodynamic) response to given stimuli. Extracting the part of the observed response that is stimulus-specific from the inherent variability of brain activity is a challenging task. Schinkel and colleagues [75,76] showed how ordinal pattern methods can be used to achieve better signal-to-noise ratios. This was done using permutation entropy in conjunction with recurrence quantification analysis (RQA). The authors showed that this combination of methods can improve the analysis of event related potentials (ERP), i.e., the trial-averaged EEG signal time-locked to given behavioral events. The resulting technique, termed order patterns recurrence plots (OPRPs), was applied on EEG data recorded during a language processing experiment, resulting in a significant reduction of the number of trials required to extract a task-related ERP.
Ordinal patterns can also be used for classification purposes, between different trial types in cognitive neuroscience experiments. For instance, permutation entropy was employed to characterize signals from the electroencephalogram of three subjects performing four different motor imagery tasks, which were then classified using a support vector machine [84]. Subject-specific single-trial classification accuracy levels higher than conventional classifiers could be achieved, occasionally achieved perfect classification.

4.4. Heart Rhythms

Cardiac diseases are often associated with changes in heart rate variability and in characteristic patterns of beat-to-beat intervals (BBI). Discriminating between physiological and pathological BBI patterns represents a key diagnostic tool. Successful classification of time series of BBIs crucially depends on the availability of significant features. Permutation entropy has consistently been shown to greatly improve the ability to distinguish heart rate variability under different physiological and pathological conditions [54]. Ordinal pattern statistics was proven to be more efficient than established heart rate variability indicators at distinguishing between patients suffering from congestive heart failure from healthy subjects [17]. Ordinal patterns have also proved to be valuable features for the classification of fetal heart state [19] and could conceivably serve to develop and investigate clustering methods by considering the ordinal structure of a time series. Berg et al. [77] compared a large number of signal features, including conventional heart rate variability parameters, and a statistics based on ordinal patterns; the aim was to assess their ability to form the basis for suitable signal classifiers. The results for animal and humans suffering from myocardial infarction (MI) suggested that ordinal patterns may represent meaningful features.
The heart continuously interacts with other physiological regulatory mechanisms, and the failure of one system can trigger a breakdown of the entire network. Understanding and quantifying the complex coupling patterns interactions patterns between these systems represents a major theoretical challenge. Two studies suitably modified information theoretic measures of directionality of coupling with ordinal pattern statistics. Bahraminasab et al. [52] introduced a permutation entropy-based directionality index, which could distinguish unidirectional from bidirectional coupling, and reveal and quantify asymmetry in bidirectional coupling. The method was tested on cardiorespiratory data from 20 healthy subjects. Consistent with existing physiological literature, the results from this study showed that respiration drives the heart more than vice versa.
Taken together, these results illustrate the possible use of permutation entropy-based methods to tackle often non-trivial diagnostic problems in the field of cardiology. Conceptual simplicity and computational efficiency render this method of data analysis an excellent one for screening and detecting pathological patterns of physiological activity both in systems considered in isolation, such as the heart, and in coupled systems.

5. Econophysics Applications

Assessing the efficiency and the potential development of a given market is a fundamental issue in economics, as this has clear implications in terms of political economy. The main problem is that such assessment can only be performed by means of the analysis of the time series of market indicators, which are usually the only available objective output. The Efficient Market Hypothesis (EMH) stipulates that efficient markets should be perfectly unpredictable, as any deterministic structure can be used to outperform the market. As previously reviewed, PE can be used effectively to discriminate between deterministic chaos and random noise.
A natural way of doing that using the Bandt and Pompe methodology involves quantifying the forbidden patterns in the series, as their presence indicates a deterministic chaotic dynamics (see Section 3.1). This idea was first examined in [85], where real time series of different financial indicators (Dow Jones Industrial Average, Nasdaq Composite, IBM and Boeing NYSE stocks, and the ten year U.S. Bond interest rate) were shown to have a number of forbidden patterns at least two orders of magnitude higher than that expected if the different time series were random. By employing a rolling sample approach with a sliding window, it was also found that the evolution of the forbidden patterns allowed identifying periods of time where noise prevailed over the deterministic behavior of the financial indicators.
In addition to helping assessing the presence or absence of determinism, the number of forbidden patterns can also be used to quantify the amount of market structure, which in turn is an indicator of the level of stock market development. Therefore, statistics about ordinal patterns can be used as a model-independent measure of stock market inefficiency. In [86], the number of forbidden patterns and the normalized PE were estimated for the stock market indices of 32 different countries, including 18 developed and 14 emerging markets. Developed markets had a lower number of forbidden patterns and higher normalized PE, indicating that they are less predictable.
Expanding on this idea, Zunino and coworkers analyzed the location of stock [38], commodity [39] and sovereign bond [87] markets in the complexity-entropy causality plane (see Section 3.2). The EMH stipulates that efficient markets should be associated with large entropy and low complexity values. The presence of temporal patterns resulted in deviations from the position associated to a totally random process. Consequently, the distance to this random ideal location is used to quantify the inefficiency of the market under analysis. The results from [38,87] showed that the complexity-entropy causality plane could robustly discriminate emergent and developed stock markets.
Another common problem in stock market analysis is that of judging the degree of dependency between of two or more time series. In [46], authors propose a test based on ordinal patterns, which was described in Section 3.4. Furthermore, the method was evaluated against the daily financial returns of Dow Jones Industrial Average, S&P 500 and three exchange rate time series (French franc, German mark and Canadian dollar all against the U.S. dollar). Results indicate that all five time series are not independent, and thus substantially deviate from a random process.
Finally, it has very recently been shown [88] that volatility in energy markets can be effectively quantified by PE and its improved version FGPE, defined in Section 3.5. Through numerical examples the authors proved that these two approaches based on ordinal patterns are more appropriate for estimating the uncertainty associated to a time series than conventional measures of dispersion, such as the standard deviation. Moreover, the analysis of some typical electricity markets (Nord Pool, Ontario, Omel and four Australian markets) demonstrated the ability of these measures in detecting interesting features, such as seasonal behavior of the volatilities and relationships between markets.

6. Conclusions

In this work, we have reviewed the technique introduced exactly ten years ago by Bandt and Pompe [11], which is based on the assessment of the frequency of appearance of permutation patterns in a time series. The mathematical foundations of the method have been discussed, and some extensions of the original concept have been described.
The Bandt and Pompe methodology represents an extremely simple technique that only requires in its basic form two parameters: the pattern length/embedding dimension D and the embedding delay τ. Its most important merit resides in its ability of extracting useful knowledge about the dynamics of a system. Often the quantity of forbidden patterns is related to other classical non-linear quantifiers, as, for instance, the Lyapunov exponent [89], but can be calculated with minimum computational cost. Furthermore, the ordinal-pattern’s associated PDF is invariant with respect to nonlinear monotonous transformations. Accordingly, nonlinear drifts or scalings artificially introduced by a measurement device will not modify the quantifiers’ estimation, a nice property if one deals with experimental data [90]. A further valuable property is its robustness to both observational and dynamical noise [11]. Finally, it is model-free and can be applied to any type of time series, i.e., regular, chaotic, noisy, etc.
While the original goal of the PE was the discrimination of chaotic from random dynamics, it has soon became clear that this method can be used in an effective way to address a number of important problems in time series analysis: among others, (a) classifying different dynamics; (b) identifying break points in time series; (c) predicting future events; (d) determining time scales; (e) quantifying the dissimilarity between time series; or (f) identifying directionality and causality. Furthermore, while the method was originally designed to deal with simple scalar time series, it has been successfully extended to multi-variate and multi-scale systems.
Several applications to economical and biological systems have been discussed. Yet, uncountable other examples of applications can be found in the literature: they include characterization of correlated stochastic processes [91,92,93] and lasers dynamics [94,95,96,97], identification of the quantum-classical transition [20,98,99,100], analysis of solar winds time series [101] and of climate evolution [90], songs classification [102], analysis of motor current signals [103], control of machine tool chatter phenomena [104], characterization of gene expression [105], optimization of grid computing [79], characterization and improvements of pseudo-random number generators (PSRG) [7,106,107,108,109], determination of the sampling period for chaotic attractors which preserves the chaotic dynamics [110], and encryption test of messages in lasers signals [111].

Acknowledgments

LZ and OAR were supported by the Consejo Nacional de Investigaciones Científicas y Técnicas (CONICET), Argentina. O. A. Rosso gratefully acknowledge support from CNPq fellowship, Brazil.

References

  1. Gray, R.M. Entropy and Information Theory; Springer: Berlin/Heidelberg, Germany, 1990. [Google Scholar]
  2. Brissaud, J.B. The meaning of entropy. Entropy 2005, 7, 68–96. [Google Scholar] [CrossRef]
  3. Shannon, C.E. A mathematical theory of communication. Bell Syst. Tech. J. 1948, 27, 379–423. [Google Scholar] [CrossRef]
  4. Shannon, C.; Weaver, W. The Mathematical Theory of Communication; University of Illinois Press: Champaign, IL, USA, 1949. [Google Scholar]
  5. Feldman, D.P.; Crutchfield, J.P. Measures of statistical complexity: Why? Phys. Lett. A 1998, 238, 244–252. [Google Scholar] [CrossRef]
  6. Rosso, O.A.; Craig, H.; Moscato, P. Shakespeare and other English renaissance authors as characterized by Information Theory complexity quantifiers. Physia A 2009, 388, 916–926. [Google Scholar] [CrossRef]
  7. De Micco, L.; González, C.M.; Larrondo, H.A.; Martín, M.T.; Plastino, A.; Rosso, O.A. Randomizing nonlinear maps via symbolic dynamics. Physia A 2008, 387, 3373–3383. [Google Scholar] [CrossRef]
  8. Mischaikow, K.; Mrozek, M.; Reiss, J.; Szymczak, A. Construction of symbolic dynamics from experimental time series. Phys. Rev. Lett. 1999, 82, 1144–1147. [Google Scholar] [CrossRef]
  9. Powell, G.E.; Percival, I.C. A spectral entropy method for distinguishing regular and irregular motion of hamiltonian systems. J. Phys. A: Math. Gen. 1979, 12, 2053–2071. [Google Scholar] [CrossRef]
  10. Rosso, O.A.; Blanco, S.; Jordanova, J.; Kolev, V.; Figliola, A.; Schürmann, M.; Başar, E. Wavelet entropy: A new tool for analysis of short duration brain electrical signals. J. Neurosci. Meth. 2001, 105, 65–75. [Google Scholar] [CrossRef]
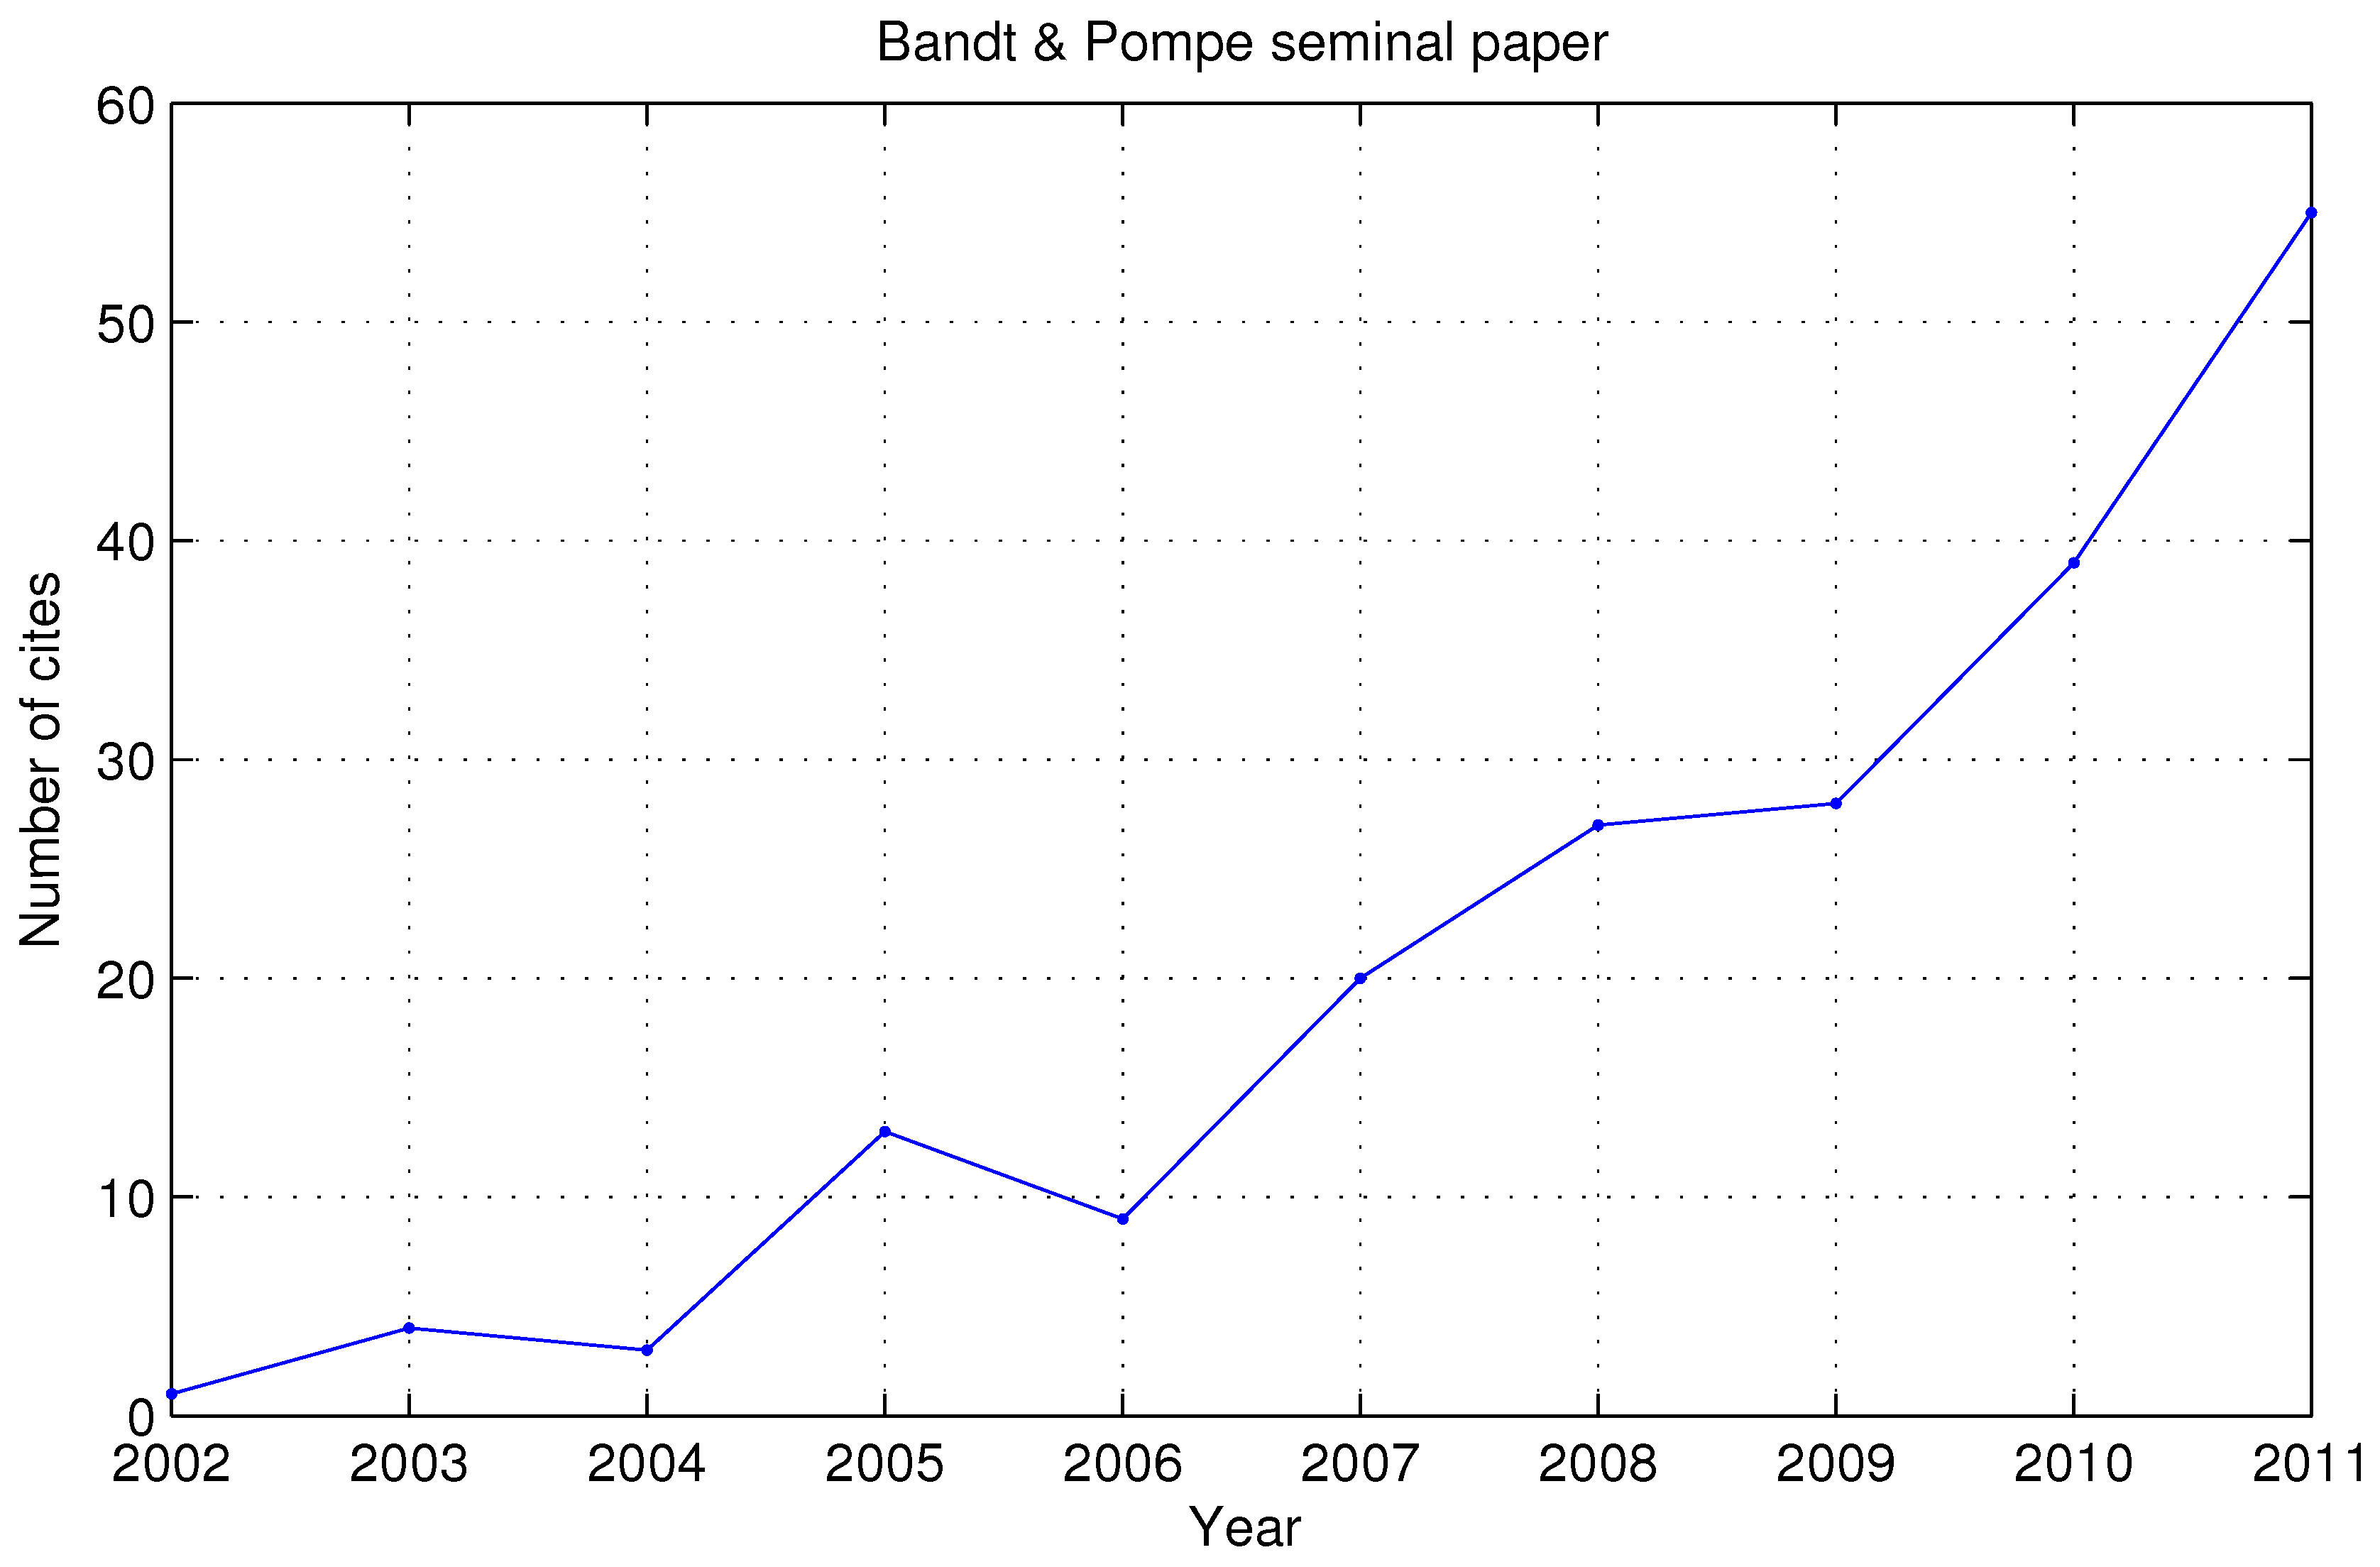
  11. Bandt, C.; Pompe, B. Permutation entropy: A natural complexity measure for time series. Phys. Rev. Lett. 2002, 88, 174102:1–174102:4. [Google Scholar] [CrossRef]
  12. Martín, M.T.; Plastino, A.; Rosso, O.A. Generalized statistical complexity measures: Geometrical and analytical properties. Physia A 2006, 369, 439–462. [Google Scholar] [CrossRef]
  13. Rosso, O.A.; Larrondo, H.A.; Martín, M.T.; Plastino, A.; Fuentes, M.A. Distinguishing noise from chaos. Phys. Rev. Lett. 2007, 99, 154102:1–154102:4. [Google Scholar] [CrossRef]
  14. Rosso, O.A.; Carpi, L.C.; Saco, P.M.; Ravetti, M.G.; Plastino, A.; Larrondo, H.A. Causality and the entropy-complexity plane: Robustness and missing ordinal patterns. Phys. A 2012, 391, 42–55. [Google Scholar] [CrossRef]
  15. Rosso, O.A.; De Micco, L.; Larrondo, H.; Martín, M.T.; Plastino, A. Generalized statistical complexity measure. Int. J. Bifurc. Chaos 2010, 20, 775–785. [Google Scholar] [CrossRef]
  16. Parlitz, U.; Berg, S.; Luther, S.; Schirdewan, A.; Kurths, J.; Wessel, N. Classifying Cardiac Biosignals Using Pattern Statistics and Symbolic Dynamics. In Proceedings of the 6th ESGCO, Berlin, Germany, 12–14 April 2010.
  17. Parlitz, U.; Berg, S.; Luther, S.; Schirdewan, A.; Kurths, J.; Wessel, N. Classifying cardiac biosignals using ordinal pattern statistics and symbolic dynamics. Comput. Biol. Med. 2012, 42, 319–327. [Google Scholar] [CrossRef] [PubMed]
  18. Peitgen, H.O.; Jürgens, H.; Saupe, D. Chaos and Fractals, New Frontiers of Science; Springer-Verlag: New York, NY, USA, 1992. [Google Scholar]
  19. Frank, B.; Pompe, B.; Schneider, U.; Hoyer, D. Permutation entropy improves fetal behavioural state classification based on heart rate analysis from biomagnetic recordings in near term fetuses. Med. Biol. Eng. Comput. 2006, 44, 179–187. [Google Scholar] [CrossRef] [PubMed]
  20. Kowalski, A.M.; Martín, M.T.; Plastino, A.; Rosso, O.A. Bandt-Pompe approach to the classical-quantum transition. Phys. D 2007, 233, 21–31. [Google Scholar] [CrossRef]
  21. Bandt, C. Ordinal time series analysis. Ecol. Model. 2005, 182, 229–238. [Google Scholar] [CrossRef]
  22. Zunino, L.; Soriano, M.C.; Fischer, I.; Rosso, O.A.; Mirasso, C.R. Permutation-information-theory approach to unveil delay dynamics from time-series analysis. Phys. Rev. E 2010, 82, 046212:1–046212:9. [Google Scholar] [CrossRef]
  23. Soriano, M.C.; Zunino, L.; Rosso, O.A.; Fischer, I.; Mirasso, C.R. Time scales of a chaotic semiconductor laser with optical feedback under the lens of a permutation information analysis. IEEE J. Quantum Electron. 2011, 47, 252–261. [Google Scholar] [CrossRef] [Green Version]
  24. Soriano, M.C.; Zunino, L.; Larger, L.; Fischer, I.; Mirasso, C.R. Distinguishing fingerprints of hyperchaotic and stochastic dynamics in optical chaos from a delayed opto-electronic oscillator. Opt. Lett. 2011, 36, 2212–2214. [Google Scholar] [CrossRef] [PubMed]
  25. Amigó, J.M.; Kocarev, L.; Szczepanski, J. Order patterns and chaos. Phys. Lett. A 2006, 355, 27–31. [Google Scholar] [CrossRef]
  26. Amigó, J.M.; Zambrano, S.; Sanjuán, M.A.F. True and false forbidden patterns in deterministic and random dynamics. Europhys. Lett. 2007, 79. [Google Scholar] [CrossRef]
  27. Amigó, J.M.; Zambrano, S.; Sanjuán, M.A.F. Combinatorial detection of determinism in noisy time series. Europhys. Lett. 2008, 83. [Google Scholar] [CrossRef]
  28. Amigó, J.M. Permutation Complexity in Dynamical Systems; Springer-Verlag: Berlin/Heidelberg, Germany, 2010. [Google Scholar]
  29. Bandt, C.; Shiha, F. Order patterns in time series. J. Time Ser. Anal. 2007, 28, 646–665. [Google Scholar] [CrossRef]
  30. Carpi, L.C.; Saco, P.M.; Rosso, O.A. Missing ordinal patterns in correlated noises. Phys. A 2010, 389, 2020–2029. [Google Scholar] [CrossRef]
  31. Feldman, D.P.; McTague, C.S.; Crutchfield, J.P. The organization of intrinsic computation: Complexity-entropy diagrams and the diversity of natural information processing. Chaos 2008, 18. [Google Scholar] [CrossRef] [PubMed]
  32. Lamberti, P.W.; Martín, M.T.; Plastino, A.; Rosso, O.A. Intensive entropic nontriviality measure. Phys. A 2004, 334, 119–131. [Google Scholar] [CrossRef]
  33. Rosso, O.A.; Masoller, C. Detecting and quantifying stochastic and coherence resonances via information-theory complexity measurements. Phys. Rev. E 2009, 79, 040106R:1–040106R:4. [Google Scholar] [CrossRef]
  34. Rosso, O.A.; Masoller, C. Detecting and quantifying temporal correlations in stochastic resonance via information theory measures. Eur. Phys. J. B 2009, 69, 37–43. [Google Scholar] [CrossRef]
  35. López-Ruiz, R.; Mancini, H.L.; Calbet, X. A statistical measure of complexity. Phys. Lett. A 1995, 209, 321–326. [Google Scholar] [CrossRef]
  36. Kowalski, A.M.; Martín, M.T.; Plastino, A.; Rosso, O.A.; Casas, M. Distances in probability space and the statistical complexity setup. Entropy 2011, 13, 1055–1075. [Google Scholar] [CrossRef] [Green Version]
  37. Grosse, I.; Bernaola-Galván, P.; Carpena, P.; Román-Roldán, R.; Oliver, J.; Stanley, H.E. Analysis of symbolic sequences using the Jensen-Shannon divergence. Phys. Rev. E 2002, 65. [Google Scholar] [CrossRef]
  38. Zunino, L.; Zanin, M.; Tabak, B.M.; Pérez, D.G.; Rosso, O.A. Complexity-entropy causality plane: A useful approach to quantify the stock market inefficiency. Phys. A 2010, 389, 1891–1901. [Google Scholar] [CrossRef]
  39. Zunino, L.; Tabak, B.M.; Serinaldi, F.; Zanin, M.; Pérez, D.G.; Rosso, O.A. Commodity predictability analysis with a permutation information theory approach. Phys. A 2011, 390, 876–890. [Google Scholar] [CrossRef]
  40. Masoller, C.; Rosso, O.A. Quantifying the complexity of the delayed logistic map. Philos. Trans. Roy. Soc. A 2011, 369, 425–438. [Google Scholar] [CrossRef] [PubMed]
  41. Lepri, S.; Giacomelli, G.; Politi, A.; Arecchi, F.T. High-dimensional chaos in delayed dynamical systems. Phys. D 1994, 70, 235–249. [Google Scholar] [CrossRef]
  42. Fraser, A.M.; Swinney, H.L. Independent coordinates for strange attractors from mutual information. Phys. Rev. A 1986, 33, 1134–1140. [Google Scholar] [CrossRef] [PubMed]
  43. Mackey, M.C.; Glass, L. Oscillation and chaos in physiological control systems. Science 1977, 197, 287–289. [Google Scholar] [CrossRef] [PubMed]
  44. Xiang, S.; Pan, W.; Luo, B.; Yan, L.; Zou, X.; Jiang, N.; Yang, L.; Zhu, H. Conceal time-delay signature of chaotic vertical-cavity surface-emitting lasers by variable-polarization optical feedback. Opt. Commun. 2011, 284, 5758–5765. [Google Scholar] [CrossRef]
  45. Wu, J.G.; Wu, Z.M.; Xia, G.Q.; Feng, G.Y. Evolution of time delay signature of chaos generated in a mutually delay-coupled semiconductor lasers system. Opt. Express 2012, 20, 1741–1753. [Google Scholar] [CrossRef] [PubMed]
  46. Matilla-García, M.; Ruiz Marín, M. A non-parametric independence test using permutation entropy. J. Econom. 2008, 144, 139–155. [Google Scholar] [CrossRef]
  47. López, F.; Matilla-García, M.; Mur, J.; Ruiz Marín, M. A non-parametric spatial independence test using symbolic entropy. Reg. Sci. Urban Econ. 2010, 40, 106–115. [Google Scholar] [CrossRef]
  48. Matilla-García, M.; Ruiz Marín, M. Spatial symbolic entropy: A tool for detecting the order of contiguity. Geogr. Anal. 2011, 43, 228–239. [Google Scholar] [CrossRef]
  49. Herrera Gómez, M.; Ruiz Marín, M.; Mur, J.; Paelinck, J. A non-parametric approach to spatial causality. In 9mes Journées Internationales dEconometrie et de Statistique Spatiales, Orléans, France, 24–25 June 2010.
  50. Cánovas, J.S.; Guillamón, A.; Ruíz, M.C. Using permutations to detect dependence between time series. Phys. D 2011, 240, 1199–1204. [Google Scholar] [CrossRef]
  51. Freeman, G.H.; Halton, J.H. Note on an exact treatment of contingency, goodness of fit and other problems of significance. Biometrika 1951, 38, 141–149. [Google Scholar] [CrossRef] [PubMed]
  52. Bahraminasab, A.; Ghasemi, F.; Stefanovska, A.; McClintock, P.V.E.; Kantz, H. Direction of coupling from phases of interacting oscillators: A permutation information approach. Phys. Rev. Lett. 2008, 100, 084101:1–084101:4. [Google Scholar] [CrossRef]
  53. Liu, X.-F.; Wang, Y. Fine-grained permutation entropy as a measure of natural complexity for time series. Chin. Phys. B 2009, 18, 2690–2695. [Google Scholar]
  54. Bian, C.; Qin, C.; Ma, Q.D.Y.; Shen, Q. Modied permutation-entropy analysis of heartbeat dynamics. Phys. Rev. E 2012, 85, 021906:1–021906:7. [Google Scholar] [CrossRef]
  55. Goldberger, A.L.; Amaral, L.A.N.; Hausdorff, J.M.; Ivanov, P.; Peng, C.K.; Stanley, H.E. Fractal dynamics in physiology: Alterations with disease and aging. Proc. Natl. Acad. Sci. USA 2002, 99, 2466–2472. [Google Scholar] [CrossRef] [PubMed]
  56. Kenet, T.; Bibitchkov, D.; Tsodyks, M.; Grinvald, A.; Arieli, A. Spontaneously emerging cortical representations of visual attributes. Nature 2003, 425, 954–956. [Google Scholar] [CrossRef] [PubMed]
  57. Beggs, J.; Plenz, D. Neuronal avalanches in neocortical circuits. J. Neurosci. 2003, 23, 11167–11177. [Google Scholar] [PubMed]
  58. Dragoi, G.; Tonegawa, S. Preplay of future place cell sequences by hippocampal cellular assemblies. Nature 2011, 469, 397–401. [Google Scholar] [CrossRef] [PubMed]
  59. Schindler, K.; Gast, H.; Stieglitz, L.; Stibal, A.; Hauf, M.; Wiest, R.; Mariani, L.; Rummel, C. Forbidden ordinal patterns of periictal intracranial EEG indicate deterministic dynamics in human epileptic seizures. Epilepsia 2011, 52, 1771–1780. [Google Scholar] [CrossRef] [PubMed]
  60. Stam, C.J. Nonlinear dynamical analysis of EEG and MEG: Review of an emerging field. Clin. Neurophysiol. 2005, 116, 2266–2301. [Google Scholar] [CrossRef] [PubMed]
  61. Pereda, E.; Quiroga, R.Q.; Bhattacharya, J. Nonlinear multivariate analysis of neurophysiological signals. Prog. Neurobiol. 2005, 77, 1–37. [Google Scholar] [CrossRef] [PubMed]
  62. Groth, A. Visualization of coupling in time series by order recurrence plots. Phys. Rev. E 2005, 72, 046220:1–046220:8. [Google Scholar] [CrossRef]
  63. Cao, Y.; Tung, W.; Gao, J.B.; Protopopescu, V.A.; Hively, L.M. Detecting dynamical changes in time series using the permutation entropy. Phys. Rev. E 2004, 70. [Google Scholar] [CrossRef]
  64. Keller, K.; Wittfeld, K. Distances of time series components by means of symbolic dynamics. Int. J. Bifurc. Chaos 2004, 14, 693–703. [Google Scholar] [CrossRef]
  65. Veisi, I.; Pariz, N.; Karimpour, A. Fast and Robust Detection of Epilepsy in Noisy EEG Signals Using Permutation Entropy. In Proceedings of the 7th IEEE International Conference on Bioinformatics and Bioengineering, Boston, MA, USA, 14–17 October 2007; pp. 200–203.
  66. Li, X.; Ouyang, G.; Richards, D.A. Predictability analysis of absence seizures with permutation entropy. Epilepsy Res. 2007, 77, 70–74. [Google Scholar] [CrossRef] [PubMed]
  67. Ouyang, G.; Li, X.; Dang, C.; Richards, D.A. Deterministic dynamics of neural activity during absence seizures in rats. Phys. Rev. E 2009, 79, 041146:1–041146:8. [Google Scholar] [CrossRef]
  68. Ouyang, G.; Dang, C.; Richards, D.A.; Li, X. Ordinal pattern based similarity analysis for EEG recordings. Clin. Neurophysiol. 2010, 121, 694–703. [Google Scholar] [CrossRef] [PubMed]
  69. Bruzzo, A.A.; Gesierich, B.; Santi, M.; Tassinari, C.; Birbaumer, N.; Rubboli, G. Permutation entropy to detect vigilance changes and preictal states from scalp EEG in epileptic patients: A preliminary study. Neurol. Sci. 2008, 29, 3–9. [Google Scholar] [CrossRef] [PubMed]
  70. Jordan, D.; Stockmanns, G.; Kochs, E.F.; Pilge, S.; Schneider, G. Electroencephalographic order pattern analysis for the separation of consciousness and unconsciousness: An analysis of approximate entropy, permutation entropy, recurrence rate, and phase coupling of order recurrence plots. Anesthesiology 2008, 109, 1014–1022. [Google Scholar] [CrossRef] [PubMed]
  71. Li, X.; Cui, S.M.E.; Voss, L.J. Using permutation entropy to measure the electroencephalographic effect of sevoflurane. Anesthesiology 2007, 109, 448–456. [Google Scholar] [CrossRef] [PubMed]
  72. Olofsen, E.; Sleigh, J.W.; Dahan, A. Permutation entropy of the electroencephalogram: A measure of anaesthetic drug effect. Br. J. Anaesth. 2008, 101, 810–821. [Google Scholar] [CrossRef] [PubMed]
  73. Silva, A.; Cardoso-Cruz, H.; Silva, F.; Galhardo, V.; Antunes, L. Comparison of anesthetic depth indexes based on thalamocortical local field potentials in rats. Anesthesiology 2010, 112, 355–363. [Google Scholar] [CrossRef] [PubMed]
  74. Silva, A.; Campos, S.; Monteiro, J.; Venâncio, C.; Costa, B.; Guedes de Pinho, P.; Antunes, L. Performance of anesthetic depth indexes in rabbits under propofol anesthesia. Anesthesiology 2011, 115, 303–314. [Google Scholar] [CrossRef] [PubMed]
  75. Schinkel, S.; Marwan, N.; Kurths, J. Order patterns recurrence plots in the analysis of ERP data. Cogn. Neurodyn. 2007, 1, 317–325. [Google Scholar] [CrossRef] [PubMed]
  76. Schinkel, S.; Marwan, N.; Kurths, J. Brain signal analysis based on recurrences. J. Physiol. 2009, 103, 315–323. [Google Scholar] [CrossRef] [PubMed]
  77. Berg, S.; Luther, S.; Lehnart, S.E.; Hellenkamp, K.; Bauernschmitt, R.; Kurths, J.; Wessel, N.; Parlitz, U. Comparison of Features Characterizing Beat-to-Beat Time Series. In Proceedings of Biosignal, Berlin, Germany, 14–16 July 2010.
  78. Nicolaou, N.; Georgiou, J. Detection of epileptic electroencephalogram based on Permutation Entropy and Support Vector Machines. Expert Syst. Appl. 2012, 39, 202–209. [Google Scholar] [CrossRef]
  79. Li, H.; Muskulus, M.; Heusdens, R.; Wolters, L. Analysis and Synthesis of Pseudo-Periodic Job Arrivals in Grids: A Matching Pursuit Approach. In Proceedings of the Seventh IEEE International Symposium on Cluster Computing and the Grid, Rio De Janeiro, Brazil, 14–17 May 2007; pp. 183–196.
  80. Wendling, F.; Chauvel, P.; Biraben, A.; Bartolomei, F. From intracerebral EEG signals to brain connectivity: Identification of epileptogenic networks in partial epilepsy. Front. Syst. Neurosci. 2010, 4. [Google Scholar] [CrossRef] [PubMed]
  81. Staniek, M.; Lehnertz, K. Symbolic transfer entropy. Phys. Rev. Lett. 2008, 100, 158101:1–158101:4. [Google Scholar] [CrossRef]
  82. Li, X.; Ouyang, G. Estimating coupling direction between neuronal populations with permutation conditional mutual information. Neuroimage 2010, 52, 497–507. [Google Scholar] [CrossRef] [PubMed]
  83. Li, D.; Li, X.; Liang, Z.; Voss, L.J.; Sleigh, J.W. Multiscale permutation entropy analysis of EEG recordings during sevoflurane anesthesia. J. Neural Eng. 2010, 7. [Google Scholar] [CrossRef] [PubMed]
  84. Nicolaou, N.; Georgiou, J. Permutation Entropy: A New Feature for Brain-Computer Interfaces. In Proceedings of the IEEE Biomedical Circuits and Systems Conference, Paphos, Cyprus, 3–5 November 2010; pp. 49–52.
  85. Zanin, M. Forbidden patterns in financial time series. Chaos 2008, 18. [Google Scholar] [CrossRef] [PubMed]
  86. Zunino, L.; Zanin, M.; Tabak, B.M.; Pérez, D.G.; Rosso, O.A. Forbidden patterns, permutation entropy and stock market inefficiency. Phys. A 2009, 388, 2854–2864. [Google Scholar] [CrossRef]
  87. Zunino, L.; Bariviera, A.F.; Guercio, M.B.; Martinez, L.B.; Rosso, O.A. On the efficiency of sovereign bond markets. Phys. A 2012, 391, 4342–4349. [Google Scholar] [CrossRef]
  88. Ruiz, M.C.; Guillamón, A.; Gabaldón, A. A new approach to measure volatility in energy markets. Entropy 2012, 14, 74–91. [Google Scholar] [CrossRef]
  89. Amigó, J.M.; Kennel, M.B.; Kocarev, L. The permutation entropy rate equals the metric entropy rate for ergodic information sources and ergodic dynamical systems. Phys. D 2005, 210. [Google Scholar] [CrossRef]
  90. Saco, P.M.; Carpi, L.C.; Figliola, A.; Serrano, E.; Rosso, O.A. Entropy analysis of the dynamics of El Niño/Southern oscillation during the holocene. Phys. A 2010, 389, 5022–5027. [Google Scholar] [CrossRef]
  91. Rosso, O.A.; Zunino, L.; Pérez, D.G.; Figliola, A.; Larrondo, H.A.; Garavaglia, M.; Martín, M.T.; Plastino, A. Extracting features of Gaussian self-similar stochastic processes via the Bandt-Pompe approach. Phys. Rev. E 2007, 76, 061114:1–061114:6. [Google Scholar] [CrossRef]
  92. Zunino, L.; Pérez, D.G.; Martín, M.T.; Garavaglia, M.; Plastino, A.; Rosso, O.A. Permutation entropy of fractional Brownian motion and fractional Gaussian noise. Phys. Lett. A 2008, 372, 4768–4774. [Google Scholar] [CrossRef]
  93. Zunino, L.; Pérez, D.G.; Kowalski, A.; Martín, M.T.; Garavaglia, M.; Plastino, A.; Rosso, O.A. Fractional Brownian motion, fractional Gaussian noise, and Tsallis permutation entropy. Phys. A 2008, 387, 6057–6068. [Google Scholar] [CrossRef]
  94. Tiana-Alsina, J.; Torrent, M.C.; Rosso, O.A.; Masoller, C.; Garcia-Ojalvo, J. Quantifying the statistical complexity of low-frequency fluctuations in semiconductor lasers with optical feedback. Phys. Rev. A 2010, 82. [Google Scholar] [CrossRef]
  95. Tiana-Alsina, J.; Buldu, J.M.; Torrent, M.C.; Garcia-Ojalvo, J. Quantifying stochasticity in the dynamics of delay-coupled semiconductor lasers via forbidden patterns. Philos. Trans. Roy. Soc. A 2010, 368, 367–377. [Google Scholar] [CrossRef] [PubMed]
  96. Xiang, S.; Pan, W.; Yan, L.; Luo, B.; Zou, X.; Jiang, N.; Wen, K. Influence of polarization mode competition on chaotic unpredictability of vertical-cavity surface-emitting lasers with polarization-rotated optical feedback. Opt. Lett. 2011, 36, 310–312. [Google Scholar] [CrossRef] [PubMed]
  97. Zunino, L.; Rosso, O.A.; Soriano, M.C. Characterizing the hyperchaotic dynamics of a semiconductor laser subject to optical feedback via permutation entropy. IEEE J. Sel. Top. Quantum Electron. 2011, 17, 1250–1257. [Google Scholar] [CrossRef] [Green Version]
  98. Kowalski, A.M.; Martín, M.T.; Plastino, A.; Zunino, L. Information flow during the quantum-classical transition. Phys. Lett. A 2010, 374, 1819–1826. [Google Scholar] [CrossRef]
  99. Kowalski, A.M.; Martín, M.T.; Zunino, L.; Plastino, A.; Casas, M. The quantum-classical transition as an information flow. Entropy 2010, 12, 148–160. [Google Scholar] [CrossRef] [Green Version]
  100. Kowalski, A.M.; Martín, M.T.; Plastino, A.; Rosso, O.A. Chaos and complexity in the classical-quantum transition. Int. J. Appl. Math. Stat. 2012, 26, 67–80. [Google Scholar]
  101. Suyal, V.; Prasad, A.; Singh, H.P. Hysteresis in a solar activity cycle. Solar Phys. 2012, 276, 407–414. [Google Scholar] [CrossRef]
  102. Ribeiro, H.V.; Zunino, L.; Mendes, R.S.; Lenzi, E.K. Complexity-entropy causality plane: A useful approach for distinguishing songs. Phys. A 2012, 391, 2421–2428. [Google Scholar] [CrossRef]
  103. Li, X.; Ouyang, G.; Liang, Z. Complexity measure of motor current signals for tool flute breakage detection in end milling. Int. J. Mach. Tools Manuf. 2008, 48, 371–379. [Google Scholar] [CrossRef]
  104. Nair, U.; Krishna, B.M.; Namboothiri, V.N.N.; NaMpoori, V.P.N. Permutation entropy based real-time chatter detection using audio signal in turning process. Int. J. Adv. Manuf. Technol. 2010, 46, 61–68. [Google Scholar] [CrossRef]
  105. Sun, X.; Zou, Y.; Nikiforova, V.; Kurths, J.; Walther, D. The complexity of gene expression dynamics revealed by permutation entropy. BMC Bioinform. 2010, 11. [Google Scholar] [CrossRef] [PubMed]
  106. Larrondo, H.A.; González, C.M.; Martín, M.T.; Plastino, A.; Rosso, O.A. Intensive statistical complexity measure of pseudorandom number generators. Phys. A 2005, 356, 133–138. [Google Scholar] [CrossRef]
  107. Larrondo, H.A.; Martín, M.T.; González, C.M.; Plastino, A.; Rosso, O.A. Random number generators and causality. Phys. Lett. A 2006, 352, 421–425. [Google Scholar] [CrossRef]
  108. De Micco, L.; Larrondo, H.A.; Plastino, A.; Rosso, O. Quantifiers for randomness of chaotic pseudo-random number generators. Philos. Trans. Roy. Soc. A 2009, 367, 3281–3296. [Google Scholar] [CrossRef] [PubMed]
  109. De Micco, L.; Petrocelli, R.A.; Rosso, O.A.; Plastino, A.; Larrondo, H.A. Mixing chaotic maps and electromagnetic interference reduction. Int. J. Appl. Math. Stat. 2012, 26, 106–120. [Google Scholar]
  110. De Micco, L.; Fernández, J.G.; Larrondo, H.A.; Plastino, A.; Rosso, O.A. Sampling period, statistical complexity, and chaotic attractors. Phys. A 2012, 391, 2564–2575. [Google Scholar] [CrossRef]
  111. Rosso, O.A.; Vicente, R.; Mirasso, C.R. Encryption test of pseudo-aleatory messages embedded on chaotic laser signals: An Information Theory approach. Phys. Lett. A 2008, 372, 1018–1023. [Google Scholar] [CrossRef]

