Article

A Multi-Position Approach in a Smart Fiber-Optic Surveillance System for Pipeline Integrity Threat Detection

by
Javier Tejedor
1,*,
Javier Macias-Guarasa
2,
Hugo F. Martins
3,
Sonia Martin-Lopez
2 and
Miguel Gonzalez-Herraez
2
1
Information Technology, Escuela Politécnica Superior, Fundación Universitaria San Pablo CEU, 28668 Madrid, Spain
2
Electronics department, Escuela Politécnica Superior, Universidad de Alcalá, 28801 Madrid, Spain
3
Instituto de Óptica, Consejo Superior de Investigaciones Científicas (CISC), 28006 Madrid, Spain
*
Author to whom correspondence should be addressed.
Electronics 2021, 10(6), 712; https://doi.org/10.3390/electronics10060712
Submission received: 24 February 2021 / Revised: 11 March 2021 / Accepted: 15 March 2021 / Published: 18 March 2021
(This article belongs to the Special Issue Pattern Recognition and Applications)

Abstract

:
We present a new pipeline integrity surveillance system for long gas pipeline threat detection and classification. The system is based on distributed acoustic sensing with phase-sensitive optical time domain reflectometry ( ϕ -OTDR) and pattern recognition for event classification. The proposal incorporates a multi-position approach in a Gaussian Mixture Model (GMM)-based pattern classification system which operates in a real-field scenario with a thorough experimental procedure. The objective is exploiting the availability of vibration-related data at positions nearby the one actually producing the main disturbance to improve the robustness of the trained models. The system integrates two classification tasks: (1) machine + activity identification, which identifies the machine that is working over the pipeline along with the activity being carried out, and (2) threat detection, which aims to detect suspicious threats for the pipeline integrity (independently of the activity being carried out). For the machine + activity identification mode, the multi-position approach for model training obtains better performance than the previously presented single-position approach for activities that show consistent behavior and high energy (between 6% and 11% absolute) with an overall increase of 3% absolute in the classification accuracy. For the threat detection mode, the proposed approach gets an 8% absolute reduction in the false alarm rate with an overall increase of 4.5% absolute in the classification accuracy.

1. Introduction

Pipeline transmission is used as a transmission method to transport the energy sources based on liquid or gas from the producing factories to the final users. Special attention is needed from the factory operators in order to prevent unfortunate accidents [1,2], which can produce human deaths. Moreover, most incidents around the factories related to natural gas transmission happen when the pipelines are damaged by works carried out in their surroundings. Therefore, cost-effective solution development allowing for continuously monitoring suspicious activities that represent serious threats for the pipeline is a must.
Distributed Acoustic Sensing (DAS) technology can be effectively applied to this task, since this allows to continuously interrogate urban areas by measuring the activity occurring nearby a fiber-optic buried under the ground. Moreover, phase-sensitive Optical Time Domain Reflectometry ( ϕ -OTDR) in fiber-optics has been shown to be a suitable DAS technology: Conventional ϕ -OTDR-based sensors can sense several tens of kilometers, with spatial resolutions of a few meters, and have been shown to provide enough sensitivity to allow the detection of simulated signals [3] and people walking over a buried fiber [4]. By adding distributed optical amplification, sensing ranges of 100 km [5] and above 100 km have been demonstrated: In [6,7], vibrations of up to 250 Hz and 380 Hz, respectively, were detected in a range of 125 km with 10 m resolution. In [8], vibrations were detected in a range of 175 km with 25 m resolution. In [9], people intrusion is able to be detected for 131.5 km fiber-optic with 8 m resolution. Intrusion detection and vehicle detection were addressed in [10] on a 19 km fiber-optic path. Movements on the fiber-optic by hand touching were successfully detected in [11] for 12 km fiber optic, and in [12] for 175 km fiber-optic with 25 m resolution. Simulated sinusoidal signals areable to be detected within 60 km fiber-optic in [13]. Train monitoring with DAS has also been addressed: In [14], the system successfully detected the train over the fiber-optic within 20 m precision error, and in [15] the train movement was correctly detected along with its speed with an error of 5 km/h for trains running at 160 km/h. Regarding the detection bandwidth, which has its bottleneck on the fiber length, vibrations of up to 40 kHz have been detected for short distances (less than one kilometer) [16], vibrations of up to 8 kHz have also been detected for 1 km distance [17], and vibrations of up to 20 kHz have also been detected for 10 km distance [18].

1.1. Related Work

For pipeline surveillance, the combination of the DAS technology in long pipelines with pattern recognition system (PRS) strategies, which aim to recognize the activity being carried out, makes it effectively detect the vibration produced by a dangerous activity so that the prevented action can be undertaken: In [19], three different events (climbing, kicking, and raining) are classified from level crossing rate features extracted from the acoustic signals. In [20], multi-scale wavelet decomposition is used to generate the features for identifying human intrusion for mild, normal, and extreme weather conditions. In [21], three different events (background noise, air movement, and hand perturbation) were classified by employing singular spectrum analysis for feature extraction and neural networks for classification. In [22], energy features based on the fast Fourier transform (FFT) were extracted from the acoustic signals and a support vector machine was employed to classify five different events (background noise, people walking with wind, shaking the fence, people walking without wind, and vibration exciter). In [23], morphological features based on time and space domains were used within the feature extraction stage, and the relevance vector machine was employed for classifying three different events (people walking, digging, and vehicles). In [24,25], three different events are aimed to be classified (background noise, human intrusion, and hand clapping [24], and background noise, digging, and vehicles [25]) from multi-scale wavelet decomposition and multi-scale wavelet packet decomposition as features and a neural network-based pattern recognition strategy.
The works presented in [26,27,28,29] employ the same data as those used in this work and aim to classify eight different classes (big excavator moving along the ground, big excavator hitting the ground, big excavator scrapping the ground, small excavator moving along the ground, small excavator hitting the ground, small excavator scrapping the ground, plate compactor compacting the ground, and pneumatic hammer compacting the ground) in a machine + activity identification task, along with threat detection, whereas in [30], a system that addresses threat detection from the same data is presented. In [30], the features are based on the FFT and the energy in frequency bands, and the classification is carried out from Gaussian mixture modeling. The approach presented in [26] adds a new machine + activity identification mode and two feature vector normalization schema to the work presented in [30]. In [27], an augmented feature set (based on neural networks) with respect to the one used in [26] was presented and system combination was based on the different feature sets. The work presented in [28] incorporates a hidden Markov model (HMM) approach for acoustic signal classification over [26] and the work presented in [29] added this HMM approach to the system presented in [27].
A review of the target DAS + PRS scenarios can be found in [31], and an exhaustive review of DAS + PRS strategies which includes a thorough methodology regarding database construction can be found in [32].
Combining DAS + PRS technology can also be used to solve some other problems, such as the death of fishes in a fish farm addressed in [33] by taking preventive action when a non-authorized work is carried out in the fish farm surroundings. PRS technology can also be applied to smart grid infrastructure so that the critical issue is solved [34]. Moreover, edge computation is a growing technology in which DAS + PRS can also be implemented [35]. By using this technology, regarding the smart factory research field, a decision for each suspicious activity can be carried out so that the corresponding action can be undertaken.
Regarding the PRS technology itself, evolutionary algorithms that aim to mimic the behavior of the biological evolution such as the Chicken Swarm Optimization algorithm and its variants [36] can also be applied.
Special attention also deserves the use of robots for pipeline surveillance: In [37], an autonomous vehicle is employed to detect pipeline failures due to corrosion from Markov decision processes. In [38], the robot is employed to detect leakage along the pipeline and also integrates a mechanism to remove the obstacles the robot finds while traveling the path. In [39], an ultrasonic signal-based robotic system was proposed to detect pipeline defects. In [40], a two-leg robotic system is employed to monitor horizontal, vertical, and coupling pipes. In [41], an autonomous robot based on an A* algorithm is used for pipeline inspection. Video processing along with simulated annealing algorithms are used in the robotic system presented in [42] to inspect gas pipelines. Gaussian processes with covariance function for cylindrical structure representations have been employed in the context of water pipeline inspection in [43]. A review of the use of robots for pipeline inspection can be found in [44].

1.2. Motivation and Organization of This Paper
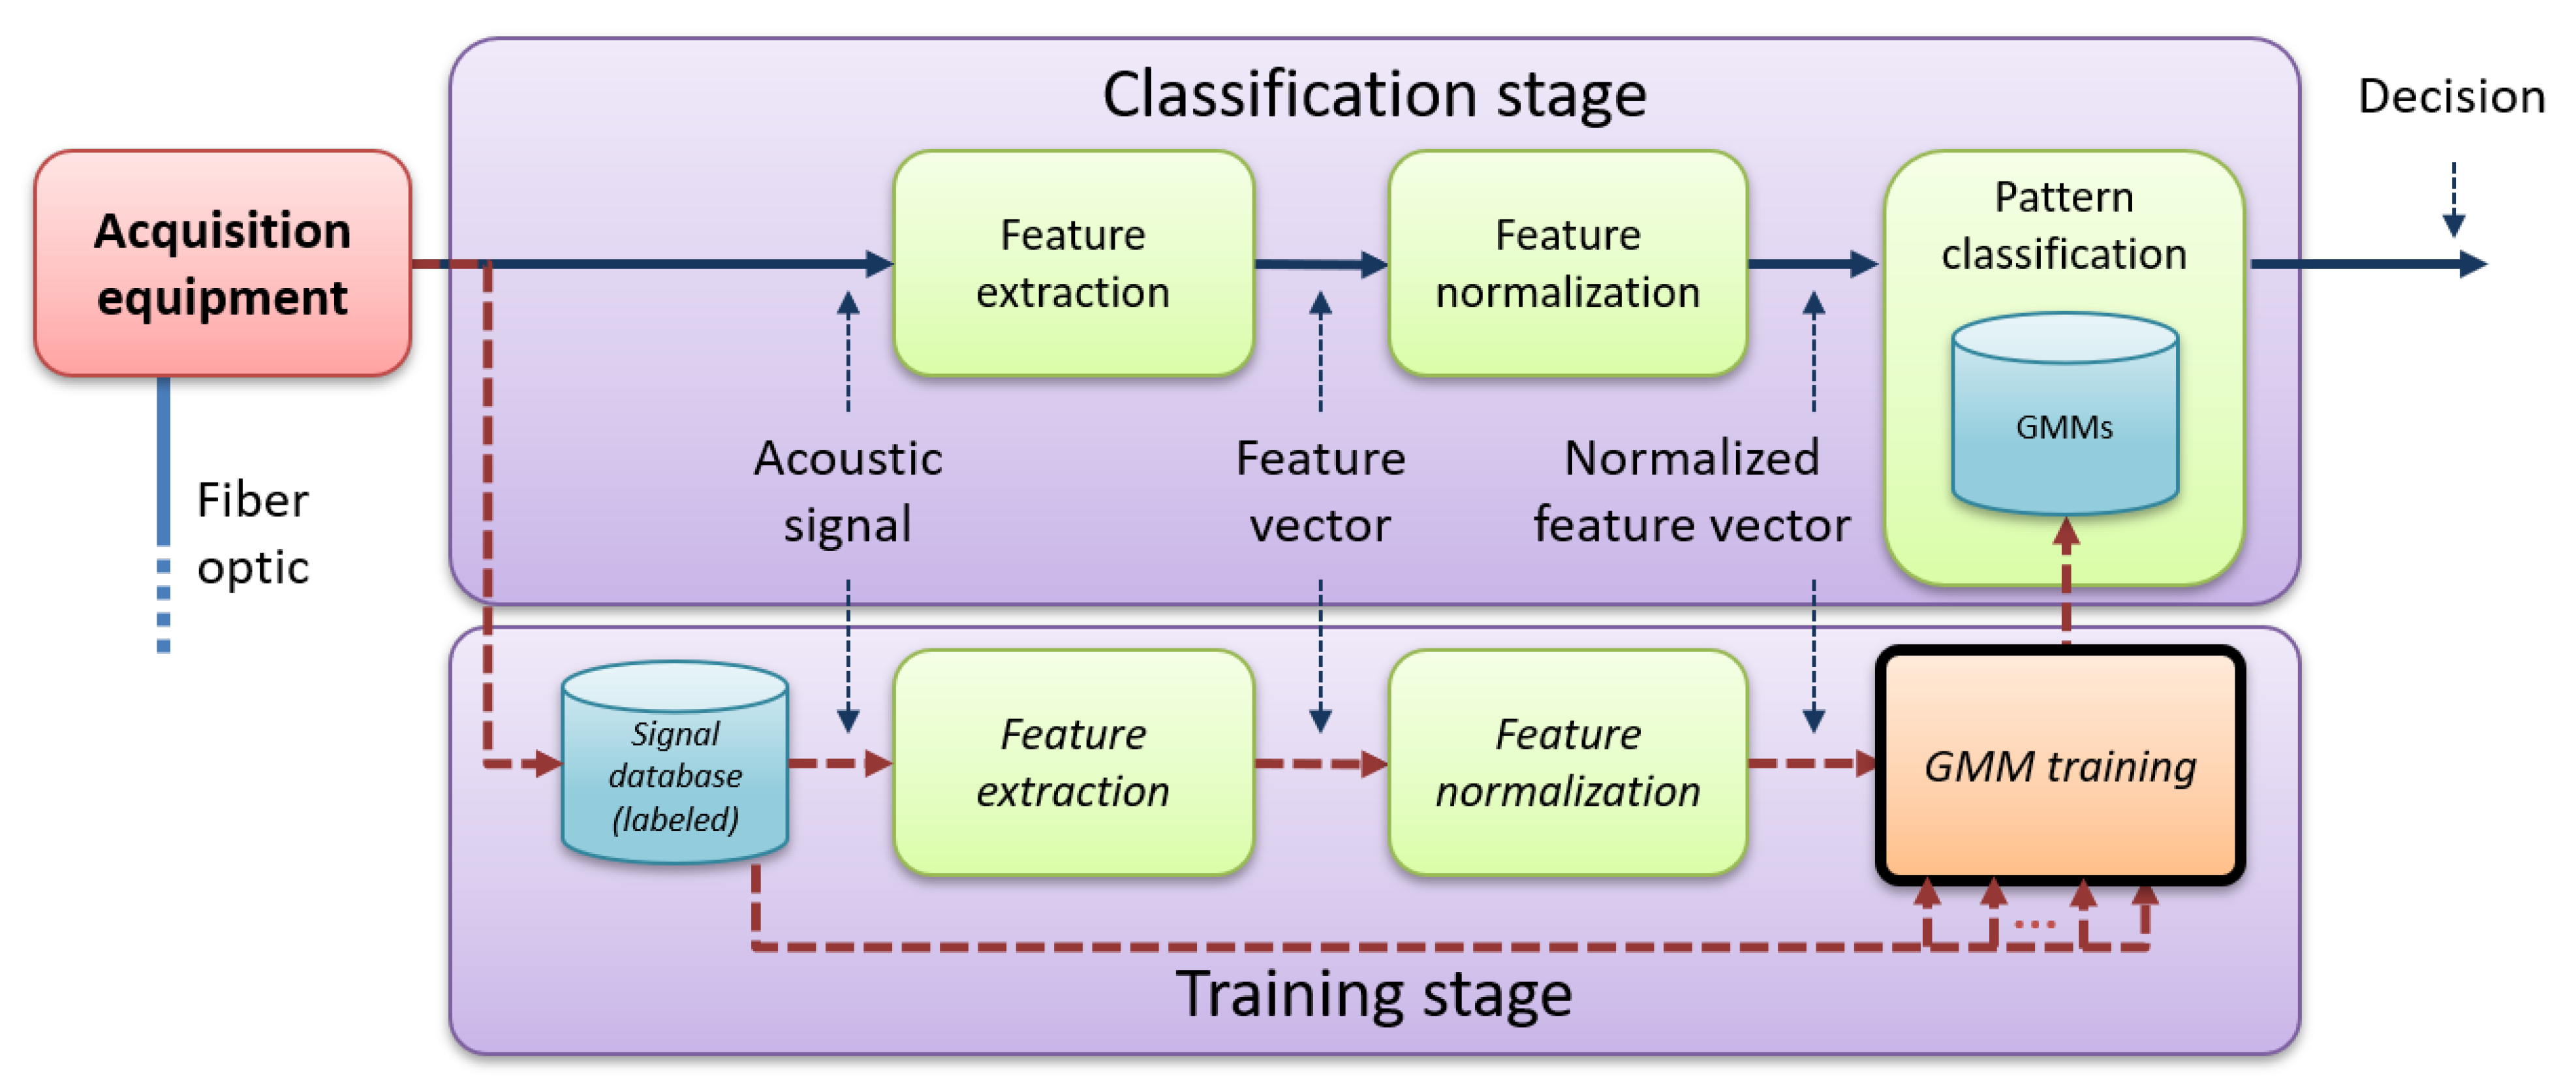
Many research works that combine DAS + PRS suffer from issues related to pattern classification design and experimental evaluation setups: real classification and results are not presented [45,46,47,48,49,50]; lack of details on both the system description and experimental conditions [25,51,52,53,54,55,56,57,58,59]; data are not obtained in realistic field environments [15,25,49,51,52,53,58,60,61,62,63,64,65,66,67,68,69,70,71,72,73,74,75,76,77]; the lack of testing signals/classes to recognize [15,49,54,63,65,69,70,71,75,76].
In [26], we presented a pipeline integrity surveillance system based on:
  • A ϕ -OTDR sensor (named FINDAS) [78] for acoustic signal acquisition.
  • Feature extraction that outputs the feature vectors with spectral information for acoustic signal representation.
  • Feature vector normalization that employs the high-frequency content of the recorded signals.
  • Pattern classification from a Gaussian mixture model (GMM) whose training was carried out from a single position for each recorded signal.
The pattern classification in [26] was based on a single-position training (so that it will be considered our baseline here), which, for some activities, may produce poor models due to data scarcity and the strong non-linear effects that are inherent to the fiber sensitivity response. On the other hand, employing more data as training material does typically build more robust models so that the pattern classification performance can be enhanced. Taking into account the human cost for data acquisition/measurement, and the power of DAS, which is able to simultaneously record several positions around the location for which the disturbance is maximum (for example, 400 positions in our system, each separated by 1 m) that comprise the vibration of the corresponding activity, we propose a multi-position approach in this work. This consists of an augmented system based on the use of the data acquired at several positions as the GMM training material, aiming to produce more robust models to enhance the pattern classification performance, and also provides insights about the actual limitations in the possible performance improvements. Moreover, due to the existence of the fading points along with the fiber (i.e., fiber optic positions that present null or very low sensitivity for the given perturbation no matter whether these positions are close or not to the actual perturbation position), a method for selecting the fiber optic position/s employed for system training is required. Therefore, the contribution of this work is 2-fold: (1) Building more robust GMMs that may enhance the system performance by employing data recorded in multiple fiber-optic positions and (2) presenting an intelligent multi-position selection method to avoid the fading points in the fiber-optic when the perturbation occurs. To the best of our knowledge, this is the first work that presents a multi-position approach for detecting threats to the pipeline integrity from different fiber optic positions measured at the same time, and that is evaluated on realistic environment conditions.
As in our previous work [26], the pipeline integrity surveillance system integrates two operation modes: machine + activity identification, where both the machine and the activity carried out are identified, and threat detection, where the occurrence of a suspicious threat for the pipeline integrity must be detected.
The organization of the rest of the paper is as follows: Section 2 presents the DAS + PRS strategy. The experimental procedure is described in Section 3. Experiments and results are presented in Section 4. Discussion is given in Section 5 and Section 6 concludes the work.

2. DAS + PRS: The Multi-Position Approach for Detecting Threats to the Pipeline Integrity

The system integrates two different modes: machine + activity identification and threat detection. In the first mode, the input acoustic signal is assigned to a certain machine + activity pair. In the threat detection mode, the signal is simply assigned the threat or non-threat class. The first mode is ideal for situations in which both the machine and the activity carried out must be known. The second mode is ideal for cases in which just a threat for the pipeline must be detected.
The system integrates different modules, as shown in Figure 1, which depicts an augmented architecture with respect to the one presented in [26]. The acquisition equipment in Figure 1 is connected to a 45 km fiber-optic and consists of a DAS sensor in charge of measuring the suspicious activities to create the so-called acoustic traces (i.e., acoustic signals). The pattern recognition system integrates two different stages: the training and classification stages. These two stages contain the feature extraction and feature normalization modules, which are the same for both stages and aim to obtain the most significant features from the acquired acoustic signals. In the training stage, the normalized feature vectors corresponding to the training data are used to train the acoustic models from the signals previously recorded by the sensor. The GMM training module is in charge of the model building and also integrates the method for fiber-optic position selection. The labeling for each suspicious activity or threat/non-threat depending on the system mode is also needed in this stage so that the model for each suspicious activity or threat/non-threat can be effectively trained. The classification stage integrates a pattern classification module that employs the normalized feature vectors corresponding to the testing data and the models previously trained in the training stage to make the corresponding decision (machine + activity pair recognized in the machine + activity identification mode or threat/non-threat in the threat detection mode) for each testing acoustic signal. All these modules are explained in more detailed next.

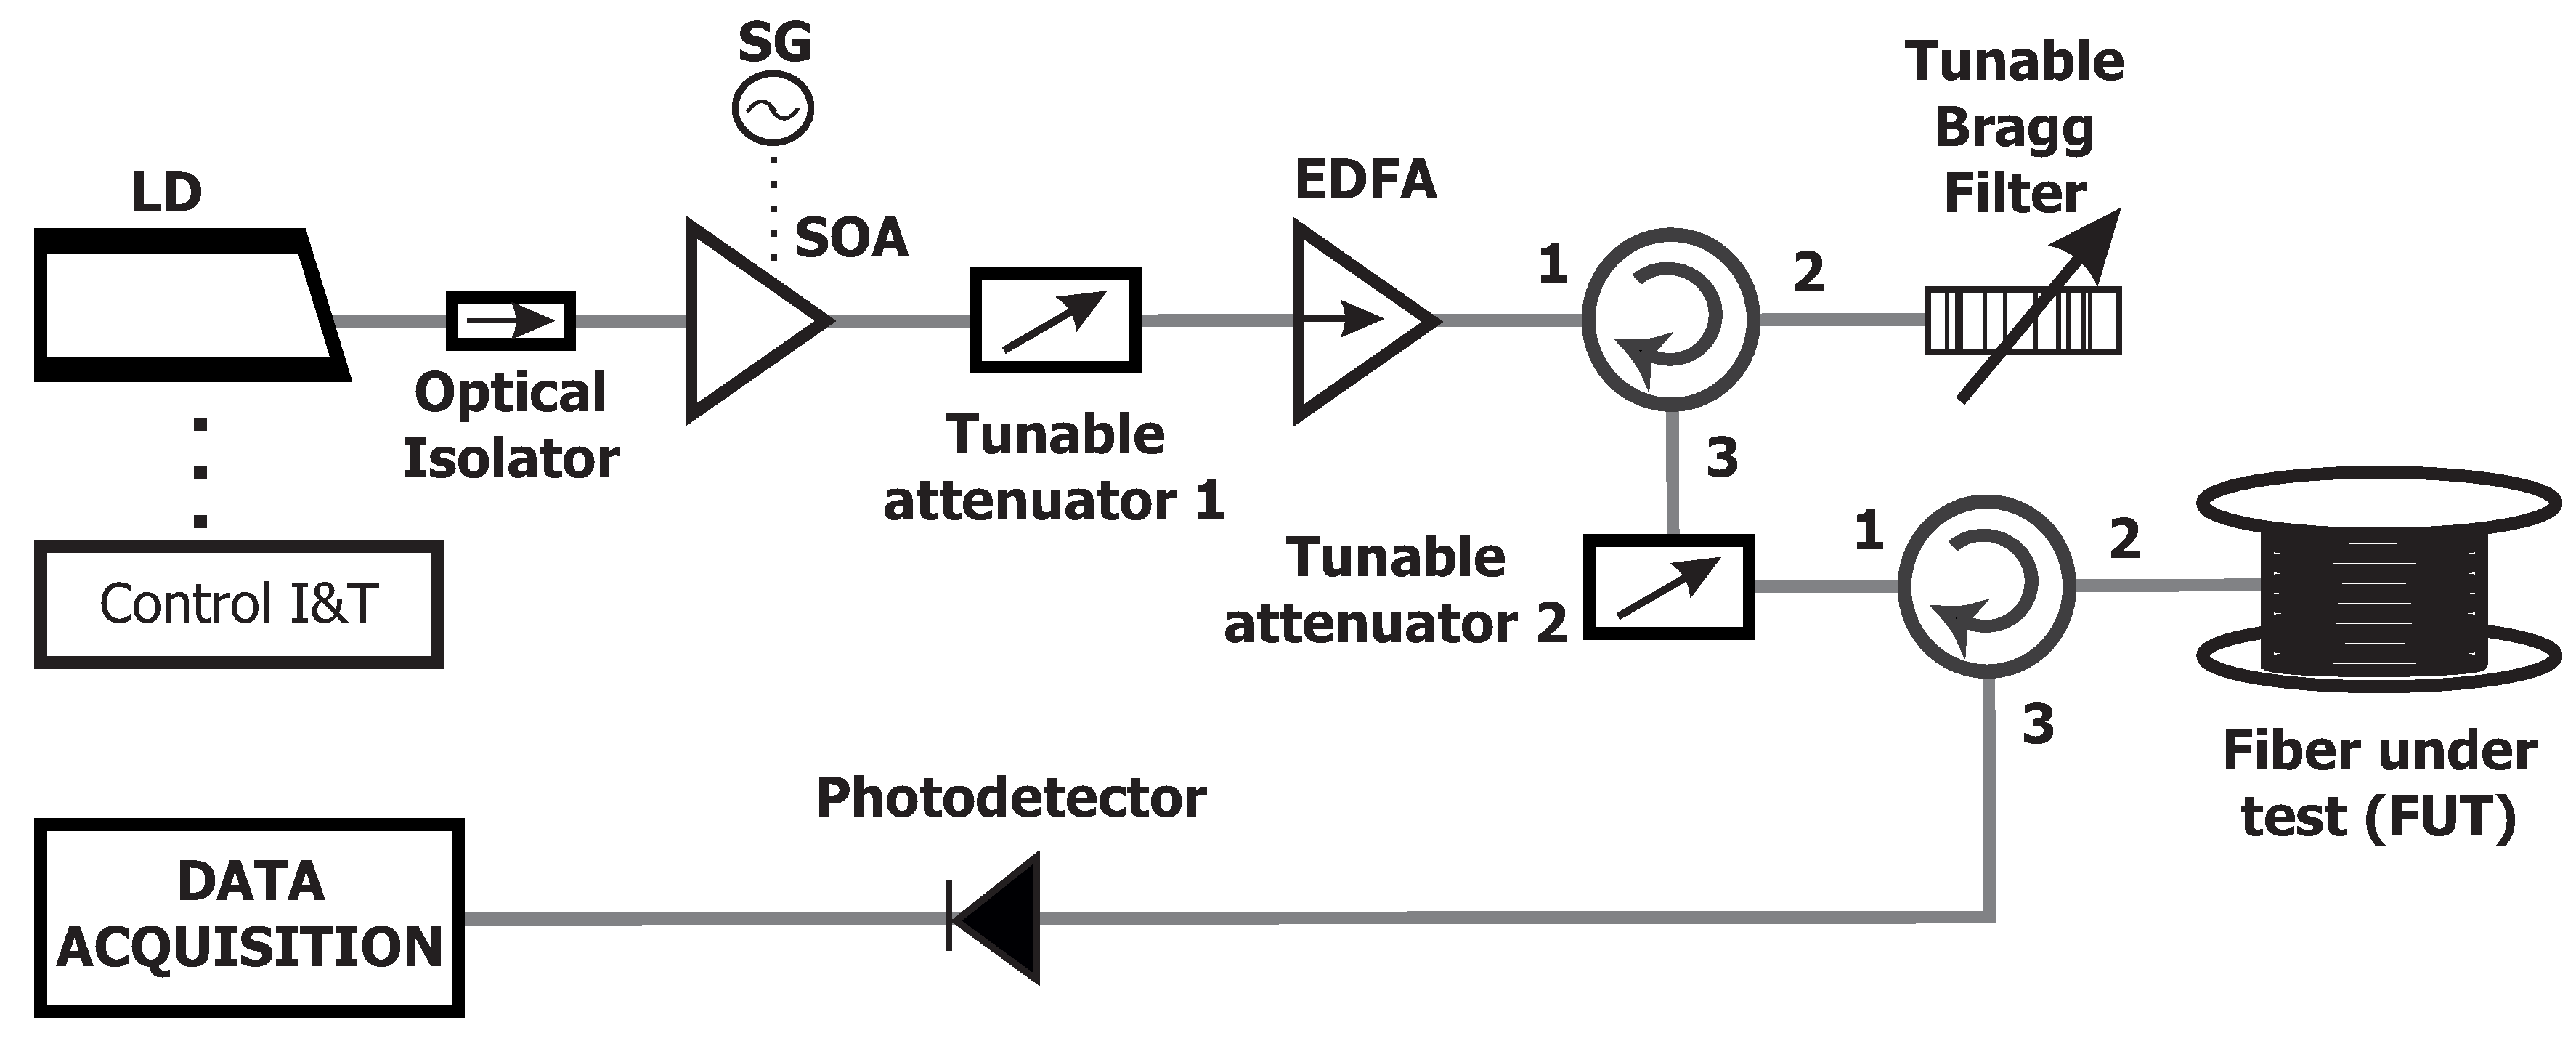
2.1. Distributed Acoustic Sensing: Acquisition Equipment

2.1.1. System Description

The DAS system consists of a ϕ -OTDR-based sensor called FINDAS [78]. The system architecture for the FINDAS sensor is presented in Figure 2. We provide here a short summary of the sensor, and refer readers to [16] for more details on the sensing mechanism and sensor configuration. The ϕ -OTDR employs Rayleigh scattering, which is an elastic scattering (without frequency shift) of light, and measures the changes that appear in the fiber state. The FINDAS sensor works with highly coherent optical pulses with a central wavelength near 1550 nm, which are given to the optical fiber. The signal that is back-reflected from the fiber-optic is then recorded, so that the interference pattern produced by the Rayleigh backscattering (i.e., the ϕ -OTDR signal) can be monitored with the same fiber input. Carrying out a flight time mapping of the light inside the fiber, the ϕ -OTDR signal received at a certain timestamp is related to a certain fiber position. If vibrations are produced at a certain fiber-optic position, the relative positions in the fiber-optic of the Rayleigh scattering centers will change, and the ϕ -OTDR signal will be accordingly changed, which allows for distributed acoustic sensing [16].
Since the fiber-optic is not installed parallel to the pipeline, and in some positions, there are fiber rolls for maintenance, a fiber-optic calibration between fiber distance and location was carried out along the pipeline.
The FINDAS sensor has an (optical) spatial resolution of five meters (readout resolution of one meter) and is able to sense up to 45 km with standard single-mode fiber. The sampling frequency for the signal acquisition was set to f s = 1085 Hz. When the energy of the monitored vibrations for a certain fiber position is higher than a predefined threshold, the acoustic samples on the top of the fiber are recorded by the FINDAS sensor to create a 20 s length acoustic trace. This acoustic trace is then given to the pipeline integrity threat detection system (described next) for classification. The system allows for the detection of multiple activities at different fiber-optic positions simultaneously, by giving a suitable threshold to each fiber position (that can be trained from past activity monitoring periods). This strategy is used in the system to avoid false alarms, so that the classification stage is only activated when there is a perturbation with an energy level above the previously trained threshold. This approach for activity detection leads to a 100% accuracy in the detection of the “no-activity” condition.

2.1.2. Signal Behavior

Both the physical process related to signal measurement and the different properties that each sensed location conveys make the signal features vary considerably.
On one hand, the vibration propagation along the fiber is heavily influenced by: (1) the distance from the machine that is carrying out a certain activity to the acquisition sensor, (2) the ground characteristics (dry or wet, compact or soft, etc.), and (3) the mechanical coupling of the fiber to the pipeline area. This causes that the acoustic signal recorded for a certain activity possesses significant differences when the recording location changes. Moreover, the background noise can also convey different properties for different locations (due to the nearness of houses, animals, roads, factories, etc.).
On the other hand, the transduction function of a ϕ -OTDR-based sensor is non-linear, which is particularly important for strong perturbations, as those considered in this work. Moreover, due to the random characteristic of a ϕ -OTDR signal, certain points that are distributed in a random way along the fiber (the so-called fading points [16]) may have low, or even null sensitivity to fiber-optic vibrations. This can be solved by analyzing several adjacent fiber-optic points to ensure that the recorded acoustic signal actually corresponds to the suspicious activity for a given location. However, the fiber sensitivity can strongly vary in a certain location from one point to another, even when they are close to each other.
Moreover, due to the so-called fiber losses, the optical power received from a certain fiber-optic position at a distance of d m meters from the beginning of the fiber, denoted as P ( d m ) —and hence the amplitude of the measured signals—will present an exponential decay. The coefficient for the fiber attenuation is α 0.0002 dB/m with the FINDAS operating laser wavelength (1550 nm). For a certain optical power at the beginning of the fiber named as P ( 0 ) , this equation stands: P ( d m ) = P ( 0 ) · 10 ( 2 · d m · α / 10 ) . Taking into account the full round-trip of the light of the fiber, this generates a 3 dB decay for every 7.5 km. This means that the optical loss effects will be relevant for long distances (e.g., tens of kilometers), as the scenario considered in this work is.
All these issues related to signal acquisition do undoubtedly affect the detection performance, so considering them in the system design is a must.

2.2. Feature Extraction

Feature extraction is used to obtain the most meaningful information present in the acoustic signals (i.e., traces) recorded by the FINDAS in the so-called feature vectors. Each acoustic trace (with 20 s length) is first divided into 1 s length segments (so-called frames), so that a feature vector representing each frame is computed. For feature vector computation, each frame overlaps 95 % (i.e., 1030 values for the sampling frequency f s = 1085 Hz) with the previous one so that a smooth change in each frame is produced. This means that a smooth change also occurs in the feature vector representation, as shown in our previous work [26]. Then, the FFT is applied to each frame to obtain the corresponding spectral information by converting it from the time-domain to the frequency-domain, since the acoustic traces from the machines and activities recorded presented a consistent spectral pattern that is suitable for further classification, as shown in [26]. The number of points of the FFT is set to 8192 as in [26] (therefore each frequency bin comprises 0.066 Hz, being 542.5 Hz the maximum available frequency in the acoustic signal). Then, the energy values corresponding to 100 frequency bands with a 100 Hz bandwidth are computed from the obtained spectral information (this 100 Hz bandwidth was shown to be the best in preliminary experiments and was used in our previous work [26]). Therefore, these energy values are the values stored in a feature vector, which will be denoted as x f .

2.3. Feature Vector Normalization

After the raw initial features have been computed in the feature extraction stage, a sensitivity-based normalization [26] for each feature vector x f normalizes each energy value by the energy above the used bandwidth (i.e., from 100 Hz to 542.5 Hz), as shown in Equation (1):
x f n ( i ) = x f ( i ) E h i g h 1 i 100 ,
where x f n ( i ) denotes the position i in the 100-dimensional normalized feature vector, x f ( i ) denotes the position i in the 100-dimensional raw feature vector, and E h i g h denotes the energy from 100 Hz to 542.5 Hz in a given frame.
This feature vector normalization approach deals with the signal degradation related to the distance between the sensed location and the FINDAS sensor. Therefore, 100-dimensional normalized feature vectors comprise the output of this module at the end. These new feature vectors x f n are the input to the pattern classification stage.

2.4. Pattern Classification

The pattern classification strategy is based on GMMs, widely used in pattern recognition (e.g., speech [79], image [80], and video [81] recognition, etc.).
The use of GMMs for system modeling is suitable since these models need a reasonably limited amount of training data to obtain a good pattern recognition performance [82]. Moreover, GMMs provide a straightforward method with which a linear combination of Gaussian functions can effectively represent a large class of sample distributions (i.e., the so-called training and testing data).
Therefore, considering a certain GMM named λ , the corresponding probability that a certain data vector (or simply data) x f n belongs to the class represented by that model λ can be obtained, which will be denoted as p ( x f n | λ ) .

2.4.1. Multi-Position Selection

From all the 400 positions recorded by FINDAS (separated by 1 m each) during signal acquisition around the given sensed location for each timestamp and a certain activity, an intelligent procedure to select the positions that will be used for model training (i.e., multi-position selection) is needed, given that the activity carried out on the top of the fiber will impact a wide fiber-optic segment nearby the actual activity location.
In our previous work [26] we simply selected the position with the highest energy, as this was supposed to correspond to the position with the highest sensitivity, thus avoiding fading points. The energy computation was carried out with the same parameter configuration as that used for feature extraction.
In this work, we present an N-highest energy position approach. To do so, the N positions which present the N-top highest energies according to the feature extraction parameters, have been chosen for GMM training. The objective here is to augment the amount of training data, while keeping a good expected sensitivity.

2.4.2. Training

From a subset of the acoustic traces recorded by FINDAS for a certain class k, which comprises the training subset, the training stage consists of model construction by estimating the parameters of each GMM λ k . The Expectation-Maximization algorithm [83] is employed to estimate the model parameters for the GMM from a maximum likelihood criterion. It must be noted that this model training is just needed once, so that all the classification processes employ the set of trained GMMs. In this work, several positions have been used to carry out the GMM training, with the criteria described in the previous subsection. To do so, a GMM for a certain class is trained with a variable number of highest energy sensed positions. To cover a reasonably wide range of possibilities, we run experiments for N = { 1 , 2 , 4 , 7 , 11 } . It must be noted that the highest energy sensed positions are computed on a frame-by-frame basis so that the highest energy sensed position/s is/are computed every 1 s and the corresponding normalized feature vectors are used for GMM training.

2.4.3. Classification

With the trained models, classification is carried out on a fully independent data subset, which is called the testing subset, to find the class represented by the model c ^ with the maximum posterior probability. This is carried out for a given input feature vector x f n from the Bayes’ rule as follows:
c ^ = a r g m a x k p ( x f n | λ k ) p ( λ k ) p ( x f n ) = a r g m a x k { p ( x f n | λ k ) } ,
where a uniform prior probability for each class is assumed (i.e., p ( λ k ) = 1 / C , where C is the number of classes (in our case C = 8 in the machine + activity identification mode and C = 2 in the threat detection mode)). Given that we use a supervised strategy for system training, our proposal is able to detect the activities for which we can generate a trained model. Since the same data are used for the machine + activity identification and threat detection modes, all the possible threats produced by the machine + activity pairs in the database can be detected. However, as shown in [84], which also bases on a GMM system, our proposal is expected to work reasonably well even for detecting threats from activities not included in the database due to the threat model generalization capability.
Classification is carried out on a frame basis from the highest energy position frame. Therefore, a classification decision is obtained for every 1 s frame within every 20 s length acoustic signal. Given the configuration parameters in the feature extraction, there are 415 decisions for each 20 s length acoustic signal in total.

3. Experimental Procedure

3.1. Database Description

For a fair comparison, the database used in the experiments is the one used in our previous work [26].
The database (i.e., the acoustic traces) was recorded over a real gas transmission pipeline managed by Fluxys Belgium S.A. (a GERG (The European Gas Research Group) partner). This means that our system is tested in a real environment. The FINDAS sensor was located at one end of the fiber which runs in parallel to the pipeline. Six different locations (named from LOC1 through LOC6) were used for acoustic trace recording. These locations aim to cover different pipeline “reference positions” selected at high distances from the FINDAS sensor (see Table 1) to produce feature variability in terms of ground conditions (e.g., concrete, grass, etc.) and evaluate the system in sensing limit conditions. The recordings were also carried out in different days, times, and weather conditions (e.g., sunny day, rainy day, etc.) to produce feature variability in terms of weather conditions (see Table 1). For data recording, before each machine starts its activity in each location, a reference position was manually selected in each location by measuring the fiber optic meter with good sensitivity when a certain machine is carrying out a certain activity (in our case, the plate compactor while compacting the ground was chosen). Once the reference position was chosen, 400 m were recorded (200 m at the left and right sides of that reference position) for each machine + activity pair in each location. Figure 3 shows an example of the furthest LOC6 location recording conditions, and Table 2 presents the machine + activity pairs recorded in each location. Time duration and the threat/non-threat labeling used in the threat detection mode of the system are also presented for each machine + activity pair and location. The decision on the activities to be considered as threats or non-threats (i.e., threat/non-threat labelling) was taken by the GERG project partners, depending on whether they could actually lead to pipeline damage. It must be noted that the time duration refers the time each machine is carrying out the corresponding activity. However, there are 400 fiber-optic positions (i.e., 400 m) being simultaneously recorded. The machines employed for database recording along with an aerial view of a machine working on the ground are presented in Figure 4.

3.2. Evaluation Metrics

The main metric employed for testing the two system modes (i.e., machine + activity identification and threat detection) is the classification accuracy. For the machine + activity identification mode, the accuracy represents the ratio between the number of correctly classified testing frames corresponding to the machine + activity pairs and the total number of testing frames for the machine + activity pairs. A hit (i.e., the machine + activity pair is correctly detected) is produced in the system when both the machine and the activity recognized by the system coincide with those of the ground truth and are within the machine + activity ground-truth time span. For the threat detection mode, a threat is correctly detected in case the system outputs the occurrence of a threat (i.e., the DAS + PRS strategy classifies the testing frame as a threat) within the threat ground-truth time span.
For the machine + activity identification mode, the confusion matrix will also be presented for additional result analyses. This confusion matrix presents the percentage of testing frames for a given class that have been classified as any of the other classes.
For the threat detection mode, we also present the Threat Detection Rate (TDR) and the False Alarm Rate (FAR). The TDR represents the percentage of threat testing frames that are classified as a threat, and the FAR corresponds to the percentage of non-threat testing frames that are classified as threats. For the TDR, the higher the better, whereas for the FAR, the lower the better.

4. Experiments and Results

Since the recording location plays an important role in system performance as shown in our previous work [26], to meet the specifications regarding database recording and experiments shown in [32], and for a proper comparison with our previous work [26], the experiments were carried out from a leave-one-out cross-validation (CV) with 6-folds, where each fold contains the acoustic traces recorded in a single location. In each fold, five locations were used for GMM training, whereas the other location was used for testing. The final testing results are computed from the average of the individual testing results for each fold.
For the machine + activity identification mode, results are presented in Table 3. They show that increasing the number of positions for GMM training leads to better overall performance. However, if we examine the individual performance per class, the gain is not so clear. It can be seen that for activities with a single mechanic behavior (that will be referred to as flat activities) and high-energy machine + activity pairs (i.e., big excavator+moving, big excavator+hitting, and small excavator+moving pairs), using more data for GMM training leads to more robust models so that the class identification performance is improved. This is due to the fact that flat activities are easier to detect since they integrate a single behavior that remains stable in the fiber-optic along several positions. On the other hand, high-energy activities get more benefit of using several positions for model training, since the spread of the energy across the fiber-optic indicates the presence of a certain activity. These classes, which represent 62 % of all data, contribute to the best overall performance. However, for activities that include more than one behavior and whose energy is lower (i.e., scrapping, which can include hitting, and compacting, whose energy is lower than the moving and hitting activities), increasing the number of positions does typically reduce the system performance. The only exceptions are for small excavator + scrapping pairs, which could be due to a more consistent behavior than the counterpart big excavator, and the pneumatic hammer + compacting pair, whose energy may extend up to fewer meters to indicate the given activity.
Regarding the statistical significance of the results, Table 3 also includes statistical confidence values for a 95 % confidence interval, and to ease the statistical significance analysis, we have included a green background color to the cells around the one with the best results with non-significant differences. It can be seen that even when the results are not statistically significant for all the classes when comparing them (the best performance obtained using N = 11 positions is statistically significant with the other cases in 3 out of the 8 classes), the average accuracy when using N = 11 positions is statistically significant as compared with all the other cases. Moreover, the use of more than N = 1 position for system training is shown to be significant for 4 out of the 8 classes when compared with the baseline (i.e., N = 1 position).
For the threat detection mode, results are presented in Table 4. They show that increasing the number of positions also leads to better overall accuracy. However, this is due to the best FAR and the fact that the number of non-threats in the system is higher than the number of threats (77.5% vs. 22.5%). Looking at the TDR, it can be seen that increasing the number of positions for GMM training does actually reduce the threat detection capability. The threat model is built from all the threat activities, and these include many different behaviors (hitting and scrapping), which results in a more blurred model so that using more positions for training may generate a less robust model for real threat detection. This is confirmed by the fact that only a few machine + activity pairs get statistically significant improved performance when several positions are used in modeling them, as shown in Table 3.
Table 4 also includes the results of the statistical-significance analysis for a 95 % confidence interval, and to ease the statistical significance analysis, it employs the same background-color convention as that used in Table 3. In this case, the differences when using N = 11 positions are only statistically significant for the FAR metric, but, as in the machine + activity identification mode, the average accuracy is statistically significant.
For the machine + activity identification mode, the confusion matrices for N = 1 and N = 11 positions in the GMM training, which are the configurations that obtain, in general, the best class performance, are presented in Table 5 and Table 6, respectively. To avoid cluttering, the confusion matrix values below chance (i.e., 1/8 = 12.5%) have been deleted and cell background color information has been added for better visualization and analysis. They show similar trends. In general, it can be seen that the diagonal contains the highest values for each class, except for the hitting activity, which is confused with scrapping and moving, and scrapping activity, which is confused with hitting. Scrapping includes hitting, and hitting class contains the lowest amount of data (and therefore training data), which derives in a less robust GMM, even though more positions are used for training.

4.1. Computational Time Analysis

Since this system aims to on-line monitor possible threats to pipeline integrity, the time response of the system is a critical issue. To show that the system is able to work in real-time, a computational time analysis for each of the system modules (feature extraction+normalization and pattern classification) has been carried out. It must be noted that the time response of the feature extraction and normalization stage does not depend on the number of models. However, the time response of the pattern classification stage varies depending on the number of system models, since the recorded acoustic trace has to be compared with all the system models. Experiments were carried out on an Intel Quad Q9550 2.83 GHz processor (Intel, Santa Clara, CA, USA) and 4GB RAM. The time response of each of the system modules is shown in Table 7. It can be seen that the system works in real-time, since the time response is less than one second for both system modes. It can also be seen that each new model added to the system increases the time response of the pattern classification by 10 msec. By analyzing the total time response of the system it can be claimed that, after the FINDAS sensor records one suspicious 20 s length acoustic trace, the machine + activity identification mode lasts 0.22 s to make a decision, and the threat detection mode lasts 0.16 s to make a threat/non-threat decision.

4.2. Comparison with Other Works

Before describing the comparison results, it is worth mentioning that our purpose in this work is to show that increasing the training data with the multi-position approach is able to improve the system performance with respect to the use of a single position for model training. Therefore, our baseline selection was that of [26], which significantly improved our first proposal in [30]. Our decision to base our current proposal in [26] was to assess the actual robustness of the improved training strategy with a relatively simple pattern recognition strategy. After the selected baseline, we proposed several alternative systems [27,28,29], mainly based on the use of more powerful feature extraction and pattern recognition approaches, so that we carried out a comparison with respect to these other works that employ the same database.
The comparison results for the machine + activity identification mode are presented in Table 8. It must be noted that the results obtained are worse than those obtained in [27,29], but our proposal exhibits a better average accuracy when compared with [28]. This improvement with respect to [28] shows that the use of multiple positions for system training (even when using less robust GMM-based acoustic models) gets more benefit than the more robust HMM-based acoustic models on a single-position approach.
The system comparison for the threat detection mode is shown in Table 9. It can be seen that the multi-position approach obtains the best overall accuracy and the lowest false alarm rate. This confirms our conjecture that the approach presented in this work, aiming to increase the number of data for model training from the multi-position selection approach, is able to improve the system performance even though a more powerful set of features and classifiers are employed in the single-position approach (used in all the other systems [27,28,29]), at the cost of missing some threat detection capability. Moreover, the multi-position selection approach improves both the TDR and the FAR (and hence the overall accuracy) with respect to [30]. This is due to the effectiveness of the multi-position selection approach and the feature vector normalization stage.

5. Discussion

Although the results have shown that the multi-position approach presented in this work generally improves the classification accuracy, there are some limitations that should be mentioned:
  • For the machine + activity identification mode, not all the machine + activity pairs get benefit from the use of multiple positions for GMM training. Results suggest that only the high energy and flat activities are effectively addressed with them. However, since suspicious activities for pipeline integrity are typically generated from high-energy events (i.e., sudden impacts to the pipeline or heavy machinery), the approach presented in this work is valid for addressing them. Concerning the activities that involve more than one single behavior, more research is needed to effectively detect them with the multi-position approach.
  • For the threat detection mode, the use of multiple positions for GMM training does increase the accuracy. However, this is at the cost of missing real threats. Due to the FAR being reduced in a greater extent with respect to the TDR reduction (8% FAR vs. 6% TDR), we consider that this system mode is a valid approach for saving unnecessary work for the system operator while detecting three out of four real threats.
  • As any supervised machine learning classification system (as the GMM approach presented in this work is, and as all the other approaches presented in the literature for DAS + PRS are), only the activities for which a model has been previously trained will be accurately detected. Although the threat detection mode is able to detect the threats produced by the activities carried out by the machines presented in Table 2, it was shown in [84] that the supervised strategy based on the GMM approach is able to work reasonably well for detecting threats produced by activities that have not been seen in the training stage due to the threat model generalization capability.

6. Conclusions and Future Work

We have presented an augmented system with respect to our previous work in [26], which is able to continuously monitor a 45 km-long pipeline for identifying possible threats. The novelty presented in this work relies on a procedure to select and use different fiber-optic positions, synchronously recorded, for model training. The system has been tested in a real-field environment in two different modes: machine + activity identification, where the machine and activity are aimed to be identified, and threat detection, where only the occurrence of a threat for the pipeline integrity must be detected.
The results of a rigorous experimental procedure suggest that, for activities with consistent behavior and high energy, using multiple positions for model training leads to better performance, whereas for multiple-behavior and low-energy activities, using multiple positions reduces the system performance. Regarding threat detection, we have shown that the multi-position approach is able to both reduce the false alarm rate and increase the overall accuracy significantly.
As future work, we plan to extend the work with deep learning approaches, oriented towards a more robust data augmentation strategy and also to improve the system performance. We also plan to apply the multi-position selection approach presented in this work to our additional systems [27,28,29]. Finally, we will also extend our proposal to be used in a biomedical field for biomedical signal processing.

Author Contributions

Conceptualization, J.T. and J.M.-G.; methodology, J.T., J.M.-G. and H.F.M.; software, J.T., J.M.-G. and H.F.M.; validation, J.T., J.M.-G., H.F.M., S.M.-L. and M.G.-H.; formal analysis, J.T., J.M.-G., H.F.M., S.M.-L. and M.G.-H.; investigation, J.T., J.M.-G., H.F.M., S.M.-L. and M.G.-H.; resources, J.T., J.M.-G., H.F.M., S.M.-L. and M.G.-H.; data curation, J.T., J.M.-G., H.F.M., S.M.-L. and M.G.-H.; writing—original draft preparation, J.T., J.M.-G. and H.F.M.; writing—review and editing, J.T., J.M.-G., H.F.M., S.M.-L. and M.G.-H.; visualization, J.T., J.M.-G., H.F.M., S.M.-L. and M.G.-H.; supervision, J.T. and J.M.-G.; project administration, J.M.-G., S.M.-L. and M.G.-H.; funding acquisition, J.T., J.M.-G., S.M.-L. and M.G.-H. All authors have read and agreed to the published version of the manuscript.

Funding

This research was funded by a private research project by Fluxys, Gassco and Statoil named “PIT-STOP (Early detection of Pipeline Integrity Threats using a SmarT fiber-OPtic surveillance system)”, by the Spanish Ministry of Economy and Competitiveness under projects HEIMDAL-UAH (TIN2016-75982-C2-1-R) and ARTEMISA (TIN2016-80939-R), by the University of Alcalá under projects ACUFANO (CCG19/IA-024) and ARGOS (CCG20/IA-043), and by the Spanish Ministry of Science, Innovation and Universities (IJCI-2017-33856 and RTI2018-097957-B-C33). The APC was funded by the Ministry of Science, Innovation and Universities of Spain grant number RTI2018-095324-B-I00.

Acknowledgments

We thank the anonymous reviewers for their careful reading of our manuscript and their many insightful comments and suggestions.

Conflicts of Interest

The authors declare no conflict of interest. The funders had no role in the design of the study; in the collection, analyses, or interpretation of data; in the writing of the manuscript, or in the decision to publish the results.

References

  1. Trust, P.S. Nationwide Data on Reported Incidents by Pipeline Type (Gas Transmission, Gas Distribution, Hazardous Liquid). Available online: http://pstrust.org/about-pipelines/stats/accident/ (accessed on 24 February 2021).
  2. European Gas Pipeline Incident Data Group (EGIG). 7th EGIG-Report on Gas Pipeline Incidents (1970–2007); Technical Report; European Gas Pipeline Incident Data Group: Groningen, The Netherlands, 2008. [Google Scholar]
  3. Choi, K.N.; Juarez, J.C.; Taylor, H.F. Distributed fiber optic pressure/seismic sensor for low-cost monitoring of long perimeters. In Proceedings of the AEROSENSE, Orlando, FL, USA, 21–25 April 2003; pp. 134–141. [Google Scholar]
  4. Juarez, J.C.; Maier, E.W.; Choi, K.N.; Taylor, H.F. Distributed Fiber-Optic Intrusion Sensor System. J. Light. Technol. 2005, 23, 2081–2087. [Google Scholar] [CrossRef]
  5. Wang, Z.N.; Li, J.; Fan, M.Q.; Zhang, L.; Peng, F.; Wu, H.; Zeng, J.J.; Zhou, Y.; Rao, Y.J. Phase-sensitive optical time-domain reflectometry with Brillouin amplification. Opt. Lett. 2014, 39, 4313–4316. [Google Scholar] [CrossRef]
  6. Martins, H.F.; Martín-López, S.; Corredera, P.; Filograno, M.L.; Frazão, O.; González-Herráez, M. Phase-sensitive Optical Time Domain Reflectometer Assisted by First-order Raman Amplification for Distributed Vibration Sensing Over > 100 km. J. Light. Technol. 2014, 32, 1510–1518. [Google Scholar] [CrossRef]
  7. Martins, H.F.; Martin-Lopez, S.; Corredera, P.; Ania-Castañon, J.D.; Frazão, O.; Gonzalez-Herraez, M. Distributed vibration sensing over 125 km with enhanced SNR using ϕ-OTDR over a URFL cavity. J. Light. Technol. 2015, 33, 2628–2632. [Google Scholar] [CrossRef] [Green Version]
  8. Wang, Z.; Zeng, J.; Li, J.; Fan, M.; Wu, H.; Peng, F.; Zhang, L.; Zhou, Y.; Rao, Y. Ultra-long phase-sensitive OTDR with hybrid distributed amplification. Opt. Lett. 2014, 39, 5866–5869. [Google Scholar] [CrossRef] [PubMed]
  9. Peng, F.; Wu, H.; Jia, X.H.; Rao, Y.J.; Wang, Z.N.; Peng, Z.P. Ultra-long high-sensitivity ϕ-OTDR for high spatial resolution intrusion detection of pipelines. Opt. Express 2014, 22, 13804–13810. [Google Scholar] [CrossRef]
  10. Juarez, J.C.; Taylor, H.F. Field test of a distributed fiber-optic intrusion sensor system for long perimeters. Appl. Opt. 2007, 46, 1968–1971. [Google Scholar] [CrossRef]
  11. Chao, P.; Hui, Z.; Bin, Y.; Zhu, Z.; Xiahoan, S. Distributed optical-fiber vibration sensing system based on differential detection of differential coherent-OTDR. In Proceedings of the IEEE Sensors, Taipei, Taiwan, 28–31 October 2012; pp. 1–3. [Google Scholar]
  12. Wang, Z.; Zeng, J.; Li, J.; Peng, F.; Zhang, L.; Zhou, Y.; Wu, H.; Rao, Y. 175 km Phase-sensitive OTDR with Hybrid Distributed Amplification. In Proceedings of the 23rd International Conference on Optical Fibre Sensors, Santander, Spain, 2–6 June 2014; Volume 9157, pp. 9157D5-1–9157D5-4. [Google Scholar]
  13. Shi, Y.; Feng, H.; Zeng, Z. A Long Distance Phase-Sensitive Optical Time Domain Reflectometer with Simple Structure and High Locating Accuracy. Sensors 2015, 15, 21957–21970. [Google Scholar] [CrossRef] [Green Version]
  14. He, M.; Feng, L.; Zhao, D. Application of distributed acoustic sensor technology in train running condition monitoring of the heavy-haul railway. Optik 2019, 181, 343–350. [Google Scholar] [CrossRef]
  15. Kowarik, S.; Hussels, M.T.; Chruscicki, S.; Munzenberger, S.; Lammerhirt, A.; Pohl, P.; Schubert, M. Fiber Optic Train Monitoring with Distributed Acoustic Sensing: Conventional and Neural Network Data Analysis. Sensors 2020, 20, 450. [Google Scholar] [CrossRef] [Green Version]
  16. Martins, H.F.; Martín-López, S.; Corredera, P.; Filograno, M.L.; Frazão, O.; González-Herráez, M. Coherent noise reduction in high visibility phase sensitive optical time domain reflectometer for distributed sensing of ultrasonic waves. J. Light. Technol. 2013, 31, 3631–3637. [Google Scholar] [CrossRef] [Green Version]
  17. Quin, Z.G.; Chen, L.; Bao, X.Y. Wavelet denoising method for improving detection performance of distributed vibration sensor. IEEE Photonics Technol. Lett. 2012, 24, 542–544. [Google Scholar] [CrossRef]
  18. Pan, Z.; Wang, Z.; Ye, Q.; Cai, H.; Qu, R.; Fang, Z. High sampling rate multi-pulse phase-sensitive OTDR employing frequency division multiplexing. In Proceedings of the 23rd International Conference on Optical Fibre Sensors, Santander, Spain, 2–6 June 2014; Volume 9157, pp. 91576X-1–91576X-4. [Google Scholar]
  19. Zhu, H.; Pan, C.; Sun, X. Vibration Pattern Recognition and Classification in OTDR Based Distributed Optical-Fiber Vibration Sensing System. In Proceedings of the SPIE Smart Structures and Materials + Nondestructive Evaluation and Health Monitoring, San Diego, CA, USA, 9–13 March 2014; Volume 9062, pp. 906205-1–906205-6. [Google Scholar]
  20. Wu, H.; Wang, Z.; Peng, F.; Peng, Z.; Li, X.; Wu, Y.; Rao, Y. Field test of a fully distributed fiber optic intrusion detection system for long-distance security monitoring of national borderline. In Proceedings of the 23rd International Conference on Optical Fibre Sensors, Santander, Spain, 2–6 June 2014; Volume 91579, pp. 915790-1–915790-4. [Google Scholar]
  21. Wu, H.; Li, X.; Peng, Z.; Rao, Y. A novel intrusion signal processing method for phase-sensitive optical time-domain reflectometry (ϕ-OTDR). In Proceedings of the 23rd International Conference on Optical Fibre Sensors, Santander, Spain, 2–6 June 2014; Volume 9157, pp. 9157O-1–9157O-4. [Google Scholar]
  22. Cao, C.; Fan, X.Y.; Liu, Q.W.; He, Z.Y. Practical Pattern Recognition System for Distributed Optical Fiber Intrusion Monitoring System Based on Phase-Sensitive Coherent OTDR. In Proceedings of the Asia Communications and Photonics Conference, Hong Kong, 19–23 October 2015; pp. 145:1–145:3. [Google Scholar]
  23. Sun, Q.; Feng, H.; Yan, X.; Zeng, Z. Recognition of a Phase-Sensitivity OTDR Sensing System Based on Morphologic Feature Extraction. Sensors 2015, 15, 15179–15197. [Google Scholar] [CrossRef] [PubMed] [Green Version]
  24. Wu, H.; Xiao, S.; Li, X.; Wang, Z.; Xu, J.; Rao, Y. Separation and Determination of the Disturbing Signals in Phase-Sensitive Optical Time Domain Reflectometry (ϕ-OTDR). J. Light. Technol. 2015, 33, 3156–3162. [Google Scholar] [CrossRef]
  25. Wu, H.; Qian, Y.; Zhang, W.; Tang, C. Feature Extraction and Identification in Distributed Optical-Fiber Vibration Sensing System for Oil Pipeline Safety Monitoring. Photonic Sens. 2017, 7, 305–310. [Google Scholar] [CrossRef] [Green Version]
  26. Tejedor, J.; Martins, H.F.; Piote, D.; Macias-Guarasa, J.; Pastor-Graells, J.; Martin-Lopez, S.; Corredera, P.; Smet, F.D.; Postvoll, W.; Gonzalez-Herraez, M. Toward Prevention of Pipeline Integrity Threats using a Smart Fiber Optic Surveillance System. J. Light. Technol. 2016, 34, 4445–4453. [Google Scholar] [CrossRef] [Green Version]
  27. Tejedor, J.; Macias-Guarasa, J.; Martins, H.F.; Pastor-Graells, J.; Martin-Lopez, S.; Corredera, P.; Gonzalez-Herraez, M. A novel fiber optic based surveillance system for prevention of pipeline integrity threats. Sensors 2017, 17, 355. [Google Scholar] [CrossRef] [PubMed]
  28. Tejedor, J.; Macias-Guarasa, J.; Martins, H.F.; Martin-Lopez, S.; Gonzalez-Herraez, M. A Gaussian Mixture Model-Hidden Markov Model (GMM-HMM)-based fiber optic surveillance system for pipeline integrity threat detection. In Proceedings of the 26th International Conference on Optical Fiber Sensors, Lausanne, Switzerland, 24–28 September 2018; pp. WF36:1–WF36:4. [Google Scholar]
  29. Tejedor, J.; Macias-Guarasa, J.; Martins, H.; Martin-Lopez, S.; Gonzalez-Herraez, M. A contextual GMM-HMM smart fiber optic surveillance system for pipeline in-tegrity threat detection. J. Light. Technol. 2019, 37, 4514–4522. [Google Scholar] [CrossRef]
  30. Martins, H.F.; Piote, D.; Tejedor, J.; Macias-Guarasa, J.; Pastor-Graells, J.; Martin-Lopez, S.; Corredera, P.; Smet, F.D.; Postvoll, W.; Ahlen, C.H.; et al. Early Detection of Pipeline Integrity Threats using a SmarT Fiber-OPtic Surveillance System: The PIT-STOP Project. In Proceedings of the 24th International Conference on Optical Fibre Sensors, Curitiba, Brazil, 28 September–2 October 2015; Volume 9634, pp. 96347X-1–96347X-4. [Google Scholar]
  31. Conway, C.; Mondanos, M. An introduction to fibre optic Intelligent Distributed Acoustic Sensing (iDAS) technology for power industry applications. In Proceedings of the International Conference on Insulated Power Cables, Versailles, France, 21–25 June 2015; Volume A3.4, pp. 1–6. [Google Scholar]
  32. Tejedor, J.; Macias-Guarasa, J.; Martins, H.F.; Pastor-Graells, J.; Corredera, P.; Martin-Lopez, S. Machine Learning Methods for Pipeline Surveillance Systems based on Distributed Acoustic Sensing: A Review. Appl. Sci. 2017, 7, 841. [Google Scholar] [CrossRef] [Green Version]
  33. Huh, J.H. PLC-based design of monitoring system for ICT-integrated vertical fish farm. Hum. Centric Comput. Inf. Sci. 2017, 7, 20:1–20:19. [Google Scholar] [CrossRef] [Green Version]
  34. Huh, J.H.; Otgonchimeg, S.; Seo, K. Advanced metering infrastructure design and test bed experiment using intelligent agents: Focusing on the PLC network base technology for Smart Grid system. J. Supercomput. 2016, 72, 1862–1877. [Google Scholar] [CrossRef]
  35. Huh, J.H.; Seo, Y.S. Understanding Edge Computing: Engineering Evolution With Artificial Intelligence. IEEE Access 2019, 7, 164229–164245. [Google Scholar] [CrossRef]
  36. Deb, S.; Gao, X.Z.; Tammi, K.; Kalita, K.; Mahanta, P. Recent Studies on Chicken Swarm Optimization algorithm: A review (2014–2018). Artif. Intell. Rev. 2020, 53, 1737–1765. [Google Scholar] [CrossRef]
  37. Yinka-Banjo, C.O.; Akinyemi, M.I.; Nwadike, C.O.; Misra, S.; Oluranti, J.; Damasevicius, R. Unmanned Vehicle Model Through Markov Decision Process for Pipeline Inspection. In Proceedings of the International Conference on Deep Learning, Artificial Intelligence and Robotics (ICDLAIR 2019), Jaipur, India, 7–8 December 2019; pp. 317–329. [Google Scholar]
  38. Kumar, D.; Kubra, B.B.K.; Varsha, J.J.; Sah, V.R. Pipe inspection robot. Int. Res. J. Eng. Technol. 2020, 7, 57–63. [Google Scholar]
  39. Zhang, L.; Du, Y.; Cao, A. The Design of Natural Gas Pipeline Inspection Robot System. In Proceedings of the International Conference on Information and Automation, Lijiang, China, 8–10 August 2015; pp. 843–846. [Google Scholar]
  40. Gargade, A.; Ohol, S. Design and Development of In-pipe Inspection Robot for Various Pipe Sizes. In Proceedings of the International Conference on Robotics, Intelligent Automation and Control Technologies, Chennai, India, 2–3 October 2020; Volume 1012, pp. 1–11. [Google Scholar]
  41. Kesteloo, T.V. Autonomous Navigation for the Pipeline Inspection Robot “PIRATE”. Master’s Thesis, University of Twente, Enschede, The Netherlands, 2020. [Google Scholar]
  42. Karkoub, M.; Bouhali, O.; Sheharyar, A. Gas Pipeline Inspection Using Autonomous Robots with Omni-Directional Cameras. IEEE Sens. 2020. [Google Scholar] [CrossRef]
  43. Miro, V.J.; Ulapane, N.; Shi, L.; Hunt, D.; Behrens, M. Robotic pipeline wall thickness evaluation for dense nondestructive testing inspection. J. Field Robot. 2018, 35, 1293–1310. [Google Scholar] [CrossRef] [Green Version]
  44. Ambati, P.; Raj, K.M.S.; Joshuva, A. A review on pipeline inspection robot. AIP Conf. Proc. 2020, 2311, 60002:1–60002:7. [Google Scholar]
  45. Sifta, R.; Munster, P.; Sysel, P.; Horvath, T.; Novotny, V.; Krajsa, O.; Filka, M. Distributed fiber-optic sensor for detection and localization of acoustic vibrations. Metrol. Meas. Syst. 2015, XXII, 111–118. [Google Scholar] [CrossRef] [Green Version]
  46. Chafiq, Y.; Tatin, M.; Postaspana, O.; Paris, J.B.; Maraval, D.; Lamour, V. Fiber optic sensing for monitoring structure and health of railway infrastructures. In Proceedings of the 26th International Conference on Optical Fiber Sensors, Lausanne, Switzerland, 24–28 September 2018; pp. 1–4. [Google Scholar]
  47. Cedilnik, G.; Hunt, R.; Lees, G. Advances in Train and Rail Monitoring with DAS. In Proceedings of the 26th International Conference on Optical Fiber Sensors, Lausanne, Switzerland, 24–28 September 2018; pp. 1–4. [Google Scholar]
  48. Wang, Y.; Jin, B.; Wang, Y.; Wang, D.; Liu, X.; Bai, Q. Real-time distributed vibration monitoring system using ϕ-OTDR. IEEE Sens. 2017, 17, 1333–1341. [Google Scholar] [CrossRef]
  49. Hussels, M.T.; Chruscicki, S.; Arndt, D.; Scheider, S.; Prager, J.; Homann, T.; Habib, A.K. Localization of Transient Events Threatening Pipeline Integrity by Fiber-Optic Distributed Acoustic Sensing. Sensors 2019, 19, 3322. [Google Scholar] [CrossRef] [Green Version]
  50. Stajanca, P.; Chruscicki, S.; Homann, T.; Seifert, S.; Schmidt, D.; Habib, A. Detection of Leak-Induced Pipeline Vibrations Using Fiber-Optic Distributed Acoustic Sensing. Sensors 2018, 18, 2841. [Google Scholar] [CrossRef] [Green Version]
  51. Cong, C.; Xinyu, F.; Qingwen, L.; Zuyuan, H. Practical Pattern Recognition System for Distributed Optical Fiber Intrusion Monitoring Based on ϕ-COTDR. ZTE Commun. 2017, 15, 1–4. [Google Scholar]
  52. Yan, Q.; Yang, Y.; Zhang, Z.; Jiang, S.; Xu, Y.; Zhou, C. Distributed Vibration Sensing System for Oil and Gas Pipelines Based on COTDR and BP Neural Network. In Proceedings of the 26th International Conference on Optical Fiber Sensors, Lausanne, Switzerland, 24–28 September 2018; pp. 1–4. [Google Scholar]
  53. Jiang, F.; Li, H.; Zhang, Z.; Zhang, Y.; Zhang, X. Localization and Discrimination of the Perturbation Signals in Fiber Distributed Acoustic Sensing Systems Using Spatial Average Kurtosis. Sensors 2017, 18, 2839. [Google Scholar] [CrossRef] [Green Version]
  54. Liang, S.; Sheng, X.; Lou, S.; Feng, Y.; Zhang, K. Combination of Phase-Sensitive OTDR and Michelson Interferometer for Nuisance Alarm Rate Reducing and Event Identification. IEEE Photonics J. 2016, 8, 6802112:1–6802112:12. [Google Scholar] [CrossRef]
  55. Aktas, M.; Akgun, T.; Demircin, M.U.; Buyukaydin, D. Deep Learning Based Multi-threat Classification for Phase-OTDR Fiber Optic Distributed Acoustic Sensing Applications. In Proceedings of the SPIE Commercial + Scientific Sensing and Imaging, Anaheim, CA, USA, 9–13 April 2017; pp. 102080G:1–102080G:18. [Google Scholar]
  56. Wu, H.; Yang, M.; Yang, S.; Lu, H.; Wang, C.; Rao, Y. A novel DAS signal recognition method based on spatiotemporal information extraction with 1DCNNs-BiLSTM network. IEEE Access 2020, 8, 119448–119457. [Google Scholar] [CrossRef]
  57. Chen, J.; Wu, H.; Liu, X.; Xiao, Y.; Wang, M.; Yang, M.; Rao, Y. A real-time distributed deep learning approach for intelligent event recognition in long distance pipeline monitoring with DOFS. In Proceedings of the International Conference on Cyber-Enabled Distributed Computing and Knowledge Discovery (CyberC), Zhengzhou, China, 18–20 October 2018; pp. 290–296. [Google Scholar]
  58. Shi, Y.; Wang, Y.; Zhao, L.; Fan, Z. An Event Recognition Method for ϕ-OTDR Sensing System Based on Deep Learning. Sensors 2019, 19, 3421. [Google Scholar] [CrossRef] [Green Version]
  59. Wang, Z.; Zheng, H.; Li, L.; Liang, J.; Wang, X.; Lu, B.; Ye, Q.; Qu, R.; Cai, H. Practical multi-class event classification approach for distributed vibration sensing using deep dual path network. Opt. Express 2019, 27, 23682–23692. [Google Scholar] [CrossRef]
  60. Bi, F.; Zheng, T.; Qu, H.; Pang, L. A Novel Fiber Optic Based Surveillance System for Prevention of Pipeline Integrity Threats. Photonic Sens. 2016, 6, 143–152. [Google Scholar] [CrossRef] [Green Version]
  61. Shiloh, L.; Eyal, A.; Giryes, R. Deep Learning Approach for Processing Fiber-Optic DAS Seismic Data. In Proceedings of the 26th International Conference on Optical Fiber Sensors, Lausanne, Switzerland, 24–28 September 2018; pp. 1–4. [Google Scholar]
  62. Zhaoyong, W.; Zhengqing, P.; Qing, Y.; Haiwen, C.; Ronghui, Q.; Zujie, F. Fast Pattern Recognition Based on Frequency Spectrum Analysis Used for Intrusion Alarming in Optical Fiber Fence. Chin. J. Lasers 2015, 42, 167–172. [Google Scholar]
  63. Xu, C.; Guan, J.; Bao, M.; Lu, J.; Ye, W. Pattern recognition based on enhanced multifeature parameters for vibration events in ϕ-OTDR distributed optical fiber sensing system. Microw. Opt. Technol. Lett. 2017, 59, 3134–3141. [Google Scholar] [CrossRef]
  64. Huang, X.; Zhang, H.; Liu, K.; Liu, T.; Wang, Y.; Ma, C. Hybrid Feature Extraction-Based Intrusion Discrimination in Optical Fiber Perimeter Security System. IEEE Photonics J. 2017, 9, 7800212:1–7800212:12. [Google Scholar] [CrossRef]
  65. Qu, H.; Zheng, T.; Pang, L.; Li, X. A new two-dimensional method to detect harmful intrusion vibrations for optical fiber pre-warning system. Optik 2016, 127, 4461–4469. [Google Scholar] [CrossRef]
  66. Yan, Z.; Shuqin, L.; Sheng, L.; Peng, W. Study of Pattern Recognition Based on Multi-Characteristic Parameters for ϕ-OTDR Distributed Optical Fiber Sensing System. Chin. J. Lett. 2015, 42. [Google Scholar]
  67. Jiang, F.; Li, H.; Zhang, Z.; Zhang, X. An event recognition method for fiber distributed acoustic sensing systems based on the combination of MFCC and CNN. In Proceedings of the International Conference on Optical Instruments and Technology, Beijing, China, 28–30 October 2017; pp. 10618:1–10618:7. [Google Scholar]
  68. Huang, L.; Li, Y.; Chen, S.; Zhang, Q.; Song, Y.; Zhang, J.; Wang, M. Building safety monitoring based on extreme gradient boosting in distributed optical fiber sensing. Opt. Fiber Technol. 2020, 55, 102149:1–102149:6. [Google Scholar] [CrossRef]
  69. Jia, H.; Liang, S.; Lou, S.; Sheng, X. A k-Nearest Neighbor Algorithm-Based Near Category Support Vector Machine Method for Event Identification of ϕ-OTDR. IEEE Sens. 2019, 19, 3683–3689. [Google Scholar] [CrossRef]
  70. Xu, C.; Guan, J.; Bao, M.; Lu, J.; Ye, W. Pattern recognition based on time-frequency analysis and convolutional neural networks for vibrational events in ϕ-OTDR. Opt. Eng. 2018, 57, 016103:1–016103:7. [Google Scholar] [CrossRef]
  71. Li, S.; Peng, R.; Liu, Z. A surveillance system for urban buried pipeline subject to third-party threats based on fiber optic sensing and convolutional neural network. Struct. Health Monit. 2020. [Google Scholar] [CrossRef]
  72. Wu, H.; Liu, X.; Xiao, Y.; Rao, Y. 1-D CNN based intelligent recognition of vibrations in pipeline monitoring with DAS. J. Light. Technol. 2019, 37, 4359–4366. [Google Scholar] [CrossRef]
  73. Wu, H.; Liu, X.; Xiao, Y.; Rao, Y. A Dynamic Time Sequence Recognition and Knowledge Mining Method Based on the Hidden Markov Models (HMMs) for Pipeline Safety Monitoring With ϕ-OTDR. J. Light. Technol. 2019, 37, 4991–5000. [Google Scholar] [CrossRef]
  74. Zhang, M.; Li, Y.; Chen, J.; Song, Y.; Zhang, J.; Wang, M. Event detection method comparison for distributed acoustic sensors using ϕ-OTDR. Opt. Fiber Technol. 2019, 52, 101980:1–101980:7. [Google Scholar] [CrossRef]
  75. Bai, Y.; Xing, J.; Xie, F.; Liu, S.; Li, J. Detection and identification of external intrusion signals from 33 km optical fiber sensing system based on deep learning. Opt. Fiber Technol. 2019, 53, 102060:1–102060:9. [Google Scholar] [CrossRef]
  76. Huang, X.D.; Zhang, H.J.; Liu, K.; Liu, T.G. Fully modelling based intrusion discrimination in optical fiber perimeter security system. Opt. Fiber Technol. 2018, 45, 64–70. [Google Scholar] [CrossRef]
  77. Peng, Z.; Wen, H.; Jian, J.; Gribok, A.; Wang, M.; Huang, S.; Liu, H.; Mao, Z.; Chen, K.P. Identifcations and classifcations of human locomotion using Rayleigh‑enhanced distributed fber acoustic sensors with deep neural networks. Sci. Rep. 2020, 10, 21014:1–21014:11. [Google Scholar] [CrossRef]
  78. FIber Network Distributed Acoustic Sensor (FINDAS). Available online: http://www.focustech.eu (accessed on 24 February 2021).
  79. Zhang, Y.; Alder, M.; Togneri, R. Using Gaussian mixture modeling in speech recognition. In Proceedings of the ICASSP IEEE International Conference on Acoustics, Speech and Signal Processing, Adelaide, SA, Australia, 19–22 April 1994; pp. 613–616. [Google Scholar]
  80. Permuter, H.; Francos, J.; Jermyn, I. A study of Gaussian mixture models of color and texture features for image classification and segmentation. Pattern Recognit. 2006, 39, 695–706. [Google Scholar] [CrossRef] [Green Version]
  81. Yu, T.; Zhang, C.; Cohen, M.; Ru, Y.; Wu, Y. Monocular Video Foreground/Background Segmentation by Tracking Spatial-Color Gaussian Mixture Models. In Proceedings of the Workshop on Motion and Video Computing, Austin, TX, USA, 23–24 February 2007; pp. 1–5. [Google Scholar]
  82. Kim, Y.; Jeong, S.; Kim, D.; López, T.S. An efficient scheme of target classification and information fusion in wireless sensor networks. Pers. Ubiquitous Comput. 2009, 13, 499–508. [Google Scholar] [CrossRef]
  83. Xuan, G.; Zhang, W.; Chai, P. EM algorithms of Gaussian mixture model and hidden Markov model. In Proceedings of the International Conference on Image Processing, Thessaloniki, Greece, 7–10 October 2001; pp. 145–148. [Google Scholar]
  84. Tejedor, J.; Macias-Guarasa, J.; Martins, H.F.; Pastor-Graells, J.; Martin-Lopez, S.; Corredera, P.; Pauw, G.D.; Smet, F.D.; Postvoll, W.; Ahlen, C.H.; et al. Real Field Deployment of a Smart Fiber Optic Surveillance System for Pipeline Integrity Threat Detection: Architectural Issues and Blind Field Test Results. J. Light. Technol. 2017, 36, 1052–1062. [Google Scholar] [CrossRef]
Figure 1. Architecture of the multi-position approach for detecting threats to the pipeline integrity. The module that appears in bold (i.e., Gaussian Mixture Model (GMM) training) is the new one with respect to [26].
Electronics 10 00712 g001
Figure 2. Architecture of the distributed acoustic sensing system FINDAS (phase-sensitive optical time domain reflectometry ( ϕ -OTDR)-based sensor).
Electronics 10 00712 g002
Figure 3. Location 6 (LOC6) recording scenario, reproduced with permission from [26]. RP stands for “reference point”, referring to the center of the machine operation area.
Electronics 10 00712 g003
Figure 4. Database machines: (a) big excavator; (b) small excavator; (c) pneumatic hammer; (d) plate compactor; and (e) aerial view (figures (ad) are reproduced with permission from [30]).
Electronics 10 00712 g004
Table 1. Recording location details (slightly modified with permission from [26]).
LOC1LOC2LOC3LOC4LOC5LOC6
Distance from FINDAS (km)22.2422.4923.7527.4327.5334.27
Ground conditionGrass & clay in agricultural fieldGrass in agricultural fieldConcrete, grass & clay Next to public street Private house nearbyWet clay in agricultural fieldClay in agricultural fieldGrass in forest
Weather conditionSunny/cloudySunnySunnyRainyCloudySunny
Table 2. Experimental database. ‘Big excavator’ represents a 5 ton Kubota KX161-3. ‘Small excavator’ represents a 1.5 ton Kubota KX41-3V. Slightly modified with permission from [26].
MachineActivityDuration in Each Location (in Seconds)Threat
Non-Threat
LOC1LOC2LOC3LOC4LOC5LOC6Total
Big
excavator
Moving along the ground11001100354017401620416013,260Non-threat
Hitting the ground120140240220802601060Threat
Scrapping the ground4604609206202005803240Threat
Small
excavator
Moving along the ground600500170082082016606100Non-threat
Hitting the ground200180220220802401140Threat
Scrapping the ground4203407803601805202600Threat
Pneumatic hammerCompacting ground66005801320013203880Non-threat
Plate compactorCompacting ground74007401240016804400Non-threat
Table 3. Results for the machine + activity identification mode by varying the number of positions used in the GMM training with the best result for each class and the best overall accuracy in bold font. Confidence intervals are shown for a 95 % confidence. Green cells show values within the confidence interval for the best performance value (i.e., statistically non-significant differences). The values shown between brackets denote the number of frames that belong to the corresponding class.
Machine + Activity Identification
Big ExcavatorSmall ExcavatorPneumatic
Hammer
Plate
Compactor
Average
Accuracy
[740360]
# PositionsMoving
[275145]
Hitting
[21995]
Scrapping
[67230]
Moving
[126575]
Hitting
[23655]
Scrapping
[53950]
Compacting
[80510]
Compacting
[91300]
N = 1 49.1 ± 0.2 % 20.1 ± 0.5 % 26 . 0 ± 0 . 3 % 50.5 ± 0.3 % 13 . 8 ± 0 . 4 % 30.2 ± 0.4 % 71.8 ± 0.3 % 39 . 5 ± 0 . 3 % 45.2 ± 0.1 %
N = 2 49.9 ± 0.2 % 24.9 ± 0.6 % 24.8 ± 0.3 % 51.9 ± 0.3 % 13.3 ± 0.4 % 30 . 5 ± 0 . 4 % 72.2 ± 0.3 % 38.3 ± 0.3 % 45.6 ± 0.1 %
N = 4 51.6 ± 0.2 % 27.6 ± 0.6 % 23.2 ± 0.3 % 53.8 ± 0.3 % 12.0 ± 0.4 % 30.1 ± 0.4 % 72 . 7 ± 0 . 3 % 37.6 ± 0.3 % 46.4 ± 0.1 %
N = 7 53.7 ± 0.2 % 29.9 ± 0.6 % 21.3 ± 0.3 % 55.9 ± 0.3 % 10.0 ± 0.4 % 29.1 ± 0.4 % 72.6 ± 0.3 % 37.7 ± 0.3 % 47.3 ± 0.1 %
N = 11 55 . 7 ± 0 . 2 % 31 . 9 ± 0 . 6 % 19.7 ± 0.3 % 57 . 5 ± 0 . 3 % 8.1 ± 0.3 % 27.4 ± 0.4 % 72.6 ± 0.3 % 37.1 ± 0.3 % 48 . 0 ± 0 . 1 %
Table 4. Results for the threat detection mode by varying the number of positions used in the GMM training with the best result for each metric in bold font. ‘TDR’ stands for threat detection rate and ‘FAR’ for false alarm rate. Confidence intervals are shown for a 95 % confidence. Green cells show values within the confidence interval for the best performance value (i.e., statistically non-significant differences). The values shown between brackets denote the number of frames that belong to the corresponding class, where the number below FAR represents the number of non-threats in the database.
Threat Detection
# PositionsTDR
[166830]
FAR
[573530]
Accuracy
[740360]
N = 1 80 . 7 ± 0 . 5 % 40.3 ± 0.4 % 64.5 ± 0.3 %
N = 2 80.3 ± 0.5 % 39.2 ± 0.4 % 65.2 ± 0.3 %
N = 4 78.7 ± 0.5 % 37.4 ± 0.4 % 66.3 ± 0.3 %
N = 7 76.7 ± 0.6 % 35.0 ± 0.4 % 67.6 ± 0.3 %
N = 11 74.4 ± 0.6 % 32 . 6 ± 0 . 4 % 69 . 0 ± 0 . 3 %
Table 5. Confusion matrix of the multi-position approach for detecting threats to the pipeline integrity for N = 1 position-based GMM training for the machine + activity identification mode (which represents the single-position approach chosen as baseline [26]). Each cell contains the classification accuracy. The values shown between brackets denote the number of frames that belong to the real class.
Recognized Class
Big ExcavatorSmall ExcavatorPneumatic
Hammer
Plate
Compactor
MovingHittingScrappingMovingHittingScrappingCompactingCompacting
Real classBig
excavator
[275145]Moving49.113.812.8 Electronics 10 00712 i001
[21995]Hitting20.020.120.415.6
[67230]Scrapping26.020.4
Small
excavator
[126575]Moving13.250.5
[23655]Hitting15.413.828.016.1
[53950]Scrapping16.814.330.216.1
Pneumatic hammer[80510]Compacting71.8
Plate Compactor[91300]Compacting22.439.5
Table 6. Confusion matrix of the multi-position approach for detecting threats to the pipeline integrity for N = 11 position-based GMM training for the machine + activity identification mode. Each cell contains the classification accuracy. The values shown between brackets denote the number of frames that belong to the real class.
Recognized Class
Big ExcavatorSmall ExcavatorPneumatic
Hammer
Plate
Compactor
MovingHittingScrappingMovingHittingScrappingCompactingCompacting
Real classBig
excavator
[275145]Moving55.722.1 Electronics 10 00712 i002
[21995]Hitting23.531.9
[67230]Scrapping17.521.119.716.3
Small
excavator
[126575]Moving14.557.5
[23655]Hitting15.812.726.016.8
[53950]Scrapping14.527.417.2
Pneumatic hammer[80510]Compacting72.6
Plate Compactor[91300]Compacting24.437.1
Table 7. Computational time of the system modules (in milliseconds). ‘MAC’ stands for machine + activity identification mode, TD for threat detection mode, and ‘Feat. Ext. + Norm.’ for Feature extraction + normalization.
System ModeFeat. Ext. + Norm.Pattern ClassificationTotal
MAC14080 (8 models)220
TD14020 (2 models)160
Table 8. Machine + activity identification mode result comparison with previous works [26,27,28,29] with the best result in bold font. Green cells show values within the confidence interval for the best performance value (i.e., statistically non-significant differences).
Big ExcavatorSmall ExcavatorPneumatic
Hammer
Plate
Compactor
Accuracy
MovingHittingScrappingMovingHittingScrappingCompactingCompacting
[27] 66.1 ± 0.2 % 22.2 ± 0.5 % 33.7 ± 0.4 % 57.9 ± 0.3 % 14.3 ± 0.4 % 36.6 ± 0.4 % 78.4 ± 0.3 % 41.3 ± 0.3 % 54.9 ± 0.11 %
[28] 44.5 ± 0.2 % 35 . 9 ± 0 . 6 % 31.5 ± 0.4 % 46.6 ± 0.3 % 31 . 6 ± 0 . 6 % 53 . 1 ± 0 . 4 % 78.4 ± 0.3 % 31.4 ± 0.3 % 45.7 ± 0.11 %
[29] 69 . 8 ± 0 . 2 % 22.6 ± 0.6 % 34 . 6 ± 0 . 4 % 63 . 9 ± 0 . 3 % 14.0 ± 0.4 % 45.4 ± 0.4 % 83 . 0 ± 0 . 3 % 45 . 5 ± 0 . 3 % 59 . 1 ± 0 . 11 %
Baseline [26] 49.1 ± 0.2 % 20.1 ± 0.5 % 26.0 ± 0.3 % 50.5 ± 0.3 % 13.8 ± 0.4 % 30.2 ± 0.4 % 71.8 ± 0.3 % 39.5 ± 0.3 % 45.2 ± 0.11 %
This work 55.7 ± 0.2 % 31.9 ± 0.6 % 19.7 ± 0.3 % 57.5 ± 0.3 % 8.1 ± 0.3 % 27.4 ± 0.4 % 72.6 ± 0.3 % 37.1 ± 0.3 % 48.0 ± 0.11 %
Table 9. Threat detection mode result comparison with previous works [26,27,28,29,30] with the best result in bold font. ‘TDR’ stands for threat detection rate and ‘FAR’ for false alarm rate. Green cells show values within the confidence interval for the best performance value (i.e., statistically non-significant differences).
Threat Detection
TDRFARAccuracy
[27] 81.1 ± 0.5 % 35.4 ± 0.4 % 68.3 ± 0.3 %
[28] 91 . 0 ± 0 . 4 % 53.7 ± 0.4 % 56.4 ± 0.3 %
[29] 89.1 ± 0.4 % 39.4 ± 0.4 % 67.0 ± 0.3 %
[30] 68.1 ± 0.6 % 55.6 ± 0.4 % 49.7 ± 0.3 %
Baseline [26] 80.7 ± 0.5 % 40.3 ± 0.4 % 64.5 ± 0.3 %
This work 74.4 ± 0.6 % 32 . 6 ± 0 . 4 % 69 . 0 ± 0 . 3 %
Publisher’s Note: MDPI stays neutral with regard to jurisdictional claims in published maps and institutional affiliations.

