
Visibility Graph Analysis of IOTA and IoTeX Price Series: An Intentional Risk-Based Strategy to Use 5G for IoT


1
International Doctoral School, Rey Juan Carlos University, 28933 Madrid, Spain
2
Department of Applied Mathematics, Rey Juan Carlos University, 28933 Madrid, Spain
*
Author to whom correspondence should be addressed.
†
Current address: Móstoles Campus, Rey Juan Carlos University, 28933 Madrid, Spain.
Electronics 2021, 10(18), 2282; https://doi.org/10.3390/electronics10182282
Submission received: 31 July 2021
/
Revised: 3 September 2021
/
Accepted: 4 September 2021
/
Published: 17 September 2021
(This article belongs to the Special Issue Blockchain for 5G and IoT: Opportunities and Challenges)
Abstract
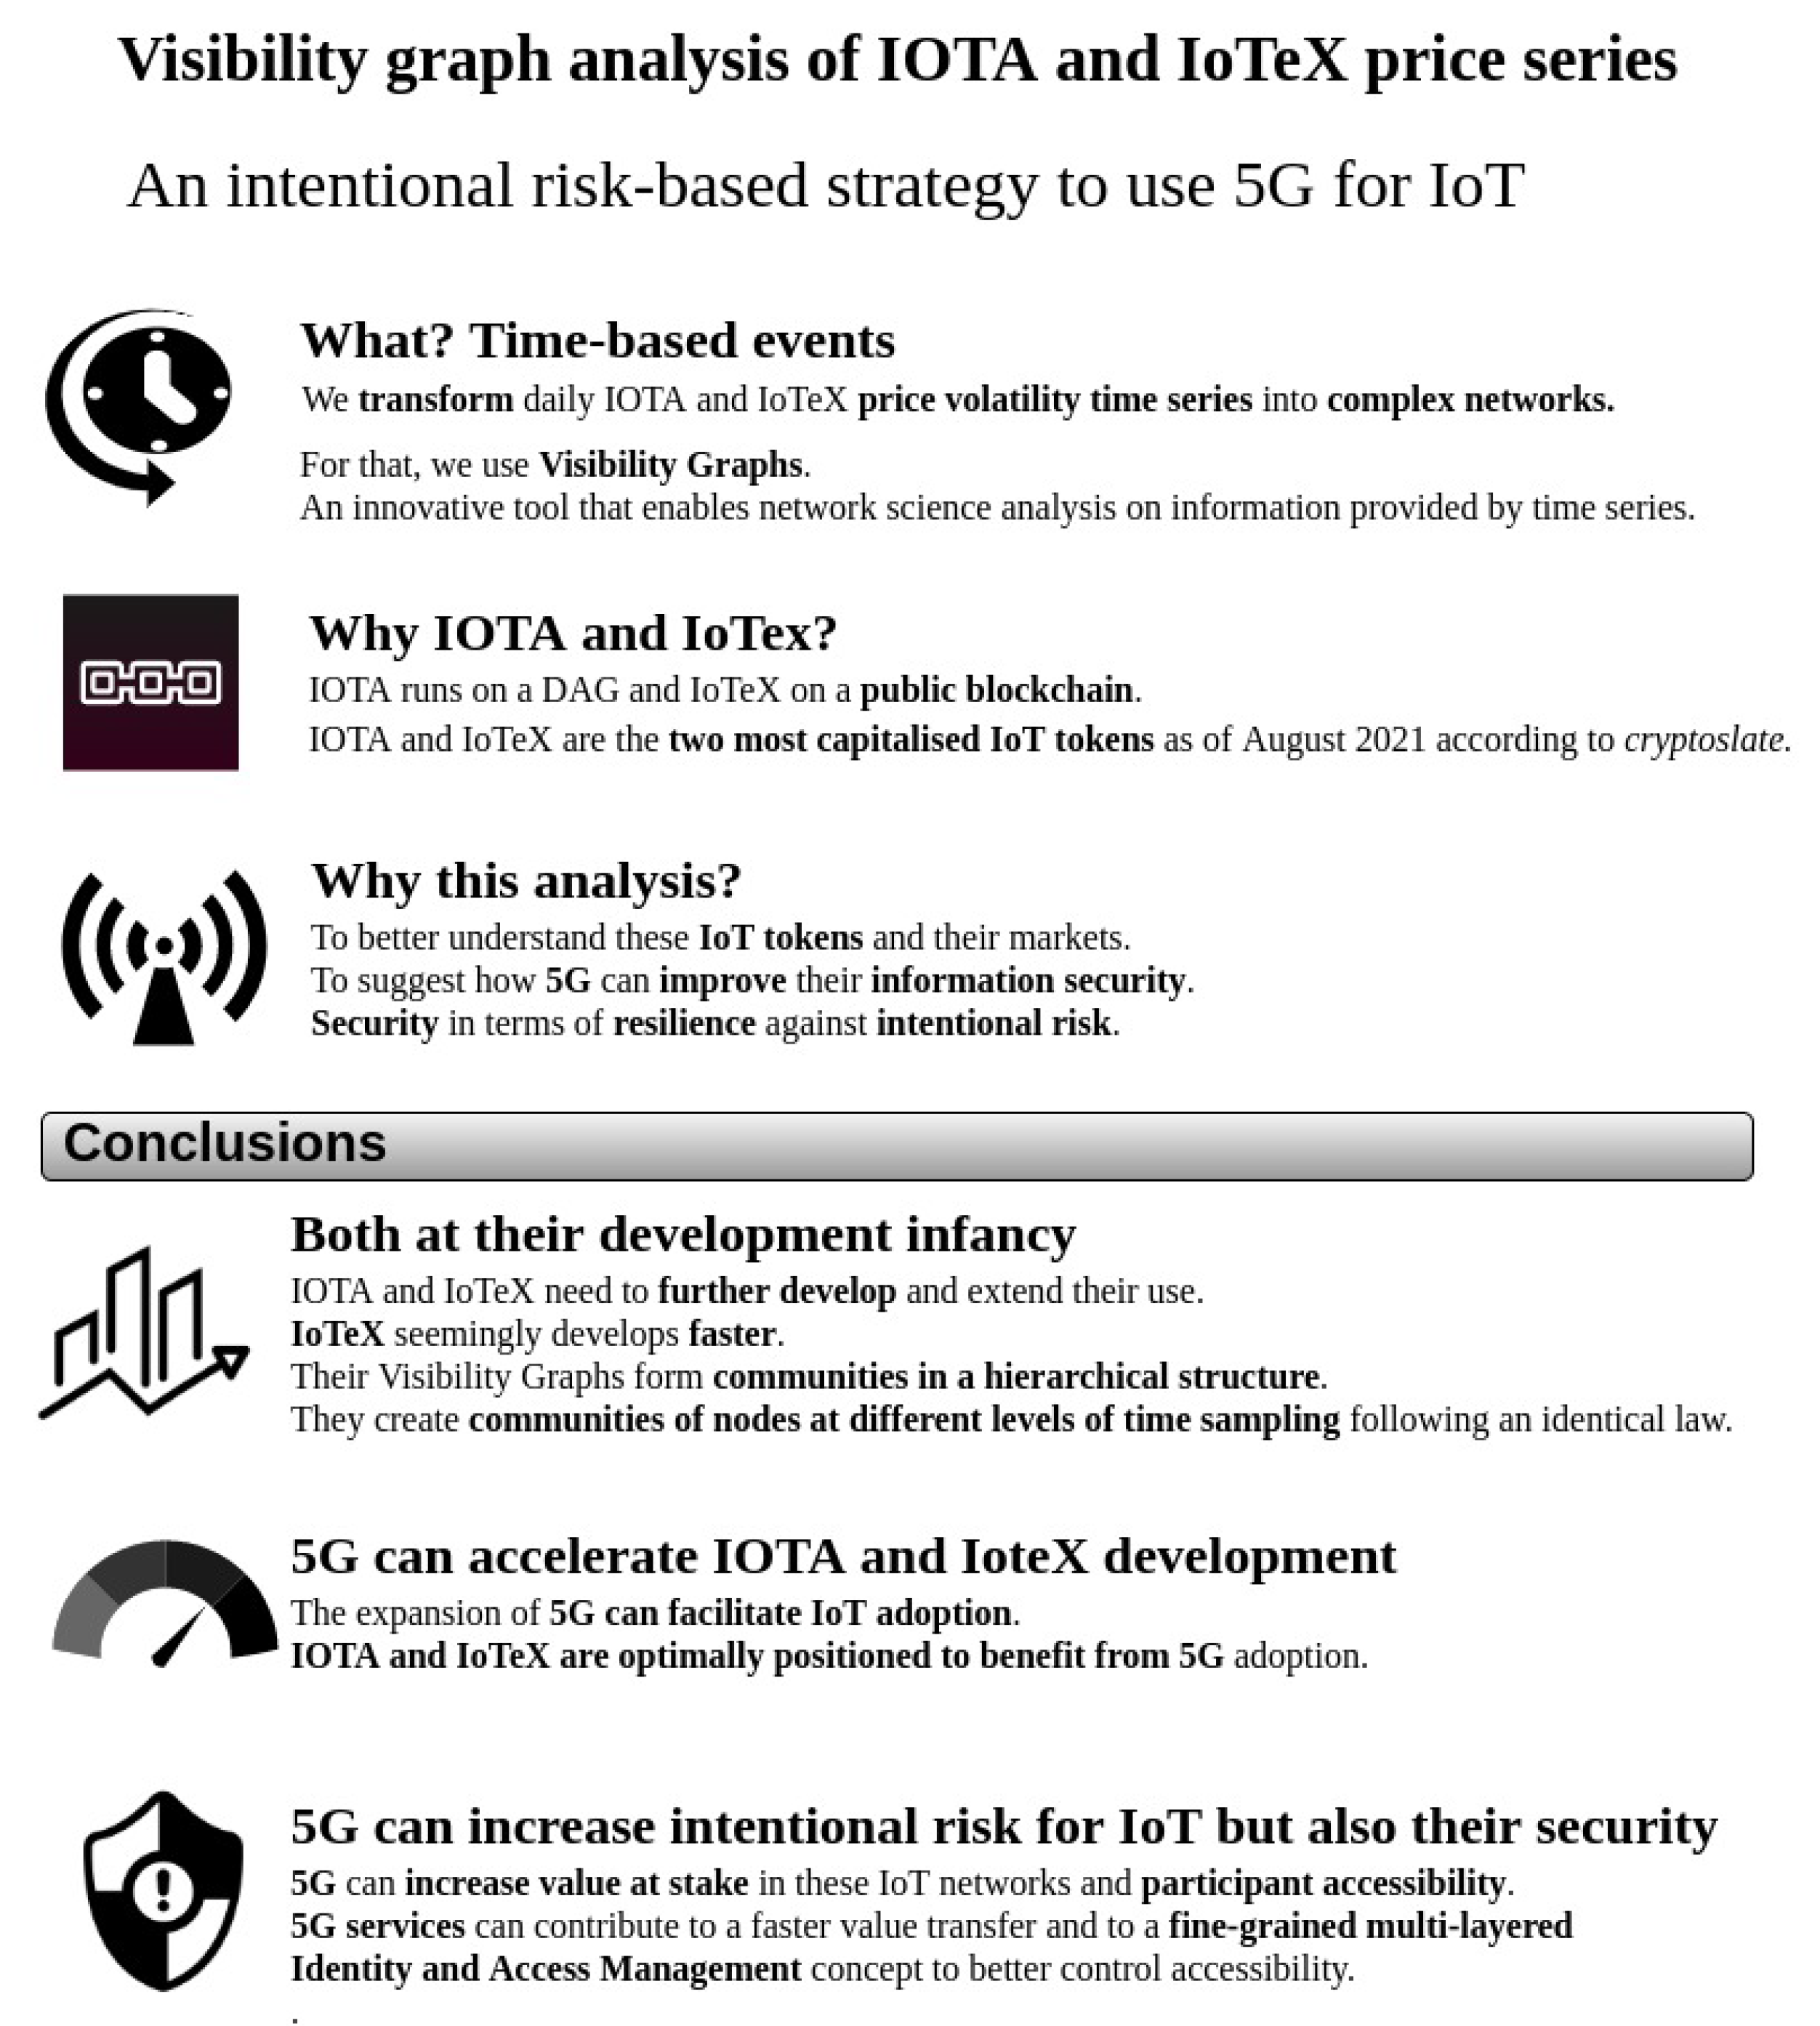
:The transformation of time series into complex networks through visibility graphs is an innovative way to study time-based events. In this work, we use visibility graphs to transform IOTA and IoTeX price volatility time series into complex networks. Our aim is twofold: first, to better understand the markets of the two most capitalised Internet of Things (IoT) platforms at the time of writing. IOTA runs on a public directed acyclic graph (DAG) and IoTeX on a blockchain. Second, to suggest how 5G can improve information security in these two key IoT platforms. The analysis of the networks created by the natural and horizontal visibility graphs shows, first, that both IOTA and IoTeX are still at their infancy in their development, with IoTex seemingly developing faster. Second, both IoT tokens form communities in a hierarchical structure, and third, 5G can accelerate their development. We use intentional risk management as a lever to understand the impact of 5G on IOTA and IoTeX. Our results lead us to provide a set of design recommendations that contribute to improving information security in future 5G-based IoT implementations.
1. Introduction
1.1. Foundations of This Study: From Time Series to Complex Networks
In mathematics, a time series is a succession of events ordered by time. Time series analysis aims to describe the statistical characteristics of the data. Time series forecasting aims to use a model to predict future values [1]. Network science is a scientific discipline at the crossroad of mathematics, statistics and physics [2]. It characterises systems composed of a collection of nodes and edges between them. They constitute a network. The nodes represent the members of the system and the edges certain relations or transfers between them. When the number of nodes and edges is high, i.e., thousands to millions, these systems create a complex network. Complex network analysis provides insights into how these systems grow, evolve and interact with their members. It is possible to transform a time series into a complex network thanks to an easy-to-implement algorithm, i.e., a visibility graph [3]. This conversion facilitates the study of the system whose events create a time series with the powerful analysis toolkit that complex network science provides. In our case, we transform the time series created from the daily prices of the two most capitalised Internet of Things (IoT) tokens into their corresponding complex networks. These visibility networks help us understand how these two IoT platforms behave and grow: IOTA and IoTeX, the former implemented on a directed acyclic graph (DAG) and the latter on a blockchain. We apply our findings to a real life scenario, i.e., the deployment of 5G mobile networks, and we use concepts stemming from intentional risk management to suggest specific 5G design choices that can potentially improve the resilience against intentional risk of both IoT platforms.
1.2. The Value Proposition of 5G
1.2.1. Mobile Networks
Mobile networks answer the need human beings have to communicate remotely while not being at home or anywhere close to a wireless local area network (LAN) access point (Wi-Fi). Since their first release in 1980 [4] until now, a series of consecutive generations has provided continuous technology improvements. Table 1 summarises data transmission (Tx) speed, technologies and some details of each generation [5] (refer to [5,6,7] on protocol acronyms used in Table 1):
1.2.2. 5G: Higher Speed and Lower Latency
Speeds displayed in Table 1 are only approximate. However, they show a continuous drive towards providing customers with faster speed rates. The mobile network generation that is currently being deployed is 5G, although there are still many GSM (2nd Generation) networks in production with a switch-off date beyond 2024 [8]. The 3rd Generation Partnership Project (3GPP) industry consortium [9] develops the communication protocol specifications for 5G. Telecommunication providers have measured in real life a 5G data transmission speed of 3 Gbps (3000 million bits per second) with a 3 milliseconds (ms) air latency. More habitual figures are in the range of 500 Mbps and 30 ms latency (including both air and edge server connection time gaps). As an example, the reaction time for the human brain on an image perceived by the eye is around 10 ms [10]. 5G providers expect to improve these figures in the coming years.
1.3. Internet of Things
The pervasiveness of Internet among human beings reaches already more than 50% of the world population, i.e., almost 4 billion people [11]. A total of 90% of those Internet users access it via mobile phones [12]. The connection of things with other things and people via Internet, known as the Internet of Things (IoT), is also growing in economic importance (USD 17 billion in 2021 [13]). The number of IoT connected devices reached the 20 billion mark in 2018 [14]. The forecast is that this figure will reach USD 30 billion by 2030 [15]. An IoT device has at least one transducer (sensor or actuator) to interact directly with the physical world and at least one network interface (e.g., 5G, Ethernet, Wi-Fi, Bluetooth) to interface with the digital world [16]. They bridge the physical with the digital world. Oracles play a similar role in distributed blockchains.
5G and Internet of Things
Already in 2016, the 3GPP consortium agreed to further develop IoT protocols like NarrowBand Internet of Things (NB-IoT) and Long Term Evolution Machine Type Communication (LTE-M). 4G mobile networks already use them within the suite of standardised low power, wide area (LPWA) technologies [17,18]. These two IoT protocols aim to meet low-cost, low-current, wide coverage and high capacity requirements. 5G is also being deployed in private networks, e.g., in industrial IoT [19]. Market analysts forecast a USD 3.6 trillion value generated in massive IoT developments up to 2035 [20].
1.4. Blockchain
The publication of the seminal Bitcoin (BTC) paper in 2008 by the pseudonym Satoshi Nakamoto [21] brought the spotlight on the blockchain, a distributed database that stores records in blocks. Each block is permanently linked to the chain of blocks by cryptographic means. The community accepts the longest chain of blocks. This technology provides data integrity as validated blocks cannot be tampered with. It also provides transparency as the chain of validated records is accessible to all participants and, finally, availability, as validators keep a copy of the blockchain [4]. Blockchain is a useful technology to register events requiring integrity, transparency and availability such as financial transactions [22,23,24,25].
Blockchain for IoT
IoT networks can benefit from the blockchain technology to answer their integrity, availability and, if required, transparency requirements [4,26]. The distributed nature of blockchain is an optimal design component for IoT implementations. As of September 2021, the market capitalisation of four IoT projects based on blockchains or directed acyclic graphs (DAG) exceeds USD 70 million: IOTA, IoTeX, MXC and Waltonchain [27]. In July 2021, their value surpassed USD 40 million.
1.5. Structure of the Paper
This paper is structured as follows. First, we introduce the foundations of our research and summarise the opportunities that 5G brings to blockchain-based IoT implementations. Second, we describe the current state-of-the-art with regard to 5G, IoT platforms and blockchain. Third, we present complex network analysis and the proxy role of price volatility. Fourth, we explain how visibility graphs bridge between time series and complex network analysis, and we briefly refer to power law functions and to intentional risk. Fifth, we share the methodology that we have followed to study IOTA and IoTeX price volatility, its implementation and the corresponding results of the analysis. Sixth, we draw several conclusions related to visibility graphs, IOTA and IoTeX markets and 5G using intentional risk concepts. Seventh, we suggest design options for 5G to improve information security in IOTA and IoTeX. Finally, we present our future work proposals.
2. Related Works
2.1. 5G Services and Their Economic Value
The International Telecommunication Union (ITU) Radio-communication sector defines the minimum standards for 5G within three main services, i.e., enhanced Mobile BroadBand (eMBB), massive Machine Type Communication (mMTC) and URLLC (Ultra Reliable and Low Latency Communications) [4]. The most deployed service continues to be eMBB [28], focused on improving data transmission rates for smartphone users. Although in 2021 5G enabled smartphones already constitute 43% of new shipped units worldwide [29], they still represent a tiny segment within the current deployed stock of smartphones. The other two services, mMTC and URLLC, are yet in their infancy. The economic value that 5G is expected to provide to the world economy is in the order of USD 12 trillion [30]. Table 2 introduces the technologies that 5G uses [4,31,32]:
2.1.1. 5G as Optimal Communication Channel for IoT
5G mobile technology will enable new value chains in many economic sectors. Those using machine-to-machine communications are among them [4]. 5G networks will provide performance enhancements, a high degree of reliability and very low latency communications [33]. The IoT segment with the heaviest economic weight is Smart Home Technologies with a projected market volume of USD 17 billion in 2021 [13]. Smart Home IoT devices are mostly connected to the Internet via Wi-Fi connections with mobile as a redundant backup communication channel. However, IoT devices in remote places and in places with no Wi-Fi coverage make use of mobile links to exchange data with their edge and cloud servers. The arrival of 5G, although at a later stage than, e.g., person-to-person mobile communications [20], will bring better energy efficiency, reliability and performance.
2.2. Blockchain or Directed Acyclic Graph-Based IoT Platforms
The two most capitalised IoT implementations based on distributed databases, i.e., distributed ledgers, are IOTA and IoTeX [27]. IOTA’s market capitalisation in July 2021 reached values such as USD 1.93 and USD 2.42 billion and IoTeX USD 181 and 188 million. In September 2021 they exceeded USD 4.3 billion and USD 633 million respectively [27]. We consider market capitalisation as a proxy for potential future economic value that these two IoT platforms can produce in IoT projects aimed to solve specific business cases, e.g., in healthcare [34] and transportation [35]. A relevant set of those projects will be using 5G mobile networks to allow for remote non-WiFi communications between sensors and edge and cloud servers.
2.2.1. IOTA
Created in 2015, IOTA is by far the most capitalised IoT platform [27]. It is an innovative solution based on a directed acyclic graph (DAG): Every participant launching a transaction in IOTA needs to validate two prior transactions, replacing the need for blocks and miners. It is a public, permissionless, open-source, and feeless distributed ledger. It enables the exchange of value between humans and machines [26]. IOTA is currently testing improvements to achieve a greater degree of decentralisation as it still requires the participation of a coordinator to validate transactions [26]. Energy, industrial communications and mobility are some of the fields where there are IOTA-based projects [36]. The IOTA token is tradeable since 2017.
2.2.2. IoTeX
Created in 2017, IoTeX allows for the use of multiple blockchains. It claims that no unique blockchain can satisfy all IoT requirements. The rootchain is a public permissionless blockchain that uses a randomised delegated proof of stake (Roll-DPoS). There are different permissioned and permissionless subchains according to their functionality [26,37]. Home domotics [38] and mobile payments [39] are two areas with promising IoTeX projects. The IoTex token started trading as an Ethereum-based token (ERC-20 IOTX token) in 2018. Table 3 presents a quick introductory summary of both IoT platforms:
2.2.3. Blockchain as Additional Security Value in 5G-Enabled IoT Networks
Blockchain technology brings additional security properties to the very high data transmission speed and the ultra low latency that 5G adds to IoT implementations, i.e., data integrity and non-repudiation [4,26,40]. Many blockchain-based IoT implementations can benefit from a reliable and fast 5G network, such as the use of IOTA in electric vehicle charging facilities [41] and IoTex in smart cities [42]. Nevertheless, a single blockchain implementation with no additional tools to manage the complexity of an IoT implementation, e.g., in edge and cloud computing, cannot provide all security requirements [26].
2.3. Complex Networks
Network analysis describes systems composed of many elements that interact with each other. Their relations create a graph. Nodes, also called vertices, connect between them via edges, also called links [2] (p. 2). The complexity appears when the number of nodes and links is high, and we need advanced mathematical and statistical tools to characterise those systems [43,44,45]. Complex network analysis is a useful tool to understand non-linear interactions [46], some of them dynamic [47] (p. 177), between network nodes. They provide a plausible behavioural model to real world examples such as social networks, contagious diseases, transportation networks and crypto-token networks [48,49] (p. 179). In our case, we use visibility graphs to transform the daily price volatility time series of IOTA and IoTeX tokens into complex networks. The study of these networks helps us understand IOTA and IoTeX markets and how 5G technology can have an impact on them.
2.4. Volatility as a Proxy Measure
The study of the relation between asset price volatility and asset trading volume is a common proposal to study markets [50]. Similarly, in crypto-currencies, the correlation coefficient between the volatility and volume is positive and statistically significant [51]. Yamak et al., studying bitcoin (BTC) from 2013 to 2019, found a bidirectional causal relationship between price volatility and trading volume being the one from volume to price volatility the strongest [51]. Equally, the number of addresses in BTC has a significant impact on the BTC price with variations over time [52], i.e., crypto-token markets relate to their networks. In Section 3, we explain how we study price volatility as a proxy to understand both IOTA and IoTex cryptocurrency markets and, ultimately, their networks and their link to a potential 5G deployment.
2.5. Visibility Graphs
Lacasa et al. propose two fast computational methods to convert a time series into a graph, the natural (in 2008 [3]) and the horizontal (in 2009 [53]) visibility graphs. The resulting graphs inherit and display structural properties of the time series. Complex network analysis helps identifying some of those properties [54]. Table 4 summarises the links between time series and visibility graphs (VG) [3]:
Visibility Graph of Bitcoin
In 2019, Liu et al. perform a visibility graph analysis of Bitcoin (BTC), Ethereum (ETH) and Litecoin (LTC) price volatility series to understand their markets [54]. They confirm that the three VGs are scale-free and they display a hierarchical structure, i.e., they cluster similarly at different levels. A power law behaviour in the function of the average clustering coefficient of each node with a specific degree confirms that each community clusters into sub-communities. These results, based on 5 years of daily prices (from April 2013 to May 2018), facilitate the construction of dynamic models of BTC, ETH and LTC markets and, in general, of any rare item market. With only 5 years of daily data, results for these three cryptocurrencies reproduce the price volatility series of the gold market throughout hundreds of years.
2.6. Power Laws
When the right tail of a probability distribution still contains a considerable amount of probability, its study is pivotal to understand that specific distribution. This is the case for power law functions. Mathematically, they behave as Equation (1):
If 3, the standard deviation of the distribution is not defined. If 2, the mean of the distribution is not defined. A scale-free, i.e., all values can occur, network has a power law function as a degree distribution, at least asymptotically. The value of for easy to identify power law functions goes goes from 2 to 3. Alstott et al. in 2014 provided a Python library to facilitate the study of the fit of empirical data with power law functions [55]. They use three typical functions to show potential power law fits, as Table 5 shows:
2.7. Intentional Risk
Traditional risk management deals with system failures and environmental disasters [56]. Intentional risk management is a security innovation proposed by Chapela et al. [46]. They perform a complex network analysis on information systems using value, anonymity and accessibility as the three key dimensions to manage attacks to the system by actors in search of a benefit. They distinguish between static and dynamic risk. The former relates to actors with access to the system and the latter to actors with no initial legitimate access to the system, i.e., with a maximum possible level of anonymity. We use for our analysis the concept of dynamic risk of an element e presented in Equation (2):
We link the concept of value with the daily price of the tokens we study and the concept of accessibility with the potential functionalities that 5G can provide to these IoT networks, as we explain in Section 3.
3. Methodology and Implementation
3.1. A Complex Network from a Visibility Graph
The first future work path mentioned in [26] is the transformation of the time series created by IOTA and IoTeX transactions, i.e., the value transacted at each point of time, into complex networks using the visibility graph technique proposed by Lacasa et al. [3]. The ultimate objective is to further analyse both IoT implementations. The number of transactions taking place in both networks since their inception render this proposal unrealistic if we consider a time series indexed per second as a time unit. A look at the IOTA explorer (Mainnet feed Section) [57] reveals time slots with several transactions, with zero and non-zero value IOTA token transfers, per second. Equally, in IoTeX explorer (right hand side column in its interface) [58], we see how there is a new block, including a handful of actions with zero and non-zero IoTeX token transfers, every few seconds. Alternatively, in this study, we analyse the visibility graphs created from IOTA and IoTeX tokens’ daily price volatility information since day one of trading. Daily token price information is accessible and regularly and accurately registered. It acts as a valid proxy to describe how these two IoT markets behave. We analyse the complex network stemming from the volatility visibility graphs. Our conclusions carry several implications for blockchain-based IoT implementations using 5G mobile networks.
3.2. Price Volatility Data Collection
We base our analysis on daily maximum and minimum prices for both IOTA and IoTeX tokens obtained from investing.com [59,60] (accessed on 24 July 2021). Investing.com (accessed on 24 July 2021) is a stock market quote and financial news provider. We calculate daily volatility values using Equation (3):
Table 6 presents the data items we use in our analysis, i.e., 4 years of daily volatility data for IOTA and 3 years of daily volatility data for IoTeX.
Figure 1 displays the lowest and highest daily price time series and the resulting price volatility time series.
3.3. Creation of the Natural Visibility Graph
Visibility_graph [61] is a Python module that implements the visibility graph proposed by Lacasa et al. [3]. We run this code to create the complex network. As input, we deploy the time series introduced in Section 3.2. The nodes correspond to each daily volatility measure, and the edges link those nodes that are “visible” to each other.
3.4. Creation of the Horizontal Visibility Graph
Visibility_algorithms [62] is a Python piece of code that implements the original proposal to create horizontal visibility graphs in Fortran 90/94 by Lacasa. Equally, we use as input the volatility time series presented in Section 3.2. The nodes correspond to each daily volatility measure, and the edges link those nodes that are “horizontally visible” to each other.
Figure 2 shows the appearance of the natural visibility graph (VG) and the horizontal visibility graph (HVG) for the 20 most recent days in our data collection.
3.5. Complex Network Analysis of the IOTA and IoTeX VG and HVG
Once we have these four complex networks at our disposal, i.e., the VGs and HVGs for both IOTA and IoTeX price volatilities, first, we obtain the degree for each node using the Python module networkx [63] and the basic network features, i.e., number of nodes and edges, number of isolated elements and self loops, average density and transitivity using the Python module metaknowledge [64]. Second, we proceed to measure the heterogeneity of the networks by plotting their degree functions and comparing them with potential power law fits using two methods:
3.5.1. Curve_Fit
First, we use the traditional curve_fit Python module from scipy.optimize [65]. It uses non-linear least squares to fit a function, in our case a power law, to the degree function of our IOTA and IoTeX volatility visibility graph-based complex network.
3.5.2. Power Law Fit Using the Powerlaw Module by Alstott et al.
Second, we assess the fit of the mentioned degree functions to a power law using the powerlaw Python module developed by Alstott et al. [55] and explained in Section 2.6. Following [55], we plot the probability density function (PDF) and the complementary cumulative distribution function (CCDF) for each of the four degree functions in our analysis.
3.6. Average of Clustering Coefficients per Degree and Fit
Inspired by [54], we study the linking possibility between neighbouring nodes by calculating the clustering coefficient of every node in these four networks. We plot the average of the clustering coefficients per degree. After that, we assess their fit with a power law function with the curve_fit Python module.
3.7. Communities in the Network
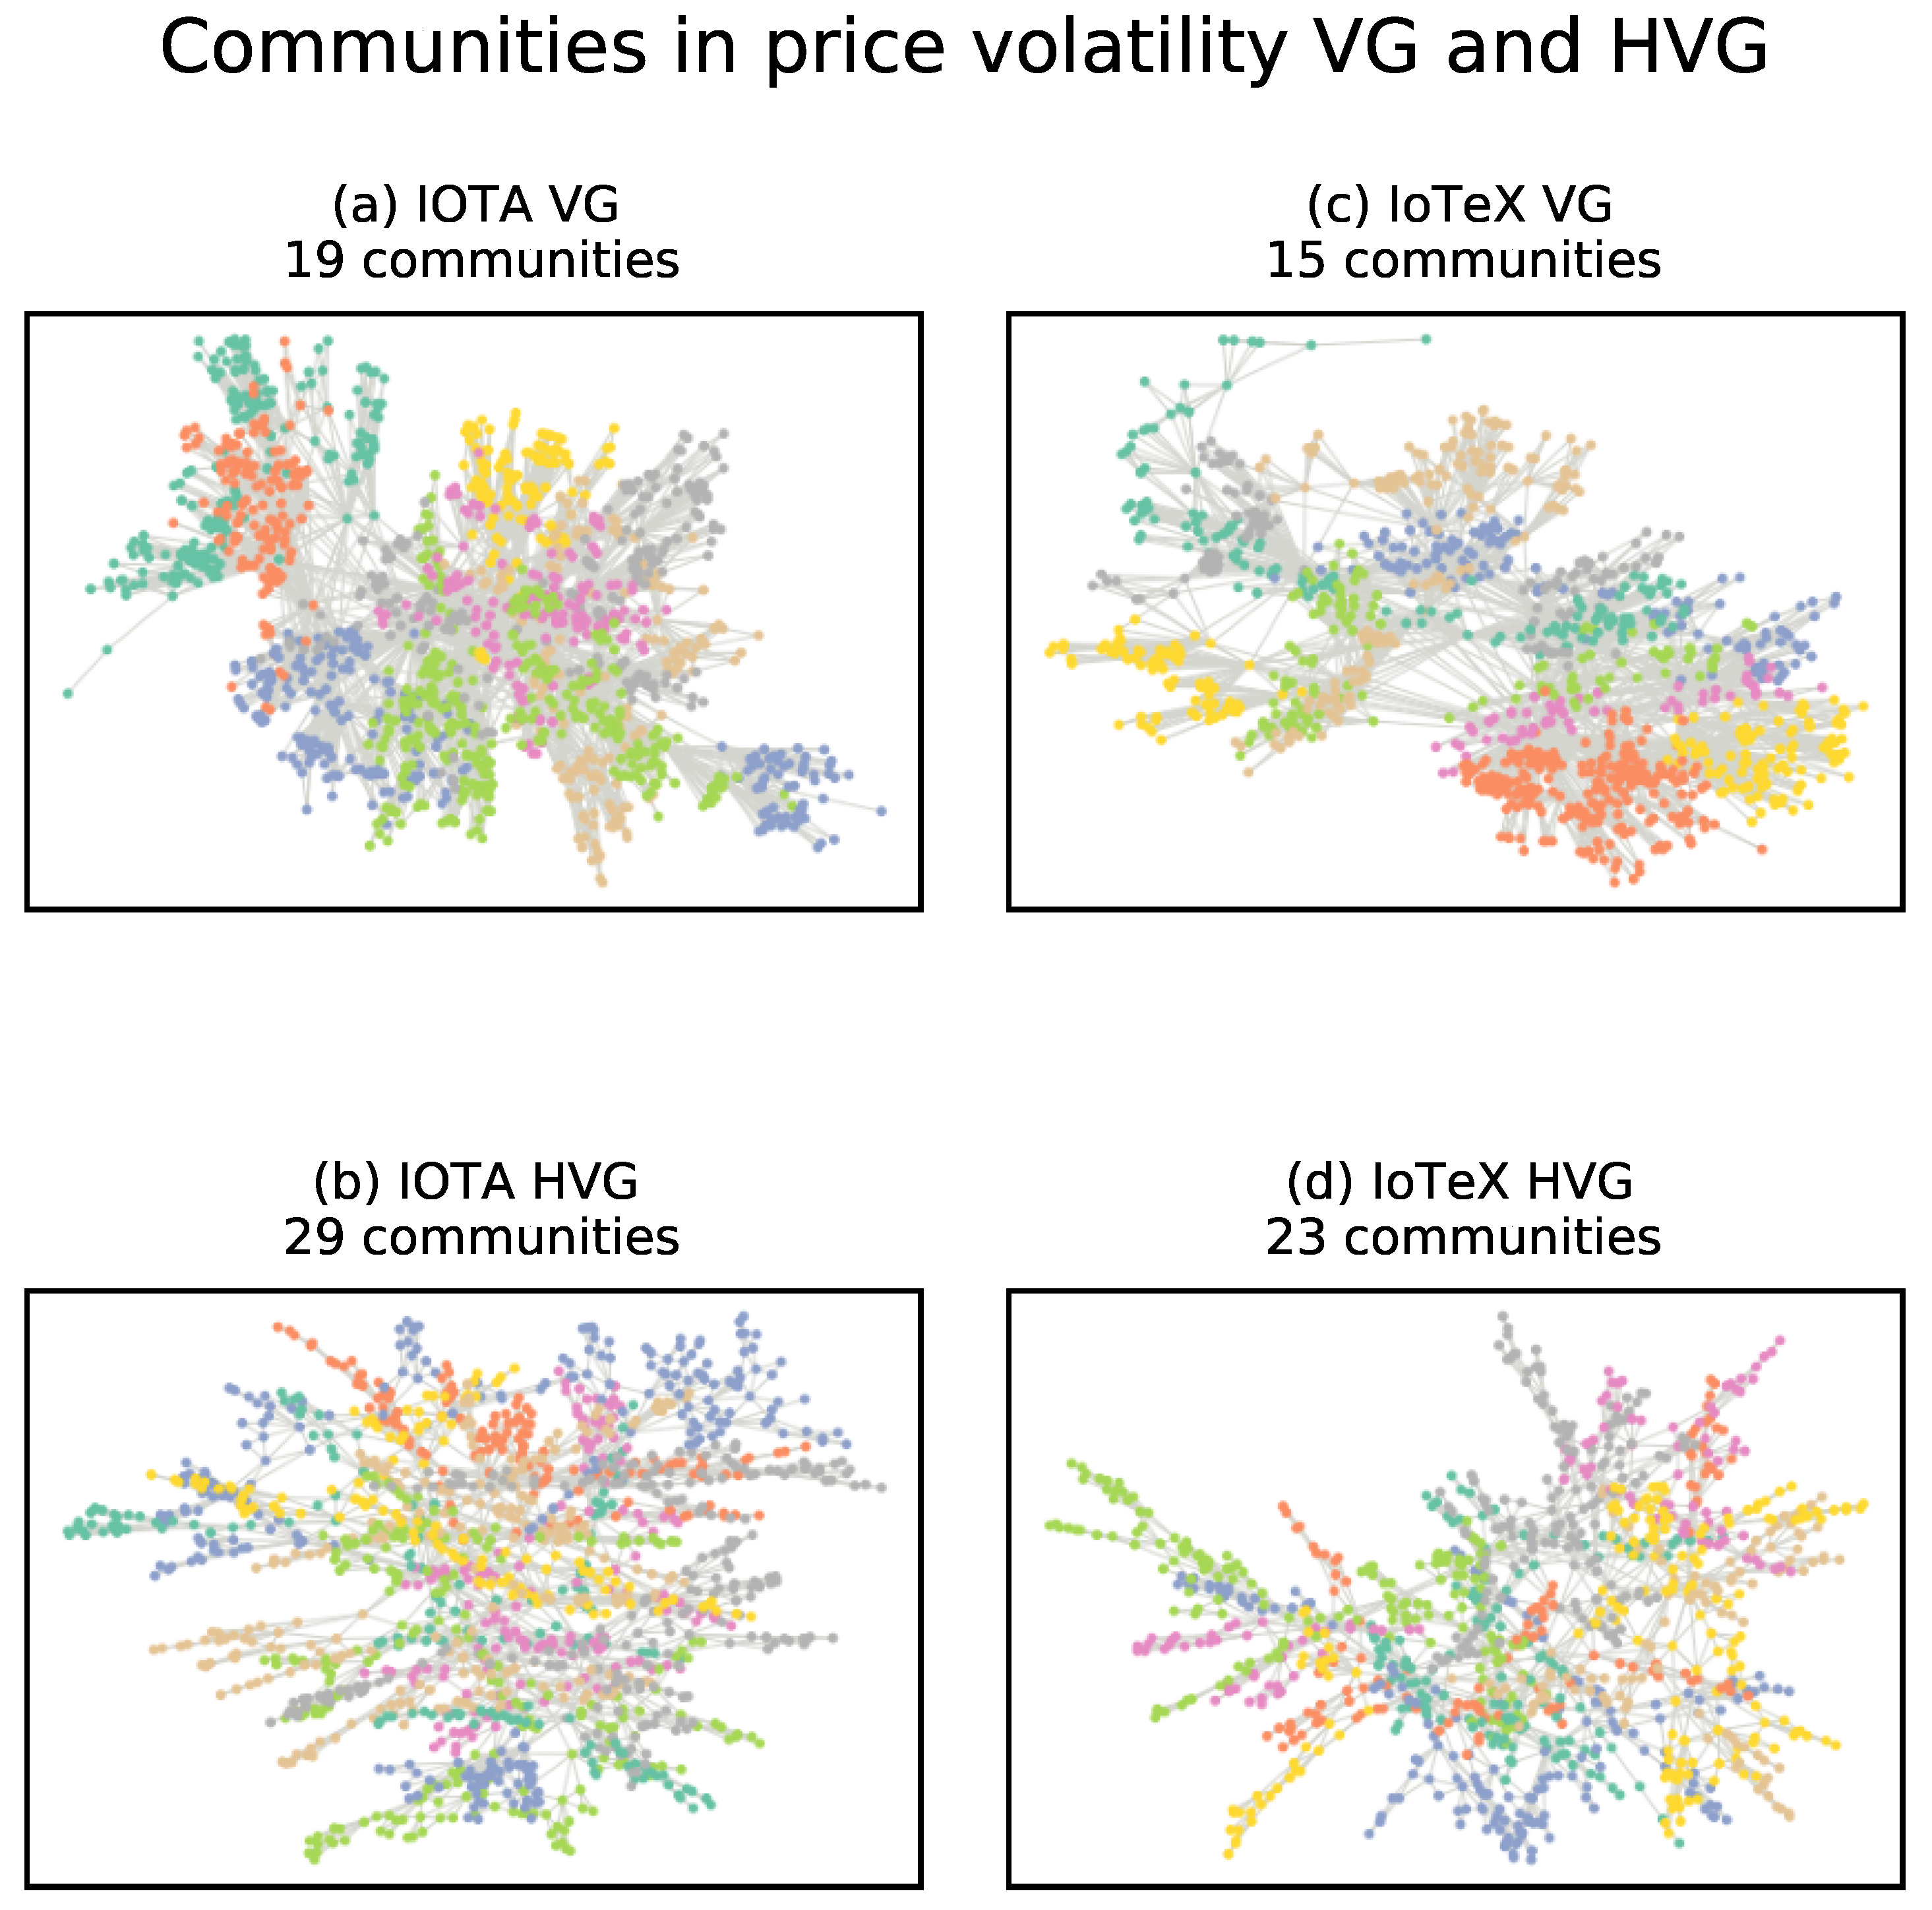
Understanding the community structure of a network contributes to describing the heterogeneity of a network. We complete our study by calculating the number and location of communities in the analysed IOTA and IoTeX networks. We use the community API for community detection in networkx [66]. An alternative will be the use of the cylovain code [67]. We run both pieces of code, and the resulting number of communities are very similar (see Table 7):
3.8. Link with Intentional Risk and Application to 5G
First, the results we obtain in terms of how close degree functions and average clustering coefficients per degree are to a power law provide insights on the heterogeneity of the network stemming from the daily price volatility visibility graph. We link our results with the two dimensions that compose dynamic risk, i.e., value and accessibility. Second, the arrival of 5G to both IoT platforms can play an important role in increasing their accessibility and in broadening the services that both IOTA and IoTeX can provide, e.g., in terms of lower-cost, lower-energy, wider coverage and higher capacity. Table 8 summarises the steps followed in our methodology, their main objective and the tools we use:
4. Analysis and Results
4.1. The Visibility Graph Creates Four Networks
We apply the visibility graph and horizontal visibility graph algorithms to the IOTA and IoTeX daily price volatility series and we obtain four complex networks: IOTA VG, IoTeX VG, IOTA HVG and IoTex HVG. The metaknowledge module provides a first approximation to the properties of these four networks (see Table 9):
The VG networks have a higher number of edges and, consequently, still low but higher values of density than HVGs. The four networks have a very low density and a low transitivity.
4.2. Power Law Fit Using Curve_Fit
Figure 3 shows the power law fits we obtain using curve_fit. We see how the fit for the IoTeX VG network provides a value of in accordance with Equation (1), hinting at the existence of a scale-free network. The IOTA VG, with an does not reach a value of two. When we focus on the HVG, we see an and for IOTA and IoTeX networks, respectively. We can even talk of incipient scale-free networks in both HVG cases. We highlight as well how in the four subplots the power law fit has a maximum degree from which there is no power law fit.
4.3. Power Law Fit Using the Powerlaw Module by Alstott
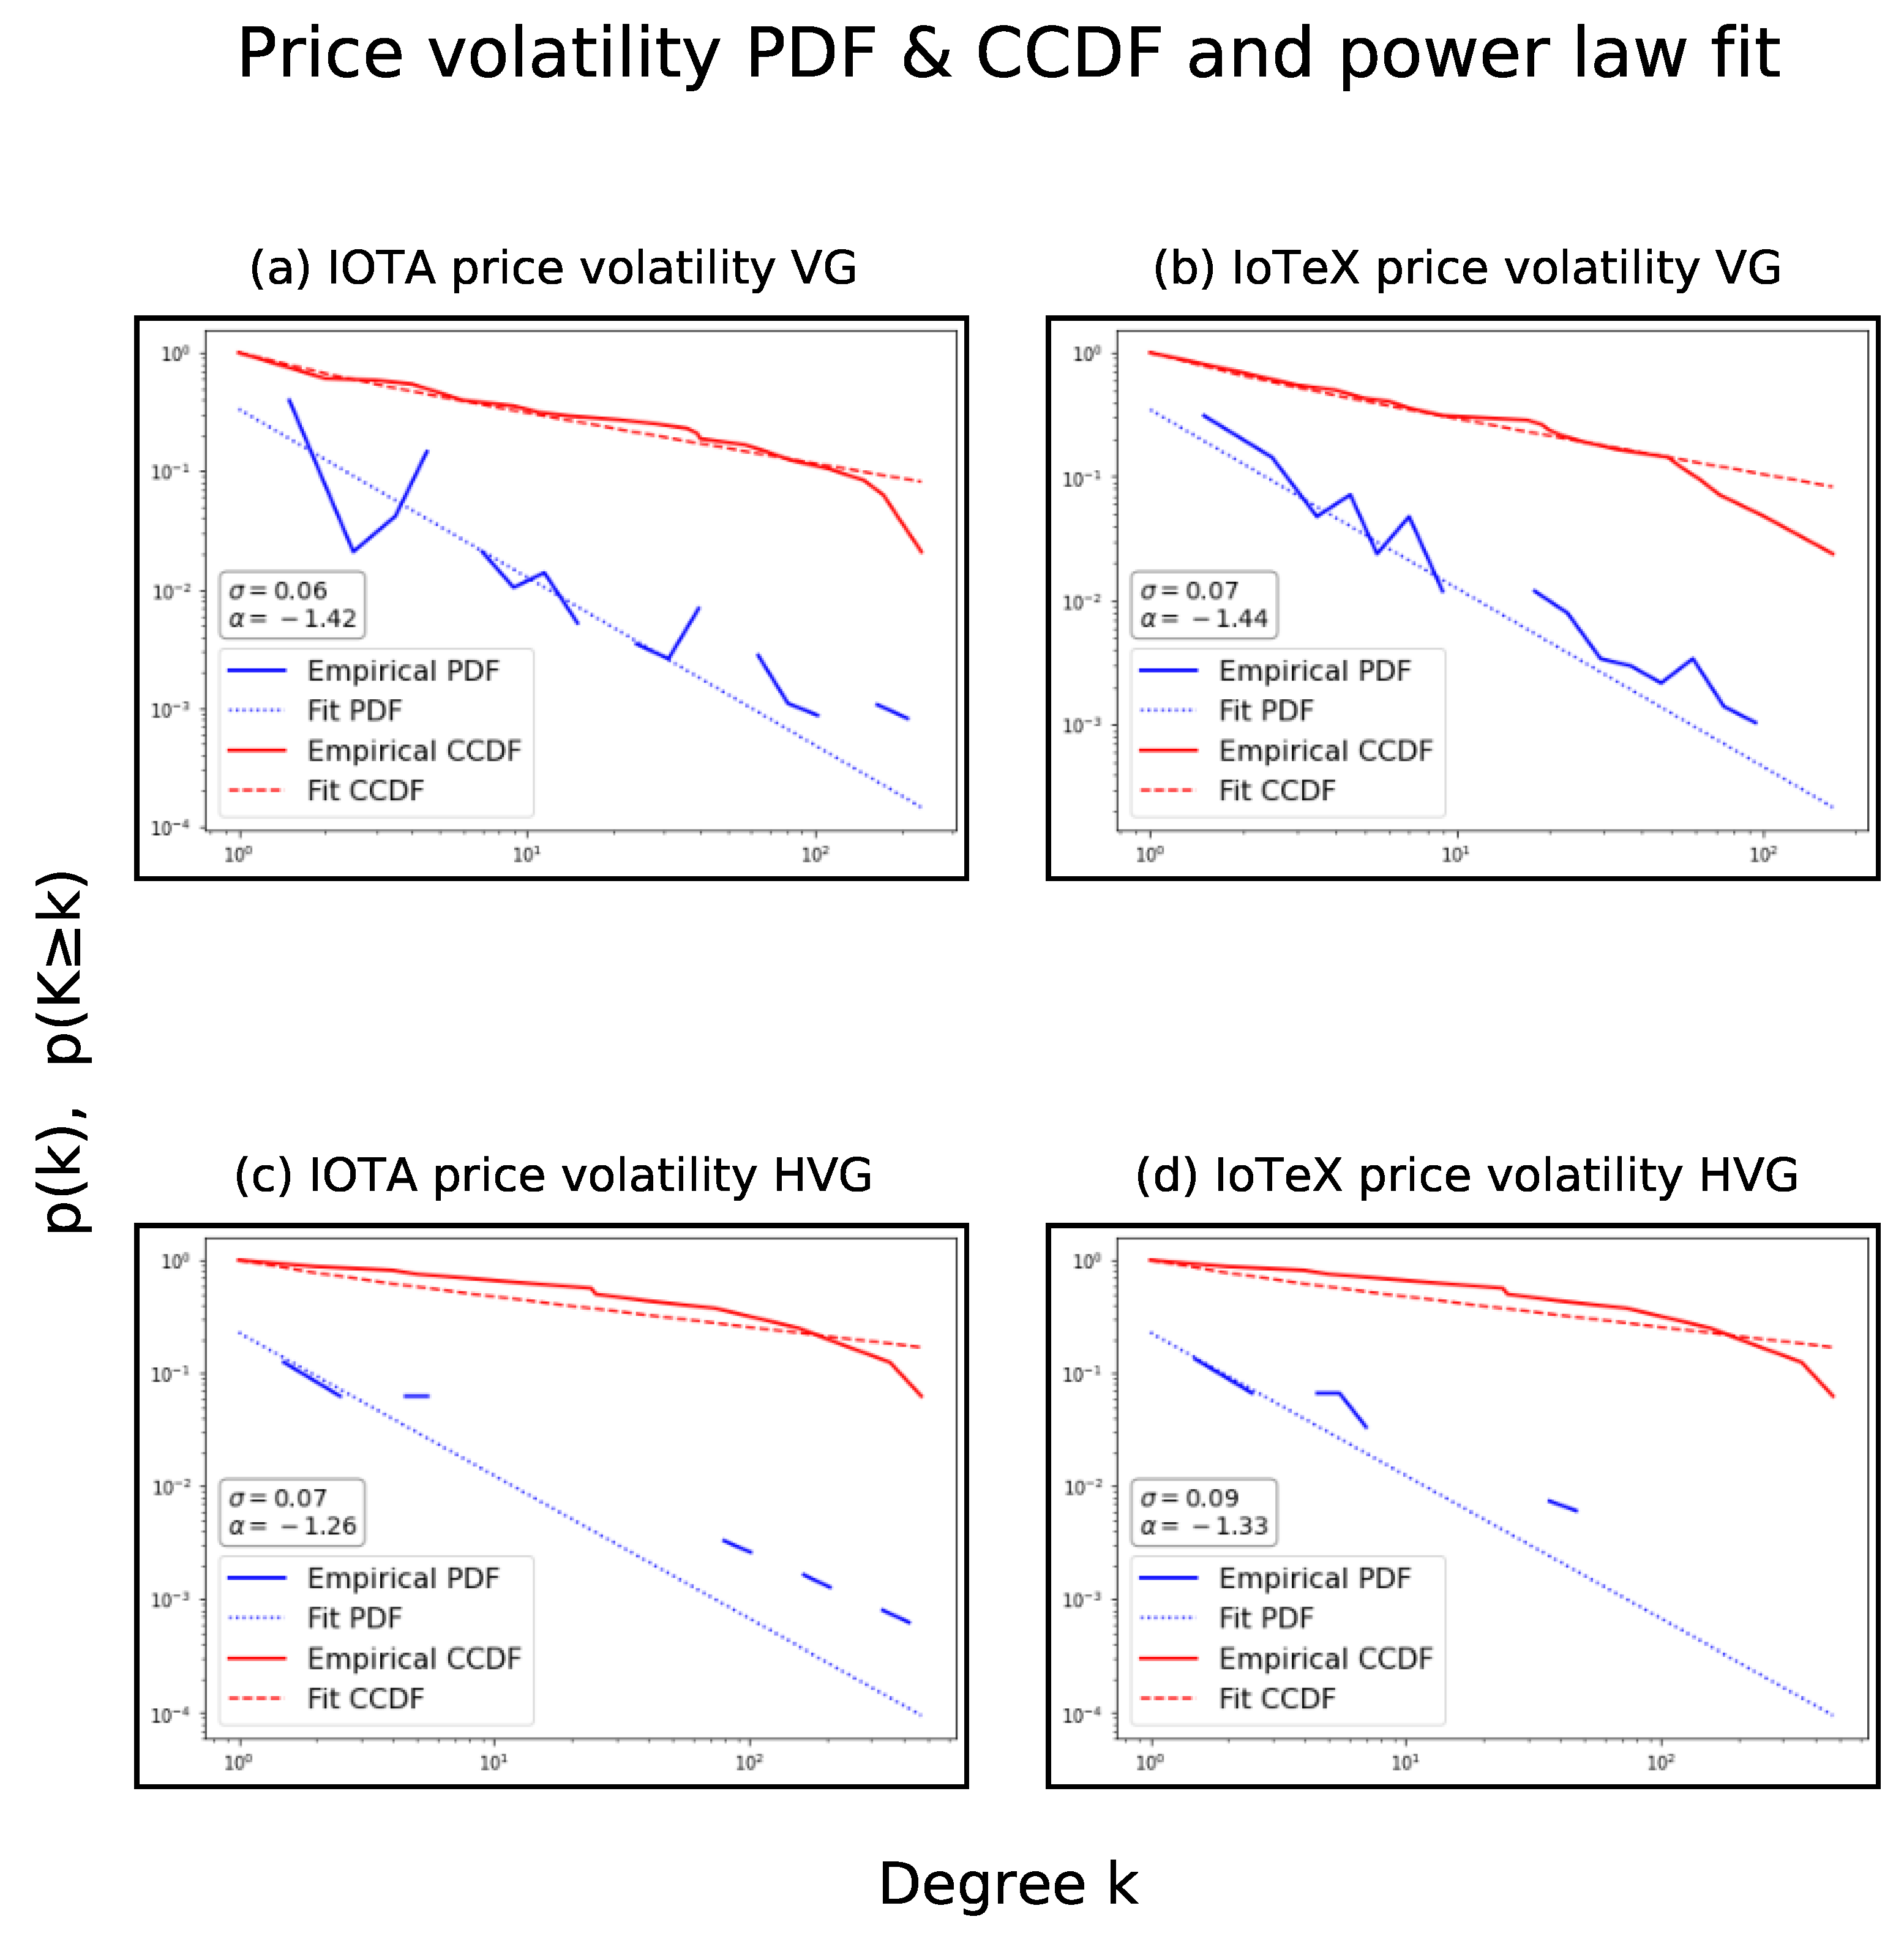
We use a second, more stringent, technique to assess the power law fit of the degrees in both the visibility graph and horizontal visibility graph networks: the Python module by Alstott powerlaw [55]. Figure 4 shows both the empirical and the fit probability density function (PDF) and the complementary cumulative distribution (CCDF) for the four networks. We identify a good fit with the power law CCDF for the four networks. However, the PDF fit can only be partially observed in the IoTeX VG. All four values of are well below two. In the remaining three networks, i.e., IOTA VG and IOTA and IoTeX HVG, the power law fits we obtain are quite limited in the range of degrees for IOTA VG and extremely limited for both HVGs.
4.4. Communities Formation Criteria within the Networks
We calculate the average of clustering coefficients per degree [54] with our own Python code. We plot this curve and fit it to a power law using curve_fit. We use the same scale as the degree function, although, here, the y axis’ range is one order of magnitude smaller. Figure 5 reveals that the power law fit is greater than in the previous cases when we plotted the degree. This means that communities at different levels are formed according to an identical law showing a fractal behaviour, i.e., a hierarchical network [54]. The values of are very close to 2 for both HVGs, where we identify an initial scale-free behaviour and around 1.85 for the VGs. In this case, we do not plot this fit using the powerlaw module by Alstott since the fit we observe with curve_fit shows a less heavy-tailed distribution than in the degree graphs.
4.5. Communities Identified in the IOTA and IoTeX Networks
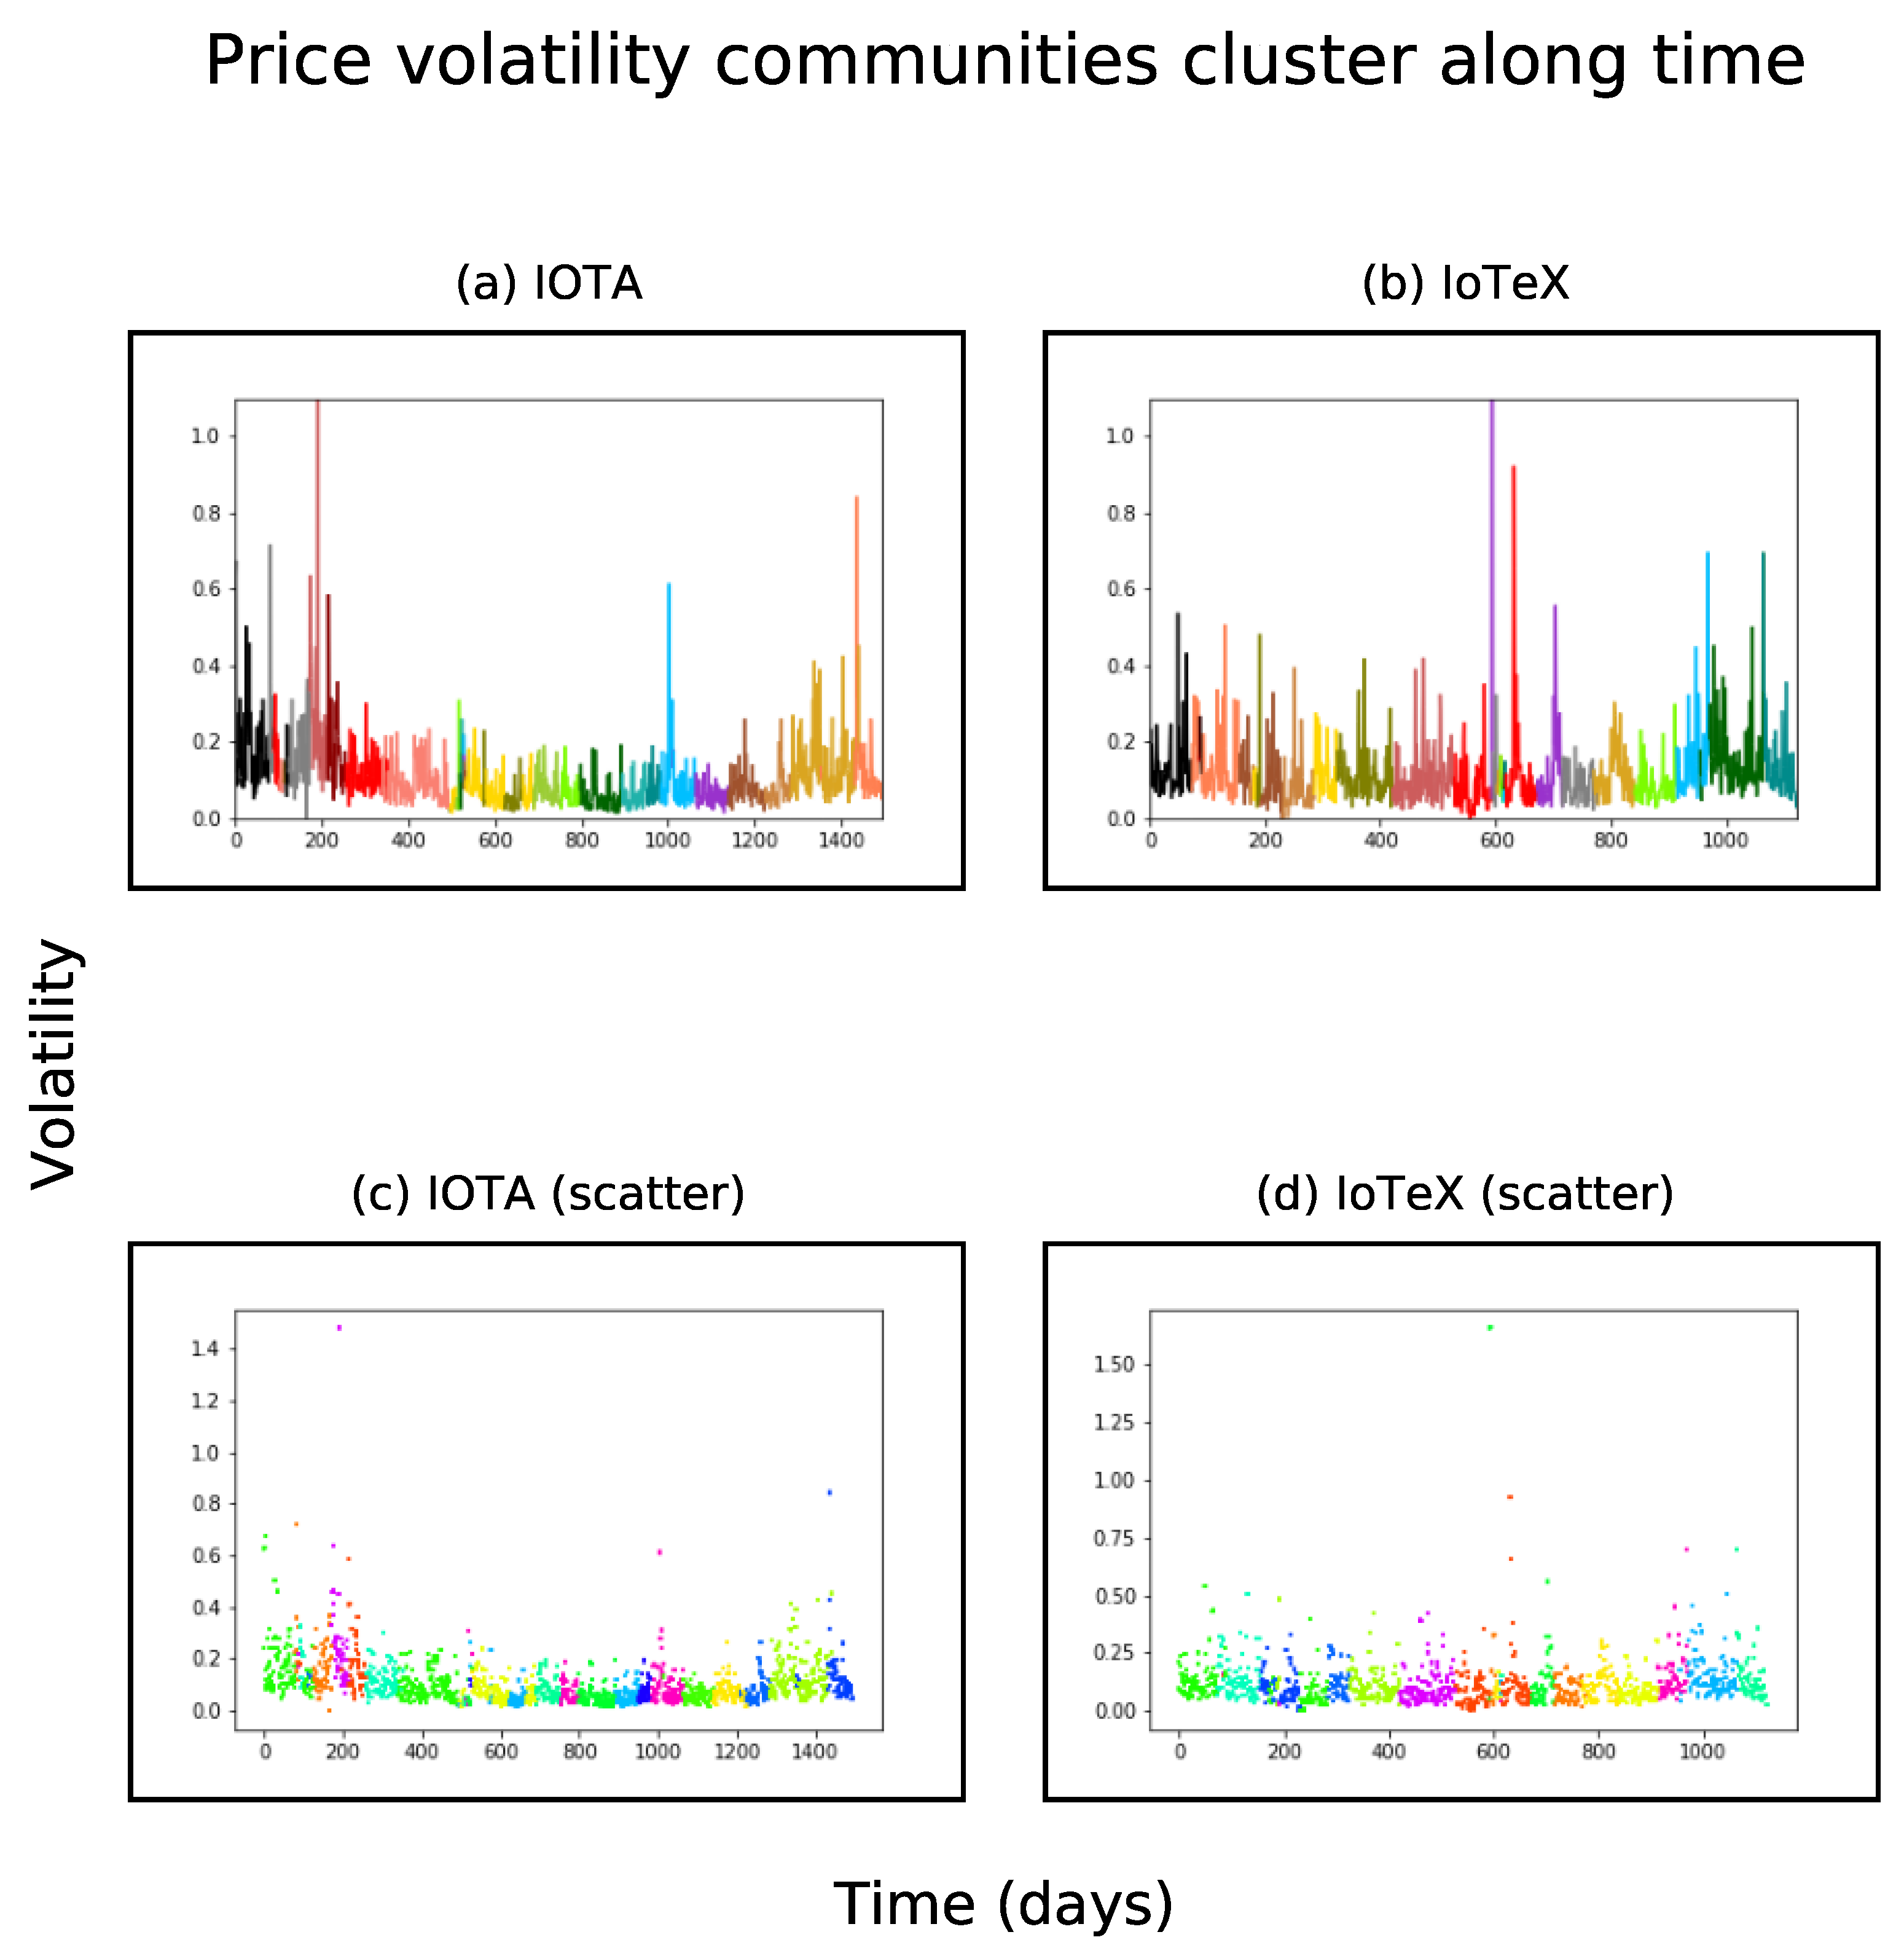
We obtain the existing communities in these networks using Community API [66], a Python module that implements the Louvain algorithm [68]. We identify a number of communities, as Table 7 shows. The presence of a community of nodes in a visibility graph is inherent to its creation. Community participant nodes tend to cluster together with a small value of the average shortest path along the timeline [54].
Figure 7 provides both volatility information as subplots in Figure 1 plus community information along IOTA and IoTeX timelines.
5. Conclusions
5.1. Visibility Graphs Are a Helpful Tool to Leverage Time Series with Network Analysis
This study confirms the usefulness of the proposal by Lacasa et al. [3] to transform time series into complex networks using visibility graphs. It is a novel way to incorporate the time dimension as an object of study within a complex network. Visibility graphs, as also confirmed by Liu et al. [54], preserve useful information present in the time series onto the resulting complex network.
5.2. IOTA and IoTeX Markets Are Still at Their Infancy in Terms of Development—IoTex Appears to Develop Faster
The number of data points studied in these networks is reduced. The history of both IoT tokens is still short. The density and transitivity figures obtained in Section 4.1 confirm this point. Similar VGs in Bitcoin, Ethereum and Litecoin [54] display stronger powerlaw fits. Their time series are 5 years long compared to the 4 and 3 year-long time series history for IOTA and IoTeX, respectively. IoTex VG, although one year younger than IOTA, seems to display a slightly better power law fit than IOTA. Figure 4 confirms this point. This could hint a faster path to maturity for IoTeX. In terms of HVG, given that the number of edges is more limited, we do not draw conclusions on maturity based on Figure 3 and Figure 4.
5.3. IOTA and IoTeX Visibility Networks form Communities in a Hierarchical Structure
Figure 5 confirms power law fits when we plot the average of clustering coefficients per degree in the four visibility networks, i.e., IOTA VG and HVG and IoTeX VG and HVG. This leads to a hierarchical structure, similar to the findings proposed by Liu et al. in the case of Bitcoin, Ethereum and Litecoin [54]. This means that the creation of communities of nodes, as Figure 6 and Figure 7 display, follow an identical law at different levels of time sampling.
5.4. 5G Can Accelerate IOTA and IoTeX Development
The move into production of 5G mobile networks, with the added value explained in Section 2.1.1, will trigger the further rollout of multiple IoT implementations and increase their adoption rates. As IOTA and IoTeX are the two most capitalised platforms [27], both are optimally positioned to become worldwide references in IoT deployments.
5.5. Intentional Risk: A Lever to Understand the Impact of 5G on IOTA and IoTeX
Within intentional risk, dynamic risk measures the impact of anonymous actors on information systems [46]. Value and accessibility are the two components of dynamic risk. The use of 5G in IoT platforms such as IoTeX and IOTA can increase their dynamic risk and, consequently:
- (a)
- The value at stake in the respective networks.
- (b)
- The accessibility of the participants.
We suggest several strategies to mitigate the growth of these two dimensions:
- (a)
- Distribute the new value generated across all platform participants. This will require a reduction of highly connected nodes, i.e., hubs that have a tendency to accumulate value. However, this strategy is not aligned with typical power law degree functions identified in IOTA and IoTeX. High-value hubs seem to remain and even grow in more mature crypto-networks (e.g., BTC and ETH [26]). We therefore recommend to:
- (b)
- Improve accessibility controls, especially to those nodes holding high value. An effective identity and access management (IAM) system, as mentioned in [26], is a potential improvement path.
- (c)
- Apply a multi-layered IAM system at different levels of scale considering the hierarchical structure observed in IOTA and IoTeX communities.
5.6. 5G Can Improve Information Security in IOTA and IoTeX
Considering the findings of our study and our prior conclusions, we state that 5G is well positioned to contribute to the security of IOTA and IoTeX platforms. The three main 5G services, i.e., enhanced Mobile BroadBand (eMBB), massive Machine Type Communication (mMTC) and URLLC (Ultra Reliable and Low Latency Communications) can:
- (a)
- Enable faster communications between IoT nodes so that high-value nodes can distribute their wealth more securely and quickly.
- (b)
- Allow for the implementation of more comprehensive, more fine-grained and faster identity and access management systems that would serve IOTA and IoTeX nodes.
- (c)
- Apply these 5G improvements not only at the edge level to tackle communications with IoT nodes but also between edge and cloud servers participating in the IoT platform, also known as “fog computing” or “fog networking”, as it is the case in IoTeX [26]. This would mean that IoTeX could have the potential to quickly reap benefits from 5G given its edge and cloud design.
We use app.diagrams.net in Figure 8 to summarise in an infographic the main points of this study.
6. Future Work
We suggest three paths for further research related to the role IOTA and IoTeX platforms will play in the IoT arena:
- (a)
- Contribute to the creation of public DAG and blockchain explorers with more advanced functionalities than the currently available ones for IOTA, thetangle.org [69], and IoTeX, IoTeXscan.io [58] (both accessed on 30 July 2021). As an example, the extraction of the transactions happening in real-time from the current explorers so that they can be easily analysed is still challenging. We would also like to contribute to an academic study focused on the standardisation of blockchain explorer functionalities and on the creation of the corresponding code modules that would implement them.
- (b)
- Once our first future work point is accomplished, we would like to perform a study similar to this one based on IOTA and IoTeX transaction data, i.e., creating the visibility graph from the transaction time series. We would complement this analysis with a time series clustering proposal that combines multiplex networks and time series attributes [1].
- (c)
- Finally, we would like to perform a similar volatility-based visibility graph analysis on other crypto-tokens such as the three currently most capitalised ones [70], i.e., Bitcoin, ETH and USDT with their entire price time series history.
Author Contributions
Conceptualization, A.P., M.R. and R.C. methodology, A.P., M.R. and R.C.; software, A.P.; validation, A.P., M.R. and R.C.; formal analysis, A.P., M.R. and R.C.; investigation, A.P.; resources, A.P., M.R. and R.C.; data curation, A.P.; writing—original draft preparation, A.P.; writing—review and editing, A.P., M.R. and R.C.; visualization, A.P.; supervision, M.R. and R.C.; project administration, M.R. and R.C.; funding acquisition, M.R. and R.C. All authors have read and agreed to the published version of the manuscript.
Funding
Regino Criado and Miguel Romance have been partially supported by projects PGC2018-101625-B-I00 (Spanish Science and Innovation Ministry, AEI/FEDER, UE) and M1967 (URJC Grant).
Conflicts of Interest
The authors declare no conflict of interest.
References
- Iglesias, P.S.; Moral-Rubio, S.; Criado, R. A new approach to combine multiplex networks and time series attributes: Building intrusion detection systems (IDS) in cybersecurity. Chaos Solitons Fractals 2021, 150, 111143. [Google Scholar] [CrossRef]
- Newman, M.E.J. The Structure and Function of Complex Networks. Siam Rev. 2003, 45, 167–257. [Google Scholar] [CrossRef] [Green Version]
- Lacasa, L.; Luque, B.; Ballesteros, F.; Luque, J.; Nuño, J.C. From time series to complex networks: The visibility graph. Proc. Natl. Acad. Sci. USA 2008, 105, 4972–4975. [Google Scholar] [CrossRef] [PubMed] [Green Version]
- Hewa, T.M.; Kalla, A.; Nag, A.; Ylianttila, M.E.; Liyanage, M. Blockchain for 5G and IoT: Opportunities and Challenges. In Proceedings of the 2020 IEEE Eighth International Conference on Communications and Networking (ComNet), Hammamet, Tunisia, 27–30 October 2020; pp. 1–8. [Google Scholar] [CrossRef]
- Meraj, M.; Kumar, S. Evolution of mobile wireless technology from 0G to 5G. Int. J. Comput. Sci. Inf. Technol. 2015, 6, 2545–2551. [Google Scholar]
- LTE Encyclopedia. Acronyms. Available online: https://sites.google.com/site/lteencyclopedia/lte-acronyms (accessed on 22 July 2021).
- Qualcomm. What Is 5G. Available online: https://www.qualcomm.com/5g/what-is-5g (accessed on 22 July 2021).
- GSM Phase out Calendar. Available online: https://www.emnify.com/en/resources/global-2g-phase-out (accessed on 22 July 2021).
- 3GPP. 3rd Generation Partnership Project (3GPP). Available online: https://www.3gpp.org/ (accessed on 22 July 2021).
- Telekom. 5G Real Time Speed. Available online: https://www.telekom.com/en/company/details/5g-speed-is-data-transmission-in-real-time-544498 (accessed on 22 July 2021).
- Statista. Internet Usage Worldwide—Statistics & Facts. Available online: https://www.statista.com/topics/1145/internet-usage-worldwide/ (accessed on 22 July 2021).
- Statista. Mobile Internet Usage Worldwide—Statistics & Facts. Available online: https://www.statista.com/topics/779/mobile-internet/ (accessed on 22 July 2021).
- Statista. Internet of Things. Revenue by Segment. Available online: https://www.statista.com/outlook/tmo/internet-of-things/worldwide (accessed on 22 July 2021).
- Sallaba, M.; Siegel, D.; Becker, S.; Deloitte Blockchain Institute. IoT Powered by Blockchain. How Blockchains Facilitate the Application of Digital Twins in IoT. May 2018. Available online: https://www2.deloitte.com/content/dam/Deloitte/de/Documents/Innovation/IoT-powered-by-Blockchain-Deloitte.pdf (accessed on 22 July 2021).
- Statista. Number of Internet of Things (IoT) Connected Devices Worldwide in 2018, 2025 and 2030. Available online: https://www.statista.com/statistics/802690/worldwide-connected-devices-by-access-technology/ (accessed on 22 July 2021).
- NIST. Creating a Profile Using the IoT Core Baseline and Non-Technical Baseline. NIST Interagency or Internal Report 8259C. December 2020. Available online: https://doi.org/10.6028/NIST.IR.8259C-draft (accessed on 22 July 2021).
- Ericsson. IoT Protocols in 5G. Available online: https://www.ericsson.com/en/reports-and-papers/nb-iot-and-lte-m-in-the-context-of-5g-industry-white-paper (accessed on 22 July 2021).
- 3GPP. 3rd Generation Partnership Project (3GPP). Decisions on IoT Protocols. Available online: https://www.3gpp.org/news-events/1805-iot_r14 (accessed on 22 July 2021).
- Qualcomm. Private Industrial Networks Offer Key Benefits for Industrial IoT. Available online: https://www.qualcomm.com/research/5g/5g-industrial-iot (accessed on 23 July 2021).
- Qualcomm. The $12 Trillion Opportunity Ahead. Available online: https://www.qualcomm.com/media/documents/files/fierce-wireless-ebrief-5g-release-16.pdf (accessed on 22 July 2021).
- Nakamoto, S.; Bitcoin: A Peer-to-Peer Electronic Cash System. Nakamotoinstitute.org, October 2008. Available online: https://bitcoin.org/bitcoin.pdf (accessed on 21 July 2021).
- Christian, C.; Joshua, S.G. Some Simple Economics of the Blockchain, Working Paper 22952, National Bureau of Economic Research, December 2016. Available online: https://www.nber.org/papers/w22952 (accessed on 22 July 2021).
- ECB. “Distributed Ledger Technology”, In Focus, Issue 1, European Central Bank. 2016. Available online: https://bit.ly/3fHcOYS (accessed on 22 May 2021).
- ESMA. “The Distributed Ledger Technology Applied to Securities Markets”, Report ESMA50-1121423017-285, Discussion Paper, European Securities and Markets Authority, 7 February 2017. Available online: https://bit.ly/344omjI (accessed on 22 July 2021).
- Pinna, A.; Ruttenberg, W. “Distributed Ledger Technologies in Securities Post trading: Revolution or Evolution”, ECB Occasional Paper Series 172, European Central Bank, 20 April 2016. Available online: https://bit.ly/3oHEMaY (accessed on 22 July 2021).
- Partida, A.; Criado, R.; Romance, M. Identity and Access Management Resilience against Intentional Risk for Blockchain-Based IOT Platforms. Electronics 2021, 10, 378. [Google Scholar] [CrossRef]
- IOT Crypto Coin Market Value. Available online: https://cryptoslate.com/cryptos/iot/ (accessed on 22 July 2021).
- Arm. Managing the Future of Cellular. Available online: https://www.arm.com/-/media/global/solutions/infrastructure/managing-the-future-of-cellular.pdf (accessed on 23 July 2021).
- Statista. Forecast 5G-Enabled Smartphone Shipments as Share of Total Smartphone Shipments Worldwide from 2019 to 2023. Available online: https://www.statista.com/statistics/1027246/5g-smartphone-shipment-share-worldwide/ (accessed on 23 July 2021).
- IHS Economics. The 5G Economy: How 5G Technology Will Contribute to the Global Economy. Available online: https://cdn.ihs.com/www/pdf/IHS-Technology-5G-Economic-Impact-Study.pdf (accessed on 23 July 2021).
- Bogale, T.E.; Wang, X.; Le, L.B. mmWave communication enabling techniques for 5G wireless systems: A link level perspective. In MmWave Massive MIMO; Academic Press: Cambridge, MA, USA, 2017; pp. 195–225. [Google Scholar]
- Shen, X. Device-to-device communication in 5G cellular networks. IEEE Netw. 2015, 29, 2–3. [Google Scholar] [CrossRef]
- Khurpade, J.M.; Rao, D.; Sanghavi, P.D. A Survey on IOT and 5G Network. In Proceedings of the 2018 International Conference on Smart City and Emerging Technology (ICSCET), Mumbai, India, 5 January 2018; pp. 1–3. [Google Scholar]
- Fatokun, T.; Nag, A.; Sharma, S. Towards a Blockchain Assisted Patient Owned System for Electronic Health Records. Electronics 2021, 10, 580. [Google Scholar] [CrossRef]
- Sun, H.; Hua, S.; Zhou, E.; Pi, B.; Sun, J.; Yamashita, K. Using Ethereum blockchain in Internet of Things: A solution for electric vehicle battery refueling. In International Conference on Blockchain; Springer: Cham, Switzerland, 2018; pp. 3–17. [Google Scholar]
- IOTA Corporate Site. Explore IOTA Industries. Available online: https://www.iota.org/solutions/industries (accessed on 28 July 2021).
- IoTex Team and Introduction Portal. Available online: https://iotex.io/ (accessed on 28 July 2021).
- Fan, X.; Zhong, Z.; Chai, Q.; Guo, D. Ucam: A User-Centric, Blockchain-Based and End-to-End Secure Home IP Camera System. In Security and Privacy in Communication Networks; Park, N., Sun, K., Foresti, S., Butler, K., Saxena, N., Eds.; Lecture Notes of the Institute for Computer Sciences, Social Informatics and Telecommunications Engineering; Springer: Cham, Switzerland, 2020; Volume 336. [Google Scholar]
- Xu, L.; Chen, L.; Gao, Z.; Carranco, L.; Fan, X.; Shah, N.; Diallo, N.; Shi, W. Supporting Blockchain-Based Cryptocurrency Mobile Payment With Smart Devices. IEEE Consum. Electron. Mag. 2020, 9, 26–33. [Google Scholar] [CrossRef] [Green Version]
- Mistry, I.; Tanwar, S.; Tyagi, S.; Kumar, N. Blockchain for 5G-enabled IoT for industrial automation: A systematic review, solutions, and challenges. Mech. Syst. Signal Process. 2020, 135, 106382. [Google Scholar] [CrossRef]
- Florea, B.C.; Taralunga, D.D. Blockchain IoT for smart electric vehicles battery management. Sustainability 2020, 12, 3984. [Google Scholar] [CrossRef]
- Tekeoglu, A.; Ahmed, N. TangoChain: A Lightweight Distributed Ledger for Internet of Things Devices in Smart Cities. In Proceedings of the 2019 IEEE International Smart Cities Conference (ISC2), Casablanca, Morocco, 14–17 October 2019; pp. 18–21. [Google Scholar]
- Newman, M.E.J. The Connected World. 2011-09-15. Santa Fe Institute. Available online: https://www.youtube.com/watch?v=yAtsm5xkb5c (accessed on 21 December 2021).
- Newman, M.E.J. Using Networks To Make Predictions. 2011-09-15. Santa Fe Institute. Available online: https://www.youtube.com/watch?v=rwA-y-XwjuU (accessed on 21 December 2021).
- Newman, M.E.J. What Networks Can Tell Us About the World. 2011-09-15. Santa Fe Institute. Available online: https://www.youtube.com/watch?v=lETt7IcDWLI (accessed on 21 December 2021).
- Chapela, V.; Criado, R.; Moral, M.; Romance, R. Intentional Risk Management through Complex Networks Analysis; Springer: Berlin/Heidelberg, Germany, 2015. [Google Scholar]
- Boccaletti, S.; Latora, V.; Moreno, Y.; Chavez, M.; Hwang, D. Complex Networks: Structure and Dynamics. Phys. Rep. 2006, 175–308. [Google Scholar] [CrossRef]
- Boccaletti, S.; Buldú, J.; Criado, R.; Flores, J.; Latora, V.; Pello, J.; Romance, M. Multiscale Vulnerability of Complex Networks. Chaos Interdiscip. J. Nonlinear Sci. 2007, 175–308. [Google Scholar] [CrossRef] [PubMed] [Green Version]
- Guo, D.; Dong, J.; Wang, K. Graph structure and statistical properties of Ethereum transaction relationships. Inf. Sci. 2019, 492, 58–71. [Google Scholar] [CrossRef]
- Ali, A.H.; Hassan, A.; Nasir, A.M. The relationship between trading volume, volatility and stock market returns: A test of mixed distribution hypothesis for a pre-and post crisis on Kuala Lumpur Stock Exchange. Invest. Manag. Financ. Innov. 2005, 2, 146–158. [Google Scholar]
- Yamak, N.; Yamak, R.; Samut, S. Causal relationship between bitcoin price volatility and trading volume: Rolling window approach. Financ. Stud. 2019, 23, 6–20. [Google Scholar]
- Guizani, S.; Nafti, I.K. The Determinants of Bitcoin Price Volatility: An Investigation with ARDL Model. Procedia Comput. Sci. 2019, 164, 233–238. [Google Scholar] [CrossRef]
- Luque, B.; Lacasa, L.; Ballesteros, F.; Luque, J. Horizontal visibility graphs: Exact results for random time series. Phys. Rev. E 2009, 80, 046103. [Google Scholar] [CrossRef] [PubMed] [Green Version]
- Liu, K.; Weng, T.; Gu, C.; Yang, H. Visibility graph analysis of Bitcoin price series. Phys. A Stat. Mech. Its Appl. 2020, 538, 122952. [Google Scholar] [CrossRef]
- Alstott, J.; Bullmore, E.; Plenz, D. Powerlaw: A Python Package for Analysis of Heavy-Tailed Distributions. PLoS ONE 2014, 9, e85777. [Google Scholar] [CrossRef] [Green Version]
- Andina, D.; Partida, A. IT Security Management: IT Securiteers—Setting Up an IT Security Function; Lecture Notes in Electrical Engineering; Springer: Berlin/Heidelberg, Germany, 2010. [Google Scholar]
- IOTA Blockchain Explorer. Available online: https://explorer.iota.org/mainnet (accessed on 30 July 2021).
- IoTeX Blockchain Explorer. Available online: https://iotexscan.io/ (accessed on 29 July 2021).
- Investing.com IOTA Index (IOT/USD). IOT Crypto Coin Market Value. Available online: https://www.investing.com/indices/investing.com-iota-usd-historical-data (accessed on 24 July 2021).
- Investing.com IoTeX Index (IOTX/USD). IoTeX Crypto Coin Market Value. Available online: https://www.investing.com/indices/investing.com-iotx-usd-historical-data (accessed on 24 July 2021).
- Visibility-Graph 0.4.1 by Rodrigo Garcia. 2 February 2021. Available online: https://pypi.org/project/visibility-graph/ (accessed on 29 July 2021).
- Visibility_Algorithms.py by Delia Fano Yela. December 2018. Available online: https://github.com/delialia/bst/blob/master/visibility_algorithms.py (accessed on 29 July 2021).
- Networkx 2.6.2. Network Analysis in Python. Last Release in 2021. Available online: https://networkx.org/ (accessed on 30 July 2021).
- Metaknowledge 3.4.1. Computational Research in Network Analysis. NetLab. University of Waterloo. 2020. Available online: https://pypi.org/project/metaknowledge/ (accessed on 30 July 2021).
- Scipy.Optimize.Curve_Fit. Available online: https://docs.scipy.org/doc/scipy/reference/generated/scipy.optimize.curve_fit.html (accessed on 29 July 2021).
- Community API. This Package Implements Community Detection. Package Name Is Community but Refer to Python-Louvain on Pypi. 2008. Available online: https://python-louvain.readthedocs.io/en/latest/api.html (accessed on 29 July 2021).
- Cylouvain: Cython Louvain. Cylouvain is a Python Module that Provides a Fast Implementation of the Classic Louvain Algorithm for Node Clustering in Graph. 2018. Available online: https://github.com/ahollocou/cylouvain (accessed on 29 July 2021).
- Que, X.; Checconi, F.; Petrini, F.; Gunnels, J.A. Scalable community detection with the Louvain algorithm. In Proceedings of the 2015 IEEE International Parallel and Distributed Processing Symposium, Hyderabad, India, 25–29 May 2015; pp. 28–37. [Google Scholar]
- IOTA Tangle Explorer. Available online: https://thetangle.org/ (accessed on 30 July 2021).
- Coinmarketcap. Cryptocurrencies Market Capitalisation in Real Time. Available online: https://coinmarketcap.com/all/views/all/ (accessed on 31 July 2021).
Figure 1.
Daily price volatility data for IOTA and IoTeX. Subplots (a,b) display the daily volatility time series for IOTA and IoTeX, respectively. Subplots (c,d) display their components: highest and lowest prices in USD per day for IOTA and IoTeX.
Figure 1.
Daily price volatility data for IOTA and IoTeX. Subplots (a,b) display the daily volatility time series for IOTA and IoTeX, respectively. Subplots (c,d) display their components: highest and lowest prices in USD per day for IOTA and IoTeX.

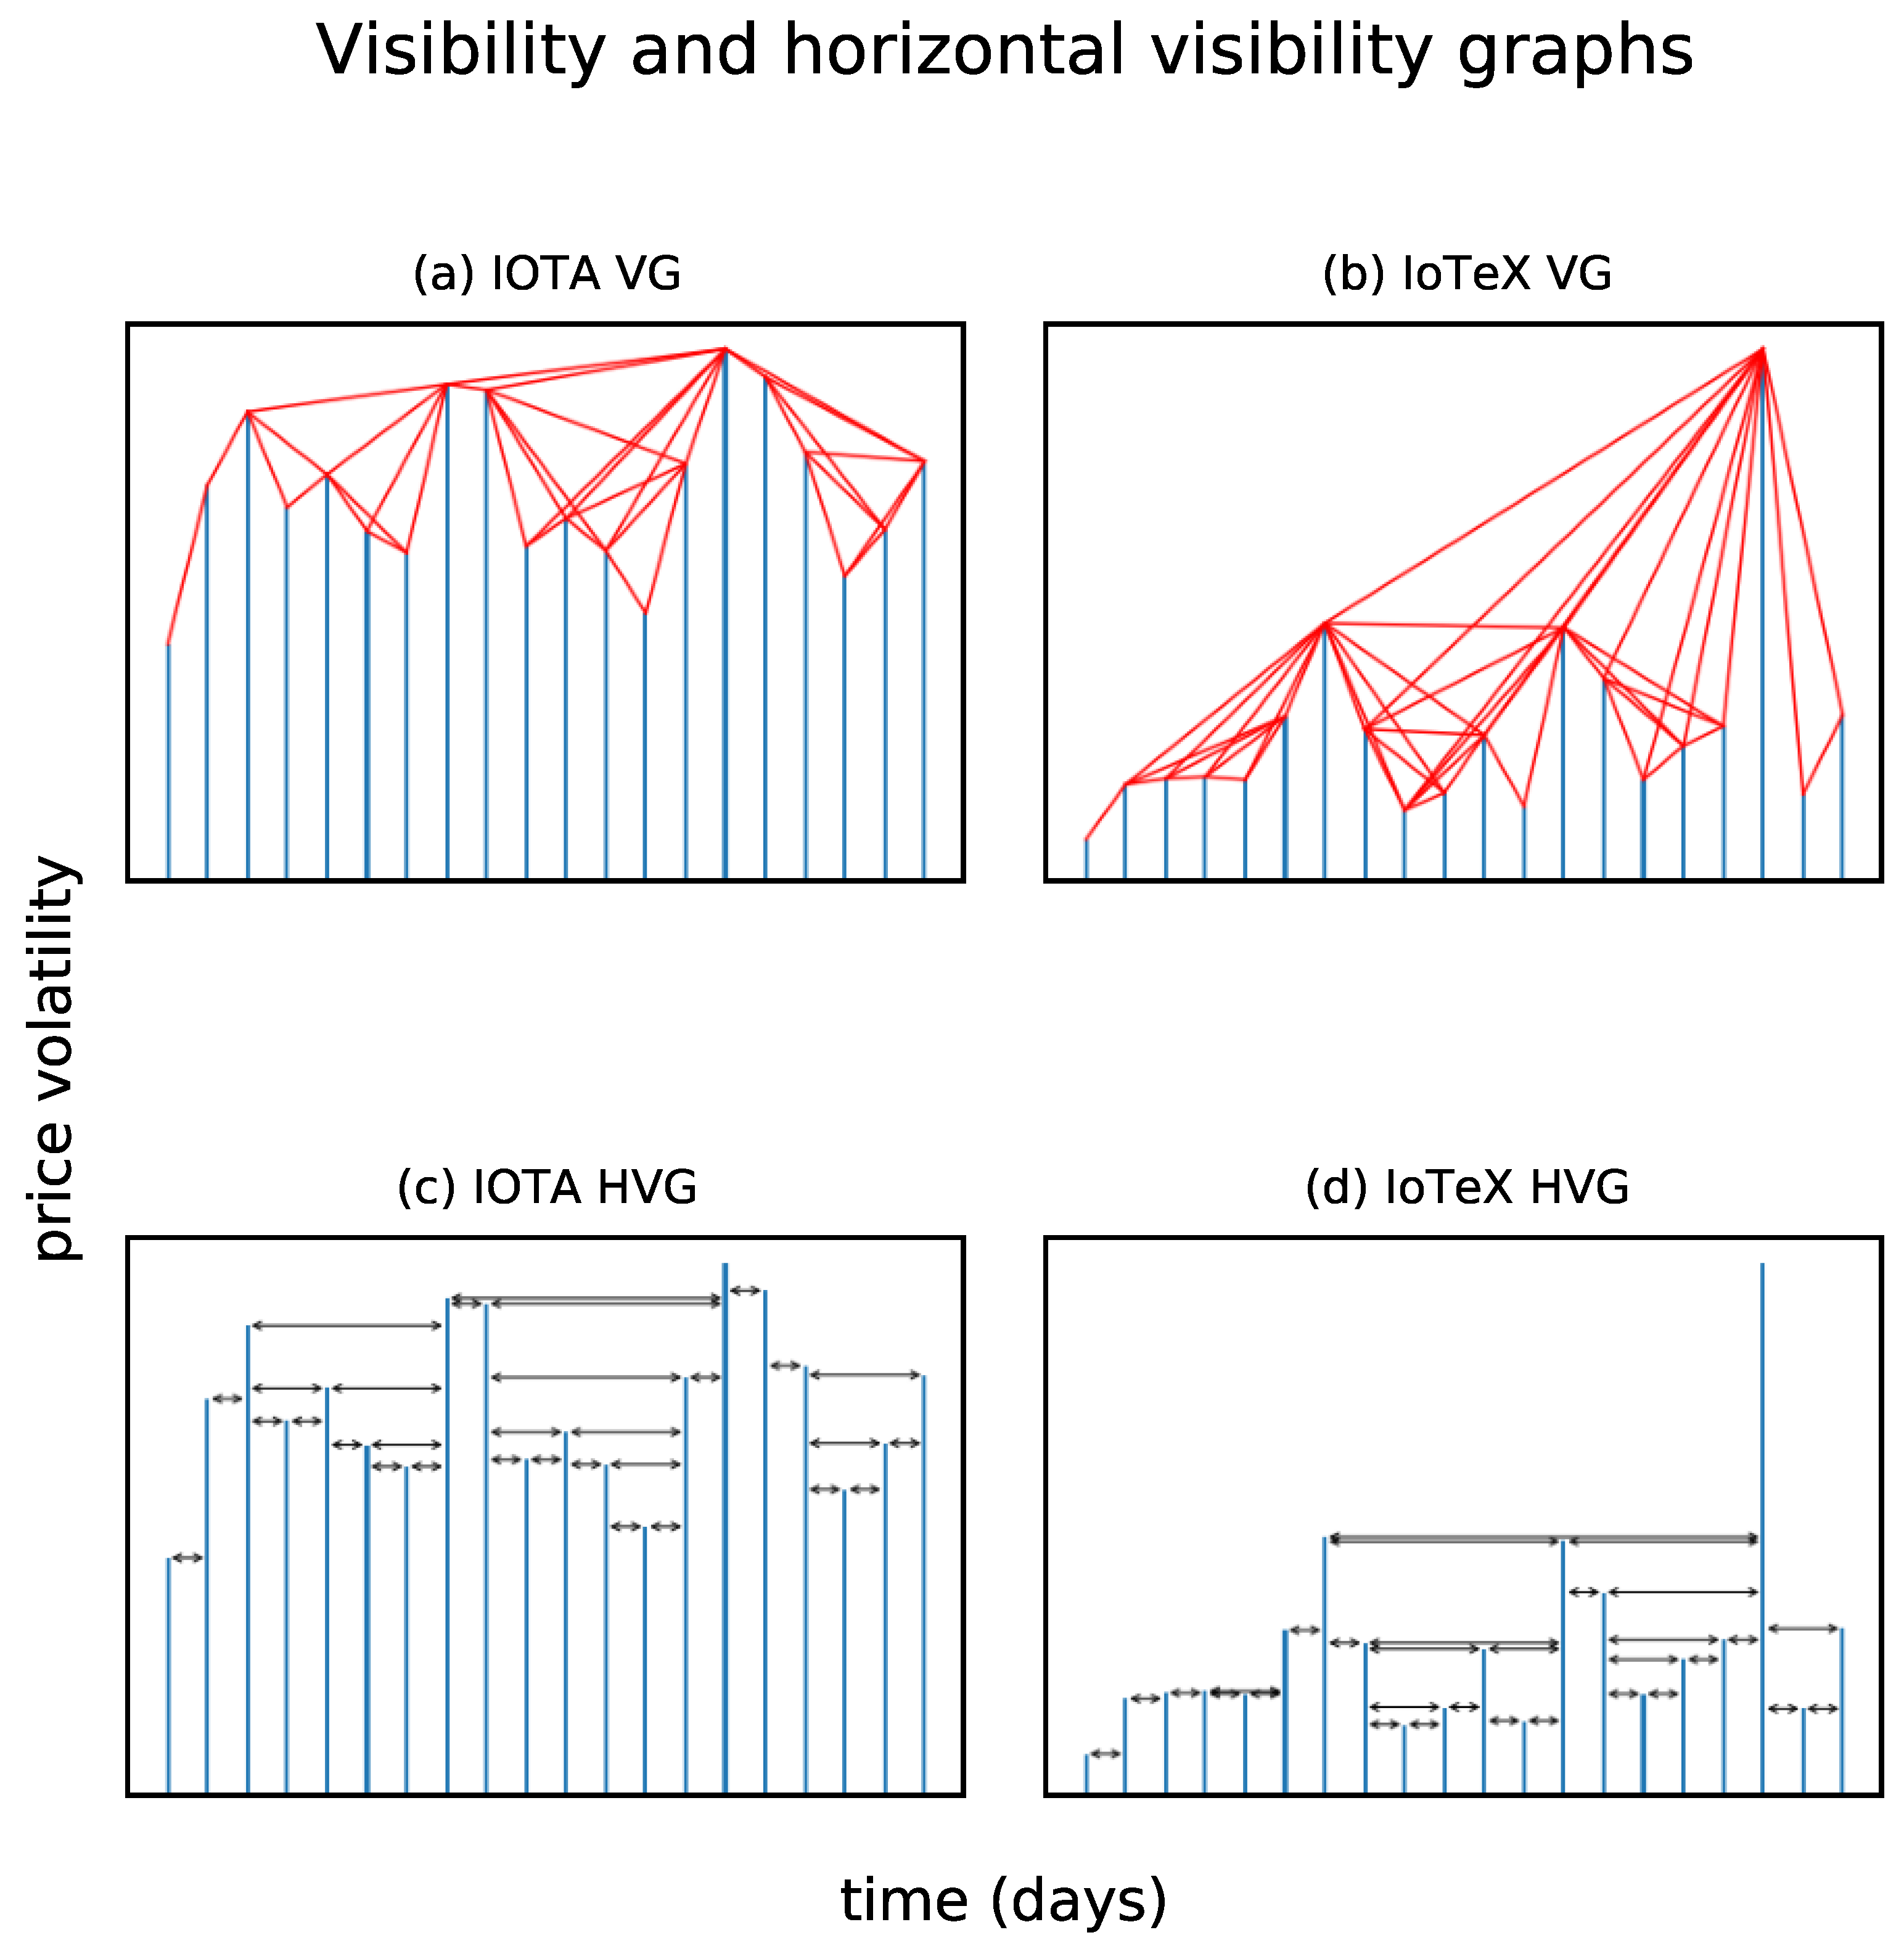
Figure 2.
Visibility and horizontal visibility graphs for IOTA and IoTeX price volatility. Subplots (a,b) display the visibility graph derived from the daily volatility time series for IOTA and IoTeX, respectively (last 20 days of the dataset). Subplots (c,d) display the horizontal visibility graph derived from the daily volatility time series for IOTA and IoTeX, respectively (last 20 days of the dataset). The depiction of these graphs is the outcome of our own Python code.

Figure 3.
Number of nodes for each degree in the networks stemming from the visibility and horizontal visibility graphs for IOTA and IoTeX price volatility. Subplots (a,b) display the degree of the network stemming from the visibility graph and the best power law fit that the function curve_fit provides together with the corresponding best and . Subplots (c,d) display the degree of the network stemming from the horizontal visibility graph and the best power law fit that the function curve_fit provides and the corresponding best and .

Figure 4.
Both empirical and fit probability density functions (PDF) and complementary cumulative distribution functions (CCDF) using the powerlaw module by Alstott et al. [55].
Figure 4.
Both empirical and fit probability density functions (PDF) and complementary cumulative distribution functions (CCDF) using the powerlaw module by Alstott et al. [55].

Figure 5.
Best power law fit using curve_fit with the average of clustering coefficients per degree for (a) IOTA VG, (b) IoTeX VG, (c) IOTA HVG and (d) IoTeX HVG.
Figure 5.
Best power law fit using curve_fit with the average of clustering coefficients per degree for (a) IOTA VG, (b) IoTeX VG, (c) IOTA HVG and (d) IoTeX HVG.

Figure 6.
Communities identified by the networkx module community API in (a) IOTA VG, (b) IoTeX VG, (c) IOTA HVG and (d) IoTeX HVG throughout the timeline in network graph format.
Figure 6.
Communities identified by the networkx module community API in (a) IOTA VG, (b) IoTeX VG, (c) IOTA HVG and (d) IoTeX HVG throughout the timeline in network graph format.

Figure 7.
Communities identified by the networkx module community API in IOTA, (a,c), and IoTeX, (b,d). Graphs (a,b) use a coloured-coded continuous line and graphs (c,d) a coloured-coded scattered plot.
Figure 7.
Communities identified by the networkx module community API in IOTA, (a,c), and IoTeX, (b,d). Graphs (a,b) use a coloured-coded continuous line and graphs (c,d) a coloured-coded scattered plot.

Figure 8.
Infographic summary of “Visibility graph analysis of IOTA and IoTeX price series: An intentional risk-based strategy to use 5G for IoT”.
Figure 8.
Infographic summary of “Visibility graph analysis of IOTA and IoTeX price series: An intentional risk-based strategy to use 5G for IoT”.


Table 1.
Mobile networks history in generations.
| Generation | Tx Speed | Technology | Period | Details |
|---|---|---|---|---|
| 1 | 14.4 kbps | Analog Tx | 1970–1990 | Voice only |
| 2 | up to 14.4 kbps | CDMA/TDMA | 1990–2000 | Digital Tx, SMS, GSM Standard |
| 2.5 | 20–170 kbps | GPRS | 2000–2003 | First basic Internet browsing |
| 2.75 | up to 236 kbps | EDGE | 2003 | ×3 GSM data capacity |
| 3 | 144 kbps–3 Mbps | UMTS, CDMA2000 | 2004–2005 | First streamings |
| 3.5 | 1–10 Mbps | HSPA | 2006–2010 | Higher speed over UMTS |
| 4 | 144 kbps–100 Mbps | LTE | 2010–2020 | First streamings |
| 5 | 1 Gbps | 3GPP Standards | 2021– | Starting deployment |
Table 2.
Technologies used in 5G mobile networks.
| Name | Acronym | Function |
|---|---|---|
| Network Slicing | NS | Virtual networks in parallel to answer different speed and latency requirements. |
| Software-Defined Networking | SDN | Centralised programmatical network configuration. It decouples forwarding and routing. |
| Multi-Access Edge Computing | MEC | Cloud computing at the network edge to tap into data with local access conditions. |
| Network Function Virtualisation | NFV | Router as SW in off-the-shelf hardware. Key for Network Slicing. |
| Millimeter Wave communications | mmWC | Higher data rates than microwaves. Key for bandwidth increase. |
| Massive MIMO | MIMO | Wireless access technology. Multiple Input Multiple Output enabled by mmWaves. |
| Device to device connectivity | D2D | User equipment (UE) communicates with UE. It leads to micro clouds in base stations. |
Table 3.
IOTA and IoTeX.
| IOTA | IoTeX | |
|---|---|---|
| Start year | 2015 | 2017 |
| Distributed | Yes | Yes |
| Ledger type | DAG | Blockchain |
| Public | Yes | Yes |
| Permissionless | Yes | Yes |
| Multiblockchain | No | Yes |
| Fees | No | Low |
Table 4.
Correspondence between time series and complex networks.
| Time Series Type | Complex Network Type |
|---|---|
| Periodic | Regular |
| Random | Random (exponential degree function) |
| Fractal | Scale-free (power law degree function) |
Table 5.
Functions to study heavy-tailed distribution functions.
| Function | X Axis | Y Axis |
|---|---|---|
| Probability density function (PDF) | Variable x | Probability |
| Cumulative distribution function (CDF) | Variable x | Probability |
| Complementary cumulative distribution (CCDF) | Variable x | Probability |
Table 6.
Data points analysed in this study.
| Token | Data Items | Frequency | From | To | # Datapoints |
|---|---|---|---|---|---|
| IOTA | Highest and lowest price | Daily | 14 June 2017 | 15 July 2021 | 1493 |
| IoTeX | Highest and lowest price | Daily | 20 June 2018 | 15 July 2021 | 1122 |
Table 7.
Community searching Python modules.
| Module Name | Implemented Algorithm | IOTA Communities (VG and HVG) | IoTeX Communities (VG and HVG) |
|---|---|---|---|
| Community API | Louvain | 19 and 29 | 15 and 23 |
| Cylouvain | Louvain | 18 and 30 | 15 and 23 |
Table 8.
Summary of the methodology with steps, objectives and tools.
| Step | Main Objective | Tools Used |
|---|---|---|
| 1 | Download daily maximum and minimum prices from investing.com | web browser |
| 2 | Production of daily price volatility time series | logarithm |
| 3 | Creation of natural visibility graphs for IOTA and IoTeX | visibility_graph |
| 4 | Creation of horizontal visibility graphs for IOTA and IoTeX | visibility_algorithms |
| 5 | Basic characterisation of the 4 networks (VG and HVG in IOTA and IoTeX) | metaknowledge |
| 6 | Production of the degree functions for the 4 networks | networkx |
| 7 | Power law fit for degree functions | curve_fit |
| 8 | Power law fit for degree functions (as proposed by Alstott) | powerlaw |
| 9 | Average of clustering coefficients per degree (as in [54]) | networkx |
| 10 | Power law fit for average clustering (as in [54]) | curve_fit |
| 11 | Identification of communities | community_api |
| 12 | Link with dynamic risk (as defined by [46]) | literature review |
| 13 | Strategy to use 5G for IoT | literature review |
Table 9.
Initial description of the visibility graph-based networks.
| Network | Nodes | Edges | Isolates | Self Loops | Density | Transitivity |
|---|---|---|---|---|---|---|
| IOTA VG | 1493 | 5715 | 0 | 0 | 0.005 | 0.300 |
| IoTeX VG | 1122 | 4472 | 0 | 0 | 0.007 | 0.312 |
| IOTA HVG | 1493 | 2969 | 0 | 0 | 0.003 | 0.344 |
| IoTeX HVG | 1122 | 2225 | 0 | 0 | 0.004 | 0.354 |
Publisher’s Note: MDPI stays neutral with regard to jurisdictional claims in published maps and institutional affiliations. |
© 2021 by the authors. Licensee MDPI, Basel, Switzerland. This article is an open access article distributed under the terms and conditions of the Creative Commons Attribution (CC BY) license (https://creativecommons.org/licenses/by/4.0/).
Share and Cite
MDPI and ACS Style
Partida, A.; Criado, R.; Romance, M. Visibility Graph Analysis of IOTA and IoTeX Price Series: An Intentional Risk-Based Strategy to Use 5G for IoT. Electronics 2021, 10, 2282. https://doi.org/10.3390/electronics10182282
AMA Style
Partida A, Criado R, Romance M. Visibility Graph Analysis of IOTA and IoTeX Price Series: An Intentional Risk-Based Strategy to Use 5G for IoT. Electronics. 2021; 10(18):2282. https://doi.org/10.3390/electronics10182282
Chicago/Turabian StylePartida, Alberto, Regino Criado, and Miguel Romance. 2021. "Visibility Graph Analysis of IOTA and IoTeX Price Series: An Intentional Risk-Based Strategy to Use 5G for IoT" Electronics 10, no. 18: 2282. https://doi.org/10.3390/electronics10182282
Note that from the first issue of 2016, this journal uses article numbers instead of page numbers. See further details here.