Power Quality Assessment of Grid-Connected PV System in Compliance with the Recent Integration Requirements


Abstract
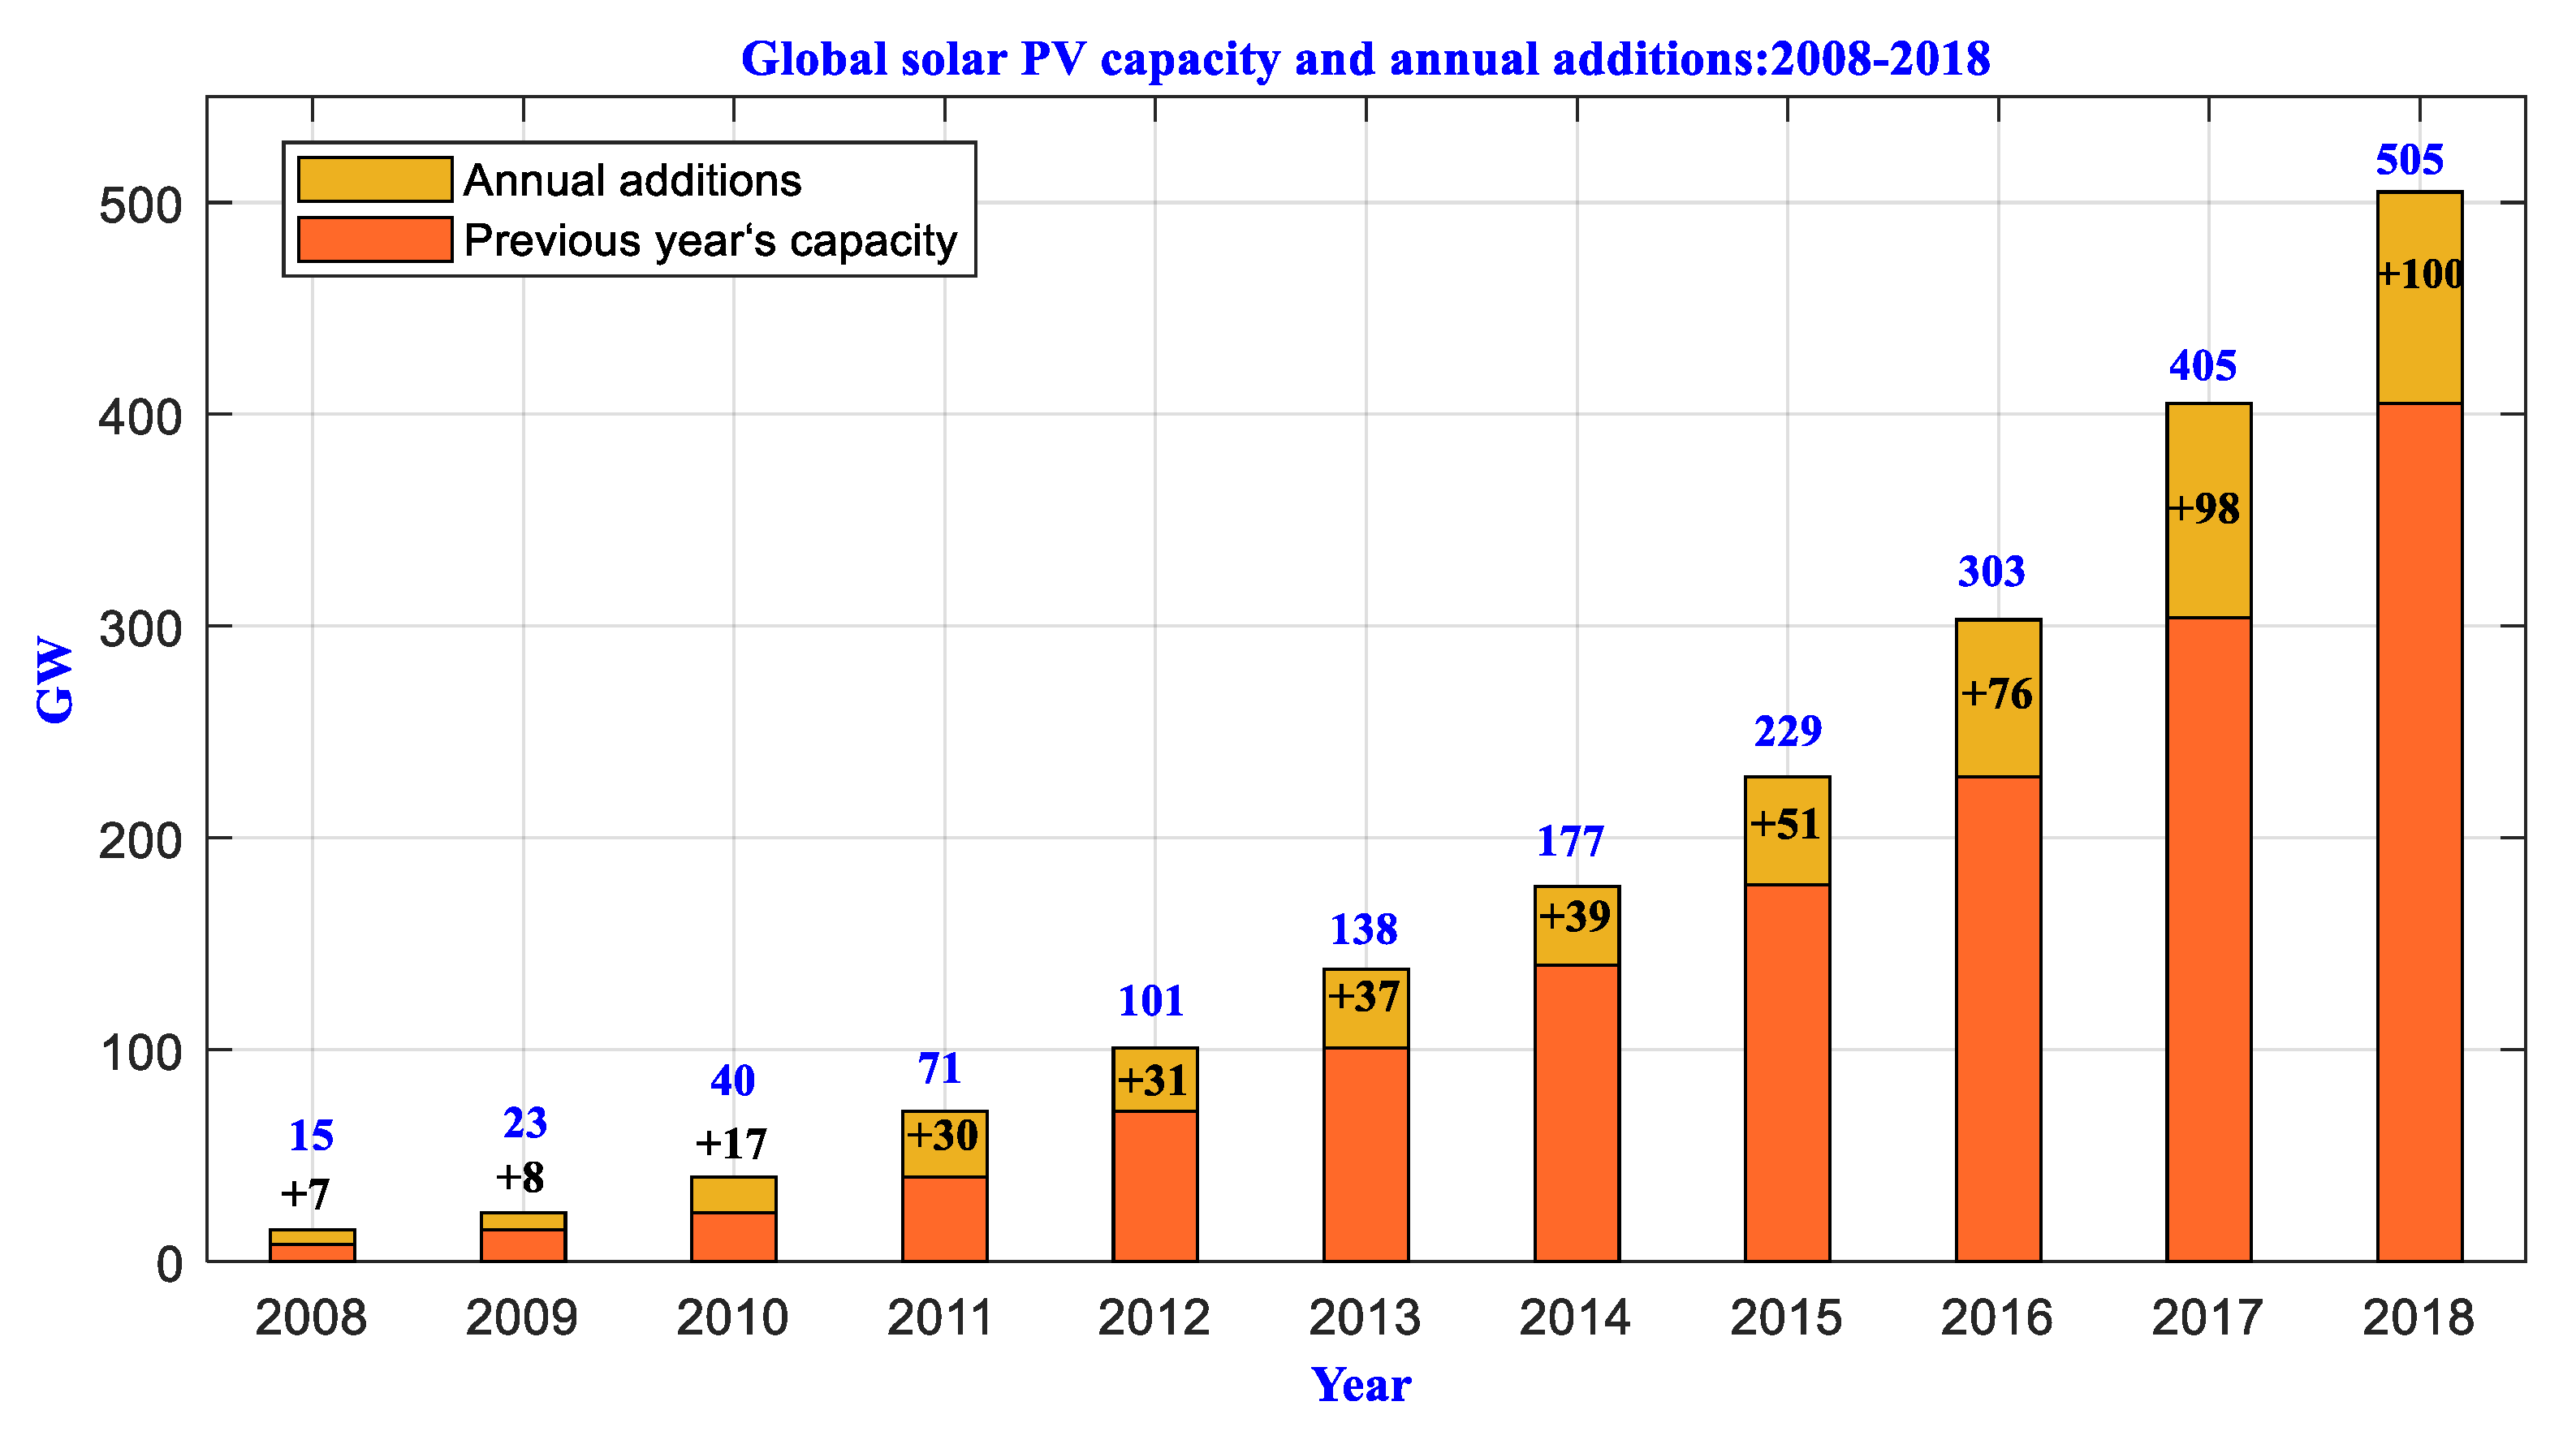
:1. Introduction
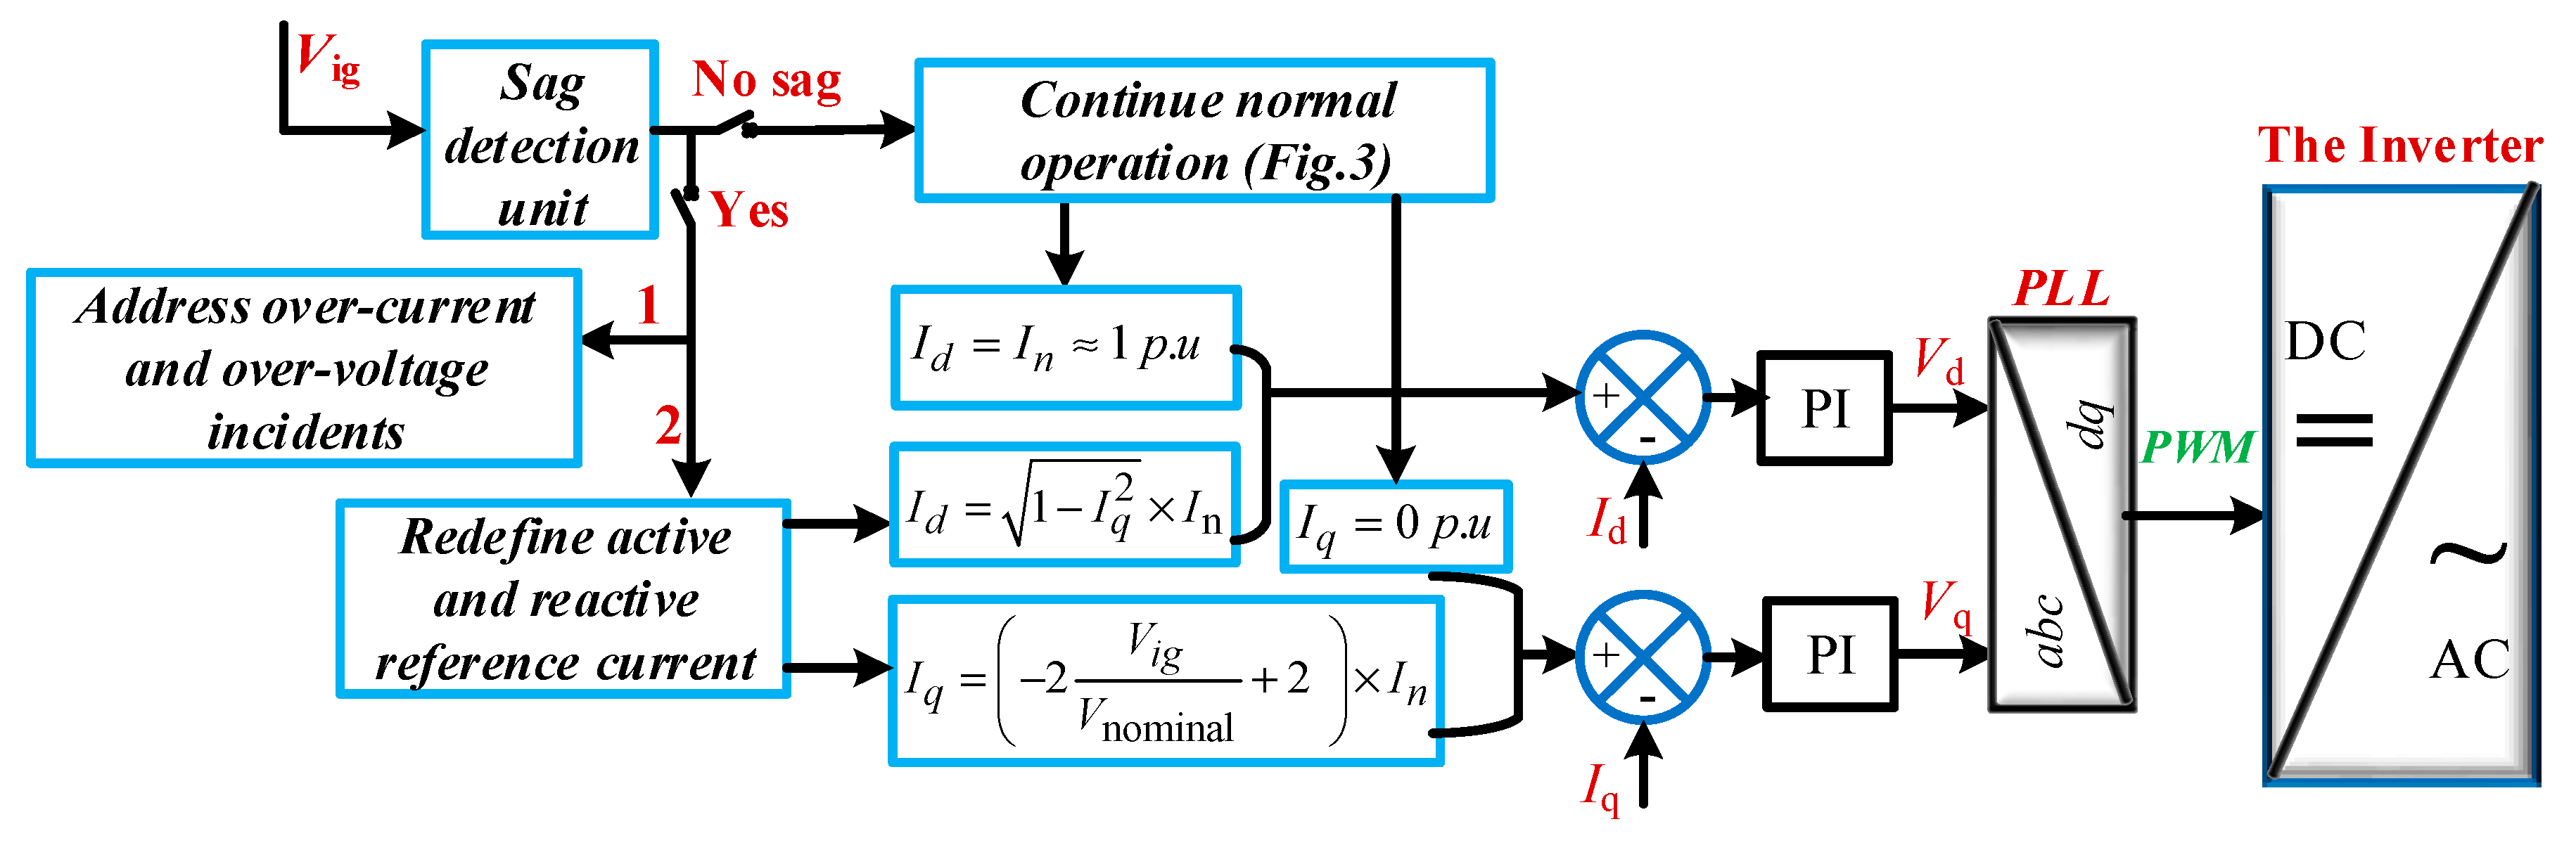
- A comprehensive control strategy that enables the PVPP to withstand grid faults, allow the inverter remains connected, continuously produce electricity, and absorb excessive energy whilst injecting the required reactive power to meet the LVRT requirements and overcoming sag event. This controller can inject active and reactive current during the fault without any extra hardware in compare to STATCOM, SVC, or energy storage system (ESS), which means less complexity and lower cost.
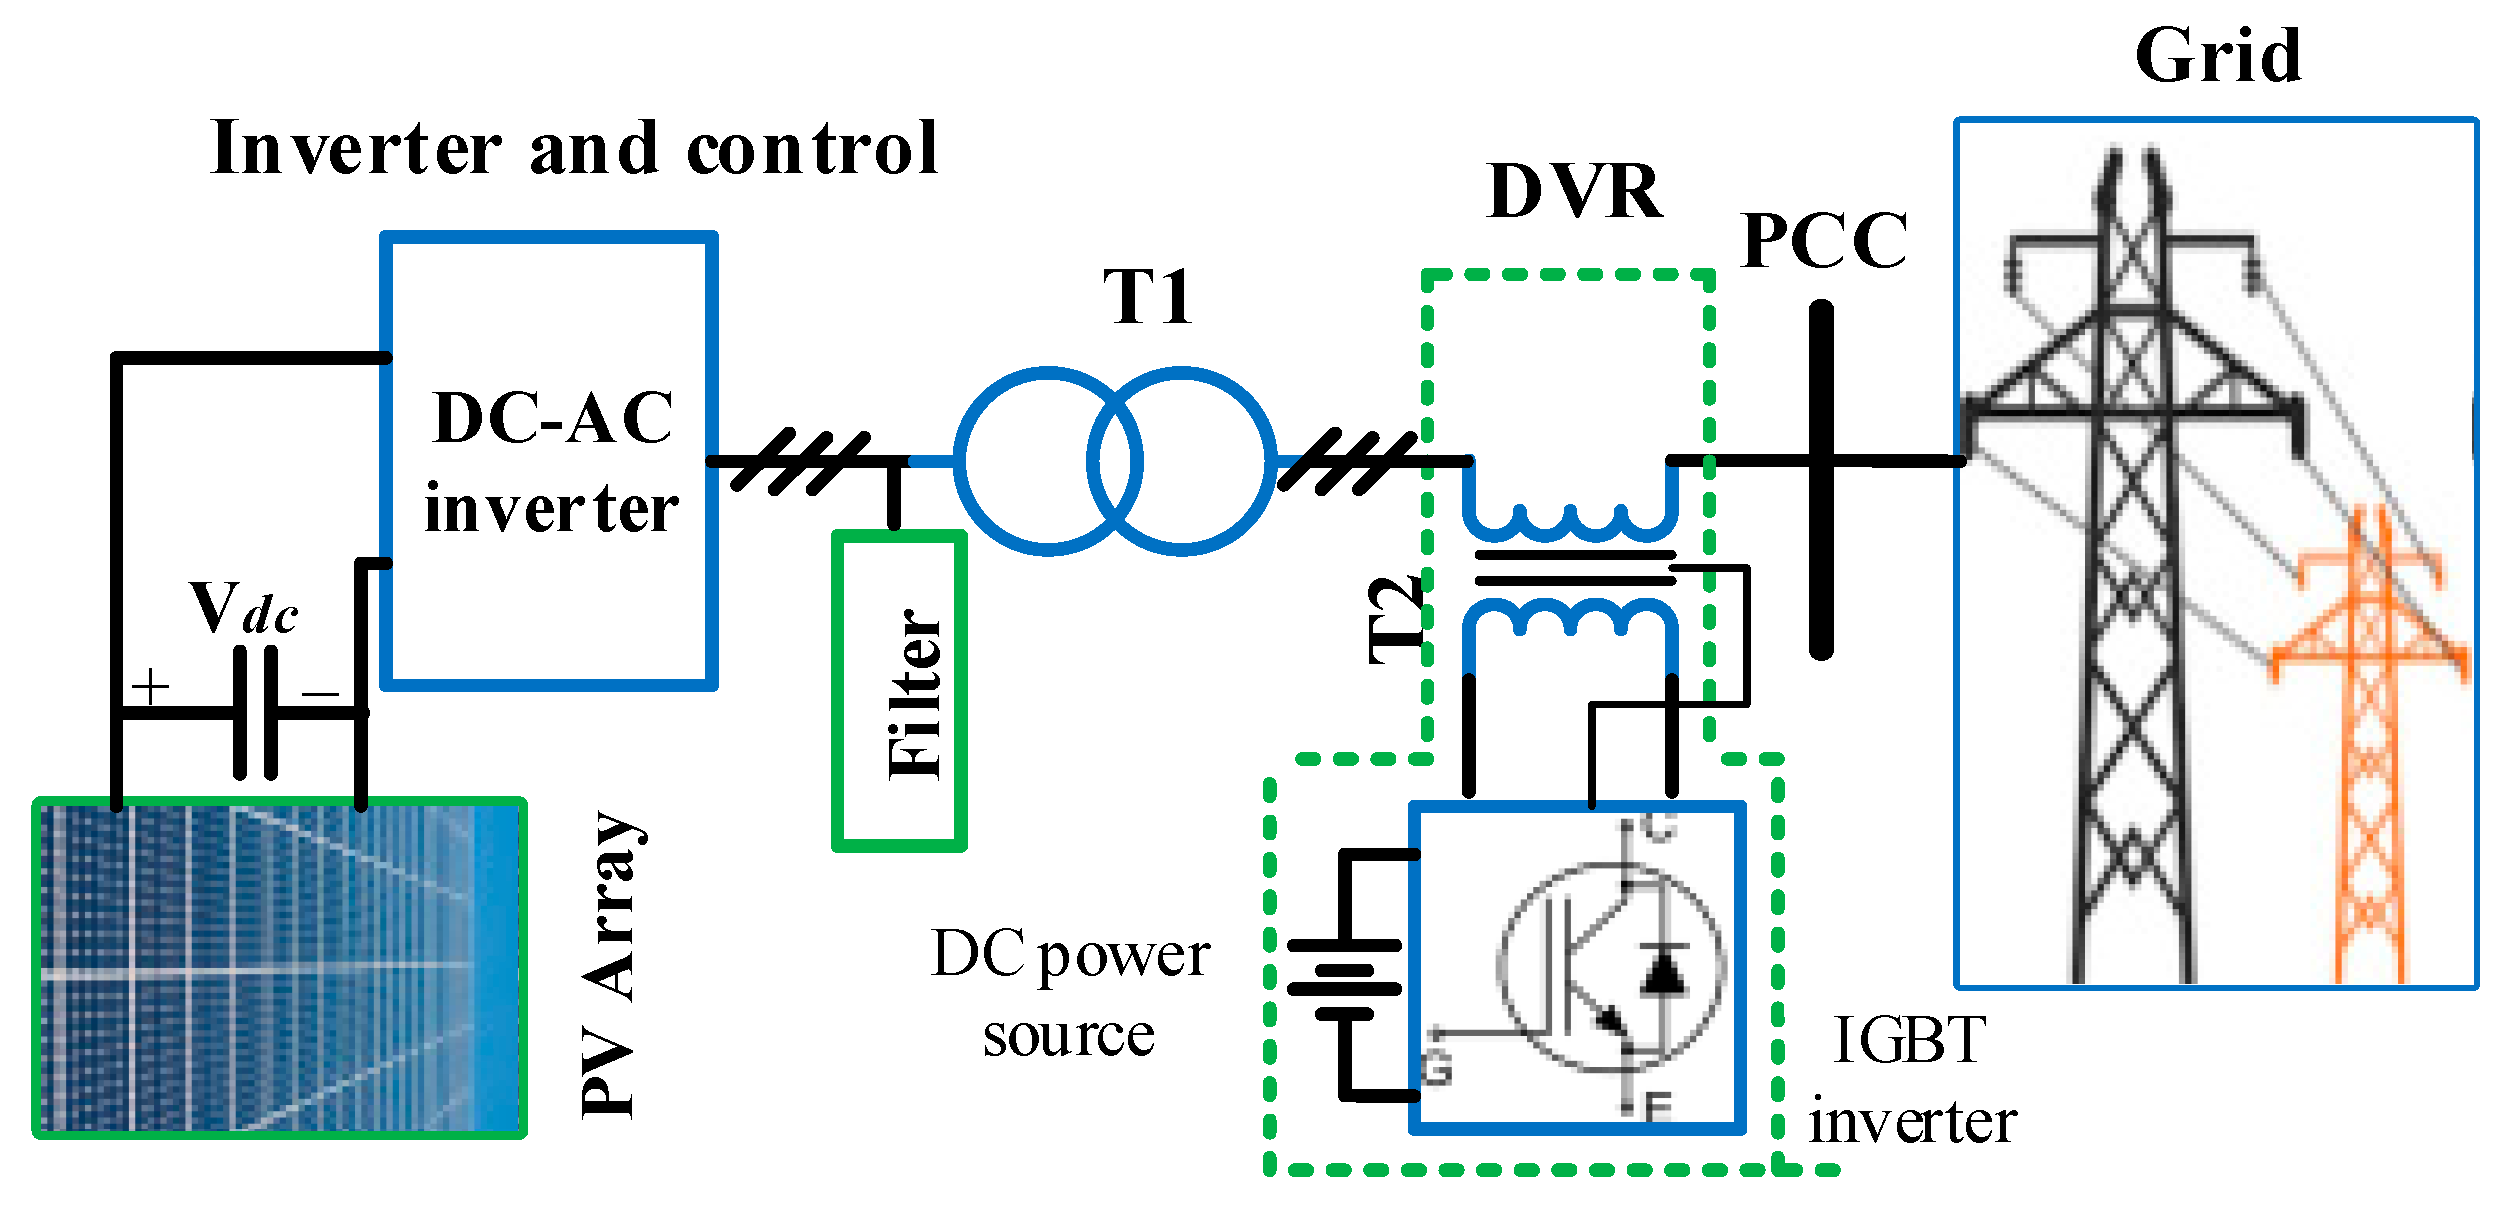
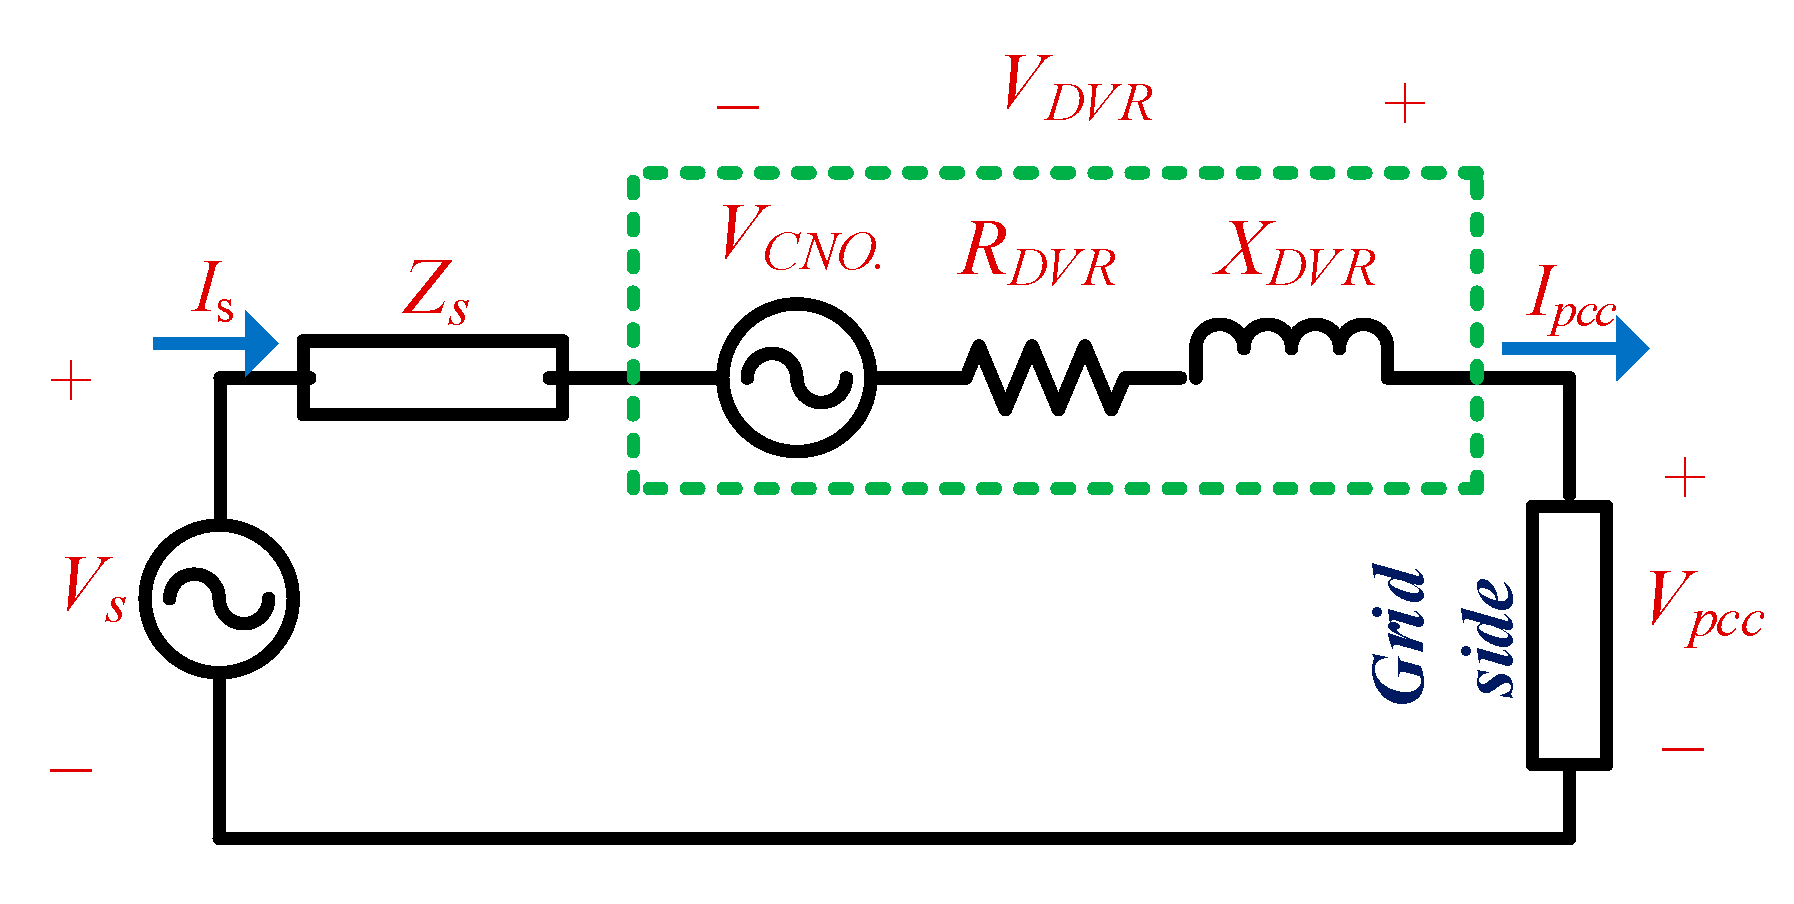
- An advanced dynamic voltage regulator (DVR) control system to reduce the voltage fluctuation, flicker, and unbalance into the required limits efficiently. The main feature of the proposed controller to address the flicker incident is injecting voltages in sequence into the power line at PCC using DVR three-phase voltage source inverter. A fast and precise detection method based on the voltage phage angle in a balanced situation is proposed to detect the unbalance so that it can overcome the balance incident based on mathematical modeling is developed.
- An efficient RLC filter to reduce the voltage and current harmonics under the specified limits at the increased switching frequency is developed.
2. The Recent PV Integration Requirements
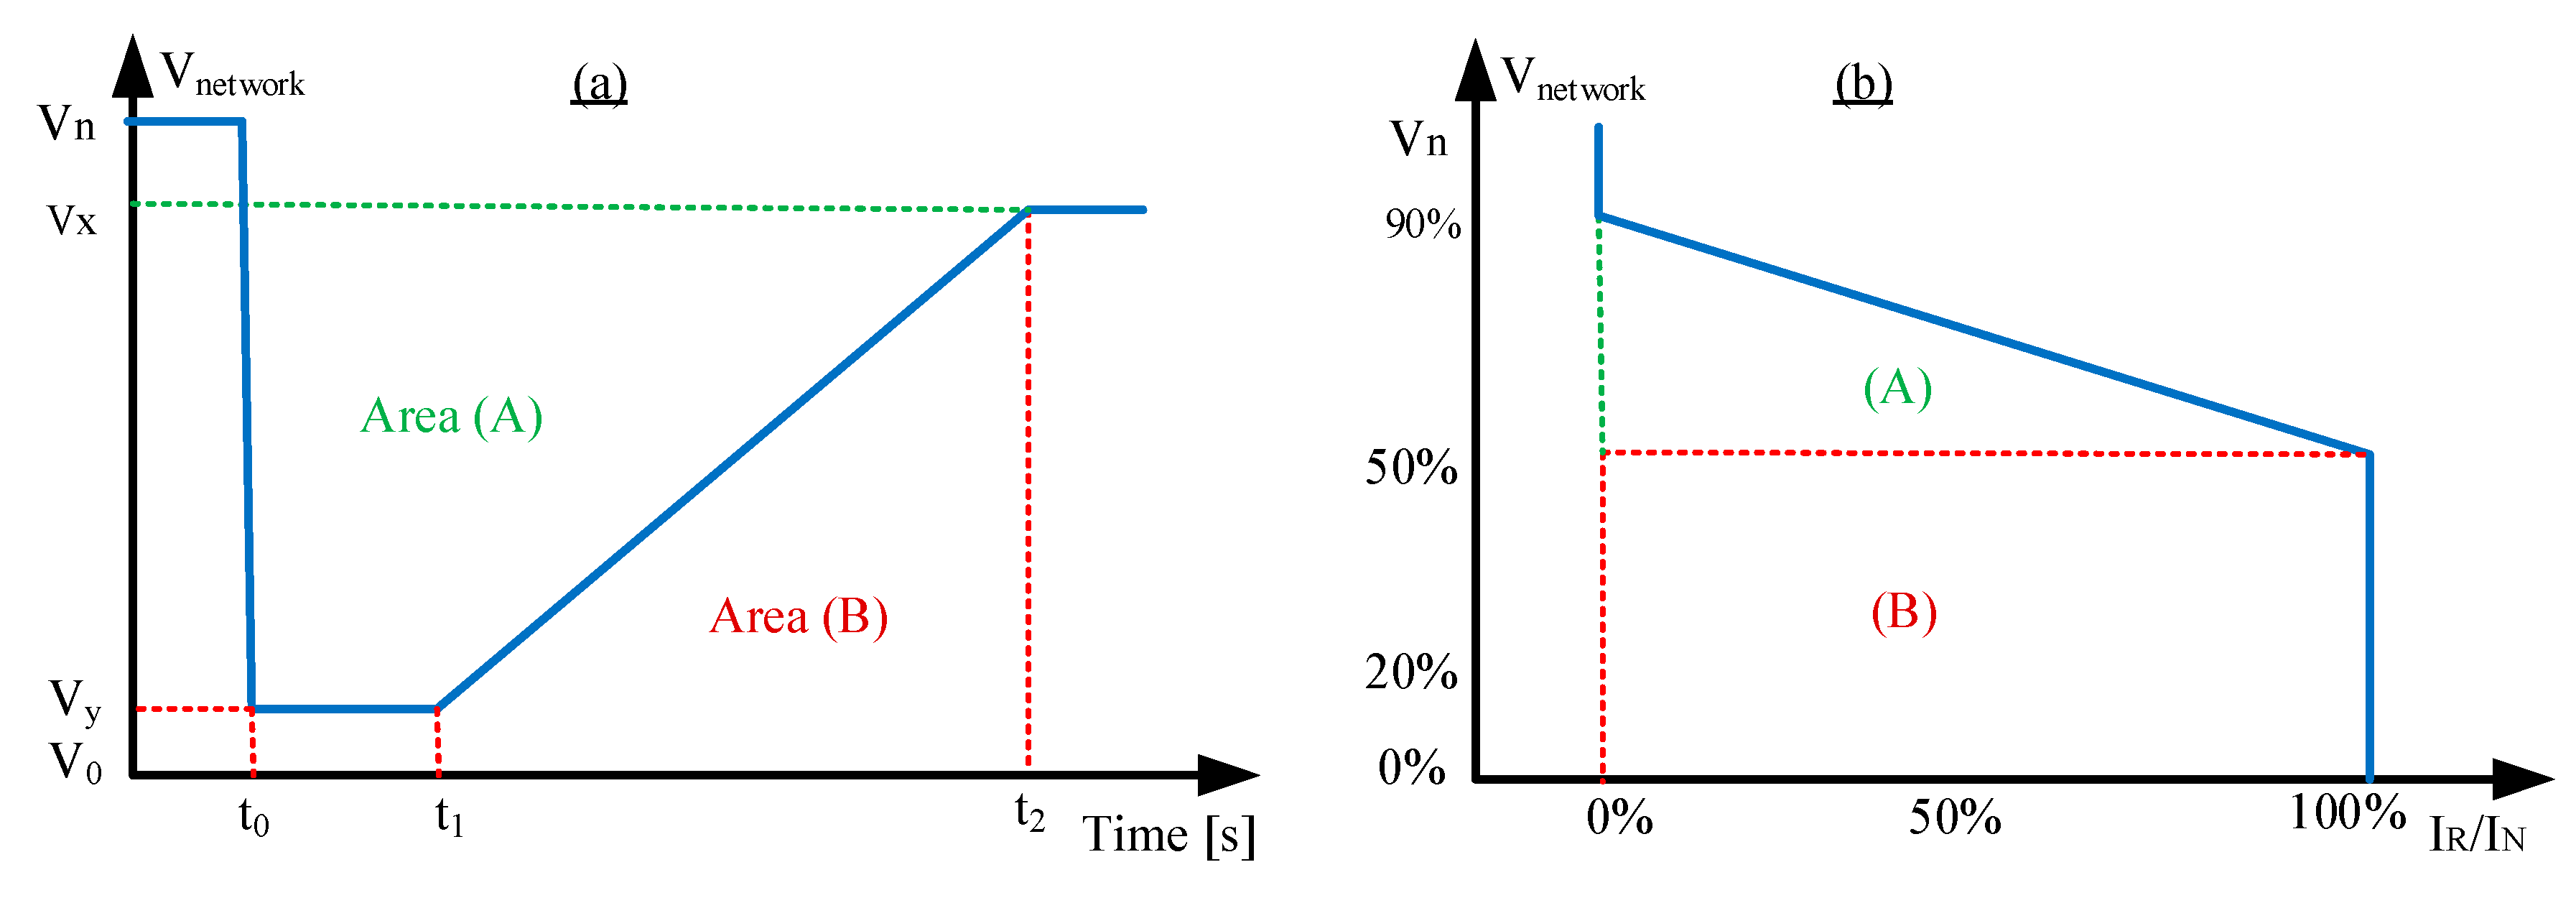
2.1. LVRT Capability Requirement toward Voltage Sag Mitigation
2.2. Voltage Flicker Requirements
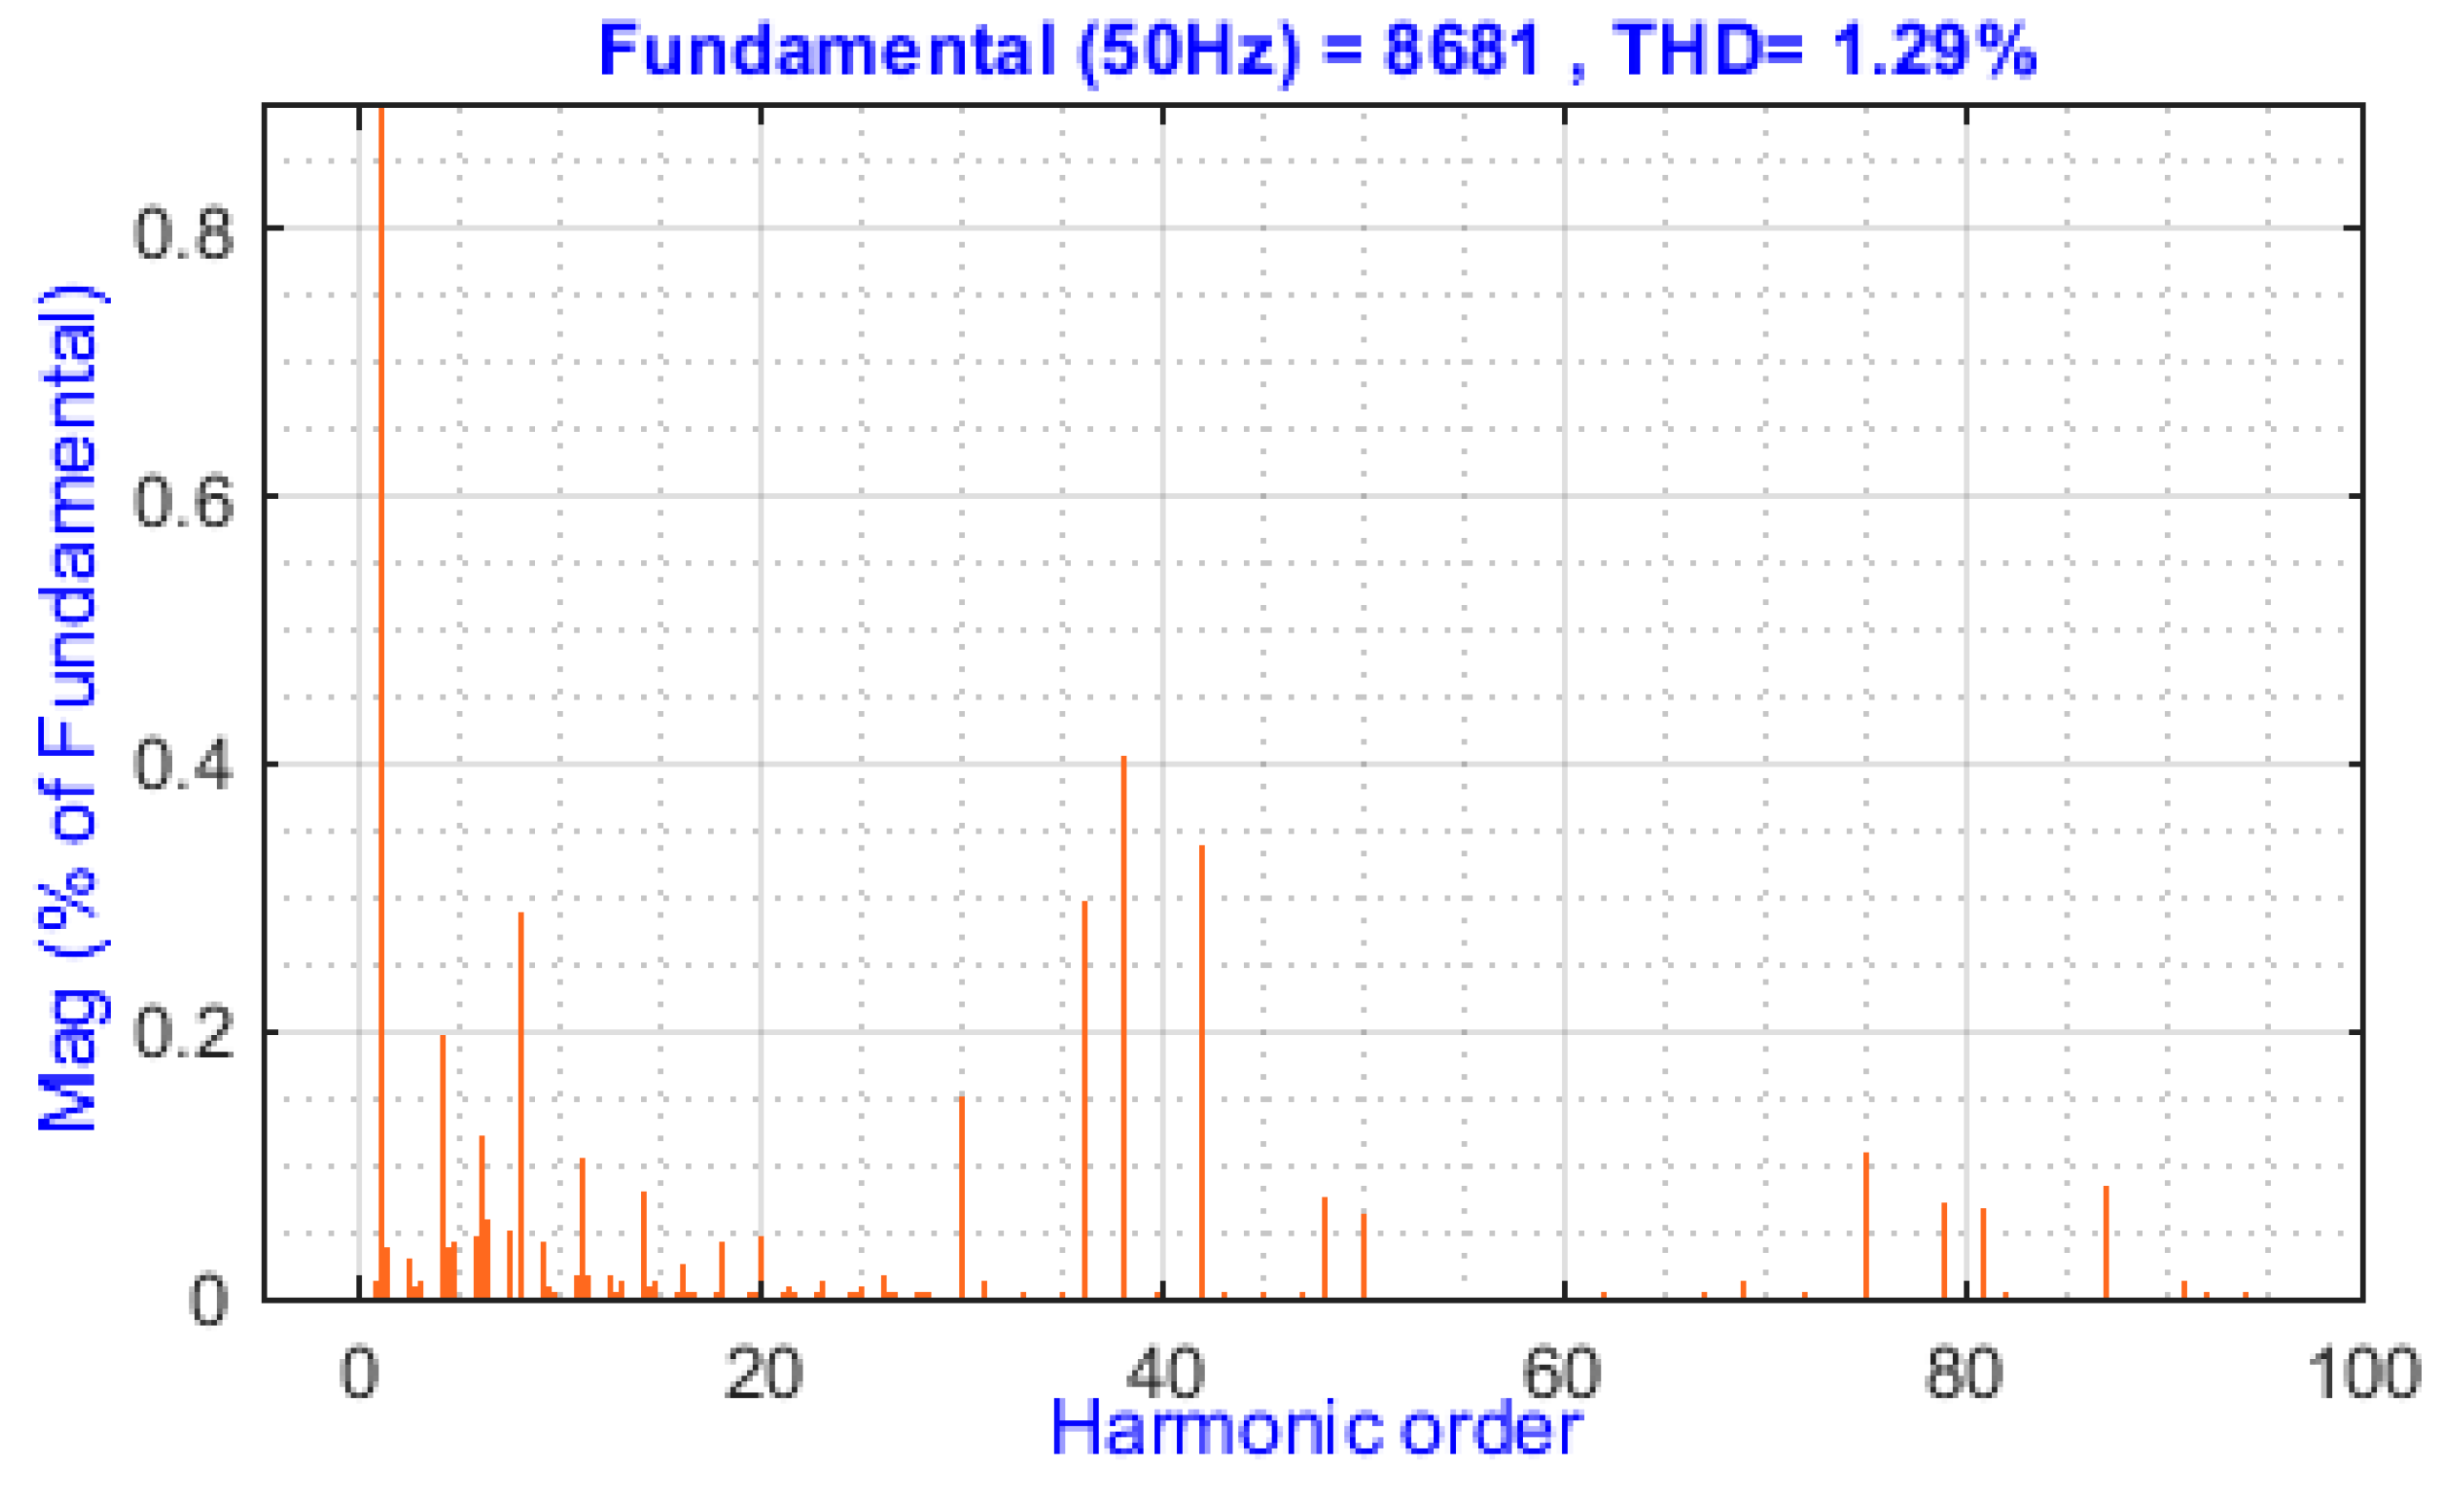
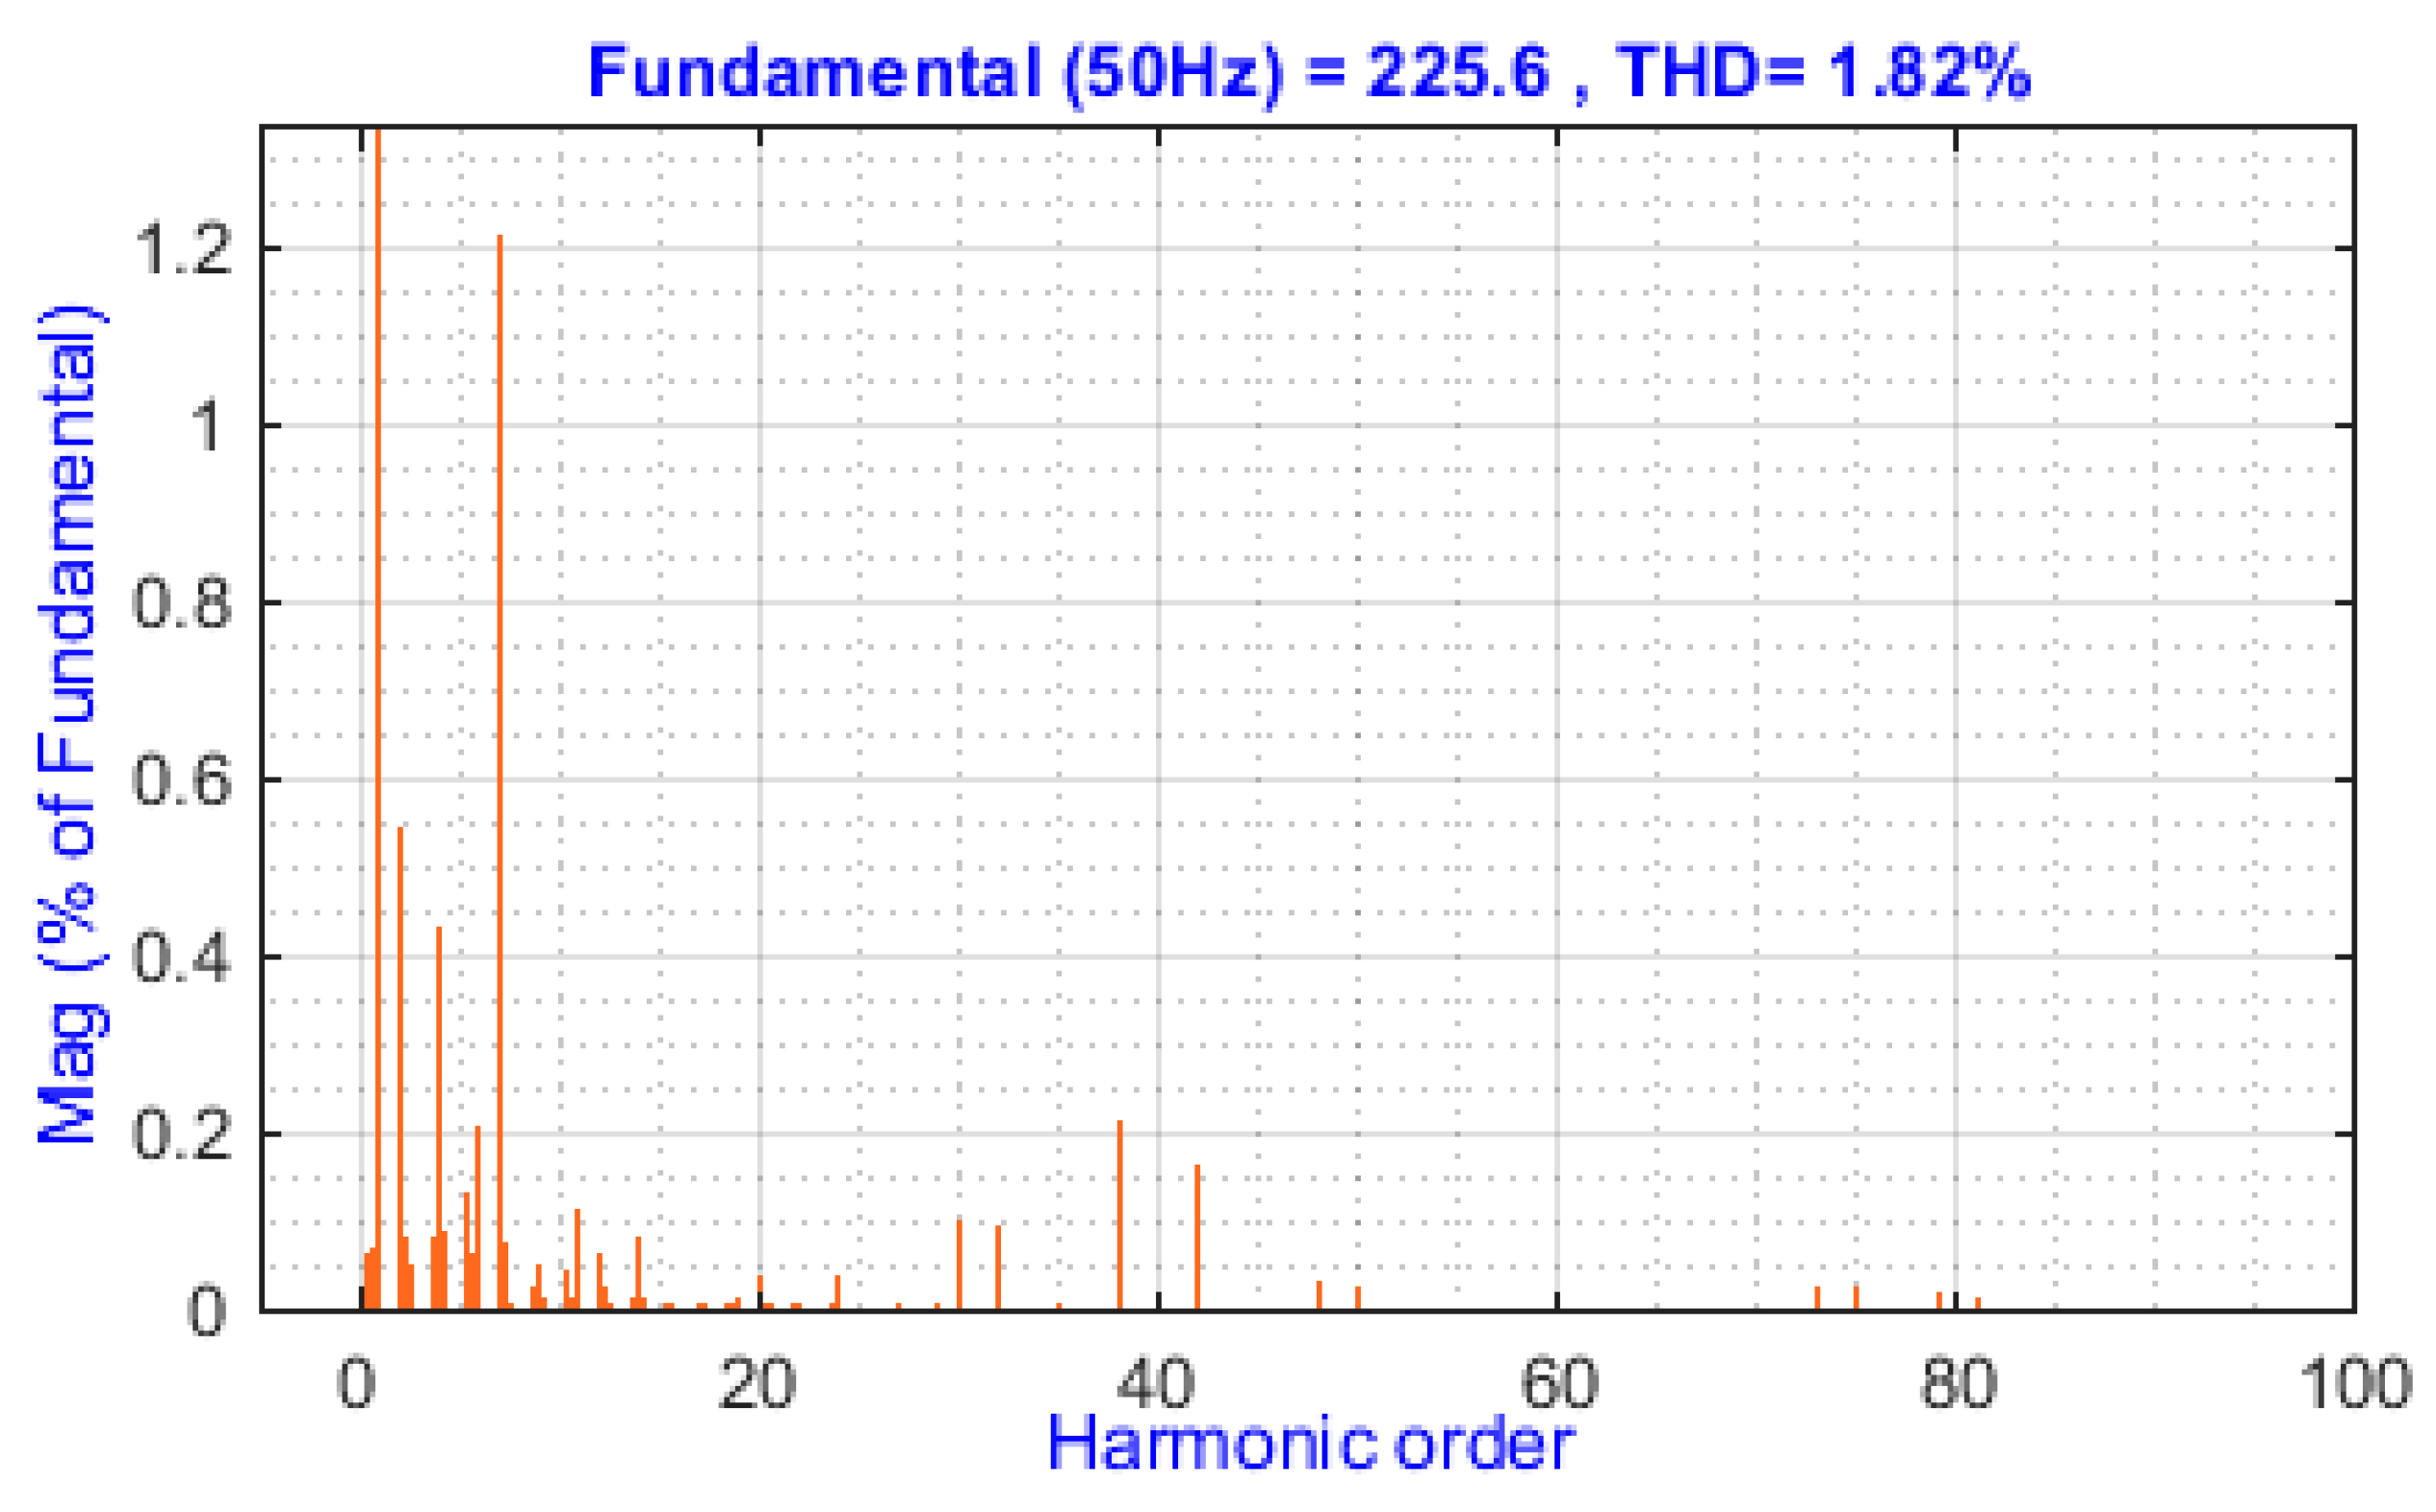
2.3. Requirements of PV Harmonics Distortion
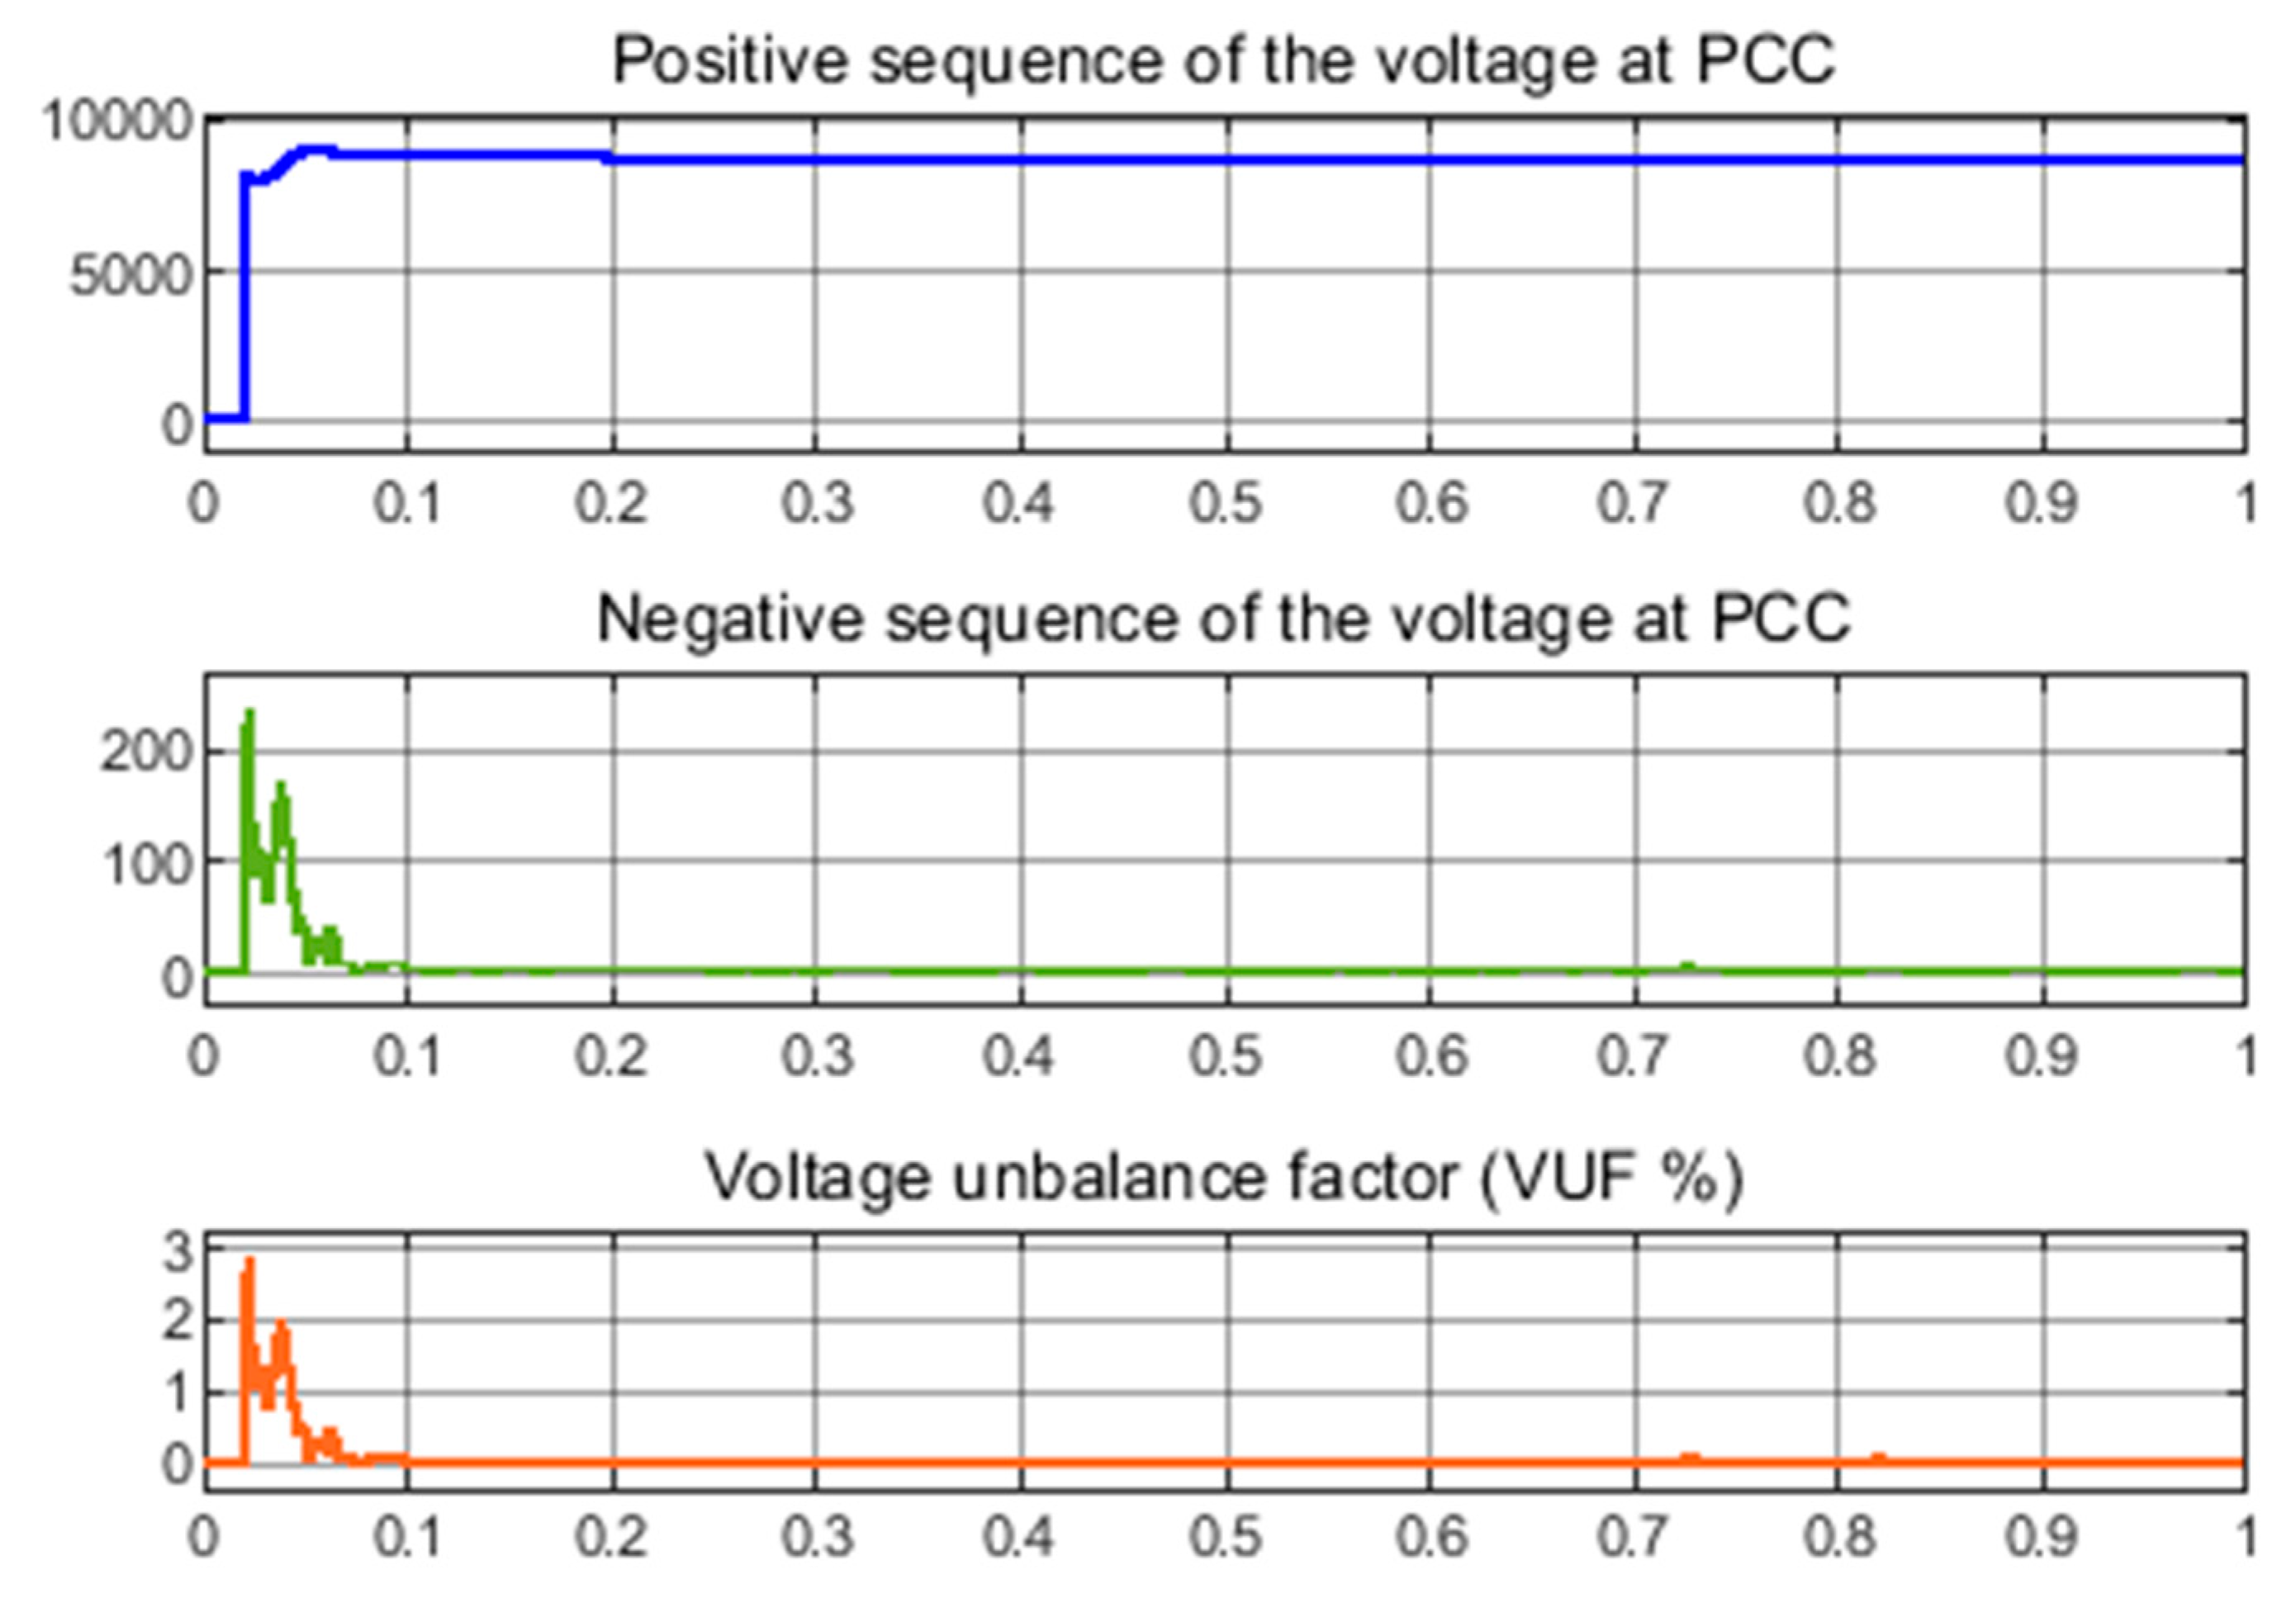
2.4. Standard Requirement for Voltage Unbalance
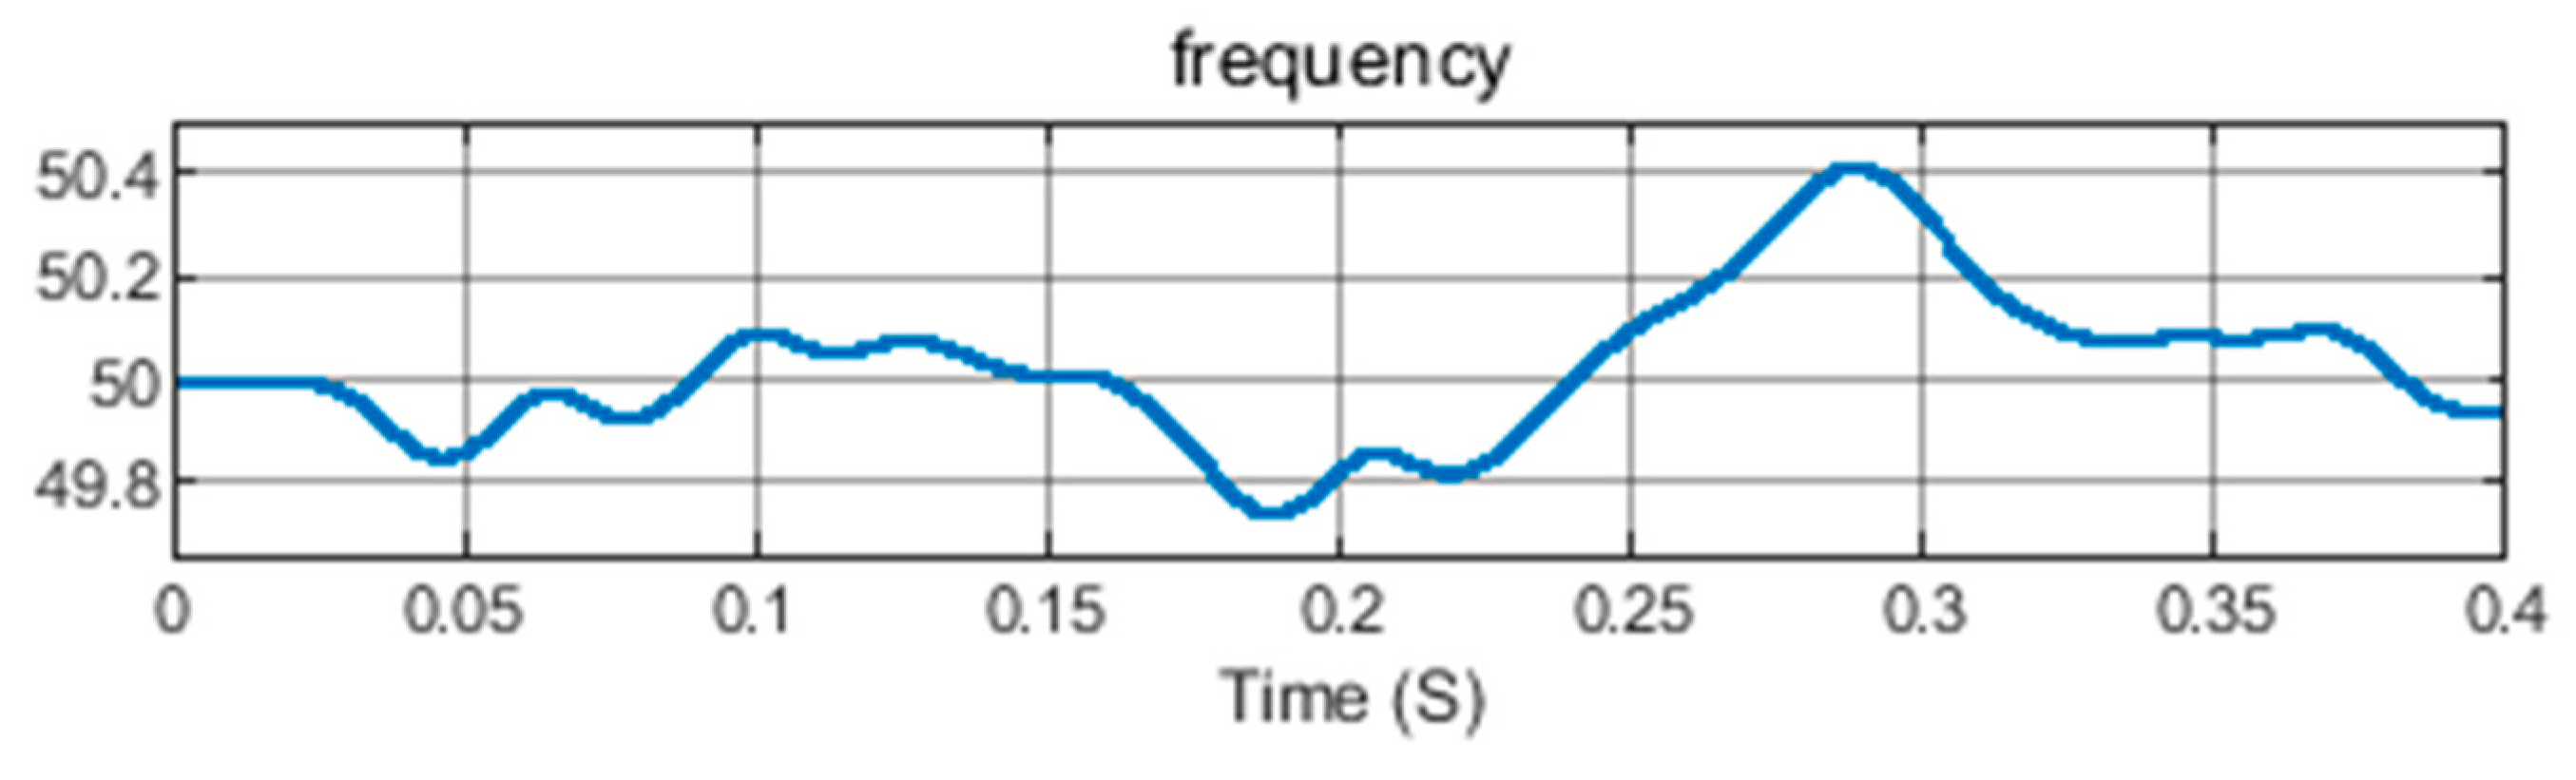
2.5. PV System Requirements on Frequency Variation and Power Factor
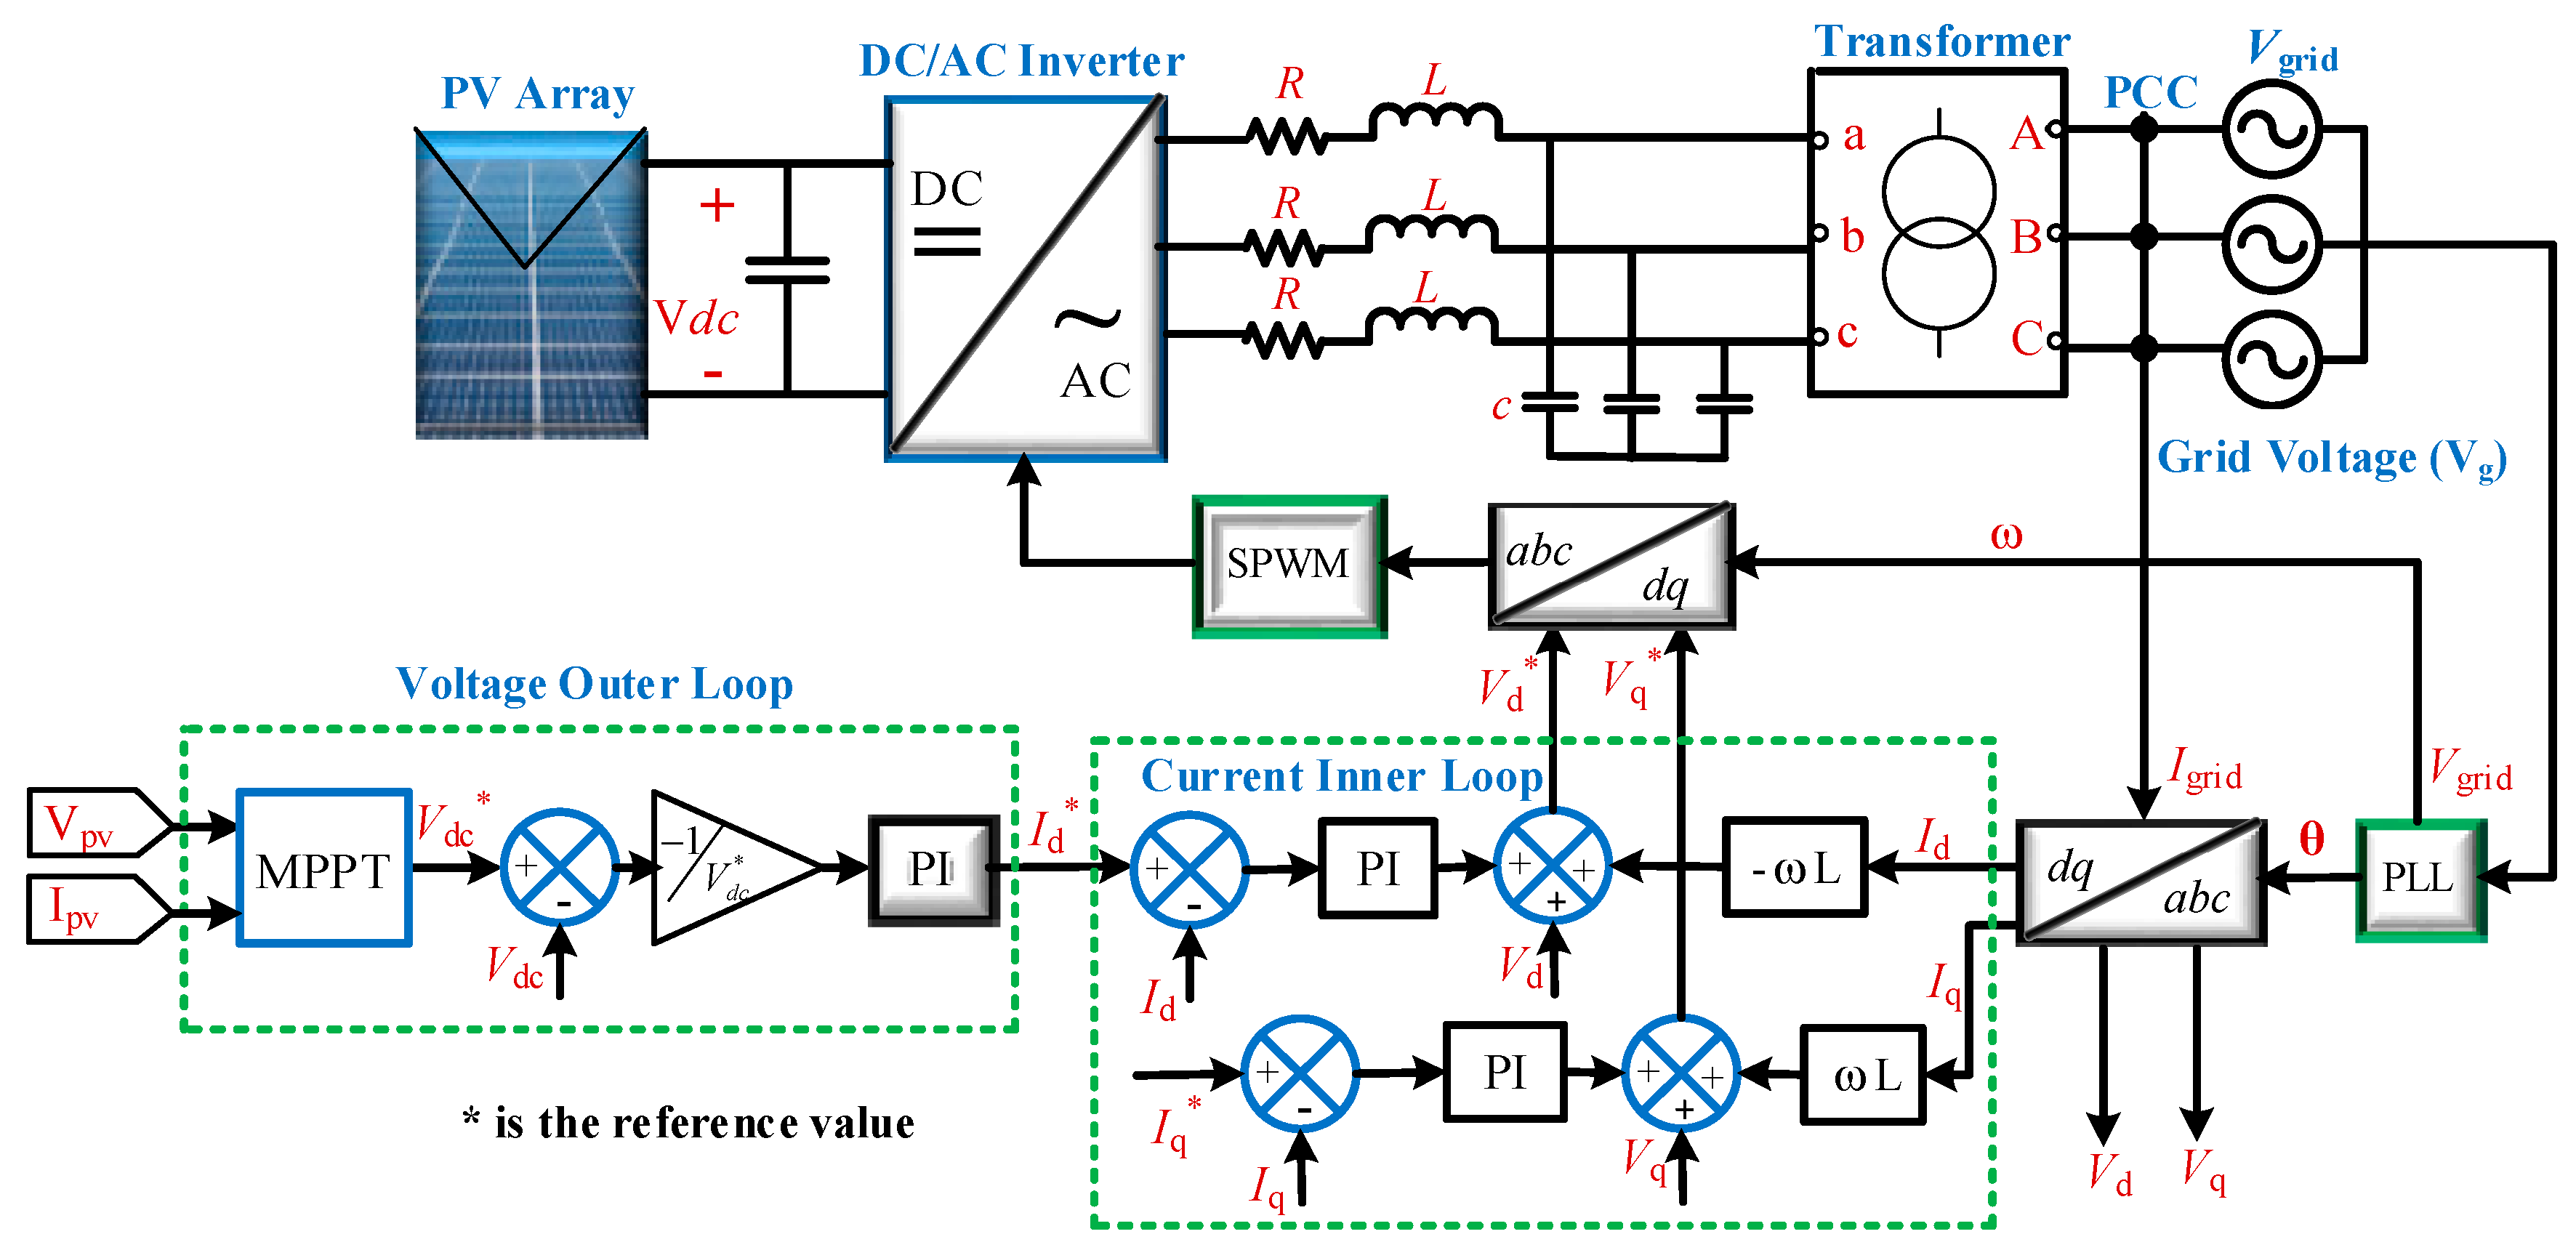
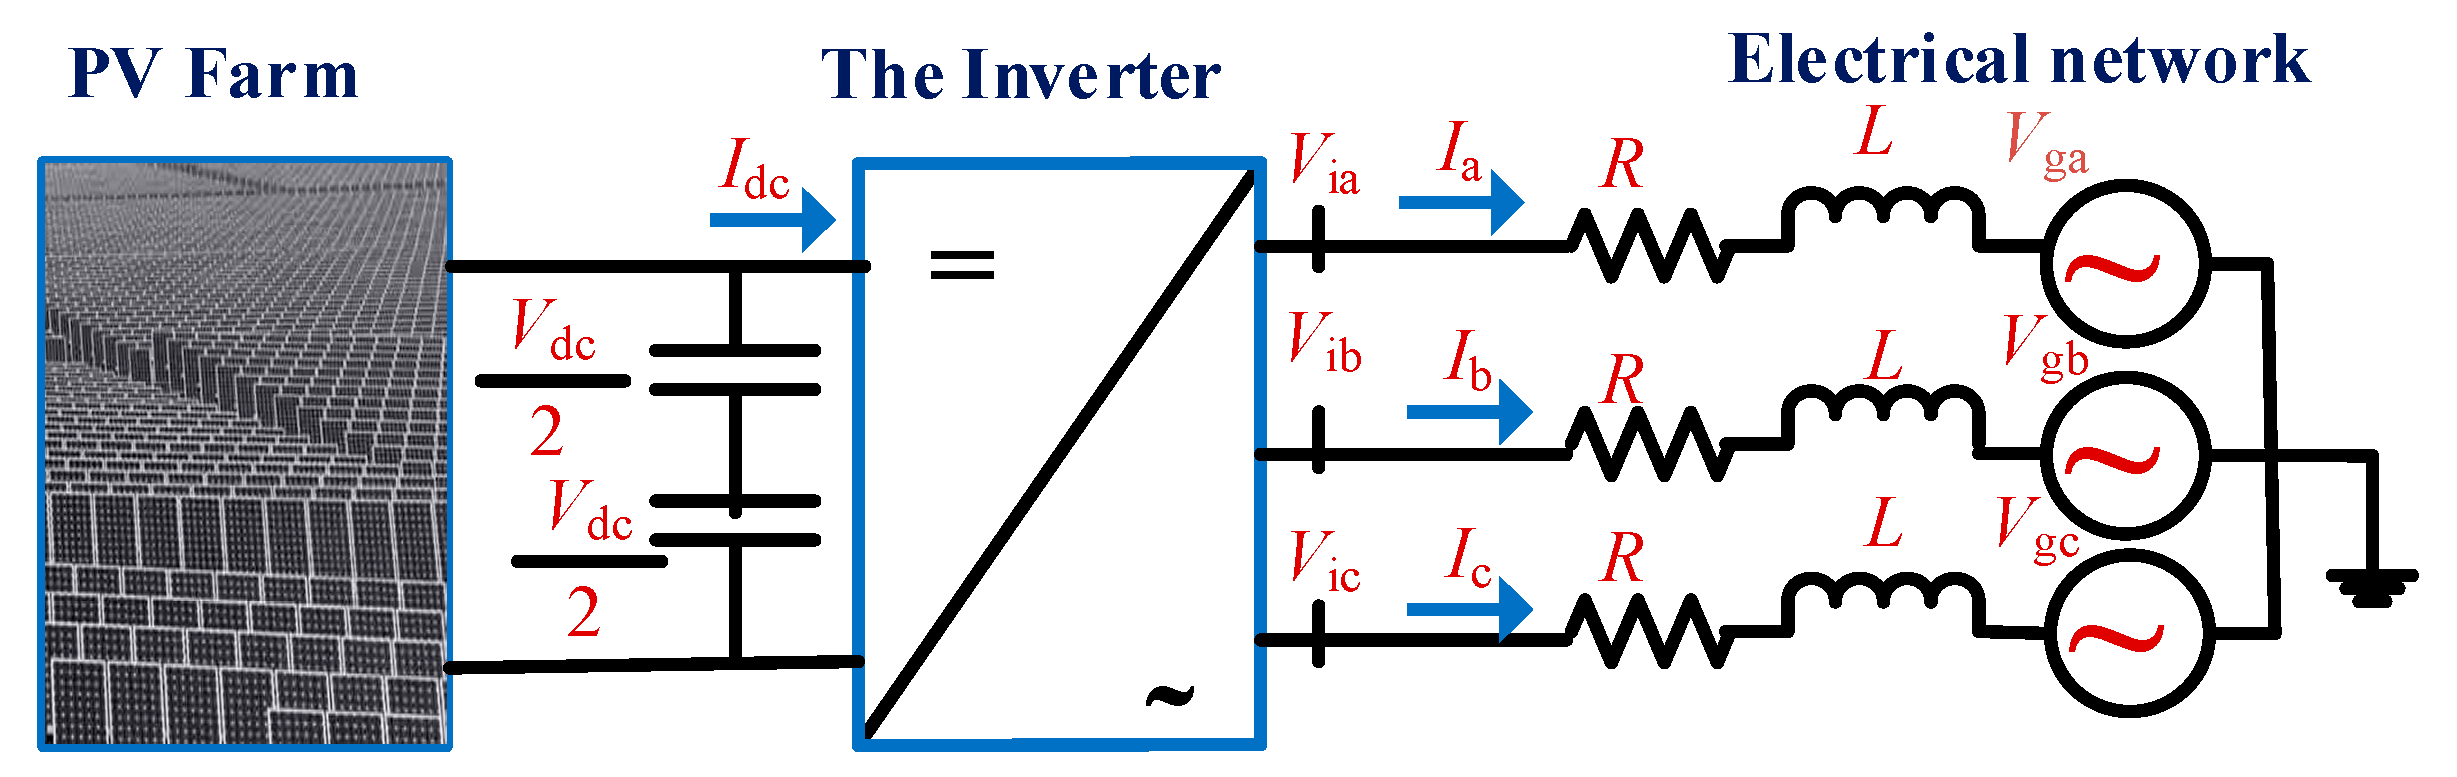
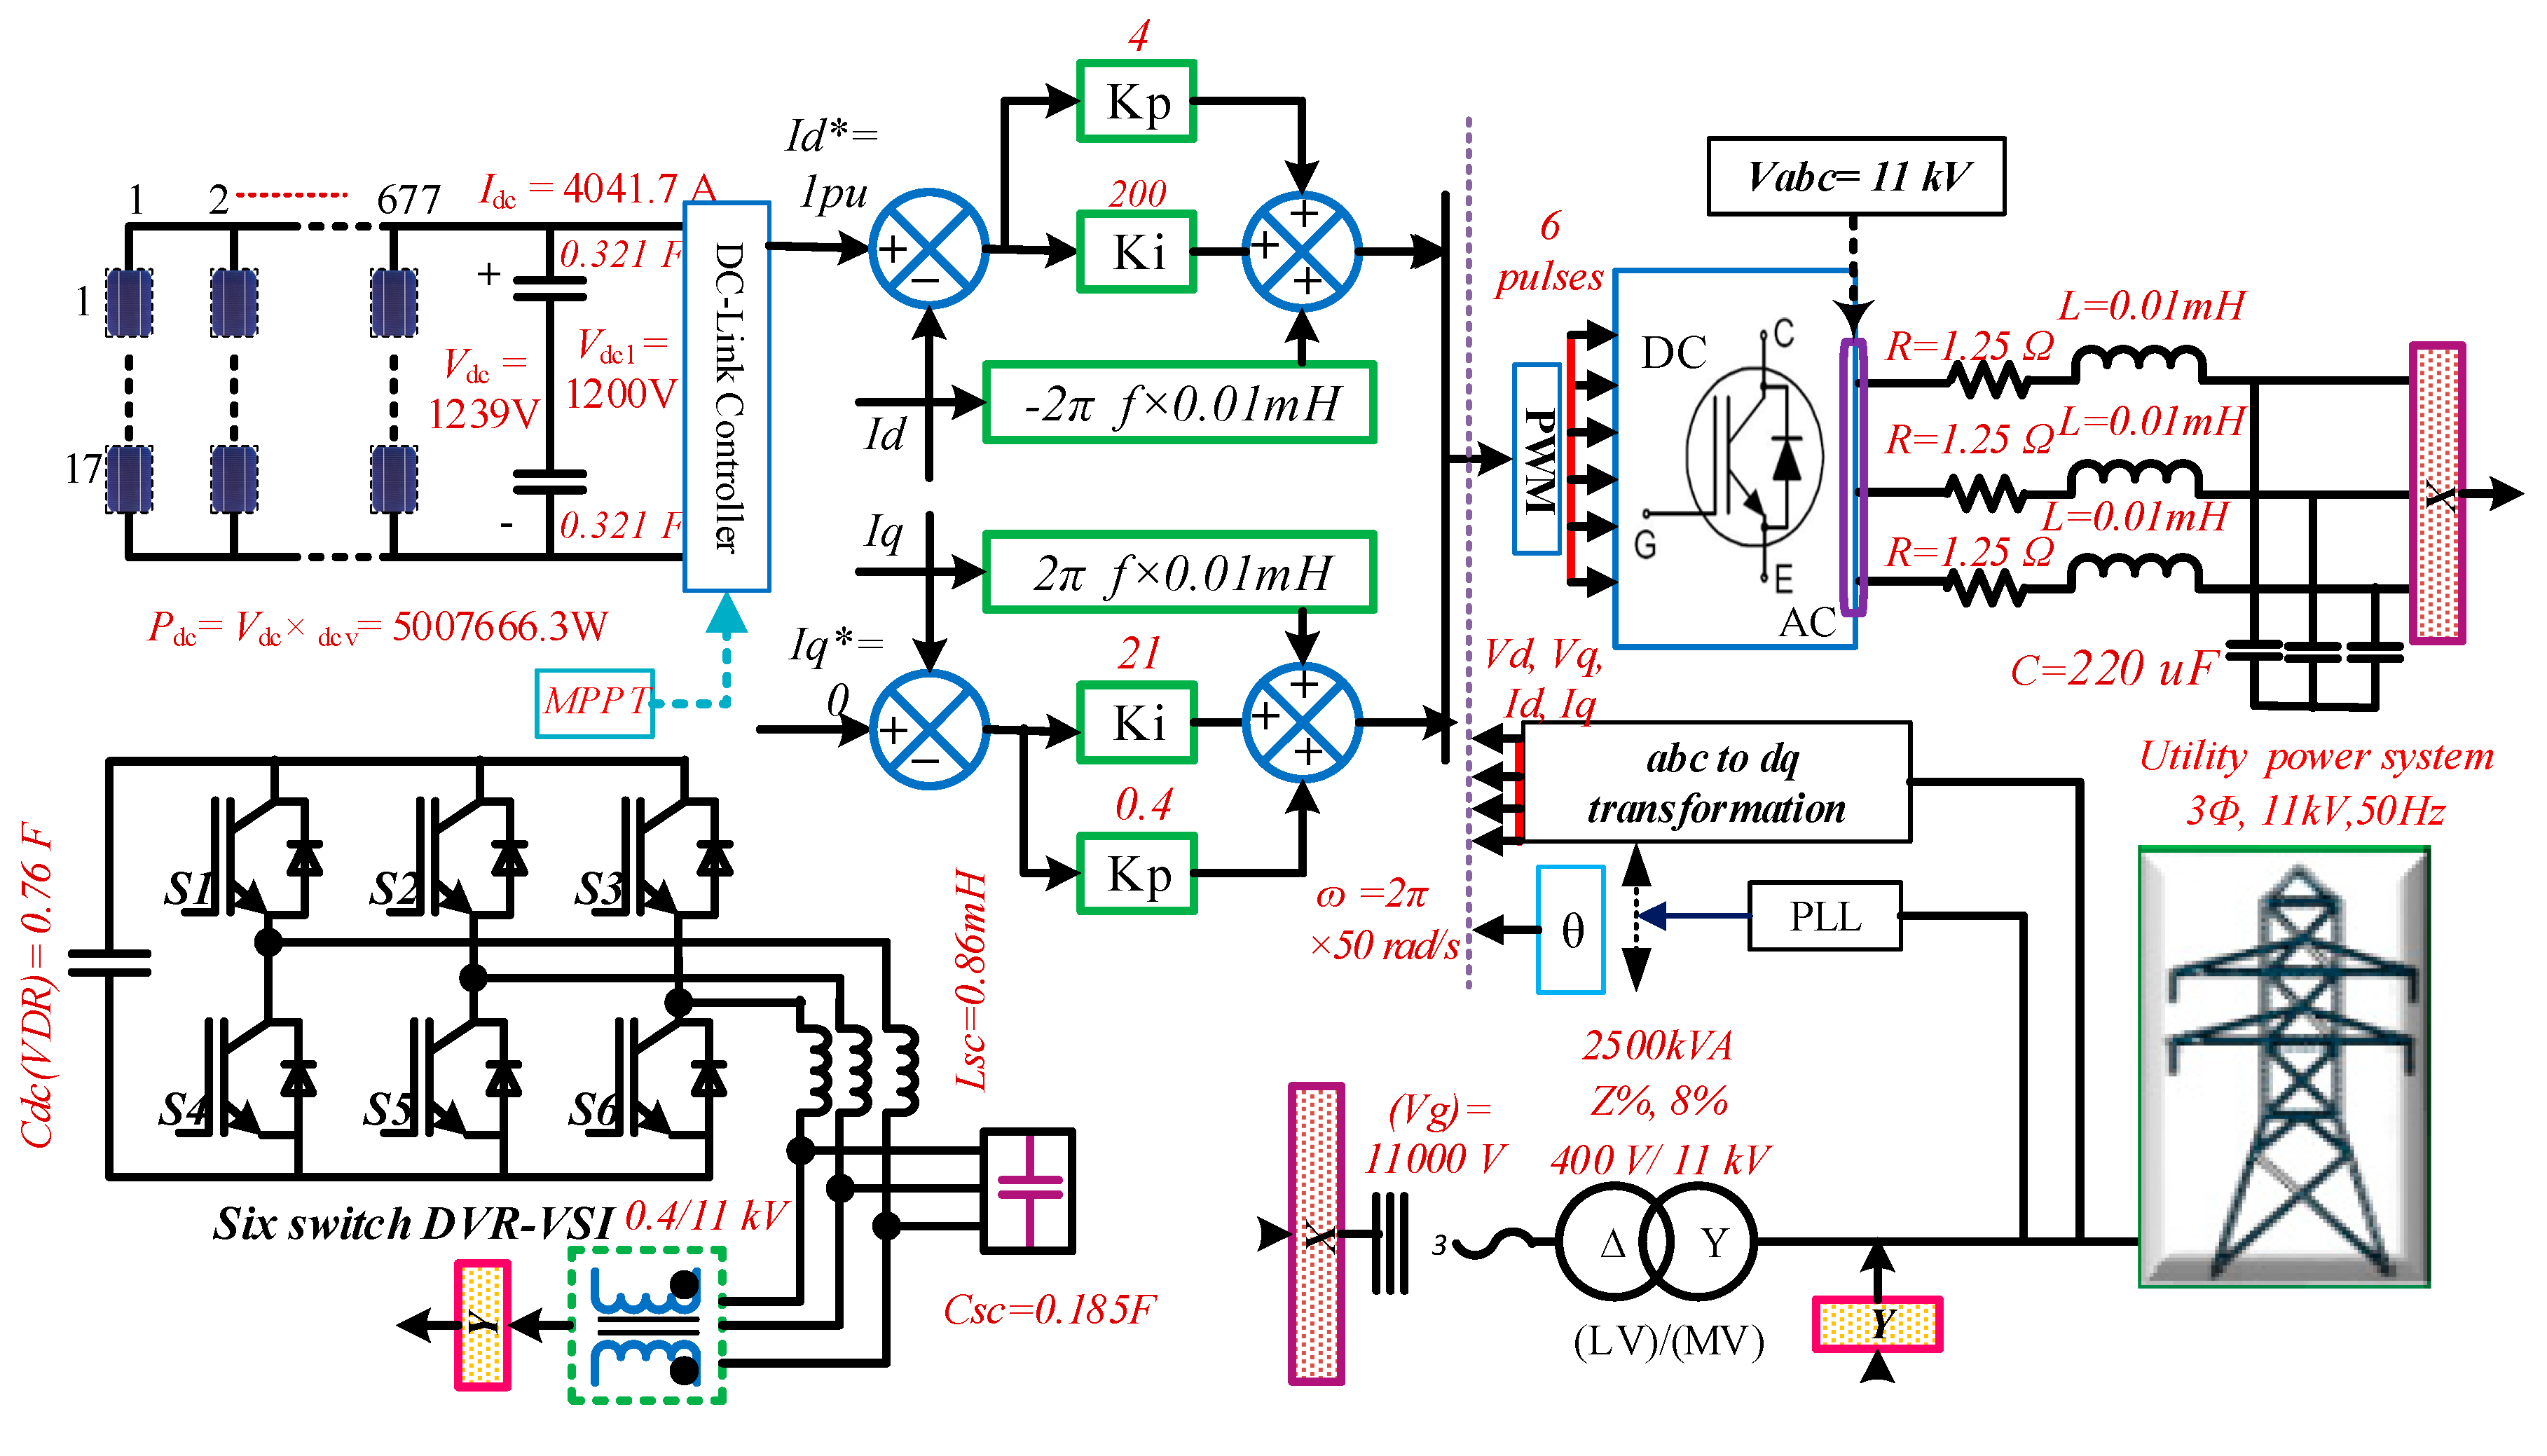
3. Grid-Connected PV System Structure and Models
4. Compliance Strategies for Achieving Power Quality Requirements
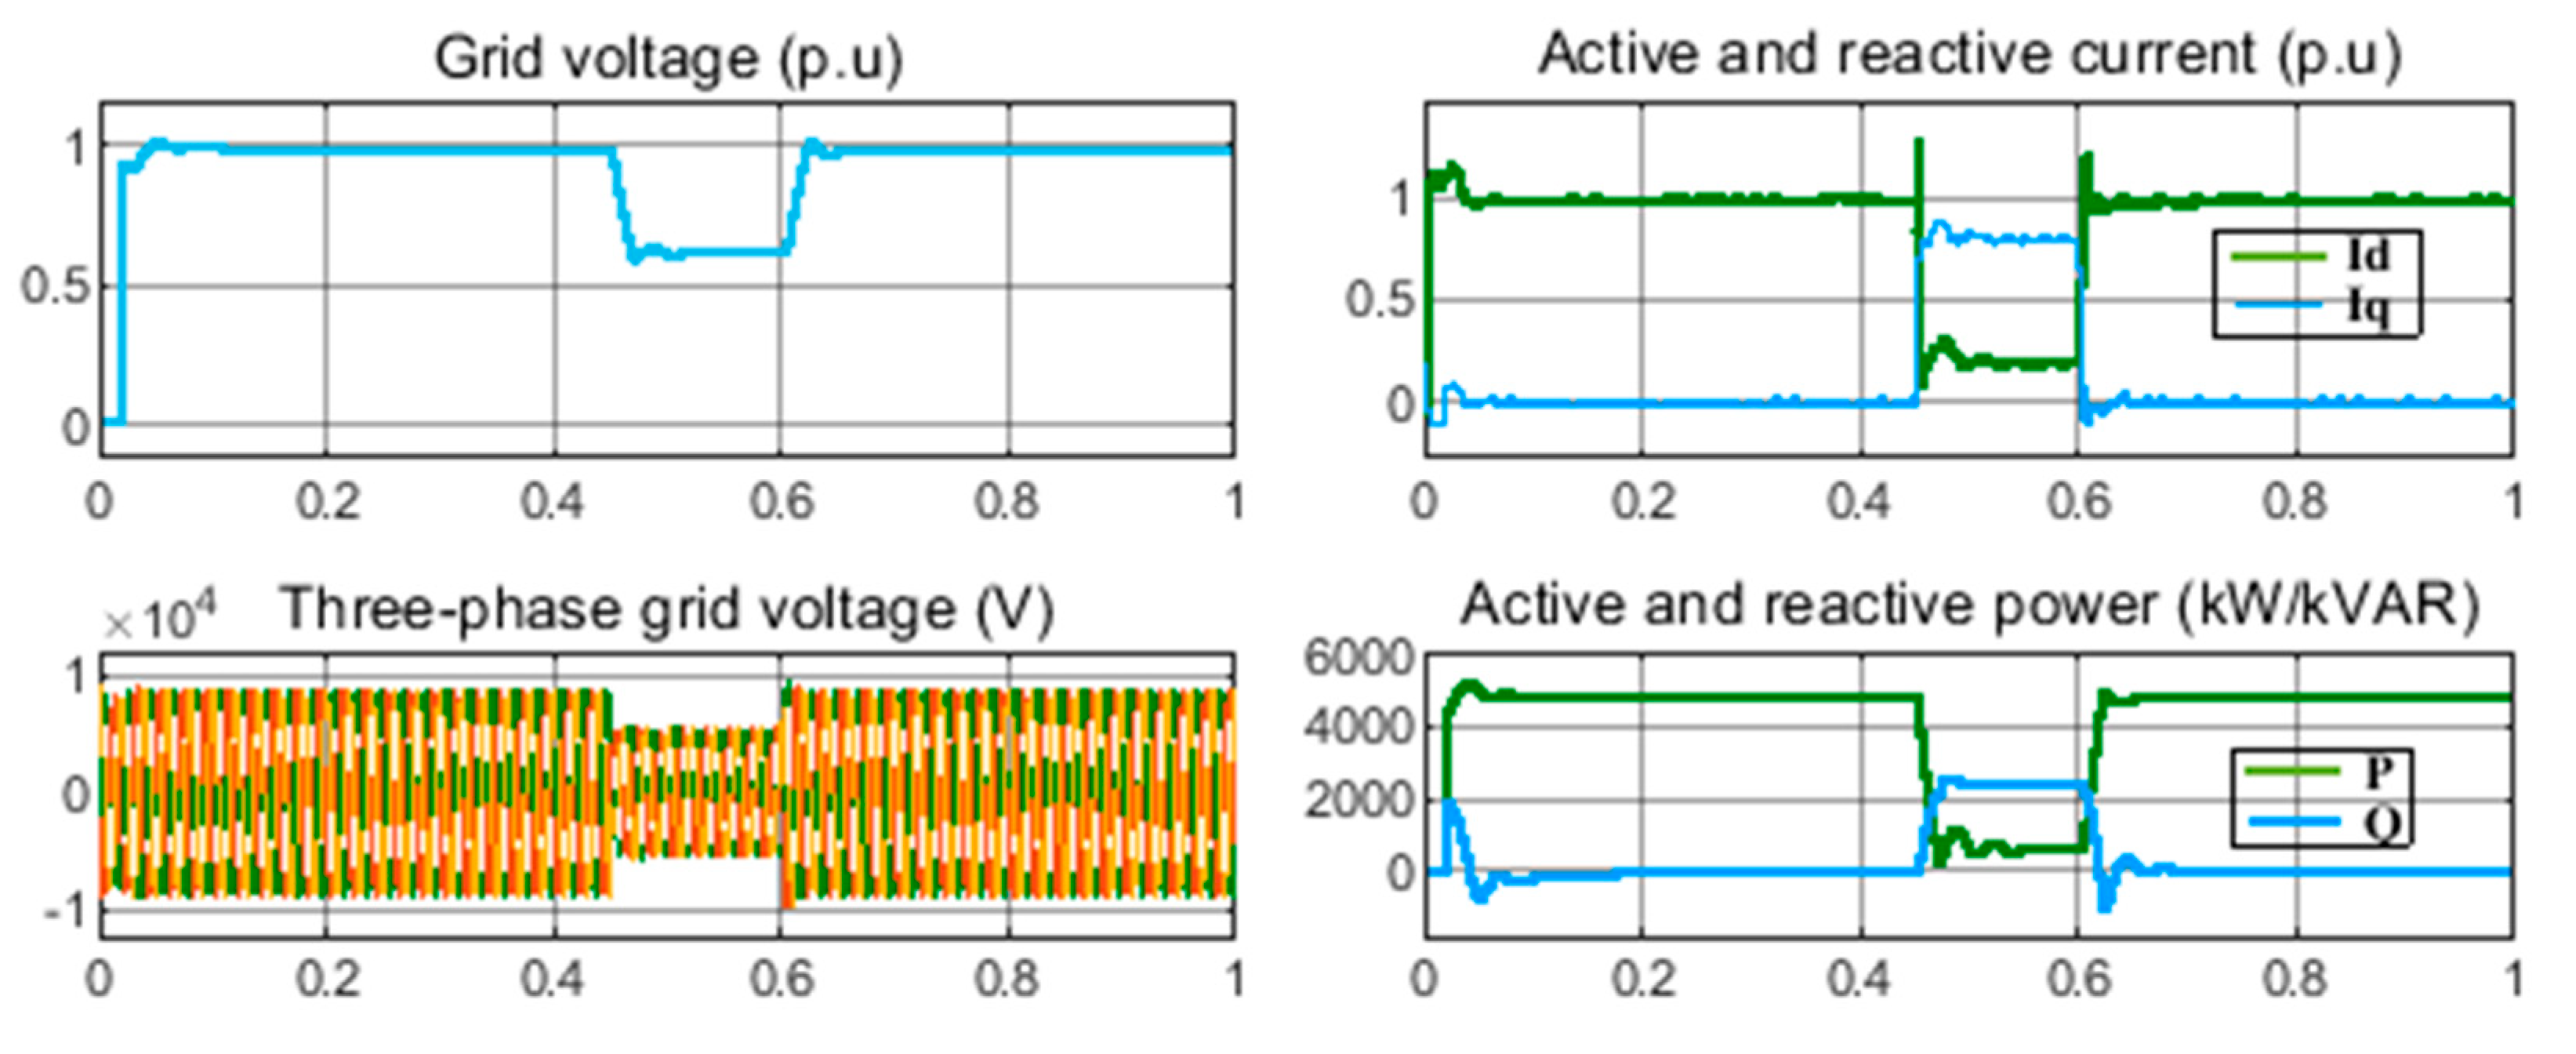
4.1. LVRT Capability Control for Voltage Sag Mitigation
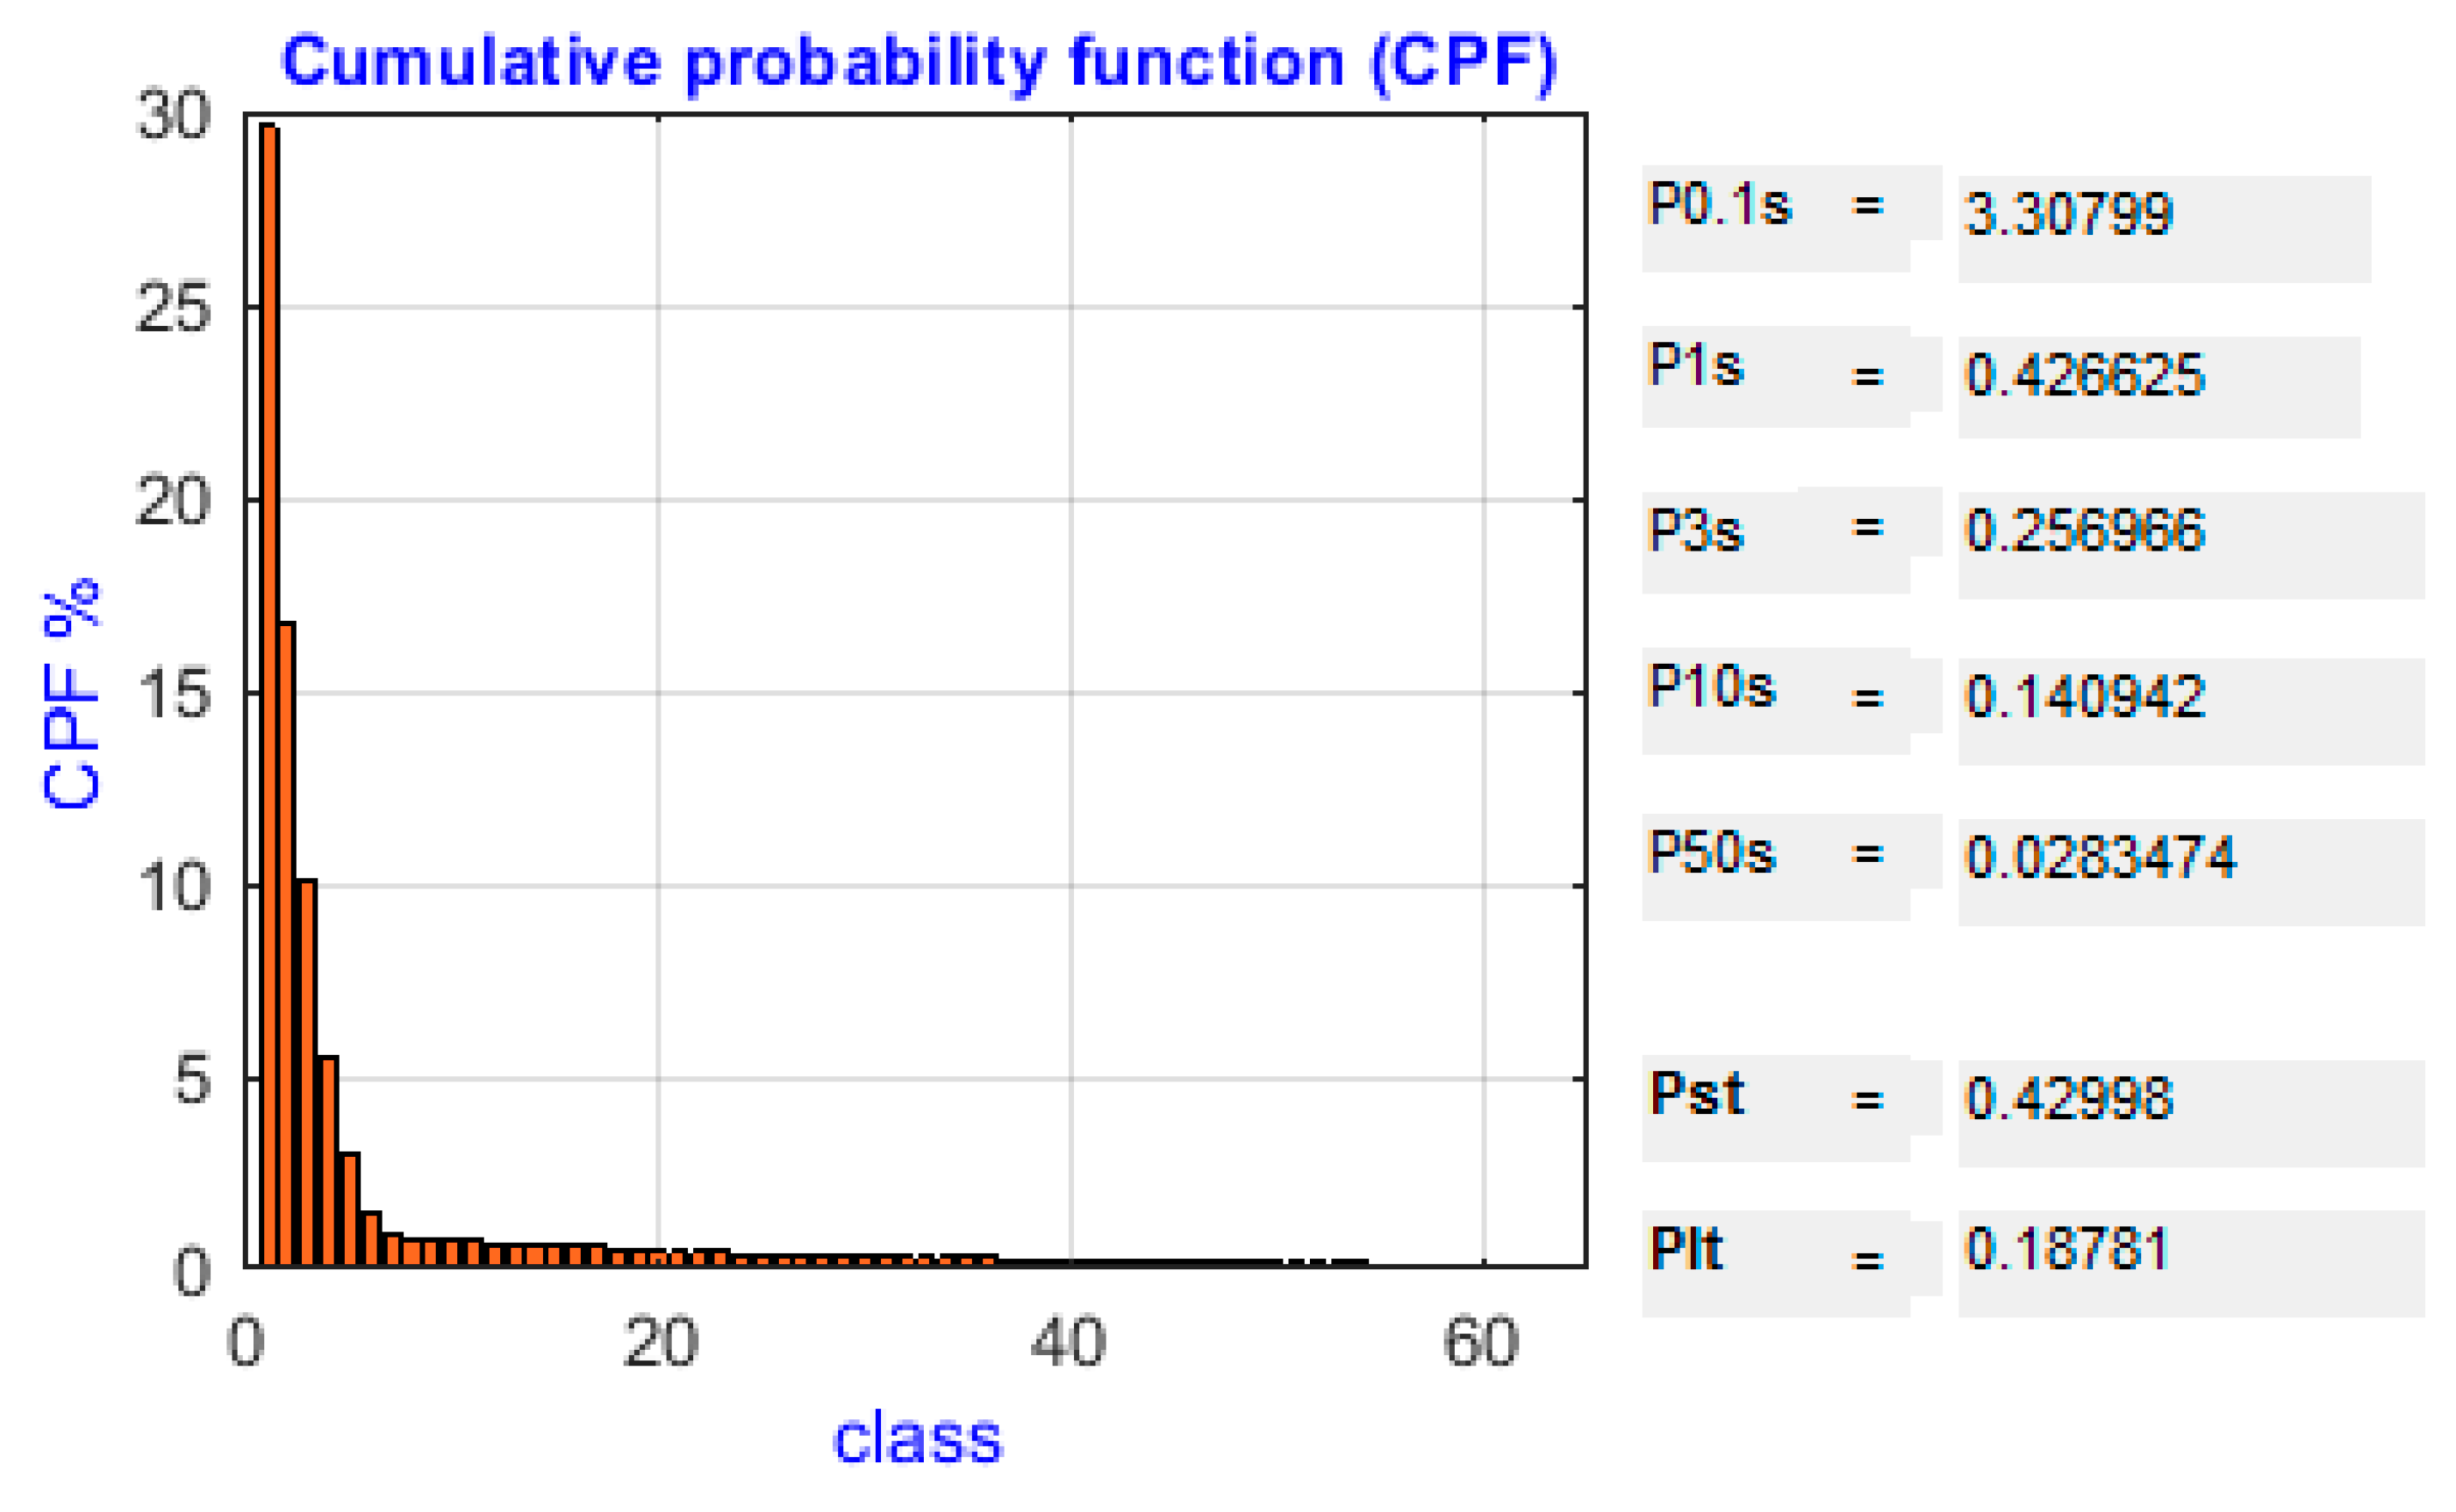
4.2. Voltage Flicker Management
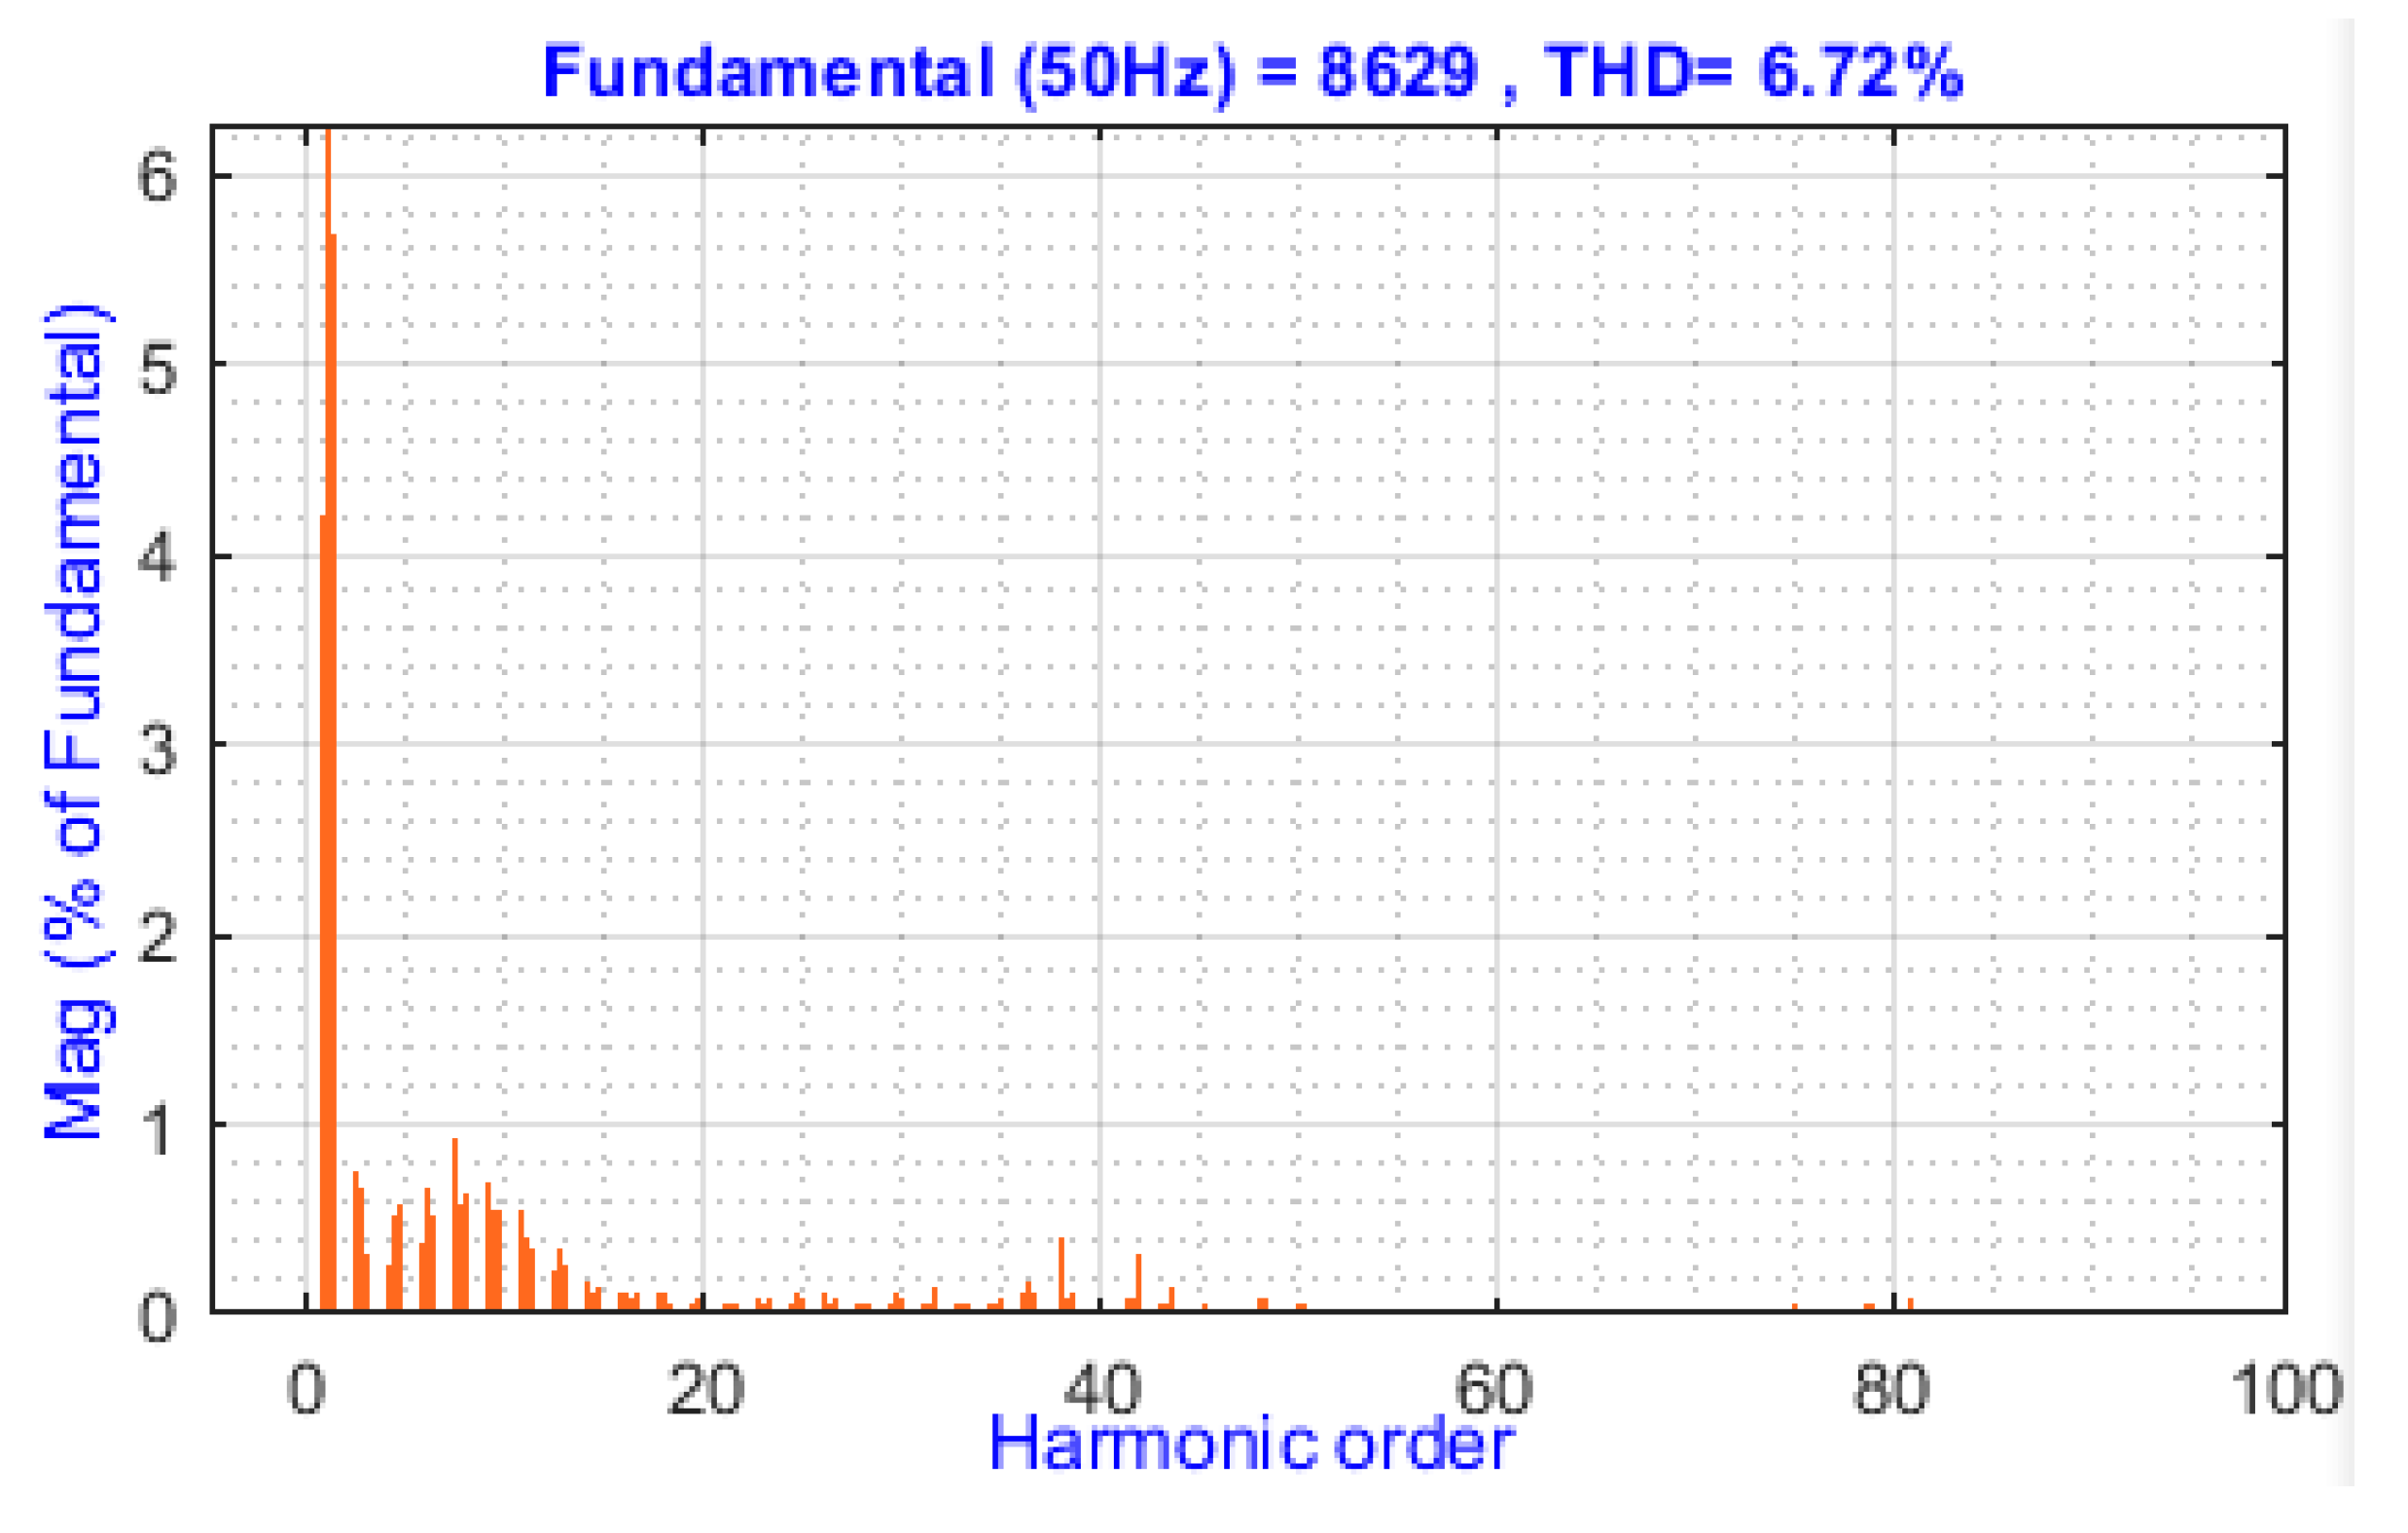
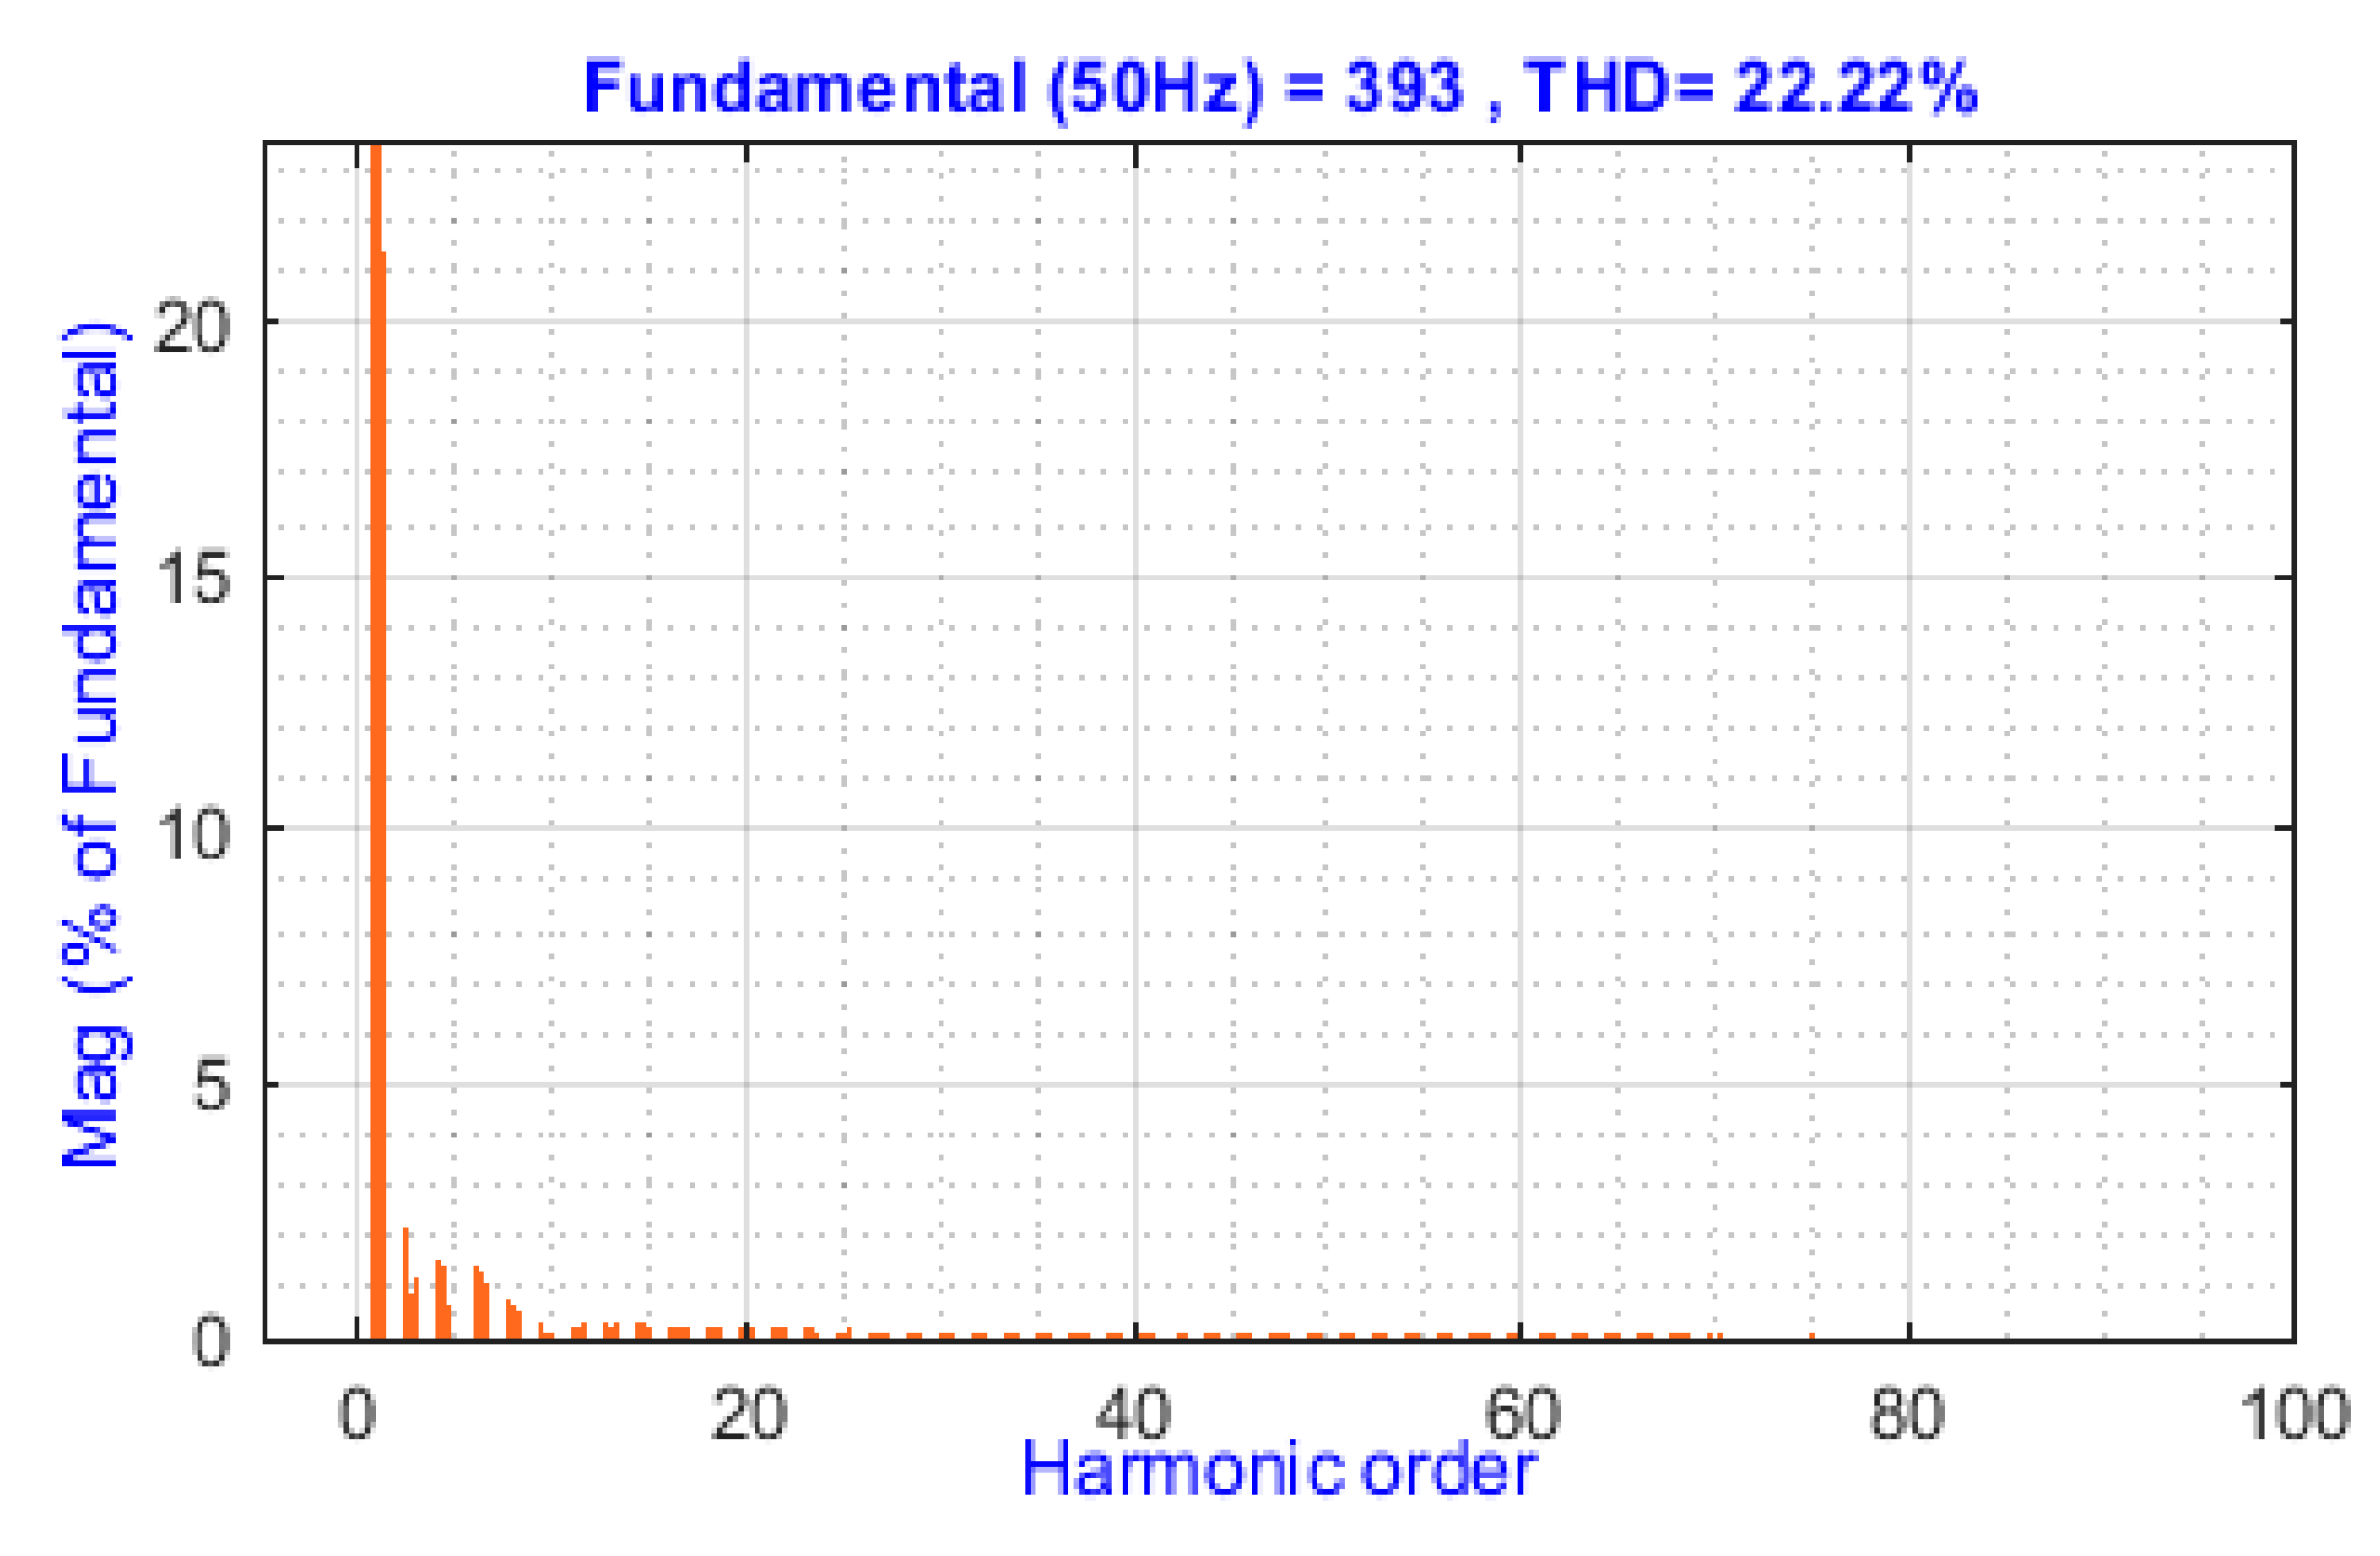
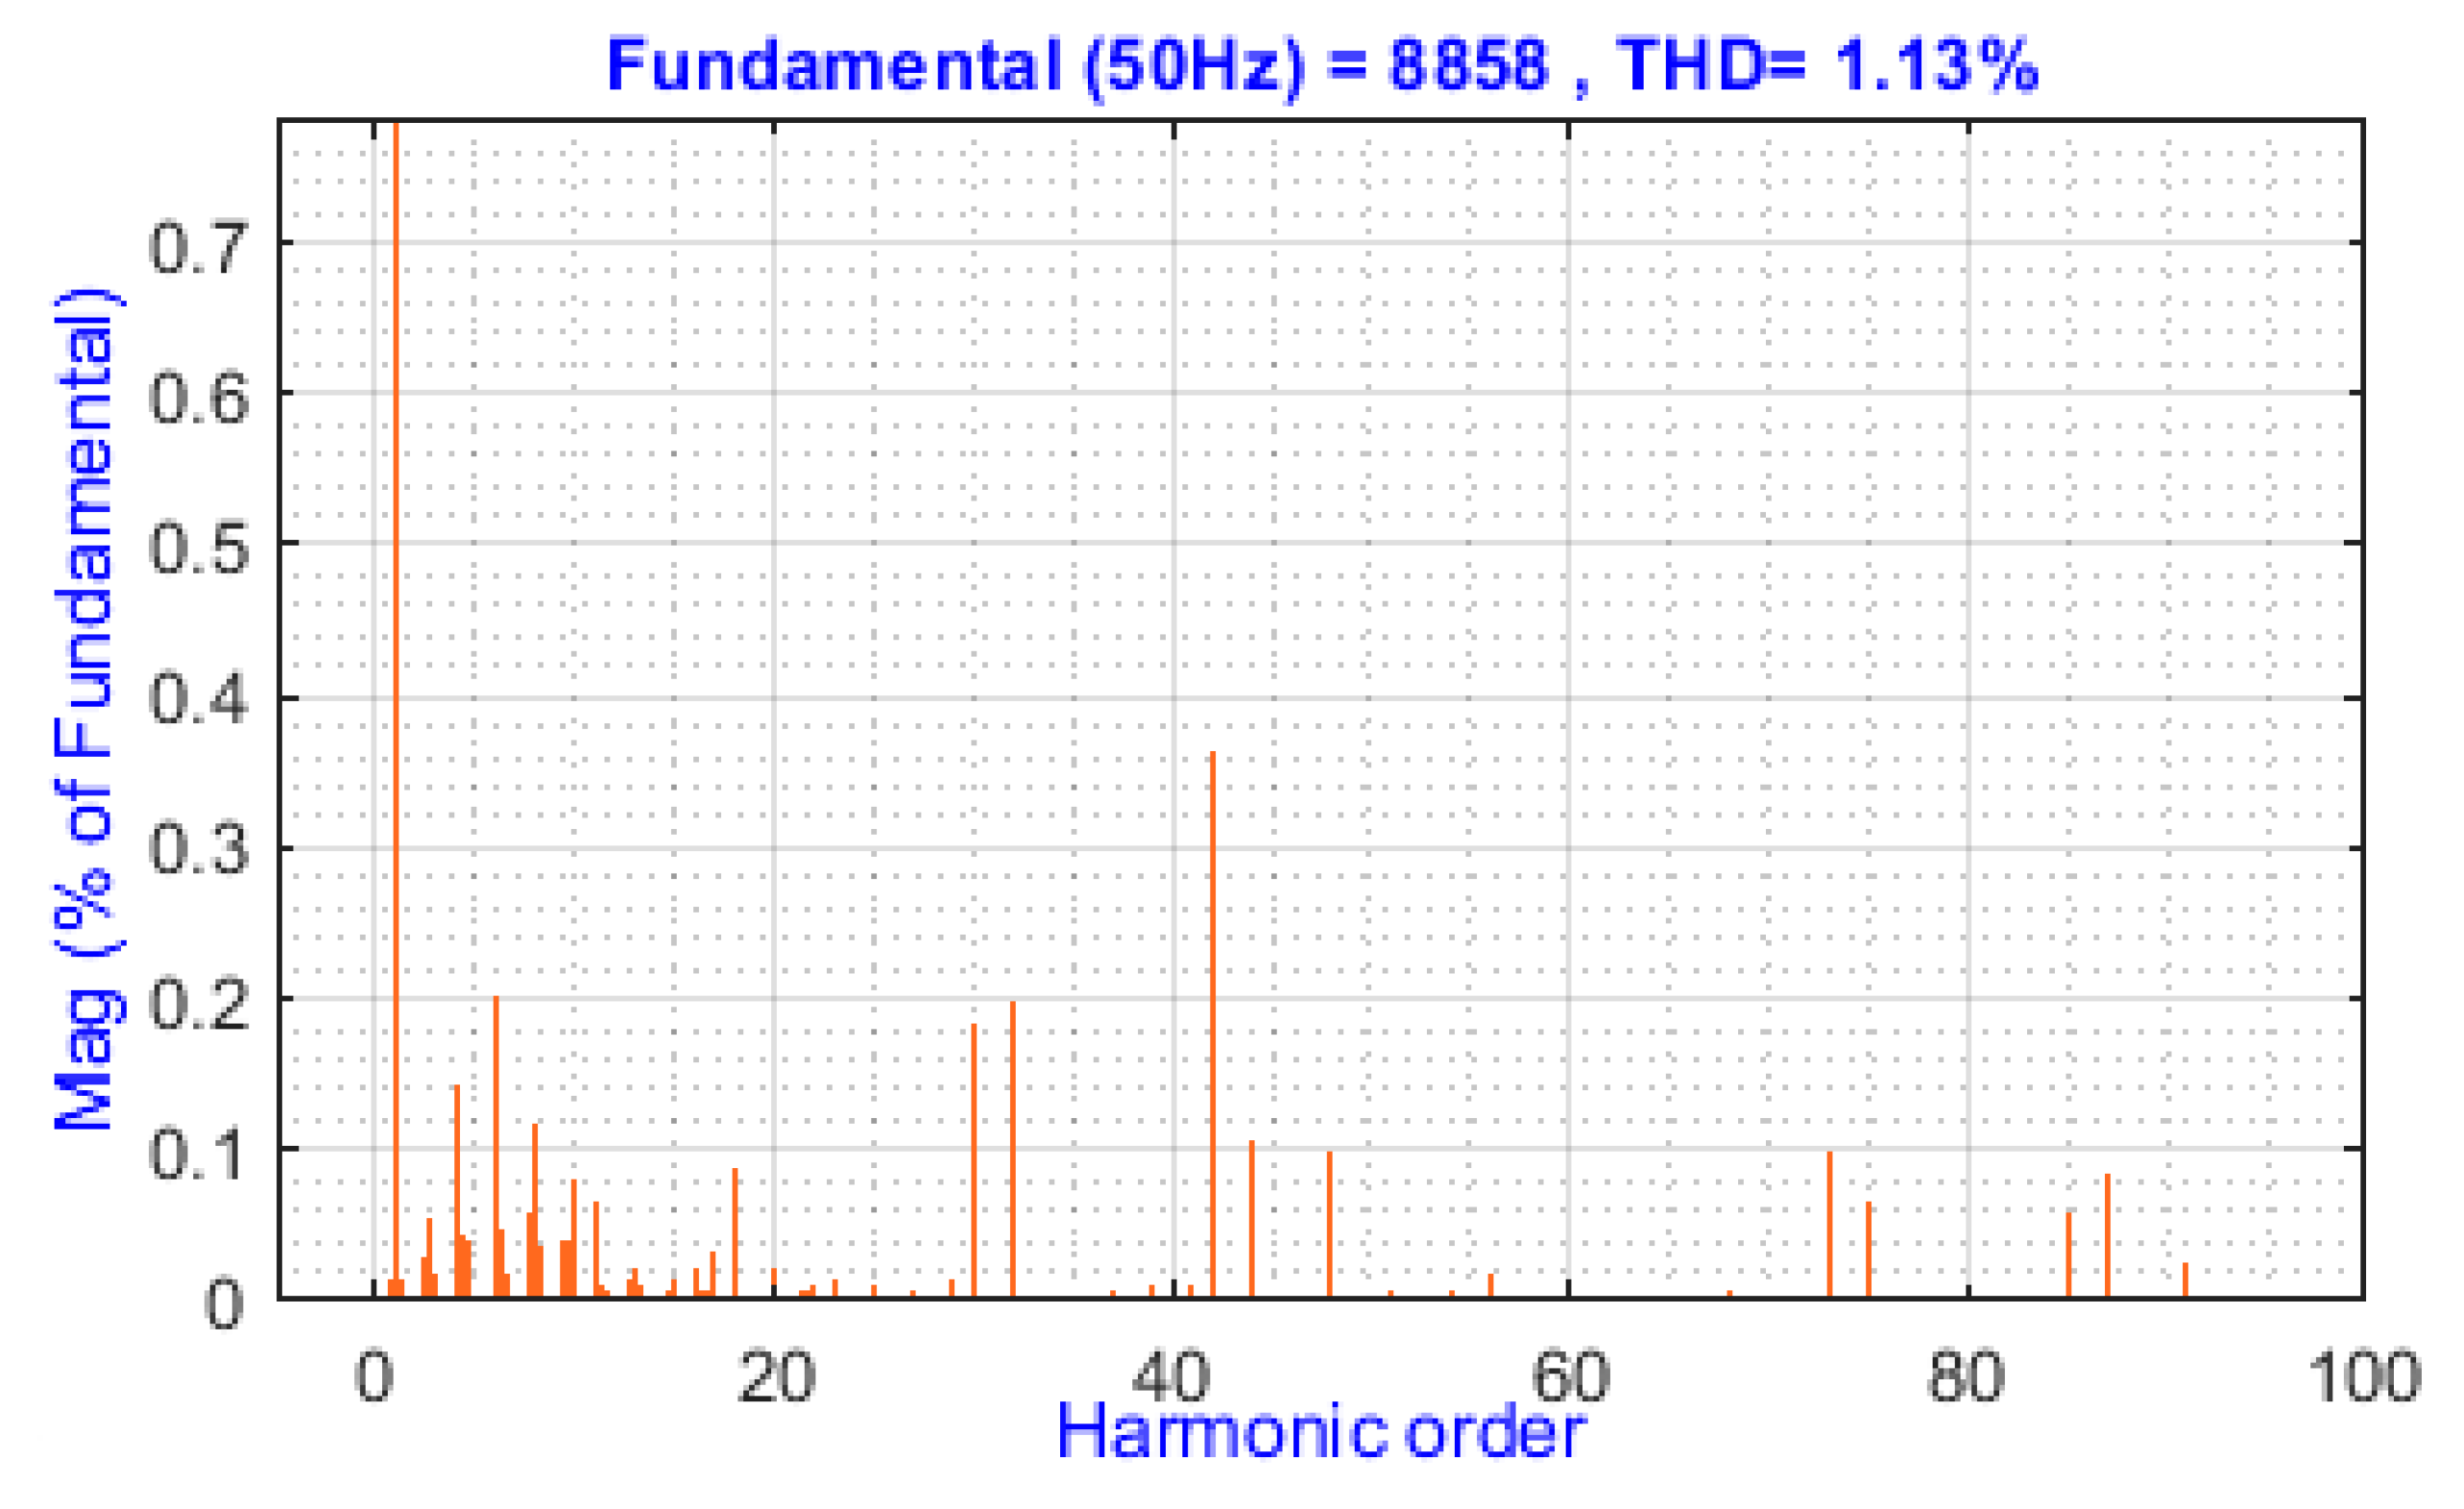
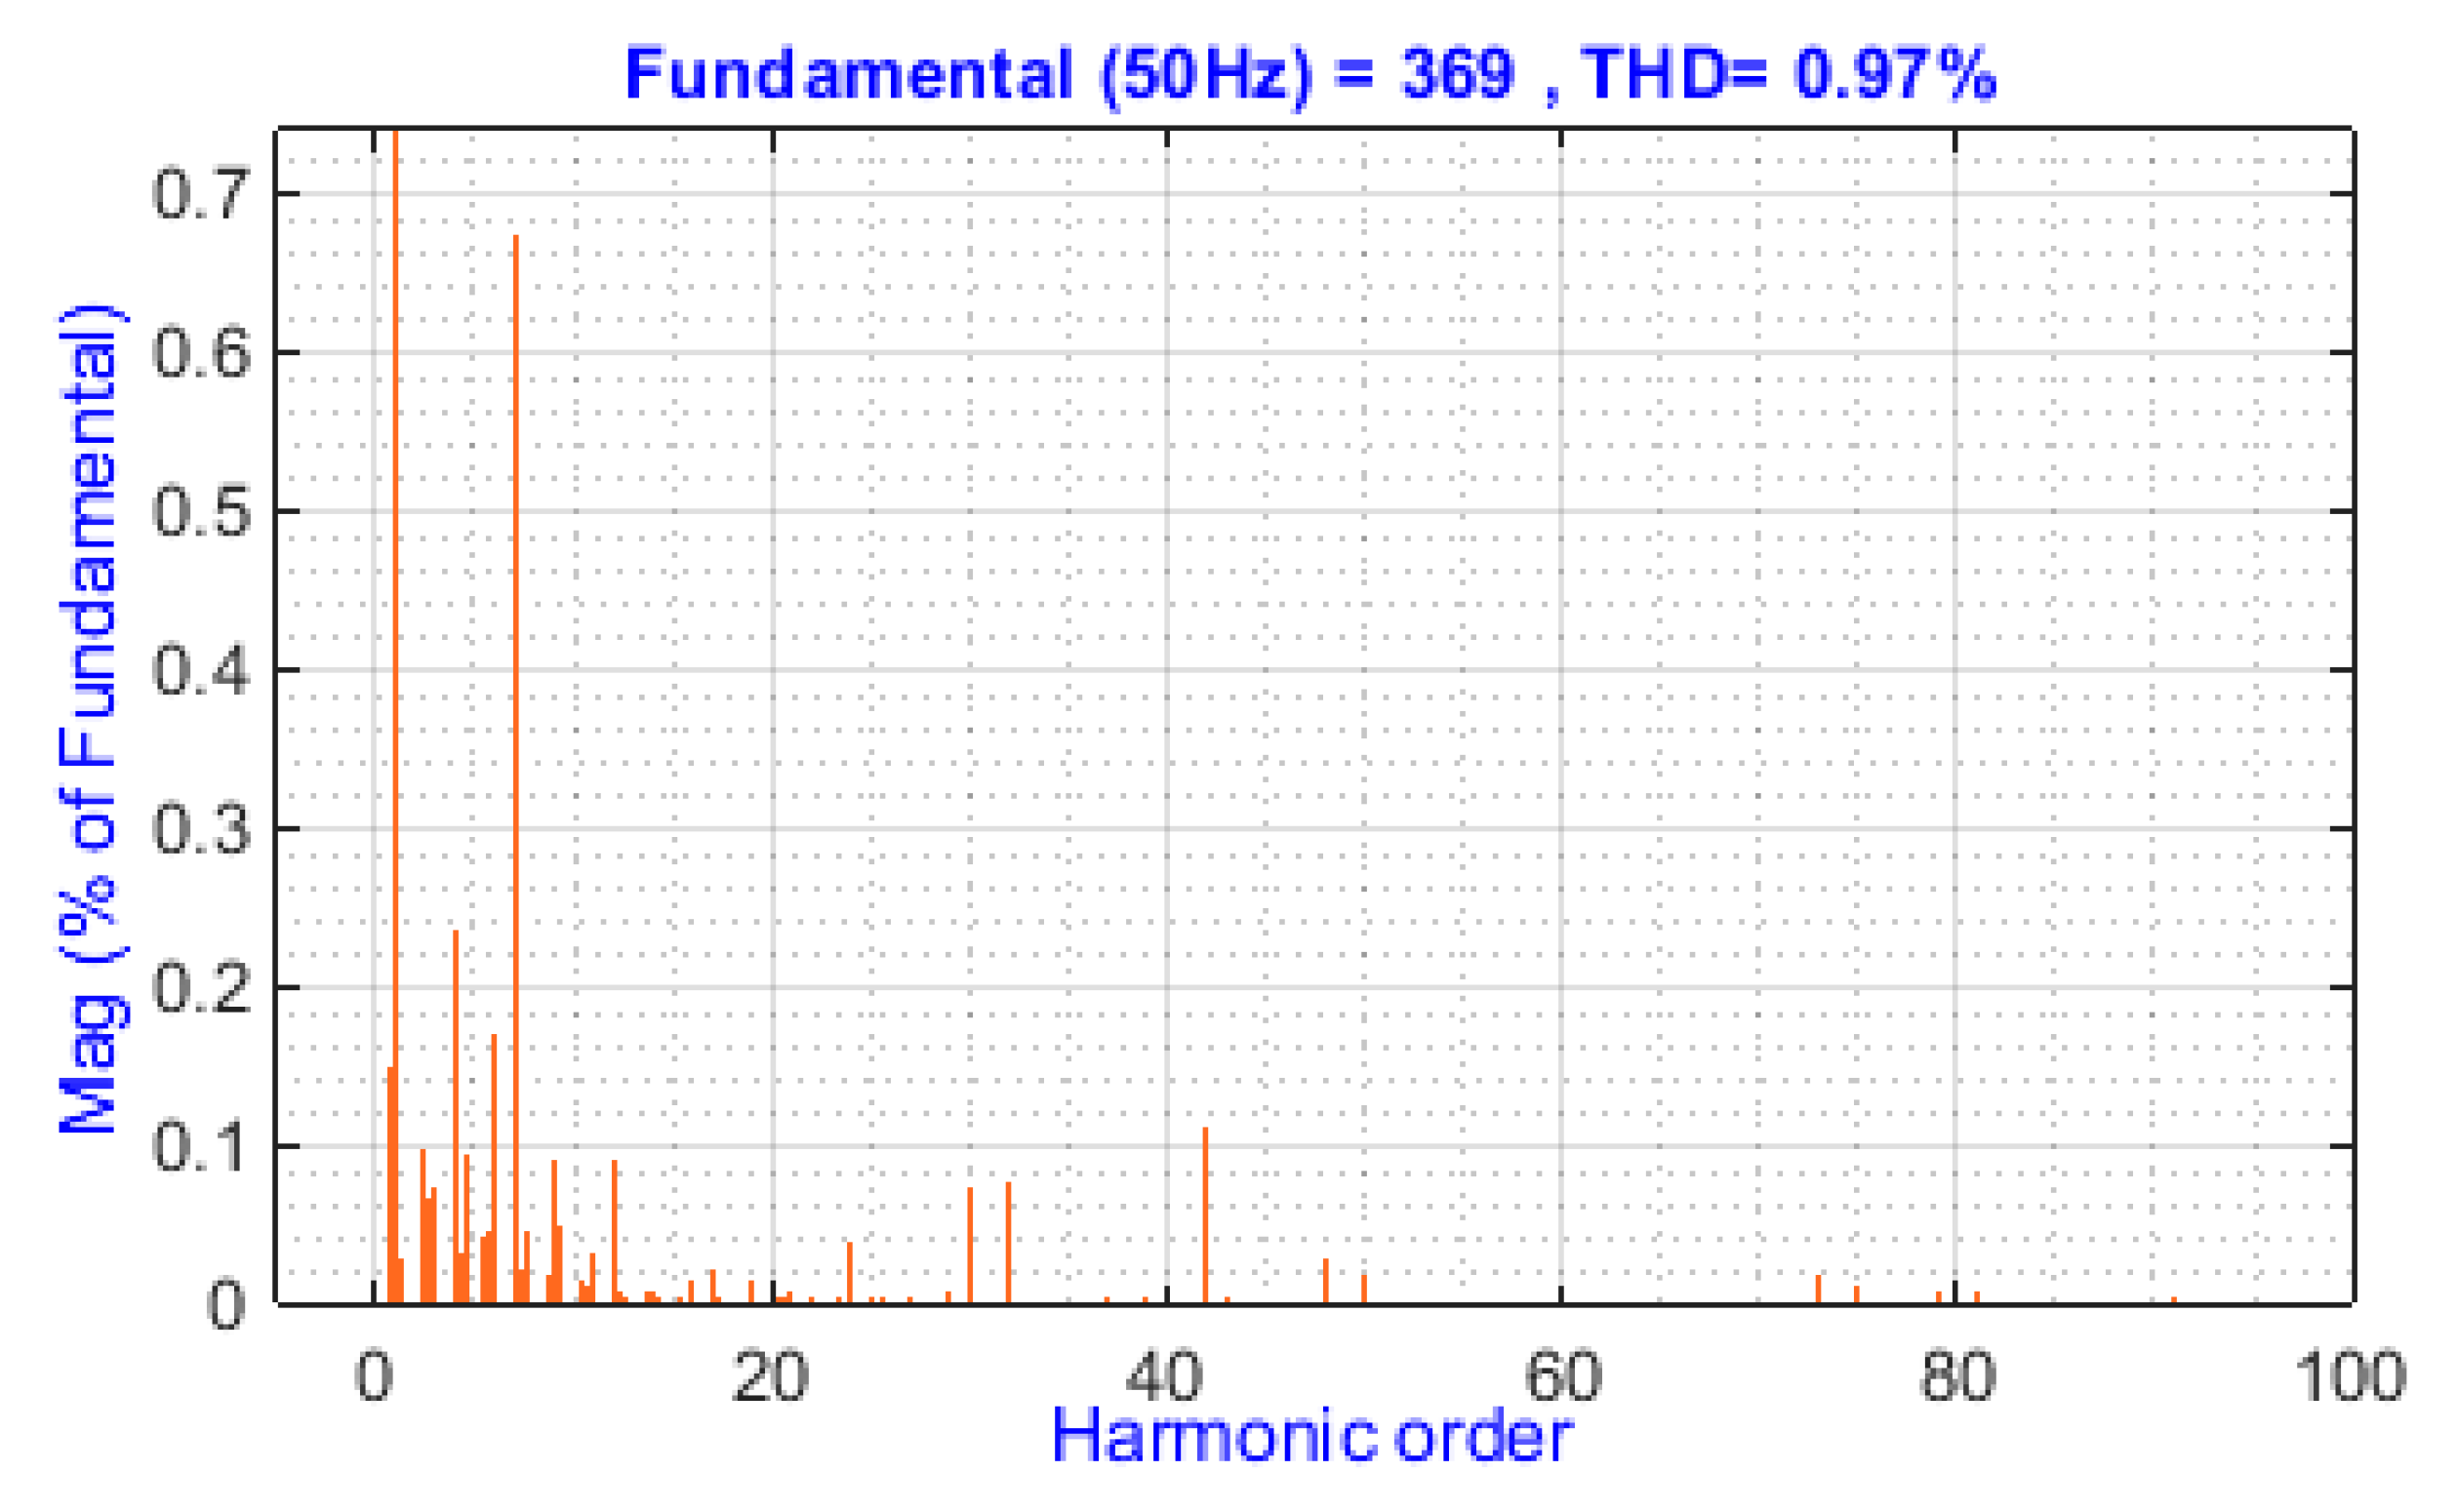
4.3. Harmonics Reduction According to the Standards Requirements
4.4. Voltage Unbalance Assessment
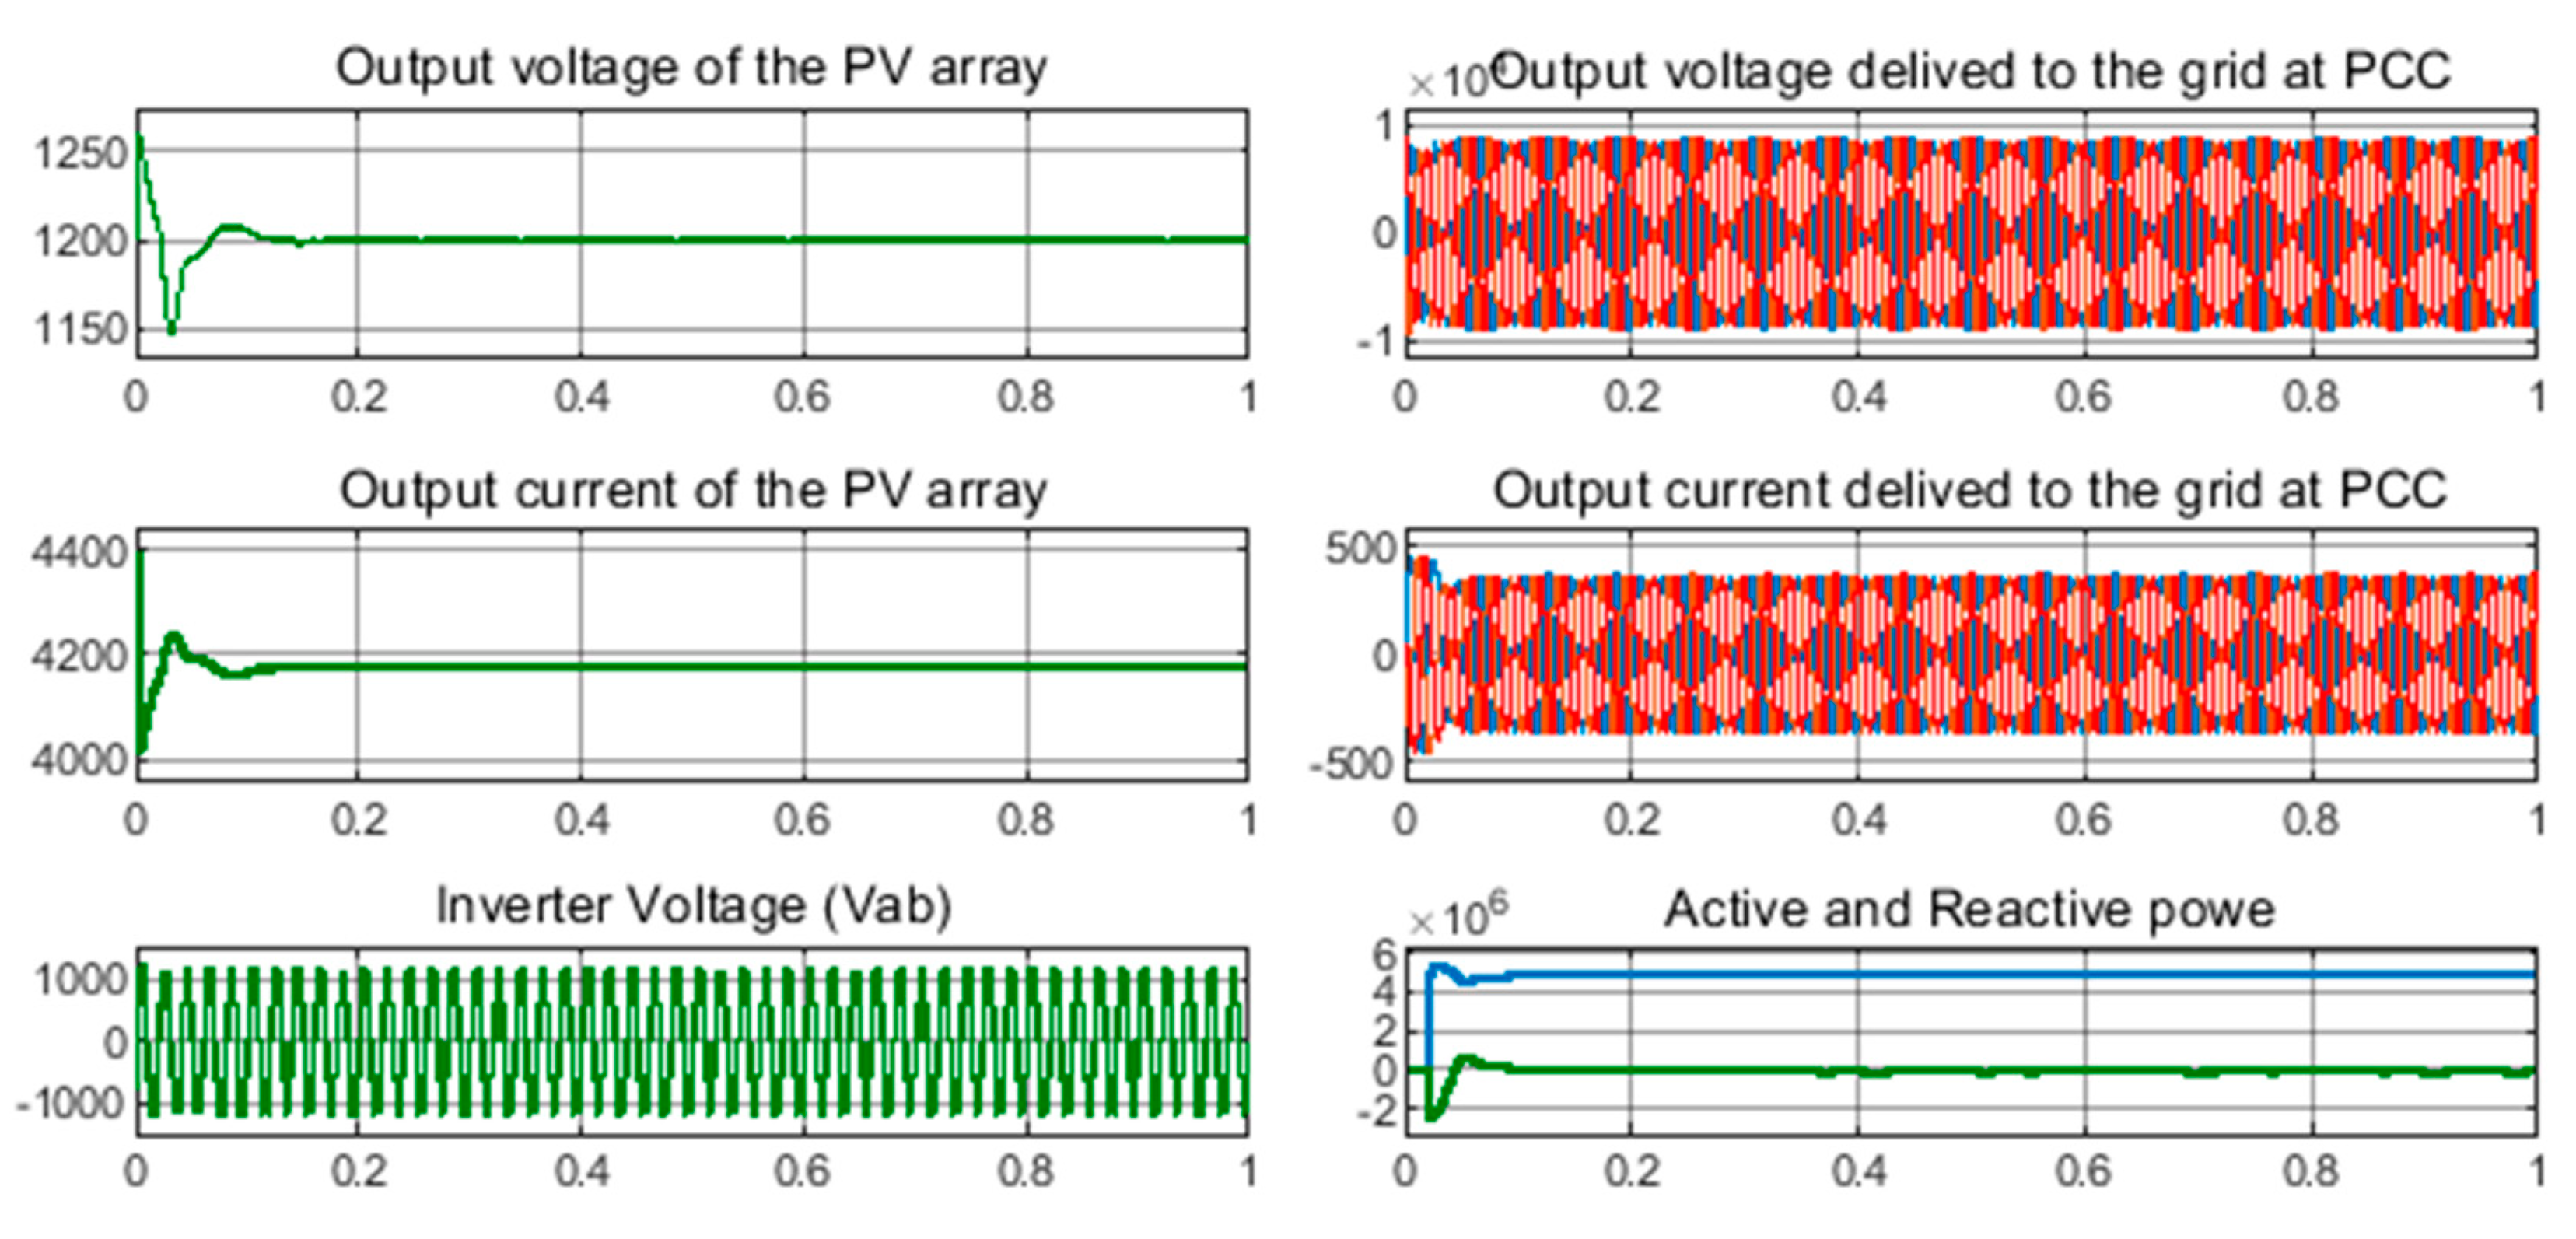
5. Results and Discussion
5.1. Large-Scale Grid Connected PVPP
5.2. Verification of the Compliance of Power Quality Requirements
5.3. Comparison between Proposed and Existing Methods
6. Conclusions
Author Contributions
Funding
Conflicts of Interest
Appendix A. System Parameters of PV Farm
References
- Global Status Report. Renewables 2019 Global Status Report-REN21. Available online: https://www.unenvironment.org/resources/report/renewables-2019-global-status-report (accessed on 22 June 2019).
- Di Silvestre, M.L.; Favuzza, S.; Sanseverino, E.R.; Zizzo, G.; Ngoc, T.N.; Pham, M.-H.; Nguyen, T.G. Technical rules for connecting PV systems to the distribution grid: a critical comparison of the Italian and Vietnamese frameworks. In Proceedings of the 2018 IEEE International Conference on Environment and Electrical Engineering and 2018 IEEE Industrial and Commercial Power Systems Europe (EEEIC/I&CPS Europe), Palermo, Italy, 12–15 June 2018; pp. 1–5. [Google Scholar]
- Troester, E. New German grid codes for connecting PV systems to the medium voltage power grid. In Proceedings of the 2nd International Workshop on Concentrating Photovoltaic Power Plants: Optical Design, Production, Grid Connection, Lisbon, Portougal, 12–13 November 2009; pp. 9–10. [Google Scholar]
- CEI-Comitato Elettrotecnico Italiano. Reference Technical Rules for the Connection of Active and Passive Consumers to the HV and MV Electrical Networks of Distribution Company. Available online: http://www.ceiweb.it/ (accessed on 23 August 2019).
- Federal Energy Regulatory Commission (FERC). 156 FERC ¶ 61,182: Order on Proposed Tariff Revisions; FERC: Washington, DC, USA, 2016.
- Australian Energy Market Commission (AEMC). National Electricity Rules Version 80. Available online: http://www.aemc.gov.au/Energy-Rules/National-electricity-rules/Rules/National-Electricity-Rules-Version-80 (accessed on 12 January 2019).
- Stone, G.; Stranges, M.K.; Dunn, D.G. Common questions on partial discharge testing: A review of recent developments in IEEE and IEC standards for offline and online testing of motor and generator stator windings. IEEE Ind. Appl. Mag. 2015, 22, 14–19. [Google Scholar] [CrossRef]
- IEEE Committee. IEEE Standard for Interconnecting Distributed Resources with Electric Power Systems1547; Institute of Electrical and Electronics Engineers: New York, NY, USA, 2014. [Google Scholar] [CrossRef]
- Al-Shetwi, A.Q.; Sujod, M.Z. Grid-connected photovoltaic power plants: A review of the recent integration requirements in modern grid codes. Int. J. Energy Res. 2018, 42, 1849–1865. [Google Scholar] [CrossRef]
- Alshahrani, A.; Omer, S.; Su, Y.; Mohamed, E.; Alotaibi, S. The technical challenges facing the integration of small-scale and large-scale PV systems into the grid: A critical review. Electronics 2019, 8, 1443. [Google Scholar] [CrossRef] [Green Version]
- Roberts, C. Review of International Grid Codes; Lawrence Berkeley National Laboratory: Berkeley, CA, USA, 2018.
- Rodrigues, E.; Osório, G.; Godina, R.; Bizuayehu, A.; Lujano-Rojas, J.; Catalão, J. Grid code reinforcements for deeper renewable generation in insular energy systems. Renew. Sustain. Energy Rev. 2016, 53, 163–177. [Google Scholar] [CrossRef]
- Honrubia-Escribano, A.; García-Sánchez, T.; Gómez-Lázaro, E.; Muljadi, E.; Molina-Garcia, A. Power quality surveys of photovoltaic power plants: Characterisation and analysis of grid-code requirements. IET Renew. Power Gener. 2015, 9, 466–473. [Google Scholar] [CrossRef]
- Marinopoulos, A.; Papandrea, F.; Reza, M.; Norrga, S.; Spertino, F.; Napoli, R. Grid integration aspects of large solar PV installations: LVRT capability and reactive power/voltage support requirements. In Proceedings of the 2011 IEEE Trondheim PowerTech, Trondheim, Norway, 19–23 June 2011; pp. 1–8. [Google Scholar]
- Hossain, E.; Tür, M.R.; Padmanaban, S.; Ay, S.; Khan, I. Analysis and mitigation of power quality issues in distributed generation systems using custom power devices. IEEE Access 2018, 6, 16816–16833. [Google Scholar] [CrossRef]
- Popavath, L.; Kaliannan, P. Photovoltaic-STATCOM with low voltage ride through strategy and power quality enhancement in a grid integrated wind-PV system. Electronics 2018, 7, 51. [Google Scholar] [CrossRef] [Green Version]
- Castilla, M.; Miret, J.; Camacho, A.; Matas, J.; de Vicuña, L.G. Voltage support control strategies for static synchronous compensators under unbalanced voltage sags. IEEE Trans. Ind. Electron. 2014, 61, 808–820. [Google Scholar] [CrossRef]
- Movahedi, A.; Niasar, A.H.; Gharehpetian, G.B. LVRT improvement and transient stability enhancement of power systems based on renewable energy resources using the coordination of SSSC and PSSs controllers. IET Renew. Power Gener. 2019, 13, 1849–1860. [Google Scholar] [CrossRef]
- Ota, J.I.Y.; Sato, T.; Akagi, H. Enhancement of performance availability and flexibility of a battery energy storage system based on a modular multilevel cascaded converter (MMCC-SSBC). IEEE Trans. Power Electron. 2016, 31, 2791–2799. [Google Scholar] [CrossRef]
- Rohouma, W.; Balog, R.S.; Peerzada, A.A.; Begovic, M.M. D-STATCOM for a Distribution Network with Distributed PV Generation. In Proceedings of the 2018 International Conference on Photovoltaic Science and Technologies (PVCon), Ankara, Turkey, 4–6 July 2018; pp. 4849–4854. [Google Scholar]
- Islam, M.; Mithulananthan, N.; Hossain, J.; Shah, R. Dynamic voltage stability of unbalanced distribution system with high penetration of single-phase PV units. J. Eng. 2019, 2019, 4074–4080. [Google Scholar] [CrossRef]
- Tang, C.-Y.; Kao, L.-H.; Chen, Y.-M.; Ou, S.-Y. Dynamic power decoupling strategy for three-phase PV power systems under unbalanced grid voltages. IEEE Trans. Sustain. Energy 2018, 10, 540–548. [Google Scholar] [CrossRef]
- Rahman, S.; Moghaddami, M.; Sarwat, A.I.; Olowu, T.; Jafaritalarposhti, M. Flicker estimation associated with PV integrated distribution network. In Proceedings of the SoutheastCon 2018, Tampa Bay, FL, USA, 19–22 April 2018; pp. 1–6. [Google Scholar]
- Montoya, F.; Baños, R.; Alcayde, A.; Montoya, M.; Manzano-Agugliaro, F. Power quality: Scientific collaboration networks and research trends. Energies 2018, 11, 2067. [Google Scholar] [CrossRef] [Green Version]
- Geng, Y.; Yang, K.; Lai, Z.; Zheng, P.; Liu, H.; Deng, R. A Novel Low Voltage Ride Through Control Method for Current Source Grid-Connected Photovoltaic Inverters. IEEE Access 2019, 7, 51735–51748. [Google Scholar] [CrossRef]
- Islam, S.U.; Zeb, K.; Din, W.U.; Khan, I.; Ishfaq, M.; Hussain, A.; Busarello, T.D.C.; Kim, H.J. Design of robust fuzzy logic controller based on the levenberg marquardt algorithm and fault ride trough strategies for a grid-connected PV system. Electronics 2019, 8, 429. [Google Scholar] [CrossRef] [Green Version]
- Tarafdar Hagh, M.; Khalili, T. A review of fault ride through of PV and wind renewable energies in grid codes. Int. J. Energy Res. 2019, 43, 1342–1356. [Google Scholar] [CrossRef]
- Rey-Boué, A.B.; Guerrero-Rodríguez, N.; Stöckl, J.; Strasser, T.I. Modeling and design of the vector control for a three-phase single-stage grid-connected PV system with LVRT capability according to the Spanish grid code. Energies 2019, 12, 2899. [Google Scholar] [CrossRef] [Green Version]
- Elshahed, M. Assessment of sudden voltage changes and flickering for a grid-connected photovoltaic plant. Int. J. Renew. Energy Res. 2016, 6, 1328–1335. [Google Scholar]
- Silsüpür, M.; Türkay, B.E. Flicker source detection methods based on IEC 61000-4-15 and signal processing techniques—A review. Balkan J. Electr. Comput. Eng. 2015, 3, 93–97. [Google Scholar] [CrossRef]
- Canadian Standards Association (CSA). Interconnection of Distributed Resources and Electricity Supply Systems, CSA C22.3 No. 9-08-R2015. Available online: https://www.csagroup.org/ (accessed on 14 August 2019).
- Colque, J.C.; Azcue, J.L.; Ruppert, E. Photovoltaic system grid-connected with active power filter functions for mitigate current harmonics feeding nonlinear loads. In Proceedings of the 2018 13th IEEE International Conference on Industry Applications (INDUSCON), São Paulo, Brazil, 21–22 December 2018; pp. 208–214. [Google Scholar]
- Memon, M.A.; Mekhilef, S.; Mubin, M.; Aamir, M. Selective harmonic elimination in inverters using bio-inspired intelligent algorithms for renewable energy conversion applications: A review. Renew. Sustain. Energy Rev. 2018, 82, 2235–2253. [Google Scholar] [CrossRef]
- IEEE Std. IEEE Recommended Practice for Utility Interface of Photovoltaic (PV) Systems; IEEE, Ed.; IEEE Std: Piscataway, NJ, USA, 2003; pp. 929–2000. [Google Scholar]
- Schwartfeger, L.; Santos-Martin, D. Review of distributed generation interconnection standards. In Proceedings of the EEA Conference & Exhibition, Auckland, New Zealand, 25–27 June 2019; pp. 18–20. [Google Scholar]
- Bayliss, C.R.; Bayliss, C.; Hardy, B. Transmission and Distribution Electrical Engineering; Elsevier: Amsterdam, The Netherlands, 2012. [Google Scholar]
- Kim, Y. Development and analysis of a sensitivity matrix of a three-phase voltage unbalance factor. IEEE Trans. Power Syst. 2018, 33, 3192–3195. [Google Scholar] [CrossRef]
- Cleveland, F. IEC 61850-7-420 communications standard for distributed energy resources (DER). In Proceedings of the 2008 IEEE, Power and Energy Society General Meeting-Conversion and Delivery of Electrical Energy in the 21st Century, Pittsburgh, PA, USA, 20–24 July 2008; pp. 1–4. [Google Scholar]
- Wu, Y.-K.; Lin, J.-H.; Lin, H.-J. Standards and guidelines for grid-connected photovoltaic generation systems: A review and comparison. IEEE Trans. Ind. Appl. 2017, 53, 3205–3216. [Google Scholar] [CrossRef]
- GB/T. Technical Rule for PV Power Station Connected to Power Grid; Chinese Enterprise Standards; China National Standards: Beijing, China, 2012. [Google Scholar]
- Ghassemi, F.; Perry, M. Review of Voltage Unbalance Limit in the GB Grid Code CC. 6.1. 5 (b); National Grid Report; GB: Beijing, China, 2014. [Google Scholar]
- Dreidy, M.; Mokhlis, H.; Mekhilef, S. Inertia response and frequency control techniques for renewable energy sources: A review. Renew. Sustain. Energy Rev. 2017, 69, 144–155. [Google Scholar] [CrossRef]
- Hamdeen, I.; Saeed, M.A.; Badran, E.A. Voltage Dip’s Mitigation during PV-Grid-Connection Using STATCOM. In Proceedings of the 2018 Twentieth International Middle East Power Systems Conference (MEPCON), Cairo, Egypt, 18–20 December 2018; pp. 760–766. [Google Scholar]
- Khawla, E.M.; Chariag, D.E.; Sbita, L. A control strategy for a three-phase grid connected PV system under grid faults. Electronics 2019, 8, 906. [Google Scholar] [CrossRef] [Green Version]
- Haidar, A.M.; Julai, N. An improved scheme for enhancing the ride-through capability of grid-connected photovoltaic systems towards meeting the recent grid codes requirements. Energy Sustain. Dev. 2019, 50, 38–49. [Google Scholar] [CrossRef]
- Oon, K.H.; Tan, C.; Bakar, A.; Che, H.S.; Mokhlis, H.; Illias, H. Establishment of fault current characteristics for solar photovoltaic generator considering low voltage ride through and reactive current injection requirement. Renew. Sustain. Energy Rev. 2018, 92, 478–488. [Google Scholar] [CrossRef]
- Bozalakov, D.; Laveyne, J.; Desmet, J.; Vandevelde, L. Overvoltage and voltage unbalance mitigation in areas with high penetration of renewable energy resources by using the modified three-phase damping control strategy. Electr. Power Syst. Res. 2019, 168, 283–294. [Google Scholar] [CrossRef]
- Kopicka, M.; Ptacek, M.; Toman, P. Analysis of the power quality and the impact of photovoltaic power plant operation on low-voltage distribution network. In Proceedings of the 2014 Electric Power Quality and Supply Reliability Conference (PQ), Rakvere, Estonia, 11–13 June 2014; pp. 99–102. [Google Scholar]
- Chen, T.-H.; Yang, C.-H.; Yang, N.-C. Examination of the definitions of voltage unbalance. Int. J. Electr. Power Energy Syst. 2013, 49, 380–385. [Google Scholar] [CrossRef]
- Bhukya, M.N.; Kota, V.R.; Depuru, S.R. A simple, efficient, and novel standalone photovoltaic inverter configuration with reduced harmonic distortion. IEEE Access 2019, 7, 43831–43845. [Google Scholar] [CrossRef]


| The Standards | Network | Plt | Pst |
|---|---|---|---|
| IEEE Std. 1547 | MV | 0.7 | 0.9 |
| HV-EHV | 0.6 | 0.8 | |
| UK | MV-HV | 0.65 | 1.0 |
| IEC61000 | MV | 0.8 | 1.0 |
| Malaysian GC | LV (less than 11 kV) | 0.8 | 1.0 |
| MV (11–33) kV | 0.7 | 0.9 | |
| HV (above 33 kV) | 0.6 | 0.8 | |
| USA | LV | 0.7 | 0.9 |
| MV-HV | 0.6 | 0.8 | |
| Brazil | LV-MV | 0.8 | 1.0 |
| Jordan (FICHTNER) | MV-LV | 0.46 | 1.0 |
| The Standards | Type | Harmonic Order (h) | Distortion Limit | THD (%) |
|---|---|---|---|---|
| IEEE 1547 AS 4777.2 (Australia), GB/T (China), and ECM (Malaysia) | Odd | 33 < h | <0.3% | <5% |
| 23 ≤ h ≤ 33 | <0.6% | |||
| 17 ≤ h ≤ 21 | <1.5% | |||
| 11 ≤ h ≤ 15 | <2% | |||
| 3 ≤ h ≤ 9 | <4% | |||
| Even | 10 ≤ h ≤ 32 | <0.5% | ||
| 2 ≤ h ≤ 8 | <1% | |||
| UK (EREC G83 Stds.) | Odd | h = 3, 5, and 7 | <(2.3, 1.14, and 0.77)% | <3% |
| h = 9, 11, and 13 | <(0.4, 0.33, and 0.21)% | |||
| 11 ≤ h ≤ 15 | <0.15% | |||
| Even | h= 2, 4, and 6 | <(1.08, 0.43, and 0.3)% | ||
| 8 ≤ h ≤ 40 | <0.23% | |||
| IEC 61000-3-2 | Odd | h = 3, 5, and 7 | <(3.45, 1.71, and 1.15)% | <5% |
| h = 9, 11, and 13 | <(0.6, 0.5, and 0.3)% | |||
| 15 ≤ h ≤ 39 | <0.225% | |||
| Even | h = 2, 4, and 6 | <(1.6, 0.65, and 0.45)% | ||
| 8 ≤ h ≤ 40 | <0.345% |
| The Standards | Voltage Bus | Max. Individual Harmonics | THD (%) |
|---|---|---|---|
| IEEE 519 | (V ≤ 1) kV | 5% | 8% |
| (1 ≤ V ≤ 69) kV | 3% | 5% | |
| (69 ≤ V ≤ 161) kV | 1.5% | 2.5% | |
| (V > 161) kV | 1% | 1.5% | |
| IEC 61000-3-2 | (2.3 ≤ V ≤ 69) kV | 3% | 5% |
| (69 ≤ V ≤ 161) kV | 1.5% | 2.5% | |
| (V > 161) kV | 1% | 1.5% |
| Requested By | Power Factor Range Point of Common Coupling | |
|---|---|---|
| Lead | Lag | |
| Germany | 0.95 | 0.95 |
| Italy | 0.90 | 0.90 |
| China (GB/T) | 0.95 | 0.95 |
| Spain | 0.85 | 0.85 |
| Australia | 0.9 | 0.95 |
| South Africa | 0.95 | 0.95 |
| Belgian regulation C10/11 | 0.95 | 0.95 |
| PQ Event | Method | Ref. | Fulfillment of the Standards | Limitation of the Method | Proposed Method |
|---|---|---|---|---|---|
| LVRT | Energy storage system | [19] | Yes. Grid is supported by reactive power. | High fluctuation and overshooting; High investment price and short lifestyles cycle; Increase the complexity; Require regular inspection and maintenance | Injected required reactive current; Protect inverter during sag event; Addressed excessive DC voltage. |
| LVRT | STATCOM and SVC | [16,17] | Inject reactive currents and enhance FRT capability | Increase the complexity and cost; Did not address the increasing of DC-link voltage during grid faults; Do not dealt on inverter protection | No extra hardware; Modified inverter controller; Lower cost; Less complexity. |
| THDV | New inverter configuration | [50] | 3.24% | Higher voltage THD than the proposed method | 1.13%. |
| THDI | Active power filter | [32] | 3.46% | Higher current THD than the proposed method | 0.97 |
| Flicker | Novel estimation method | [23] | Pst = 0.72 Plt = 0.16 | Better than the proposed method with respect to Plt, however; for Pst, the proposed method is better | Pst = 0.42 Plt = 0.18 |
| Voltage Unbalance | Dynamic voltage stability control strategy | [21] | VUF% = 2.85 case 3 | The proposed method generated better results. | VUF% = 0.6 |
© 2020 by the authors. Licensee MDPI, Basel, Switzerland. This article is an open access article distributed under the terms and conditions of the Creative Commons Attribution (CC BY) license (http://creativecommons.org/licenses/by/4.0/).
Share and Cite
Al-Shetwi, A.Q.; Hannan, M.A.; Jern, K.P.; Alkahtani, A.A.; PG Abas, A.E. Power Quality Assessment of Grid-Connected PV System in Compliance with the Recent Integration Requirements. Electronics 2020, 9, 366. https://doi.org/10.3390/electronics9020366
Al-Shetwi AQ, Hannan MA, Jern KP, Alkahtani AA, PG Abas AE. Power Quality Assessment of Grid-Connected PV System in Compliance with the Recent Integration Requirements. Electronics. 2020; 9(2):366. https://doi.org/10.3390/electronics9020366
Chicago/Turabian StyleAl-Shetwi, Ali Q., M A Hannan, Ker Pin Jern, Ammar A. Alkahtani, and A. E. PG Abas. 2020. "Power Quality Assessment of Grid-Connected PV System in Compliance with the Recent Integration Requirements" Electronics 9, no. 2: 366. https://doi.org/10.3390/electronics9020366