Article

A Second-Order Cone Programming Reformulation of the Economic Dispatch Problem of BESS for Apparent Power Compensation in AC Distribution Networks

by
Oscar Danilo Montoya
1,2,
Walter Gil-González
3,
Federico Martin Serra
4,
Jesus C. Hernández
5,* and
Alexander Molina-Cabrera
6
1
Facultad de Ingeniería, Universidad Distrital Francisco José de Caldas, Bogotá D.C 11021, Colombia
2
Laboratorio Inteligente de Energía, Universidad Tecnológica de Bolívar, Cartagena 131001, Colombia
3
Grupo GIIEN, Facultad de Ingeniería, Institución Universitaria Pascual Bravo, Campus Robledo, Medellín 050036, Colombia
4
Laboratorio de Control Automático (LCA), Facultad de Ingeniería y Ciencias Agropecuarias, Universidad Nacional de San Luis, Villa Mercedes, San Luis 5730, Argentina
5
Department of Electrical Engineering, University of Jaén, Campus Lagunillas s/n, Edificio A3, 23071 Jaén, Spain
6
Facultad de Ingenierías, Universidad Tecnológica de Pereira, Pereira 660003, Colombia
*
Author to whom correspondence should be addressed.
Electronics 2020, 9(10), 1677; https://doi.org/10.3390/electronics9101677
Submission received: 15 September 2020 / Revised: 5 October 2020 / Accepted: 7 October 2020 / Published: 14 October 2020
(This article belongs to the Special Issue New Technologies for Smart Distribution Grid)

Abstract

:
The problem associated with economic dispatch of battery energy storage systems (BESSs) in alternating current (AC) distribution networks is addressed in this paper through convex optimization. The exact nonlinear programming model that represents the economic dispatch problem is transformed into a second-order cone programming (SOCP) model, thereby guaranteeing the global optimal solution-finding due to the conic (i.e., convex) structure of the solution space. The proposed economic dispatch model of the BESS considers the possibility of injecting/absorbing active and reactive power, in turn, enabling the dynamical apparent power compensation in the distribution network. A basic control design based on passivity-based control theory is introduced in order to show the possibility of independently controlling both powers (i.e., active and reactive). The computational validation of the proposed SOCP model in a medium-voltage test feeder composed of 33 nodes demonstrates the efficiency of convex optimization for solving nonlinear programming models via conic approximations. All numerical validations have been carried out in the general algebraic modeling system.

1. Introduction

One of the systems utilized for the purpose of improving the operation of alternative current (AC) distribution networks is battery energy storage systems (BESSs), since they generate some benefits in the networks [1,2], such as reducing losses in the electrical network, lessening operating costs, improving voltage profiles, and compensating power oscillations generated by the high variability of wind speed and solar radiation from renewable energy sources [3,4,5]. Hence, the operation of BESSs has a significant impact on the performance of the AC distribution network since their inadequate operation can cause excessive cost in operation, deterioration of voltage profile, or increments of power oscillations [5]. For this reason, the economic dispatch of BESSs is an important topic to study and analyze [6,7].
There are also other forms of energy storage that can improve the operation of AC networks, such as supercapacitor energy storage systems (SCES) [8], flywheel energy storage system (FESS) [9], superconducting energy storage systems (SMES) [10], pumped hydroelectric storage (PHS) [11], and compressed air energy store (CAES) [12]. However, the use of BESSs for the economic dispatch problem in AC distribution networks is more suitable, since the BESS presents some advantages in resolving this problem [1]. In the case of the SCES, FESS, and SMES, the discharge time duration at the rated power for these systems is very fast, between milliseconds and minutes, while for this problem, the time operation must carry on for hours or days [11]. In case of PHS and CAES, the duration of the discharge time at nominal power is adjusted to the operating times for the economic dispatch problem. However, their rated powers can be very high for this problem and their efficiencies are lower than the BESS, which makes them unsuitable [11]. Hence, the BESS can solve the economic dispatch with lower inversion costs and greater efficiency than other energy storage technologies.
Conversely, the growing integration of renewable energy sources (e.g., solar and wind power generators) in AC distribution networks compels the utilities to confront operational and technical challenges [13,14]. This is due to the fact that renewable energy sources are required to be adequately integrated into AC distribution systems, and if the integration is not carried out properly, it can lead to operational problems in AC distribution networks [15,16,17]. These problems may include worsening of voltage profiles, overload on transmission lines, or power losses increment [18]. In the case of voltage profiles and their stability, voltage control is a fundamental topic in AC grids where various strategies have been studied in order to keep renewable energy sources connected to the networks when the occurring voltage drops [19]. These renewable sources must support faults and low-voltage situations to avoid a system blackout. Overload on transmission lines can happen if dispatching of the renewable source power injection in a node or area of the AC network is conducted in an uncoordinated form [20]. This could unnecessarily increase the power flow through transmission lines. The power losses in the AC networks can increase if the integration and dispatch of renewable energy sources are not appropriately executed [21]. Hence, the optimal operation of renewable energy sources is required. Additionally, they must harmoniously operate with the BESS in order to have an operational efficiency in AC distribution networks [18]. Due to this, the demand peaks do not necessarily coincide with the generation peaks [22]. Therefore, the BESS must be well-coordinated with solar and wind power generators in order to absorb energy from AC system when the generation is greater than the demand. In the opposite case, the BESS delivers energy to the system [23].
Consequently, it is necessary to propose strategies for the optimal operation of the BESS and renewable energy sources in AC distribution networks in order to minimize their energy losses or operating costs without compromising the quality of service [24]. Furthermore, these possible strategies must consider the optimal management of reactive power flow that is allowed by power electronic devices in order to enhance the voltage profiles and to reduce power losses in AC distribution systems [5].
Several strategies have been proposed for the optimal economic dispatch of BESSs and renewable energy sources in AC distribution networks. In [25], a nonlinear formulation for the optimal operation of BESSs was described. However, the BESS only managed active power flow, limiting the AC distribution network’s performance improvement. In [26], a mixed-integer conic programming model was utilized for the planning and operation of distributed generators and the BESS in the AC distribution network. The K-means clustering method was employed to predict the uncertainties of renewable power generations. At the same time, the BESS dispatch was computed with the mixed-integer conic programming model. However, the BESS was only operated considering active power flow. In [5], a methodology based on a master-slave strategy using genetic algorithms was developed for the optimal selection, dimensioning, and operation of BESSs in AC distribution networks. Nevertheless, BESSs were operated in a discrete form that decreased their impact on the performance of the AC distribution network. Furthermore, renewable energy sources were considered in this methodology. In [27], an optimal programming approach for BESSs, which took into account the converter’s active and reactive power capabilities, was presented. This approach used a linearization for load flow analysis, which led to errors in the calculation of the voltage profile and power losses. In addition, this approach did not consider renewable energy sources in its analysis. In [28], a flexible economic dispatch strategy was designed for the BESS under day-ahead environments. For renewable power generation forecasting, an artificial neural network was employed. However, the economic dispatch strategy was focused on a unique nodal, which limits its analysis. Furthermore, the possibility of dispatching reactive energy was not considered. In [29], a peak-shaving service approach for BESSs in AC distribution networks was proposed. This approach, however, only analyzed a unique nodal dispatch. In [15], an economic-dispatch model for optimal operation of BESS, considering the reactive power capabilities, was proposed.
Unlike these previous works, we propose a second-order cone programming (SOCP) model for addressing the economic dispatch problem of the BESS, considering the apparent power compensating capabilities (i.e., active and reactive power dispatch independently). The SOCP model transforms the nonlinear nonconvex economic dispatch problem into a convex problem, ensuring the global optimum for the economic dispatch problem. The main contributions of this proposal are summarized below:
(a)
The convex reformulation of the classical and well-known economic dispatch problem via conic programming by applying the hyperbolic relaxation of the power balance equations, which has not previously reported in the literature pertaining to economic dispatch analyses in AC distribution networks;
(b)
The validation of the positive impacts that have the usage of the apparent power capabilities in batteries to reduce the energy purchasing costs in conventional sources, which allows additional improvements of about 2% when it comes to classical unity power factor scenarios for the operation of BESSs.
It is important to mention that the numerical results reported in this research, in general, coincide with the large-scale nonlinear solvers available in the GAMS software. However, the nonlinear nonconvex structure of the original NLP model affects the processing time behaviors of these solvers, and there does not exist a theoretical guarantee of reaching the global optimum unlike the case of the proposed SOCP reformulation addressed in this paper, which corresponds indeed with the main contribution of this research work.
The remainder of this study is organized as follows: Section 2 presents the original NLP programming formulation for operating batteries in AC distribution networks, considering the apparent power support capabilities. Section 3 reports the SOCP reformulation of the economic dispatch problem in AC distribution networks considering BESSs with active and reactive power compensation capabilities. This reformulation is based on the hyperbolic relaxation of the product between two variables. Section 4 presents the possibility of controlling the active and reactive power in three-phase distribution networks with batteries interfaced with voltage source converters via passivity-based control theory. 
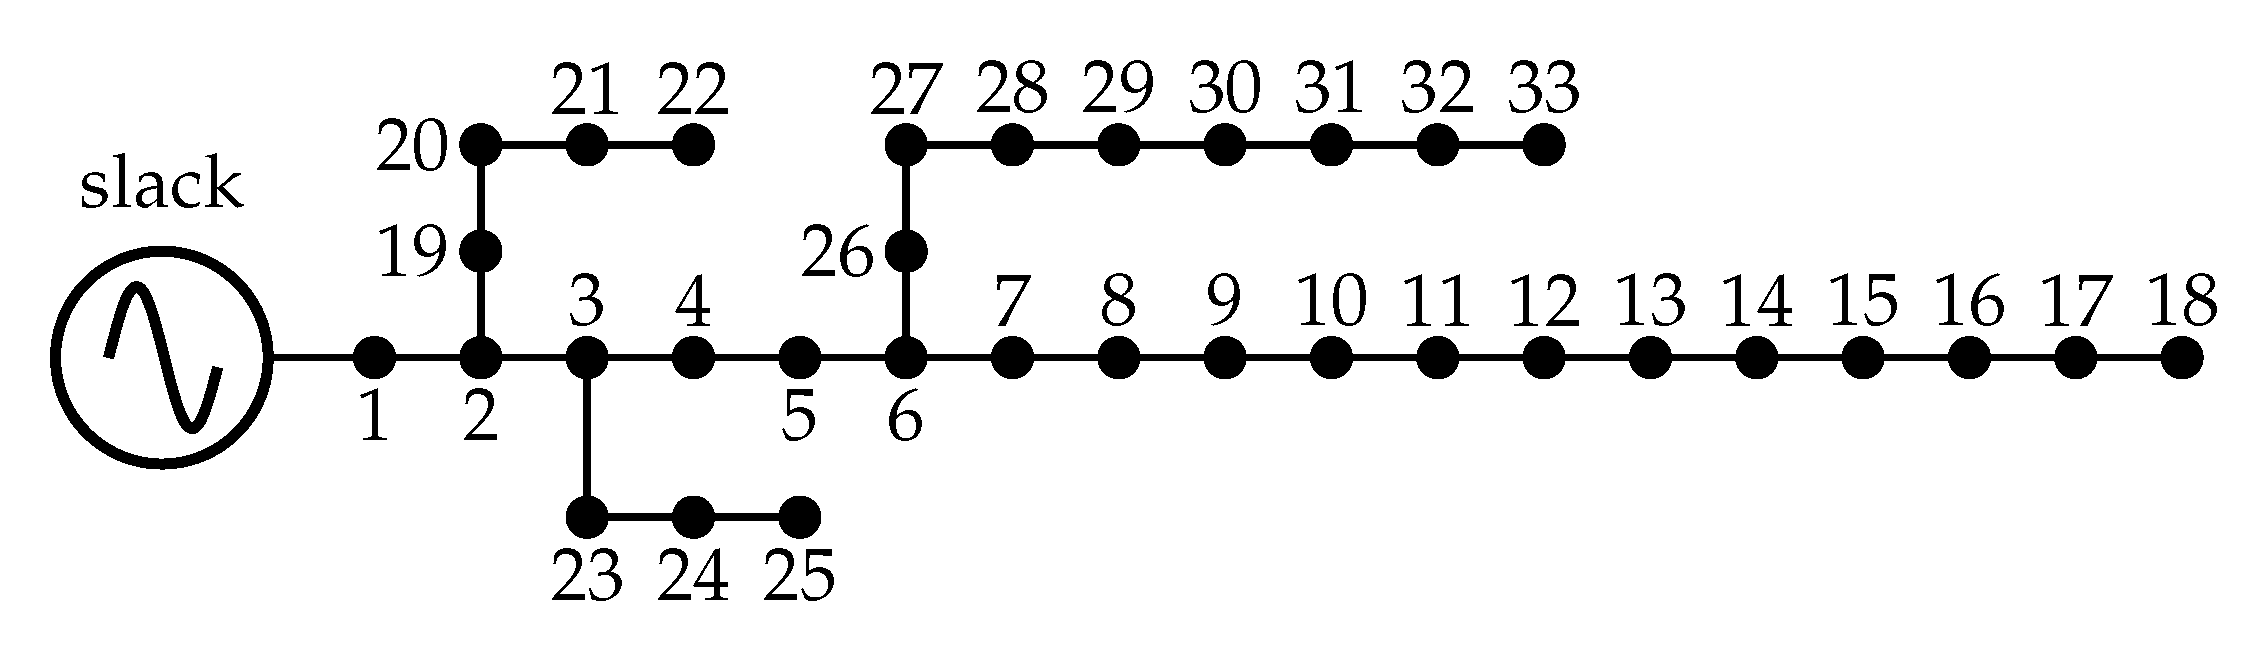
Section 5 presents the main characteristics of the distribution test feeder, which is composed of 33 nodes and 32 lines, contains four renewable generators and three BESSs, and is operated at medium-voltage levels with 12.66 kV. Section 6 presents all the computational validations of the proposed SOCP model for optimal operation of BESSs systems in the 33-node test feeder considering the unity and variable power factor in batteries and variations in the renewable generation penetration. Section 7 presents the main conclusions derived from this work and some possible future research based on the SOCP optimization model studied in this paper.

2. Nonlinear Programming Formulation

The optimal operation of battery energy storage systems in AC distribution networks corresponds to a nonlinear programming optimization model with continuous variables in terms of voltage profiles, power generations, or states-of-charges. The typical objective function is the minimization of the energy purchase cost in the conventional sources (i.e., substations or diesel generators), subject to power balance equations, states-of-charge in batteries, voltage regulation bounds, and power generation capabilities, among others. The complete mathematical formulation of the optimal operation of battery energy storage systems in AC distribution networks considering reactive power capabilities was presented in [15].

2.1. Objective Function

The objective function of the problem of the economic dispatch operation of BESSs and AC grids with high penetration of renewable energy resources is typically an economic aspect. In this study, we consider minimizing the spot market’s energy purchase, where the utility company participates. The objective function of this problem corresponds with a linear expression as a power generation function in conventional sources.
min E cost = t = 1 T i = 1 N g c c i , t g c p i , t g c Δ T ,
where E cost is the objective function value; c i , t g c and p i , t g c represent, respectively, the cost of the power generation and the power output in a conventional generator installed at node i in the period of time t; and Δ T is the fraction of time under analysis, which, in economic dispatch analysis for distribution networks, can be 0.25 h, 0.50 h, and 1 h. However, the selection of this length of the period of time depends on the available information regarding power consumption and renewable generation. T and N g c correspond to the number of periods considered in the day-ahead economic dispatch and the amount of conventional generators inside of the distribution network, respectively.

2.2. Set of Constraints

The most classical constraints in power system analysis regarding distribution networks correspond to power balance equations, which evaluates the second Tellegens’ theorem at each node regarding active and reactive injections at node i in the period of time t. In addition, we add the classical voltage regulation constraint that deals with the operative limits of the voltage profile in AC distribution grids. These constraints take the following structure:
p i , t g c + p i , t g d + p i , t b p i , t d = v i , t j = 1 n Y i j v j , t cos θ i , t θ j , t + δ i j , t T , i N
q i , t g c + q i , t g d + q i , t b q i , t d = v i , t j = 1 n Y i j v j , t sin θ i , t θ j , t + δ i j , t T , i N
v i min v i , t v i max , t T , i N .
where p i , t g c and q i , t g c correspond to the active and reactive power outputs in the conventional power sources connected at node i at the period of time t. p i , t g d and q i , t g d respectively represent the active and reactive power outputs of the distributed generators connected to node i at the period of time t; p i , t b and q i , t b are, respectively, the active and reactive power injections/consumption of the batteries energy storage devices connected at node i in the period of time t; p i , t d and q i , t d are the active and reactive power consumption at node i at time t, respectively; v i , t and θ i , t are the voltage magnitude and angle of the voltage profile at node i at the period t; Y i j and δ i j correspond to the admittance magnitude and angle that relates nodes i and j; and v i min and v i max are, respectively, the minimum and maximum voltage limits allowed for the voltage profile at each node at each period of time.
In order to study the economic dispatch problem in AC distribution networks in the presence of battery energy storage systems including reactive power capabilities as well as renewable generation sources, the following constraints must be added to the mathematical optimization model:
s o c i , t b = s o c i , t 1 b φ i b p i , t b Δ T , t T , i N ,
p i , t b 2 + q i , t b 2 s i b , max 2 , t T , i N ,
p i , t b , min p i , t b p i , t b , max , t T , i N ,
s o c i b , min s o c i , t b s o c i b , max , t T , i N ,
p i , t g d , min p i , t g d p i , t g d , max , t T , i N ,
where s o c i , t b is the state-of-charge of the energy storage device connected at node i at the time t; φ i b is the efficiency of the charging/discharging performance of the battery at node i (this corresponds to the most basic linear model for operating batteries initially reported in [30]); and s o c i b , min and s o c i b , min are the minimum and maximum limits of the state-of-charge variable (to ensure the useful life of the battery, these are typically greater than zero and lower than one). Observe that p i , t b , min and p i , t b , max represent the active power bounds of the energy storage devices and s i b , max is the maximum apparent power transference capability of the energy storage device connected to node i. Finally, p i , t g d , min and p i , t g d , max correspond to the minimum and maximum power bounds of the renewable energy resources connected at node i at each period of time.
The complete interpretation of the mathematical Equations (1)–(9) for the problem of the economic dispatch of the BESS in distribution networks is as follows: Equation (1) defines the objective function calculation for the total energy purchase costs of energy in conventional power sources (i.e., spot electricity market) for a day of operation of the distribution system. Equations (2) and (3) define the active and reactive power balance equilibrium at each node, which corresponds with Kirchhoff’s laws in the form of power. Box-type constraint (4) defines the region of the admissibility of the voltage profiles. This constraint is typically known as the voltage regulation constraint in scientific literature. Equation (5) defines the linear relation between the BESS charging/discharging coefficient with the state-of-charge and the amount of power absorbed from/injected into the grid at each period of time. The inequality constraint (6) defines the power triangle of powers, i.e., active, reactive, and apparent, which must be satisfied at each time by the BESS system in order to ensure the correct operation of the power electronic converters that interface them to the power grid. Box-type constraints (7)–(9) determine the admissible region for active power in batteries as well as their states-of-charge and the amount of power available in the renewable energy resources, respectively.
Remark 1.
The mathematical model that represents the economic dispatch problem of the BESS in AC distribution networks (see the model (1)–(9)) is nonlinear and nonconvex due to the active and reactive power balance constraints defined in (2) and (3); this complicates the finding of the global optimal solution due to the nonconvexities of the solution space [31]. However, this model can be convexified via SOCP reformulation in the complex domain. This will be presented in the next section.
It is essential to highlight that the inequality constraint (6) is nonlinear but convex, since it corresponds to the circle of powers where its border and inside are free of holes [32].

3. Second-Order Cone Programming Reformulation

The SOCP programming is a branch of the convex optimization that deals with a class of optimization problems with conic structures that can be solved efficiently via interior point methods [33]. The main idea of reformulating the economic dispatch optimization problem into a SOCP equivalent is to rewrite the power balance constraints (2) and (3) into a linear equivalent via hyperbolic relaxations [34]. In order to do so, let us rewrite these power balance equations in their complex form:
S i , t g c + S i , t g d + S i , t b S i , t d = V i , t j = 1 n Y i j V j , t , t T , i N
where S i , t g c = p i , t g c + j q i , t g c is the apparent power generation at conventional sources; S i , t g d = p i , t g d + j q i , t g d corresponds to the apparent power generation in the renewable energy resources; S i , t b = p i , t b + j q i , t b is the apparent power injection/absorption in the batteries; S i , t d = p i , t d + j q i , t d represents the apparent power consumption in load nodes; V i , t is the complex voltage profile, with ( · ) being the complex conjugate operation of the argument; and Y i j is the complex admittance component that relates nodes i and j, respectively.
In order to transform the complex apparent power balance constraint (10) into a linear convex restriction, let us define the following auxiliary variable:
U i j , t = V i , t V j , t .
Note that, from (11), we can define U i i , t = V i , t 2 and U j j , t = V j j , t 2 , which implies that if we elevate Equation (10) in both sides at square, then we have
U i j , t 2 = V i , t 2 V j , t 2 = U i i , t U j j , t .
The structure of Equation (12), which corresponds to the product between two auxiliary variables on the right-hand side, can be rewritten as recommended in [35], through its hyperbolic representation, as follows:
U i j , t 2 = U i i , t U j j , t = 1 4 U i i , t + U j j , t 2 1 4 U i i , t U j j , t 2 2 U i j , t 2 + U i i , t U j j , t 2 = U i i , t + U j j , t 2 , 2 U i j , t U i i , t U j j , t = U i i , t + U j j , t .
Note that Equation (13) is still nonconvex due to the equality symbol; however, as recommended in [35], it is possible to relax this expression by changing the equality symbol with a lower-equal one, which allows for the translation of this equation into a conic-convex constraint:
2 U i j , t U i i , t U j j , t U i i , t + U j j , t .
In order to complete the SOCP programming reformulation of apparent power balance constraints, let us substitute Expression (11) into (10), which produces
S i , t g c + S i , t g d + S i , t b S i , t d = j = 1 n Y i j U i j , t , t T , i N
This can be split into its real and imaginary part as follows ( U i j , t = U i j , t r + j U i j , t i ):
p i , t g c + p i , t g d + p i , t b p i , t d = j = 1 n G i j U i j , t r B i j U i j , t i , t T , i N
q i , t g c + q i , t g d + q i , t b q i , t d = j = 1 n B i j U i j , t r + G i j U i j , t i , t T . i N
where Y i j = G i j + j B i j .
In addition, the voltage regulation constraint (4) can be redefined as a function of the auxiliary variables in the following manner:
v i min 2 U i i , t v i max 2 , t T . i N .
Finally, the inequality constraint (6) can be rewritten using the conic form as presented below:
p i , t b q i , t b s i b , max , t T , i N .
Remark 2.
After the convexification of the power balance constraints, the SOCP model that represents the economic dispatch problem of the batteries in the AC distribution systems considering apparent power compensation and high penetration of renewables is defined by the set of Equations (1), (5), (7)–(9), (14), and (16)–(19), respectively.

4. Dynamic Active and Reactive Power Control

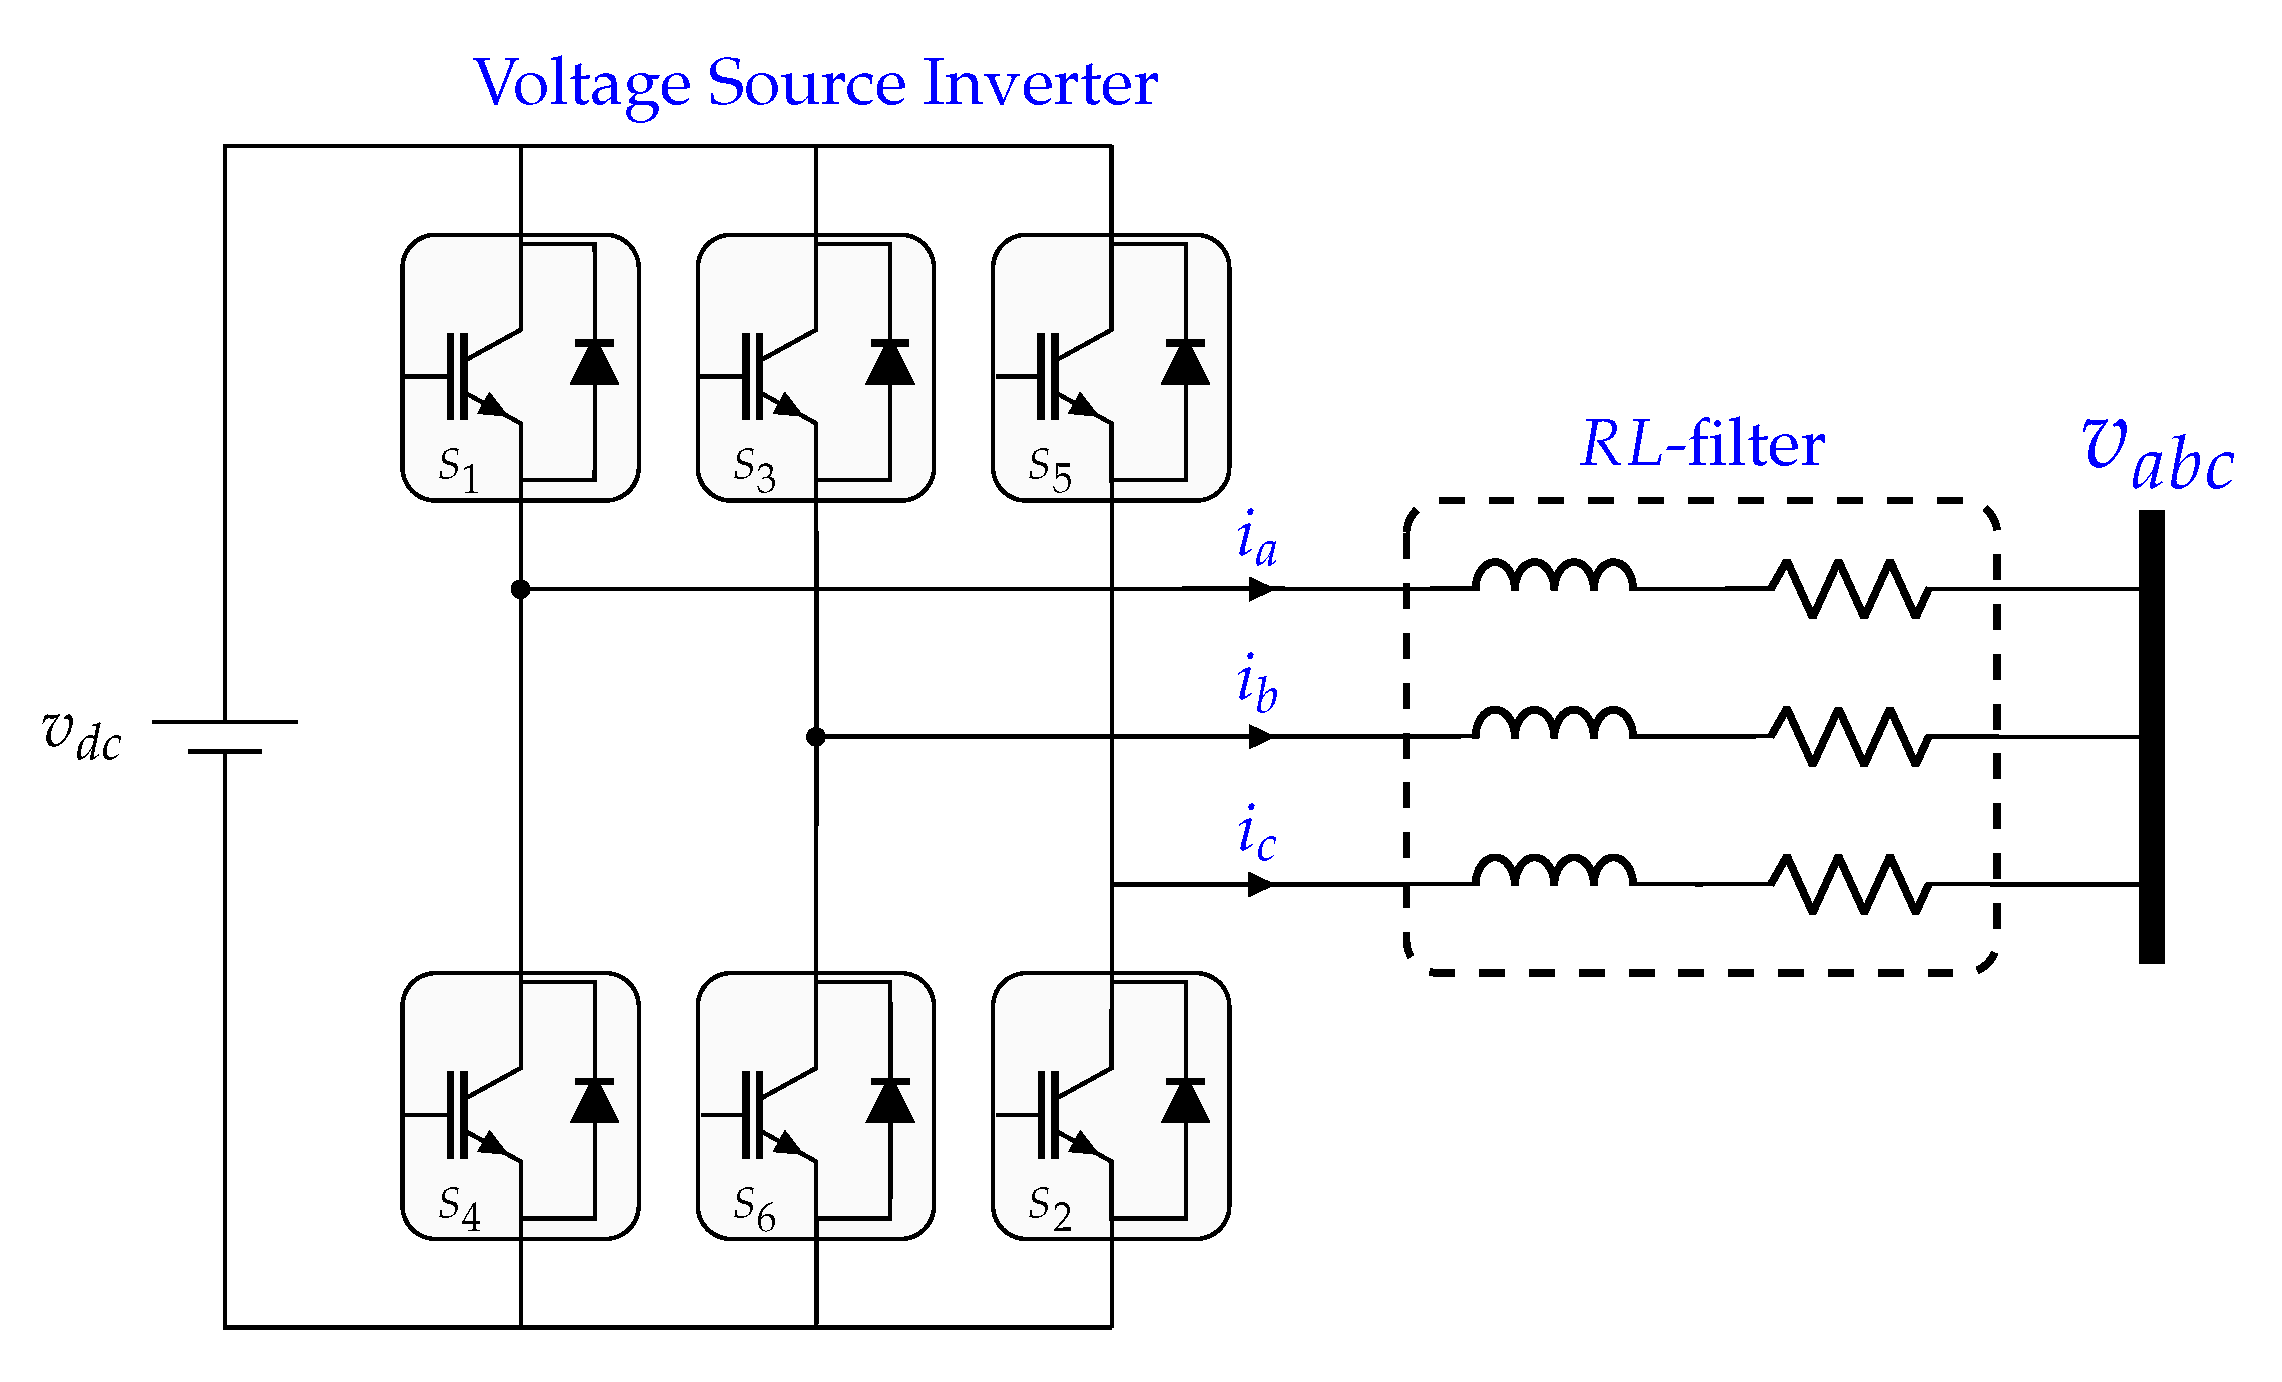
In order to demonstrate the possibility of controlling the active and reactive power of a form independent considering a BESS connected to an electrical AC distribution network, consider the interconnection of this battery via a voltage source converter (VSC) as depicted in Figure 1.
For the purpose of reaching the dynamical model of the BESS connected to the distribution network, we apply the second Kirchhoff’s law on the AC side, which produces in the Park reference frame the following expressions [36]:
l d d t i d = r i d + ω l i q + v b m d v d ,
l d d t i q = r i q ω l i d + v b m q v q ,
where l and r are the parameters of the resistive-inductive (RL) filter, i d and i q correspond to the currents flowing through the filter in the d q -reference frame, m d and m q represent the average the modulation indexes, v d and v q are the voltages of the AC network, and ω corresponds to the angular frequency of the grid voltages.
Note that, if we consider balanced operative conditions in the AC distribution network, the dynamical model (20) can be transformed into a model with active and reactive power variables, i.e., p and q, by considering that, under balanced grid voltage conditions, v q = 0 , which implies that
p = v d i d d d t p = v d d d t i d ,
q = v d i q d d t p = v d d d t i q ,
Now, if (20) is substituted in (21) and we make some algebraic operations, we find the following result:
l d d t p = r p ω l q + v m d v d 2 ,
l d d t q = r q + ω l p v m q ,
where v = v b v d . Additionally, the direct power model (22) can be expressed as a port-Hamiltonian system with the following structure:
D x ˙ = J R H x + g u + ζ ,
where D is known as the inertia matrix by its similitude with mechanical systems, J represents the interconnection matrix that is skew-symmetric, R is the damping matrix being positive semi-definite, H x is the Hamiltonian function, G represents the input matrix, ζ constitutes the vector of external perturbations, and x and u correspond to the state variables and control inputs, respectively. Note that each term in (23) is defined as follows:
D = l 0 0 l , J R = r ω l ω l r , G = v 1 0 0 1
u = m d m q , x = p q , ζ = v d 2 0 , H x = 1 2 x T x ,
Observe that the Hamiltonian function H x is a positive definite function with a hyperboloidal structure, which can be used to explore the stability properties of the dynamical model (23).
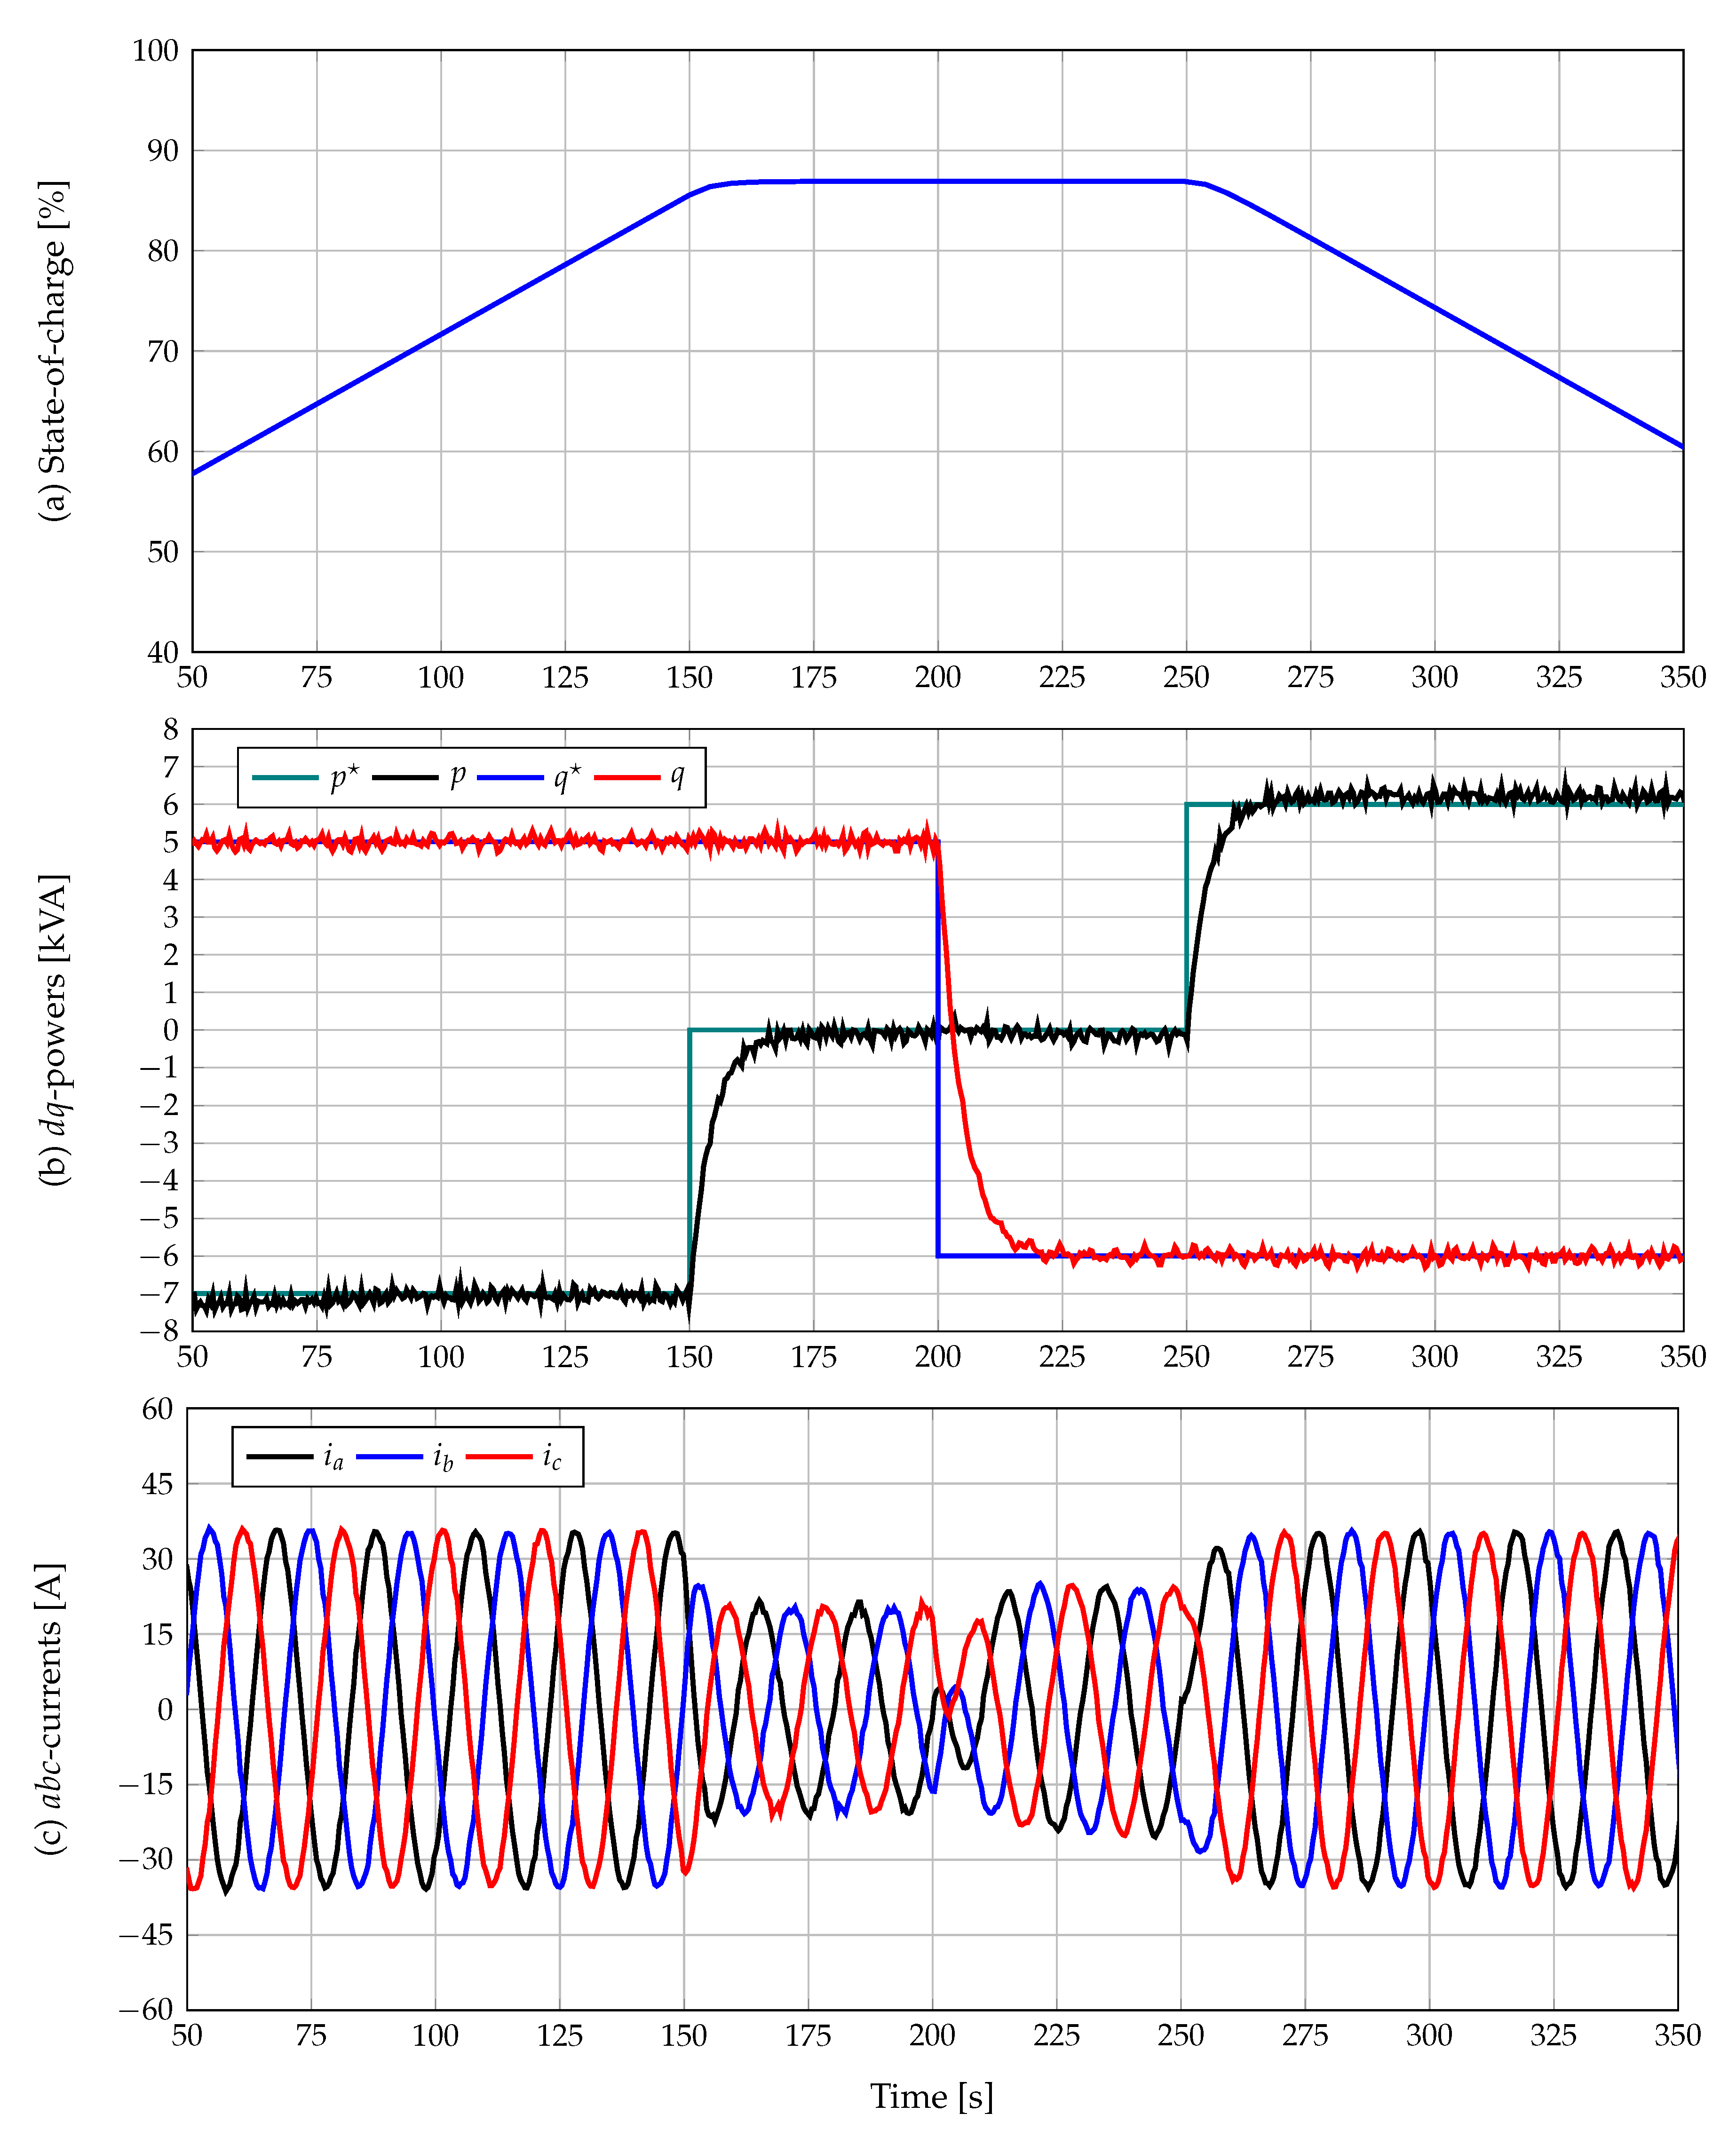
Remark 3.
The control of the Hamiltonian model that represents the connection of a battery package to the AC grid via a voltage source converter can be made via the passivity-based control theory as demonstrated [37], guaranteeing global asymptotic convergence properties in the sense of Lyapunov [38]. The control laws developed via the passivity-based theory for active and reactive power independent control are presented below [38]:
m ˜ d = k p 1 v p p k i 1 v 0 t p p d t ,
m ˜ q = k p 2 v p p + k i 2 v 0 t q q d t ,
m d = 1 v r p + ω l q + v d 2 ,
m q = 1 v r q ω l p .
where the complete control laws are m d = m ˜ d + m d and m q = m ˜ q + m q [39]. Note that k p 1 , k p 2 , k i 1 , and k i 2 are the proportional and integral gains with a must-be positive definite.
In order to demonstrate the fact that the passivity-based control design can independently control active and reactive power, consider the BESS and filter parameters reported in Table 1. In addition, we consider that the battery charges with 7 kW between 0 ms and 150 ms; then, this battery is operated in repose ( 150 ms and 250 ms). Finally, it discharges with 6 kW after 250 ms, while the reactive power is defined to be 5 kVAr while t 200 ms, and −6 kVAR otherwise in the d q reference frame. The performance of the passivity-based controller is reported in Figure 2.
Regarding battery parametrization, it was assumed that it operates with 390 V as nominal voltage, a current rate capability of about 0.75 Ah, and an initial state-of-charge of about 45 % . All of these parameters have been taken from [40].
From Figure 2, we can observe that the active and reactive power can be controlled independently in four quadrants with step-responses of about 15 ms (see Figure 2b). In addition, the three-phase currents present a phase inversion at t = 200 ms since, at this moment, the active power is zero and the reactive power passes from a positive to a negative value. For this simulation case, the maximum THD is 4.40 % for the period comprehended between 150 ms and 200 ms; nevertheless, this THD is in the international range standards and fulfills grid-code requirements. It is worth mentioning that, as presented in Figure 2a, the state-of-charge of the battery energy storage system is only dependent on the amount of active power interchanged with the AC grid (compare with Figure 2b), since we observe that, when p < 0 , the s o c increases, when p = 0 , the s o c is constant and, when p > 0 , the s o c decreases. These behaviors are especially important when batteries are incorporated into the AC grid, as it is possible to support active and reactive power in four quadrants by adequately controlling the VSC that interfaces the battery package.
Remark 4.
Note that the capability of using a BESS to control active and reactive power independently is exploited in this research as proposed in [15] with the main advantage that the complete optimization model has a convex structure that allows ensuring the optimum global.

5. Test Systems

In order to validate the proposed SOCP model for optimal operation of battery energy storage systems in AC distribution networks using a day-ahead economic dispatch approach, we consider two test distribution test feeders composed of 33 and 69 nodes, respectively, both with radial topology. The information regarding these test feeders has been taken from [15].

5.1. 33-Node Test Feeder

This is a radial test system composed of 33 nodes and 32 lines, which operates with a unique substation with a voltage profile of 12.66 kV. The total demand at the peak hour for this test system is 3715 kW and 2300 kVAr. Figure 3 depicts the electrical interconnection among all the nodes, and Table 2 presents the relevant information from left to right as follows: sending node, receiving node, resistance, reactance of the line, and active and reactive power consumed at the receiving node.

5.2. 69-Node Test Feeder

This test feeder is composed of 69 nodes and 68 branches, with an operative voltage of 12.66 kV at the substation, which is located at node 1. The amounts of active and reactive power consumption in this test feeder are 3890.7 kW and 2693.6 kVAr, respectively. The electrical configuration of this test feeder regarding nodal connections is presented in Figure 4. In addition, all the branches and nodal information regarding active and reactive power are reported in Table 3, where columns have the same interpretation of the 33-node test system.

5.3. Renewable Energy Behavior

In order to deal with the stochastic variations of the renewable energy behavior, in this work of research, we implement the forecasting methodology reported in [15], which is based on recursive neural networks to predict the renewable power output with a length of 24 h considering as inputs humidity, pressure, time, and wind speed for wind power generation, and solar radiation, time, and temperature for a photovoltaic generation. The renewable generation power curves considered in this work are presented in Figure 5; they have been taken from [38].
Note that, in the case of renewable generation, cost and demand curves are plotted in Figure 5. We consider that, for the 33-node test feeder, (1), the photovoltaic sources PV 1 and PV 2 are connected at nodes 13 and 25 with nominal generation capacities of 450 kW and 1500 kW, respectively; (2) the wind turbines WT 1 and WT 2 are connected at nodes 13 and 30 with maximum power generation rates of 825 kW and 1200 kW, respectively; (3) regarding the 69-node test feeder, the photovoltaic plant PV 1 and the wind generator WT 2 with nominal rates of 1050 kW and 1000 kW are connected at node 12. Additionally, the second photovoltaic generator PV 2 is connected to the node 22 with a power rate of 850 kW and the second wind turbine WT 2 is connected at the node 61 with a nominal power capacity of 760 kW; (4) the costs of the energy at the slack node is assumed as the energy cost reported by CODENSA utility from Colombia in May 2019, which is COP$/kWh 479.3389 [15]; and (5) the per unit curve regarding the demand plotted in Figure 5b multiplies at each period the peak load consumption reported in Table 2.

5.4. Battery Information

For both test feeders, as reported in [38], it is considered that the utility company has installed three and four batteries. The information regarding these batteries is reported in Table 4.
The distribution of the batteries for each test feeder is reported below:
(a)
In the case of the 33-node test feeder, the batteries installed by the utility are distributed as follows: at node 6, a C-type battery is installed; at node 14, an A-type battery is installed, and at node 31, a B-type battery is installed; and
(b)
For the 69-node test feeder, the four batteries installed by the utility are connected at nodes 40, 64, 16, and 9 of the A, B, C, and D model types, respectively.

6. Computational Validations

In order to solve the general NLP model that represents the problem of optimal operation of battery energy storage systems in AC distribution networks with dynamic active and reactive power capabilities as well as the equivalent SOCP reformulation proposed in this research work, we implement these models in GAMS software by using the nonlinear solver IPOPT on a desk computer INTEL(R) Core(TM) i5-3550, 3.50 GHz, 8 GB RAM with 64-bits Windows 7 Professional.

6.1. Simulations Cases

In order to validate the effectiveness of the proposed SOCP reformulation to operate BESS in distribution networks considering the possibility of supporting active and reactive power in AC distribution systems, we consider the following simulation cases:
  • Case 1 (C 1 ): The operation costs of the distribution network are evaluated by only considering the activation of the distributed generation.
  • Case 1 (C 2 ): The operation costs of the distribution network are evaluated by considering the activation of the distributed generation and the possibility of injecting only reactive power with batteries (zero power factor).
  • Case 2 (C 3 ): The operational cost of the network is evaluated by considering renewable generation and batteries operated with a unity power factor.
  • Case 3 (C 4 ): The operational cost of the network is evaluated in the presence of the distributed generation and batteries operated with apparent power support compensation capabilities.
For simulation cases that consider BESSs, we assume that minimum and maximum states of charge of 10 % and 90 % for ion-lithium are recommended in scientific literature batteries [41]. Additionally, the BESS starts and ends each day with 50% of their charge, as proposed in [25].

6.2. Numerical Performance of the 33-Node Test Feeder

In order to demonstrate the efficiency of the proposed SOCP reformulation for optimal power flow and economic dispatch approaches in AC distribution networks, we simulate the C 1 considering different solvers available in GAMS for NLP problems as well as the proposed SOCP reformulation.
The results in Table 5 demonstrate that the proposed SCOP approach deals with optimal solutions of the economic dispatch problem of batteries in AC distribution networks for the simulation C 1 , which coincides with the solutions reported by different NLP solvers available in GAMS. However, it is essential to mention that the SCIP solver of GAMS, even if it works with NLP models, cannot deal with the solution of the problem, which is attributable to the nonconvex structure of the solution space. In addition, other NLP solvers available in GAMS, such as MOSEK, BARON, and ANTIGONE, cannot solve the exact model since they do not support trigonometric functions. In this sense, an adequate formulation to address the problem of the economic dispatch problem of BESS in distribution networks corresponds to the SOCP proposal since (1) no trigonometric functions appear in this reformulation, (2) the convex structure makes it possible to reach the optimal solution with the speediest convergence (see the third column in Table 5), and (3) the SOCP formulation can be implemented in free software such as Python with the theoretical advantage that the solution reached is indeed the global optimal.
Remark 5.
Due to fact that the solutions reached by the GAMS NLP solvers and the proposed SOCP coincide, ahead in this study, we only report the solutions found by the proposed SOCP reformulation for the remainder simulation cases.
Figure 6 shows the expected energy purchasing costs finally in the 33-node test feeder at each one of the simulation cases.
From Table 6, we can observe the following:
(a)
The integration of the reactive power capabilities of the BESSs in the C 2 reduces the total energy purchasing cost regarding C 1 of about 3.41 % . This is an important improvement since BESSs are generally not for apparent power support.
(b)
The operation of BESSs considering the unity power factor (i.e., C 3 ) allows for reduction of the total energy purchasing costs in the conventional source about 23.14 % , which demonstrates the efficiency of combining BESSs with renewable power sources for active power support in AC distribution networks.
(c)
Simulation C 4 allows an additional improvement regarding C 3 respect to the base case about 2.21 % , which confirms that the usage of the apparent power capabilities in BESSs allows for improvements of the grid performance in relation to energy purchasing costs in conventional sources (i.e., substations and/or diesel generators).
Table 6 reports the grid performance when there are variations in renewable generation availability, which can be associated with cloudy (rainy) or low wind speed days. This table compares C 1 and C 4 for penetrations of renewable generation from 0 % to 120 % .
From Table 6, we can observe the positive impact of the BESS system with apparent power support in improving the performance of the distribution networks since the energy purchasing cost in the conventional power sources as the availability of renewable generation increases. Note that the percentage of improvement in regarding the purchasing costs when compared C 1 and C 4 is an increasing function of the renewable generation penetration and can be understood as a possibility of having 100 % clean energy resources if the combination of renewable generation and batteries allows avoiding (eliminating) the dependency of conventional sources. This situation is critical since the proposed optimization model can be extended to optimal design active distribution networks in urban and rural areas minimizing or eliminating greenhouse gas emissions.

6.3. Numerical Performance of the 69-Node Test Feeder

To validate the SOCP model in the 69-node test feeder, we consider the same simulation scenarios applied to the 33-node test feeder. However, the objective function has been modified to consider the minimization of emissions of CO 2 to the atmosphere during the daily operation. In this sense, the objective function is slightly modified as defined in Equation (25).
min G emissions = t = 1 T i = 1 N g c g i , t g c p i , t g c Δ T ,
where G emissions corresponds to the amount of the CO 2 emitted to the atmosphere measured in pounds-per-day, i.e., l b d a y , and g i , t g c corresponds to the amount of greenhouse emissions per megawatt-hour of generation, which is considered here that for diesel generator is about 1350 lb MWh , as suggested in [38].
Table 7 presents the simulation results for each of the simulation cases 1, 3, and 4, considering that the objective of minimization is given by Equation (25), where the renewable generation is operated under nominal conditions. Note that C 2 is not analyzed since it is not typical that batteries are used only for reactive compensation due to its main purpose in electrical networks is to provide active compensation service [42].
The numerical results in Table 7 shows that, (1) comparing C 1 with C 4 , the greenhouse gas emissions of CO 2 are reduced about 8.49 % and 8.69 % regarding daily operative costs with the inclusion of the battery energy storage systems with apparent power compensation capabilities and, (2) if these results are compared with C 3 , then we observe that the reduction regarding the base case are about 5.55 % , and 6.02 % , which demonstrates the positive effects of including reactive power capabilities of batteries to improve the grid performance of the distribution networks in relation with greenhouse gas emissions and energy purchasing costs, since additional 2.94 % , and 2.67 % where reactive power is introduced, respectively.

6.4. Complementary Analysis

To demonstrate that the SOCP formulation can find the global optimum of the studied problem in contrast to conventional metaheuristic optimization procedures, in this section, we resolve a simplistic optimization problem widely known in the literature as an optimal power flow problem in AC distribution networks [43,44]. This problem is the one-hour equivalent of the economic dispatch problem studied in the mathematical model (1)–(9), which implies that batteries can be assumed at this period as generators or loads; here, we assume that these are under a neutral operative condition, i.e., they do not consume or generate power. For both test feeders, we consider the optimal location of distributed generators reported in multiple articles available in the scientific literature for the 33-node test feeder. These are krill herd algorithm (KHA) [45], loss sensitivity factor simulated annealing (LSFSA) [45], combined genetic algorithm (GA) and particle swarm optimization (PSO) (GA-PSO) [46], teaching-learning based optimization (TLBO) [47], quasi-oppositional teaching-learning-based optimization (QOTLBO) [47], harmony search algorithm with PSO embedded artificial bee colony (HSA-PABC) [48], hybrid intelligent water drops and GA (GA-IWD) [49], heuristic approach (AHA) [50], mutated salp swarm algorithm (MSSA) [51], MINLP model [52], constructive heuristic vortex search algorithm (CHVSA) [53], and the hybrid approach based on the Chu & Beasley genetic algorithm and the vortex-search algorithm (CBGA-VSA) [54]. We also consider these distributed generators with capabilities between 300 kW and 1200 kW for this simulation case.
Table 8 presents the numerical validations of the comparative metaheuristic approaches and the SOCP formulation to solve the problem of the optimal power flow in AC distribution networks.
The numerical simulations in Table 8 highlight that the SOCP programming formulation for the optimal power flow problem finds the global optimal for the different locations of the distributed generators reported in the scientific literature with conventional metaheuristic techniques. Furthermore, only two of them, named MSSA and CBGA-VSA, manage to reach the same solution found by the SOCP model. These results show that only 16.67 % of the tested combinatorial methods can reach the best solution for the optimal power flow problem in the 33-node test feeder. However, this is a very simplified optimization problem compared with the day-ahead economic dispatch problem, including apparent power capabilities in BESS systems, a time-couple problem that includes T couple optimal power flows. Therefore, the studied problem reduces the possibility of finding the global optimal with metaheuristics. While in the case of the SOCP, reformulation always reaches the global solution of the problem due to the solution space’s convex structure [31].
It is worth mentioning that the usage of metaheuristic optimization methods to solve continuous optimization problems in AC distribution networks requires the usage of some heuristic parameters such as population size and number of iterations, among others, that make these methods sensible to the programmer, and their convergence and optimization capabilities can be compromised if these are not correct selected; in addition, to demonstrate the efficiency of these combinatorial methods statistical tests are required that imply higher computational times due to the multiple runs employed on them [55,56]. The main problem is that the optimal solution always varies, even if these variations are slightly. It is no possible to ensure the global optimum finding; however, the proposed SOCP formulation does not require any parametrization strategy and, due to the convex properties of the solution space, it does not require statistical tests since their optimal finding properties are theoretical [35].

7. Conclusions and Future Works

A new reformulation of the economic dispatch problem of battery energy storage with apparent power injection capabilities using second-order cone programming formulation has been proposed in this paper. The main advantage of the SOCP formulations in optimal power flow and economic dispatch analysis is the convex structure of the solution space. This is attained by employing a hyperbolic relaxation of the product between voltage variables in the power balance equations, due to the possibility of being able to guarantee finding the optimal solution and its uniqueness, which is not possible in nonconvex solution spaces.
Numerical validations of the proposed approach in a classical AC distribution test feeder composed of 33 nodes have confirmed the advantages of using the reactive power capabilities of batteries in conjunction with their energy storage capabilities to reduce the total energy purchasing cost in the conventional sources in contrast with the conventional unity power factor operation case with additional improvements of about 2 % (with 100 % penetration of renewable generation). This improvement is essential, economically speaking, since utilities have opportunities for using existing devices in their grids to have additional profits with minimum investment.
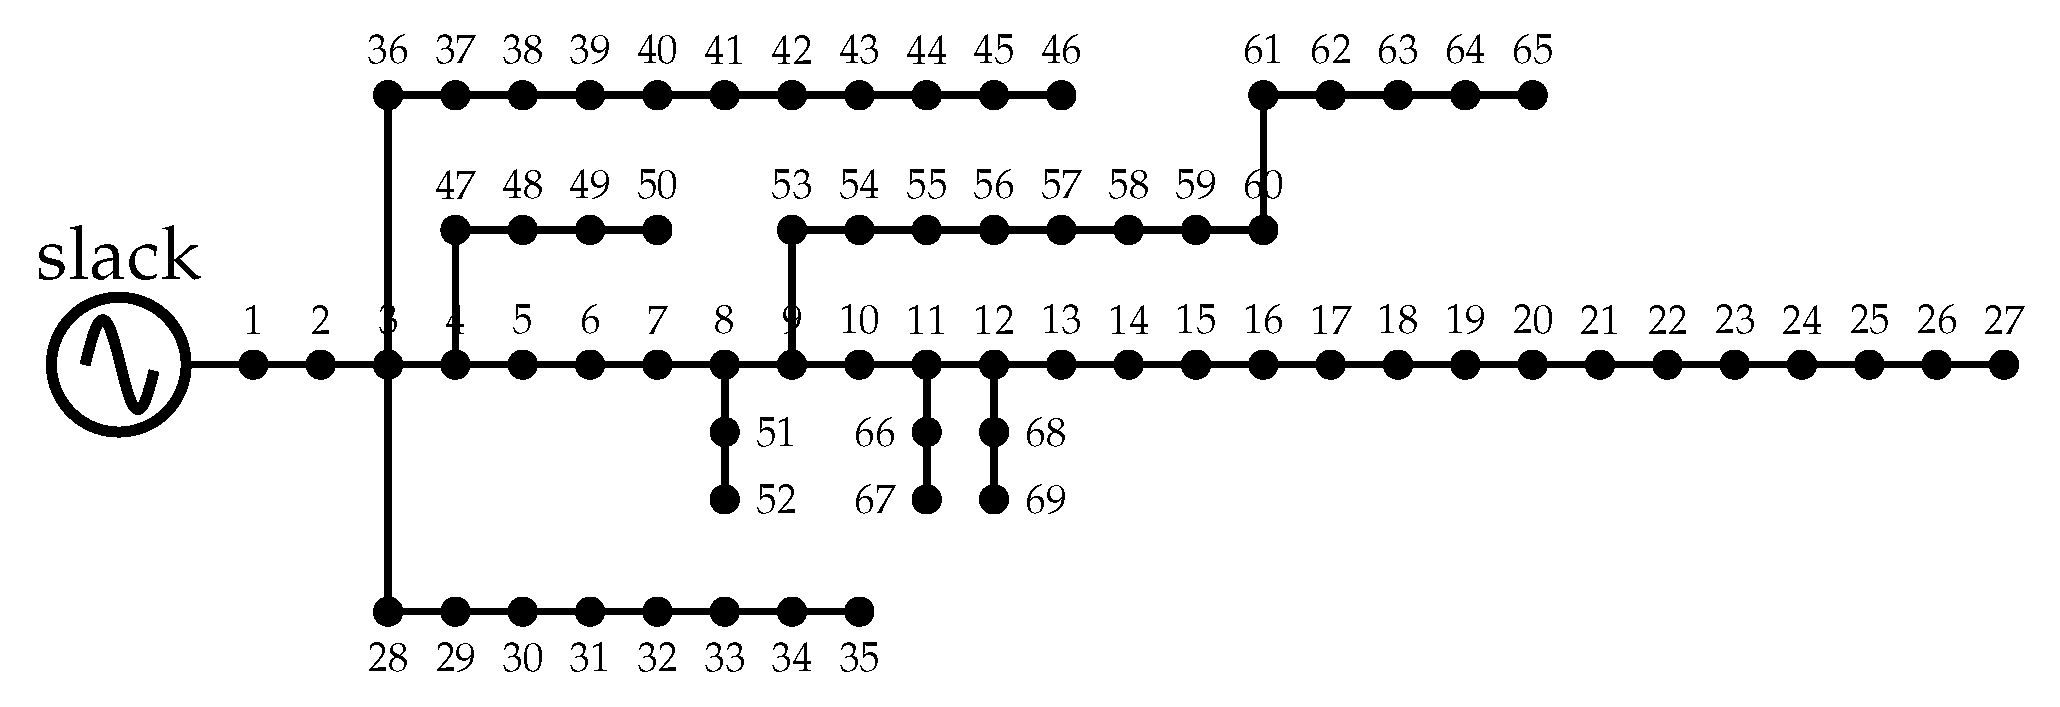
Analysis of the objective function regarding minimization of the CO 2 emissions to the atmosphere in the 69-node test feeder has demonstrated that using the reactive power capabilities of the voltage source converters that interface BESS with AC distribution networks permits reducing the contaminant effects of the diesel generators for electricity generation. This apparent power compensation has allowed reaching additional improvements of about 2.94 % in the daily greenhouse gas emissions compared with the classical unit power factor scenario, which is an important percentage that can help distribution companies fill the energetic sustainability challenges imposed by regulatory entities.
The evaluation of different metaheuristic optimization techniques in the 33-node test feeder regarding the classical optimal power flow problem resolving continuous optimization problem. The best alternative is convex optimization since it can deal with the global optimum at each running, which is not possible with metaheuristics. In addition, due to the combinatorial methods’ random search procedures, these can be stuck in locally optimal solutions while the SOCP formulation always reaches the global one.
Regarding future research, the following topics can be addressed: (1) extend the conic convex optimization studied in this paper to the problem of the optimal placement and sizing renewable generation and batteries by reformulating the original mixed-integer nonlinear programming model into a mixed-integer SOCP model with global optimum finding capabilities via branch and bound methods and (2) combine the studied SOCP model with heuristic and metaheuristic optimization techniques to plan AC distribution in rural areas involving renewable energies and batteries to eliminate the dependency of fossil fuels.

Author Contributions

Conceptualization O.D.M., W.G.-G., and J.C.H.; Methodology, O.D.M., W.G.-G., and J.C.H.; Investigation, O.D.M., W.G.-G., and J.C.H.; Writing—review and editing, O.D.M., W.G.-G., F.M.S., J.C.H., and A.M.-C. All authors have read and agreed to the published version of the manuscript.

Funding

This research was funded by the Agencia Estatal de Investigación, Spain (AEI) and the Fondo Europeo de Desarrollo Regional (FEDER) aimed at the Challenges of Society (grant No. ENE 2017-83860-R “Nuevos servicios de red para microredes renovables inteligentes. Contribución a la generación distribuida residencial”).

Acknowledgments

This work was partially supported by the National Scholarship Program Doctorates of the Administrative Department of Science, Technology, and Innovation of Colombia (COLCIENCIAS), by calling contest 727-2015, and partially by the Programa de Maestría en Ingeniería Eléctrica de la Universidad Tecnológica de Pereira.

Conflicts of Interest

The authors declare no conflict of interest.
Acronyms
ACAlternating Current
BESSBattery energy storage systems
NLPNonlinear Programming
GAMSGeneral Algebraic Modeling System
SOCPSecond-order cone programming
Sets and subscripts
N Set of nodes
T Set of periods
dDemand
g d Distributed generator
g c Conventional power source
bBattery
i or jNode
tPeriod of time
Parameters
Y i j Component of the admittance matrix that relates nodes i and j
Y i j Complex admittance component that relates nodes i and j
δ i j Angle of the admittance matrix that relates nodes i and j
Variables
E cost Objective function value
v i Voltage profile at node i
θ i Angle of voltage profile at node i
s o c i b State-of-charge of the BESS connected at node i
φ i b Charging/discharging of the BESS at node i
U i j Cross-product of voltage i with voltage j
Control variables
p d , q d Active and reactive power demanded by loads
p g c , q g c Active and reactive power generated by conventional generators
p g d , q g d Active and reactive power generated by distributed source
p b , q b Active and reactive power delivered/absorbed by the BESS
s d Apparent power demanded by loads
s g c Apparent power generated by conventional generators
s g d Apparent power generated by distributed source
s b Apparent power delivered/absorbed by the BESS
Limits
v min , v max Minimum and maximum voltage profile
p g c , min , p g c , max Minimum and maximum active power by conventional generator
q g c , min , q g c , max Minimum and maximum reactive power by conventional generator
p g d , min , p g d , max Minimum and maximum active power by generated source
q g d , min , q g d , max Minimum and maximum reactive power by generated source
p b , min , p b , max Minimum and maximum active power by the BESS
q b , min , q b , max Minimum and maximum reactive power by the BESS
s o c b , min , s o c b , max Minimum and maximum limits by s o c

References

  1. Sedighizadeh, M.; Esmaili, M.; Jamshidi, A.; Ghaderi, M.H. Stochastic multi-objective economic-environmental energy and reserve scheduling of microgrids considering battery energy storage system. Int. J. Electr. Power Energy Syst. 2019, 106, 1–16. [Google Scholar] [CrossRef]
  2. Kumar, A.; Meena, N.K.; Singh, A.R.; Deng, Y.; He, X.; Bansal, R.; Kumar, P. Strategic integration of battery energy storage systems with the provision of distributed ancillary services in active distribution systems. Appl. Energy 2019, 253, 113503. [Google Scholar] [CrossRef]
  3. Tan, X.; Wu, Y.; Tsang, D.H.K. Pareto Optimal Operation of Distributed Battery Energy Storage Systems for Energy Arbitrage under Dynamic Pricing. IEEE Trans. Parallel Distrib. Syst. 2016, 27, 2103–2115. [Google Scholar] [CrossRef]
  4. Mehrjerdi, H. Simultaneous load leveling and voltage profile improvement in distribution networks by optimal battery storage planning. Energy 2019, 181, 916–926. [Google Scholar] [CrossRef]
  5. Grisales-Noreña, L.; Montoya, O.D.; Gil-González, W. Integration of energy storage systems in AC distribution networks: Optimal location, selecting, and operation approach based on genetic algorithms. J. Energy Storage 2019, 25, 100891. [Google Scholar] [CrossRef]
  6. Dulău, L.I.; Abrudean, M.; Bică, D. Smart Grid Economic Dispatch. Procedia Technol. 2016, 22, 740–745. [Google Scholar] [CrossRef] [Green Version]
  7. Li, B.; Wang, Y.; Li, J.; Cao, S. A Fully Distributed Approach for Economic Dispatch Problem of Smart Grid. Energies 2018, 11, 1993. [Google Scholar] [CrossRef] [Green Version]
  8. Yang, B.; Wang, J.; Zhang, X.; Wang, J.; Shu, H.; Li, S.; He, T.; Lan, C.; Yu, T. Applications of battery/supercapacitor hybrid energy storage systems for electric vehicles using perturbation observer based robust control. J. Power Sources 2020, 448, 227444. [Google Scholar] [CrossRef]
  9. Mansour, M.; Mansouri, M.; Bendoukha, S.; Mimouni, M. A grid-connected variable-speed wind generator driving a fuzzy-controlled PMSG and associated to a flywheel energy storage system. Electr. Power Syst. Res. 2020, 180, 106137. [Google Scholar] [CrossRef]
  10. Vyas, G.; Dondapati, R.S. Superconducting Magnetic Energy Storage (SMES). In High-Temperature Superconducting Devices for Energy Applications; CRC Press: Boca Raton, FL, USA, 2020. [Google Scholar]
  11. Luo, X.; Wang, J.; Dooner, M.; Clarke, J. Overview of current development in electrical energy storage technologies and the application potential in power system operation. Appl. Energy 2015, 137, 511–536. [Google Scholar] [CrossRef] [Green Version]
  12. Lai, C.S.; Locatelli, G.; Pimm, A.; Wu, X.; Lai, L.L. A review on long-term electrical power system modeling with energy storage. J. Clean. Prod. 2020, 280, 124298. [Google Scholar] [CrossRef]
  13. Essallah, S.; Khedher, A.; Bouallegue, A. Integration of distributed generation in electrical grid: Optimal placement and sizing under different load conditions. Comput. Electr. Eng. 2019, 79, 106461. [Google Scholar] [CrossRef]
  14. Olaszi, B.D.; Ladanyi, J. Comparison of different discharge strategies of grid-connected residential PV systems with energy storage in perspective of optimal battery energy storage system sizing. Renew. Sustain. Energy Rev. 2017, 75, 710–718. [Google Scholar] [CrossRef]
  15. Montoya, O.D.; Gil-González, W. Dynamic active and reactive power compensation in distribution networks with batteries: A day-ahead economic dispatch approach. Comput. Electr. Eng. 2020, 85, 106710. [Google Scholar] [CrossRef]
  16. Kumar, M. Social, Economic, and Environmental Impacts of Renewable Energy Resources. In Wind Solar Hybrid Renewable Energy System; IntechOpen: London, UK, 2020. [Google Scholar] [CrossRef] [Green Version]
  17. Vezmar, S.; Spajic, A.; Topic, D.; Sljivac, D.; Jozsa, L. Positive and Negative Impacts of Renewable Energy Sources. Int. J. Electr. Comput. Eng. Syst. 2014, 5, 15–23. [Google Scholar]
  18. Strunz, K.; Abbasi, E.; Huu, D.N. DC microgrid for wind and solar power integration. IEEE Trans. Emerg. Sel. Top. Power Electron. 2013, 2, 115–126. [Google Scholar] [CrossRef]
  19. Eltigani, D.; Masri, S. Challenges of integrating renewable energy sources to smart grids: A review. Renew. Sust. Energy Rev. 2015, 52, 770–780. [Google Scholar] [CrossRef]
  20. Schiel, C.; Lind, P.G.; Maass, P. Resilience of electricity grids against transmission line overloads under wind power injection at different nodes. Sci. Rep. 2017, 7, 1–11. [Google Scholar] [CrossRef] [Green Version]
  21. Ciupageanu, D.A.; Barelli, L.; Lazaroiu, G. Real-time stochastic power management strategies in hybrid renewable energy systems: A review of key applications and perspectives. Electr. Power Syst. Res. 2020, 187, 106497. [Google Scholar] [CrossRef]
  22. Abid, S.; Alghamdi, T.A.; Haseeb, A.; Wadud, Z.; Ahmed, A.; Javaid, N. An Economical Energy Management Strategy for Viable Microgrid Modes. Electronics 2019, 8, 1442. [Google Scholar] [CrossRef] [Green Version]
  23. Gil-González, W.; Montoya, O.D.; Holguín, E.; Garces, A.; Grisales-Noreña, L.F. Economic dispatch of energy storage systems in dc microgrids employing a semidefinite programming model. J. Energy Storage 2019, 21, 1–8. [Google Scholar] [CrossRef]
  24. Kim, S.; Kim, J.; Cho, K.; Byeon, G. Optimal Operation Control for Multiple BESSs of a Large-Scale Customer Under Time-Based Pricing. IEEE Trans. Power Syst. 2018, 33, 803–816. [Google Scholar] [CrossRef]
  25. Montoya, O.D.; Grajales, A.; Garces, A.; Castro, C.A. Distribution Systems Operation Considering Energy Storage Devices and Distributed Generation. IEEE Lat. Am. Trans. 2017, 15, 890–900. [Google Scholar] [CrossRef]
  26. Home-Ortiz, J.M.; Pourakbari-Kasmaei, M.; Lehtonen, M.; Mantovani, J.R.S. Optimal location-allocation of storage devices and renewable-based DG in distribution systems. Electr. Power Syst. Res. 2019, 172, 11–21. [Google Scholar] [CrossRef]
  27. Mehrjerdi, H.; Hemmati, R. Modeling and optimal scheduling of battery energy storage systems in electric power distribution networks. J. Clean. Prod. 2019, 234, 810–821. [Google Scholar] [CrossRef]
  28. Niu, J.; Tian, Z.; Lu, Y.; Zhao, H. Flexible dispatch of a building energy system using building thermal storage and battery energy storage. Appl. Energy 2019, 243, 274–287. [Google Scholar] [CrossRef]
  29. Gimelli, A.; Mottola, F.; Muccillo, M.; Proto, D.; Amoresano, A.; Andreotti, A.; Langella, G. Optimal configuration of modular cogeneration plants integrated by a battery energy storage system providing peak shaving service. Appl. Energy 2019, 242, 974–993. [Google Scholar] [CrossRef]
  30. Luna, A.C.; Diaz, N.L.; Andrade, F.; Graells, M.; Guerrero, J.M.; Vasquez, J.C. Economic power dispatch of distributed generators in a grid-connected microgrid. In Proceedings of the 2015 9th International Conference on Power Electronics and ECCE Asia (ICPE-ECCE Asia), Seoul, Korea, 1–5 June 2015. [Google Scholar] [CrossRef] [Green Version]
  31. Molzahn, D.K. Identifying and Characterizing Non-Convexities in Feasible Spaces of Optimal Power Flow Problems. IEEE Trans. Circuits Syst. II 2018, 65, 672–676. [Google Scholar] [CrossRef]
  32. Busemann, H. Note on a theorem on convex sets. Matematisk Tidsskrift. B 1947, 32–34. [Google Scholar]
  33. Meng, J.; Cao, P.; Huang, J.; Lin, H.; Chen, Y.; Cao, R. Second-order cone programming formulation of discontinuous deformation analysis. Int. J. Numer. Methods Eng. 2019, 118, 243–257. [Google Scholar] [CrossRef]
  34. Renegar, J. Hyperbolic Programs, and Their Derivative Relaxations. Found. Comut. Math. 2006, 6, 59–79. [Google Scholar] [CrossRef] [Green Version]
  35. Farivar, M.; Low, S.H. Branch Flow Model: Relaxations and Convexification-Part I. IEEE Trans. Power Syst. 2013, 28, 2554–2564. [Google Scholar] [CrossRef]
  36. Chiou, G.J.; Chen, J.Y.; Chen, T.C.; Chen, B.X. Application of D-Q axis transformation control strategy for three-phase AC/DC converter. In Proceedings of the 2013 IEEE 10th International Conference on Power Electronics and Drive Systems (PEDS), Kitakyushu, Japan, 22–25 April 2013. [Google Scholar] [CrossRef]
  37. Rymarski, B.; Dyga, D. Passivity-Based Control Design Methodology for UPS Systems. Energies 2019, 12, 4301. [Google Scholar] [CrossRef] [Green Version]
  38. Montoya, O.D.; Serra, F.M.; Angelo, C.H.D. On the Efficiency in Electrical Networks with AC and DC Operation Technologies: A Comparative Study at the Distribution Stage. Electronics 2020, 9, 1352. [Google Scholar] [CrossRef]
  39. Cisneros, R.; Pirro, M.; Bergna, G.; Ortega, R.; Ippoliti, G.; Molinas, M. Global tracking passivity-based PI control of bilinear systems: Application to the interleaved boost and modular multilevel converters. Control Eng. Pract. 2015, 43, 109–119. [Google Scholar] [CrossRef]
  40. Fernández, L.M.; Serra, F.; Angelo, C.D.; Montoya, O.D. Control of a charging station for electric vehicles. J. Phys. Conf. Ser. 2020, 1448, 012013. [Google Scholar] [CrossRef] [Green Version]
  41. Redondo-Iglesias, E.; Venet, P.; Pelissier, S. Measuring Reversible and Irreversible Capacity Losses on Lithium-Ion Batteries. In Proceedings of the 2016 IEEE Vehicle Power and Propulsion Conference (VPPC), Hangzhou, China, 17–20 October 2016; pp. 1–5. [Google Scholar] [CrossRef] [Green Version]
  42. Gusev, Y.P.; Subbotin, P.V. Using Battery Energy Storage Systems for Load Balancing and Reactive Power Compensation in Distribution Grids. In Proceedings of the 2019 International Conference on Industrial Engineering, Applications and Manufacturing (ICIEAM), Sochi, Russian, 25–29 March 2019; pp. 1–5. [Google Scholar]
  43. Biswas, P.P.; Mallipeddi, R.; Suganthan, P.; Amaratunga, G.A. A multiobjective approach for optimal placement and sizing of distributed generators and capacitors in distribution network. Appl. Soft Comput. 2017, 60, 268–280. [Google Scholar] [CrossRef]
  44. Biswas, P.P.; Suganthan, P.; Amaratunga, G.A. Optimal power flow solutions incorporating stochastic wind and solar power. Energy Convers. Manag. 2017, 148, 1194–1207. [Google Scholar] [CrossRef]
  45. Sultana, S.; Roy, P.K. Krill herd algorithm for optimal location of distributed generator in radial distribution system. Appl. Soft Comput. 2016, 40, 391–404. [Google Scholar] [CrossRef]
  46. Moradi, M.; Abedini, M. A combination of genetic algorithm and particle swarm optimization for optimal DG location and sizing in distribution systems. Int. J. Electr. Power Energy Syst. 2012, 34, 66–74. [Google Scholar] [CrossRef]
  47. Sultana, S.; Roy, P.K. Multi-objective quasi-oppositional teaching learning based optimization for optimal location of distributed generator in radial distribution systems. Int. J. Electr. Power Energy Syst. 2014, 63, 534–545. [Google Scholar] [CrossRef]
  48. Muthukumar, K.; Jayalalitha, S. Optimal placement and sizing of distributed generators and shunt capacitors for power loss minimization in radial distribution networks using hybrid heuristic search optimization technique. Int. J. Electr. Power Energy Syst. 2016, 78, 299–319. [Google Scholar] [CrossRef]
  49. Moradi, M.; Abedini, M. A novel method for optimal DG units capacity and location in Microgrids. Int. J. Electr. Power Energy Syst. 2016, 75, 236–244. [Google Scholar] [CrossRef]
  50. Bayat, A.; Bagheri, A. Optimal active and reactive power allocation in distribution networks using a novel heuristic approach. Appl. Energy 2019, 233–234, 71–85. [Google Scholar] [CrossRef]
  51. Gholami, K.; Parvaneh, M.H. A mutated salp swarm algorithm for optimum allocation of active and reactive power sources in radial distribution systems. Appl. Soft Comput. 2019, 105833. [Google Scholar] [CrossRef]
  52. Kaur, S.; Kumbhar, G.; Sharma, J. A MINLP technique for optimal placement of multiple DG units in distribution systems. Int. J. Electr. Power Energy Syst. 2014, 63, 609–617. [Google Scholar] [CrossRef]
  53. Bocanegra, S.Y.; Montoya, O.D. Heuristic Approach for Optimal Location and Sizing of Distributed Generators in AC Distribution Networks. Wseas Trans. Power Syst. 2019, 14, 113–121. [Google Scholar]
  54. Montoya, O.D.; Gil-González, W.; Orozco-Henao, C. Vortex search and Chu-Beasley genetic algorithms for optimal location and sizing of distributed generators in distribution networks: A novel hybrid approach. Eng. Sci. Technol. Int. J. 2020. [Google Scholar] [CrossRef]
  55. Eftimov, T.; Korošec, P. A novel statistical approach for comparing meta-heuristic stochastic optimization algorithms according to the distribution of solutions in the search space. Inf. Sci. 2019, 489, 255–273. [Google Scholar] [CrossRef]
  56. Barbosa, E.B.M.; Senne, E.L.F. A Heuristic for Optimization of Metaheuristics by Means of Statistical Methods. In Proceedings of the 6th International Conference on Operations Research and Enterprise Systems, Porto, Portugal, 23–25 February 2017. [Google Scholar] [CrossRef]
Publisher’s Note: MDPI stays neutral with regard to jurisdictional claims in published maps and institutional affiliations.
Figure 1. Schematic of a voltage source converter (VSC) that interfaces a battery connected to an a c grid.
Electronics 09 01677 g001
Figure 2. Independent active and reactive power control: (a) state-of-charge behavior, (b) active and reactive power in the d q reference frame, and (c) three-phase currents.
Electronics 09 01677 g002
Figure 3. IEEE 33-node test feeder topology.
Electronics 09 01677 g003
Figure 4. IEEE 69-node test feeder topology.
Electronics 09 01677 g004
Figure 5. Operational curves for day-ahead economic dispatch approach: (a) renewable generation, and (b) demand and cost curves [15].
Electronics 09 01677 g005
Figure 6. Daily energy purchasing costs for each simulation case.
Electronics 09 01677 g006
Table 1. Test system parameters.
ParameterValueUnitParameterValueUnitParameterValueUnit
l1.25mHr0.20 Ω f50Hz
c4.40 μ F v b 400V---
Table 2. The IEEE 33-node test feeder parameters.
Node iNode j R ij ( Ω ) X ij ( Ω ) P j (kW) Q j (kW)Node iNode j R ij ( Ω ) X ij ( Ω ) P j (kW) Q j (kW)
120.09220.04771006017180.73200.57409040
230.49300.251190402190.16400.15659040
340.36600.18641208019201.50421.35549040
450.38110.1941603020210.40950.47849040
560.81900.7070602021220.70890.93739040
670.18720.61882001003230.45120.30839050
781.71141.235120010023240.89800.7091420200
891.03000.7400602024250.89600.7011420200
9101.04000.740060206260.20300.10346025
10110.19660.0650453026270.28420.14476025
11120.37440.1238603527281.05900.93376020
12131.46801.1550603528290.80420.700612070
13140.54160.71291208029300.50750.2585200600
14150.59100.5260601030310.97440.963015070
15160.74630.5450602031320.31050.3619210100
16171.28901.7210602032330.34100.53026040
Table 3. The IEEE 69-node test feeder parameters.
Node iNode j R ij ( Ω ) X ij ( Ω ) P j (kW) Q j (kW)Node iNode j R ij ( Ω ) X ij ( Ω ) P j (kW) Q j (kW)
120.00050.0012003360.00440.01082618.55
230.00050.00120036370.06400.15652618.55
340.00150.00360037380.10530.123000
450.02510.02940038390.03040.03552417
560.36600.18642.62.239400.00180.00212417
670.38110.194140.43040410.72830.85091021
780.09220.0470755441420.31000.362300
890.04930.0251302242430.04100.047864.3
9100.81900.2707281943440.00920.011600
10110.18720.061914510444450.10890.137339.2226.3
11120.71140.235114510445460.00090.001239.2226.3
12131.03000.3400854470.00340.008400
13141.04400.34508547480.08510.20837956.4
14151.05800.34960048490.28980.7091384.7274.5
15160.19660.0650453049500.08220.2011384.7274.5
16170.37440.123860358510.09280.047340.528.3
17180.00470.0016603551520.33190.11403.62.7
18190.32760.1083009530.17400.08864.353.5
19200.21060.069010.653540.20300.103426.419
20210.34160.11291148154550.28420.14472417.2
21220.01400.004653.555560.28130.143300
22230.15910.05260056571.59000.533700
23240.34630.1145282057580.78370.263000
24250.74880.24750058590.30420.100610072
25260.30890.1021141059600.38610.117200
26270.17320.0572141060610.50750.25851244888
3280.00440.01082618.661620.09740.04963223
28290.06400.15652618.662630.14500.073800
29300.39780.13150063640.71050.3619227162
30310.07020.02320064651.04100.53025942
31320.35100.11600011660.20120.06111813
32330.83900.2816101066670.00470.00141813
33341.70800.5646141412680.73940.24442820
34351.47400.48734468690.00470.00162820
Note that, for both text feeders, 100 kVA and 12.66 kV are used as powder and used as powder and voltage bases.
Table 4. Type of batteries connected in the 33- and 69-node test feeders.
TypeNominal
Energy (kWh)
Charge/Dis. Time (h)Nominal
Power (kW)
A10004250
B15004375
C20005400
D30006500
Table 5. GAMS solutions for the simulation C 1 .
SolverObjective Function (MCOP$)Proc. Times (s)
CONOPT5.8078290616.618
IPOTH5.807829064.164
KNITRO5.807829064.081
MINOS5.807829064.124
SOCP5.807829063.167
Table 6. Energy purchasing cost considering simulation C 4 and different levels of renewable generation availability compared with C 1 .
Ren. Gen. Penetration (%)Case 1 (MCOP$)Case 4 (MCOP$)Improvement (%)
026.4652622825.692258352.92
2021.9285826721.189707913.37
4017.4909730416.779578274.07
6013.1563658112.456269535.32
809.113155448.221514129.78
1005.807828124.3358208125.35
1204.045894132.9158741127.93
Table 7. Evaluation of C 1 , C 3 , and C 4 for the 69-node test feeder.
Scenario (%) G emissions lb MWh G cost (MCOP$)
Case 12.656999 × 10 4 8.62394538
Case 32.509434 × 10 4 8.10450580
Case 42.431309 × 10 4 7.87427882
Table 8. Comparative results between literature approaches and the second-order cone programming (SOCP) for optimal power solutions.
MethodLocation (Node)Loss (kW)Loss (SOCP) (kW)
KHA [45]{13,25,30}75.411673.5035
LSFSA [45]{6,18,30}82.052581.8853
GA-PSO [46]{11,16,32}103.360086.0107
TLBO [47]{10,24,31}75.540074.5106
QOTLBO [47]{12,24,29}74.100874.1006
HSA-PABC [48]{14,24,30}72.812972.7897
GA-IWD [49]{11,16,32}110.510086.0107
AHA [50]{13,24,30}72.834072.7853
MSSA [51]{13,24,30}72.785472.7853
MINLP [52]{13,24,30}72.786272.7853
CHVSA [53]{6,14,31}78.453478.4532
CBGA-VSA [54]{13,24,30}72.785372.7853

