Total-Factor Energy Efficiency in China’s Agricultural Sector: Trends, Disparities and Potentials


1
College of Economics and Management, Huazhong Agricultural University, No. 1 Shizishan Street, Wuhan 430070, China
2
UWA School of Agriculture and Environment, The University of Western Australia, M089, 35 Stirling Highway, Crawley, WA 6009, Australia
3
School of Business and Management, Murdoch University, 90 South Street, Murdoch, WA 6150, Australia
4
Australia-China Sustainable Research and Development Center, Perth, WA 6009, Australia
5
Inner Mongolia Honghe Energy and Environment Consultancy, Huhhot 010020, China
6
College of Land Management, Huazhong Agricultural University, No. 1 Shizishan Street, Wuhan 430070, China
7
School of Economics and Finance, Faculty of Business and Law, Curtin University, Rm 3016, Bldg 408, Bentley, Perth, WA 6004, Australia
*
Author to whom correspondence should be addressed.
†
These authors contributed equally to this work.
Energies 2018, 11(4), 853; https://doi.org/10.3390/en11040853
Submission received: 18 February 2018
/
Revised: 30 March 2018
/
Accepted: 2 April 2018
/
Published: 5 April 2018
Abstract
:This paper investigates total-factor energy efficiency and analyses the trends of the efficiency changes in China’s agricultural production across 30 provinces and three regions from 2001 to 2011, based on data envelopment analysis (DEA) approach. The potential amount of energy savings and five potential factors for energy efficiency improvement are also empirically studied by Tobit regression model. The findings show that (1) total-factor energy efficiency in China’s agricultural sector is increasing over years but performs heterogeneously across regions; (2) agriculture intensive regions and energy abundant provinces tend to be relatively energy inefficient in agricultural production; and (3) economic structure, agricultural production structure, technological progress and income effect are major potentials for improving energy efficiency, whereas energy price is not a significant factor. This phenomenon results from the divergence of economic development, endowment effects as well as the scale of agricultural production. Policy implications drawn from this research are to upgrade industrial structure and promote agricultural transformation to enhance farmers’ income as well as to establish a land market with entitling land property rights to farmers. This conclusion can assist to form more scientific rural energy policy decision-making in China and also can be extended to other developing economies for sustainable agriculture.
1. Introduction
China is an ancient and grand agricultural economy. Energy consumption of agricultural sector has been increasing in recent decades so that the efficiency issue has emerged and attracted attention of economists and policymakers. China produces food for 23% of the world’s population with only 7% of the world’s farms, along with agricultural modernization and rapid urbanization [1]. This progress is closely connected with energy consumption in the agricultural sector given that energy is to some degree a foundation and key input of industrialization. As the largest energy consumer and the largest food producer in the world, China recently has launched a national strategy to decrease energy intensity and increase energy efficiency in order to tackle environmental degradation as well as climate change [2], from 42 million tons of standard coal (Mtce) to 75 Mtce. Concerning the accelerative trend, the central government announced that the agricultural sector will share equal responsibilities in improving energy efficiency with other sectors in the Twelfth National Five-Year Plan (2011–2015) [2]. Agriculture plays an important role in achieving energy efficiency targets mainly because the quantity of energy consumption would not decrease in China’s predictable future given the substantial economic growth in rural areas. In fact, the absolute quantity of energy consumption is enormous and should not be ignored by policymakers. In many years, energy consumption within China’s agricultural sector exceeds the total energy consumption of some industrialized or Organization for Economic Co-operation and Development (OECD) countries. For instance, according to the China Energy Statistical Yearbook and the China Energy Databook (Version 8.0), China’s agricultural sector used 75 Mtce energy in 2011, which is 3.75 times the total energy consumption of Israel (20 Mtce), 2.7 times that of Switzerland (27 Mtce), 1.6 times that of Sweden (46 Mtce), and 1.2 times that of Belgium (61 Mtce) as well as nearly equal to the Netherlands (85 Mtce). Moreover, China’s energy mix relies a lot on traditional energy compared to those developed countries in terms of rural underdevelopment. This implies that an effective regulation on agriculture energy efficiency would have a more significant effect on global greenhouse gases (GHG) mitigation, whilst the premise is to understand the state of energy efficiency in the agricultural sector delicately. Although some researchers have done a lot related to China’s industry energy efficiency [3,4] and found that China’s energy efficiency is much lower than some developed countries [5,6,7,8], and seldom has investigated energy efficiency in the agricultural sector. In this paper, we will investigate the trends of China’s agriculture energy efficiency over the years, exploring the disparities across regions and analysing potentials for improving energy efficiency in the future. To our knowledge, this research will contribute a first glance to energy efficiency in China’s agriculture by means of data envelop analysis (DEA) and the Tobit regression model.
Generally, we find that energy efficiency in China’s agricultural sector increased during the past decades and some agriculture intensive provinces have lower efficiency in energy use. That is, more food in total output usually means less energy efficiency in the agricultural sector across provinces. This disparity between developed regions and underdeveloped regions further suggests that an interaction with divergent industrialization and economies of scale in agriculture. Thus, promotion of energy efficiency is connected with agriculture transformation as well. This is the primary contribution of this paper.
The article is structured as follows. Section 2 will review the main literature on energy efficiency. Section 3 will describe the methodologies we use. Section 4 will provide data and variable description. In addition, we will present and discuss results in Section 5 followed by policy implications in Section 6 and conclusions in Section 7.
2. Literature Review
An earlier relevant research was conducted by Catania [9] and he firstly stated that some characteristics of China’s rural energy system include dispersed resource distribution, lower population density, lower energy technologies and investment; in addition, he pointed out that the energy consumption in the agricultural sector is closely related to agricultural production and ecological environment. However, this paper did not study energy efficiency in agriculture production. Some Chinese scholars reviewed the overall pattern and policy in rural China by provinces and fuels [10], but they did not calculate energy efficiency as well.
Basically, there are three dimensions on energy efficiency research. The traditional energy technical efficiency refers to total output over energy consumption, with the same meaning as energy productivity [11]. However, this partial-factor energy efficiency treats energy as a single input of production so that it ignores potential relations of substitution effect with other inputs, say, labor and capital [6,8]. To overcome this inaccuracy, Hu and Wang [6] have proposed an index named total-factor energy efficiency (TFEE) based on data envelopment analysis (DEA), which defines as a ratio of optimal to actual energy input under a multi-factor framework). This efficiency index presents an exact version of energy technical efficiency. Following this direction, an increasing studies emerged in total-factor energy efficiency analysis by using DEA [3,12].
At an international level, some researchers examined TFEE for the European agricultural sector [13,14,15,16]. Some other studies compare the energy efficiency across countries within China. Hu and Kao [17] investigate energy efficiency across 17 Asia-Pacific Economic Cooperation (APEC) countries. Wei and Ni [18] compare energy efficiency among 156 countries. These researchers found that China’s energy efficiency is considerably lower than other countries but has a great potential to improve. Furthermore, Zhang, Cheng, Yuan and Gao [8] found that China experienced the most rapid increase between the periods of 1980–2005 among 23 developing countries and, more importantly, they suggest that the effective energy policy plays a crucial role in energy efficiency improvement.
However, China’s government usually targets different energy-saving goals for different provinces in terms of disparities of natural resources’ endowments and priorities of development strategies [7]. That is to say, a detailed investigation on drivers of efficiency improvement may assist policy decision-making at the provincial level [6,12]. These researchers find that most provinces in eastern China have higher TFEE than provinces in central or in western areas since the eastern region experienced the most rapid economic growth and also attracted the advanced technology and managerial knowledge in China.
Owing to the fact that the industry sector takes the highest share of energy consumption, several studies also examine TFEE by the industry sector. For instance, Wei and Liao [19] explore energy efficiency for China’s iron and steel sector; Shi and Bi [20] conduct it in the provincial industry sector; and Zhao and Yang [5] extend this research to assess energy efficiency both by provinces and sectors. These researchers have drawn two conclusions: (1) the TFEE gap among industrial sectors is found to be narrowed in the eastern region but expanded into the central and western regions; (2) and technological change, energy price and economic development are factors of energy efficiency performance.
On the side of the literature examining energy use in the agricultural sector, there are essentially two research strands. The first one focuses on investigating the relationship between energy consumption and agricultural growth using econometric methods [21,22,23,24]. Their results suggest that energy input is sensitive to agricultural productivity and support the energy-led growth hypothesis in the agricultural sector. These studies do not discuss the energy efficiency; however, they highlight the importance of energy input in agriculture. The second strand utilizes the energy content of farm inputs and converts it into joules to measure exergy efficiency at the farm level [25,26,27,28,29]. Although their investigations are meaningful, they do not provide information on TFEE and potentials of energy efficiency promotion by provinces.
In general, research on energy efficiency in agriculture production at the provincial level is rare and needed. This paper seeks to fill the gaps by evaluating the TFEE of China’s provincial agricultural sector.
3. Methodology
Two mainstream methods have been commonly used for assessing efficiency: data envelopment analysis (DEA) and stochastic frontier analysis (SFA). The major difference between them is that DEA is a non-parametric method, whereas SFA is a parametric method. In contrast with SFA, no assumptions on functional form of production function or distribution of the error term are in the DEA model [30,31]. Thus, DEA is a sufficiently powerful analytical tool for efficiency analysis, and has been widely used by previous studies to estimate energy efficiency [6]. We will apply the DEA approach to analyse TFEE in the provincial agricultural sector and then do a regression model to examine what factors would contribute to improve energy efficiency.
3.1. Total-Factor Energy Efficiency Based on DEA
Using linear programming, DEA creates a piecewise linear frontier that envelops the input and output data of each decision-making unit (DMU). Efficiency measurements are obtained relative to this frontier [30]. There are two different assumptions of returns to scale that are widely used in the DEA model including the constant returns to scale (CRS) and the variable returns to scale (VRS) [30]. Compared with the CRS DEA model imposing hypotheses on all DMUs operate at their optimal scale, the VRS model is more appropriate in the agricultural sector since, in agriculture, increasing inputs do not proportionally increase outputs [32]. Therefore, the VRS DEA model is employed in this study. In addition, an input-oriented model under variable returns to scale (VRS) is applied because we focus on using a minimum level of inputs to produce a given level of outputs.
Let us consider that produce N outputs using M inputs. The technical efficiency of can be computed by solving the following linear programming problem:
where is a scalar, ranging from 0 to 1; and represent the output and input non-radial slacks, respectively; y and x are the output and input variables, respectively; J is the number of ; N and M are the types of output and inputs, respectively; and are nonnegative constants. The results obtained from solving the above linear programming can be interpreted as follows:
- If and all slacks and , the is considered to be strongly efficient.
- If and and/or , the is considered to be weakly efficient.
- If , the is considered to be inefficient.
The value of is called radial adjustments for the m-th input of . The sum of the radial adjustments and non-radial adjustments is called the total adjustments that can be reduced for the observed DMU to reach the production frontier, without compromising the outputs. Therefore, the target energy input can be defined as dividing the actual energy input by the total adjustments, which represents the minimum feasible energy input for the observed DMU to produce the given output. Thus, the TFEE indicator of at time t can be specified as [6]
Since the target energy input is the optimal quantities of energy input in a region, the actual energy input is thus always larger than or equal to this target energy input. Hence, the TFEE score always ranges from 0 to 1. When the actual energy input is equal to the target energy input for a region, a TFEE score of unity is achieved. The TFEE score is lower than unity if the actual energy input is larger than the target energy input, implying that there are redundant energy inputs, which are needed to be reduced. A lower score of TFEE implies a higher potential for the region to reduce the application rate of energy.
3.2. Factors Influencing the Possibility of Improving TFEE
To examine the factors that may influence improvement of TFEE, we conduct a regression model in the second stage. However, given that the efficiency scores are censored values and bounded between 0 and 1, the binary Probit model is inappropriate in this study. In addition, the ordinary least squares (OLS) method does not provide unbiased and consistent estimates. Instead, a panel Tobit regression is used in this study. The Tobit model is proposed by Tobin [33], and it is widely employed by economists to do regression analysis when the dependent variable is incontinuous and/or subjected to a known upper or lower bound [5,8]. This model can be specified as:
where is total-factor energy efficiency score of the region in the agricultural sector, which is obtained from stage one; is an intercept; is a parameter vector that needs to be estimated; and is a vector of independent variables that may affect efficiency.
4. Variable and Data
This study involves 30 provinces categorized by three regions according to their economic and geographic characteristics. The eastern region includes 11 provinces (Beijing, Tianjin, Shanghai, Hebei, Liaoning, Jiangsu, Zhejiang, Fujian, Shandong, Guangdong, and Hainan). The central region includes eight inland provinces (Shanxi, Jilin, Heilongjiang, Anhui, Jiangxi, Henan, Hubei, and Hunan). The western region includes 11 provinces (Inner Mongolia, Guangxi, Chongqing, Sichuan, Guizhou, Yunnan, Shaanxi, Gansu, Qinghai, Ningxia, and Xinjiang). By and large, the eastern region is most developed and the west is underdeveloped in terms of per capita GDP. In addition, central provinces produce more food than the others.
4.1. Input and Output Variables of the DEA Model
We use agricultural added value (AAV) as the output variable to measure the agricultural sector’s TFEE, which is consistent with available studies. Labour, capital stock, and energy consumption are selected as input variables [3,6]. The years range from 2001 to 2011. Labour input is measured by total number of employees in the agricultural sector in each province. Capital stock data in the agricultural sector are obtained from Wu [34] and our estimation through the perpetual inventory method, since the data of capital stock are not available in any statistical yearbooks of China. AAV and labour input are collected from the China Statistical Yearbook, and all the monetary variables are converted into the constant price in 2001 according to the index of AAV of each region. Energy consumption includes coal, oil, and electricity. All energy data are collected from China Energy Databook (Version 8.0) and convert to the standard coal equivalent. Table 1 illustrates the descriptive statistics of the input and output data. To compare the relative importance of agriculture in each province, we also present the agricultural share of total output in Table 1.
4.2. Variables in the Regression Model
To explore the possibilities of TFEE improvement, five factors are included in the regression model, including energy price, economic structure, agricultural production structure, technological change, and income level. Previous studies have suggested that energy price [5], economic structure [35,36], and technological change [37,38] are important in influencing energy efficiency. In this study, we assume that agricultural production structure (the ratio of farming added value to total agricultural added value for each province) also affects energy efficiency in agriculture since different agricultural sectors (farming, livestock husbandry and fishery) usually have different energy intensity and energy utilization patterns. Moreover, farmers’ income is also included in the model. Income usually reflects farmers’ ability to utilize farm resources including energy in agriculture and upgrading their farm machinery. In the context that new farm equipment tends to be highly efficient and gets energy savings due to the government’s energy policy, upgrading farm machinery may help to improve energy efficiency. To a large extent, income level also represents the managerial skills of utilizing resources, which could contribute to using resources including energy at their optimal level.
Energy price is measured by the purchasing price of fuel and power at the provincial level with 2001 as the base year. Economic structure is by the ratio of agricultural added value to GDP (gross domestic product). Technological change is measured by the per capita total power of agricultural machinery as farm machinery usually determines the direct energy consumption in agricultural production, and also reflects the level of modernization in agriculture. Income is represented by per capita annual net income of rural households in each province. All these data are collected from statistical yearbooks of each province. Table 2 describes the independent variables used in the empirical analysis.
5. Results and Discussion
Using the DEA model (1) and definition (2), the total-factor energy efficiency in the agricultural sector for each province of China is evaluated. Then, the Tobit model (3) is applied to examine the factors influencing the possibilities to improve energy efficiency.
5.1. Estimated Results of Total-Factor Energy Efficiency
The TFEE scores in the agricultural sector for each province from 2001 to 2011 are presented in Table 2. On average, the TFEE score for China’s agricultural sector is 0.657 during the period, implying that about 34% of energy can be saved given the level of output. Thus, China’s agricultural sector could contribute effectively to energy savings and GHG mitigation.
Overall, the eastern provinces are more efficient than the west while the central provinces perform worst. Only eastern provinces (0.750) exceed the average efficiency of China (0.657). This tells us that an agriculture-intensive economy generally performs the worst in agricultural energy efficiency.
In the east, four provinces (Beijing, Tianjin, Shanghai and Hainan) exhibit a high TFEE with average efficiency scores above 0.8. Other seven provinces (Hebei, Liaoning, Jiangsu, Fujian, Zhejiang, Shandong, and Guangdong) have the average efficiency scores less than 0.8. Hainan shows the best TFEE with 0.939 and Hebei is the lowest (0.468). Hainan is a special case here as Hainan is a typical island agriculture economy and served as the national agriculture base. The agricultural share of Hainan province is always the highest (average 28.4% all years) within the country and exceeds the others much more (average 11.8% all years). However, for the continental provinces: the lowest score in the east (Hebei) is the most intensive agriculture province compared to other continental eastern provinces.
In the west, Qinghai is the most efficient with an average score of 0.989, followed by Guangxi (0.935), but the economic structures of these two provinces are distinguished. An agricultural share of Guangxi is highest in the western group and the number (19.7%) is also the highest across continental provinces; instead, Qinghai is one of the smallest agricultural shares in the west. Furthermore, the four lowest efficiency score provinces (Gansu 0.319, Shaanxi 0.374, Yunnan 0.397, and Guizhou 0.387) are all agriculture intensive provinces (14.7%, 10.2%, 17.3%, and 15.2%). Generally, the more agriculture in economic structure, the less energy efficiency in agriculture production.
In the central region, only one province (Jilin) has mean efficiency scores above 0.8 and three provinces (Anhui, Jiangxi and Hubei) around 0.7 to 0.8. The other four provinces (Shanxi, Heilongjiang, Henan and Hunan) show low TFEE with average scores less than 0.6, in which Shanxi is particularly noteworthy since it is the lowest average TFEE score in the whole country (0.231). In terms of output structure, we also find that, except for Jilin, the more agricultural output one province produces, the lower TFEE it has.
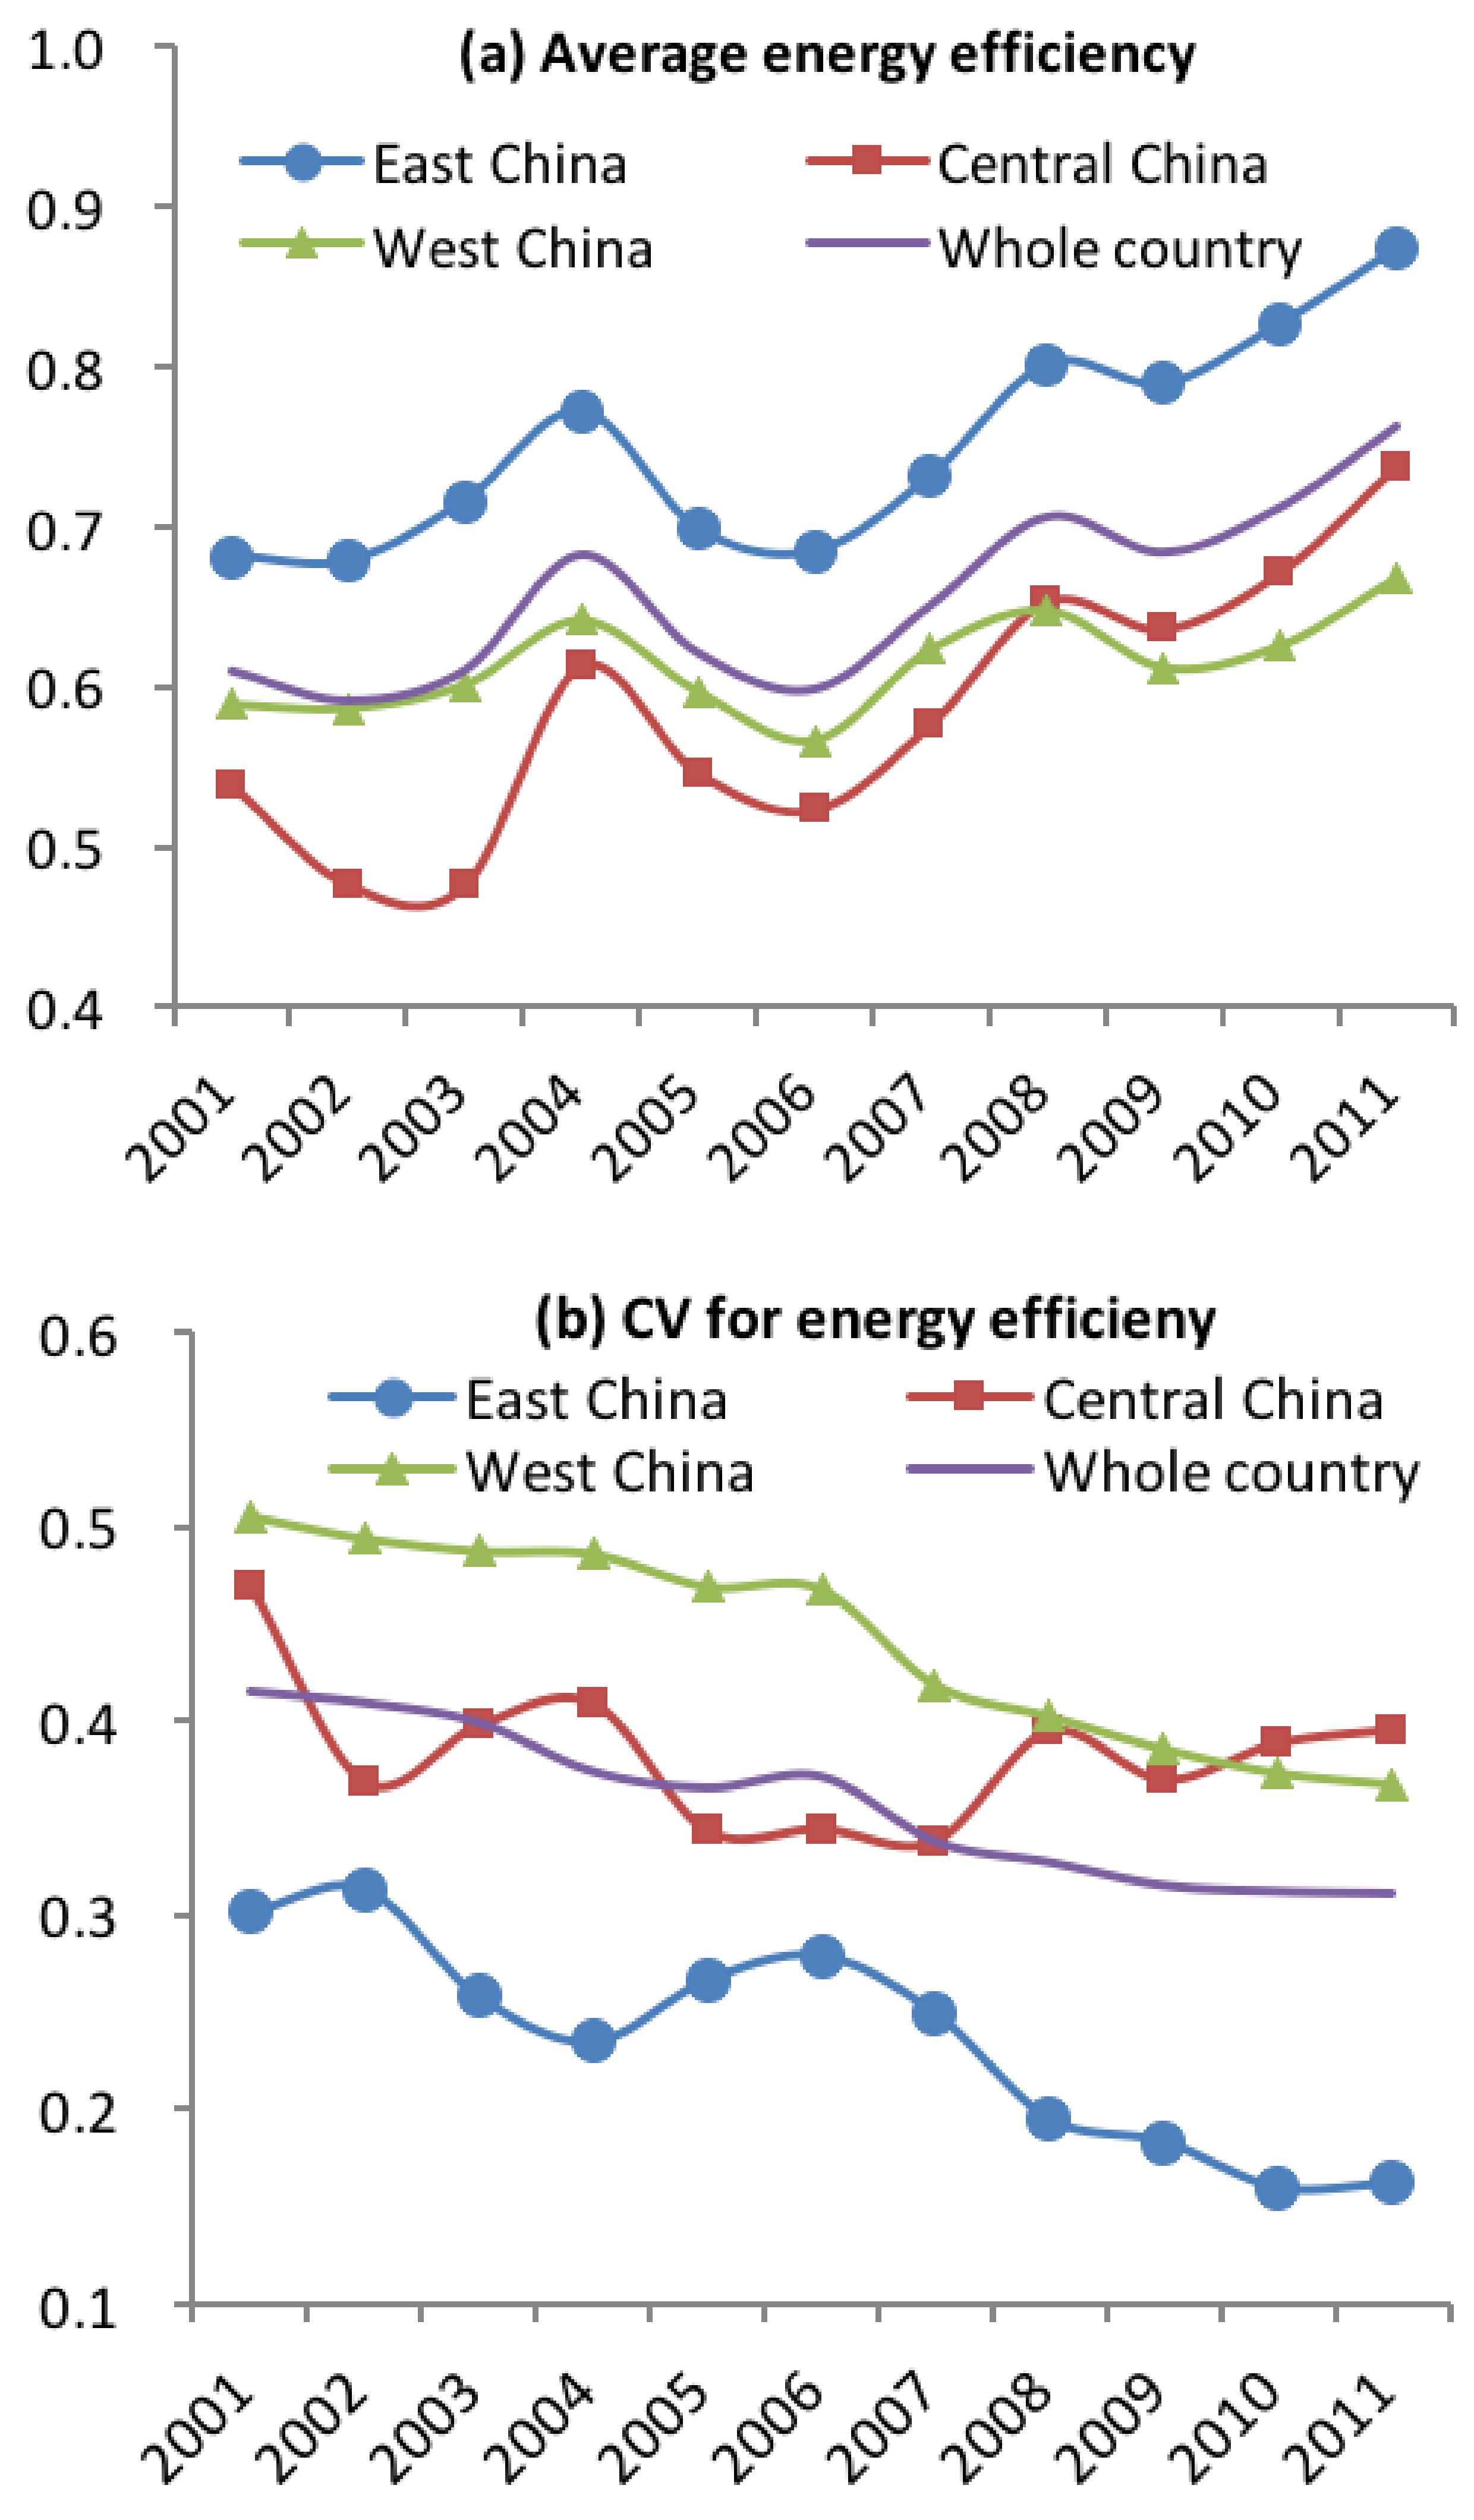
Moving to the disparity of TFEE across three regions, we find that the average TFEE of each region differed and fluctuated dramatically during the period from 2001 to 2011, but the TFEE varying among regions is narrowing in terms of the trends of the coefficient of variation (CV) of TFEE in Figure 1. The efficiency score of the west was exceeded thoroughly that of the central region after 2008 and nearly reached an average level of the country by 2011. The overall patterns of all lines are rising, but two turning points appear in 2004 and 2008 followed by a slight decline. The first turning point is associated with the subsidy policy of purchasing farm machinery that was provided by the Chinese government since 2004. The subsidy policy dramatically increased the appliance of farm machinery and thereby stimulated energy consumption in agriculture. It is reasonable to conjecture that the sharp rises of energy input are likely to cause a great deal of energy to be wasted. For the turning point in 2008, one explanation is that China’s government invests massive resources into agriculture production to guarantee the domestic food security by avoiding the world food crisis in 2008. This may reduce energy efficiency performance in the agricultural sector in the next year, 2009. The Chinese government started to subsidize agricultural machinery in 2005. The huge capital inputs on machines may significantly decrease TFEE in the following year. This is why, in 2006, neither province is on the frontier.
By and large, the TFEE differences among the 30 provinces in China have decreased significantly between 2001 and 2011. From Figure 1b, the trends of the CV of TFEE indicate that the efficiency differences between provinces in the east are the smallest, followed by those in the central region. However, the disparity in the central region widened after the year 2007. Reminding readers that the central region is the main agricultural production region of this country, the increase in CV can draw an attentive policy implication. Although the gap in the western region is larger than other regions, it experienced a declining trend during the period.
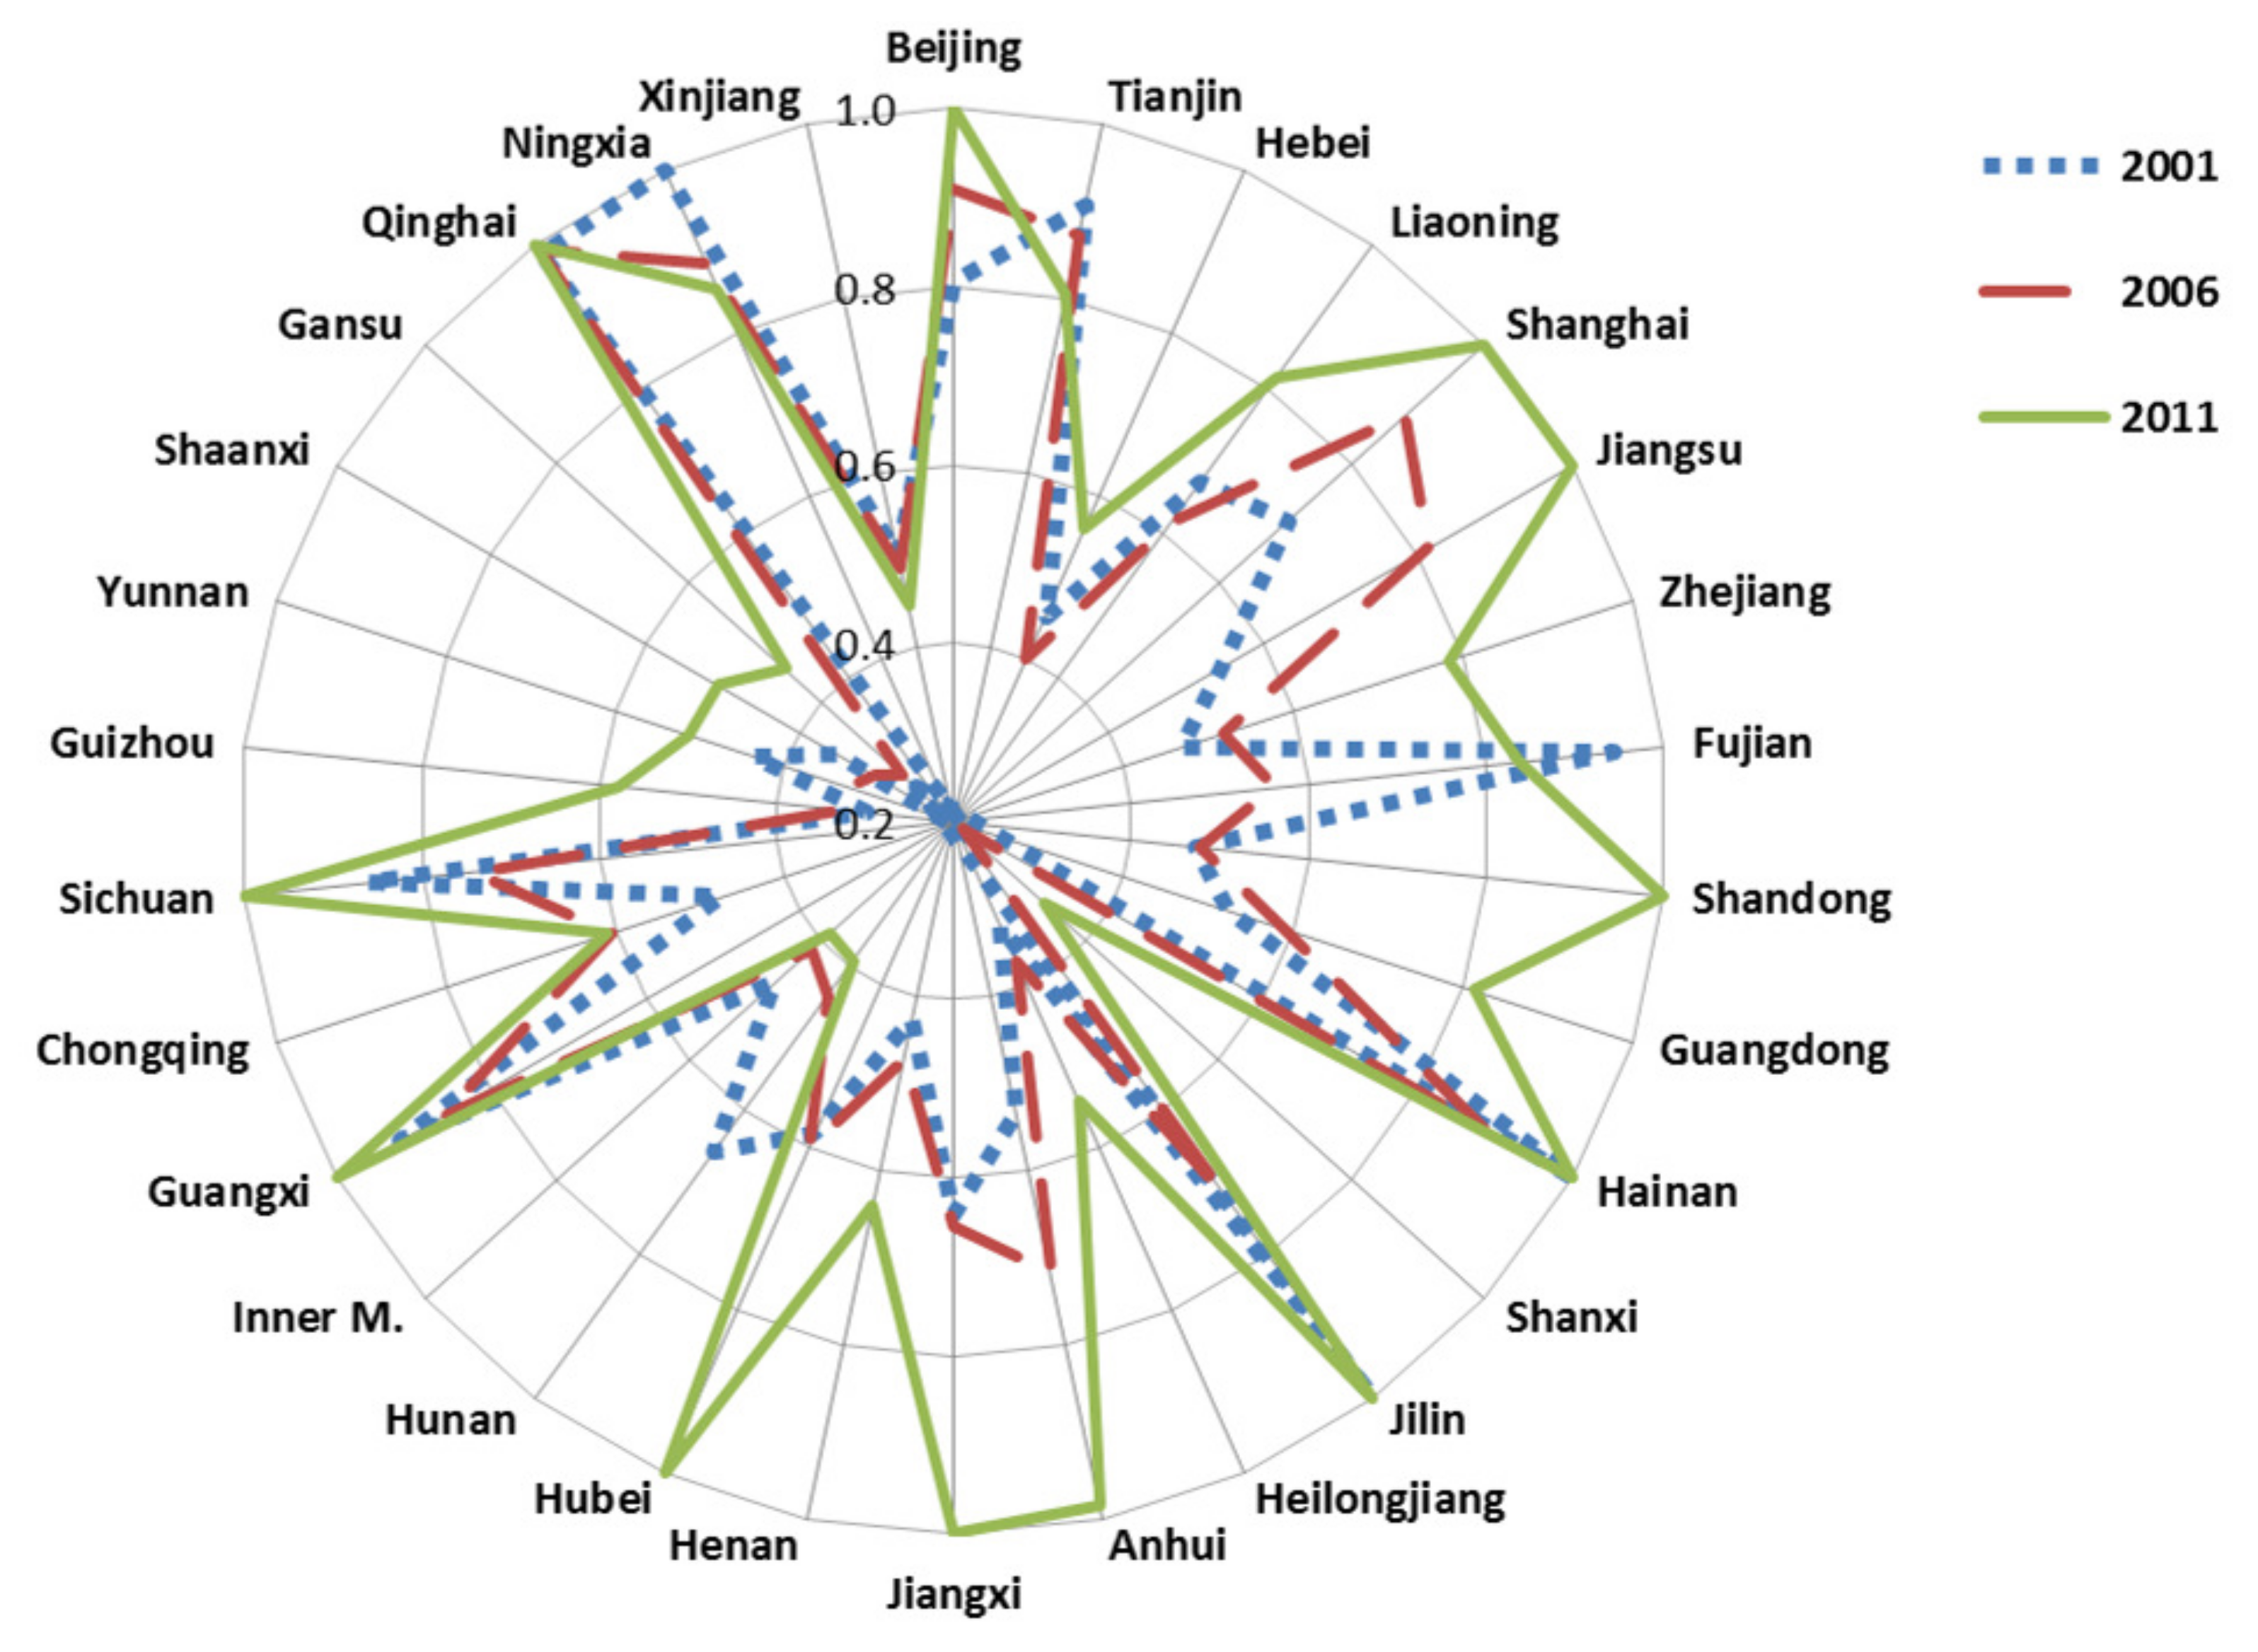
Finally, the TFEE of all 30 provinces in the agricultural sector displays different trends in 2001, 2006 and 2011. The following can be seen from Figure 2: (1) 16 out of 30 provinces’ TFEE experienced an increase from 2001 through 2006 and 2011, in which Shanghai, Jiangsu, Shandong, Anhui, Jiangxi and Hubei present a more significant improvement; (2) nine provinces’ TFEE decreased from 2001 to 2006, and then increased in 2011. However, the efficiencies of two out of nine provinces in 2011 is lower than those in 2001 (Fujian, and Yunnan), and the other six provinces exceed their initial level (Hebei, Liaoning, Jilin, Guangxi, Sichuan and Shaanxi), whereas Hainan recovers to its initial level; and (3) the remaining five provinces’ TFEE fluctuated slightly across the three time points.
5.2. Potential Energy Savings of Provinces in China
The DEA theory suggests that inefficient decision making units (DMUs) can become efficient and reach the frontier by adjusting their inefficient application of inputs [30]. We find that some provinces exhibit full efficiency and thus are located at the frontier in the period. For instance, two provinces (Hainan and Ningxia) constituted the energy efficiency frontier in 2001, while Hainan and Qinghai provinces constituted the frontier in 2002. Overall, Qinghai is located at the TFEE frontier in five out of eleven years, followed by Beijing, Hainan, Jilin and Guangxi, which are constituting the frontier for three years. There are also some other provinces located at the frontier for two years or one year. Those provinces that are not yet at the frontier can project themselves onto the energy use frontier to optimize their inputs’ portfolio through adjusting their technology and the production method. Thus, the DEA method can be used to measure the energy savings potential for each province during the surveyed period (see Table 3).
Table 3 presents the potential energy savings for each province as well as the total potential energy savings for the east, central, west and the whole country from 2001 to 2011. We find that the average energy savings potential for six provinces is more than 2.0 Mtce during the period. Hebei has the largest potential to reduce energy consumption, on average, the energy consumption of 3.1 Mtce could be saved in Hebei to improve energy efficiency, followed by Hunan (3.016 Mtce), Shanxi (2.619 Mtce), Henan (2.319 Mtce), Shandong (2.125 Mtce) and Inner Mongolia (2.083 Mtce). Nine provinces could save 1.0–2.0 Mtce of their energy consumption in the agricultural sector , of which Heilongjiang’s energy savings potential ranks first (1.950 Mtce), followed by Gansu (1.823 Mtce), Xinjiang (1.636 Mtce), Guangdong (1.549 Mtce), Zhejiang (1.470 Mtce), Guizhou (1.393 Mtce), Yunnan (1.328 Mtce), Shaanxi (1.161 Mtce) and Hubei (1.034 Mtce). Amongst the other 15 provinces that have lower energy savings potential (less than 1.0 Mtce), Qinghai can save the lowest amount of energy (0.002 Mtce).
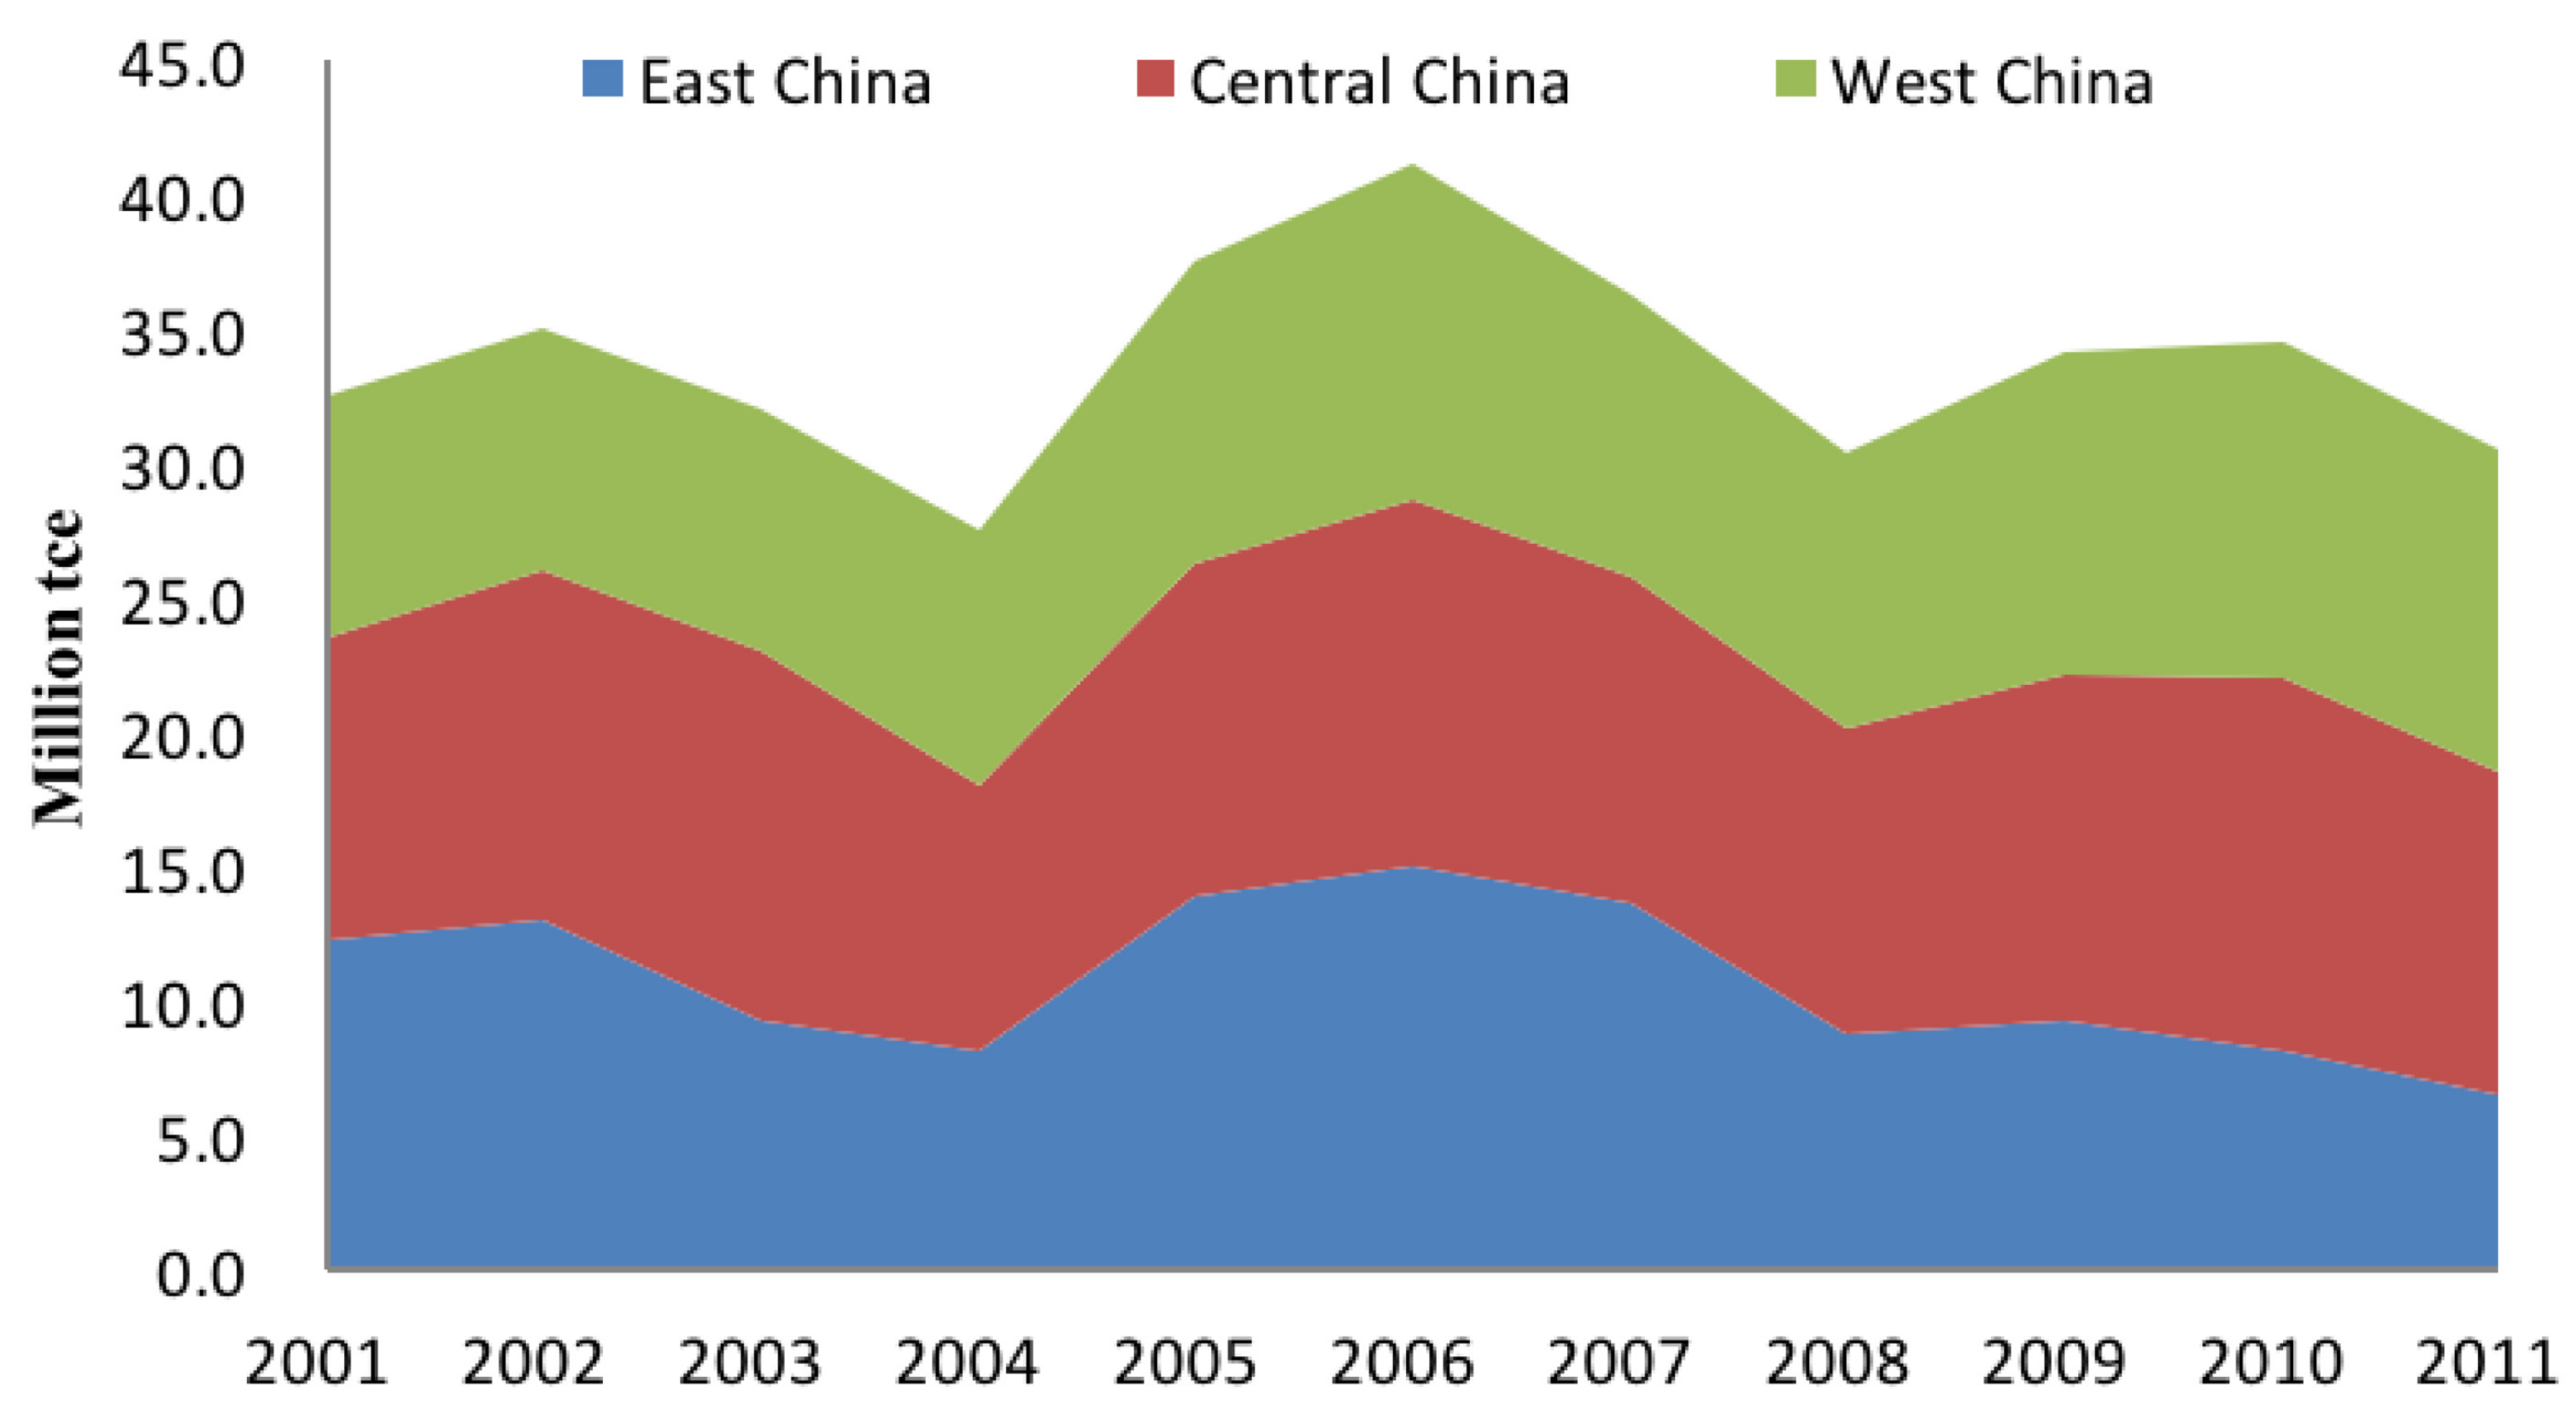
The energy savings potential for the whole country is reported in the last row of Table 3. We find that the energy savings potential in China’s agricultural sector ranging from 27.581 Mtce in 2004 to 41.182 Mtce in 2006, with an average of 33.803 Mtce during 2001 and 2011. The results imply that a substantial energy can be reduced through improving energy efficiency in agriculture. This gives rise to a meaningful implication for the country to mitigate GHG emission and manage energy conservation. At the regional level, we find that the central region has the largest energy savings potential of 12.349 Mtce, compared to the east (10.758 Mtce) and west regions (10.696 Mtce). The slight differences across the three regions in terms of potential energy savings imply that the energy savings effort and energy efficiency-improved polices should be emphasized equally in all regions of China. As it can be seen from Figure 3, the total energy savings potentials for the three regions during 2001 and 2011 exhibit similar trends, decreased from 2002 to 2004, then increased dramatically until 2006, and at last fluctuated and declined from 2007 to 2011. This finding further confirms that the energy policies in China could have similar effects in all regions of China.
5.3. Regression Results of Tobit Model and Discussions
Table 4 reports which factors can improve energy efficiency. We find that energy price does not show a significant relationship with TFEE in the agricultural sector. Although it is a general belief that higher energy price could reduce the energy intensity and improve energy efficiency, our finding is reasonable and can be explained when we consider that China’s energy market does not function well [36] and the abundant subsidy for energy consumption exists in the agricultural sector.
Significantly, a negative relationship between agricultural production structure and TFEE suggests that higher farming share is associated with lower TFEE compared with livestock husbandry and fishery. In other words, more farming means less energy efficiency in the agricultural sector. This could be attributed to the small and scattered scale of operation of farming in China. The scale of operation for farming is limited to adjusting for smallholder producers to a large extent due to the land tenure system, the informal and less developed land rental market in rural China. In contrast, it is easy for the livestock husbandry and fishery to enlarge scale of operations and thereby could gain scale economy. Moreover, the coefficient of agricultural production structure is found to be the largest in the central region (−0.700), followed by the east region (−0.613), implying that if agricultural production structure increases by 1%, the possibility of improving TFEE decreases 0.7% for the central region and 0.6% for the east region. In contrast, the coefficient for the west region is lowest and not significant (−0.257). It is worth noting that most provinces in the central region are major grain producing regions of China, and its scale of operation for farming are less than that in the west region, which is not helpful to reach economies of scale including energy consumption. Therefore, the higher agricultural production structure in the central region can be seen as a major reason that it has the lowest TFEE score compared with the other two regions. Moreover, the reason that Hainan in the east region and Guangxi in the west region exhibit a higher TFEE score compared to other agriculture provinces can also be seen, since the two provinces have the lowest and the second lowest share of farming in agriculture within their groups. Particularly, Qinghai province in the west region shows the highest TFEE score throughout the whole country and also has the lowest share of farming in agriculture.
The coefficient of economic structure for the whole sample (0.185) indicates that a province with a higher share of primary industry is more likely to exhibit a higher TFEE score in the agricultural sector. If economic structure increases by 1%, and the possibility of enhancing TFEE increases 0.185%. However, this story is not true for the east and central regions. In contrast, a 1% increase of economic structure in the west region can increase the possibility of TFEE improvement by 0.861% correspondingly. This result is contradictory with the findings that most of the agriculture heavier provinces are associated with lower TFEE scores but is consistent with the findings that Hainan, Jilin and Guangxi provinces have the relatively higher efficiency scores. To some extent, this result confirms the findings above referring to the heterogeneous effects of economic structure across regions, implying that the contributions of economic structure on increasing the possibility of enhancing TFEE among the east and central regions are weakened by the economic structure.
Although the effect of technological change on TFEE is not significant on a country level, it is pronounced for the central and west regions. However, the coefficient of technological change is negative in the central region but positive in the west region. The technological change in this study is defined by the application of farm machinery. Given the fact that the dramatically increased use of farm machinery significantly stimulates the energy consumption in agriculture in a relatively short period, the consumed energy is more likely to be wasted and thus leads to energy inefficiency. The significant and negative influence of the application of farm machinery in the central region (−0.467) can be attributed to the higher agricultural production structure and smaller scale of operation to a large extent, which could weaken the efficiency of mechanization. However, farm size in the west region is usually larger than that in the east and central regions due to its geographic and population factors. Thus, the application of farm machinery in the west region could be more efficient at energy consumption. Moreover, as mentioned above, the west region is the most underdeveloped in the economy among the three regions, implying that its technological level in agriculture also ranks the worst. In other words, the marginal benefits of wide application of farm machinery in the west region can be larger than the other two regions.
The significant influences of income level suggest that increasing a farmer’s income can improve the possibility of enhancing TFEE in the agricultural sector at the country level (0.592). However, the story is not true for the west region. The coefficient of the income level in the west region (0.079) is insignificant and is the smallest compared to that in the other two regions. In contrast, the coefficient for central region is pronounced to be larger than that for the other two regions (0.943), followed by the east region (0.593). Improving income level in the central and east regions by 1%, the possibilities to increase TFEE can increase by 0.943% and 0.593% in these two regions, respectively. Thus, the different influences of income level in the central and west regions can be seen as the reason that the TFEE in the west region has been exceeded by the central region since 2009. Additionally, the heterogeneous influences of technological change and income level on TFEE among the three regions also indicate that the possibility of energy efficiency improvement can be stimulated by technology investment at an early stage of agricultural development, whereas the income effect will be greater than the technology effect at a late stage of development.
6. Policy Implication
The improvement in energy efficiency is one of the most effective methods to save energy and mitigate GHG emission. Although the industry sector consumes a large amount of primary energy, energy consumption in the agriculture production should not be ignored, especially for big agriculture economies like China. Under the total-factor framework, this study uses the DEA method to examine the TFEE performance of China’s provincial agricultural sector during the period of 2001–2011. We further calculate how much energy can be saved potentially. In addition, Tobit regression is applied to explore the determinants of TFEE (see Table 5).
Firstly, our results indicate that China’s agricultural sector has large energy-saving potential and 34% of current energy consumption could be reduced without reduction of agriculture output if energy efficiency increases. Secondly, the overall trend of TFEE is considerably upward moving during the period from 2001 to 2011, though two turning points appear in 2004 and 2008, respectively. Thirdly, agricultural energy efficiency is heterogeneous across regions, but the disparities are narrowing during the observed period. By and large, the developed region (the east) has the highest efficiency scores followed by the west, and the TFEE score of the central region is the lowest, whereas TFEE of the central region exceeds that of the western region after 2008. Fourthly, most agriculture intensive provinces usually have lower TFEE except for Hainan, Jilin and Guangxi provinces. In addition, provinces with abundant energy resource are found to be more inefficient in energy use in agriculture production, especially for Shanxi and Inner Mongolia provinces.
This research also shows how much energy can be saved in each region yearly. We find that agricultural structure, economic structure, technological change and income level are the main factors that can influence TFEE performance across provincial agricultural sectors, but energy price does not affect TFEE significantly. Moreover, these influences are found to differ across regions. From the findings above, several policy implications can be derived to assist the improvment of China’s agriculture energy efficiency.
This research suggests that provinces with higher primary industry share generally consume energy inefficiently in the agricultural sector; furthermore, considering the agricultural production structure, if the amount of farming grows, then energy efficiency tends to be worse. That is to say, the performance of energy efficiency in the agricultural sector is highly connected with China’s industrial upgrading as well as structural transformation. This delivers hints for improving energy efficiency: the promotion of energy efficiency in the agricultural sector not only depends on the structural change between sectors but also that within the agricultural sector. China should insist on upgrading industrial structure towards a service-oriented economy, and meanwhile adjusting agricultural production structure with a stronger emphasis on diversified agriculture instead of traditional farming.
Secondly, there is a positive relationship between energy efficiency promotion and farmers’ income increase. Put differently, we can improve them simultaneously without any contradiction. Without a doubt, this is a crucial conclusion for policymakers while making rural development policy. The roots would result from the fact that farmers’ awareness of energy savings will enhance energy utilization as living standard continuously improves. They tend to apply more advanced technologies in production and save more energy for avoiding environmental degradation. Consequently, the government should accelerate the application of energy-saving technologies opportunely while farmers become rich.
Lastly, from the perspective of institutional economics, changing scattered farmland into a larger scale area would be beneficial to energy efficiency improvement as large farms usually enjoy increasing return to energy consumption by using energy more efficiently and wisely. This requires a deepening of land transition policy. The central government should release the regulation of rural land property and entitle the same rights for rural land and city land. Furthermore, a nationwide land market is needed for farmers to conduct land transactions freely. This will result in an agglomeration of farms, which can assist with improving energy efficiency and food productivity.
7. Conclusions
In conclusion, China’s energy consumption in the agricultural sector is huge in absolute quantity; thus, energy efficiency issues stay at the center of rural energy policy decision-making and should be paid more attention to by economists and policymakers in order to tackle global GHG emission. To some degree, China’s agriculture energy efficiency is a development issue in addition to being a technical one. From the perspective of economics and policy, energy efficiency can be improved by further development, which has seen China grow from an ancient agriculture economy to a modern industry economy. This is the major message conveyed by this paper. More importantly, by increasing total-factor energy efficiency, the energy intensity of the agricultural sector will be expected to decline over time, which would be much more important for China’s energy transition to a sustainable development pathway. China has a huge potential to enhance the performance of energy efficiency in the agricultural sector if they can make proper policies for structural transformation of sectors, income growth of farmers and institutional changes of property rights. All of these socioeconomics elements provide a deeper policy thinking beyond technology. These also provide an alternative pathway for energy transition and sustainable growth in other developing worlds.
Acknowledgments
We gratefully acknowledge the financial support from the National Natural Science Foundation of China (No. NSFC 71573101), (No. NSFC71373095) and the National Social Science Foundation of China (No. 16CGL038) and are thankful for the financial support from the China Scholarship Council (CSC). Dong Wang thanks the research funding from UWA School of Agriculture and Environment, the University of Western Australia. Tianyi Du thanks the PhD scholarship from Murdoch University. We thank Rui Hou for his generous help in LaTeX techniques. The authors are also grateful for valuable comments from the editor and two reviewers.
Author Contributions
Zhihai Yang and Dong Wang developed the original idea of the paper, convinced and designed the research project. They completed the most of modeling work and drafted the original version of the paper. Tianyi Du contributed to the results presentation, some writing parts and coded the whole paper into Latex. Anlu Zhang navigated the research direction from beginning to the end and also made a significant contribution on the policy discussion part. Yixiao Zhou contributed to the data collecting and also conducted the task of writing, editing, revising and proofreading.
Conflicts of Interest
The authors declare no conflict of interest.
References
- Tong, S.; Berry, H.L.; Ebi, K.; Bambrick, H.; Hu, W.; Green, D.; Hanna, E.; Wang, Z.; Butler, C.D. Climate change, food, water and population health in China. Bull. World Health Organ. 2016, 94, 759–765. [Google Scholar] [CrossRef] [PubMed]
- Government, C.C. The 13th Five-Year Plan for Economic and Social Development of the People’s Republic of China; Central Compilation and Translation Press: Beijing, China, 2016. [Google Scholar]
- Wang, Z.H.; Zeng, H.L.; Wei, Y.M.; Zhang, Y.X. Regional total factor energy efficiency: An empirical analysis of industrial sector in China. Appl. Energy 2012, 97, 115–123. [Google Scholar] [CrossRef]
- Wang, K.; Wei, Y.M. China’s regional industrial energy efficiency and carbon emissions abatement costs. Appl. Energy 2014, 130, 617–631. [Google Scholar] [CrossRef]
- Xiaoli, Z.; Rui, Y.; Qian, M. China’s total factor energy efficiency of provincial industrial sectors. Energy 2014, 65, 52–61. [Google Scholar] [CrossRef]
- Hu, J.L.; Wang, S.C. Total-factor energy efficiency of regions in China. Energy Policy 2006, 34, 3206–3217. [Google Scholar] [CrossRef]
- Wang, K.; Yu, S.; Zhang, W. China’s regional energy and environmental efficiency: A DEA window analysis based dynamic evaluation. Math. Comput. Model. 2013, 58, 1117–1127. [Google Scholar] [CrossRef]
- Zhang, X.P.; Cheng, X.M.; Yuan, J.H.; Gao, X.J. Total-factor energy efficiency in developing countries. Energy Policy 2011, 39, 644–650. [Google Scholar] [CrossRef]
- Catania, P. China’s rural energy system and management. Appl. Energy 1999, 64, 229–240. [Google Scholar] [CrossRef]
- Zhang, L.; Yang, Z.; Chen, B.; Chen, G. Rural energy in China: Pattern and policy. Renew. Energy 2009, 34, 2813–2823. [Google Scholar] [CrossRef]
- Wang, D. A dynamic optimization on economic energy efficiency in development: A numerical case of China. Energy 2014, 66, 181–188. [Google Scholar] [CrossRef]
- Wei, C.; Ni, J.; Shen, M. Empirical analysis of provincial energy efficiency in China. China World Econ. 2009, 17, 88–103. [Google Scholar] [CrossRef]
- Błażejczyk-Majka, L. Application of DEA for evaluating the efficiency of economic policy as exemplified by EU agriculture. Stud. Hist. Oecon. 2017, 35, 163–176. [Google Scholar] [CrossRef]
- Błażejczyk-Majka, L.; Radosław, K. Concentration and productivity of livestock and mixed farms in new and old EU member states. A regional level approach. J. Cent. Eur. Agric. 2015, 16, 159–176. [Google Scholar] [CrossRef]
- Yan, Q.; Yin, J.; Baležentis, T.; Makutėnienė, D.; Štreimikienė, D. Energy-related GHG emission in agriculture of the European countries: An application of the Generalized Divisia Index. J. Clean. Prod. 2017, 164, 686–694. [Google Scholar] [CrossRef]
- Vlontzos, G.; Niavis, S.; Pardalos, P. Testing for Environmental Kuznets Curve in the EU Agricultural Sector through an Eco-(in) Efficiency Index. Energies 2017, 10, 1992. [Google Scholar] [CrossRef]
- Hu, J.L.; Kao, C.H. Efficient energy-saving targets for APEC economies. Energy Policy 2007, 35, 373–382. [Google Scholar] [CrossRef]
- Wei, C.; Ni, J.; Sheng, M. China’s energy inefficiency: A cross-country comparison. Soc. Sci. J. 2011, 48, 478–488. [Google Scholar] [CrossRef]
- Wei, Y.M.; Liao, H.; Fan, Y. An empirical analysis of energy efficiency in China’s iron and steel sector. Energy 2007, 32, 2262–2270. [Google Scholar] [CrossRef]
- Shi, G.M.; Bi, J.; Wang, J.N. Chinese regional industrial energy efficiency evaluation based on a DEA model of fixing non-energy inputs. Energy Policy 2010, 38, 6172–6179. [Google Scholar] [CrossRef]
- Karkacier, O.; Gokalp Goktolga, Z.; Cicek, A. A regression analysis of the effect of energy use in agriculture. Energy Policy 2006, 34, 3796–3800. [Google Scholar] [CrossRef]
- Zaman, K.; Khan, M.M.; Ahmad, M.; Rustam, R. The relationship between agricultural technology and energy demand in Pakistan. Energy Policy 2012, 44, 268–279. [Google Scholar] [CrossRef]
- Sebri, M.; Abid, M. Energy use for economic growth: A trivariate analysis from Tunisian agriculture sector. Energy Policy 2012, 48, 711–716. [Google Scholar] [CrossRef]
- Zhao, Q.; Chen, Q.; Xiao, Y.; Tian, G.; Chu, X.; Liu, Q. Saving Forests through Development? Fuelwood Consumption and the Energy-Ladder Hypothesis in Rural Southern China. Transform. Bus. Econ. 2017, 16, 199–219. [Google Scholar]
- Pahlavan, R.; Omid, M.; Akram, A. Energy use efficiency in greenhouse tomato production in Iran. Energy 2011, 36, 6714–6719. [Google Scholar] [CrossRef]
- Khoshroo, A.; Mulwa, R.; Emrouznejad, A.; Arabi, B. A non-parametric Data Envelopment Analysis approach for improving energy efficiency of grape production. Energy 2013, 63, 189–194. [Google Scholar] [CrossRef]
- Unakitan, G.; Hurma, H.; Yilmaz, F. An analysis of energy use efficiency of canola production in Turkey. Energy 2010, 35, 3623–3627. [Google Scholar] [CrossRef]
- Rahman, S.; Rahman, M.S. Energy productivity and efficiency of maize accounting for the choice of growing season and environmental factors: An empirical analysis from Bangladesh. Energy 2013, 49, 329–336. [Google Scholar] [CrossRef]
- Luo, Y.; Long, X.; Wu, C.; Zhang, J. Decoupling CO2 emissions from economic growth in the agricultural sector across 30 Chinese provinces from 1997 to 2014. J. Clean. Prod. 2017, 159, 220–228. [Google Scholar] [CrossRef]
- Coelli, T.J.; Rao, D.S.P.; O’Donnell, C.J.; Battese, G.E. An Introduction to Efficiency and Productivity Analysis; Springer: New York, NY, USA, 2005; pp. 47–61. [Google Scholar]
- Błażejczyk-Majka, L.; Kala, R. On the combined estimation of technical efficiency and its application to agriculture. Agric. Econ. Zeměd. Ekon. 2015, 61, 441–449. [Google Scholar] [CrossRef]
- Speelman, S.; D’Haese, M.; Buysse, J.; D’Haese, L. A measure for the efficiency of water use and its determinants, a case study of small-scale irrigation schemes in North-West Province, South Africa. Agric. Syst. 2008, 98, 31–39. [Google Scholar] [CrossRef]
- Tobin, J. Estimation of Relationships for Limited Dependent Variables. Econometrica 1958, 26, 24–36. [Google Scholar] [CrossRef]
- Wu, Y. China’s Capital Stock Series by Region and Sector. Front. Econ. China 2016, 11, 156–172. [Google Scholar]
- Fan, Y.; Xia, Y. Exploring energy consumption and demand in China. Energy 2012, 40, 23–30. [Google Scholar] [CrossRef]
- Song, F.; Zheng, X. What drives the change in China’s energy intensity: Combining decomposition analysis and econometric analysis at the provincial level. Energy Policy 2012, 51, 445–453. [Google Scholar] [CrossRef]
- Ma, C.; Stern, D.I. China’s changing energy intensity trend: A decomposition analysis. Energy Econ. 2008, 30, 1037–1053. [Google Scholar] [CrossRef]
- Eom, J.; Clarke, L.; Kim, S.H.; Kyle, P.; Patel, P. China’s building energy demand: Long-term implications from a detailed assessment. Energy 2012, 46, 405–419. [Google Scholar] [CrossRef]
Figure 1.
Energy efficiency and differences in the agricultural sector by regions and year (2001–2011). (a) Average energy efficiency; (b) coefficient of variation(CV) for energy efficiency.
Figure 1.
Energy efficiency and differences in the agricultural sector by regions and year (2001–2011). (a) Average energy efficiency; (b) coefficient of variation(CV) for energy efficiency.

Figure 2.
Provincial level energy efficiency in 2001, 2006 and 2011.

Figure 3.
Total energy savings potential in the east, central and west.


Table 1.
Summary statistics of input and output variables by region.
| Region | Input Variables | Output Variable | Agri. Share (%) | ||||||
|---|---|---|---|---|---|---|---|---|---|
| Labour Input | Capital Stock | Energy Usage | AAV | ||||||
| (10,000 Persons) | (100 Million RMB) | (Mtce) | (100 Million RMB) | ||||||
| Mean | SD | Mean | SD | Mean | SD | Mean | SD | ||
| Beijing (E) | 61.45 | 3.23 | 550.21 | 33.36 | 1.09 | 0.08 | 91.88 | 8.17 | 1.02 |
| Tianjin (E) | 77.89 | 2.88 | 677.58 | 69.19 | 0.86 | 0.11 | 88.84 | 9.07 | 1.98 |
| Hebei (E) | 1542.24 | 87.90 | 6798.39 | 1031.91 | 5.89 | 1.52 | 1255.50 | 291.78 | 13.05 |
| Liaoning (E) | 668.05 | 11.74 | 1912.33 | 460.65 | 2.71 | 0.60 | 725.49 | 168.07 | 9.67 |
| Shanghai (E) | 56.27 | 17.37 | 1228.77 | 206.19 | 0.90 | 0.21 | 112.14 | 21.76 | 0.78 |
| Jiangsu (E) | 1054.15 | 213.32 | 4607.41 | 882.04 | 3.85 | 0.43 | 1373.50 | 333.92 | 6.93 |
| Zhejiang (E) | 762.39 | 127.04 | 3431.27 | 126.38 | 3.54 | 0.23 | 843.80 | 150.06 | 5.43 |
| Fujian (E) | 679.73 | 55.64 | 3056.10 | 865.74 | 2.17 | 0.87 | 794.86 | 146.19 | 10.52 |
| Shandong (E) | 2109.87 | 173.58 | 8260.35 | 1958.76 | 6.22 | 1.71 | 1876.15 | 449.05 | 9.64 |
| Guangdong (E) | 1519.87 | 46.15 | 3769.90 | 212.64 | 4.38 | 0.67 | 1254.23 | 247.16 | 5.44 |
| Hainan (E) | 195.64 | 9.97 | 409.78 | 38.49 | 0.73 | 0.33 | 237.80 | 35.24 | 28.41 |
| Shanxi (C) | 641.37 | 9.40 | 1904.72 | 355.42 | 3.41 | 0.35 | 233.26 | 72.71 | 5.92 |
| Jilin (C) | 501.42 | 7.44 | 804.18 | 229.47 | 1.94 | 0.89 | 479.81 | 89.18 | 14.15 |
| Heilongjiang (C) | 700.73 | 27.62 | 3444.98 | 531.67 | 3.31 | 0.33 | 547.70 | 132.21 | 13.57 |
| Anhui (C) | 1716.69 | 165.84 | 3900.36 | 593.08 | 1.82 | 0.19 | 977.34 | 210.61 | 15.39 |
| Jiangxi (C) | 921.26 | 51.99 | 1516.46 | 214.52 | 1.69 | 0.38 | 643.50 | 121.10 | 14.65 |
| Henan (C) | 3040.34 | 289.93 | 8572.38 | 2021.19 | 5.01 | 0.76 | 1585.65 | 316.22 | 14.89 |
| Hubei (C) | 1043.06 | 92.24 | 2402.78 | 640.26 | 3.85 | 0.79 | 1055.22 | 314.60 | 14.57 |
| Hunan (C) | 1935.17 | 69.80 | 2721.92 | 494.75 | 5.54 | 2.19 | 1163.20 | 304.00 | 15.48 |
| Inner M. (W) | 530.15 | 9.03 | 2497.07 | 894.84 | 3.60 | 1.31 | 467.46 | 105.19 | 11.43 |
| Guangxi (W) | 1533.30 | 22.04 | 1455.01 | 342.54 | 1.10 | 0.25 | 787.74 | 196.65 | 19.72 |
| Chongqing (W) | 738.56 | 94.50 | 731.00 | 287.71 | 2.35 | 0.26 | 370.16 | 67.38 | 10.03 |
| Sichuan (W) | 2290.46 | 161.46 | 2640.35 | 448.00 | 2.24 | 0.56 | 1306.47 | 303.02 | 16.82 |
| Guizhou (W) | 1255.85 | 69.79 | 1437.97 | 34.78 | 2.18 | 0.74 | 344.75 | 67.51 | 15.15 |
| Yunnan (W) | 1673.97 | 18.96 | 3506.37 | 259.74 | 2.16 | 0.62 | 558.54 | 99.81 | 17.32 |
| Shaanxi (W) | 927.04 | 58.48 | 2203.29 | 427.05 | 1.88 | 0.52 | 392.22 | 118.02 | 10.23 |
| Gansu (W) | 737.58 | 20.97 | 899.10 | 160.98 | 2.72 | 0.35 | 272.49 | 61.69 | 14.71 |
| Qinghai (W) | 127.01 | 8.09 | 565.62 | 102.89 | 0.14 | 0.04 | 63.18 | 17.33 | 10.47 |
| Ningxia (W) | 137.87 | 9.74 | 382.15 | 109.54 | 0.51 | 0.12 | 63.69 | 14.68 | 10.02 |
| Xinjiang (W) | 351.63 | 23.82 | 2320.66 | 480.59 | 3.28 | 0.86 | 429.55 | 114.18 | 18.22 |
| East region | 793.41 | 68.07 | 3154.74 | 535.03 | 2.94 | 0.61 | 786.74 | 169.13 | 8.44 |
| Central region | 1312.51 | 89.28 | 3158.47 | 635.05 | 3.32 | 0.74 | 835.71 | 195.08 | 13.58 |
Note: SD is for standard deviation; AAV is for agricultural added value; agricultural share is defined as total agricultural output value divided by gross regional domestic product; E indicates eastern region; C indicates central region; W indicates western region.
Table 2.
Summary statistics of variables in regression model.
| Variable | Whole Country | East Region | Central Region | West Region | ||||
|---|---|---|---|---|---|---|---|---|
| Mean | SD | Mean | SD | Mean | SD | Mean | SD | |
| Energy price | 156.23 | 53.10 | 165.96 | 55.72 | 152.48 | 43.75 | 149.22 | 55.51 |
| Agricultural production structure (%) | 56.45 | 8.81 | 52.23 | 7.03 | 58.22 | 7.14 | 59.37 | 9.88 |
| Economic structure (%) | 13.12 | 6.62 | 9.41 | 8.11 | 14.98 | 4.35 | 15.47 | 4.35 |
| Technological change (KW per capita) | 1.01 | 0.57 | 1.07 | 0.64 | 1.10 | 0.46 | 0.90 | 0.55 |
| Income level (RMB per capita) | 3772.33 | 2062.26 | 5465.00 | 2391.11 | 3201.45 | 883.83 | 2494.83 | 776.39 |
Note: SD for standard deviation; energy price is using price indices.
Table 3.
Total-factor energy efficiency for each province from 2001 to 2011.
| Region | 2001 | 2002 | 2003 | 2004 | 2005 | 2006 | 2007 | 2008 | 2009 | 2010 | 2011 | Mean |
|---|---|---|---|---|---|---|---|---|---|---|---|---|
| Beijing (E) | 0.806 | 0.897 | 0.861 | 1.000 | 0.987 | 0.911 | 1.000 | 0.837 | 0.841 | 0.897 | 1.000 | 0.912 |
| Tianjin (E) | 0.907 | 0.872 | 0.947 | 0.934 | 0.888 | 0.873 | 0.892 | 0.908 | 0.879 | 0.855 | 0.806 | 0.887 |
| Hebei (E) | 0.452 | 0.406 | 0.444 | 0.513 | 0.449 | 0.400 | 0.456 | 0.473 | 0.477 | 0.517 | 0.559 | 0.468 |
| Liaoning (E) | 0.670 | 0.678 | 0.676 | 0.754 | 0.657 | 0.617 | 0.698 | 0.722 | 0.736 | 0.775 | 0.816 | 0.709 |
| Shanghai (E) | 0.704 | 0.725 | 0.748 | 0.772 | 0.805 | 0.880 | 0.857 | 0.932 | 0.939 | 1.000 | 1.000 | 0.851 |
| Jiangsu (E) | 0.546 | 0.546 | 0.598 | 0.695 | 0.759 | 0.813 | 0.884 | 0.989 | 0.957 | 0.952 | 1.000 | 0.794 |
| Zhejiang (E) | 0.470 | 0.466 | 0.468 | 0.525 | 0.543 | 0.518 | 0.579 | 0.625 | 0.653 | 0.744 | 0.784 | 0.580 |
| Fujian (E) | 0.944 | 0.897 | 0.941 | 0.998 | 0.587 | 0.561 | 0.628 | 0.800 | 0.736 | 0.789 | 0.837 | 0.793 |
| Shandong (E) | 0.472 | 0.455 | 0.675 | 0.737 | 0.487 | 0.478 | 0.516 | 0.881 | 0.873 | 0.923 | 1.000 | 0.682 |
| Guangdong (E) | 0.524 | 0.518 | 0.587 | 0.606 | 0.590 | 0.586 | 0.635 | 0.708 | 0.697 | 0.766 | 0.813 | 0.639 |
| Hainan (E) | 1.000 | 1.000 | 0.930 | 0.961 | 0.931 | 0.888 | 0.903 | 0.941 | 0.893 | 0.881 | 1.000 | 0.939 |
| Shanxi (C) | 0.143 | 0.127 | 0.132 | 0.239 | 0.242 | 0.212 | 0.240 | 0.240 | 0.309 | 0.324 | 0.337 | 0.231 |
| Jilin (C) | 0.993 | 0.543 | 0.375 | 1.000 | 0.775 | 0.715 | 0.706 | 1.000 | 0.964 | 0.930 | 1.000 | 0.818 |
| Heilongjiang (C) | 0.330 | 0.333 | 0.363 | 0.350 | 0.365 | 0.372 | 0.429 | 0.464 | 0.446 | 0.466 | 0.543 | 0.406 |
| Anhui (C) | 0.533 | 0.552 | 0.569 | 0.680 | 0.742 | 0.718 | 0.817 | 0.854 | 0.838 | 0.895 | 0.985 | 0.744 |
| Jiangxi (C) | 0.643 | 0.663 | 0.631 | 0.735 | 0.635 | 0.654 | 0.753 | 0.843 | 0.813 | 0.883 | 1.000 | 0.750 |
| Henan (C) | 0.426 | 0.424 | 0.411 | 0.491 | 0.516 | 0.472 | 0.535 | 0.601 | 0.591 | 0.677 | 0.642 | 0.526 |
| Hubei (C) | 0.584 | 0.560 | 0.688 | 0.826 | 0.652 | 0.600 | 0.673 | 0.777 | 0.723 | 0.862 | 1.000 | 0.722 |
| Hunan (C) | 0.659 | 0.611 | 0.641 | 0.582 | 0.445 | 0.443 | 0.460 | 0.446 | 0.404 | 0.333 | 0.393 | 0.492 |
| Inner M. (W) | 0.470 | 0.437 | 0.454 | 0.454 | 0.441 | 0.417 | 0.459 | 0.473 | 0.403 | 0.356 | 0.388 | 0.432 |
| Guangxi (W) | 0.919 | 0.892 | 0.980 | 1.000 | 0.894 | 0.864 | 0.912 | 1.000 | 0.896 | 0.924 | 1.000 | 0.935 |
| Chongqing (W) | 0.476 | 0.511 | 0.545 | 1.000 | 0.785 | 0.605 | 0.671 | 0.638 | 0.625 | 0.562 | 0.611 | 0.639 |
| Sichuan (W) | 0.862 | 0.830 | 0.783 | 0.859 | 0.771 | 0.743 | 0.941 | 1.000 | 0.872 | 0.889 | 1.000 | 0.868 |
| Guizhou (W) | 0.297 | 0.299 | 0.302 | 0.333 | 0.327 | 0.326 | 0.392 | 0.473 | 0.450 | 0.485 | 0.577 | 0.387 |
| Yunnan (W) | 0.437 | 0.464 | 0.426 | 0.300 | 0.316 | 0.325 | 0.372 | 0.397 | 0.404 | 0.416 | 0.513 | 0.397 |
| Shaanxi (W) | 0.351 | 0.385 | 0.331 | 0.340 | 0.325 | 0.303 | 0.346 | 0.392 | 0.386 | 0.451 | 0.506 | 0.374 |
| Gansu (W) | 0.173 | 0.158 | 0.204 | 0.297 | 0.259 | 0.279 | 0.364 | 0.434 | 0.428 | 0.461 | 0.455 | 0.319 |
| Qinghai (W) | 0.988 | 1.000 | 1.000 | 0.975 | 1.000 | 0.992 | 1.000 | 0.995 | 0.962 | 0.970 | 1.000 | 0.989 |
| Ningxia (W) | 1.000 | 0.982 | 0.983 | 0.944 | 0.912 | 0.884 | 0.860 | 0.854 | 0.856 | 0.859 | 0.855 | 0.908 |
| Xinjiang (W) | 0.503 | 0.494 | 0.602 | 0.555 | 0.538 | 0.491 | 0.540 | 0.471 | 0.449 | 0.508 | 0.447 | 0.509 |
| East region | 0.681 | 0.678 | 0.716 | 0.772 | 0.698 | 0.684 | 0.732 | 0.802 | 0.789 | 0.827 | 0.874 | 0.750 |
| Central region | 0.539 | 0.476 | 0.476 | 0.613 | 0.546 | 0.523 | 0.576 | 0.653 | 0.636 | 0.671 | 0.737 | 0.586 |
| West region | 0.589 | 0.586 | 0.601 | 0.642 | 0.597 | 0.566 | 0.623 | 0.648 | 0.612 | 0.626 | 0.668 | 0.614 |
| Whole country | 0.609 | 0.591 | 0.610 | 0.682 | 0.621 | 0.598 | 0.651 | 0.706 | 0.683 | 0.712 | 0.762 | 0.657 |
Note: E indicates eastern region provinces; C indicates central region provinces; W indicates western region provinces; the last four rows are calculated by simple average.
Table 4.
Energy savings potential for each province from 2001 to 2011 (Mtce).
| Region | 2001 | 2002 | 2003 | 2004 | 2005 | 2006 | 2007 | 2008 | 2009 | 2010 | 2011 | Mean |
|---|---|---|---|---|---|---|---|---|---|---|---|---|
| Beijing (E) | 0.228 | 0.119 | 0.156 | 0.000 | 0.012 | 0.092 | 0.000 | 0.180 | 0.182 | 0.120 | 0.000 | 0.099 |
| Tianjin (E) | 0.072 | 0.114 | 0.037 | 0.047 | 0.090 | 0.107 | 0.095 | 0.079 | 0.108 | 0.142 | 0.210 | 0.100 |
| Hebei (E) | 2.033 | 2.606 | 2.374 | 2.162 | 3.124 | 3.578 | 3.497 | 3.596 | 3.852 | 3.799 | 3.477 | 3.100 |
| Liaoning (E) | 0.678 | 0.619 | 0.611 | 0.496 | 0.965 | 1.191 | 0.977 | 0.873 | 0.814 | 0.714 | 0.620 | 0.778 |
| Shanghai (E) | 0.344 | 0.305 | 0.290 | 0.257 | 0.195 | 0.098 | 0.115 | 0.045 | 0.041 | 0.000 | 0.000 | 0.154 |
| Jiangsu (E) | 1.849 | 1.761 | 1.564 | 1.216 | 0.810 | 0.641 | 0.403 | 0.038 | 0.162 | 0.202 | 0.000 | 0.786 |
| Zhejiang (E) | 1.643 | 1.966 | 1.868 | 1.611 | 1.549 | 1.655 | 1.512 | 1.321 | 1.220 | 0.972 | 0.855 | 1.470 |
| Fujian (E) | 0.060 | 0.115 | 0.065 | 0.002 | 1.162 | 1.288 | 1.096 | 0.485 | 0.690 | 0.581 | 0.492 | 0.549 |
| Shandong (E) | 3.525 | 3.626 | 1.046 | 0.934 | 3.917 | 4.321 | 4.149 | 0.643 | 0.738 | 0.482 | 0.000 | 2.125 |
| Guangdong (E) | 1.891 | 1.826 | 1.279 | 1.382 | 2.054 | 2.009 | 1.757 | 1.426 | 1.398 | 1.068 | 0.943 | 1.549 |
| Hainan (E) | 0.000 | 0.000 | 0.030 | 0.020 | 0.038 | 0.080 | 0.063 | 0.050 | 0.104 | 0.145 | 0.000 | 0.048 |
| Shanxi (C) | 3.064 | 3.265 | 3.168 | 2.406 | 2.386 | 2.561 | 1.977 | 2.531 | 2.445 | 2.469 | 2.538 | 2.619 |
| Jilin (C) | 0.009 | 1.306 | 2.582 | 0.000 | 0.441 | 0.599 | 0.651 | 0.000 | 0.046 | 0.093 | 0.000 | 0.521 |
| Heilongjiang (C) | 2.125 | 1.894 | 1.967 | 2.136 | 1.932 | 2.015 | 1.942 | 1.679 | 1.963 | 1.944 | 1.849 | 1.950 |
| Anhui (C) | 0.874 | 0.784 | 0.775 | 0.559 | 0.396 | 0.447 | 0.304 | 0.273 | 0.314 | 0.218 | 0.032 | 0.452 |
| Jiangxi (C) | 0.474 | 0.457 | 0.589 | 0.381 | 0.879 | 0.793 | 0.480 | 0.275 | 0.311 | 0.173 | 0.000 | 0.437 |
| Henan (C) | 2.395 | 2.452 | 2.589 | 2.325 | 2.234 | 2.631 | 2.330 | 2.062 | 2.213 | 1.854 | 2.429 | 2.319 |
| Hubei (C) | 1.293 | 1.429 | 0.856 | 0.459 | 1.308 | 1.657 | 1.415 | 1.001 | 1.319 | 0.637 | 0.000 | 1.034 |
| Hunan (C) | 1.016 | 1.356 | 1.129 | 1.600 | 2.844 | 2.859 | 3.023 | 3.632 | 4.202 | 6.446 | 5.073 | 3.016 |
| Inner M. (W) | 1.089 | 1.218 | 1.361 | 1.669 | 1.705 | 1.911 | 1.837 | 2.043 | 2.868 | 3.713 | 3.500 | 2.083 |
| Guangxi (W) | 0.064 | 0.095 | 0.015 | 0.000 | 0.105 | 0.148 | 0.116 | 0.000 | 0.128 | 0.105 | 0.000 | 0.070 |
| Chongqing (W) | 1.197 | 1.172 | 1.055 | 0.000 | 0.461 | 0.930 | 0.766 | 0.877 | 0.871 | 1.167 | 1.090 | 0.871 |
| Sichuan (W) | 0.183 | 0.236 | 0.329 | 0.313 | 0.524 | 0.676 | 0.145 | 0.000 | 0.343 | 0.294 | 0.000 | 0.277 |
| Guizhou (W) | 1.721 | 1.807 | 1.965 | 1.894 | 1.937 | 1.994 | 1.426 | 0.694 | 0.768 | 0.645 | 0.477 | 1.393 |
| Yunnan (W) | 0.702 | 0.627 | 0.734 | 1.969 | 1.846 | 1.747 | 1.513 | 1.475 | 1.495 | 1.387 | 1.108 | 1.328 |
| Shaanxi (W) | 0.814 | 0.663 | 0.897 | 1.011 | 1.165 | 1.423 | 1.365 | 1.376 | 1.435 | 1.326 | 1.295 | 1.161 |
| Gansu (W) | 1.936 | 1.984 | 1.828 | 1.602 | 2.026 | 2.061 | 1.795 | 1.681 | 1.744 | 1.663 | 1.733 | 1.823 |
| Qinghai (W) | 0.002 | 0.000 | 0.000 | 0.003 | 0.000 | 0.001 | 0.000 | 0.001 | 0.007 | 0.006 | 0.000 | 0.002 |
| Ningxia (W) | 0.000 | 0.007 | 0.007 | 0.025 | 0.041 | 0.059 | 0.074 | 0.087 | 0.088 | 0.092 | 0.099 | 0.053 |
| Xinjiang (W) | 1.228 | 1.234 | 0.918 | 1.102 | 1.345 | 1.609 | 1.511 | 2.038 | 2.269 | 2.072 | 2.665 | 1.636 |
| East region (total) | 12.322 | 13.058 | 9.319 | 8.127 | 13.914 | 15.061 | 13.664 | 8.736 | 9.309 | 8.226 | 6.598 | 10.758 |
| Central region (total) | 11.250 | 12.944 | 13.656 | 9.866 | 12.420 | 13.562 | 12.123 | 11.453 | 12.813 | 13.834 | 11.920 | 12.349 |
| West region (total) | 8.935 | 9.044 | 9.110 | 9.588 | 11.154 | 12.559 | 10.549 | 10.272 | 12.015 | 12.468 | 11.966 | 10.696 |
| Whole country (total) | 32.507 | 35.045 | 32.085 | 27.581 | 37.488 | 41.182 | 36.335 | 30.461 | 34.137 | 34.528 | 30.484 | 33.803 |
Note: E for eastern region; C for central region; W for western region; the last four rows are calculated by summing up the corresponding numbers.
Table 5.
Results of Tobit regression (Dependent variable: TFEE).
| Independent Variable | All Sample | East Region | Central Region | West Region |
|---|---|---|---|---|
| Coefficient | Coefficient | Coefficient | Coefficient | |
| Energy price | −0.02 | −0.086 | 0.338 | 0.001 |
| −0.087 | −0.125 | −0.266 | −0.136 | |
| Agricultural production structure | −0.573 *** | −0.613 *** | −0.700 ** | −0.257 |
| −0.178 | −0.234 | −0.349 | −0.321 | |
| Economic structure | 0.185 ** | 0.089 | 0.241 | 0.861 *** |
| −0.073 | −40.083 | −0.216 | −0.209 | |
| Technological change | −0.076 | −0.056 | −0.467 *** | 0.513 *** |
| −0.055 | −0.066 | −0.16 | −0.139 | |
| Income level | 0.592 *** | 0.593 *** | 0.943 *** | 0.079 |
| −0.122 | −0.193 | −0.32 | −0.228 | |
| Constant | 1.27 | 1.931 | −3.084 | 2.283 |
| −1.224 | −1.831 | −2.619 | −1.908 | |
| Log likelihood | 26.66 | 34.79 | 5.32 | 12.15 |
Note: *, **, *** indicate significant at 10%, 5% and 1% respectively. Standard errors in parentheses.
© 2018 by the authors. Licensee MDPI, Basel, Switzerland. This article is an open access article distributed under the terms and conditions of the Creative Commons Attribution (CC BY) license (http://creativecommons.org/licenses/by/4.0/).
Share and Cite
MDPI and ACS Style
Yang, Z.; Wang, D.; Du, T.; Zhang, A.; Zhou, Y. Total-Factor Energy Efficiency in China’s Agricultural Sector: Trends, Disparities and Potentials. Energies 2018, 11, 853. https://doi.org/10.3390/en11040853
AMA Style
Yang Z, Wang D, Du T, Zhang A, Zhou Y. Total-Factor Energy Efficiency in China’s Agricultural Sector: Trends, Disparities and Potentials. Energies. 2018; 11(4):853. https://doi.org/10.3390/en11040853
Chicago/Turabian StyleYang, Zhihai, Dong Wang, Tianyi Du, Anlu Zhang, and Yixiao Zhou. 2018. "Total-Factor Energy Efficiency in China’s Agricultural Sector: Trends, Disparities and Potentials" Energies 11, no. 4: 853. https://doi.org/10.3390/en11040853
Note that from the first issue of 2016, this journal uses article numbers instead of page numbers. See further details here.