Evaluation of Harmonics Impact on Digital Relays


Department of Electrical Power Engineering, Brno University of Technology, Technicka 12, 61600 Brno, Czech Republic
*
Author to whom correspondence should be addressed.
Energies 2018, 11(4), 893; https://doi.org/10.3390/en11040893
Submission received: 28 February 2018
/
Revised: 2 April 2018
/
Accepted: 4 April 2018
/
Published: 11 April 2018
(This article belongs to the Special Issue Power Electronics and Power Quality)
Abstract
:This paper presents the concept of the impact of harmonic distortion on a digital protection relay. The aim is to verify and determine the reasons of a mal-trip or failure to trip the protection relays; the suggested solution of the harmonic distortion is explained by a mathematical model in the Matlab Simulink programming environment. The digital relays have been tested under harmonic distortions in order to verify the function of the relays algorithm under abnormal conditions. The comparison between the protection relay algorithm under abnormal conditions and a mathematical model in the Matlab Simulink programming environment based on injected harmonics of high values is provided. The test is separated into different levels; the first level is based on the harmonic effect of an individual harmonic and mixed harmonics. The test includes the effect of the harmonics in the location of the fault point into distance protection zones. This paper is a new proposal in the signal processing of power quality disturbances using Matlab Simulink and the power quality impact on the measurements of the power system quantities; the test simulates the function of protection in power systems in terms of calculating the current and voltage values of short circuits and their faults. The paper includes several tests: frequency variations and decomposition of voltage waveforms with Fourier transforms (model) and commercial relay, the effect of the power factor on the location of fault points, the relation between the tripping time and the total harmonic distortion (THD) levels in a commercial relay, and a comparison of the THD capture between the commercial relay and the model.
1. Introduction
In electrical engineering, the protective relay is a relay device designed to trip a circuit breaker when a fault is detected, and has the ability to measure the power system quantities through the internal logic of a microprocessor. Digital relays have become more efficient and functional, especially for each of the following processes: the digital relay features accurate methods to calculate the voltage, current measurements, and other electrical quantities, and has become a communication standard for electrical Substation Automation Systems (SAS). Digital relays include multi-protection functions such as distance protection, overcurrent protection, under-voltage protection, etc. In addition, there are many measurements that can be done using the microprocessor, such as internal/external fault diagnosis, fault measurements, zero current sequences, and disturbance recording. Additional functions of the digital relays, such as monitoring, metering, setting groups, fault recorder communication, and reports, have no direct relation to the protective elements. The hierarchy structure of power system automation comprises an electrical protection relay, control, measurement and monitoring, and data communications. Power system automation is a system that is integrated into the various components connected to the power network. The numerical relay is a focal concept of the power system automation for protecting the equipment and limiting the damage. The system’s components have better communication with each other; the information is exchanged via dozens of communication protocols, this concept can be characterized by the fact that one sensor is enough to obtain and collect information through the network instead of a sensor per component in the power system. Power system automation has several levels to integrate between the power substations and the substation supervisory system (SCADA). It defines both the information model and services used for communication between the Intelligent Electronic Devices (IEDs) in a substation.
Some studies presented the practical test of the harmonic influence on electromechanical and microprocessor relays, the test implemented the current signal accompanied by the total harmonic distortion on relays, these studies found that the mixed-harmonics influence is minor on the protective relays, conversely, the influence of pure signal above the fundamental frequency found a significant effect on protection relays function [1,2,3,4,5]. The evaluation influence of the power quality on the proactive relays presented using the simulation models (Mathcad software) [6,7,8,9], these studies focused on the advantages and distances of the relay algorithm. The harmonic distortions in the power system and the associated problems caused by non-linear loads were briefly discussed. A review related to various methodologies for detecting and measuring harmonics based on this review of a new hybrid method for detecting and measuring harmonics is introduced in these references [10,11,12]. Few studies explore the research associated with quantifying the cost of reliability and power quality. Various power quality disturbances are investigated and possible methods of quantifying both the effect and cost are presented [13,14,15], moreover, it aims at analyzing and probing the influences of harmonics to differential relays. It analyzes and compares the mathematic models which are constructed by using EMTP and the test results [16,17]. It presents the impact of the fault in the power line based on the short circuit and abnormal condition, comparing the fault tripping time on the distance relay with two simulation scenarios developed using matlab environment [18].
This paper explains the signal processing of power quality disturbances using Matlab 2016, MathWorks, Natick, MA, USA) Simulink, especially the power quality impact on the measurements of the power system quantities; the test simulates the function of protection in power systems in terms of calculating the current and voltage values of short circuits and their faults. The model includes a number of blocks that process the signals for the current and voltage coming from the simulator side. First, the current and voltage signals are filtered through a low-pass filter which removes the high-frequency components from these signals. After the passage of the signals through the filter, there is the second level that converts the analog signals into digital signals through the processing signal within four stages. The first stage is the sampling process of the original signal, taking into account the sampling frequency which is determined to be 80 samples/cycle according to IEC standard 61850 (4000 Hz per second for systems operating at 50 Hz frequency). For this block, the input signals are analog and plus generator signals. The signal is then inserted into a quantizer that converts the sinusoidal signal into a digital signal. Meanwhile, the signal is filtered through a digital filter. The parameters of this filter are adjusted to match the previous filter. The last stage is the calculation relating to the signal itself, which includes the amplitude angle using the Fourier transformation or an arms calculation. The model characteristics are calculated from the parameters of the component with the intention to protect the relay, such as the transmission line, the transformer, and the generator, etc.
2. Impact of Harmonics on Protection Relays
The main reasons to study the power quality as follows:
- Intelligent electrical devices (IED) have become more accurate in power quality measurements and less tolerant with higher frequency components than the nominal frequency of these devices. The major risk of harmonics in power systems is mal-operation of the protective relays and the thermoelectric effect accompanied by these harmonics.
The reason to study the impact of harmonics on protective relays is the existence of harmonics in current and voltage signals which can cause a mal-trip of the relay when no fault happens or the system fails to trip when there is a fault in the power system, especially when a harmonic can be noticed during faulty performance. The relay algorithm is an important factor to define the harmonic impact. There is a difference between the higher values of relay tripping thresholds and the lower values of normal operation. A large difference will cause a higher risk of failure to trip and mal operation. The power systems quantities are converted to the digital form that provides easy implementation of digital processing signal (DPS) and analysis the power quality.
Usually, the harmonic can be determined by the load characteristics; moreover, the harmonic in the current has a more intense impact than the harmonic in the voltage.
In the power system, the harmonics might reduce the power quality and cause a number of problems, such as overloads in distribution systems because of an increase in the rms current value, and harmonics can also cause a shorter lifespan of generators, transformers, motors, and other power system components. On the other hand, the sensitive loads can be affected by harmonic distortion.
Harmonic Phenomena
The total harmonic distortion (%THD) is a percentage of the rms of the fundamental component.
The percentage current total harmonic distortion is
where is the current harmonic amplitude of order h (i.e., the h-th harmonic) and Irms is the current amplitude of the normal frequency and harmonic components:
This subsequently leads to the formula:
The total power factor
The percentage voltage total harmonic distortion is
where is the voltage harmonic amplitude of order h (i.e., the hth harmonic) and Vrms is the voltage amplitude of the normal frequency and harmonic components:
The European energy organizations define the power quality in three parameters [2]:
- Commercial quality: it refers to the services which provide by the electrical distribution companies. Voltage quality: it refers to the total harmonic distortion, frequency variation and voltage distortion can cause mal-operation. Levels of continuity of supply depend on the measurements which can be collected at all voltage level.
The IEC (International Electrotechnical Commission) is an organization for standardization comprising all national electrotechnical committees.
There are three European standards defining the limitation of harmonic currents injected to the power system. They define the limits of the harmonic component of the input current which may be produced by the equipment:
- IEC 61000-3-2:2014 Electromagnetic compatibility (EMC)—Part 3-2: Limits—Limits for harmonic current emissions (equipment input current ≤16 A per phase). This standard is applicable to the electrical equipment which required an input current up to 16 A.
- IEC 61000-4-7: Testing and measurement techniques—General guide on harmonics and inter-harmonics measurements and instrumentation, for power supply systems and equipment connected thereto. The new requirement launched for measuring harmonic should get 10 cycles of the fundamental current. Furthermore, no gap and no overlapping between the successive measuring windows are allowed.
- IEEE 519: The standard provides limitations for a harmonic distortion (a limitation on the harmonic voltage distortion provided by the distributor to the customers, a limitation on the harmonic current distortion superimposed to the system by a customer).
- Individual Voltage Distortion limits for the bus voltage level of 69 kV and below should be not be exceeded by 3% and the total voltage distortion THD should be not be exceeded by 5%. Moreover, according to IEEE 519, there are more conditions with regard to the effects of harmonics on protective relays (electromechanical, static, and digital relays).
3. Description of Mathematical Model
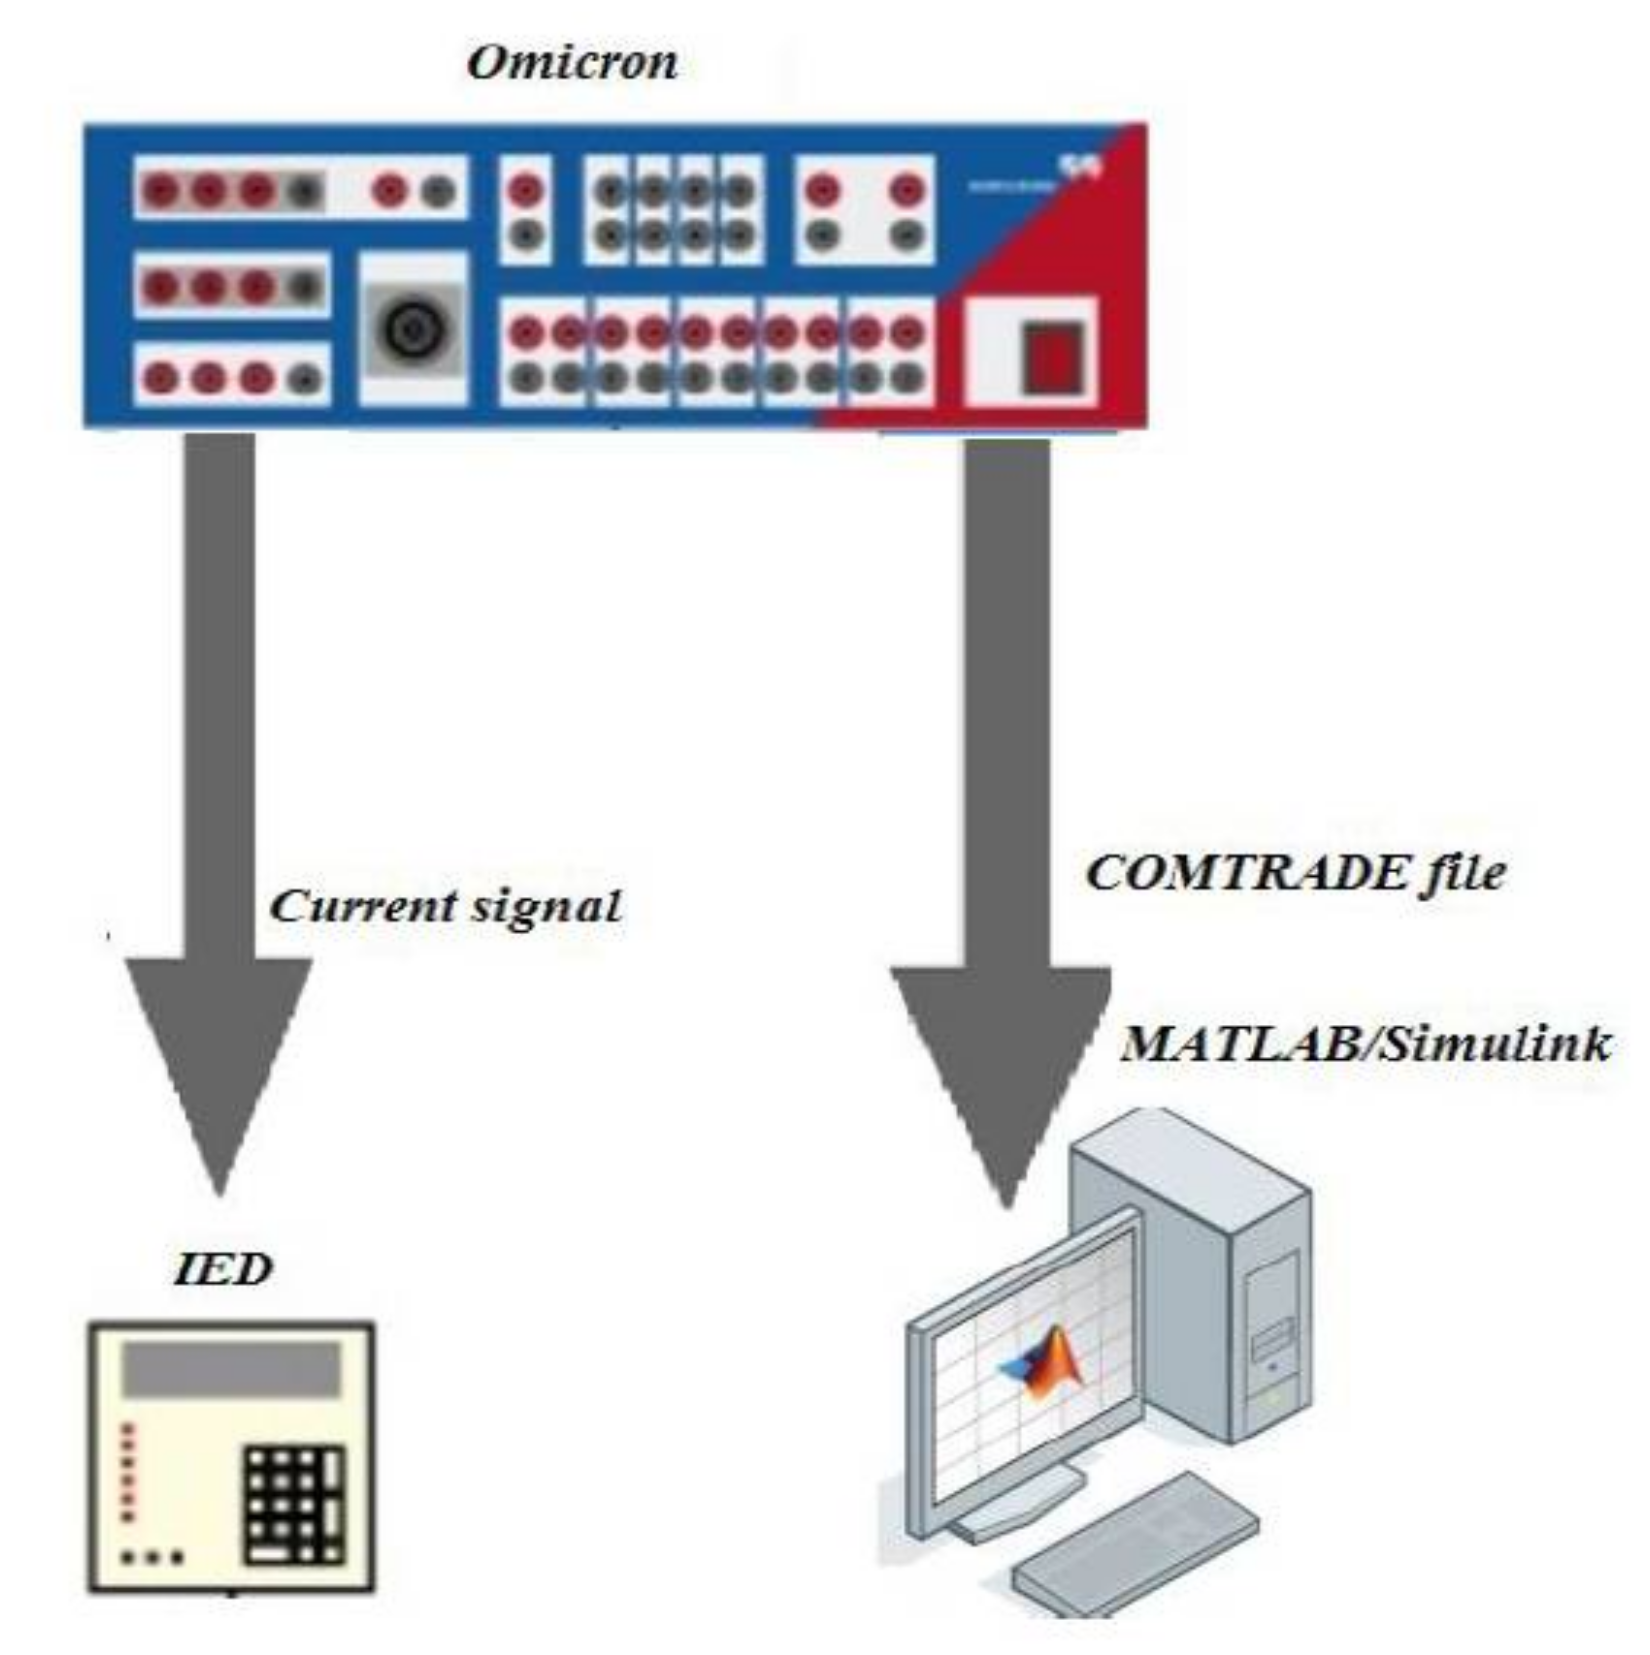
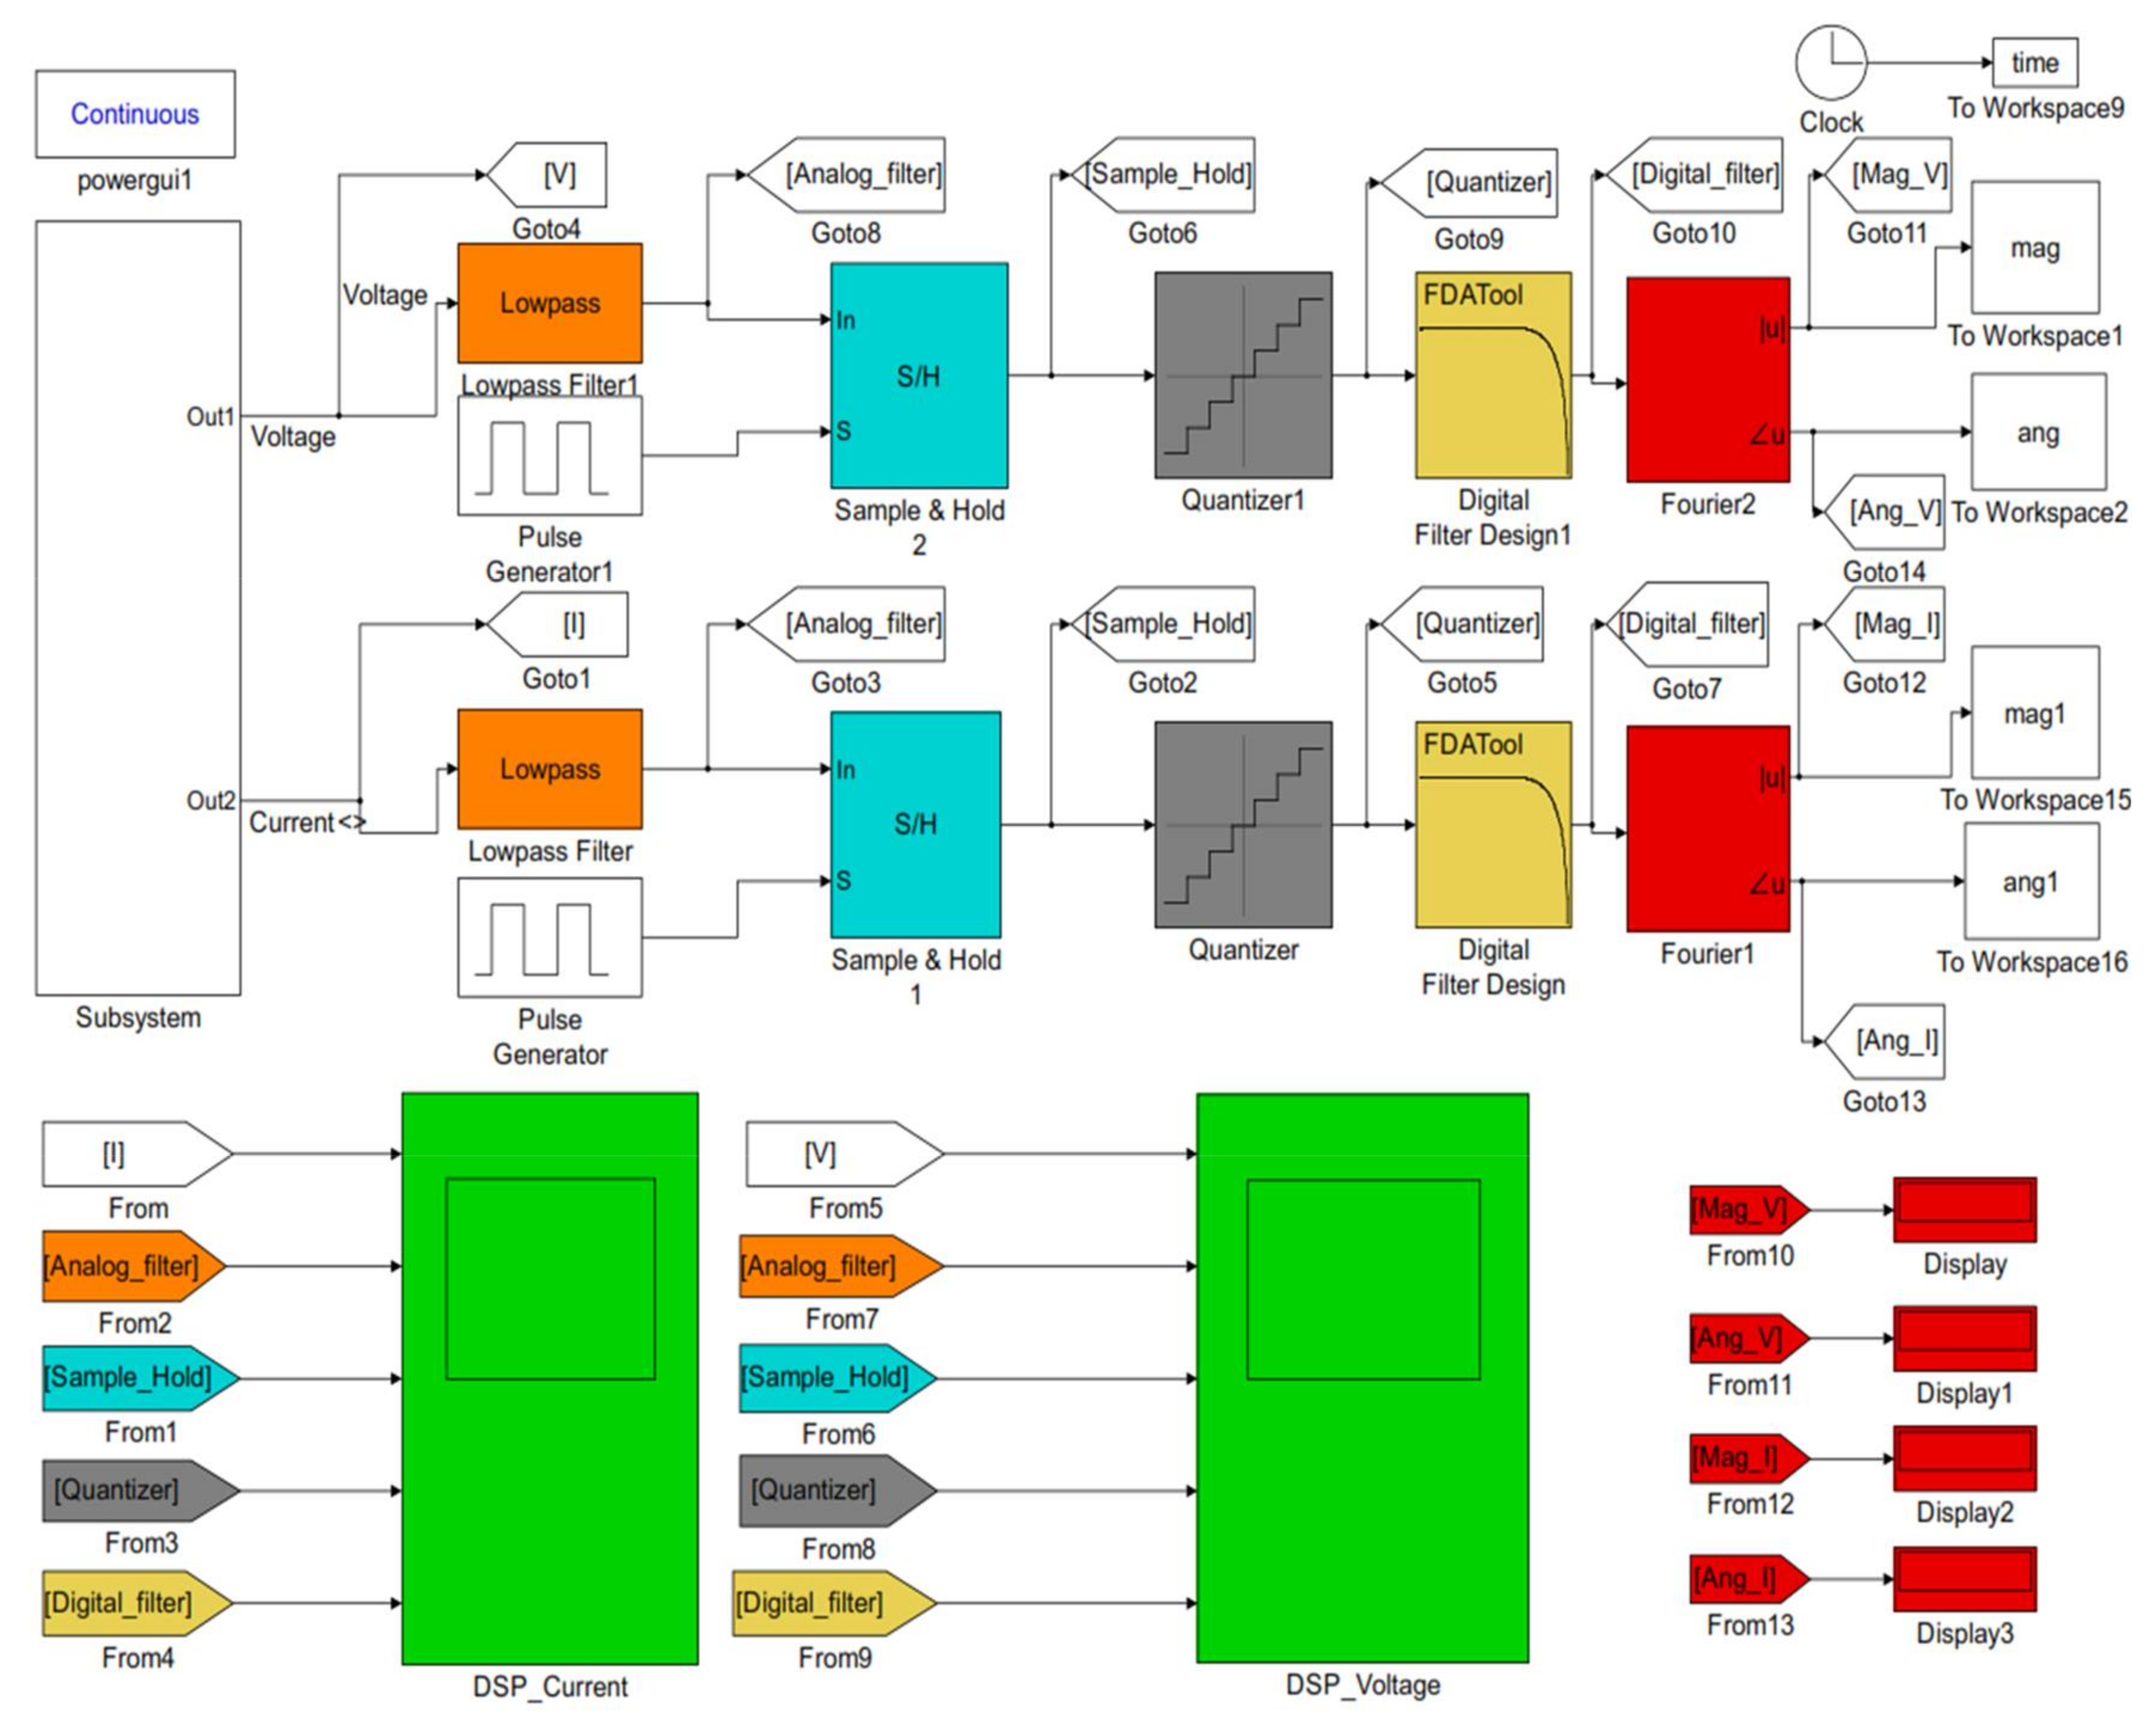
The model is a suggested method of processing the voltage and current signals similarly to the process that takes place in relays, precisely, for the frequency variations and the number of samples per cycle. To ensure the validity of the test for this model, a comparison was made between the output of the model and the output of the physical relay located in the laboratory. The simulator generated signals for the voltage and current of a single phase fault (a short circuit) with the accompanying of these signals. These signals have been sent to the physical relay and have been recorded and changed the format to Comtrade (Common Format for Transient Data Exchange for power systems); after that the signals have been sent to the model; see Figure 1. Comtrade is a file format for status data related to a transient power system and storing signals. In addition to blocks that simulate these physical elements, the model also contains a display and calculation blocks for graphic representation of the results of simulated scenarios. The model presents the simulation and modeling of communication-based digital relay using Matlab and the model tested under abnormal conditions (short circuit) and under various fault types. The behavior of the model can be monitored and compared with the real protection relay by using the Enerlyzer in Omicron which can able to record voltage and current signals. The model reads the recorded signals by using a comtrade reader and the model offers the analysis of signals as shown in Figure 2.
The model was made in the Matlab Simulink programming environment (Figure 2) using elements of the Sim-Power-Systems library. The first step is to get the current and voltage signals from the current and voltage transformer sides and apply some functions to them. The digital processing signal is the process of modifying a signal to improve the performance of the relay, to eliminate the high-frequency components, and to avoid the phenomenon of aliasing from a fault signal; low pass anti-aliasing analog filters with suitable cut-off frequency are used. Holding and sampling the signal is the second block of the signal process which converts the analog signal to the sample. The quantizer converts the smooth signal into a stair step output. Fast Fourier Transform (FFT) is a faster version of the Discrete Fourier Transform (DFT) which is used to find the fundamental frequency and higher frequencies contained in the input signal [6,7].
3.1. The Low Pass Filter Block
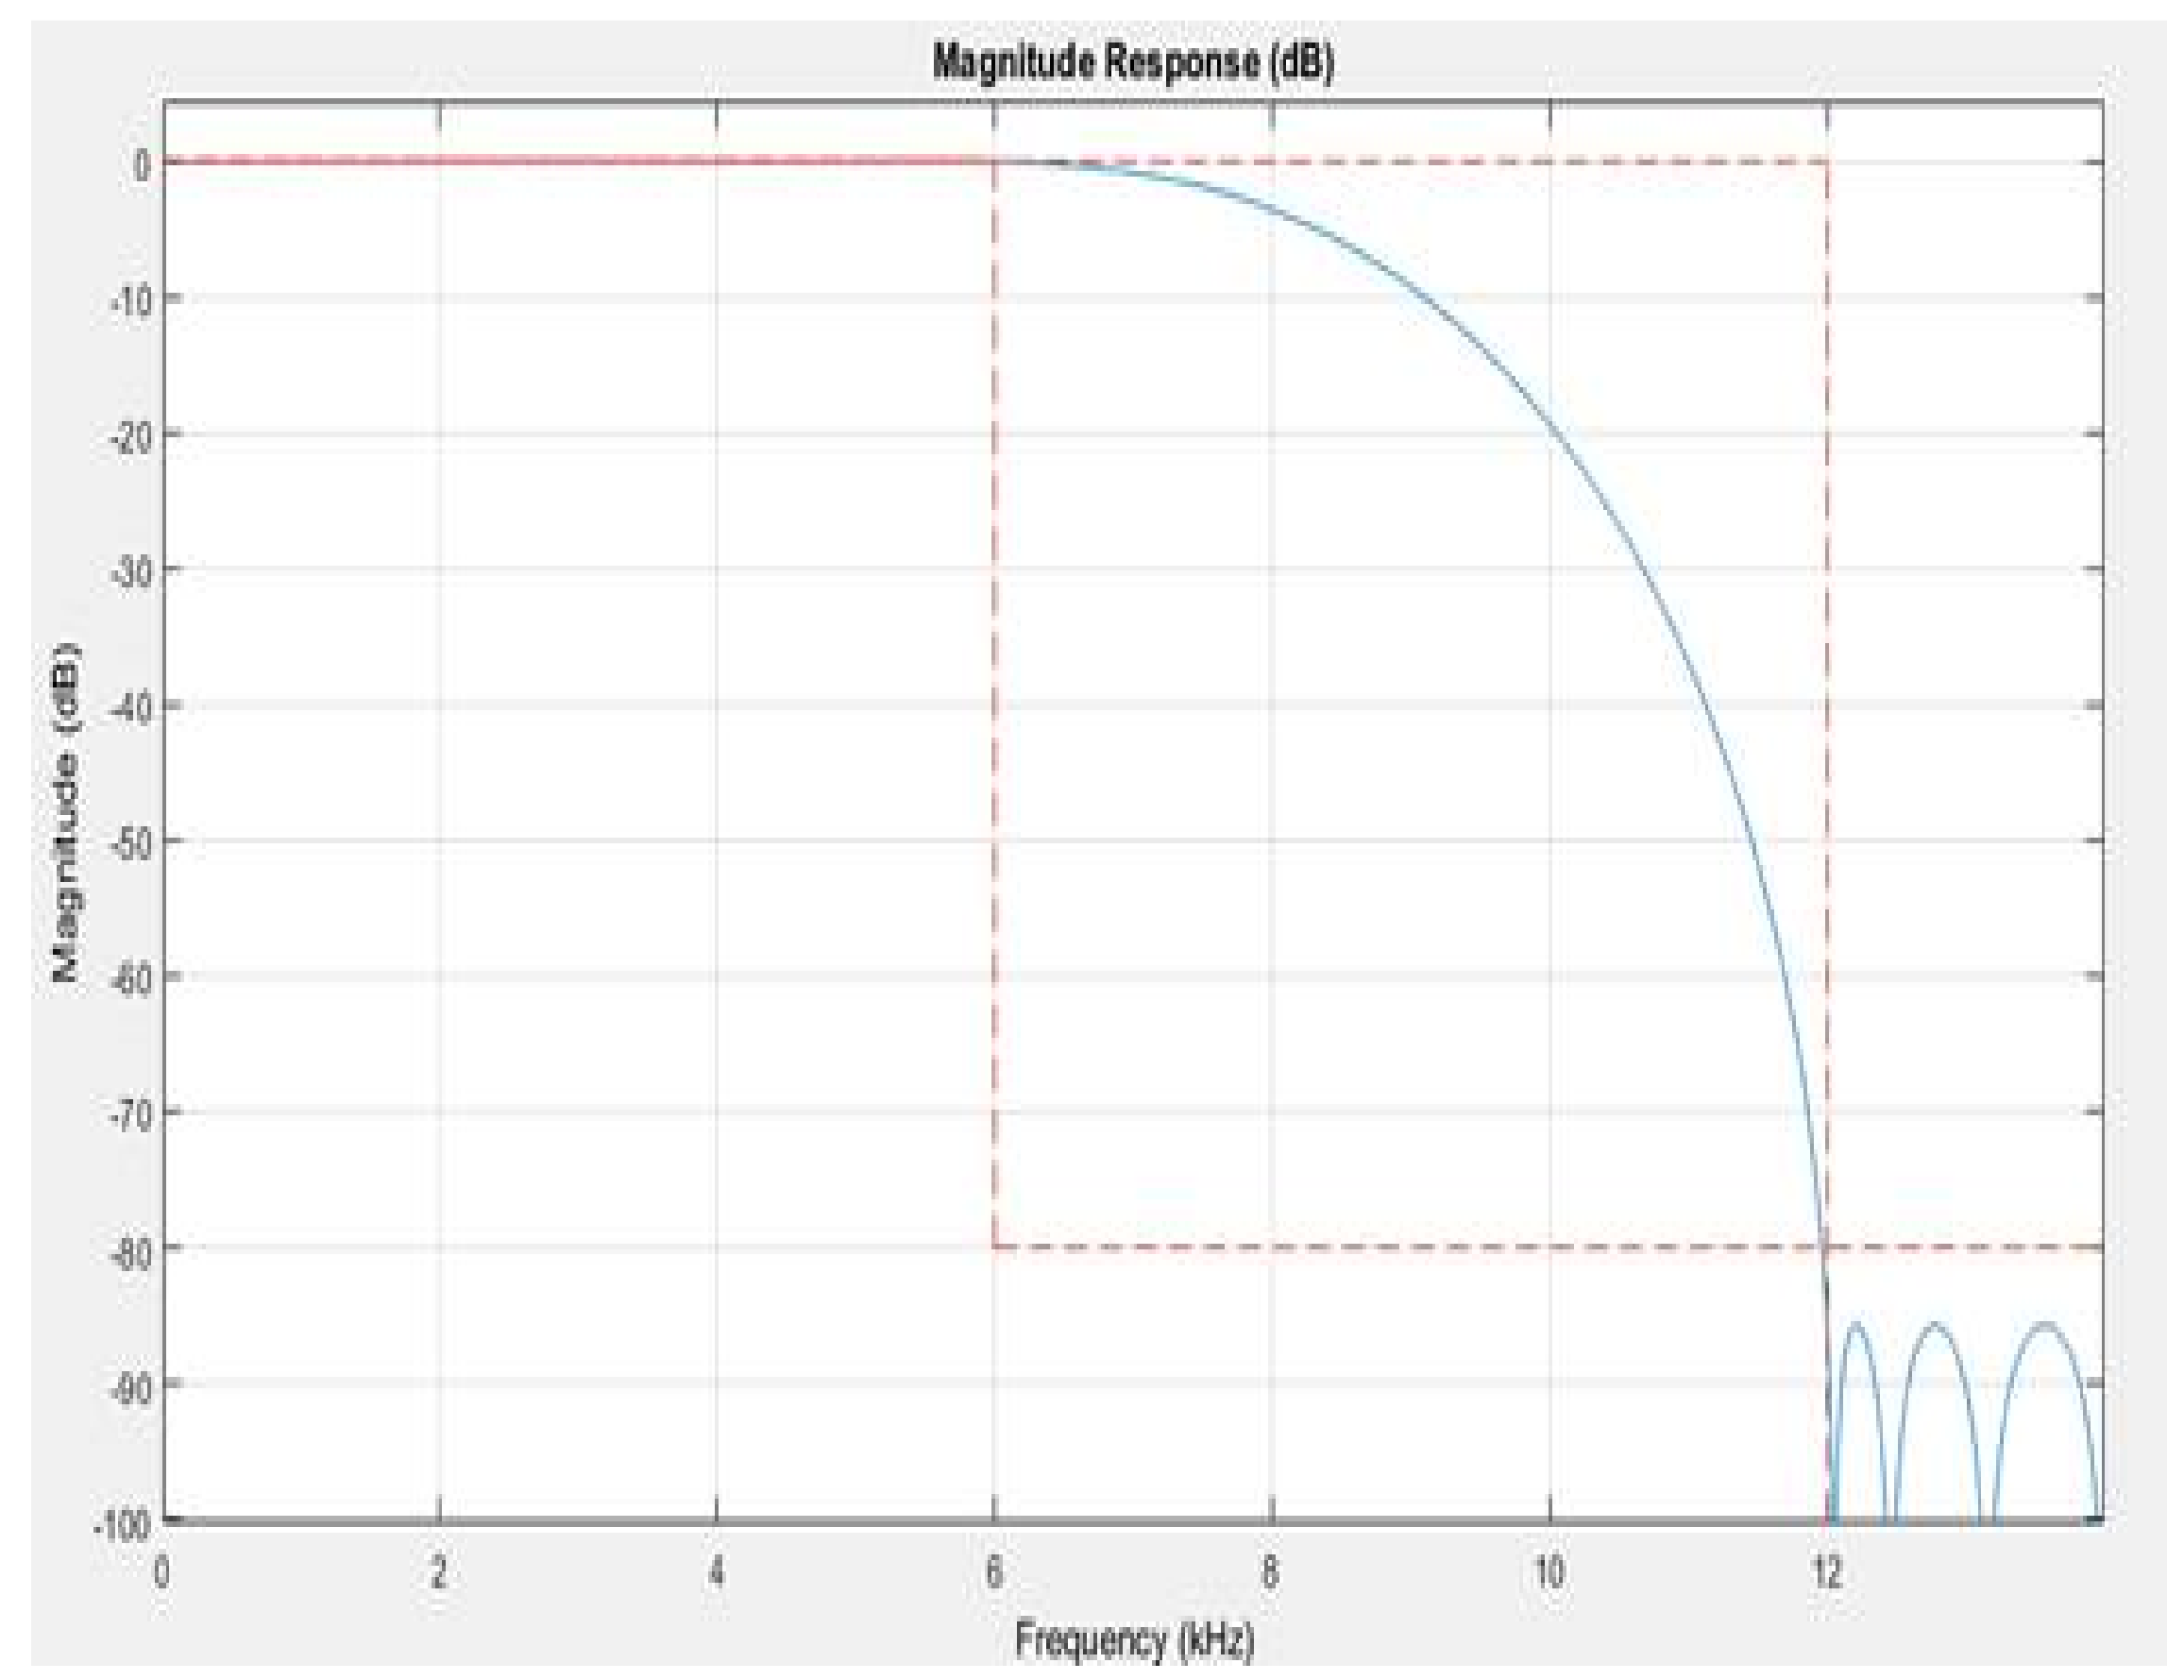
The low pass filter block can filter every channel of the input signal separately using the given design specification as shown in Figure 3 and the Table 1. A detailed description and the possibilities of determining equivalent parameters are thoroughly discussed in [9,19].
The output signal from the Finite impulse response (FIR) filter can be described by Equation (1):
where:
- Refers to the current or voltage signals,
- Refers to the filtering signal,
- Refers to the filter order,
- is the value of the impulse response at the th instant for ≤ ≤ of an th-order FIR filter.
3.2. Sample and Hold
The sample and hold block gets the input signal when it receives a trigger event at the trigger port. The block holds the output signal until the next triggering event occurs.
- When the trigger input rises from a negative value to a positive value, the block starts to acquire the input signal.
- When the trigger input drops from a positive value to a negative value, the block starts to acquire the input signal.
3.3. Pulse Generator
The pulse generator block is the trigger input of the sample and hold block. It generates square wave pulses at regular intervals. The block waveform parameters (amplitude, pulse width, period, and phase delay) determine the shape of the output waveform.
3.4. Fourier Block
The Fourier block offers the calculation the amplitude and phase of the input signal (current and voltage), total harmonic distortion. The block offers analysis of the signal components as a percentage of the fundamental signal.
Recall that a signal f(t) can be expressed by a Fourier series of the form
where represents the rank of the harmonics. ( = 1 corresponds to the fundamental component.) The magnitude and phase of the selected harmonic component are calculated by these equations:
where
: Fundamental frequency.
3.5. Phase Locked Loop (PLL) System
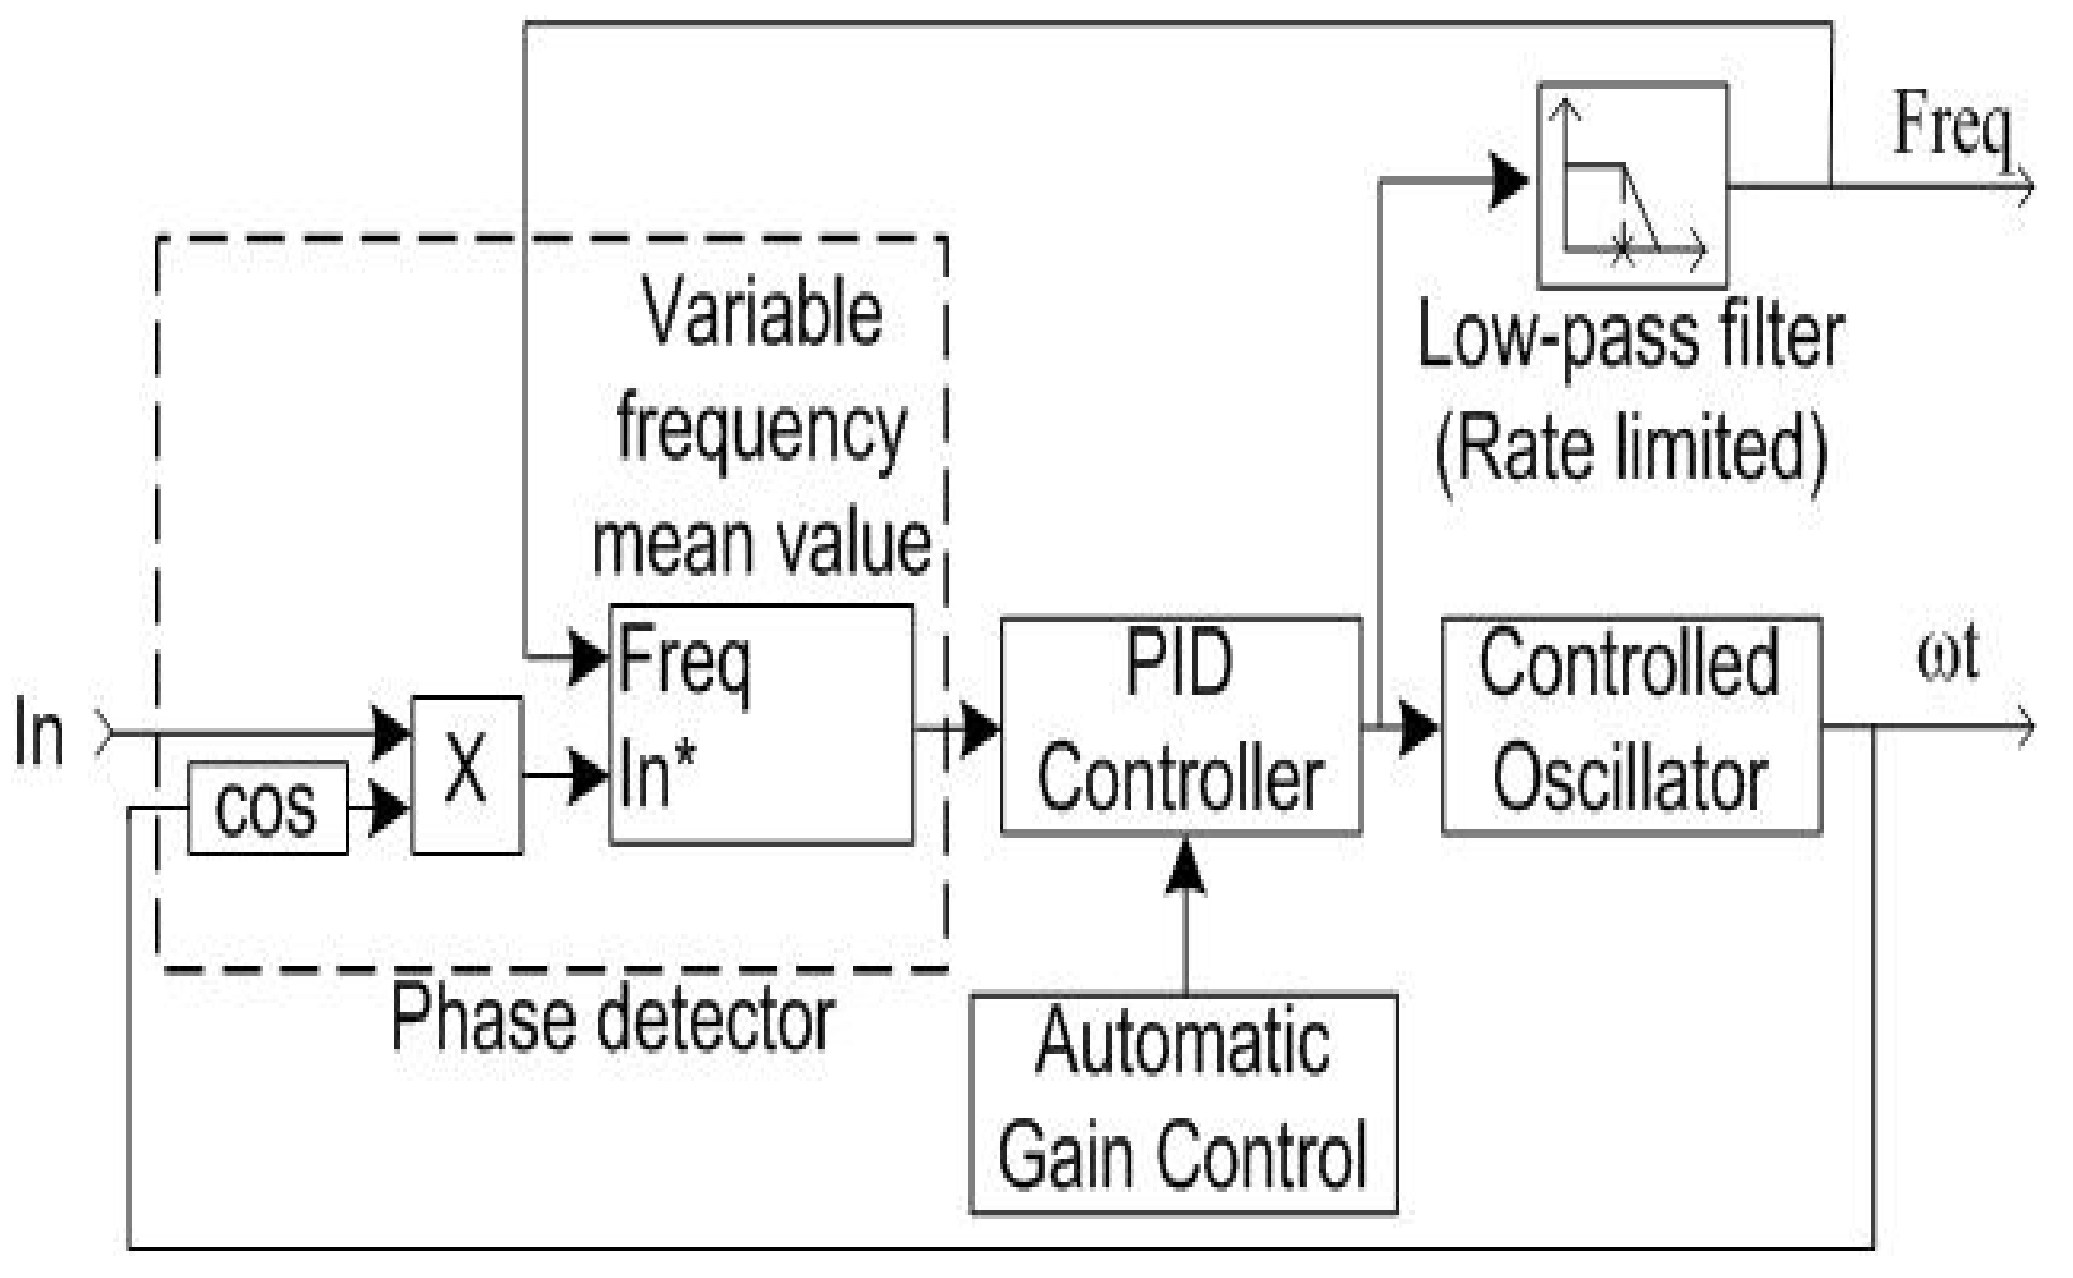
This block is used to synchronize a variable frequency sinusoidal signal. Meanwhile, this model is used to determine the frequency and the fundamental component of the signal phase angle which can be used to track the frequency and phase of the sinusoidal signal by using an internal frequency oscillator. The control system changes the internal frequency to keep the phase difference set to 0, as shown in Figure 4.
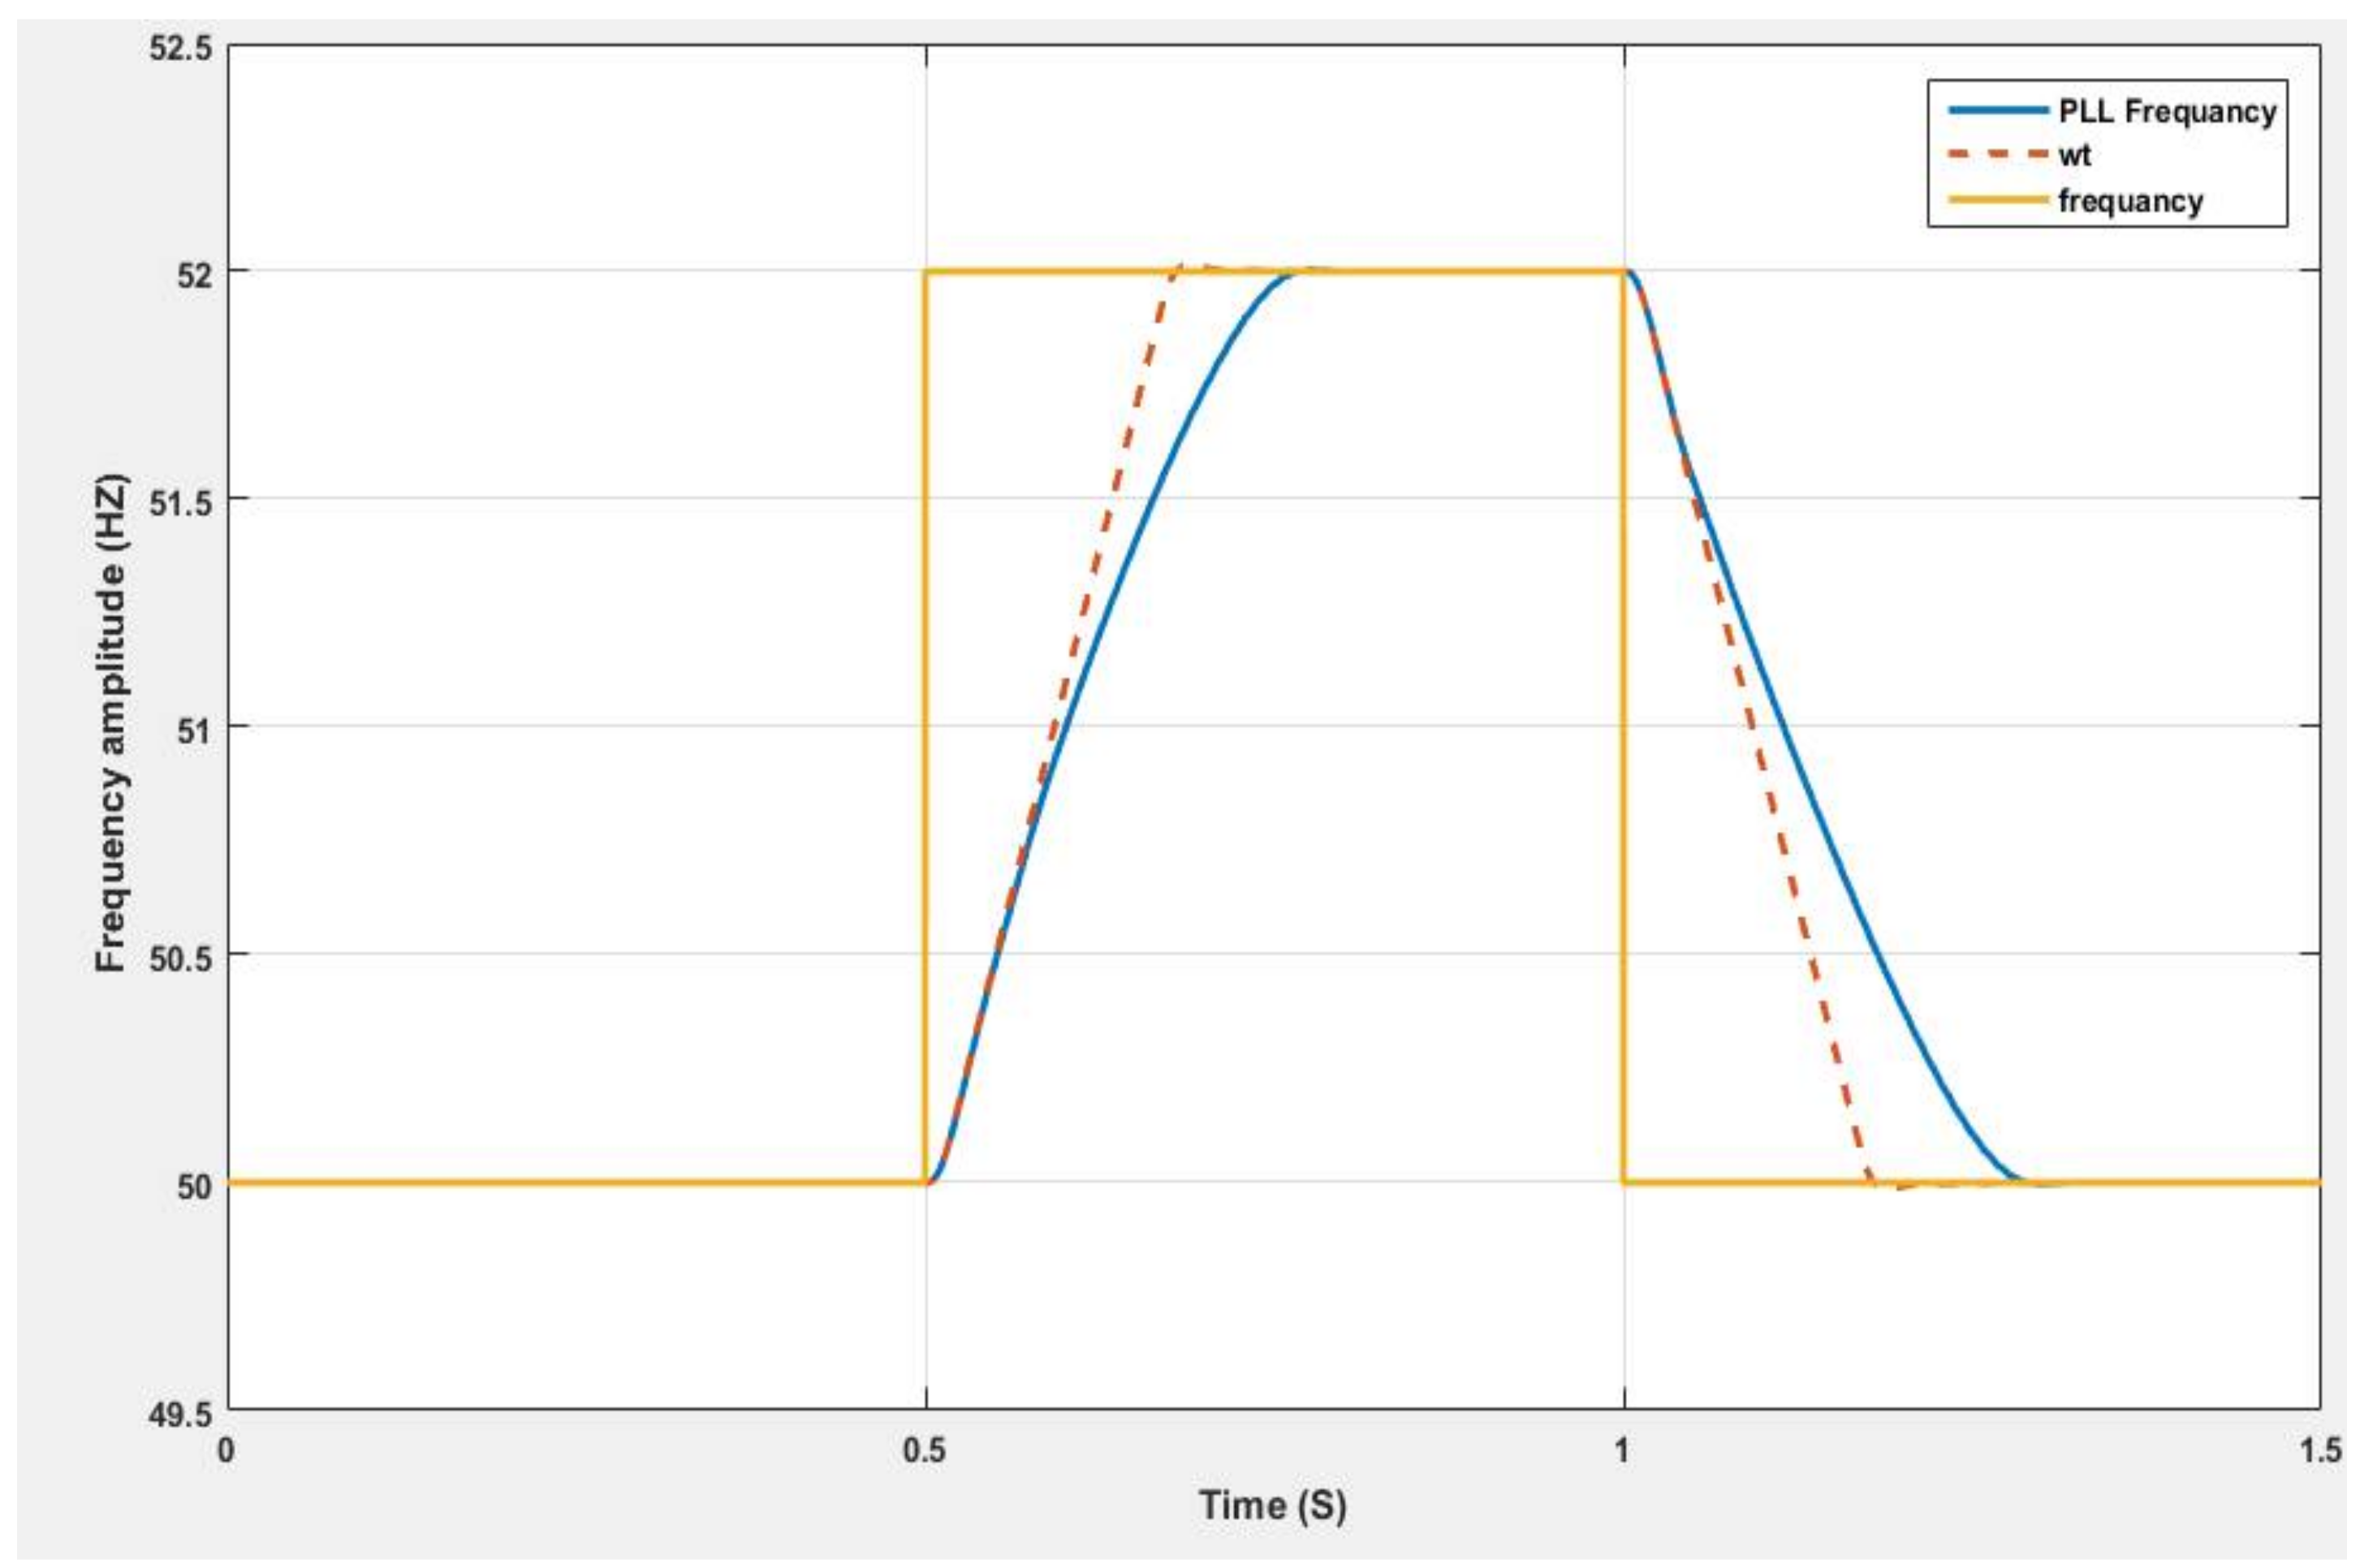
The model discusses two cases of Power Frequency variations when the power frequency gradually increases from 50 Hz to 52 Hz and returns to the normal frequency after a period of time; see Figure 5. The model compares the conventional way of calculating the frequency variation and the proposed way using a closed circuit. The proposed method is to track the frequency and amplitude of the input wave by using the frequency oscillator. In Figure 6, in contrast, the frequency decreases by 2 Hz gradually to 48 Hz.
4. Relay Report and Simulink Result
Fault points were used in the tests, and a single phase with ground (SLG) was chosen; the fault points were included in the harmonic components. The points were located near the border of zone 1 and zone 2. The characteristic zones of the distance relay and the chosen points can be seen in Figure 7. As it is known, most digital relays use quadrilateral characteristics due to the many advantages which those characteristics can provide. The configuration and settings of the relay should be done in the first place; after that, exporting of these settings to CMC 256 is important to evaluate the relay functions. CMC 256 provides different platforms to test the relay with its zones setting, transmission line parameters, and time delay. Moreover, an advanced distance test displays the amplitude and phase of the three phase currents and voltages determined by the fault type and the fault location [11]. The distance relay is a universal short-circuit protection. Its mode of operation is based on the measurement and evaluation of the short-circuit impedance which, in the classic case, is proportional to the distance to the fault. Its tripping time is approximately one to two cycles (20 to 40 ms at 50 Hz) in the first zone for faults within the first 80% to 90% of the length. In the second zone, the tripping time depends on the settings which are usually 300–500 ms [20].
The parameters of the derived model are based on the physical relay, as shown in Figure 7, which presents the characteristic zones of distance relay designed in the matlab environment.
The Testing Conditions
A harmonics test allows for creating a voltage and current signals with three states: pre-signal refers to the signal with the fundamental frequency and pre-signal time can be determined according to the test conditions, signal refers to the signal accompanied by the harmonic components, post signal refers to the signal with the fundamental frequency as shown in Table 2. Harmonic can be added to the voltage an current signals individually or mixed. The test offers the file export as comtrade formate and playback.
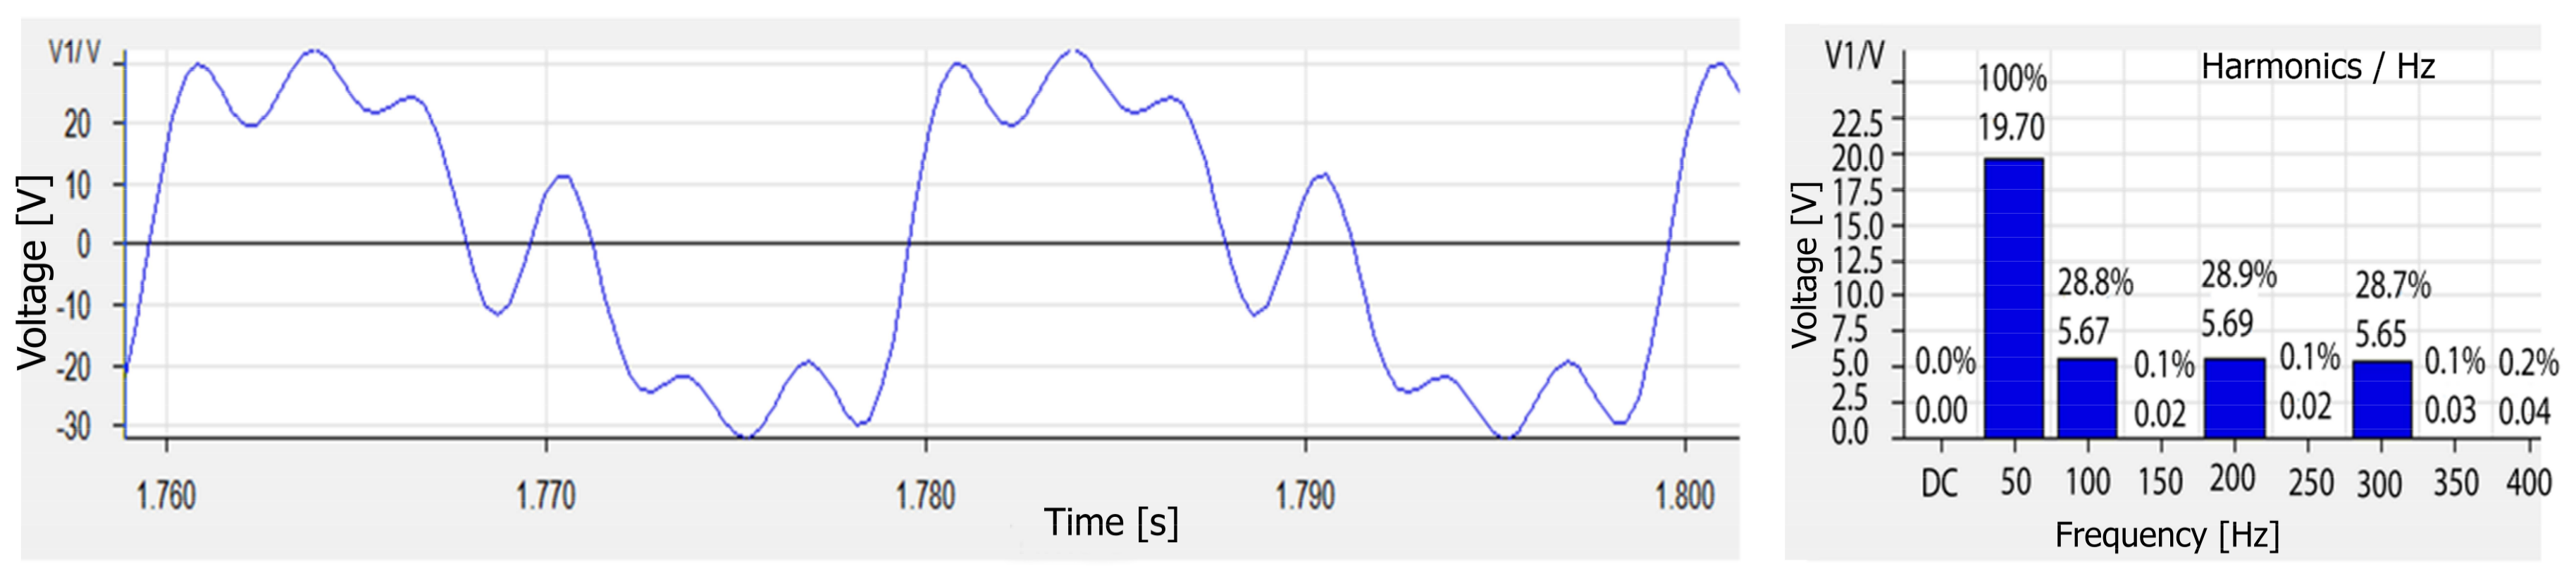
The distorted voltage and the current waveform can be composed of harmonic components; however, the distorted waveform can be decomposed into a fundamental sinusoidal waveform at nominal and harmonic frequencies. The decomposition of distorted waveforms can be done by Fourier transform, as shown in Figure 8. An evaluation of the relay function and harmonics impact can be done in this test. The test is divided into different levels. The first level is based on the harmonic effect of mixed harmonics and individual harmonics. Both are used to test the protection operation and the Simulink model, considering that protection is IED and Matlab is a Simulink model. Figure 8 shows three mixed harmonics (2nd, 4th, 6th) of the fundamental signal. The discrete Fourier transform is used to calculate the THD in the Matlab model. The DFT Spectrum of a one-cycle (20 ms) voltage signal was taken, applying the DFT to the first 20 ms of sampled signal results in the line spectrum at discrete frequencies 50, 100, 150 Hz, etc. Figure 8 shows the magnitude values of the harmonics by using Equation (8). The figure shows that the 50 Hz component dominates; it is already visible from the original signal. The voltage signal contains significant components at even harmonics of 100, 200, and 300 Hz. Figure 9 shows decomposed voltage waveform with harmonic distortions of three harmonics (3rd, 5th, 7th) using the Fourier transform/ Matlab window. The harmonic analysis was tested and measured using a Matlab model.
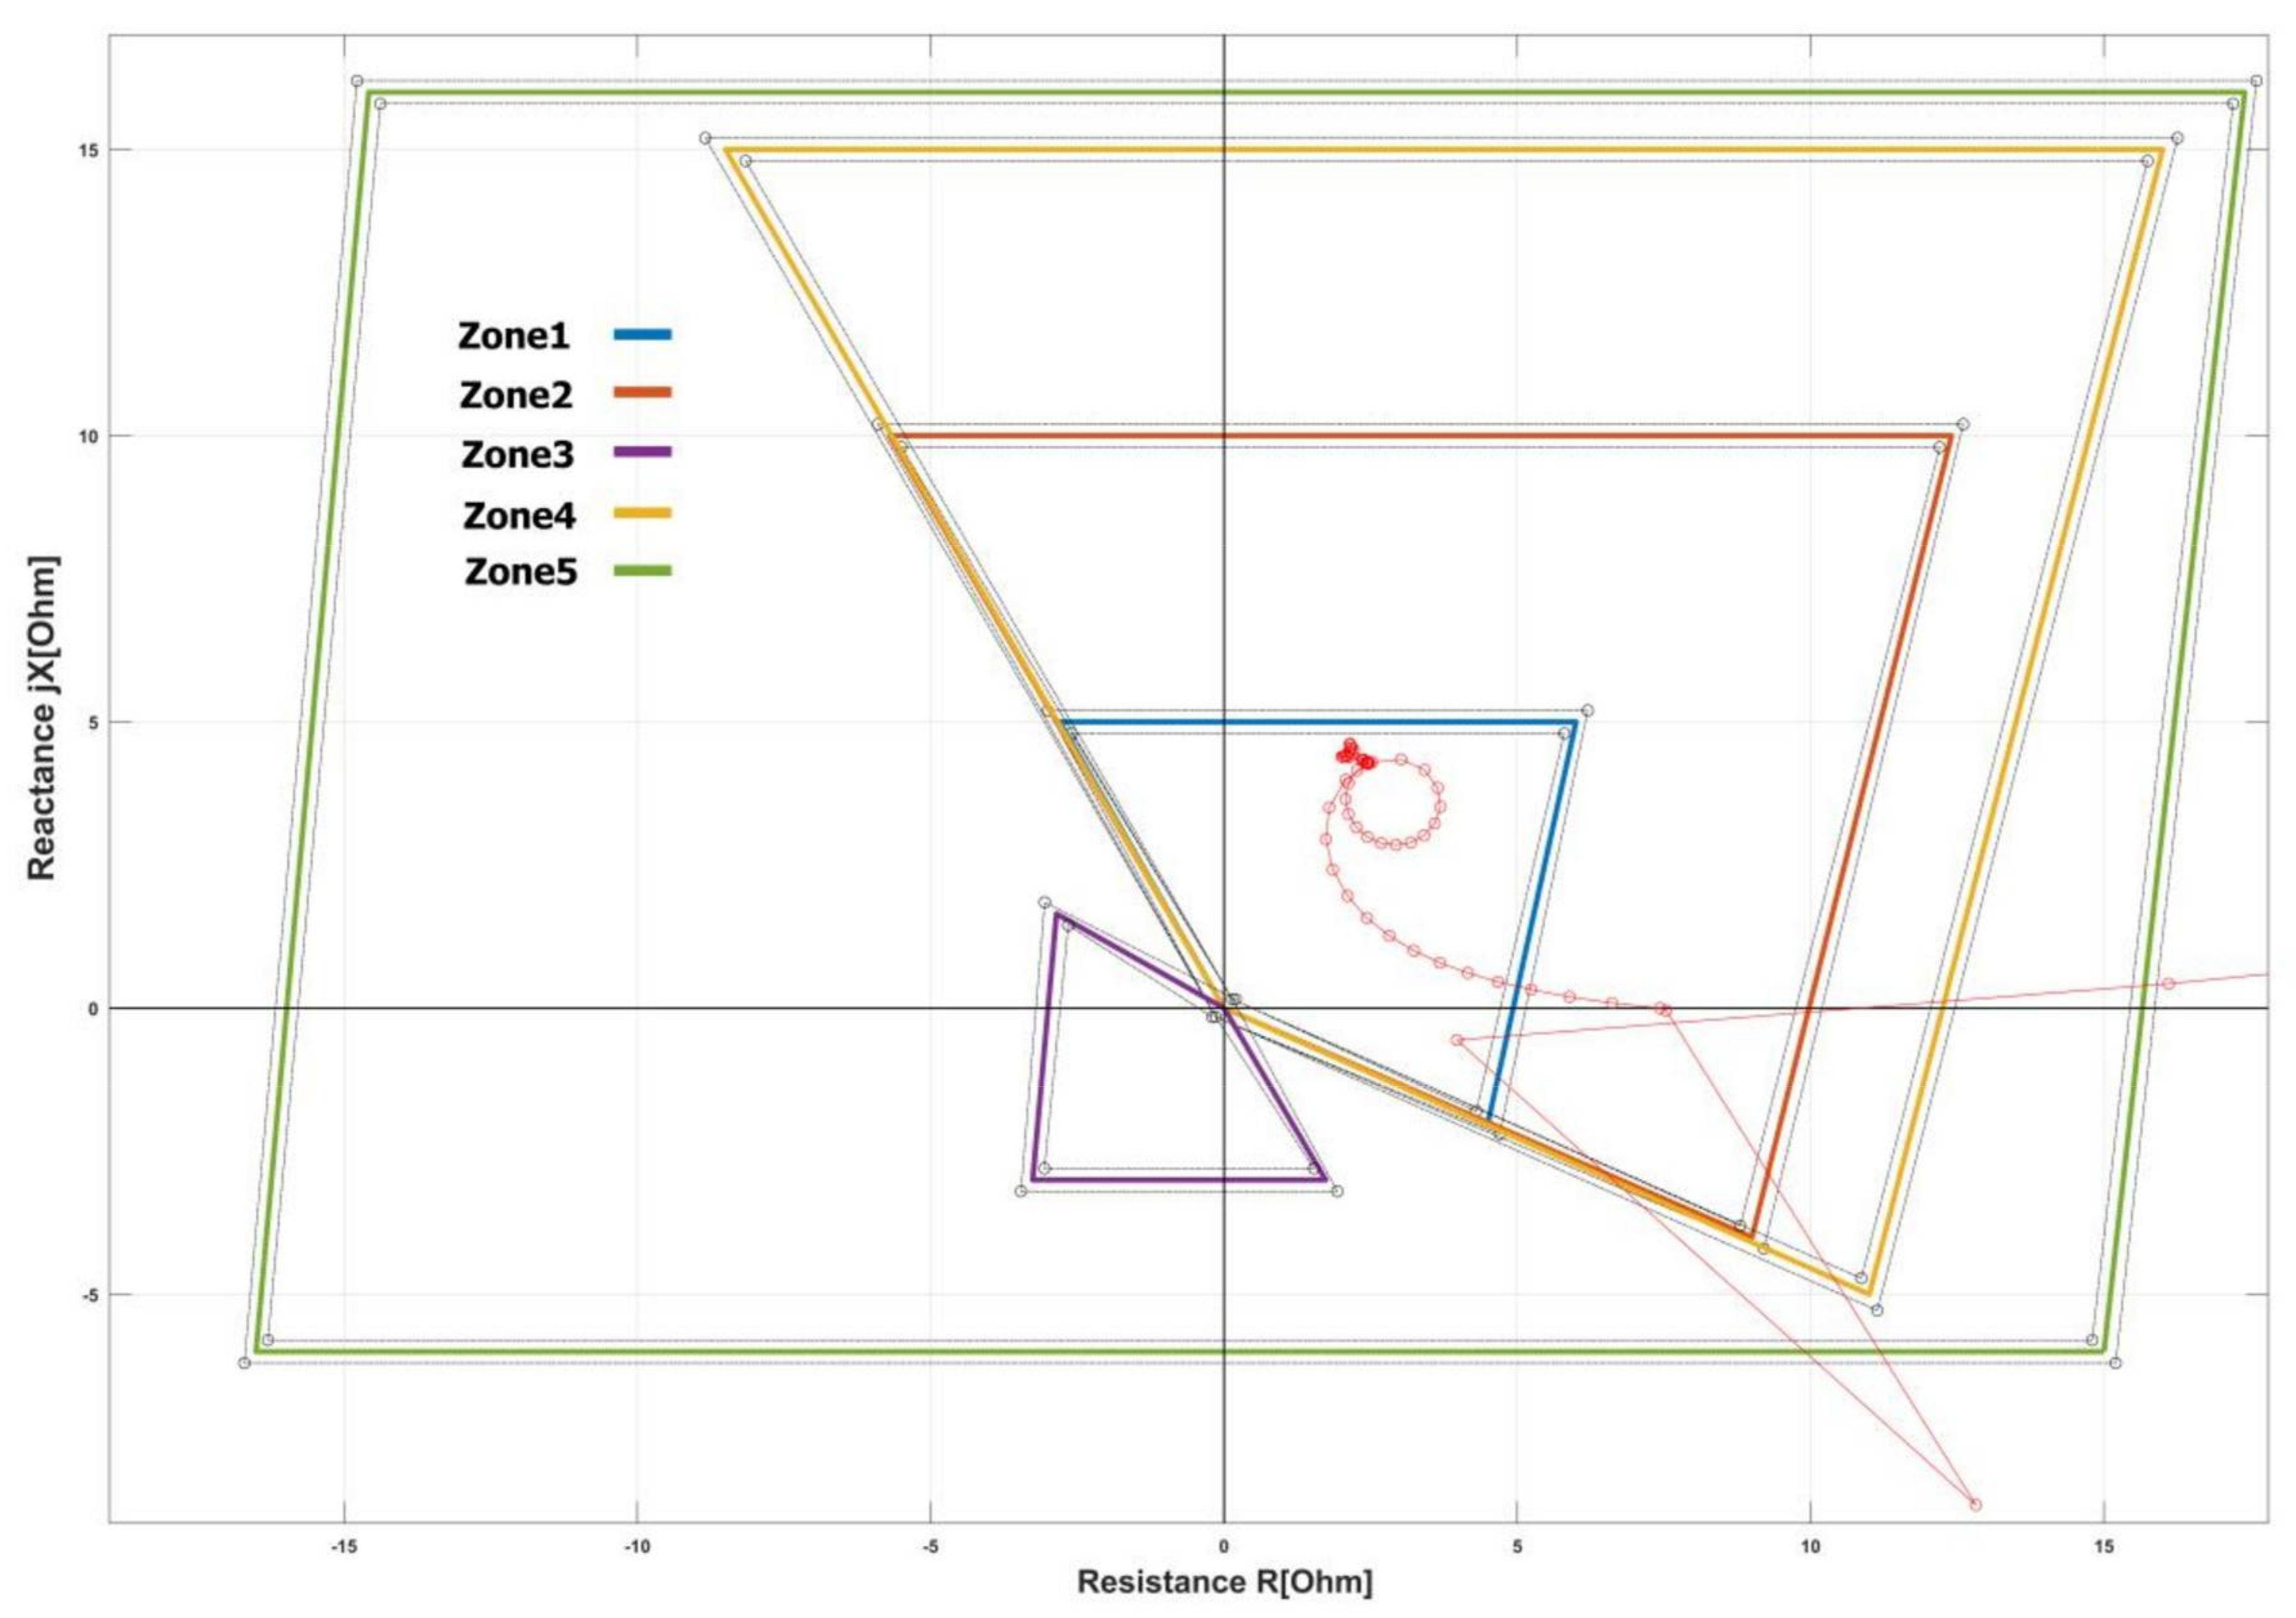
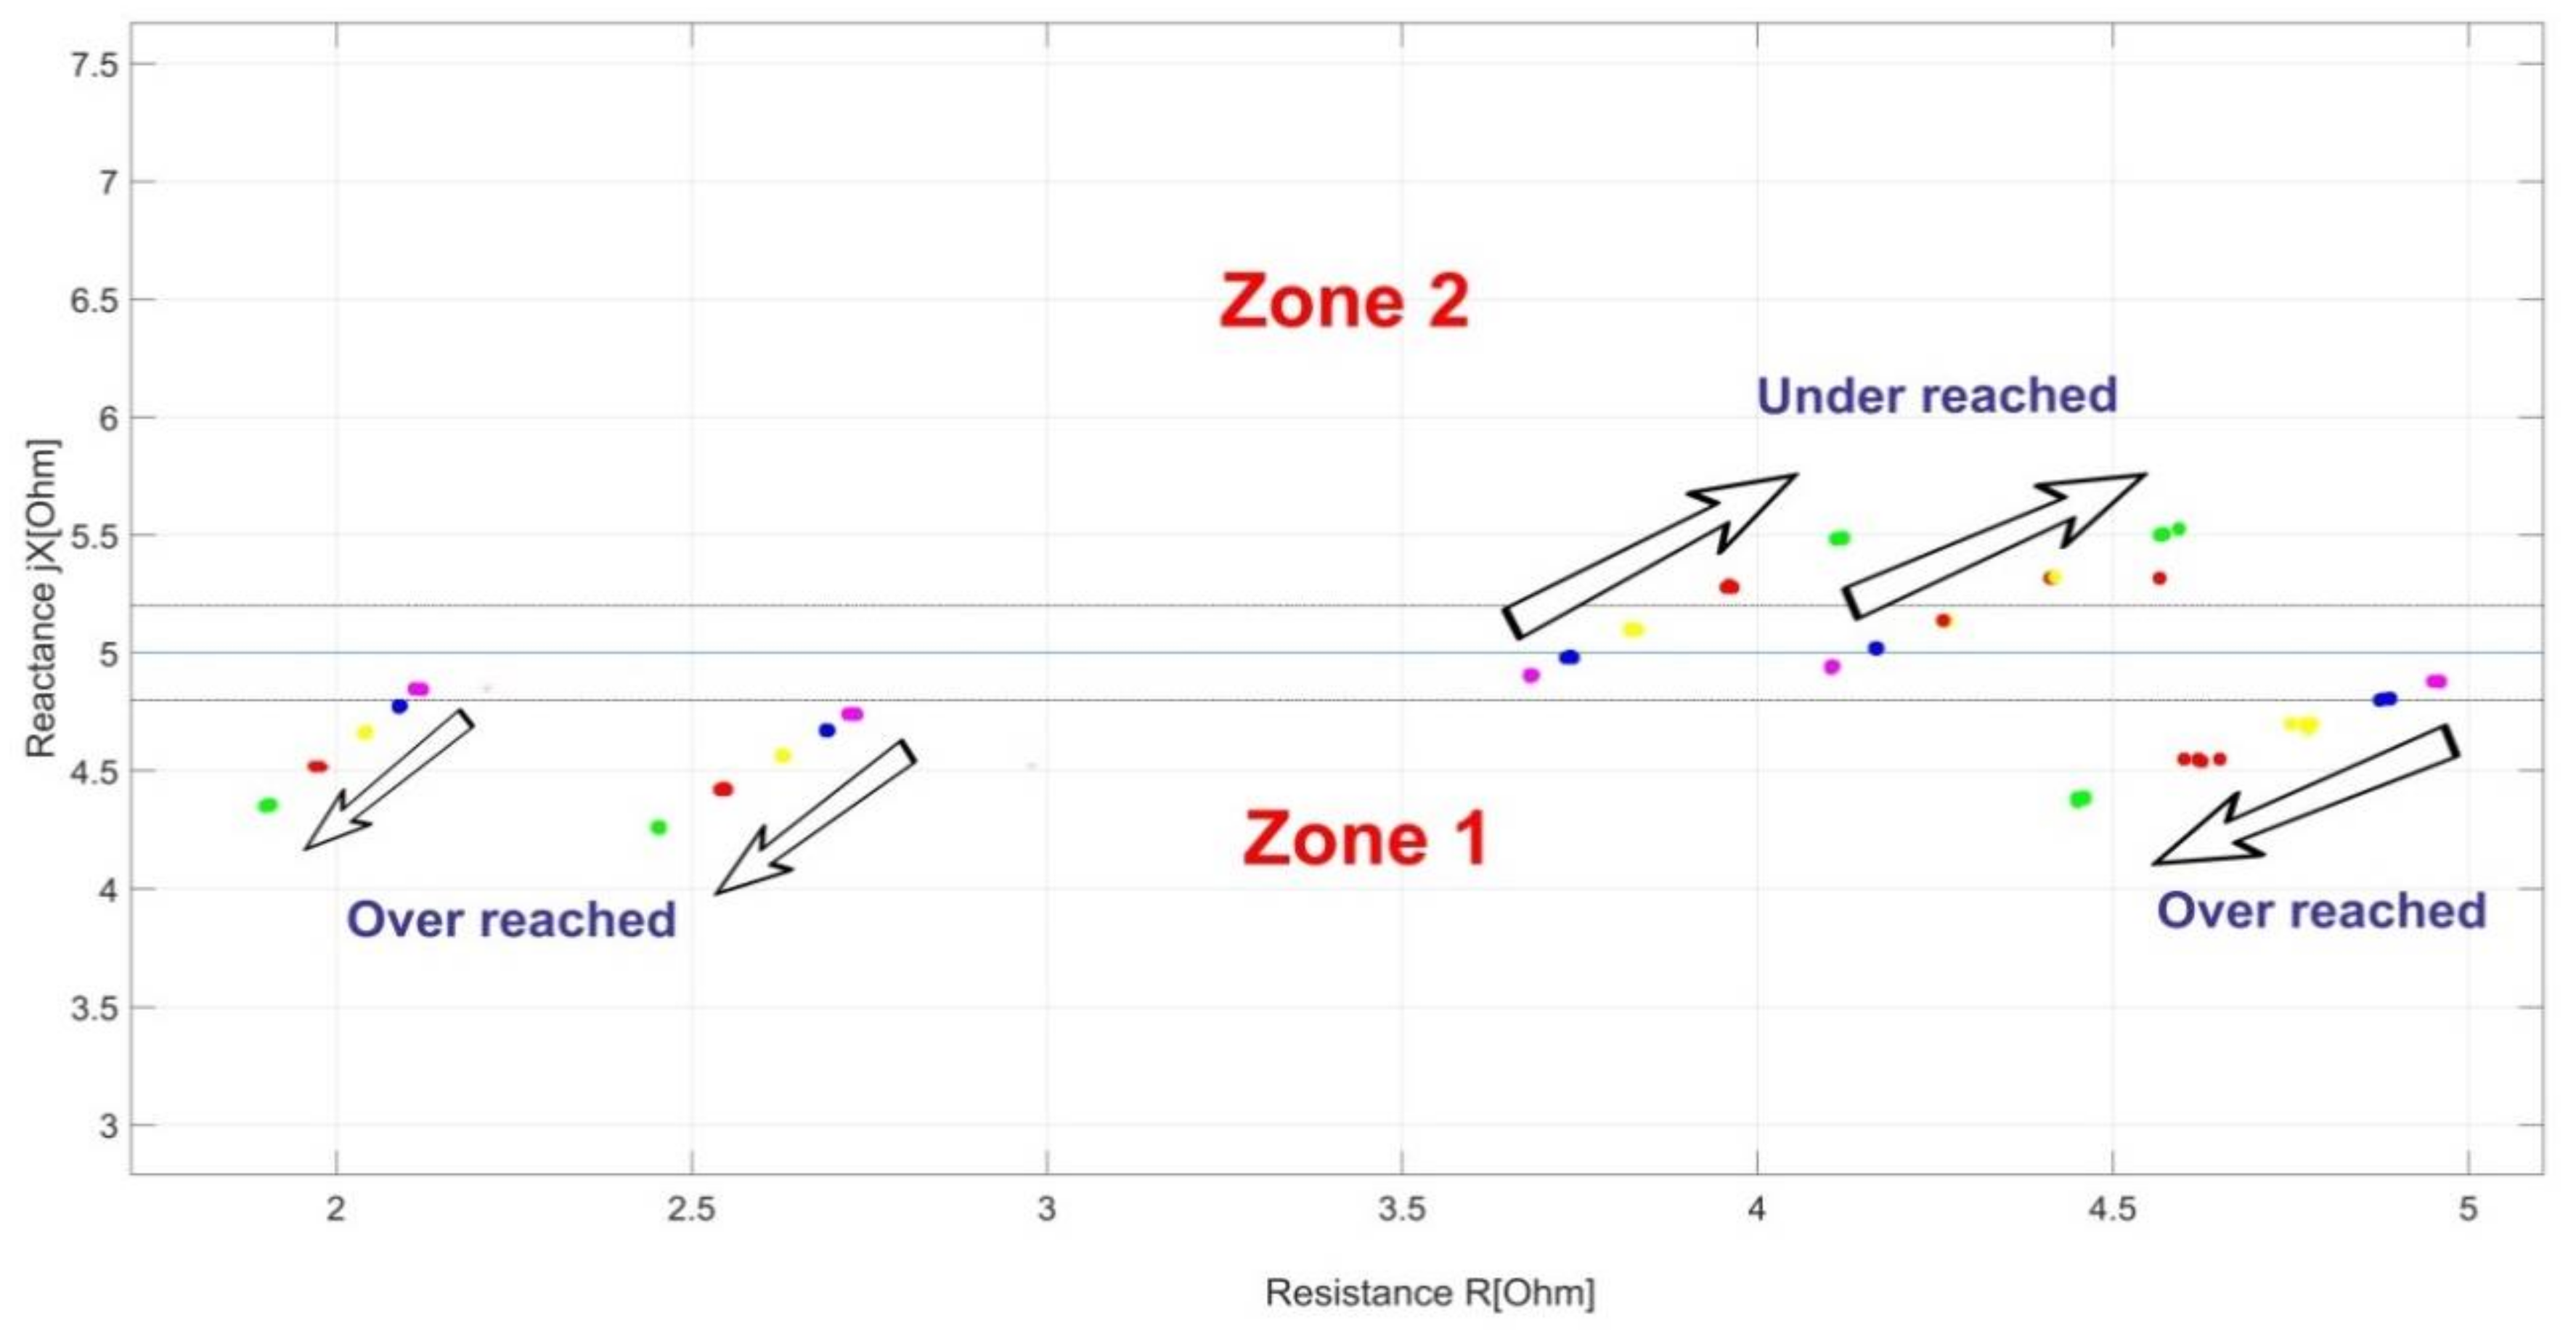
The test was conducted at five different fault points and a total harmonic distortion was added to each of these tests. The total harmonic distortion on the current wave added at two points (the arrow direction up) is called an overreach, and the total harmonic distortion was added to the voltage wave at three points, as shown in Figure 10. The total harmonic distortion was added as a percentage of the fundamental signal as follows: 10%, 20%, 30%, 40%, and 50%, and were colored in the following colors, respectively (violet, blue, yellow, red, and green).
Overreach and underreach of protection relays are common problems in power systems; they cause a mal-operation of the protection relays and it is impossible to detect the fault in the correct zone. The overreach of the point of the fault can cause the protection relay to send a mal-trip signal, which means that the relay instead of a trip in a delayed time zone 2 will send the tripping signal in zone 1, which is not desired; as shown in Figure 10. A harmonic distortion can change the power factor which leads to a change in the measured impedance lower than the actual value. The overreach can be noticed from a distorted voltage waveform, as shown in Figure 10, due to the lagging power factor. Conversely, an underreach of the point of fault can cause the change of protection relay and the decision to send a mal-trip signal; it means that the relay instead of a trip at a delayed time zone 1 will send a tripping signal at zone 2, which is not desired, as shown in Figure 10. A harmonic distortion can change the power factor, which leads to a change in the measured impedance higher than the actual value. The underreach can be noticed from a distorted voltage waveform, as shown in Figure 10, due to the leading power factor. The overreach of the distance relays should be avoided mostly in the first zone.
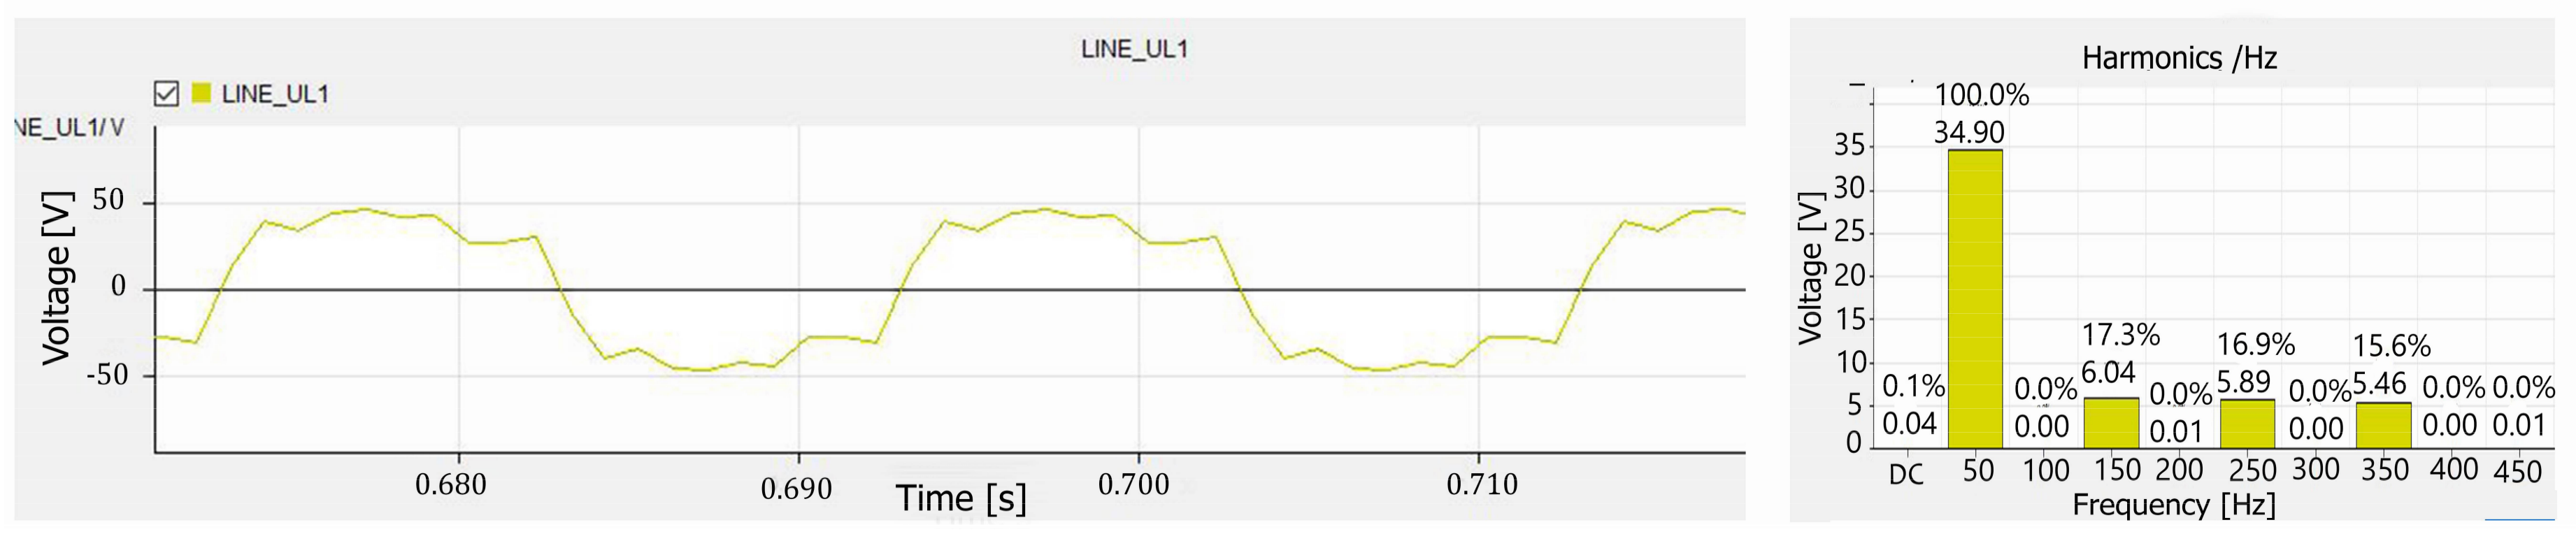
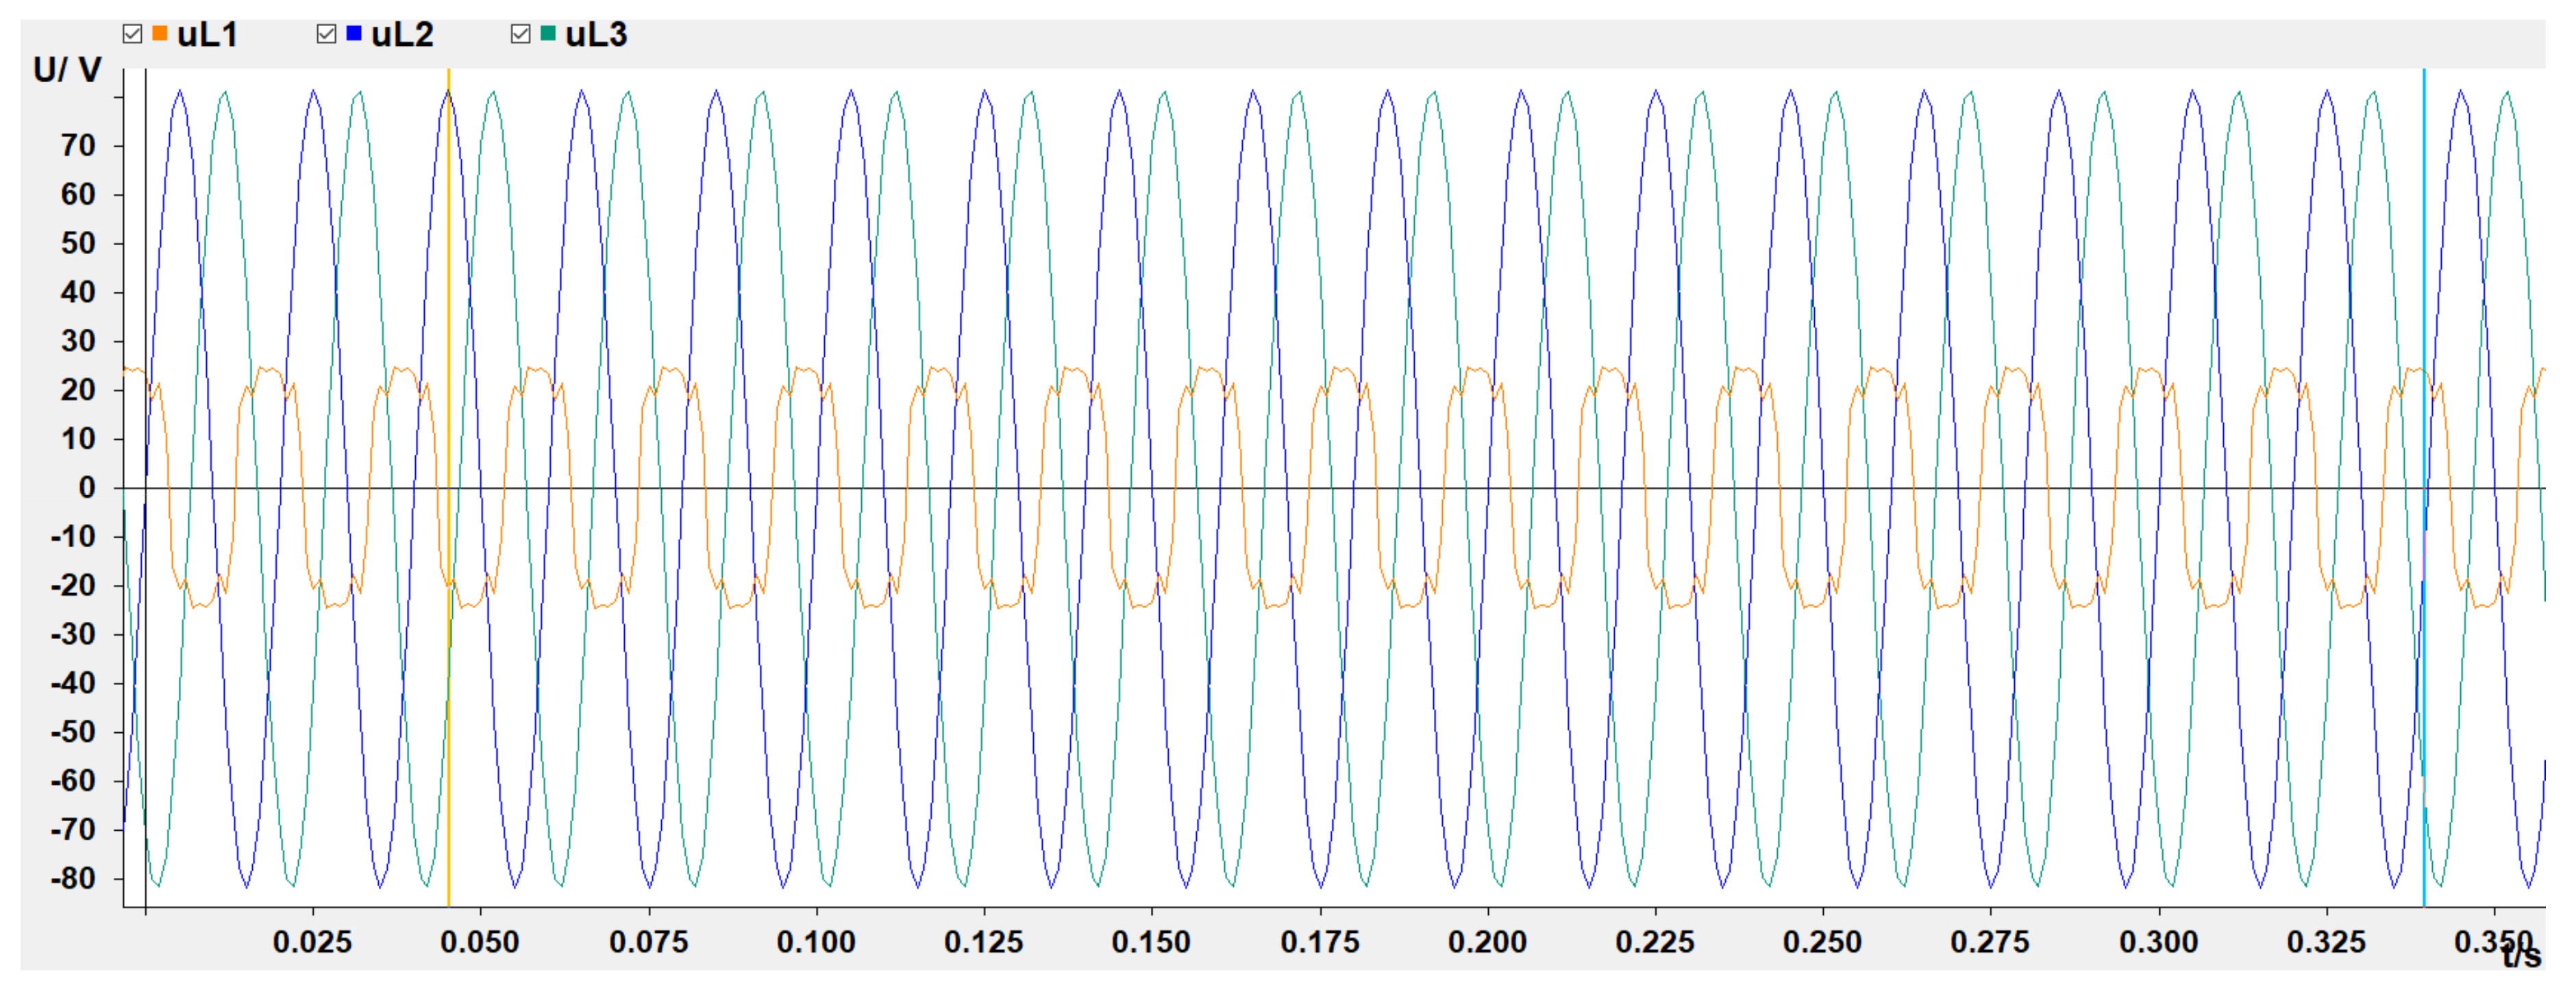
The test can illustrate harmonic distortion. A single-phase fault operation of a distance digital relay was applied and, as a result, the relay made a mal-operation decision. The analysis has been summarized from the integral disturbance recorder in the relay that has an area of memory. The relay can store all events in a disturbance recorder. Figure 11 shows a single phase to earth fault on the transmission line in a power system with a high harmonic content. It is assumed that three harmonics (3rd, 5th, and 7th) exist. The distance protection relay shows the instantaneous value of the three-phase voltage with a high harmonic content once a single phase with earth occurs.
5. Distance Relay: Tripping Time vs. THD Level
Based on previous reports [21,22], the total harmonic distortion was measured at 30 different grids in the Czech Republic at different intervals. The measurements and evaluation of the harmonic level were made by the E.ON Distribution in the Czech Republic, operated by the company E.ON Czech Republic. More than 1000 MW of distributed energy sources (DES) are connected to this network, mainly from photovoltaic (PV) sources; see Table 3.
According to the total harmonics of the measured points in grids, the distance relay was tested. Its mode of operation is based on the measurement and evaluation of the short-circuit impedance which in the classic case is proportional to the distance to the fault.
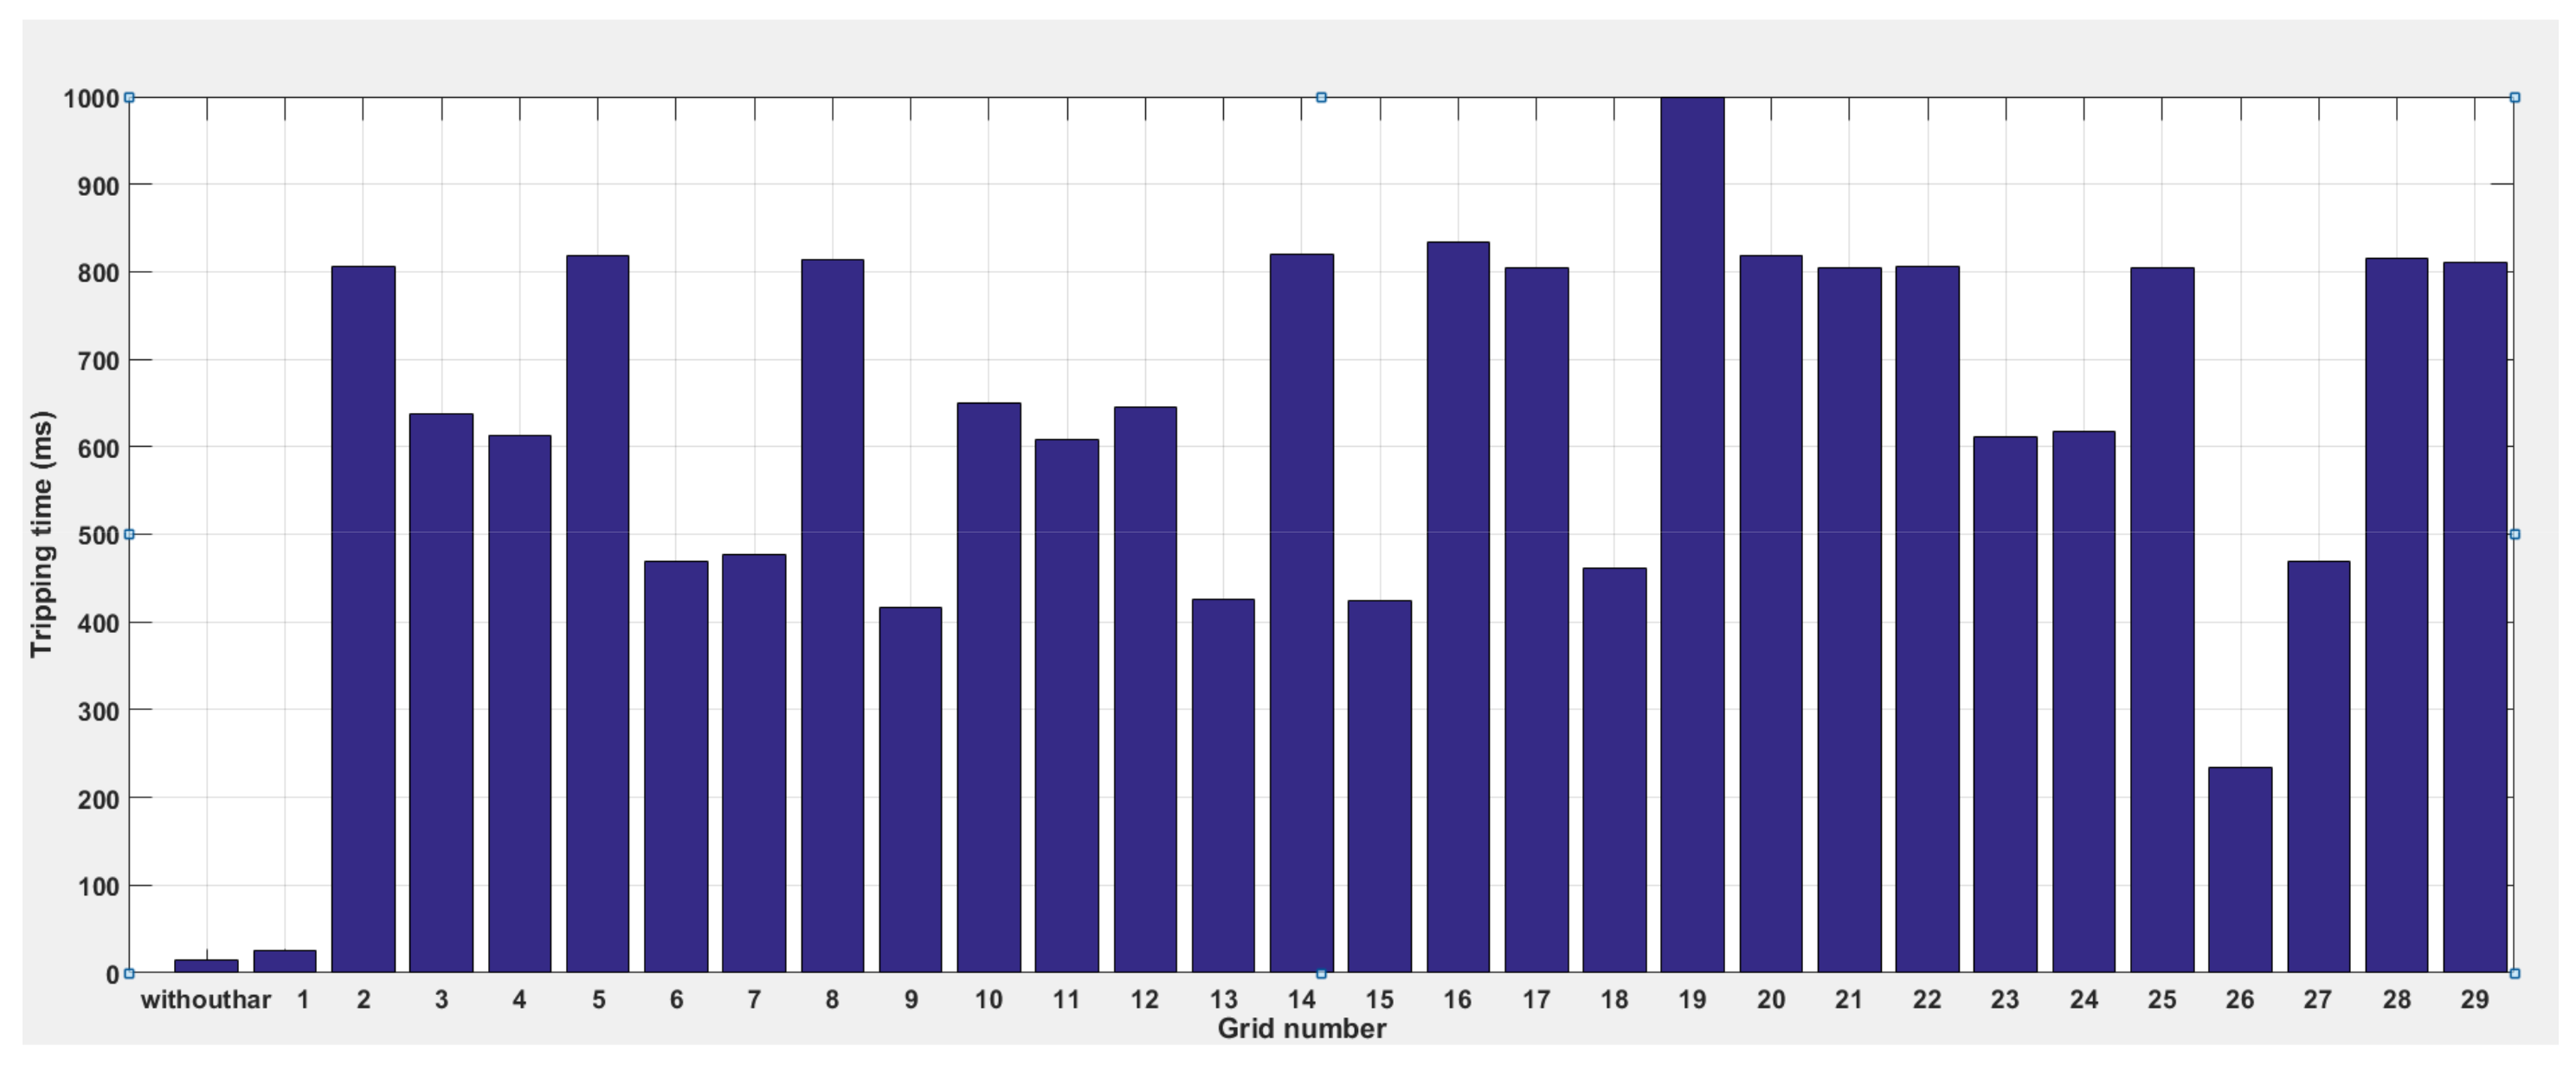
This test explains how a different magnitude of the total harmonic distortion can influence the relay’s operation and the tripping time of most digital protection relays used. A fault was located at zone 1 near the border zone 1–2 border (as shown in Figure 12: the tripping time for fault without distortion was 23 ms (average of 10 measurements); the tests were performed with zone 1 tripping time set to 0 ms and zone 2 tripping time set to 1000 ms. It is possible to see how the harmonic distortion can affect the distance relay’s accuracy and assessment of where the fault took place. During harmonic distortion, a portion of the current is missing so an excessively large impedance is measured. In our measurements on the distance protection, the zone reach is reduced. It is acceptable for near faults, because the distance to the zone limit is long [13,16].
For faults close to the zone limit, an underreach is not permitted; the relay will trip in the second zone with a time delay [11]. Figure 12 shows the relation between the tripping time and the THD of the voltage. In this test, the THD does not exceed 4.5%. Note that the tripping time for the distance protection varies according to the added harmonic value.
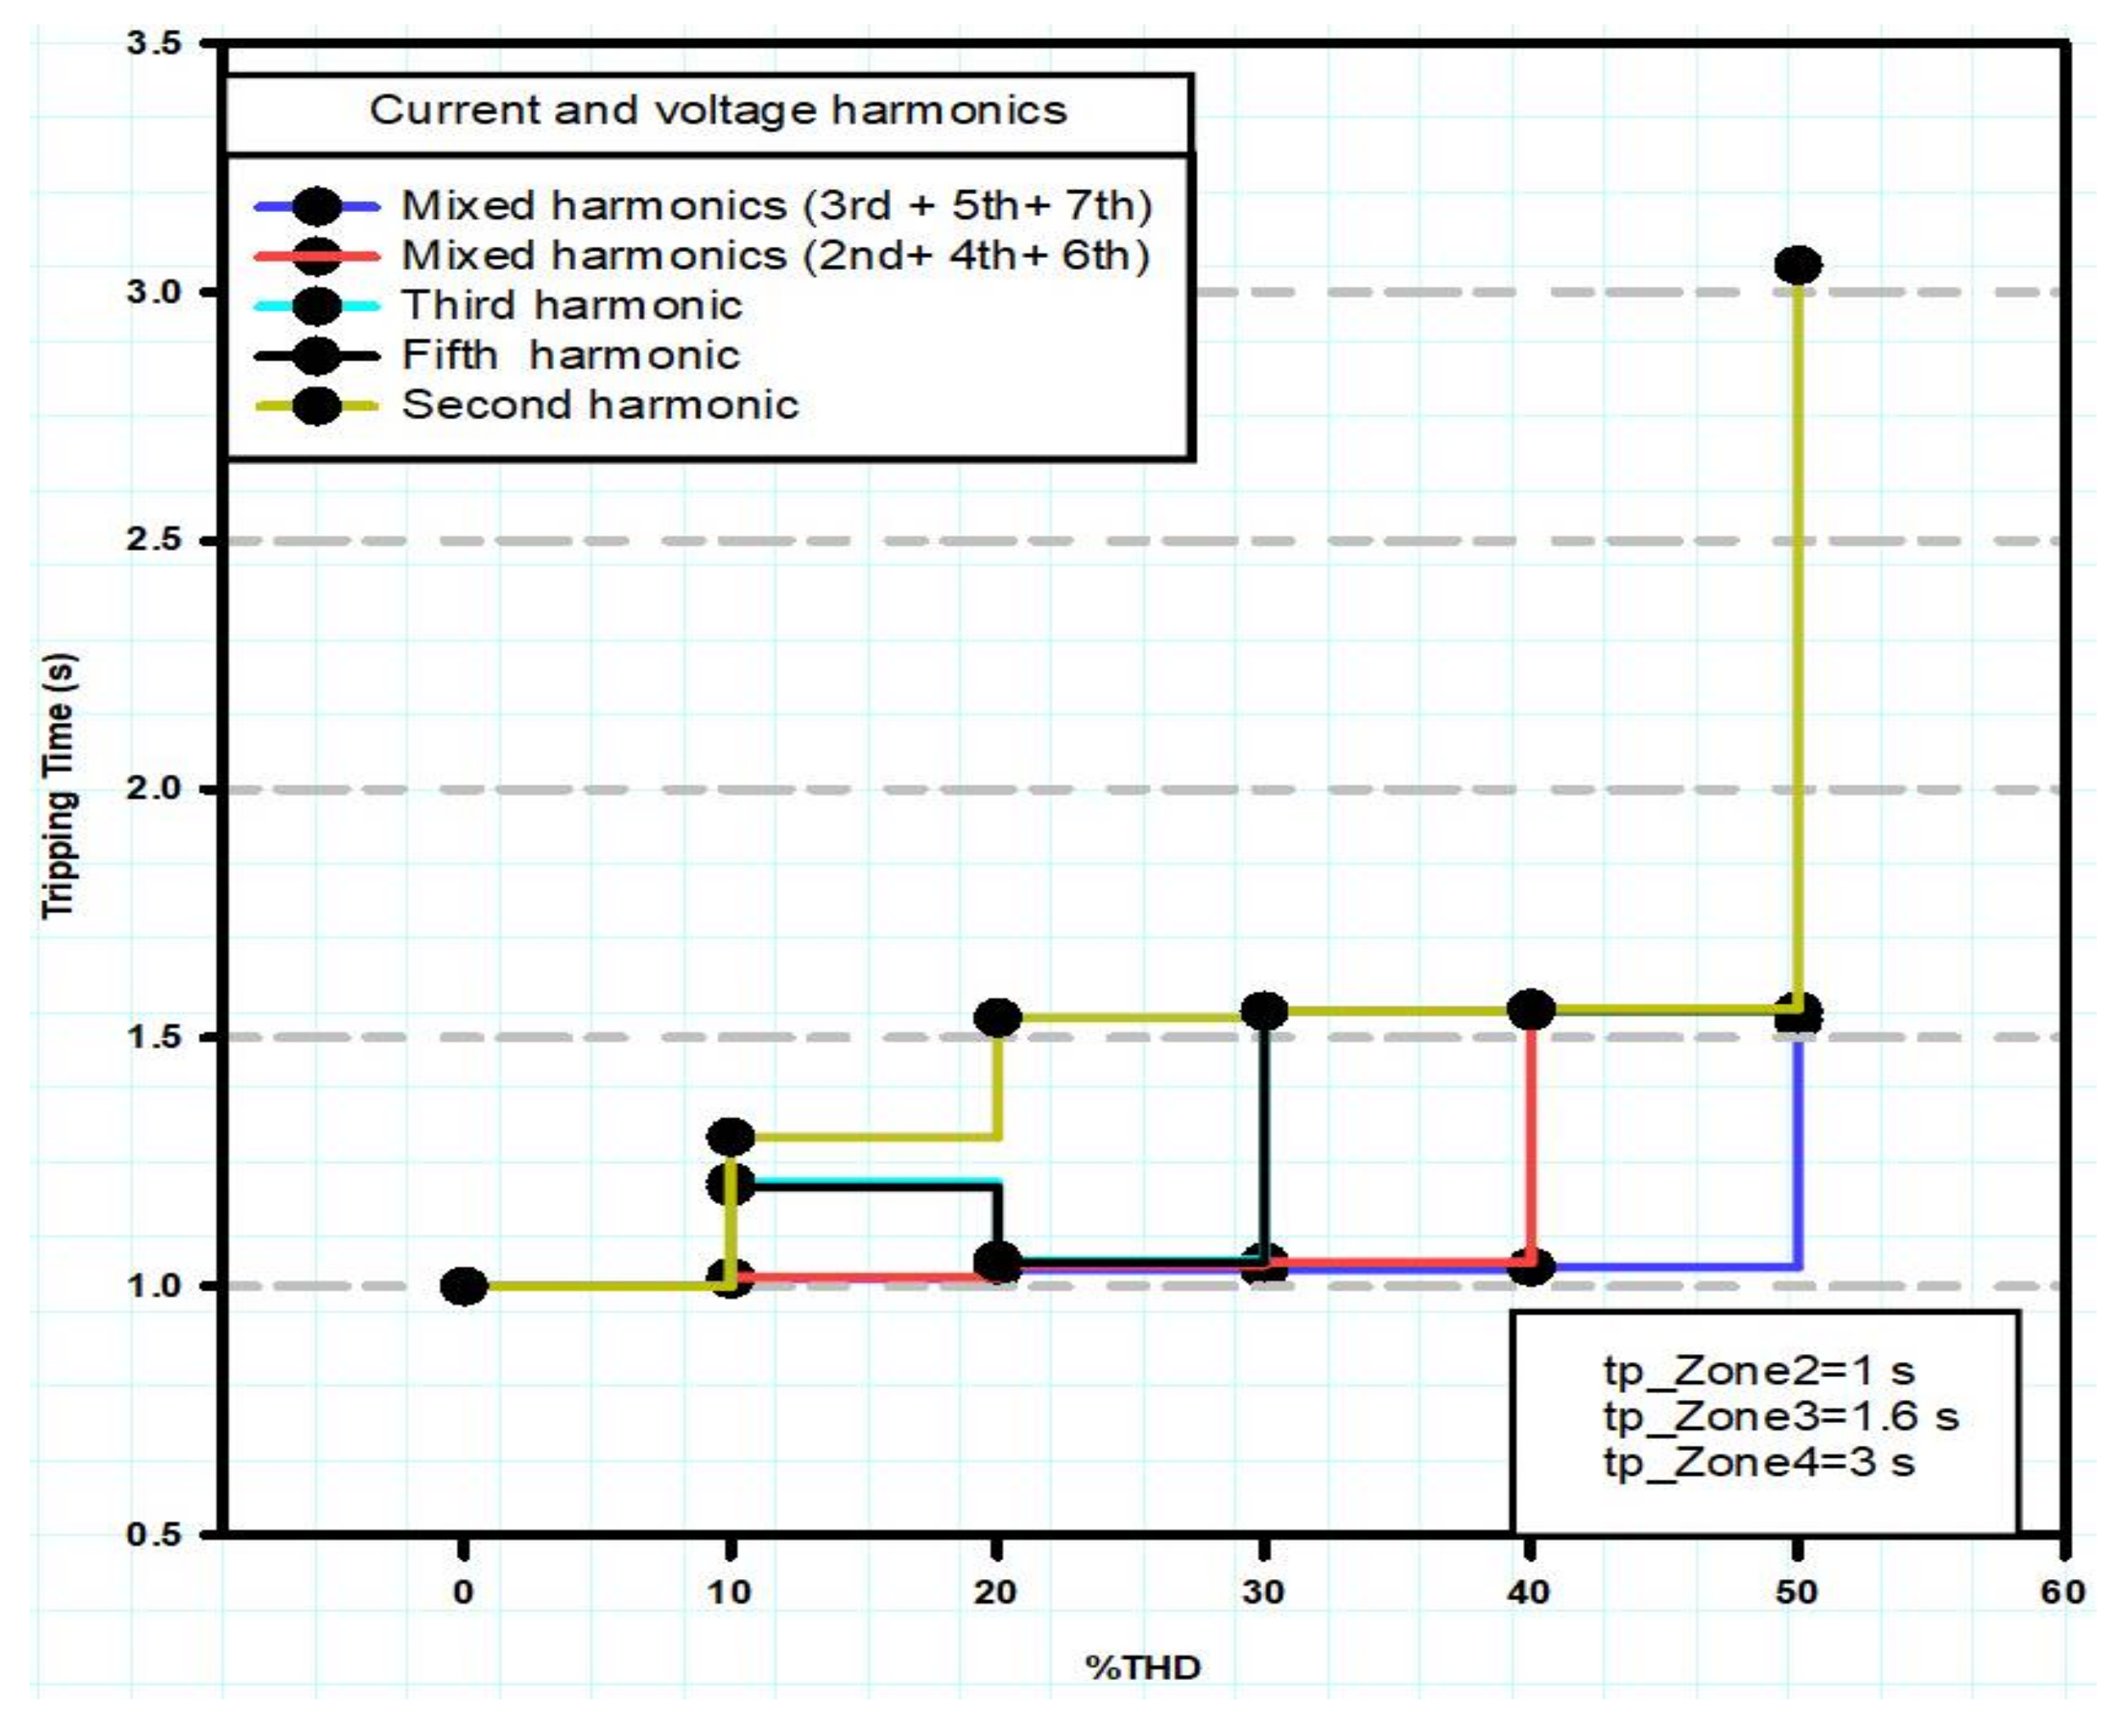
Figure 13 presents the harmonic influence on the tripping time of the physical distance relay, where the current and voltage signals contain harmonics at a high level. The test was repeated five times and the average tripping time is presented. The type of fault is a single phase with the ground and tripping time without added harmonics of 1 s. The rms current and rms voltage should be constant during the test. For example, when the voltage and current signals contain the second harmonic, the tripping time of the distance protection is not constant, and the tripping time starts to change from 1 s to 1.6 s, meaning that the relay algorithm calculated the impedance in the third zone when the harmonic level was 10–40% of the current and voltage signals. Moreover, when the harmonic level was 50% of the current and voltage signals, the tripping time is changed to 3 s and the distance protection decision wrongly calculated the fault in zone 4.
6. Comparison of Total Harmonic Measurement between Physical Relay and Model
The test involves a calculation of performance indicators concerning the level of harmonics through a commercial relay. This chapter contains a large number of measurements. The interval in the relay is 10 cycles in a 50-Hz system according to IEC 61000-4-30 and the model. The harmonics were added as the percentage of the current and voltage signals.
• Testing Conditions
To achieve a comparison between the THD in the commercial relay and the model, EnerLyzer is used to control the measuring features of the CMC test sets. It runs as a stand-alone test module. It has four modes of operation: a multimeter mode, a transient recording mode, a harmonic analysis mode, and a trend recording mode. It calculates the harmonic analysis of all configured inputs (up to 64 harmonics) and displays it in a bar graph and in a tabular format.
• Total Harmonic Distortion Detection in Physical Relay and Matlab Model
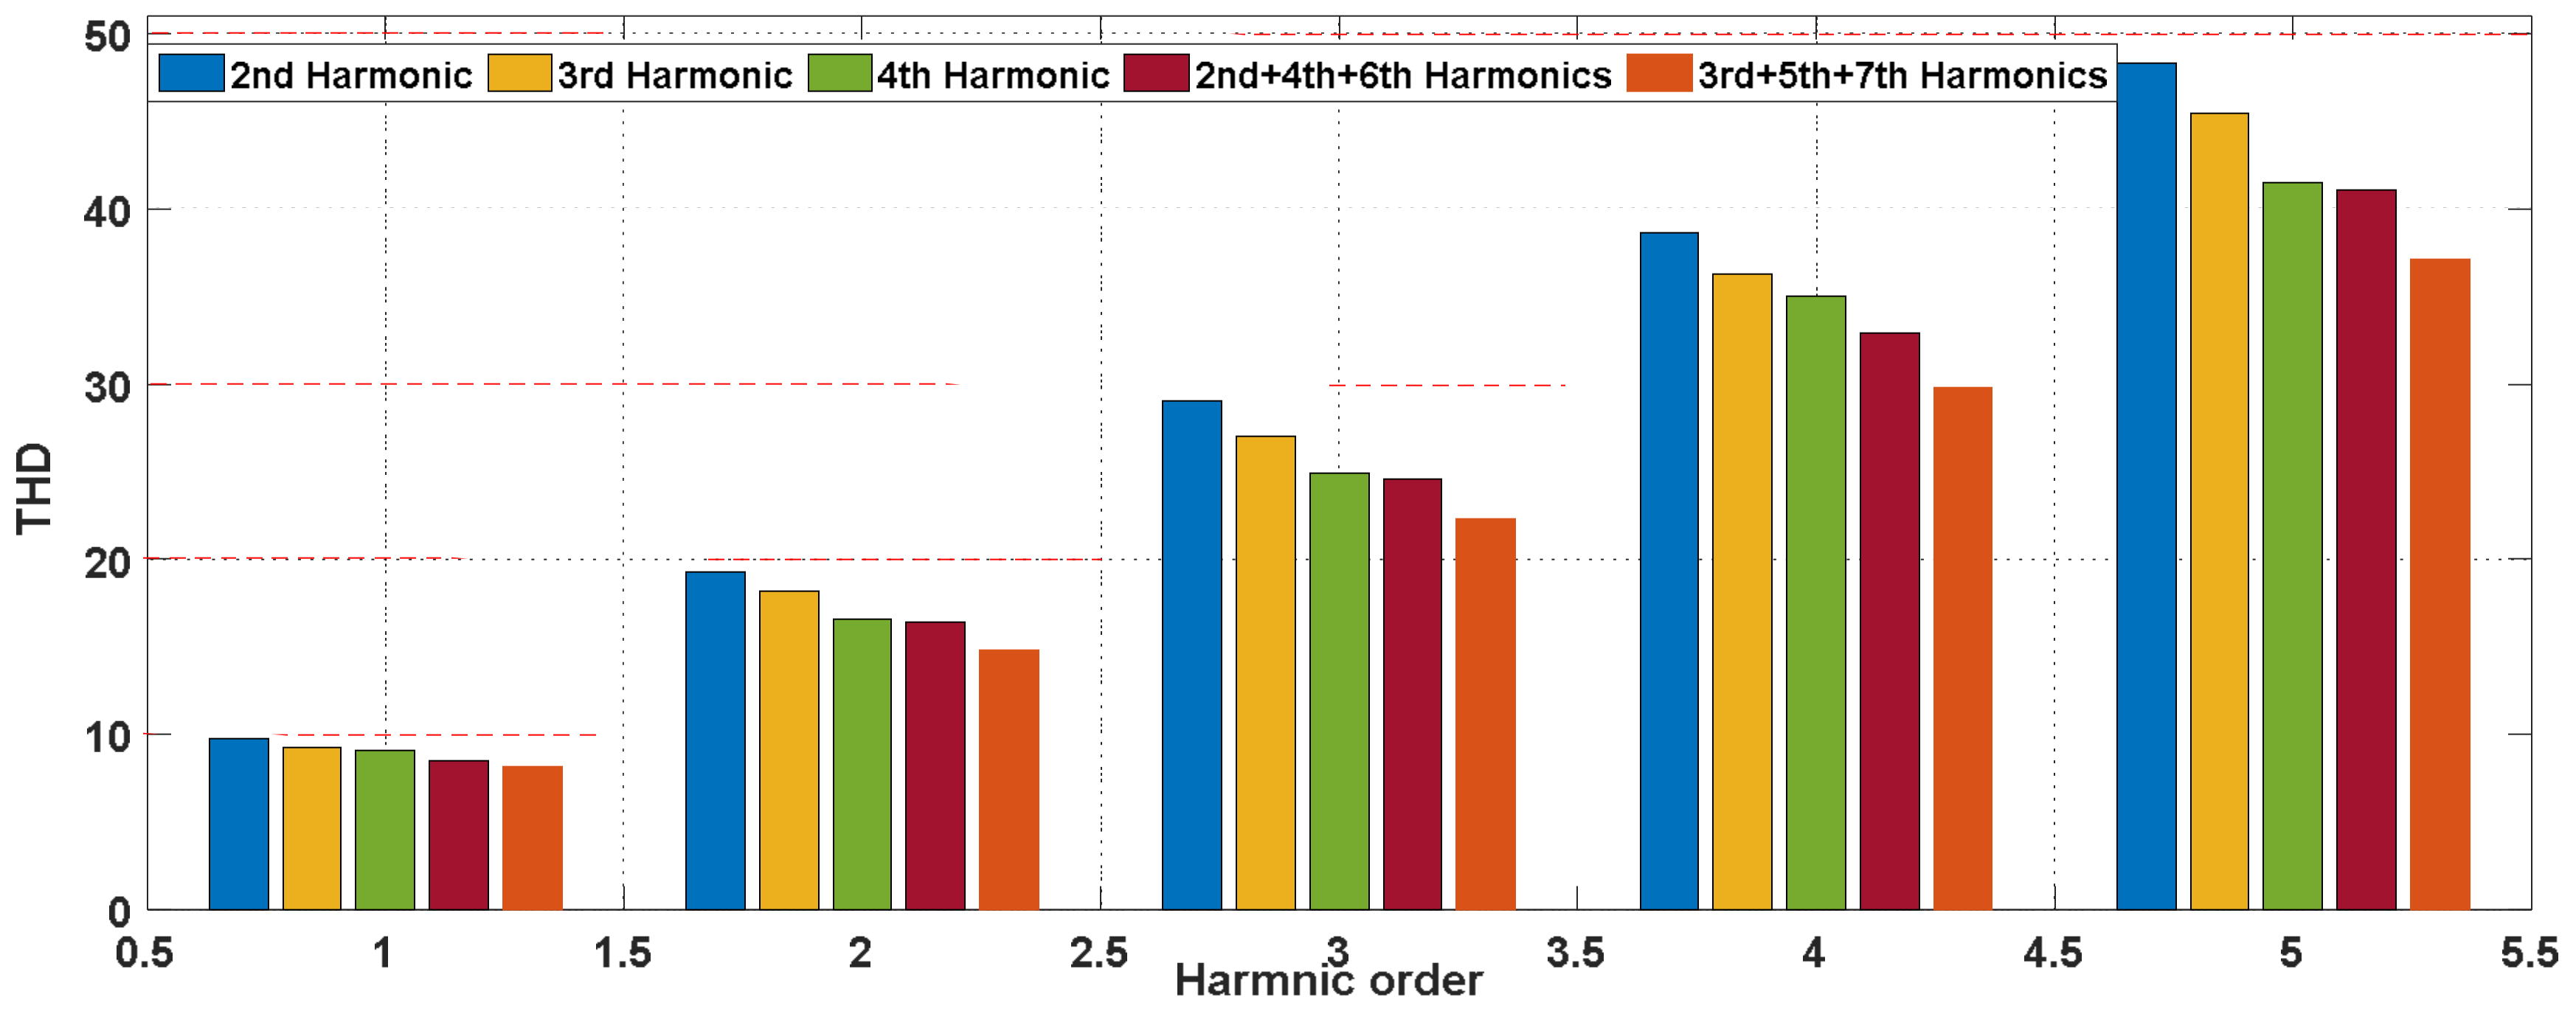
Through the test, the results show that the commercial relay of the harmonic capture ratio is lower than the original harmonic value. The total harmonic distortion is 10%, 20%, 30%, 40%, and 50% of the current signal according to the relay report. Figure 14 shows the harmonic measurements in a commercial relay. The second, third, and fourth harmonics were added as well as the three harmonics combined (2nd, 4th, 6th) and were added to the 3rd, 5th, and 7th harmonics. We can conclude that the commercial relay measures the THD with a difference of up to 35%, especially when there are three harmonics combined in the input signal, as shown in Figure 14. The digital relays start function when abnormal conditions occurred as faults. Abnormal events are accompanied by harmonics which are combined with the current and voltage signals.
Figure 14 shows the measurement of THD in a commercial relay. A harmonic measurement evaluates the error of calculation, and the calculation method described above applies to the steady state fault conditions. The measurements of the third harmonic showed that the error of calculation in the commercial relay increased according to the harmonic percentage of the signal. The error of the calculation of the third harmonic is ca. 7% when the percentage of harmonic is 0–10%. After that, the error of the calculation of the third harmonic is stabilized to 10% when the percentage of harmonic is 10–50%. The highest error of the calculation of the THD can be found in mixed harmonics, as shown in Table 4 and Table 5. The THD for mixed 3rd, 5th, and 7th harmonics is ca. 10–20% when the harmonic content is 0–10%. After that, the error of the calculation of THD for mixed 3rd, 5th, and 7th harmonics is stabilized to 33% when the percentage of harmonic is 10–50%.
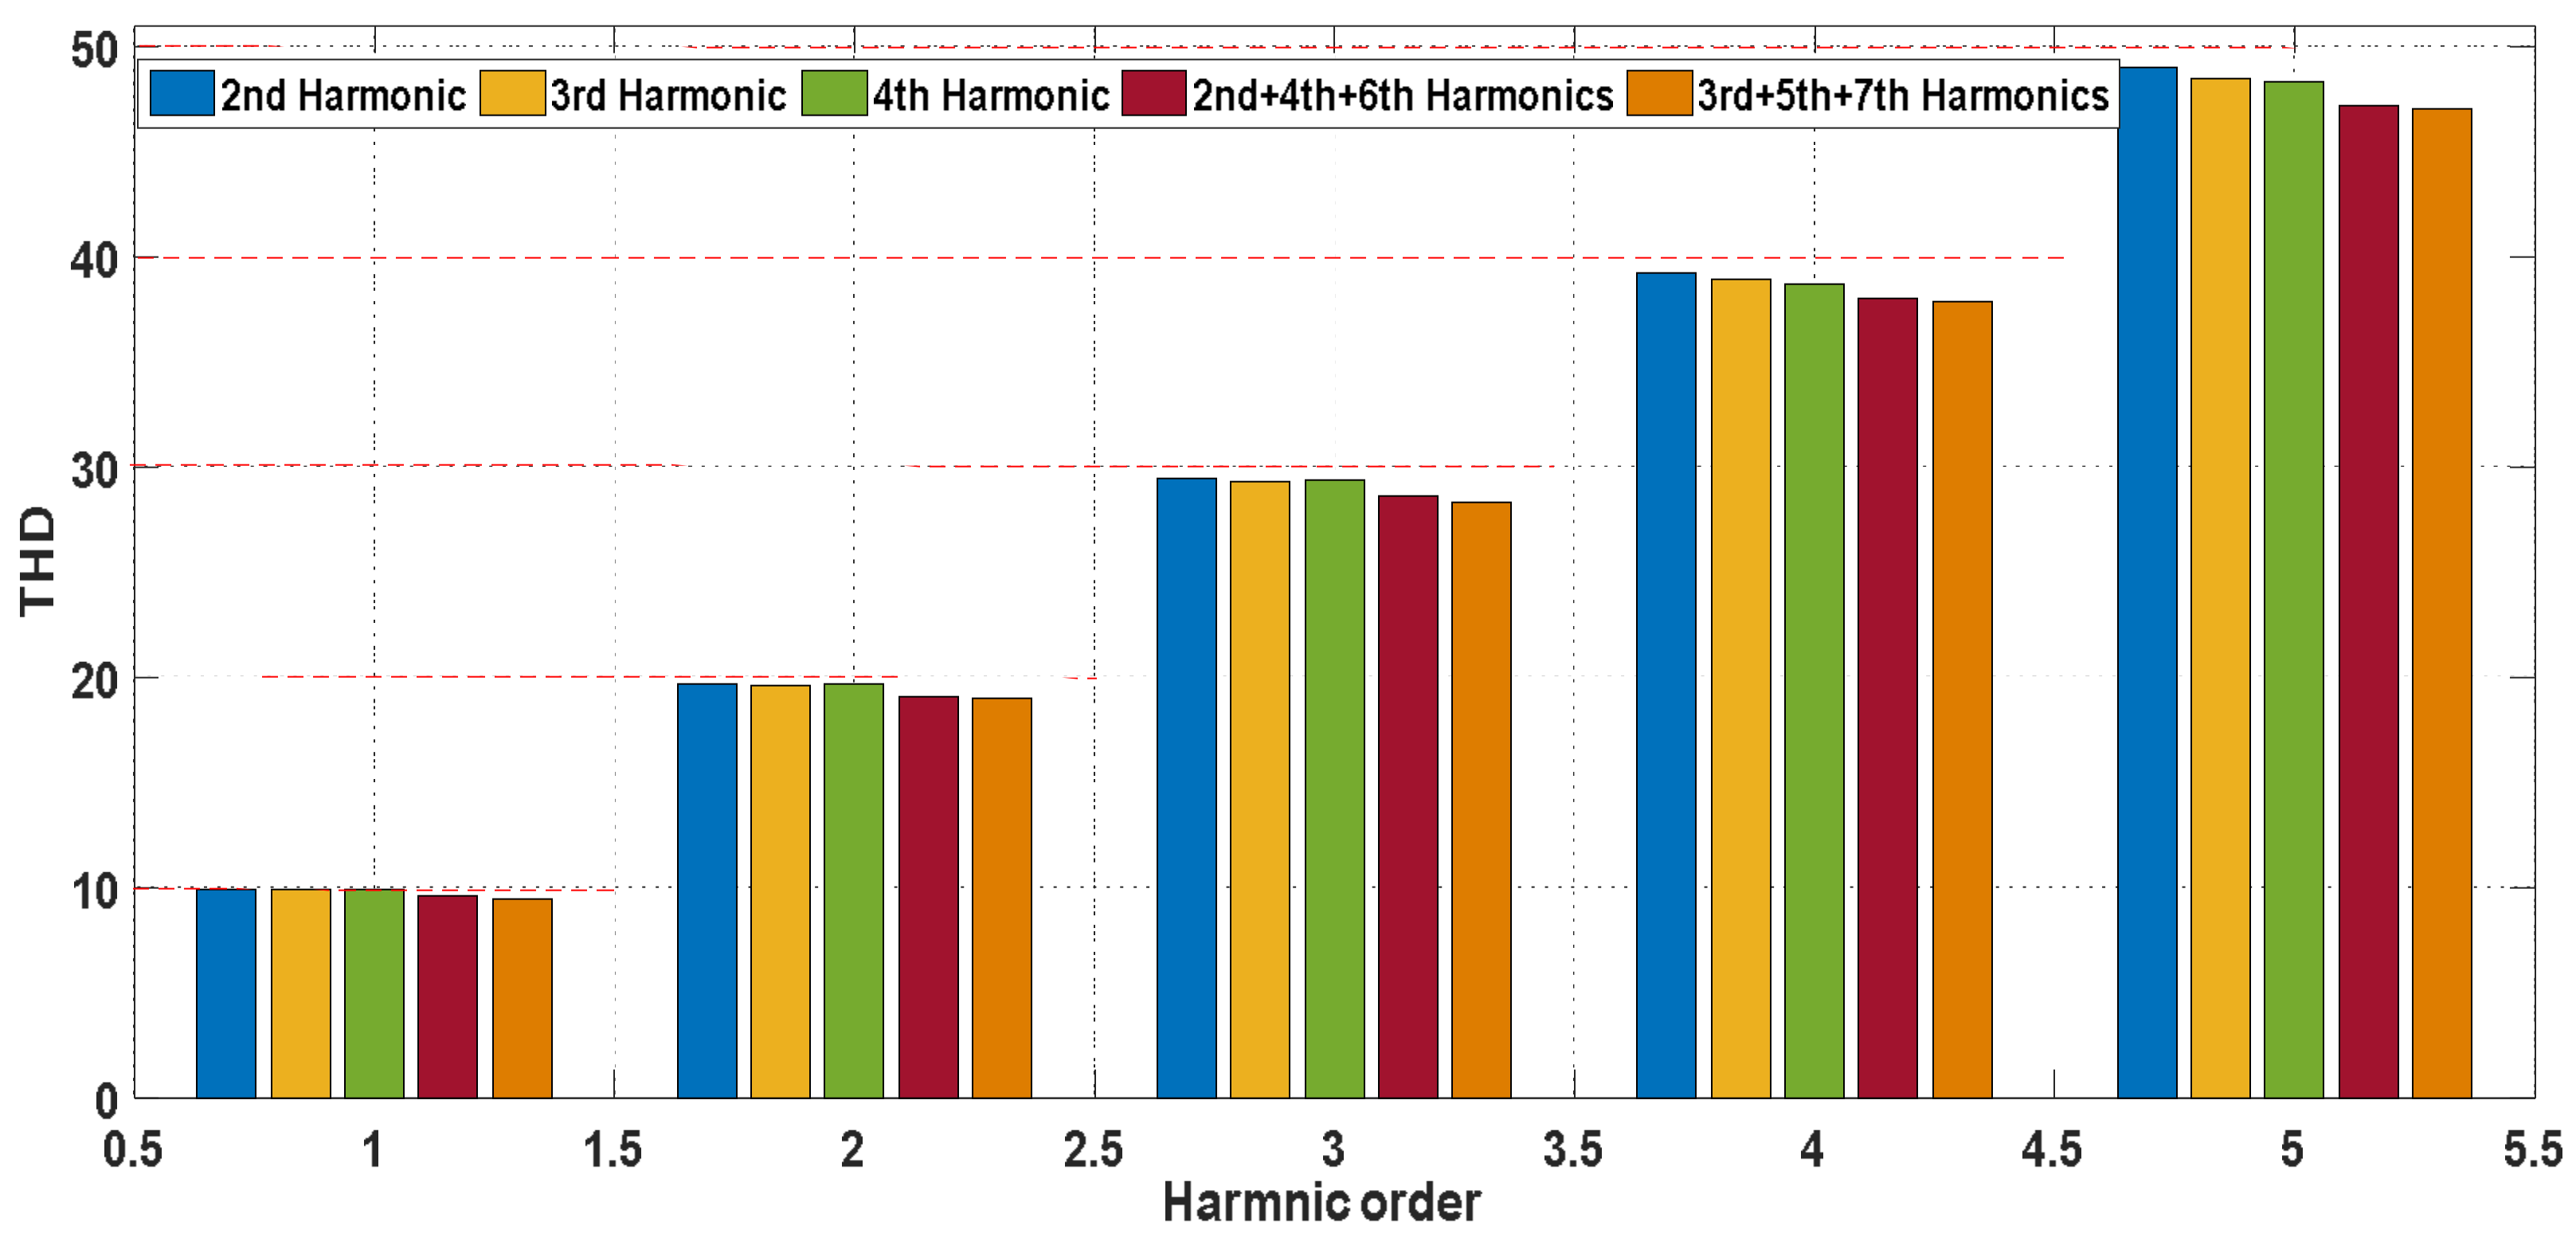
Figure 15 shows the measurement of THD in the model. The harmonic measurements evaluate the error of calculation. The measurements of the third harmonic show that the error of the calculation in the model is increasing according to the harmonic percentage of the signal and the error of the calculation of the third harmonic is ca. 1% when the harmonic percentage is 0–10%. After that, the error of the calculation of the third harmonic is stabilized to 2% when the harmonic percentage is 10–50%. The highest error in the calculation of THD can be found in mixed harmonics, as shown in Figure 15 and in Table 6; the THD for the 3rd + 5th + 7th harmonics is around 1–2% when the harmonic percentage is 0–10%. After that, the error in the calculation of the THD for the 3rd + 5th + 7th harmonics is stabilized to 3% when the harmonic percentage is 10–50%.
Because the model implements the voltage and current signals, it is able to measure higher THD than the physical relay, as shown in Figure 15. The model captures harmonics with accuracy of 90–95%. In the case of the individual harmonics, however, the physical relay captures with accuracy of 80–85%, as shown in Figure 14. Similarly, mixed harmonics are inserted in the physical relay accompanied by the fault current and voltage signals. The physical relay captures mixed harmonics with accuracy of 65–70%, however the model captures mixed harmonics with accuracy of 85–90% , as shown in Figure 14 and Figure 15.
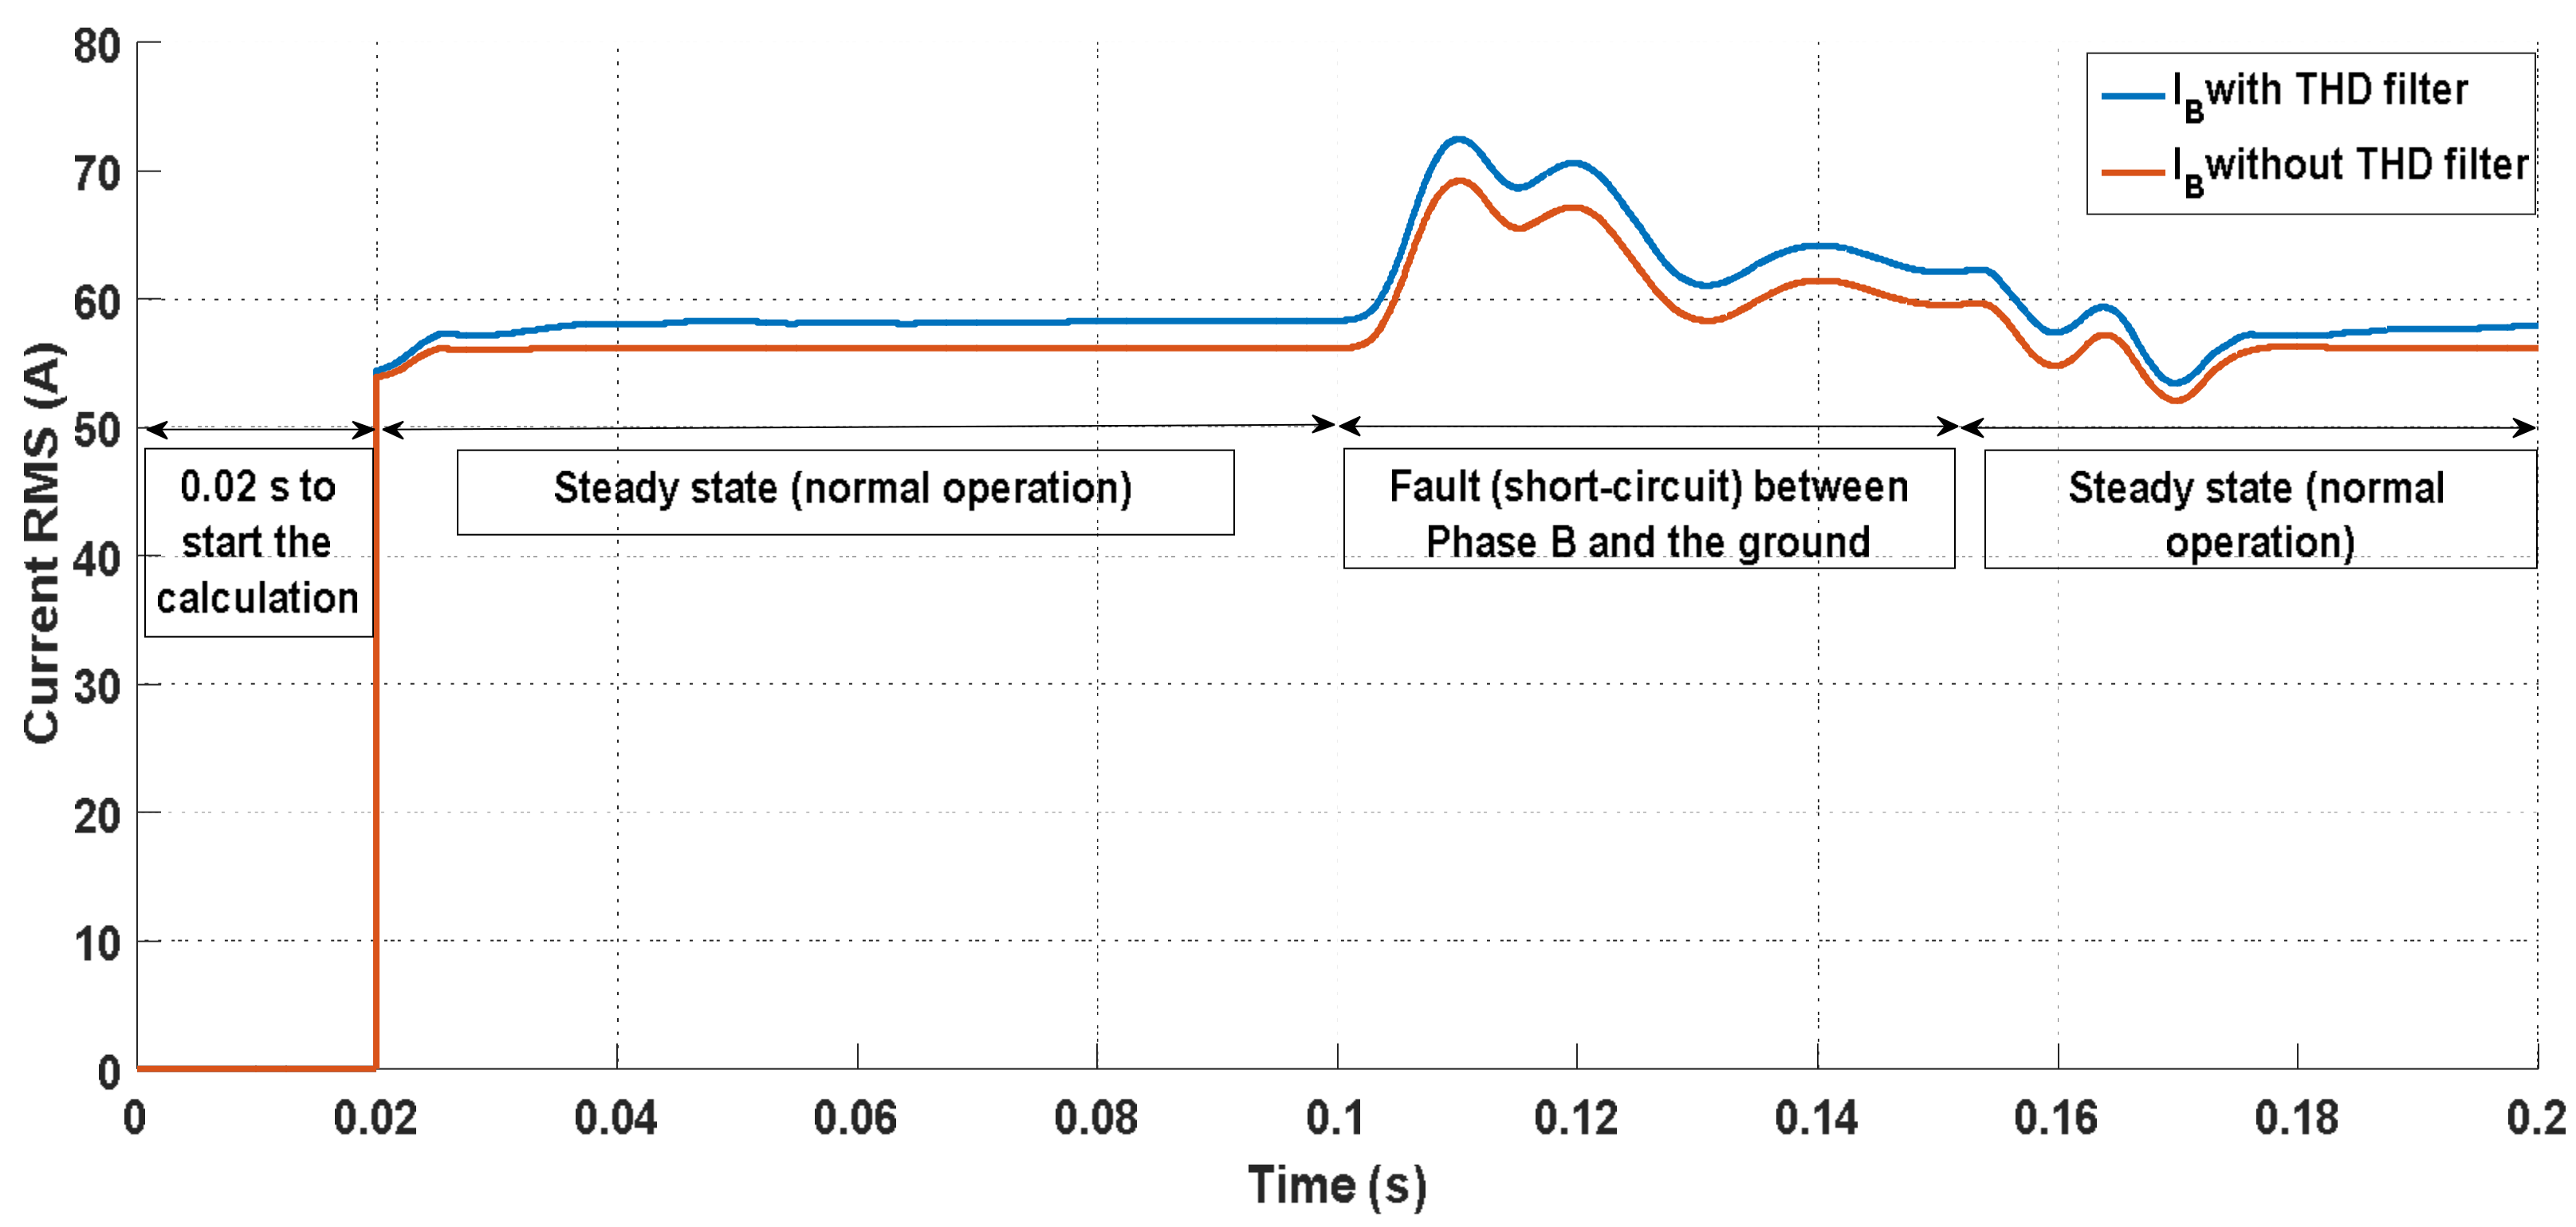
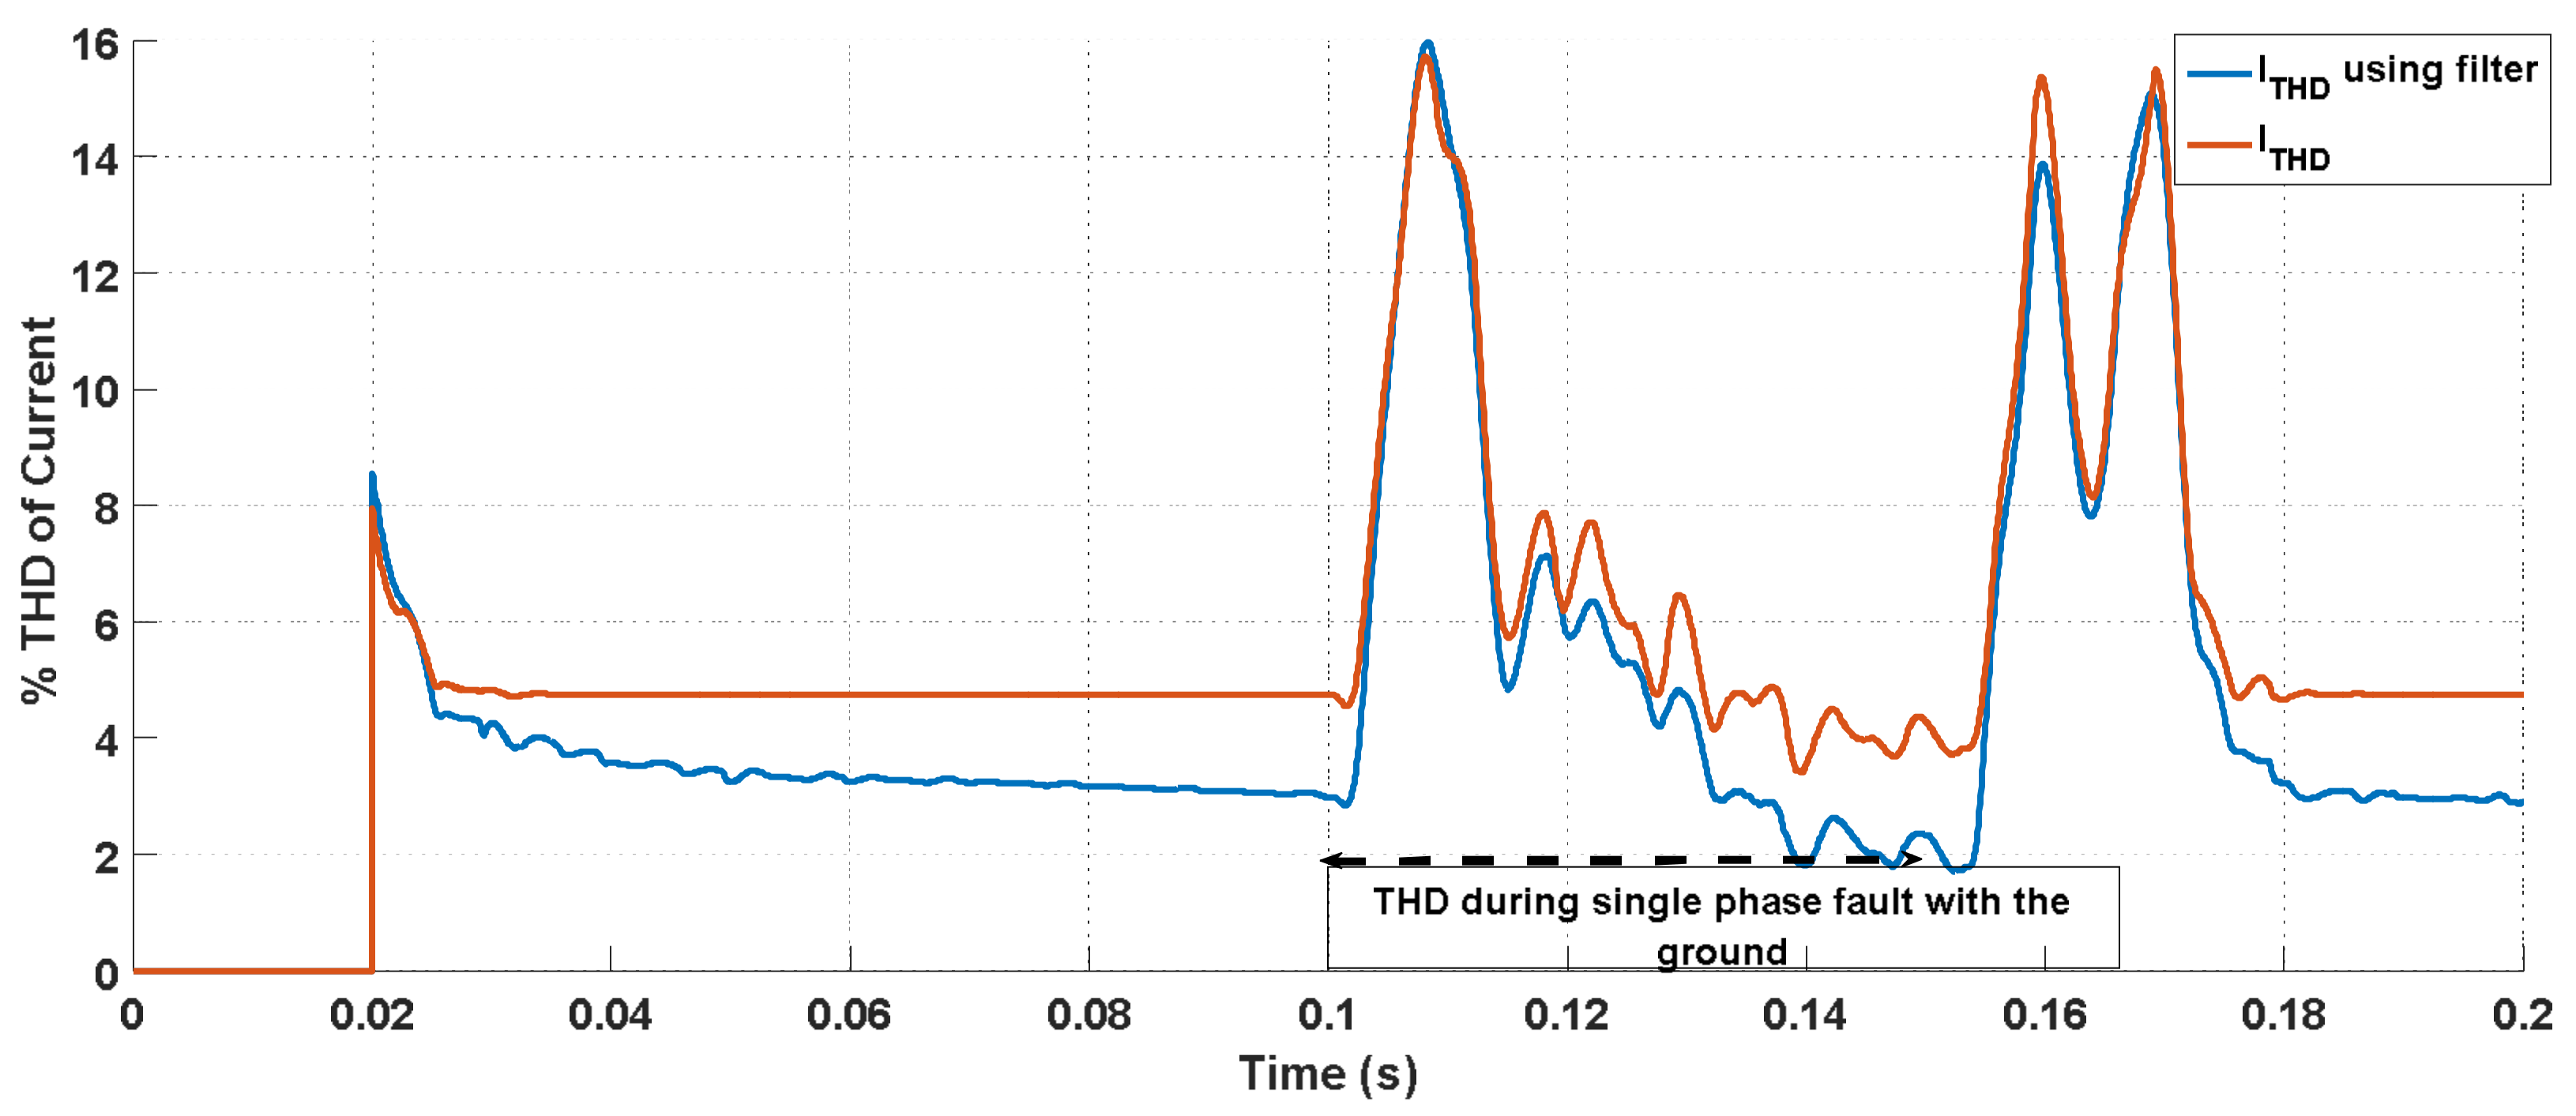
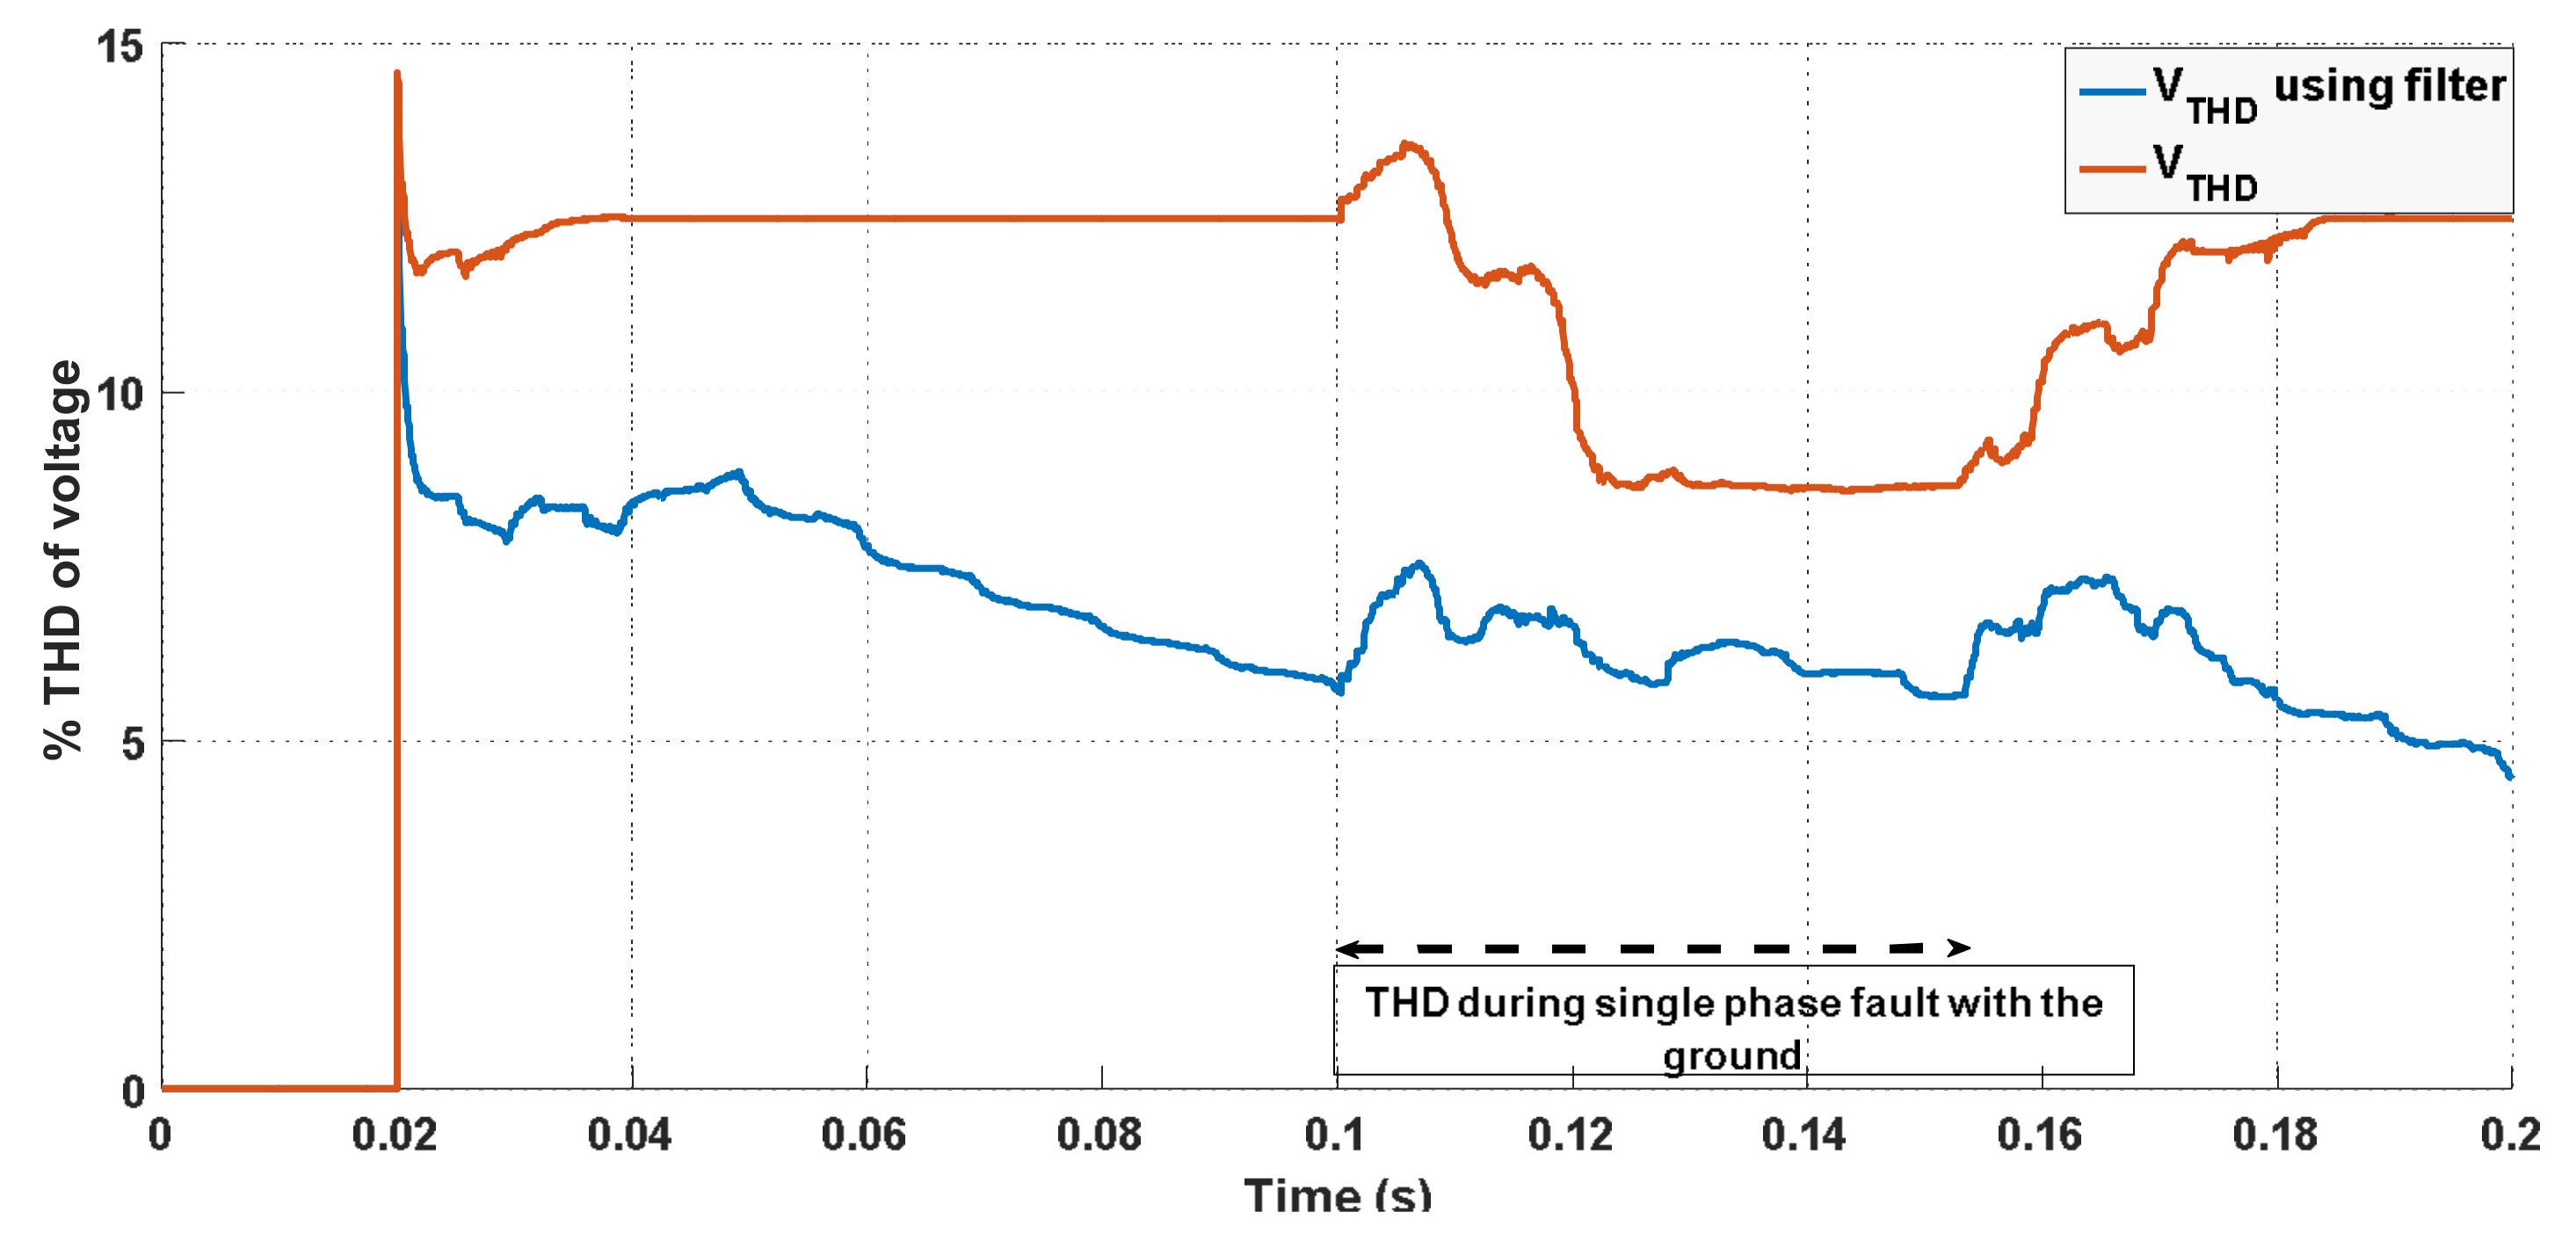
The model provides a filter to reduce the harmonic distortion; this filter is built up from passive RLC components. Their values are computed using the specified nominal reactive power, tuning frequency, and quality factor. The filter has been implemented to mitigate the total harmonic distortion of the current and voltage. In case of an abnormal condition (a short circuit), the simulation implements a fault (a single-phase with the ground) from 0.1 to 0.15 s. Conversely, the steady state has been implemented during the period from (0 to 0.1) s and (0.15 to 0.2) s. During the implementation of the simulation, the delay to start the calculation at the very beginning takes 0.02 s or 1 cycle. The steady state of the model takes place under normal operation and the calculation of voltage total harmonic distortion (VTHD) and current total harmonic distortion (ITHD) are implemented. Abnormal operation begins at 0.1 s and lasts for 0.05 s (2.5 cycles), which is accompanied by increasing the fault current and decreasing the voltage.
Figure 16 shows the rms current calculation during the steady state and fault (short circuit) between phase B and the ground. The THD filter block offers the possibility to mitigate the harmonics, and the THD filter is designed to reduce the 5th, 7th, 11th, and 13th) harmonics, as it known that the physical relay has the ability to remove harmonics up to the 5th.
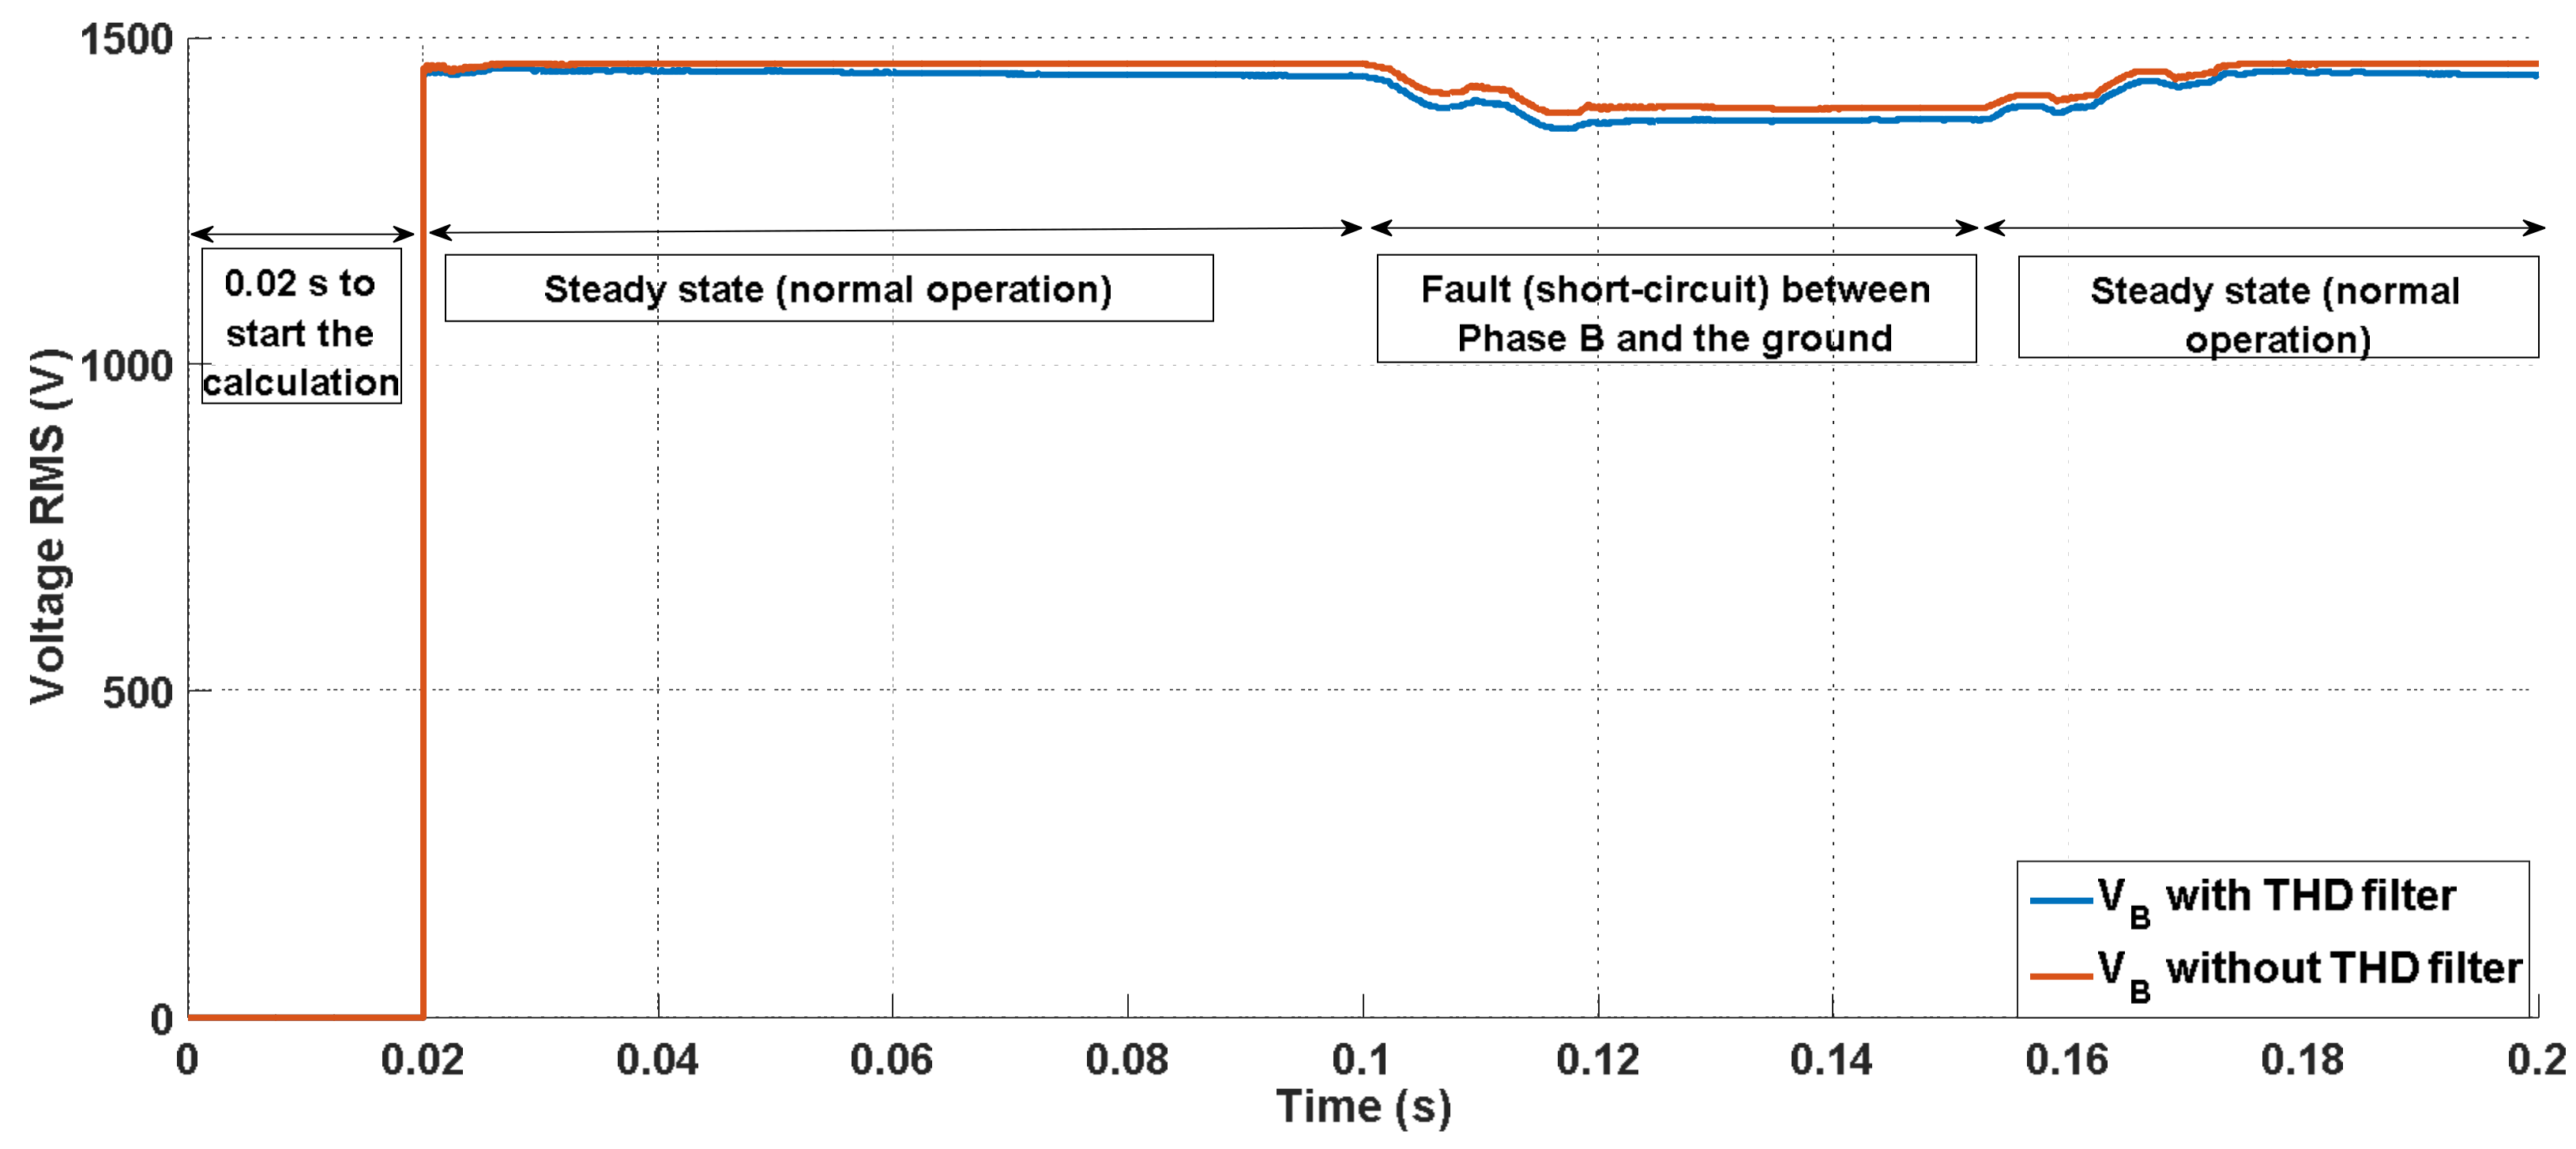
Figure 17 shows the comparison between the rms measured voltage with and without a THD filter. The figure confirms the assumption that the rms voltage with a THD filter is lower than the rms voltage without a THD filter.
Figure 18 shows the computed total harmonic distortion (THD) of the current signal. The THD is defined as the rms value of the total harmonic content of the signal divided by the rms value of its fundamental signal. For example, for currents, the THD is defined as
- In: rms value of the harmonic n,
- IF: rms value of the fundamental current.
In Figure 18, when the simulation performs a normal condition, the ITHD has decreased accordingly by 1% to 2% when the filter has been implemented, during the short circuit the ITHD has decreased accordingly by 0.4% to 1.7%.
In Figure 19, when the simulation was run under normal conditions, the VTHD decreased accordingly by 5% to 7%. When a filter was implemented during the short circuit, the ITHD decreased accordingly by 2% to 5%.
7. Conclusions
This paper explains part of the digital signal processing in a power system. Moreover, the paper provides different methods to compare the relay algorithm which can be used in a power system based on the impact of harmonics once they are injected in high values. The implementation of the test requires analyzing the occurrence of events in the power system. Each event contained in the input signals can be imported to Matlab via a Comtrade reader which reads the selected event. Digital relays are limited because they can only respond to changes in the magnitude of the fundamental current or voltage. Regarding overcurrent relays, a low level of harmonic distortion may not affect their operation. However, concerning distance relays, while the relay’s ability to find faults away from zone’s limit may still be reliable, when it comes to faults located near the limit of the zone, there is a possibility for the distance relay to be misguided as to the location of the fault.
Protective relays implement different techniques to measure the current and voltage. The microprocessor relays use a digital filter to take out the fundamental component. Filtering techniques were developed to accommodate a wide variety of harmonic influences. Anti-aliasing provides the ability to remove the frequencies higher than the Nyquist frequency; filter techniques should be implemented to reduce the harmonic level from the power system measurements. The THD filter implemented in this paper can mitigate the THD of the current and voltage. The calculations of the THD during abnormal and normal conditions showed that the voltage harmonics were reduced by 2–5% and the current harmonics were reduced by 0.4–1.7%.
Acknowledgments
This research work has been carried out in the Centre for Research and Utilization of Renewable Energy (CVVOZE). Authors gratefully acknowledge financial support from the Ministry of Education, Youth and Sports of the Czech Republic under NPU I programme (project No. LO1210).
Author Contributions
Kinan Wannous performed the measurements, data analysis and created the simulation model. Petr Toman consulted the results of the analysis. All of the authors have been involved in writing the manuscript.
Conflicts of Interest
The authors declare no conflict of interest.
References
- Al-Musawi, L.; Waye, A.; Yu, W.; Al-Mutawaly, N. The effects of waveform distortion on power protection relays. In Proceedings of the International Protection Testing Symposium, Feldkirch, Austria, 13–14 October 2015. [Google Scholar]
- Wang, F.; Bollen, M. Classification of Component Switching Transients in the Viewpoint of Protective Relays. Ph.D. Thesis, Chalmers University of Technology, Göteborg, Sweden, 2003. [Google Scholar]
- Paithankar, Y.G. Line protection with distance relays. In Book Transmission Network Protection: Theory and Practice, 6th ed.; Dekker, M., Ed.; Dekker: New York, NY, USA; Basel, Switzerland; Hong Kong, China, 1998; pp. 296–321. [Google Scholar]
- Zocholl, S.E.; Benmouyal, G. How microprocessor relays respond to harmonics, saturation, and other wave distortions. In Proceedings of the 24th Annual Western Protective Relay Conference, Spokane, WA, USA, 21 October 1997. [Google Scholar]
- Achleitner, G.; Fickert, L.; Obkircher, C.; Sakulin, M.; IFEA, T.; AG, Ö.I.B. Earth fault distance protection. In Proceedings of the 20th International Conference and Exhibition on Electricity Distribution, Prague, Czech Republic, 8–11 June 2009; pp. 1–4. [Google Scholar]
- Cease, T.W.; Kunsman, S.A.; Apostolov, A.; Boyle, J.R.; Carroll, P.; Hart, D.; Johnson, G.; Kobet, G.; Nagpal, M.; Narendra, K.; et al. Protective Relaying and Power Quality; IEEE PSRC Working Group Report; IEEE: Piscataway, NJ, USA, 2003; pp. 1–65. [Google Scholar]
- Pietkiewicz, A.; Melly, S. Harmonic Filter White Paper; White Paper; In Electric Power Quality; Springer: Dordrecht, The Netherlands, 2008. [Google Scholar]
- Schweitzer, E.O.; Hou, D. Filtering for protective relays. In Proceedings of the IEEE WESCANEX 93 Communications, Computers and Power in the Modern Environment, Saskatoon, SK, Canada, 17–18 May 1993; pp. 15–23. [Google Scholar]
- Kumar, B. Design of Harmonic Filters for Renewable Energy Applications. Master’s Thesis, Gotland University, Visby, Sweden, 2011. [Google Scholar]
- Durdhavale, S.R.; Ahire, D.D. A review of harmonics detection and measurement in power system. Int. J. Comput. Appl. 2016, 143, 42–45. [Google Scholar]
- Hodder, S.; Kasztenny, B.; Fischer, N.; Xia, Y. Low second-harmonic content in transformer inrush currents—Analysis and practical solutions for protection security. In Proceedings of the 67th Annual Conference for Protective Relay Engineers, College Station, TX, USA, 31 March–3 April 2014; pp. 1–20. [Google Scholar]
- Kim, G.; Lee, H. A study on IEC 61850 based communication for intelligent electronic devices. In Proceedings of the 9th Russian-Korean International Symposium on Science and Technology, Novosibirsk, Russia, 26 June–2 July 2005. [Google Scholar]
- Leao, P.S.; Barroso, G.C.; Melo, N.X.; Sampaio, R.F.; Barbosa, J.A.; Antunes, F.L. Numerical relay: Influencedby and accessing the power quality. In Book Power Quality, 1st ed.; Eberhard, A., Ed.; InTech: Rijeka, Croatia, 2011; pp. 213–236. ISBN 978-953-307-180-0. [Google Scholar]
- Elphick, S.; Ciufo, P.; Smith, V.; Perera, S. Summary of the economic impacts of power quality on consumers. In Proceedings of the Australasian Universities Power Engineering Conference (AUPEC), Wollongong, Australia, 27–30 September 2015; pp. 1–6. [Google Scholar]
- Daut, I.; Hasan, S.; Taib, S. Magnetizing current, harmonic content and power factor as the indicators of transformer core saturation. J. Clean Energy Technol. 2013, 1, 304–307. [Google Scholar] [CrossRef]
- Ho, J.M.; Liu, C.C. The effects of harmonics on differential relay for a transformer. In IEE Conference Publication; Institution of Electrical Engineers: London, UK, 2001; pp. 2–34. [Google Scholar]
- Rafajdus, P.; Bracinik, P.; Hrabovcova, P.; Saitz, J.; Altus, J.; Höger, M.; Pyrhönen, J. Examination of Instrument Transformers for Their Employment in New Fault Location Method; ADE: Bologna, Italy, 2012; pp. 4585–4595. [Google Scholar]
- Cintula, B.; Eleschova, Z.; Belan, A.; Volcko, V.; Konicek, M.; Kovac, M. Impact of fault location on transient stability of synchronous generator. In Proceedings of the 2014 15th International Scientific Conference on Electric Power Engineering (EPE), Brno, Czech Republic, 12–14 May 2014; pp. 17–21. [Google Scholar]
- Alkandari, A.; Soliman, S. Measurement of a power system nominal voltage, frequency and voltage flicker parameters. Int. J. Electr. Power Energy Syst. 2009, 31, 295–301. [Google Scholar] [CrossRef]
- Apostolov, A.; Vandiver, B. Maintenance testing of multifunctional distance protection IEDs. In Proceedings of the Transmission and Distribution Conference and Exposition, New Orleans, LA, USA, 19–22 April 2010; pp. 1–6. [Google Scholar]
- Kaspirek, M.; Mikulas, L.; Mezera, D. Analysis of voltage quality parameters in LV distribution grids with connected distributed energy sources. CIRED-Open Access Proc. J. 2017, 2017, 513–516. [Google Scholar] [CrossRef]
- Kaspirek, M.; Mikulas, L.; Mezera, D.; Prochazka, K.; Santarius, P.; Krejci, P. Analysis of voltage quality parameters in MV distribution grid. CIRED-Open Access Proc. J. 2017, 2017, 517–521. [Google Scholar] [CrossRef]
Figure 1.
The test structure.

Figure 2.
Model for current/voltage signal processing (DSP).

Figure 3.
Low pass filter block characteristics.

Figure 4.
Phase locked loop (PLL) system. (PID: proportional–integral–derivative controller).

Figure 5.
Frequency variation measurements between 50 and 52 Hz.

Figure 6.
Frequency variation measurements between 48 and 50 Hz.

Figure 7.
Characteristic zones of a distance relay and fault points.

Figure 8.
Decomposed voltage waveform with Fourier transform/Matlab window.

Figure 9.
Decomposed voltage waveform with Fourier transform/Matlab window.

Figure 10.
Quadrilateral characteristic and measured fault impedance locus.

Figure 11.
Voltage waveforms during single-phase fault (IED).

Figure 12.
Distance relay: tripping time (seconds) vs. THD level of grids.

Figure 13.
Distance relay: tripping time (seconds) vs. %THD level.

Figure 14.
Commercial relay measurement of THD.

Figure 15.
Model measurements of THD.

Figure 16.
Compare rms current calculation using THD filter & without THD filter.

Figure 17.
Compare rmsvoltage calculation using THD filter & without THD filter.

Figure 18.
Compare %THD of current calculation using THD filter & without THD filter.

Figure 19.
Comparison of the %THD of voltage calculation with and without THD filter.


Table 1.
Parameters of low pass filter block.
| Parameter | Value |
|---|---|
| Passband edge frequency (Hz) | 6000 |
| Stopband edge frequency (Hz) | 12,000 |
| Maximum passband ripple (dB) | 0.1 |
| Minimum stopband attenuation (dB) | 80 |
| Input sample rate (Hz) | 28,000 * |
* Sampling frequency (3 kHz, 9 kHz, 28 kHz).
Table 2.
Harmonic testing conditions Omicron.
| Voltage | Current | Signal Definition | Triger Condition | Harmonic Input |
|---|---|---|---|---|
| VA | IA | Pre-signal time | Active high | % of fundamental |
| VB | IB | Signal | Active low | Absolute |
| VC | IC | Post-signal | ||
| Measured trip time |
Table 3.
Evaluation of the voltage harmonic from Grids.
| Grid | 3rd | 5th | 7th | 15th |
|---|---|---|---|---|
| 1 | 0.80% | 1.60% | 0.80% | 0.10% |
| 2 | 0.20% | 0.80% | 1.40% | 0.10% |
| 3 | 1.90% | 2.20% | 1.60% | 0.42% |
| 4 | 1.00% | 1.80% | 1.20% | 0.38% |
| 5 | 0.60% | 1.70% | 0.80% | 0.02% |
| 6 | 0.40% | 2.20% | 1.90% | 0.50% |
| 7 | 0.70% | 1.90% | 1.40% | 0.18% |
| 8 | 0.70% | 1.80% | 1.80% | 0.17% |
| 9 | 0.40% | 1.60% | 1.20% | 0.08% |
| 10 | 1.00% | 1.60% | 1.00% | 0.26% |
| 11 | 0.80% | 1.80% | 1.60% | 0.30% |
| 12 | 0.40% | 1.40% | 1.60% | 0.10% |
| 13 | 1.40% | 1.40% | 2.00% | 0.41% |
| 14 | 0.80% | 1.80% | 1.60% | 0.20% |
| 15 | 1.00% | 1.80% | 0.80% | 0.24% |
| 16 | 1.60% | 1.80% | 1.40% | 0.36% |
| 17 | 1.00% | 2.60% | 1.60% | 0.08% |
| 18 | 0.60% | 1.00% | 1.20% | 0.19% |
| 19 | 0.60% | 0.80% | 1.70% | 0.16% |
| 20 | 1.00% | 1.80% | 1.80% | 0.42% |
| 21 | 0.60% | 1.70% | 1.20% | 0.40% |
| 22 | 0.40% | 1.00% | 1.80% | 0.12% |
| 23 | 2.50% | 2.40% | 2.10% | 0.60% |
| 24 | 2.40% | 2.00% | 1.80% | 0.60% |
| 25 | 1.60% | 2.40% | 1.80% | 0.48% |
| 26 | 0.40% | 1.00% | 3.20% | 0.18% |
| 27 | 1.00% | 1.00% | 1.80% | 0.18% |
| 28 | 1.00% | 2.00% | 1.40% | 0.32% |
| 29 | 0.60% | 0.60% | 2.40% | 0.12% |
| 30 | 0.40% | 1.00% | 2.10% | 0.08% |
Table 4.
Data from distance relay’s tests with fault near to the border from zone 1 to zone 2.
| THD Level | Tripping Time (ms) | |||||
|---|---|---|---|---|---|---|
| Test 1 | Test 2 | Test 3 | Test 4 | Test 5 | Average | |
| 0.00% | 0 | 20 | 30 | 20 | 1 | 14.2 |
| 1.63% | 20 | 21 | 20 | 50 | 20 | 26.2 |
| 1.68% | 1005 | 1000 | 26 | 1000 | 1000 | 806.2 |
| 1.96% | 1000 | 170 | 1000 | 1000 | 15 | 637.0 |
| 1.97% | 30 | 1000 | 1005 | 25 | 1005 | 613.0 |
| 1.98% | 1005 | 1000 | 1005 | 80 | 1000 | 818.0 |
| 2.04% | 1000 | 130 | 180 | 30 | 1005 | 469.0 |
| 2.10% | 291 | 70 | 20 | 1000 | 1000 | 476.2 |
| 2.15% | 1000 | 1000 | 70 | 1000 | 1000 | 814.0 |
| 2.17% | 1000 | 1000 | 50 | 15 | 15 | 416.0 |
| 2.20% | 1000 | 1000 | 1000 | 40 | 210 | 650.0 |
| 2.22% | 20 | 1001 | 20 | 1000 | 1000 | 608.2 |
| 2.30% | 1000 | 160 | 1000 | 1005 | 60 | 645.0 |
| 2.36% | 80 | 20 | 1000 | 30 | 1000 | 426.0 |
| 2.41% | 100 | 1000 | 1000 | 1000 | 1000 | 820.0 |
| 2.47% | 60 | 40 | 20 | 1000 | 1005 | 425.0 |
| 2.55% | 1006 | 1000 | 160 | 1000 | 1000 | 833.2 |
| 2.56% | 1001 | 1000 | 20 | 1005 | 1000 | 805.2 |
| 2.65% | 1000 | 80 | 160 | 70 | 1000 | 462.0 |
| 2.66% | 1000 | 1000 | 1000 | 1000 | 1000 | 1000.0 |
| 2.77% | 1000 | 1000 | 90 | 1005 | 1000 | 819.0 |
| 2.81% | 1000 | 1000 | 20 | 1000 | 1000 | 804.0 |
| 2.84% | 1000 | 30 | 1000 | 1001 | 1000 | 806.2 |
| 2.98% | 1000 | 1000 | 40 | 15 | 1000 | 611.0 |
| 3.21% | 1000 | 46 | 40 | 1000 | 1000 | 617.2 |
| 3.34% | 1000 | 1000 | 26 | 1000 | 1000 | 805.2 |
| 3.38% | 50 | 1000 | 70 | 20 | 30 | 234.0 |
| 3.43% | 1000 | 1000 | 20 | 280 | 45 | 469.0 |
| 3.66% | 70 | 1000 | 1000 | 1000 | 1005 | 815.0 |
| 4.10% | 1000 | 1000 | 1000 | 1000 | 50 | 810.0 |
Table 5.
The error of calculation THD for commercial relay.
| THD | 10% | 20% | 30% | 40% | 50% |
|---|---|---|---|---|---|
| 2nd harmonic | 2.04 | 3.62 | 3.45 | 3.62 | 3.52 |
| 3rd harmonic | 7.526 | 9.89 | 10.29 | 10.19 | 10.13 |
| 4th harmonic | 9.89 | 20.48 | 20.48 | 14.28 | 20.48 |
| 2nd + 4th + 6th harmonics | 17.56 | 21.95 | 21.95 | 21.58 | 21.65 |
| 3rd + 5th + 7th harmonics | 21.95 | 35.13 | 34.53 | 34.22 | 34.77 |
Table 6.
The error of calculation THD for Matlab model.
| THD | 10% | 20% | 30% | 40% | 50% |
|---|---|---|---|---|---|
| Har2 | 1 | 1.52 | 1.69 | 2.04 | 2.04 |
| Har3 | 2.045 | 2.38 | 2.74 | 2.827 | 3.092 |
| Har4 | 1.01 | 1.522 | 2.739 | 3.359 | 3.519 |
| Har246 | 4.16 | 4.712 | 4.89 | 5.26 | 5.932 |
| Har357 | 5.266 | 5.263 | 6 | 6.1 | 6.38 |
© 2018 by the authors. Licensee MDPI, Basel, Switzerland. This article is an open access article distributed under the terms and conditions of the Creative Commons Attribution (CC BY) license (http://creativecommons.org/licenses/by/4.0/).
Share and Cite
MDPI and ACS Style
Wannous, K.; Toman, P. Evaluation of Harmonics Impact on Digital Relays. Energies 2018, 11, 893. https://doi.org/10.3390/en11040893
AMA Style
Wannous K, Toman P. Evaluation of Harmonics Impact on Digital Relays. Energies. 2018; 11(4):893. https://doi.org/10.3390/en11040893
Chicago/Turabian StyleWannous, Kinan, and Petr Toman. 2018. "Evaluation of Harmonics Impact on Digital Relays" Energies 11, no. 4: 893. https://doi.org/10.3390/en11040893
Note that from the first issue of 2016, this journal uses article numbers instead of page numbers. See further details here.