Article

Sensitivity Analysis of Key Parameters for Population Balance Based Soot Model for Low-Speed Diffusion Flames

1
School of Mechanical and Manufacturing Engineering, University of New South Wales, Sydney, NSW 2052, Australia
2
Department of Chemical and Materials Engineering, Hefei University, Hefei 230601, Anhui, China
3
School of Mechanical and Automotive Engineering, RMIT University, Melbourne, VIC 3000, Australia
4
Australian Nuclear Science and Technology Organisation (ANSTO), Locked Bag 2001, Kirrawee DC, NSW 2232, Australia
*
Author to whom correspondence should be addressed.
Energies 2019, 12(5), 910; https://doi.org/10.3390/en12050910
Submission received: 13 January 2019 / Revised: 23 February 2019 / Accepted: 4 March 2019 / Published: 8 March 2019

Abstract

:
In this article, the evolution of in-flame soot species in a slow speed, buoyancy-driven diffusion flame is thoroughly studied with the implementation of the population balance approach in association with computational fluid dynamics (CFD) techniques. This model incorporates interactive fire phenomena, including combustion, radiation, turbulent mixing, and all key chemical and physical formation and destruction processes, such as particle inception, surface growth, oxidation, and aggregation. The in-house length-based Direct Quadrature Method of Moments (DQMOM) soot model is fully coupled with all essential fire sub-modelling components and it is specifically constructed for low-speed flames. Additionally, to better describe the combustion process of the parental fuel, ethylene, the strained laminar flamelet model, which considers detailed chemical reaction mechanisms, is adopted. Numerical simulation is validated against a self-conducted co-flow slot burner experimental measurement. A comprehensive assessment of the effect of adopting different nucleation laws, oxidation laws, and various fractal dimension and diffusivity values is performed. The results suggest the model employing Moss law of nucleation, modified NSC law of oxidation, and adopting a fractal dimension value of 2.0 and Schmidt number of 0.9 yields the simulation result that best agreed with experimental data.

1. Introduction

Soot particles are fine carbonaceous particulates that are formulated through multiple physical binning and chemical reaction processes of intermediate combustion products. They are invariably incepted and evolved in the flame region, and subsequently dispersed in the smoke layer. The soot formation mechanisms begin with the soot nuclei inception from precursor species and it follows by the formation of lager fractal object via particle-particle collision events, including coalescence and aggregation, as well as via surface growth reaction of the soot particulates. It ends with the breakage of the clusters into fragments that are eventually consumed via oxidation processes [1,2]. Soot particulates can be carcinogenic and they endanger our lives through toxication, suffocation, or causing permanent damage to our respiratory systems, such as trachea, blood vessels, and lungs [3]. As a strong emitter and absorber of radiative heat, soot particulates significantly affect the global heat transfer process, both in the inflame and surrounding regions [2,4]. This is especially hazardous in compartment fire scenarios, where the inhalation of the toxic compounds, including flame generated gas mixture and soot particulates, combined its ability to obscure visibility through a combination of absorption and light scattering, can significantly interfere with the evacuation process [5]. The recent development of bio-based fire retardants material could significantly reduce the generation of fire and smoke [6,7], however, there are still a considerable amount of other combustible materials, such as wood and plastic consumables, which could potentially pose a threat to building fire safety. Hence, the evolution of soot particles is of great interest to both research and industrial communities. Is useful in the design of fire protection engineering systems, such as smoke extraction, smoke curtain, pressurised zone, and sprinkler systems. Accordingly, this work aims to investigate the formation and destruction processes of soot particulates in a non-premixed buoyant flame that is commonly encountered in compartment or wildland fires.
Flame generated soot particles have been commonly studied via experimental approaches. For instance, soot particulates can be locally collected using thermophoresis sampling technique, and then be visualized with transmission electron microscope (TEM) imaging [8]. Soot morphological information, e.g., projected area, radius of gyration, fractal dimension of the aggregates, primary particle size etc., can be collectively characterised. The second type of diagnostic approach is the optical based non-intrusive measuring technique, e.g., laser-induced incandescence (LII), elastic light scattering (ELS), small-angle neutron scattering (SANS), and small-angle X-ray scattering (SAXS), which provides insight into a wide variety of soot related properties, including size, structure, and composition of particulates [9,10,11,12]. However, spatial resolution of the measurement and the potential perturbation of the very combustion process under investigation when intrusive approaches are used limited the experimental approaches. Most of the optical and laser-based diagnostics are dependent on optical properties of the materials, which are very difficult characterise. Numerical modelling of soot particles using the population balance approach (PBA), on the other hand, can deliver informative data that are not assessable by experimental measurements alone, such as displaying the full spectrum of particle size and number density distribution for any location and time. Therefore, the use of numerical approaches can provide more theoretical insight that can significantly enhance our understanding of the soot formation mechanisms and the dispersion of soot particles for the research communities.
Numerical simulation of soot involves the appropriate description of the evolution of the fine hydrocarbon particulates as a result of incomplete combustion, which were subsequently immersed or recirculated back into the flammable gas mixture. This phenomenon could be resolved on various scales depending on the aim and focus of the investigation. For example, one conventional method that is commonly used in bushfire or compartment fire modelling is the macroscale level approach, in which only the hydrodynamics behaviours of the phase are resolved, and no more than a soot particle concentration (i.e., mass/volume fraction) term is resolved. However, such macroscale models were initially designed to assess industrial-scale fires and are usually limited to only simulate smoke movement, flow velocities, and temperatures changes due to soot radiation. Furthermore, the deviation of the predicted quantities is often beyond 20% when comparing with experimental measurements due to the lack of detail description of the actual physical and chemical processes that are involved [13]. The microscale Eulerian–Lagrangian approach, on the other hand, tracks the motion of discrete elements by considering the interaction of discrete particles within the computational domain. It provides more fundamental insights into the detailed description of the soot species evolution, thus enabling the deliver simulation with improved prediction accuracy [14]. Nevertheless, it is limited to microscopic level due to its immense requirement for small mesh sizes and it is not practical for medium-to large-scale fire modelling for the enormous computational cost. In practical engineering applications, most of the soot models used at present in commercial computational fluid dynamic (CFD) packages resolve the issue from an intermediate level, i.e., mesoscale, which focus on the local structural development and are aimed to investigate the evolvement of cluster groups e.g., droplets, bubbles, and particles [15,16,17,18,19]. The mesoscale model categorised all sooting processes into the consideration of critical mechanisms and it limits its scope to predict key soot-related properties with reasonable accuracy, whilst notably reducing the computational effort required [20,21,22]. The Direct Quadrature Method of Moments (DQMOM) soot model presented in this paper, therefore, is targeting to resolve soot evolution on a mesoscale level by taking into account all necessary soot processes that are involved the formation pathway, namely particle inception, aggregations, coagulation, surface growth, and oxidation.
One of the major drawbacks of common mesoscale soot models is the difficulty in quantifying case dependent properties. In practice modelling, such properties are often represented by an empirical value or are approximated by empirical formulations. This assumption or simplification, if not carefully justified, can generate large numerical errors. In fire modelling, the particulate size of soot species is one of the properties that has been oversimplified by most current mesoscale models. It is generally agreed that the soot particulate size can vary between a broad range, depending on various aspects, such as parent fuel composition, burner configuration, ambient condition, etc. The two-equations based semi-empirical model, e.g., Moss–Brookes soot model used in Fluent, however, considers a uniform soot particle size distribution (PSD) that is set based on a predefined empirical data, i.e., 35 nm [20]. The population balance based Standard Method of Moments (SMM) soot model evaluates particle size distribution with the use of a presumed log-normal function that is based on experimental data collected under certain flaming conditions [23]. The quadrature method of moment (QMOM) is an attractive alternative, which effectively resolves the enclosure by adopting a moment construction and inversion algorithm. This mathematical approach closed the population balance equation with limited computational burden and it proved to be numerically stable in most of its applications. Nevertheless, it is formulated based on a presumed particle size distribution method that is similar to the concept of SMM. The abovementioned numerical soot models could not directly evaluate the distribution of particle size that varies according to the combustion conditions, which could potentially lead to inaccuracies in determining the other soot properties that are particle size dependent.
The Direct Quadrature Method of Moments (DQMOM) that was developed by Marchisio and Fox [24] directly solves the nodes and weights of the quadrature approximation of the number density function for an internal coordinate, e.g., particle sizes. This novel approach enables the prediction of the real-time and spatial size distribution and, hence, further improves the accuracy of soot mass fraction predictions. Previous numerical studies that implemented the DQMOM approach in soot modelling have showcased its competency to provide promising results with moderate computational burden [25,26,27,28]. However, those studies are mainly focused on the investigation of inertia-driven highly turbulent flame with relatively high fuel/oxidiser injection rate, for example, with 50 ms−1 fuel injection rate. A DQMOM-based soot model targeting low-speed buoyancy-driven diffusion flame, which corresponds better to natural fire occurrences in open configuration, e.g., bushfire and compartment fire, has not been formulated and tested. Moreover, it has been reported that DQMOM algorithm can be numerically unstable and difficult to implement, i.e., generating unrealizable (negative) weights and nodes, if the system is not cautiously designed. Alternative approaches that were proposed by Mueller et al. and Chittipotula et al. [28,29] could potentially resolve the numerical issue. However, the alternative approaches often require solving additional sub-modules that are integrated to the framework or correction algorithms, which could significantly increase the computational cost or need the cumbersome coupling of the CFD code with an external mathematical package. This challenge could become more predominant when the investigated case has relatively small spatial-diffusion terms [29], like the flame of the interest in this work. Therefore, it is critical to systematically investigate the effect of all modelling aspects to ensure the numerical robustness and simulation accuracy.
The information about soot particle size distribution could also aid the design of fire protection systems in practical engineering. Among previous works on smoke control systems [30], it is discovered that the smoke detection system is mainly categorised into three types: (i) ionisation smoke alarms, (ii) light obscuration photoelectric alarms, and (iii) light scattering photoelectric alarms. When the soot particles reach a particular size, it will trigger the alarms by either (i) providing a voltage signal for ionisation alarms, (ii) blocking the light signals to the receiver for obscuration type photoelectric alarms, or (iii) changing the light scattering for scattering type photoelectric alarms. Nevertheless, the current drawbacks of the use of numerical models to predict the detection of smoke particulates are lacking in consideration of the particle size distribution. In essence, the alarms in numerical codes such as FDS is trigger by either gas temperature or smoke volume fraction, which often lead to inaccurate response time. With the application of the DQMOM approach, providing an enhanced understanding of soot formation and destruction processes, especially for the particle size distribution, will contribute to the prediction of fire protection systems.
In light of the above gaps in knowledge, this work will present, for the very first time, a detailed parametric study on the effects of key modelling aspects of an in-house soot model that is built based upon the DQMOM algorithm that enables the real-time tracking of the evolution of PSD. The proposed soot model is fully coupled with a gas-phase combustion model incorporating detailed chemistry, and it is specifically formulated for a for a low-speed buoyant diffusion flame configuration with optimised parameters. The results of the present model are validated against measurements from a self-constructed experiment in the Combustion Laboratory, School of Mechanical and Manufacturing Engineering, the University of New South Wales. Comprehensive assessments will be performed on a collection of key parameters within the DQMOM framework towards the performance of soot modelling for turbulent diffusion flames, and the objectives can be summarised, as follows:
(i)
comparison of three nucleation laws, including Moss, Leung, and Fairweather, and discuss their effectiveness in predicting the changes in particle size due to the particle generations;
(ii)
study of two different oxidation law including modified NSC and Said to investigate the appropriate soot particle reduction or disruption mechanisms for DQMOM;
(iii)
investigating the influences of fractal dimensions towards the aggregation and surface growth mechanisms, as well as the effect on particle size distribution;
(iv)
study the effect of diffusion coefficient for soot quantities and number density towards the dispersion of soot particles within the computational field; and,
(v)
provide a deeper understanding of the soot formation process, in particular, within the flaming/soot nucleating region.

2. Mathematical Model

Numerical simulations have been carried out using an in-house population balance approach (PBA) DQMOM code coupled with Fluent solver (i.e., version 19.1). This computational fluid dynamics model incorporates sub-modelling components, including soot formation, turbulence, combustion, and radiation heat exchange to describe the fire phenomena. To take into account the highly irregular nature of the combustion process, several assumptions are made, including (i) the low Mach number flow equations are considered, (ii) the thermal-physical properties are constant, (iii) the ratio between mass and thermal diffusivity (Lewis number) is unity, (iv) no external body force and heat source are applied towards the flow, and (vi) non-adiabatic non-premixed combustion of the energy equation is adopted.

2.1. Governing Equations

The fully coupled, non-linear, and interactive physical and chemical processes that are involved in the turbulent reacting gas mixture caused by the pulsating diffusion flame is modelled using computational fluid dynamics techniques. With the application of the Favre averaging approach, the following governing equations, i.e., the continuity, Navier–Stokes, and scalar transport equations are utilised in this simulation study are given as:
ρ ¯ t + x i ρ ¯ U ˜ i = 0
ρ ¯ U i ˜ + U ˜ i U ˜ j + ρ ¯ u i u j ˜ = p ¯ x i + ( ν + ν t ) 2 ρ ¯ U ˜ i x j x j
ρ ¯ Φ ˜ α + ρ ¯ Φ ˜ α U ˜ i + ρ ¯ ϕ α u i ˜ = ( Γ + Γ t ) 2 ρ ¯ Φ ˜ α x i x i + S ( Φ ) ˜
where ρ ¯ and p ¯ are the mean density and pressure, ν and ν t is the kinematic and turbulent viscosity, U ˜ i and u i are the Favre-averaged and fluctuation value of the mean fluid velocity, Φ ˜ α and ϕ α are the mean and fluctuation value of the α th scalar, Γ and Γ t are molecular and turbulent diffusivity, and S ( Φ ) ˜ is the Favre-averaged chemical reaction source term.

2.2. Turbulence and Combustion Modelling

Literature works have suggested that the standard k - ε model is usually suitable for modelling non-premixed diffusion and non-swirling flames, like the one under investigation in this work [25,26,27,28]. The chemical reaction source term in the transport equations of the involved reacting scalars is determined by the strained laminar flamelet approach, in which the combustion chemistry is a pre-assumed probability density function (pre-PDF) of the mixture fraction ( f ) and the scalar dissipation ( χ ). In essence, the mixture fraction governs the amount of the fuel mixture in each control volume element in the simulation domain. The scalar dissipation is a term that is introduced to describe the strain and extinction of the flame, in which the magnitude of this quantity depicts the departure of the combustion process away from its chemical equilibrium [31]. It should be noted that, in the present work, the GRI-MECH 3.0 detailed chemical reaction mechanisms, which includes 325 reaction steps and 53 chemical species [32], was implemented to formulate the flamelet library for the strained laminar flamelet model, with ethylene (C2H4) being selected as the parental fuel. Such an approach of resolving turbulence-chemistry interaction has been demonstrated in previous studies to provide a reasonable result with moderate computational burden [18,33].
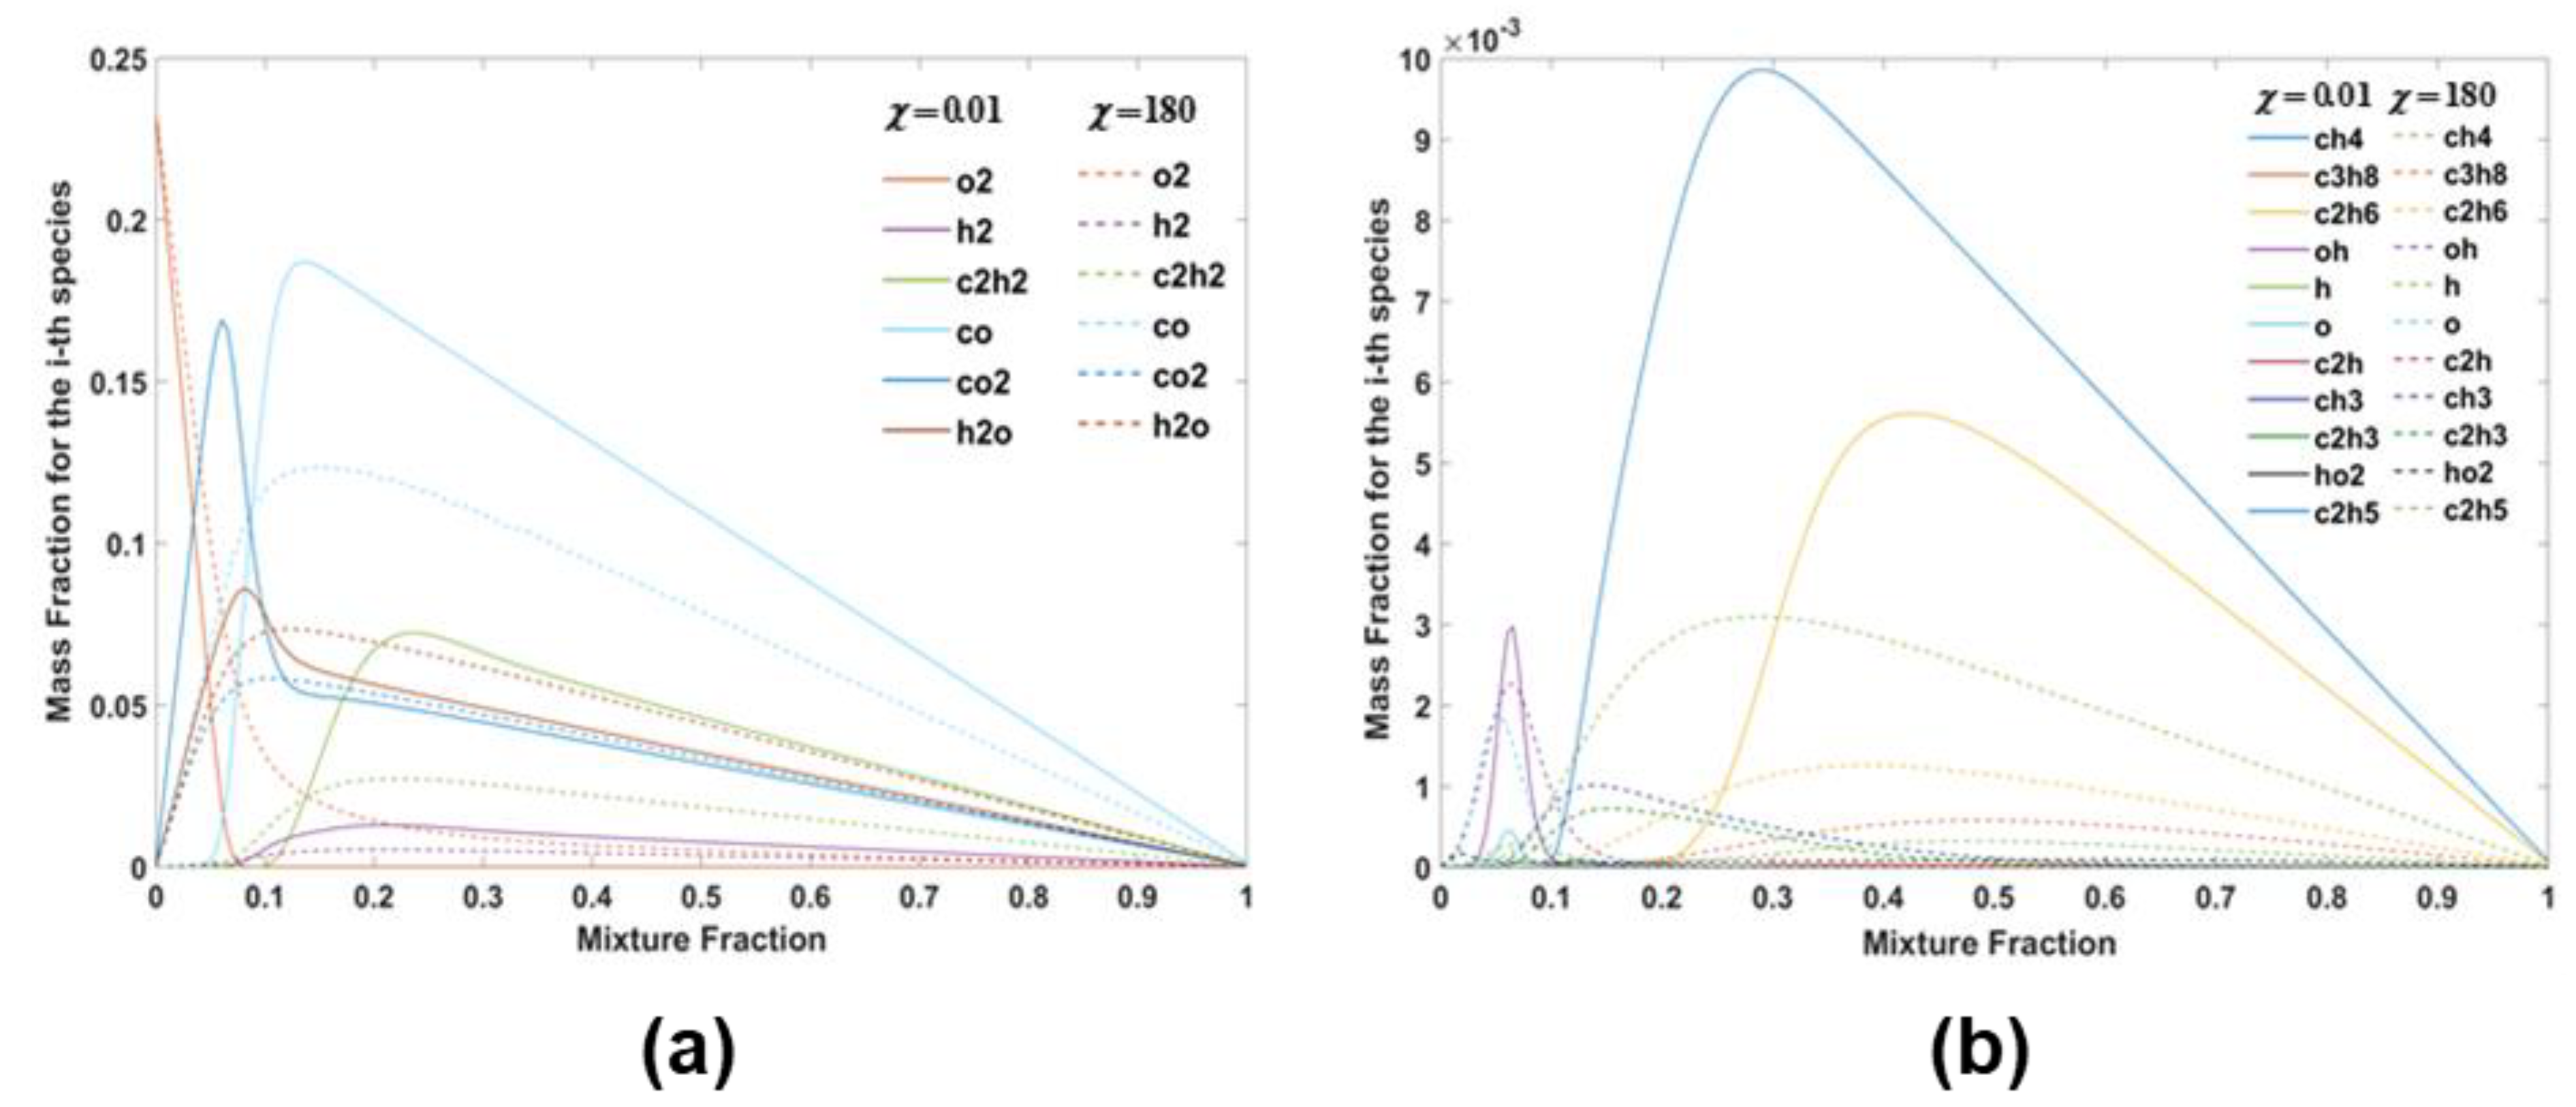
Figure 1 presents the post-processed flamelet profile results for major and minor species, respectively, at near-equilibrium and near-extinction scalar dissipation rates, being generated for 20 different scalar dissipation rates that range from 10−6 to 180. As can be seen, the key significant combustion products are oxygen, carbon monoxide, carbon dioxide, water vapour, hydrogen, and acetylene, while minor species include hydrocarbon compounds, oxygen, and hydrogen molecules.

2.3. Direct Quadrature Method of Moments (DQMOM) Model

The DQMOM model is written in numerical code and then adapted into the CFD framework. It fully resolves the evolution of the soot particulates in turbulent flames and its size distribution to give a better representation of the soot formation and disruption mechanisms by the DQMOM model. The population balance equation for the Favre-averaged number density n ˜ is firstly described, similar to the transport equation for moments, as:
t ( ρ ¯ n ˜ ) + x j ( ρ ¯ u j ˜ n ˜ ) = x j [ ( Γ T + Γ ) n ˜ x j ] + S ¯ n ˜
where n ˜ is the Favre-averaged number density function (NDF) of the internal coordinate vector ξ and S ¯ n ˜ is the source terms taken into the consideration of all chemical and physical mechanisms that are involved in soot evolution.
The main idea behind this methodology is to resolve the closure by introducing a quadrature approximation to evaluate the development of the moments of NDF. For a length-based system with mono-variable ( ξ = L ) , the NDF can be expressed as:
n ˜ α = 1 N ω α δ [ L L α ]
where ω α and L α are the weight and abscissas of node α of the quadrature approximation, N is the number of node points defined in the distribution of the internal coordinate, and δ indicates the Dirac delta function. Various soot-related properties can be subsequently derived from the k th moment of NDF. For example, with a length-based NDF, the particle number density, mean particle size, and volume fraction corresponding to the zeroth ( m ˜ 0 ), first ( m ˜ 1 ), and third moment ( m ˜ 3 ), and can be resolved as:
m ˜ k = 0 + n ˜ L k d L α = 1 N ω α L α k
Meanwhile, the weight and abscissas are solved through the DQMOM transport equations:
t ( ρ ¯ ω α ) + x j ( ρ ¯ u j ˜ ω α ) = x j [ Γ T ω α x j ] + α α
t ( ρ ¯ α ) + x j ( ρ ¯ u j ˜ α ) = x j [ Γ T α x j ] + b α
where α = ω α × L α is defined as the α th weighted abscissa, and α α and b α are the source terms for weight and weighted abscissa, respectively. For a numerical system with N = 2 , the source terms of α α and b α can be determined via solving the following rank four linear system of the first four moments:
α 1 + α 2 = S ¯ 0
b 1 + b 2 = S ¯ 1
L 1 2 α 1 L 2 2 α 2 + 2 L 1 b 1 + 2 L 2 b 2 = S ¯ 2 + C ¯ 2
2 L 1 3 α 1 2 L 2 3 α 2 + 3 L 1 2 b 1 + 3 L 2 2 b 2 = S ¯ 3 + C ¯ 3
where C ¯ k is a correction term of diffusion in real space expressed as:
C ¯ k = k ( k 1 )   α = 1 N L α k 2 ω α Γ T D α x j D α x j
and S ¯ k is the integrated source term of the k th moments as:
S ¯ k = + L k S ¯ n ˜ d L
In this particular soot modelling application, the integrated source term is evaluated as a summation of several contributions that account for critical physical and chemical mechanisms that are involved in soot evolution, e.g., nucleation, coagulation, surface growth, and oxidation. Each contribution can be expressed as a function of weight, weighted abscissas and the reaction rate of the mechanism. The formulation of the individual terms in the integrated source term is further described in detail in the following section.

2.4. Soot Formation Kinetics

In practical soot modelling, the following mechanisms are often defined as the key sooting process that is involved in the soot formation pathway, namely nucleation, aggregation, surface growth, and oxidation. Therefore, those mechanisms are considered in the formulation of the integrated source term, S ¯ k .

2.4.1. Nucleation

The in-flame soot formation commences with the inception process that solid-phase soot nuclei formed from the basic structural units (BSUs) consist of fuel fragments as a result of pyrolysis of the parent fuel [34]. The nucleation is, so far, the most complicated and least-understood process in soot formation. A generally accepted description of the phenomena is that the BSUs would polymerise and grow in size to formulate liquid-like polycyclic aromatic hydrocarbons (PAHs) precursor species with no internal structure, and subsequently transformed into solid-phase soot nuclei [2,35,36,37,38,39], under certain flaming condition.
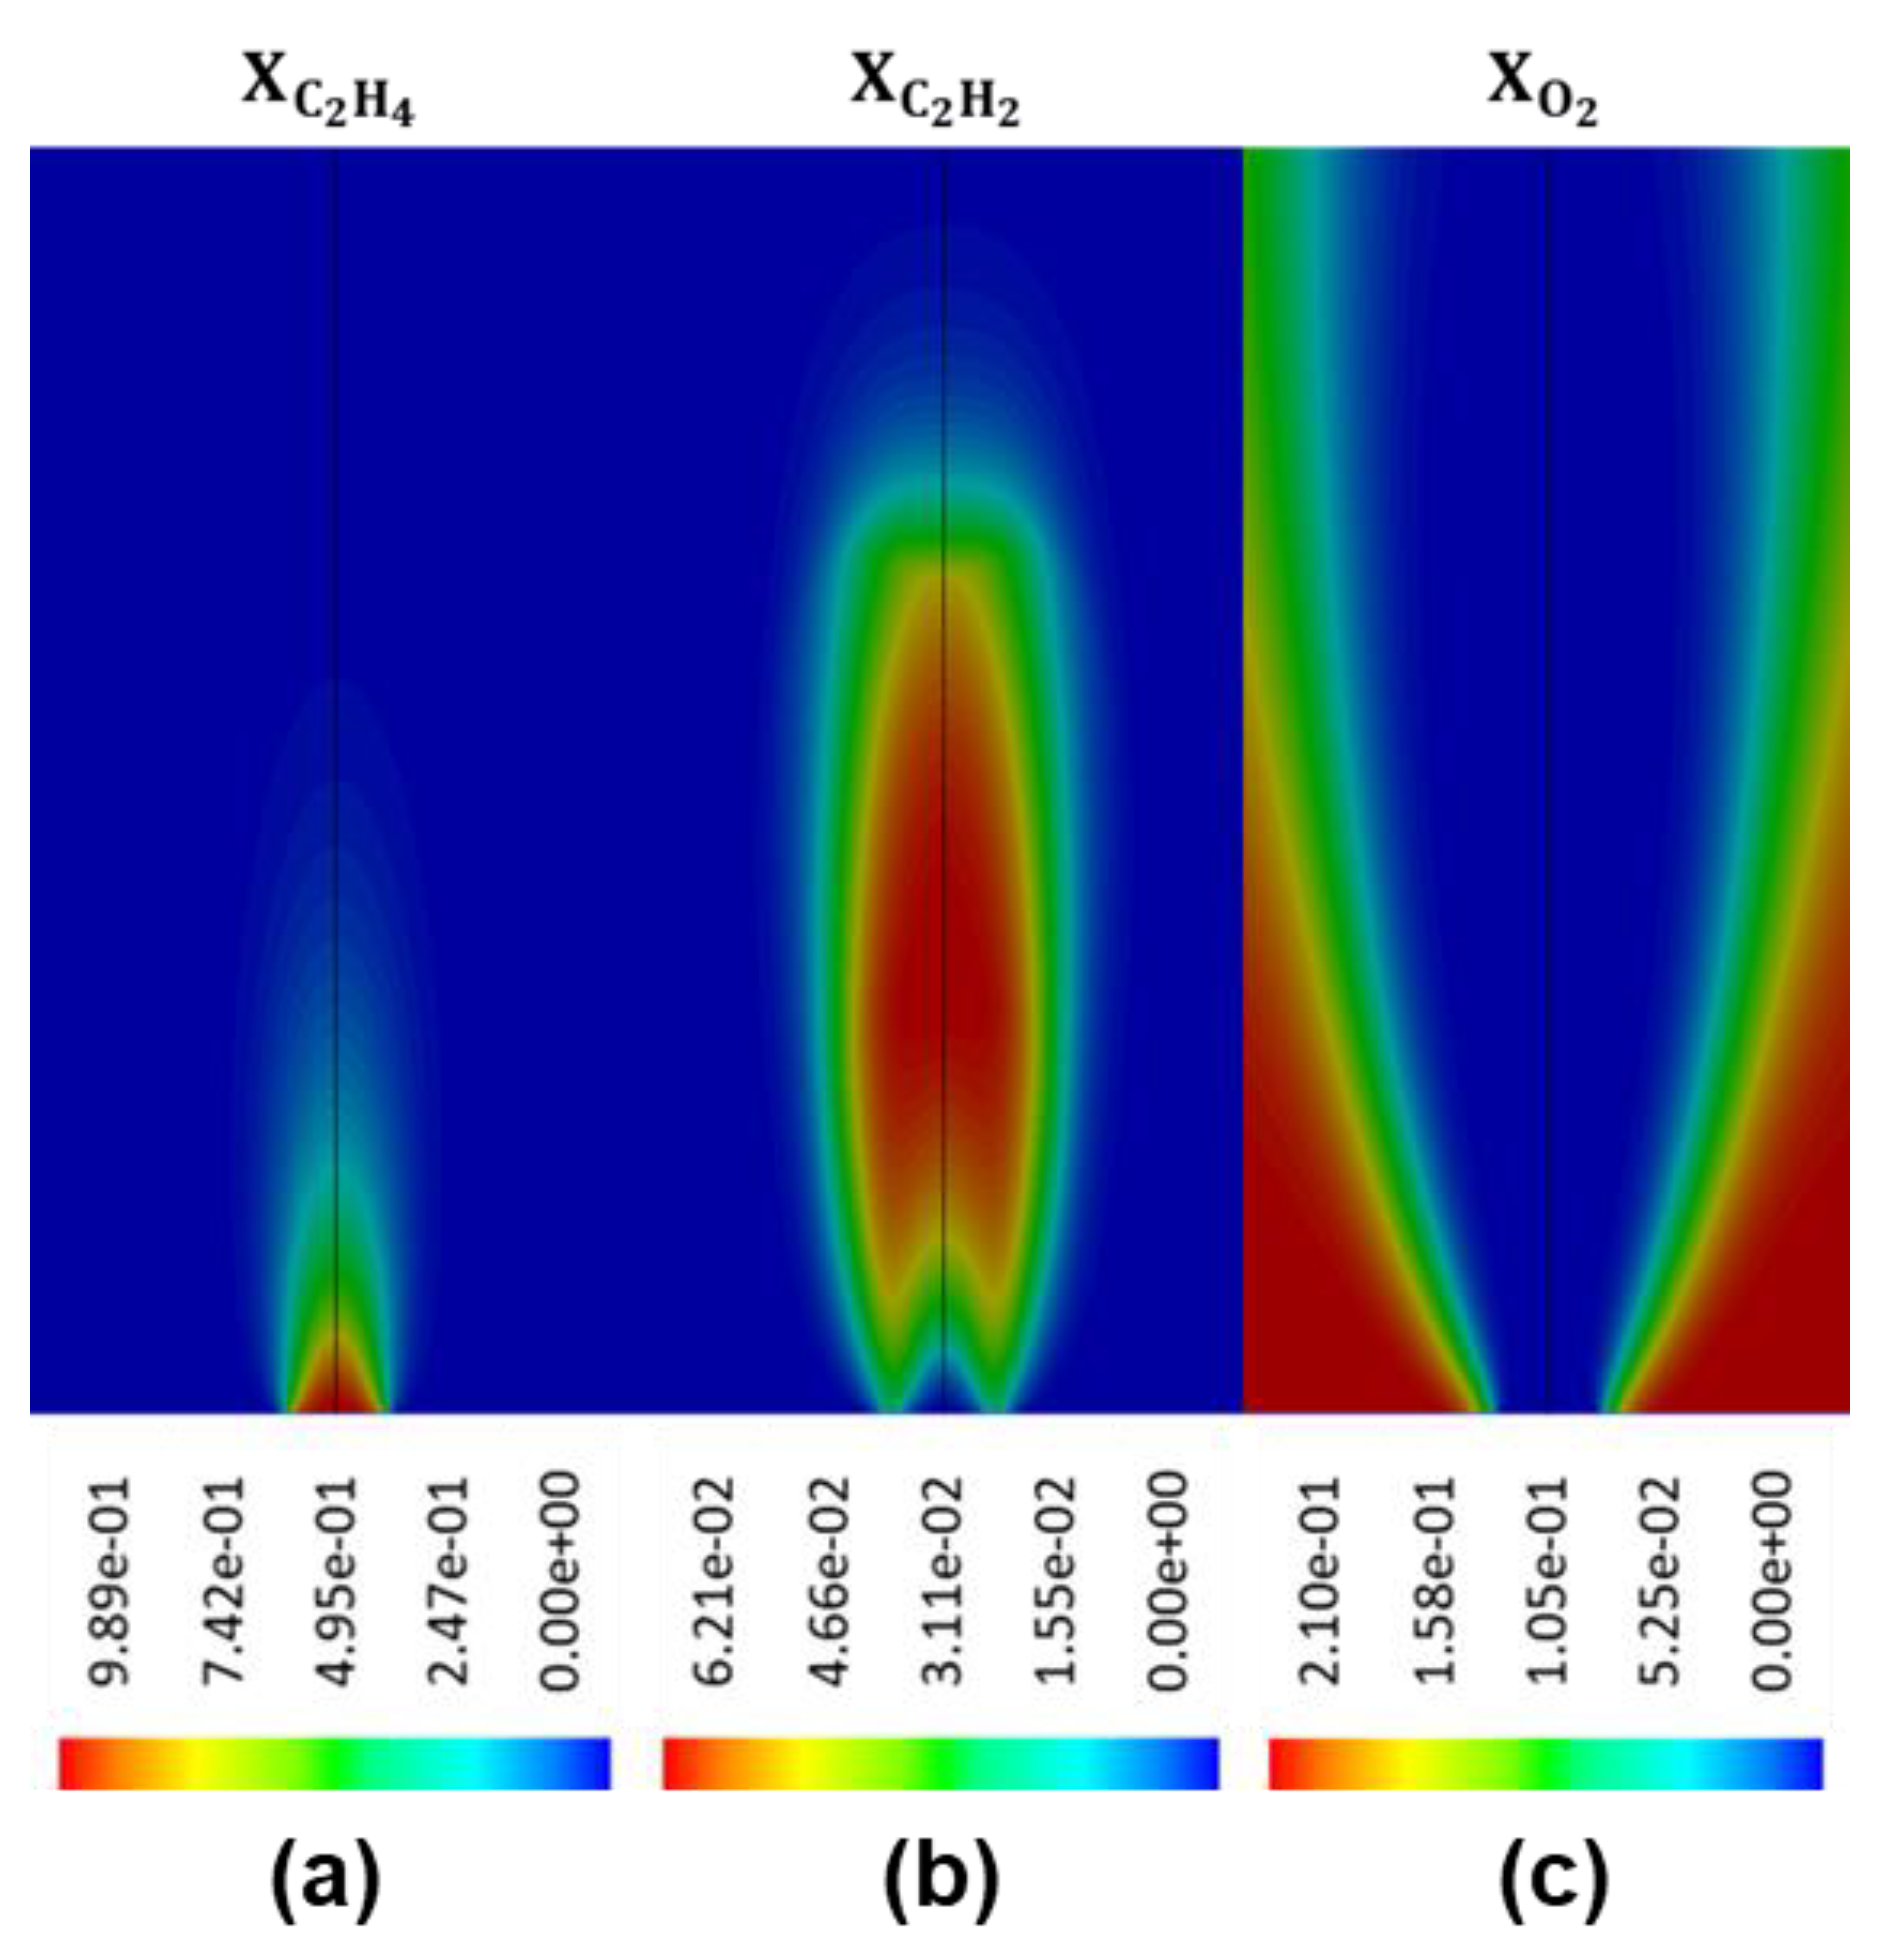
Numerically, the rate of nucleation is often expressed as a function of the concentration of acetylene, the main BSUs of hydrocarbon flame [40]. The following nucleation kinetics, while employing Moss [20], Leung [40], and Fairweather [27] approach to yield the reaction rates, refer to Equations (15)–(17), respectively, are considered in this study:
J M o s s = 6 × 10 6 ρ ¯ 2 N A T exp ( 46100 T ) X C 2 H 2
J L e u n g = 2 C m N A 1.7 exp ( 7548 T ) C C 2 H 2
J F a i r w e a t h e r = 2.7 × 10 6 ρ s C m N A exp ( 46100 R T ) C C 2 H 2
where ρ ¯ and ρ s are local mixture density and the soot density ( 1800   kg · m 3 ), N A is the Avogadro number, R is the gas constant, T is the local temperature of the mixture, and C C 2 H 2 and X C 2 H 2 are mole concentration and mole fraction of acetylene, respectively. The C m term is defined as the minimum number of carbon atoms in the soot nucleus, which is proportional to the pre-defined nucleus size. As suggested in the literature, the value of C m is defined as 700 in the Leung approach representing soot nucleus with size of about 2.4 nm, and 2.9 × 10 5 in the Fairweather approach corresponding to soot nucleus with size of about 18 nm [27,40].
The source term of k th moments due to particle inception can subsequently be evaluated as:
S ¯ k p i L ε k k + 1 J ¯
where L ε is the size of nuclei that is set based on the definition of C m value.

2.4.2. Aggregation

As nascent soot particulates proceed to flow downstream, they evolve to form larger soot cluster with fractal structure, due to particle-particle collision that has insufficient time to complete particle merging (i.e., coalescence), and such a mechanism is referred to as aggregation [1]. The rate of aggregation or collision efficiency of two soot particulates with collision radius Rc1 and Rc2 can be expressed with a single expression that interpolates the coagulation process between free molecular, continuum, as well as the transition regimes, as [41]:
β ( R c 1 , R c 2 ) = 4 π ( D 1 + D 2 ) × ( R c 1 + R c 2 ) [ ( R c 1 + R c 2 ) R c 1 + R c 2 + g 1 2 + g 2 2 + 4 ( D 1 + D 2 ) c 1 2 + c 2 2 + R c 1 + R c 2 ] 1
where
c i = 8 k b T ˜ π m i
D i = k b T ˜ 6 π μ R c i ( 5 + 4 K n i + 6 K n i 2 + 18 K n i 3 5 k n i + ( 8 + π ) K n i 2 )
l i = 8 D i π c i
g i = ( 2 R c i + l i ) 1 3 ( 4 R c i 2 + l i 2 ) 3 2   6 R c i l i 2 R c i
With k b the Boltzmann constant, K n the Knudsen number defined as the ratio between the molecular mean free path of gas mixture molecules and mean particle radius, m the soot particle mass, and R c the collision radius. It is worth noting that, rather than adopting the diameter of soot particles, the collision radius R c is a characteristic value that resembles the radius of gyration, and it is used to represent the characteristic dimension used to determine collision efficiency. The collision radius R c is evaluated based on [26]:
R c = D 0 2 ( V V 0 ) 1 D f  
where D 0 and V 0 are diameter and volume of a representative soot primary particle, V is the volume of the soot aggregate, and D f is the fractal dimension, a morphological property that describes the compactness of a fractal object such as soot particulates.
The source term of k th moments due to aggregation can subsequently be formulated as:
S ¯ k A g 1 2 α = 1 N γ = 1 N ( L α 3 + L γ 3 ) k 3 β α γ ω α ω γ α = 1 N γ = 1 N L α k β α γ ω α ω γ

2.4.3. Molecular Growth

The mass and size of soot particulates can be increased via chemical and physical surface reactions and processes, for example, the hydrogen abstraction carbon addition based surface growth reaction and the condensation of precursor species onto the particle surfaces. Additionally, they could be decreased as the soot is consumed by the oxidation reactions with O 2 molecules and OH radicals attacking soot clusters as they enter the soot-oxidation zone [2].
In practical soot modelling, as an alternative to the abovementioned complex surface reactions, a simplified reaction model, based on the use of BSUs, i.e., acetylene, to link the gas-phase chemistry to the continuous size change [42], is used to formulate the reaction rate of surface growth G s g , as:
G s g =   6 D f ρ s ( R c R c 0 ) 3 D f 3 2 M s × 6 exp ( 6038 T ) C C 2 H 2
where R c is the collision radius, the subscript “ 0 ” indicates the primary particle, thus the collision radius of a monomer will be equivalent to its radius, and M s is the soot molecular weight (12 g·mol−1). It should be noted that the term 6 D f ρ s ( R c R c 0 ) 3 D f 3 is referred to as the soot surface area coefficient that is dependent on the size, as well as the fractal property of the soot aggregates [26,40].
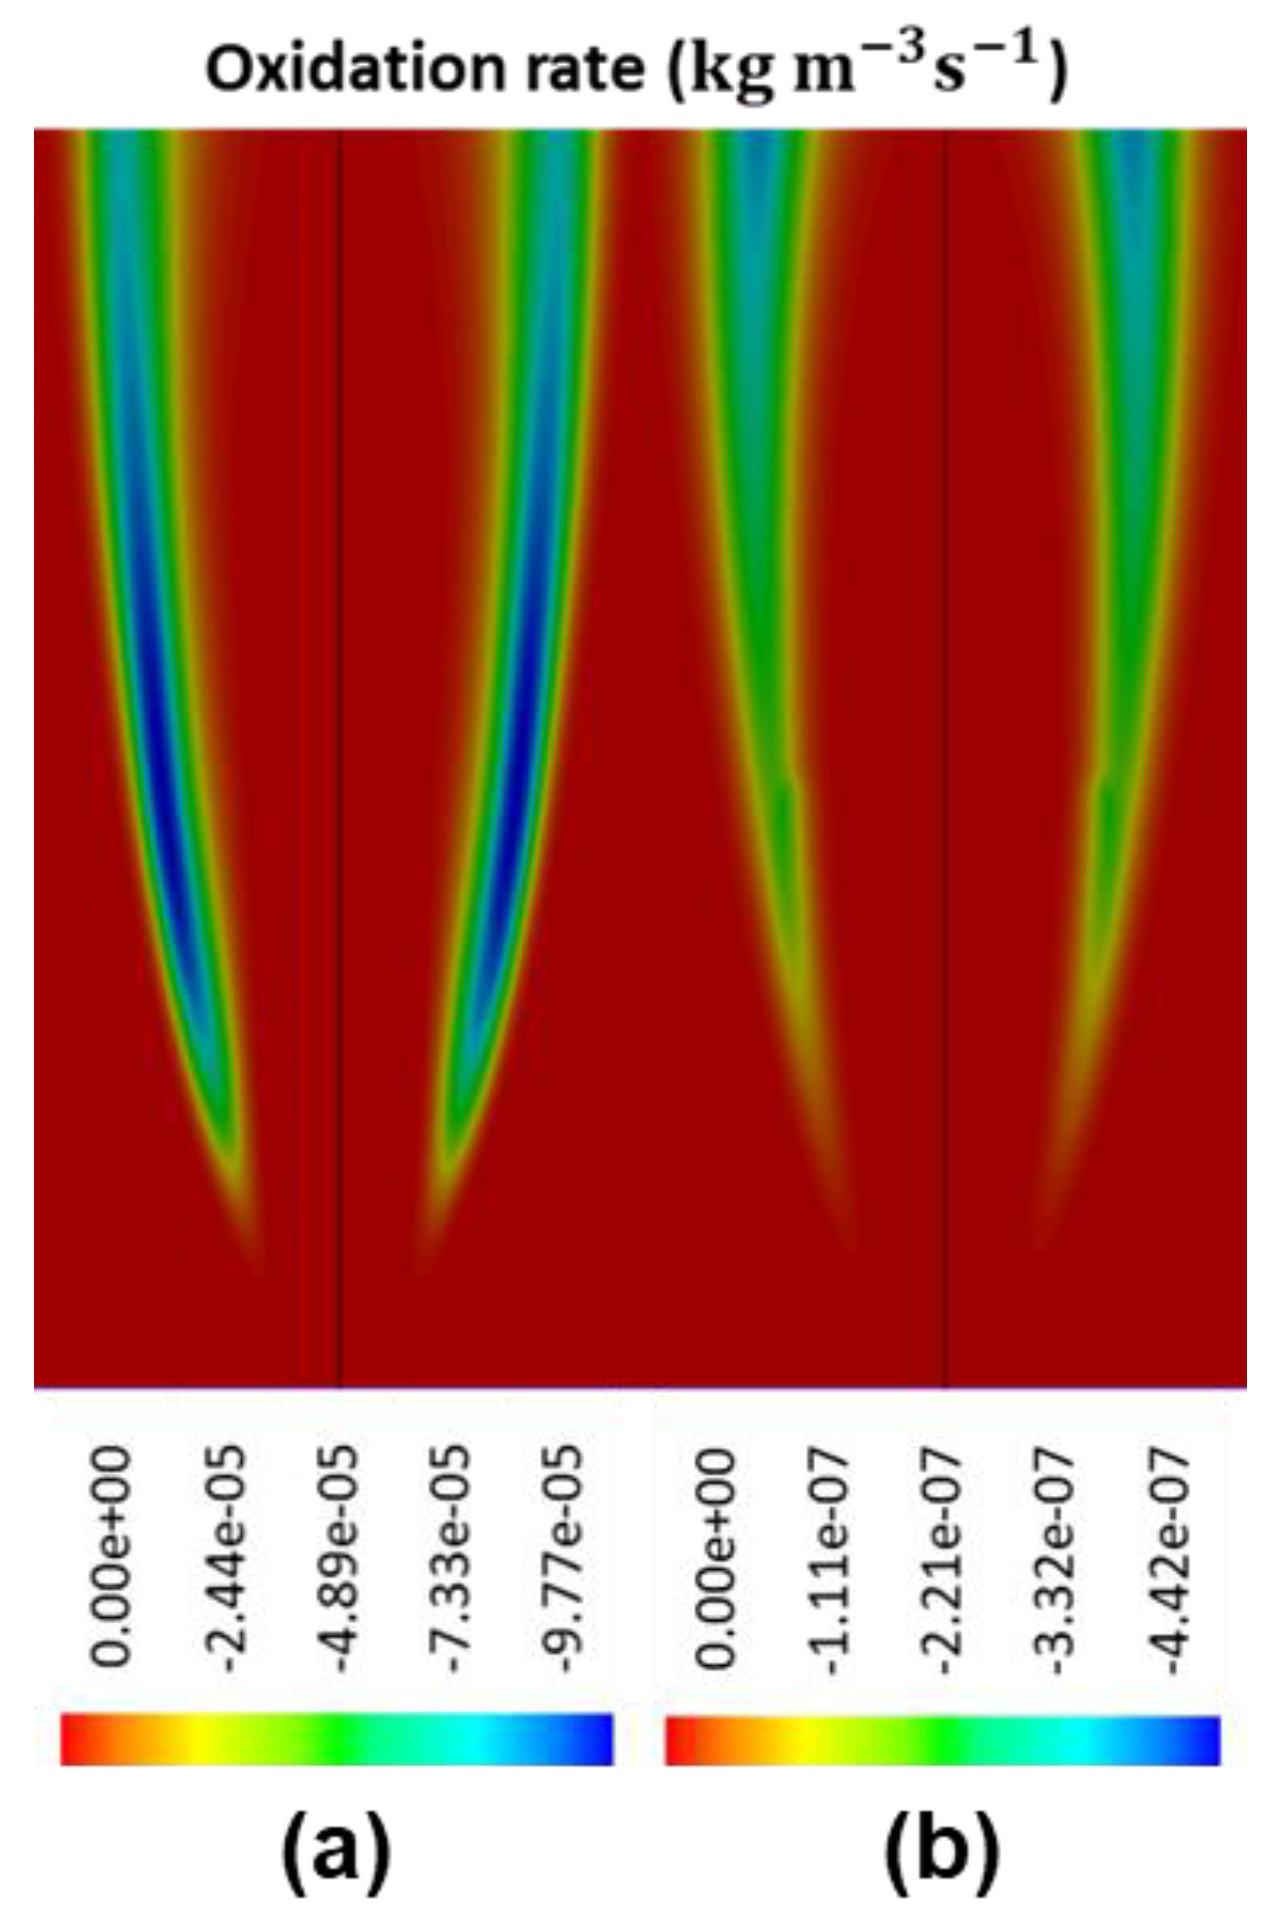
The oxidation process could also be simulated based on the concentration of reacting species and ambient conditions. Two oxidation approaches that have been widely accepted in a commercial package and research code, namely the Said approach [43] and modified NSC approach [20,27], have been investigated in this work. The reaction rate determined based on the two approaches can be expressed as:
G S a i d o x = p D f ρ s T 1 2 6.5 exp ( 26500 T ) Y O 2
and
G N S C o x = ( r M s 6 D f ρ s ( R c R c 0 ) 3 D f 3 )  
r = 120 [ k A X O 2 χ 1 + k Z X O 2 + k B X O 2 ( 1 χ ) ] f O 2
χ = ( 1 + k T k B X O 2 ) 1
where Y O 2 and X O 2 are the mass and mole fraction of oxygen and k A ,   k B ,   k T and k Z are rate constants adopted from semi-empirical investigation [20,40]. Herein, a temperature dependent correction factor f O 2 , introduced by Liu et al., which tuned to best match the experimental observation of soot formation in smoking flame [40,44,45], is defined as:
f O 2 = ( 1 + exp ( T 1650 80 ) ) 1
It should be noted that Liu’s correction factor becomes negligible as the local temperature is below 1300   K and it approaches unity when the temperature increases to 2000   K . Therefore, the correction factor also serves as a cut-off function that limits the oxidation reaction to regions with relatively high temperature.
The source terms of k th moments, due to the combined effects of surface growth and oxidation, applying the quadrature approximation, are:
S ¯ k s g + o x k α = 1 N ω α L α k 1 ( G s g + G o x )

2.5. Numerical and Case Configurations

The geometry of the model that is used in the current study replicates a laboratory scaled co-flow diffusion flame generated from an in-house built co-flow slot burner with a centre slot for fuel injection and two side slots for oxidiser supply. Both ethylene and air are injected at 0.07   ms 1 , normal to the burner front through the fuel and oxidiser slots, respectively, and the combustion occurs at atmospheric pressure. It should be noted that, the injection rate of fuel applied in this work is significantly lower than the 50   ms 1 that is used in other numerical studies adopting the DQMOM algorithm [25,26,28]. A computational domain symmetrical with respect to burner centreline, with dimensions of 0.8   m and 1.2   m , is defined and applied with a non-uniform mesh of about 800 , 000 elements. Higher mesh resolution is applied at regions near the axis and close to burner front where both the flow development and intense chemical reaction are expected to take place. The dimension of the domain is set based on the observation of flame shape and the mesh configuration has been verified to ensure that the yield simulation result is independent of grid resolution.
One of the potential challenges of the DQMOM approach is that the system could be ill-conditioned when the weight and abscissas of the defined internal coordinate become null, i.e., raised when considering the regions with no soot particles or particulates with infinitely small particle size, which leads to a singular or near-singular condition when solving the linear system (Equations (9)–(12)). This ill-conditioned system could result in either the linear system being unable solve or solved with large numerical error. The issue can be resolved by seeding the domain with particles that have a size distribution that is predefined based upon the PD algorithm that was proposed by Gordon et al. [46]. For mono-variate case with N = 2 , the pre-defined particle size L α can be set as L 1 = 0.2113 × L ε and L 2 = 0.7887 × L ε and then applied to regions where the weights are null or abscissas are not defined.
The DQMOM coefficient matrix could also become near singular when the values of any pair of abscissas are equal, or getting too close to each other, resulting in numerical instability and yielding significant numerical error. To tackle the issue, a small perturbation was introduced to the abscissas to ensure non-distinct values of L α in the DQMOM coefficient matrix, as suggested by Marchisio and Fox [24].
Soot radiative heat transfer is taken into consideration by introducing an additional source term into the energy transport equation, which is defined as:
Q r a d = σ a s ( T 4 T r e f 4 )
where σ is the Stefan–Boltzmann constant, T ref is the ambient reference temperature that is defined as 300   K , and the a s is the absorption coefficient expressed as:
a s = 2370 T f v
where f v is the soot volume fraction, as evaluated from the third moment of the NDF.

2.6. Sensitivity Analysis

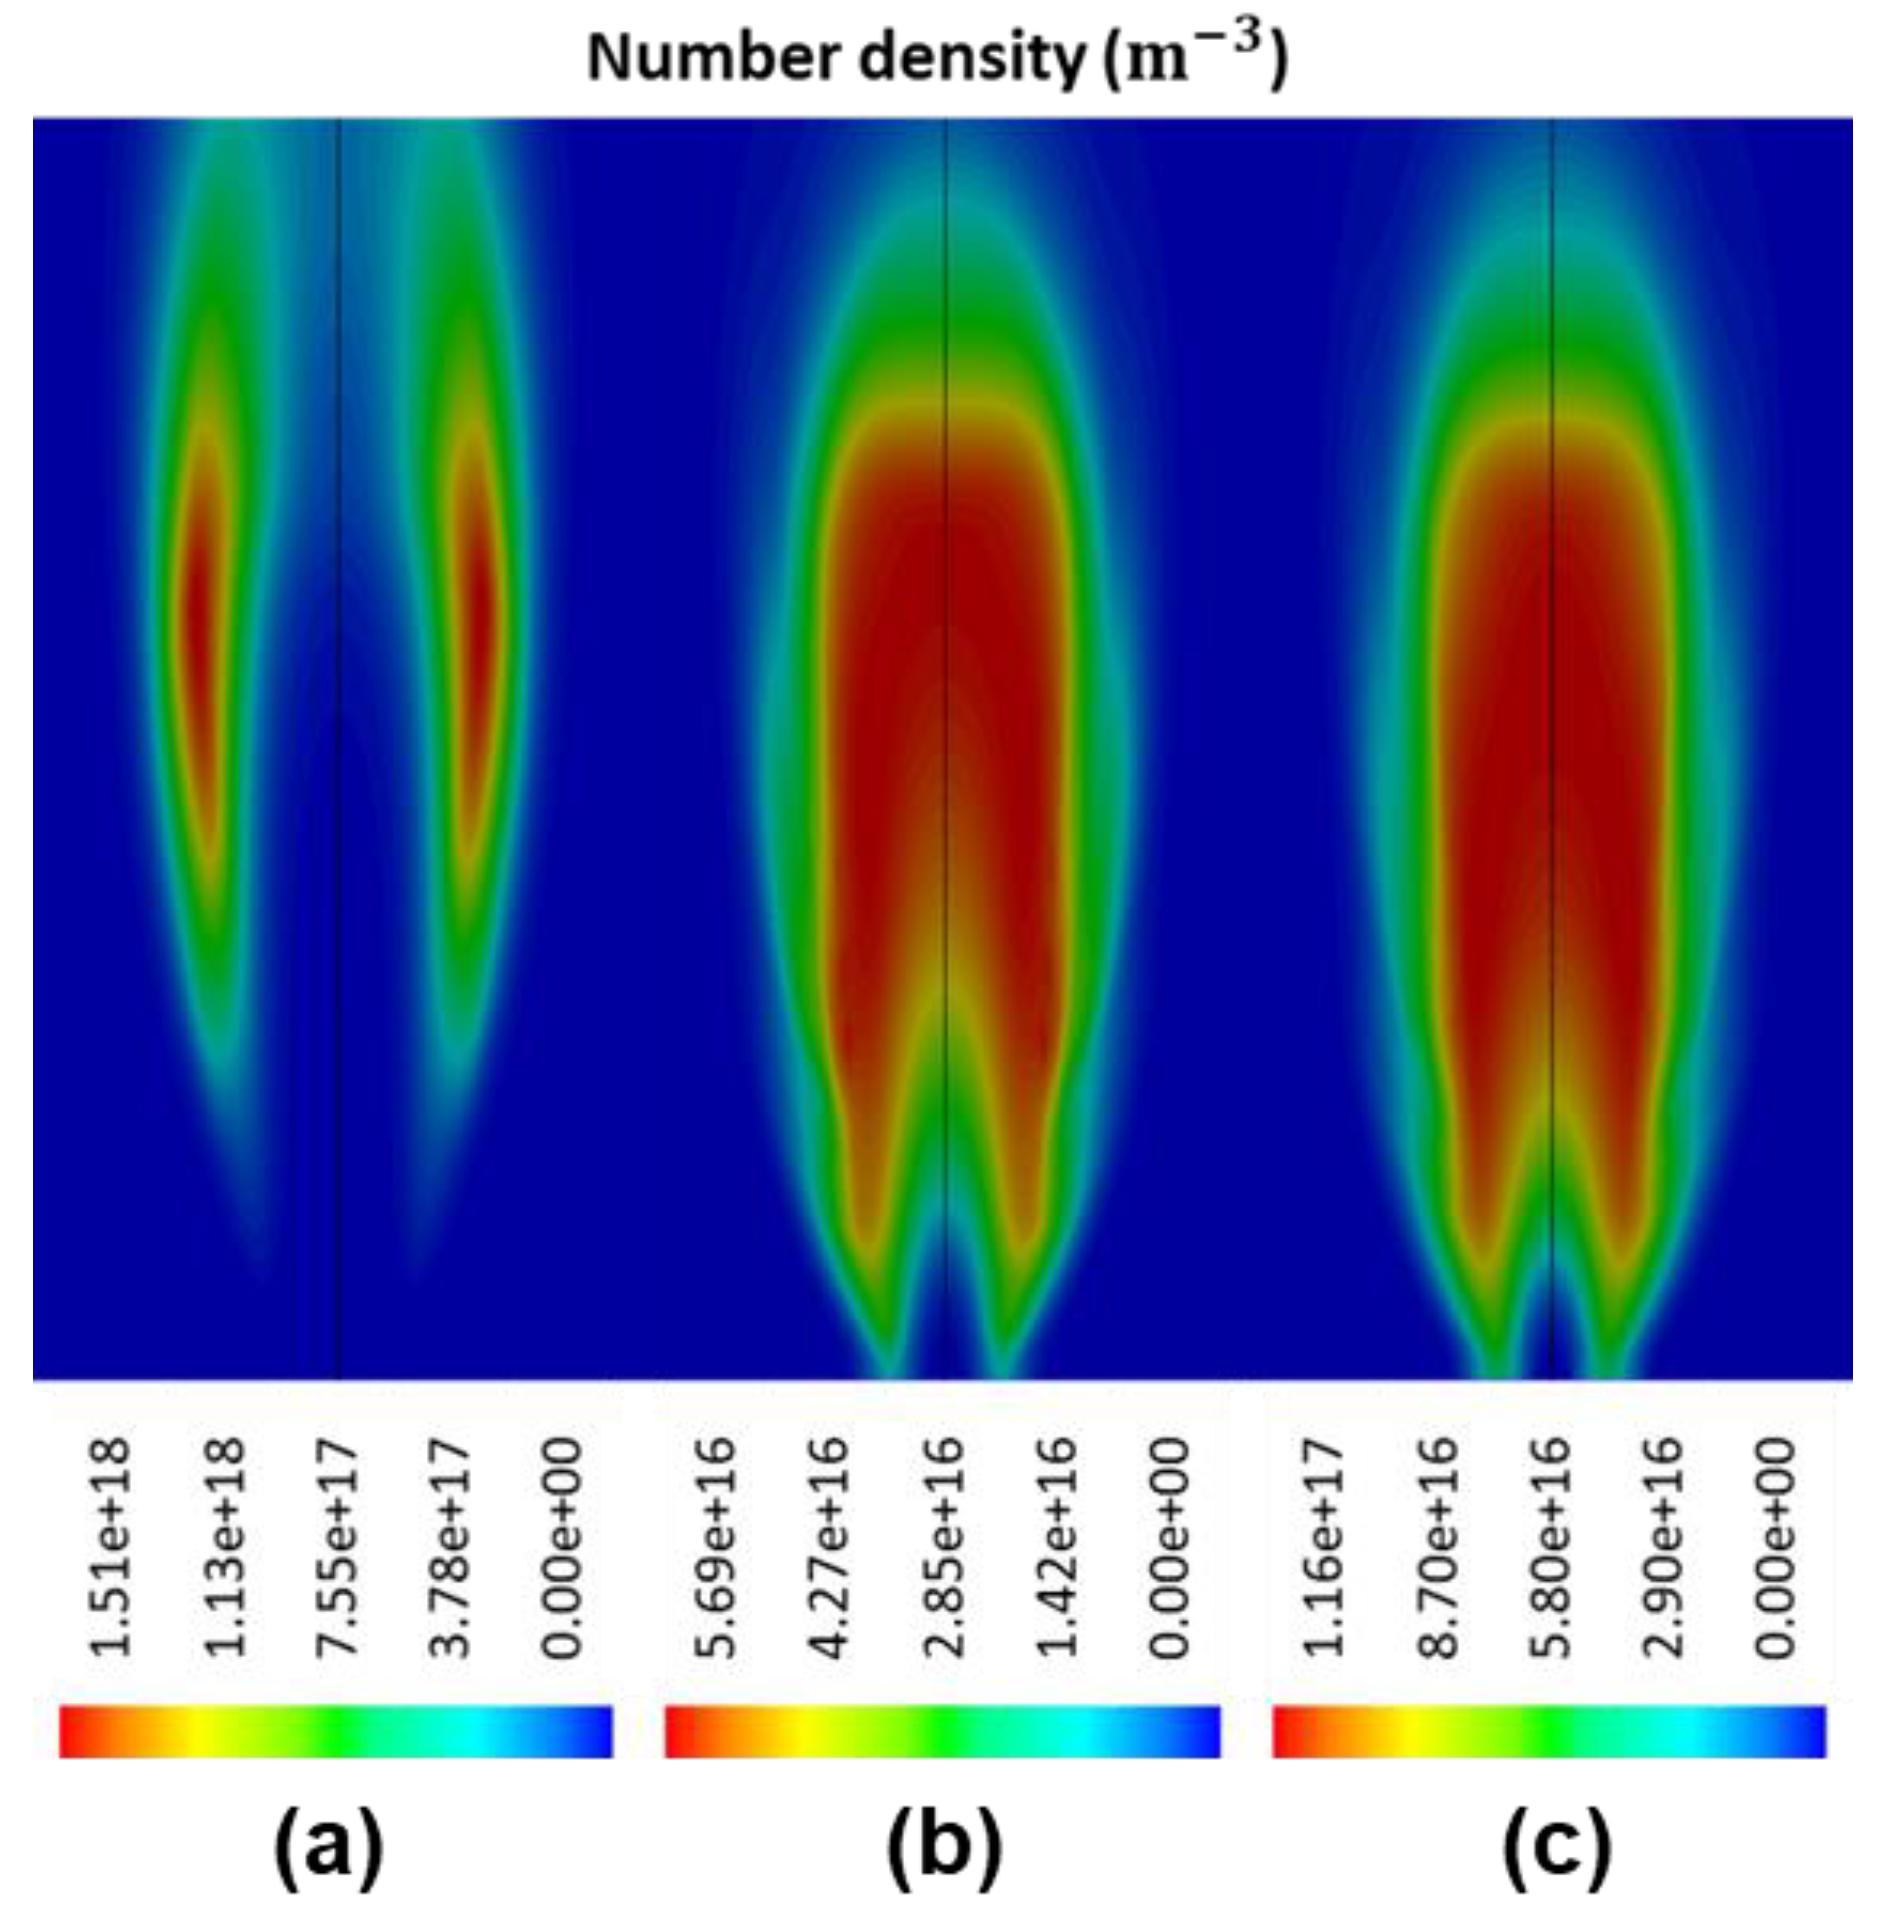
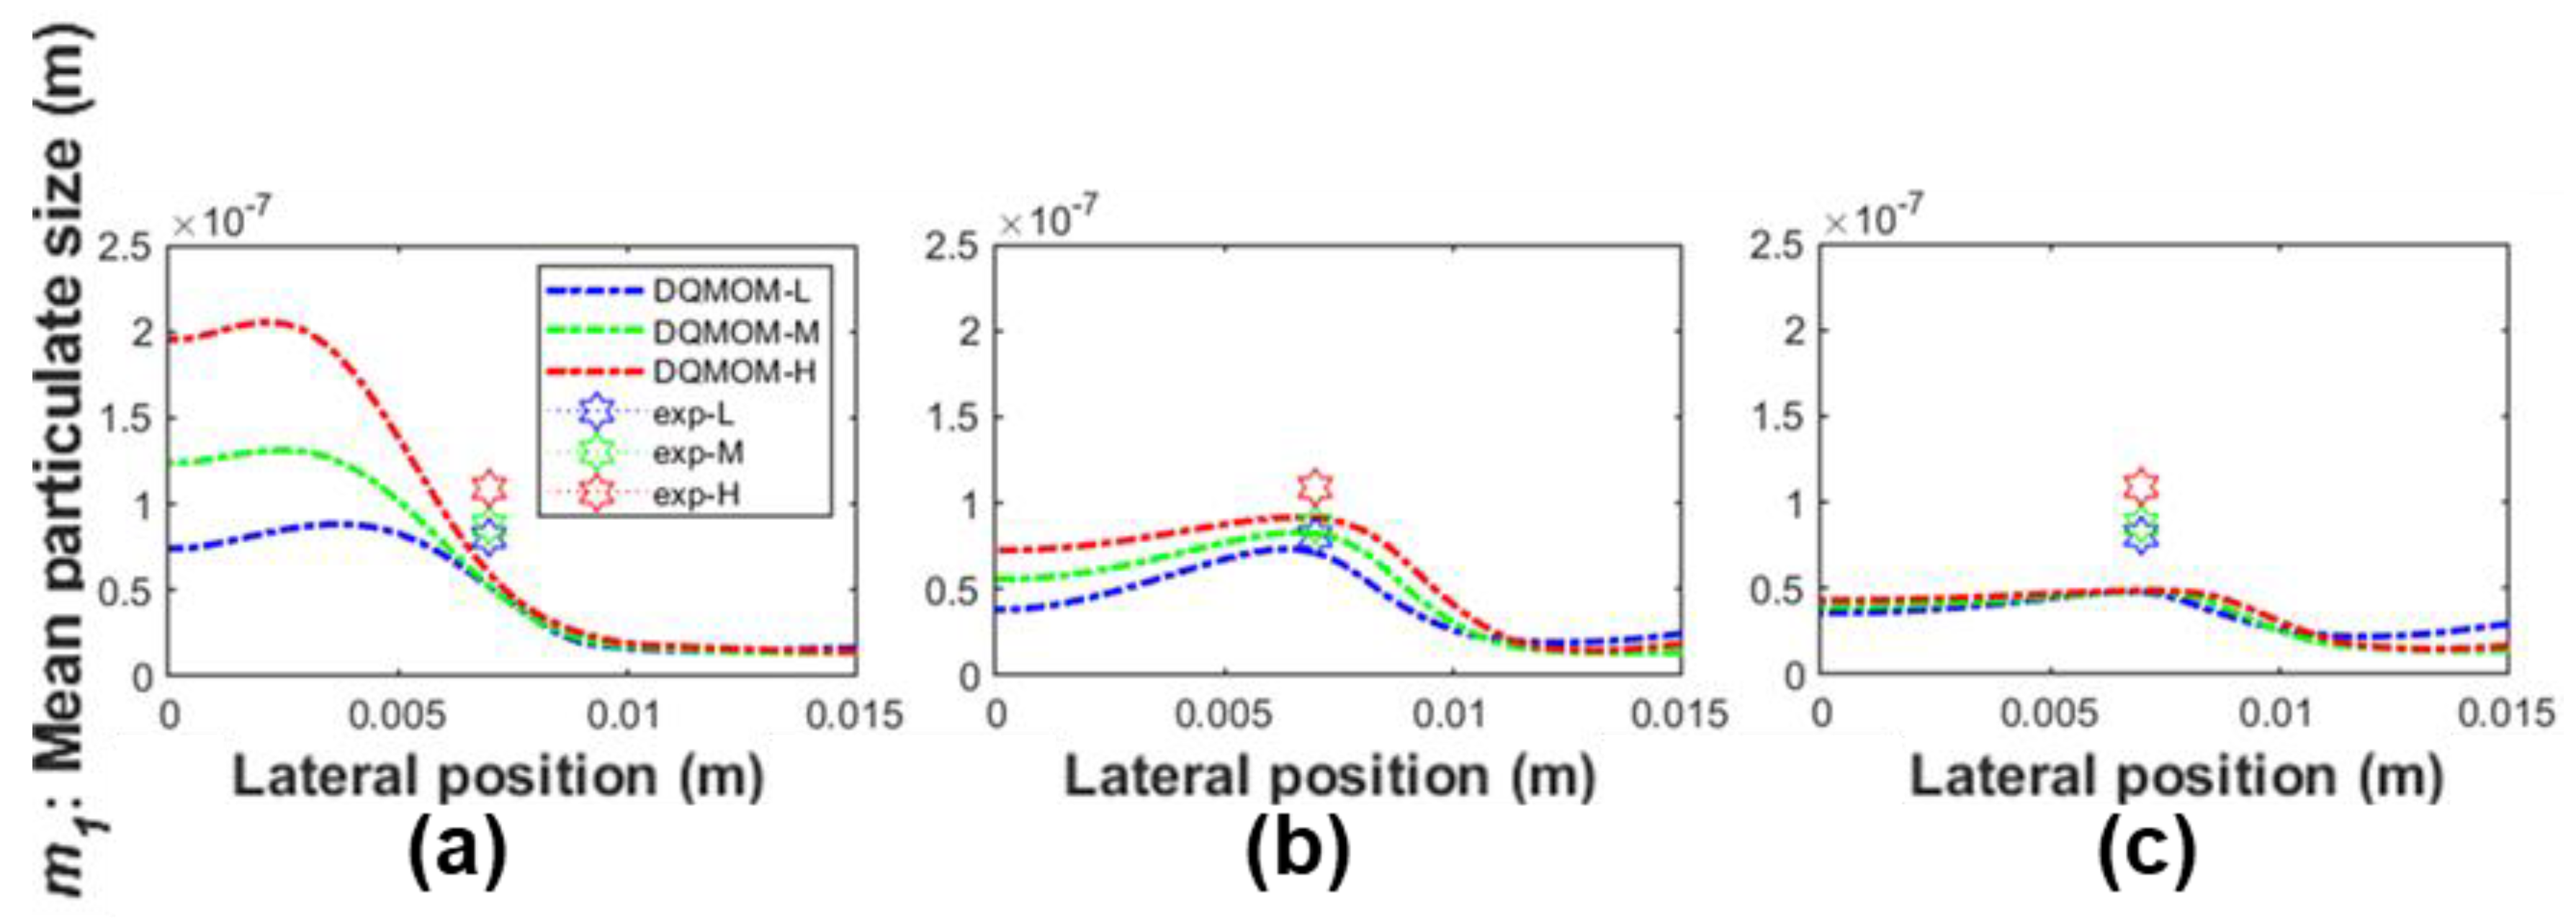
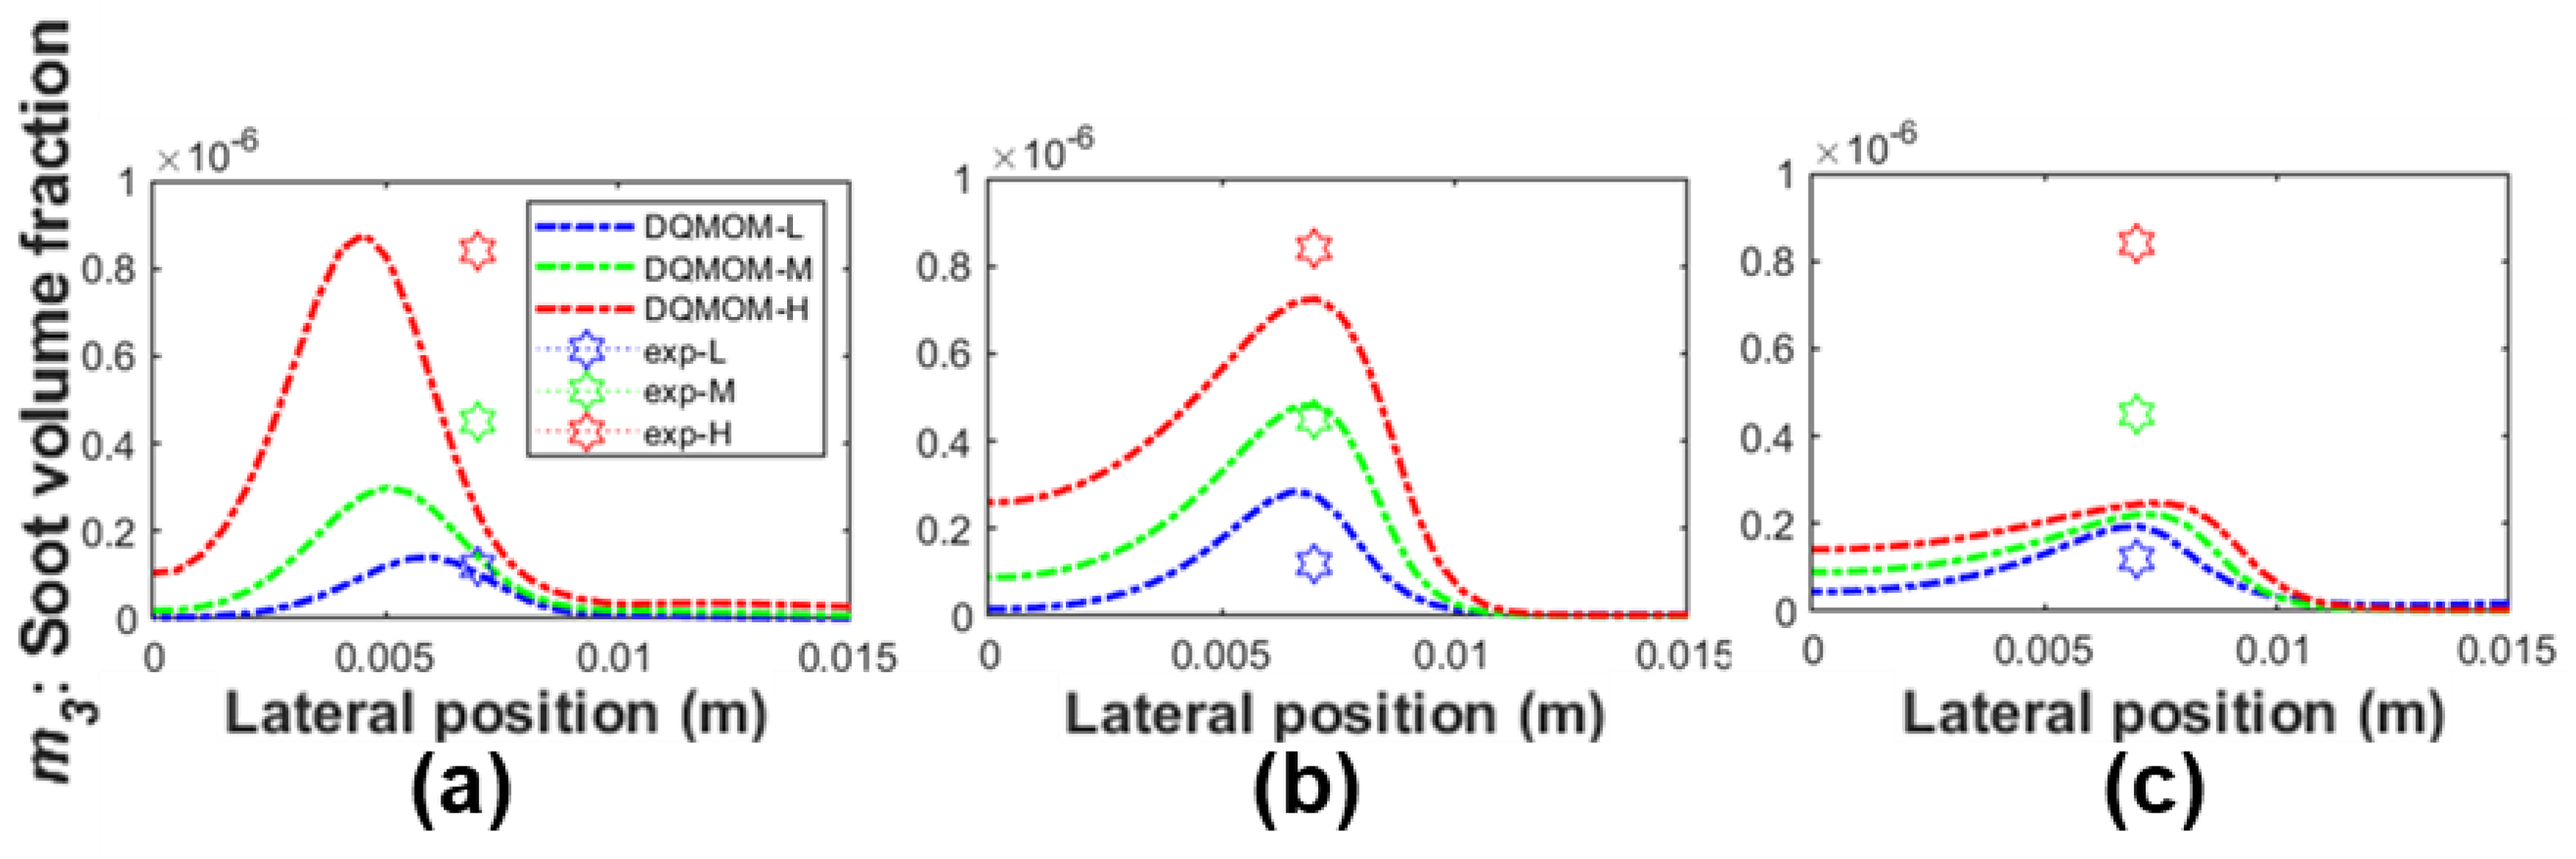
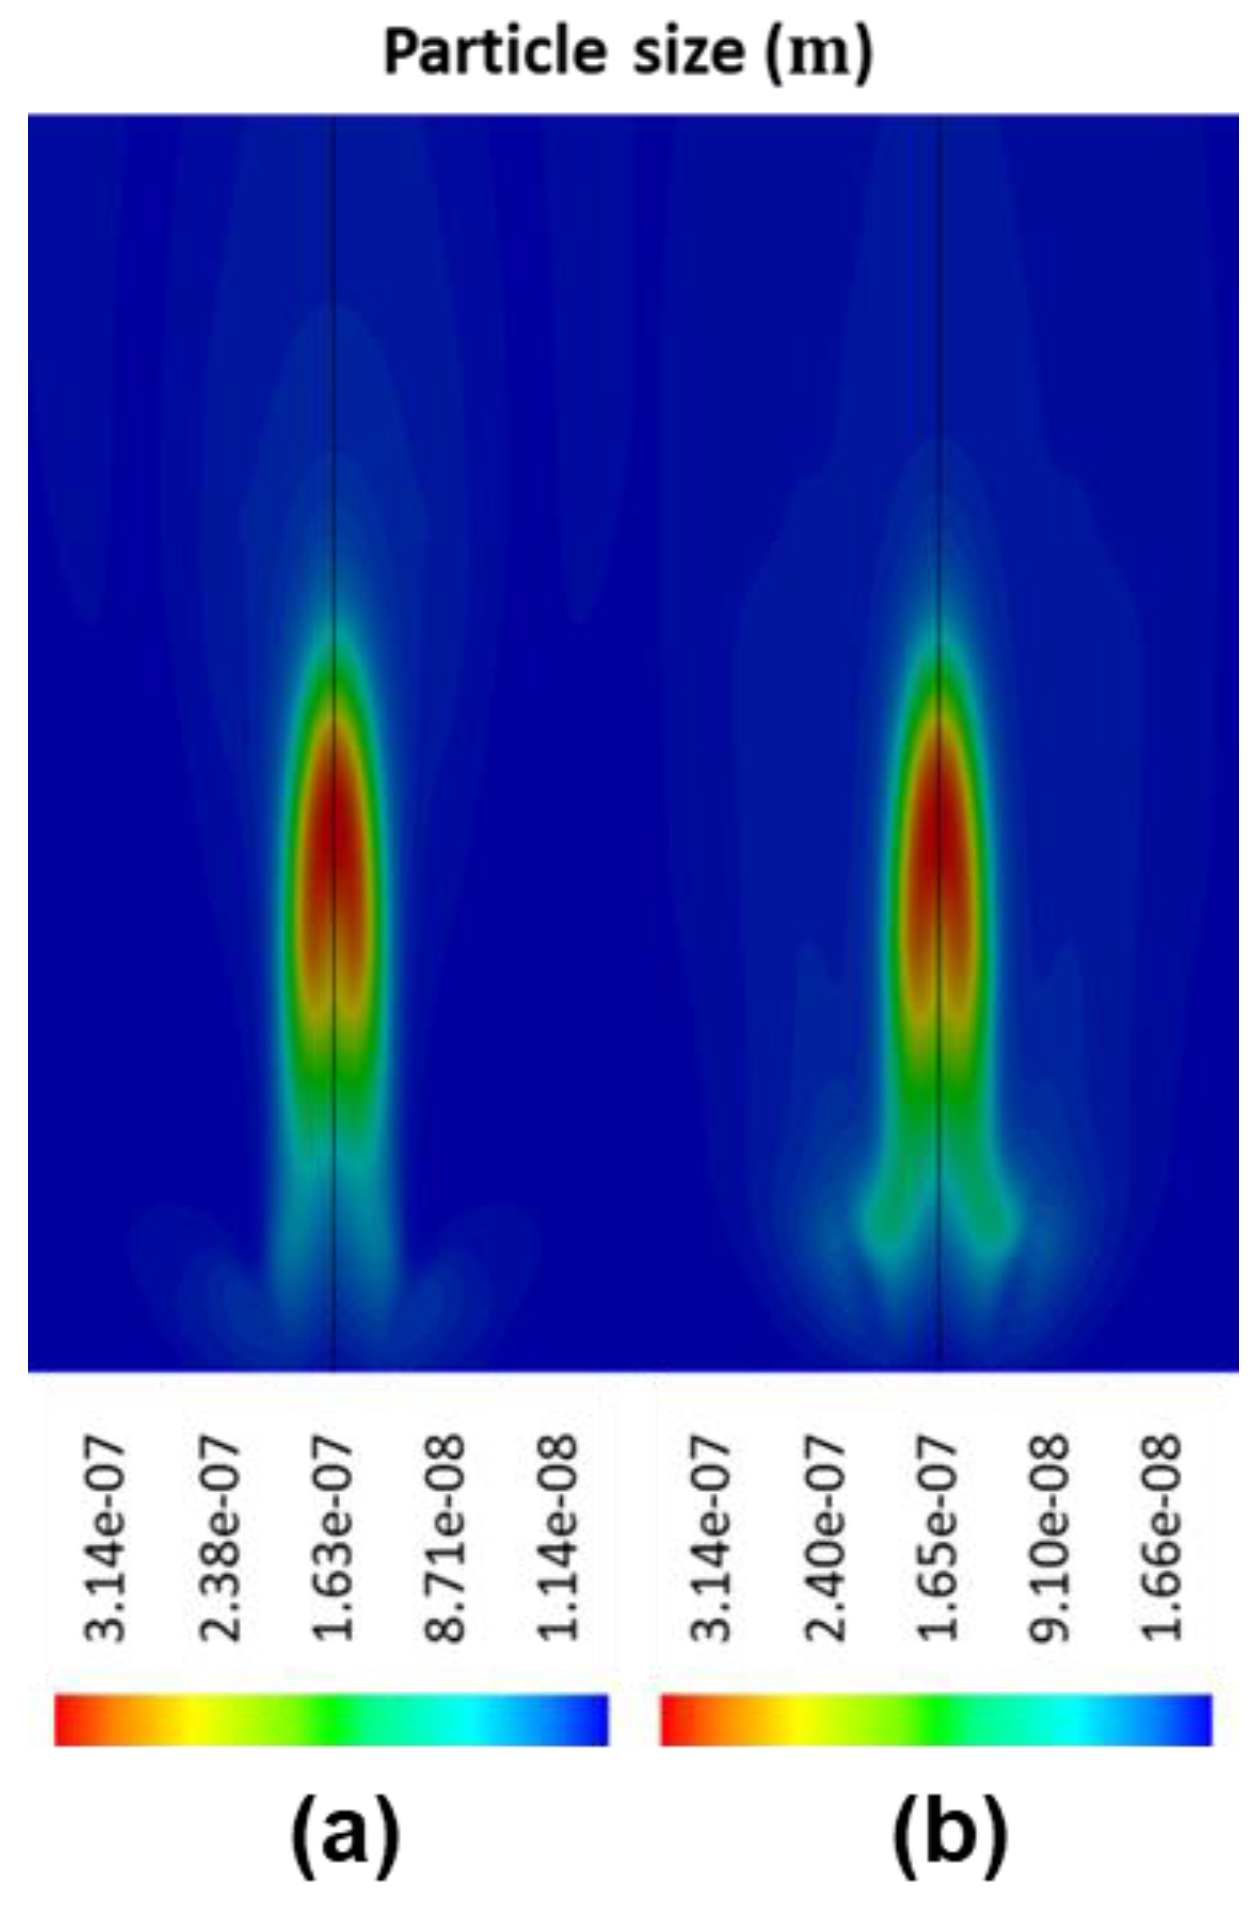
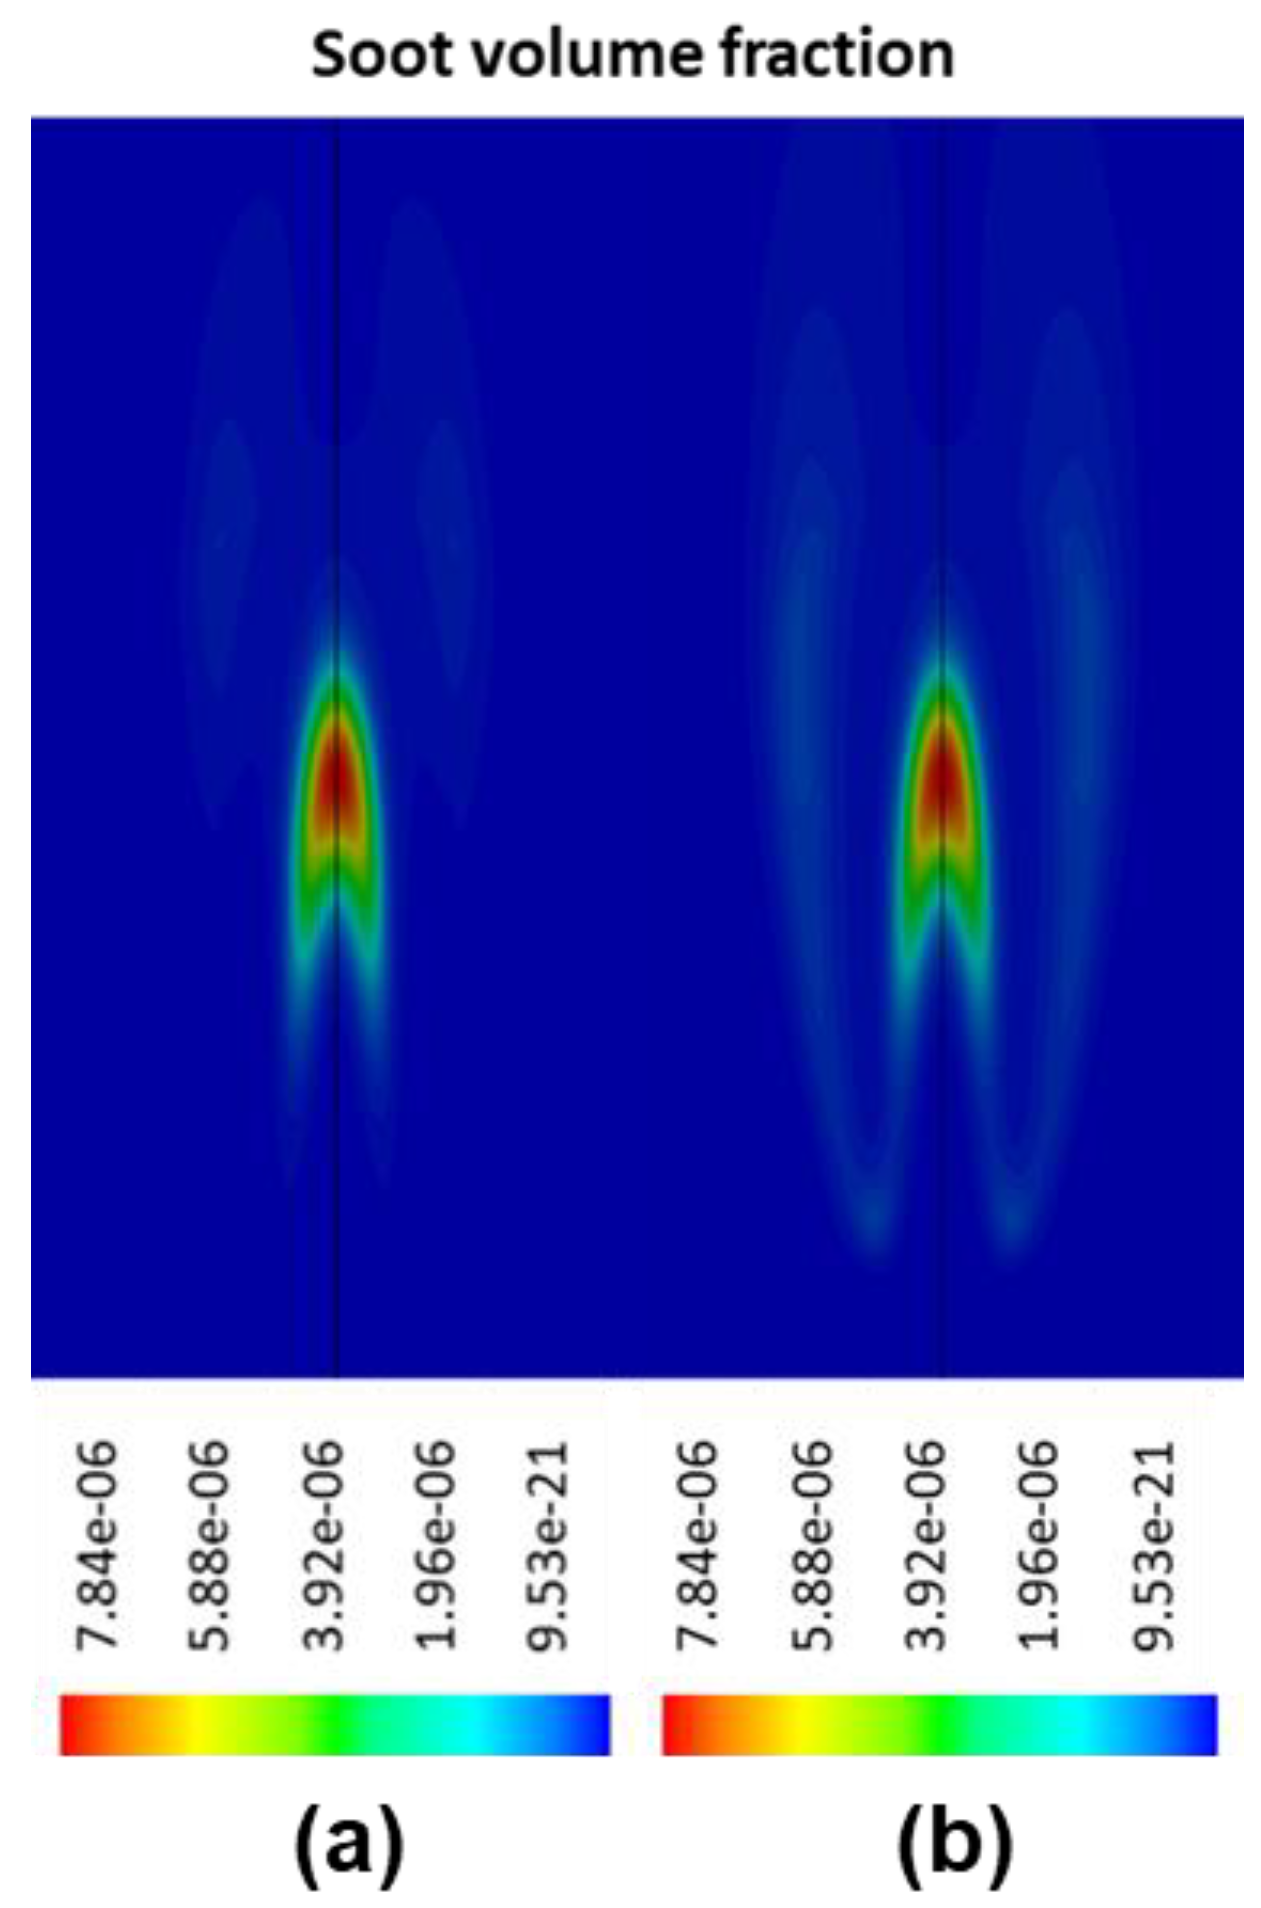
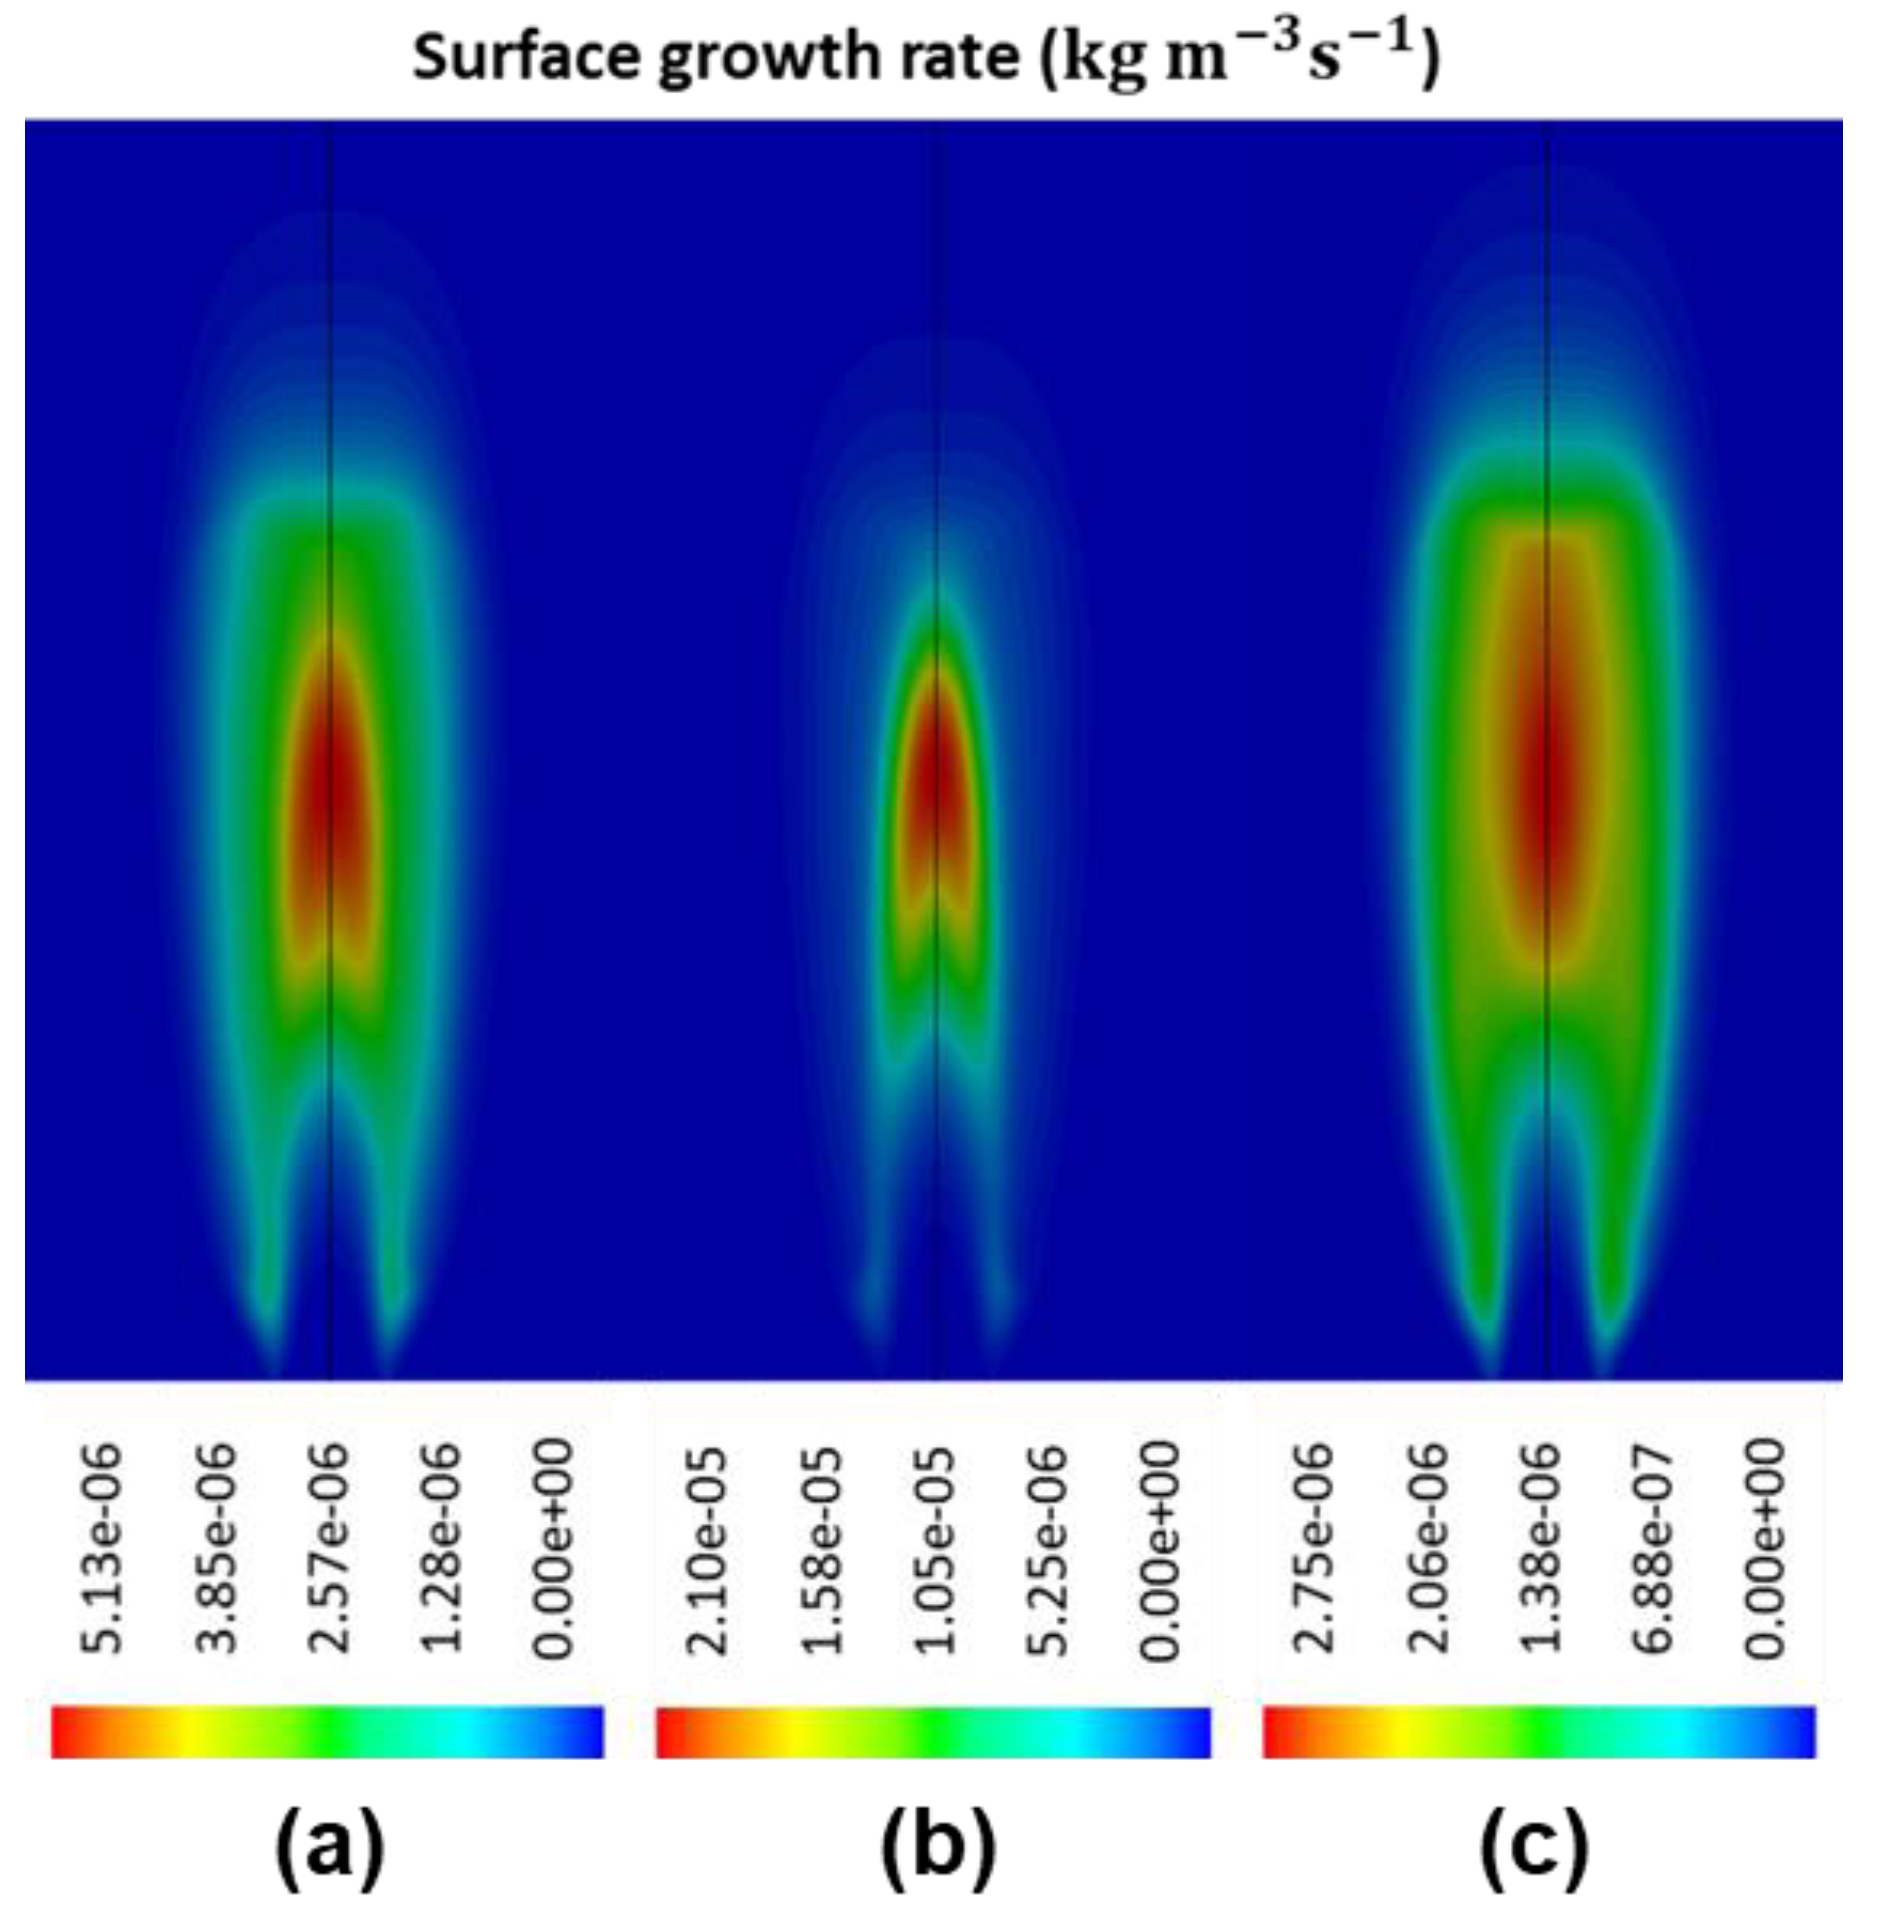
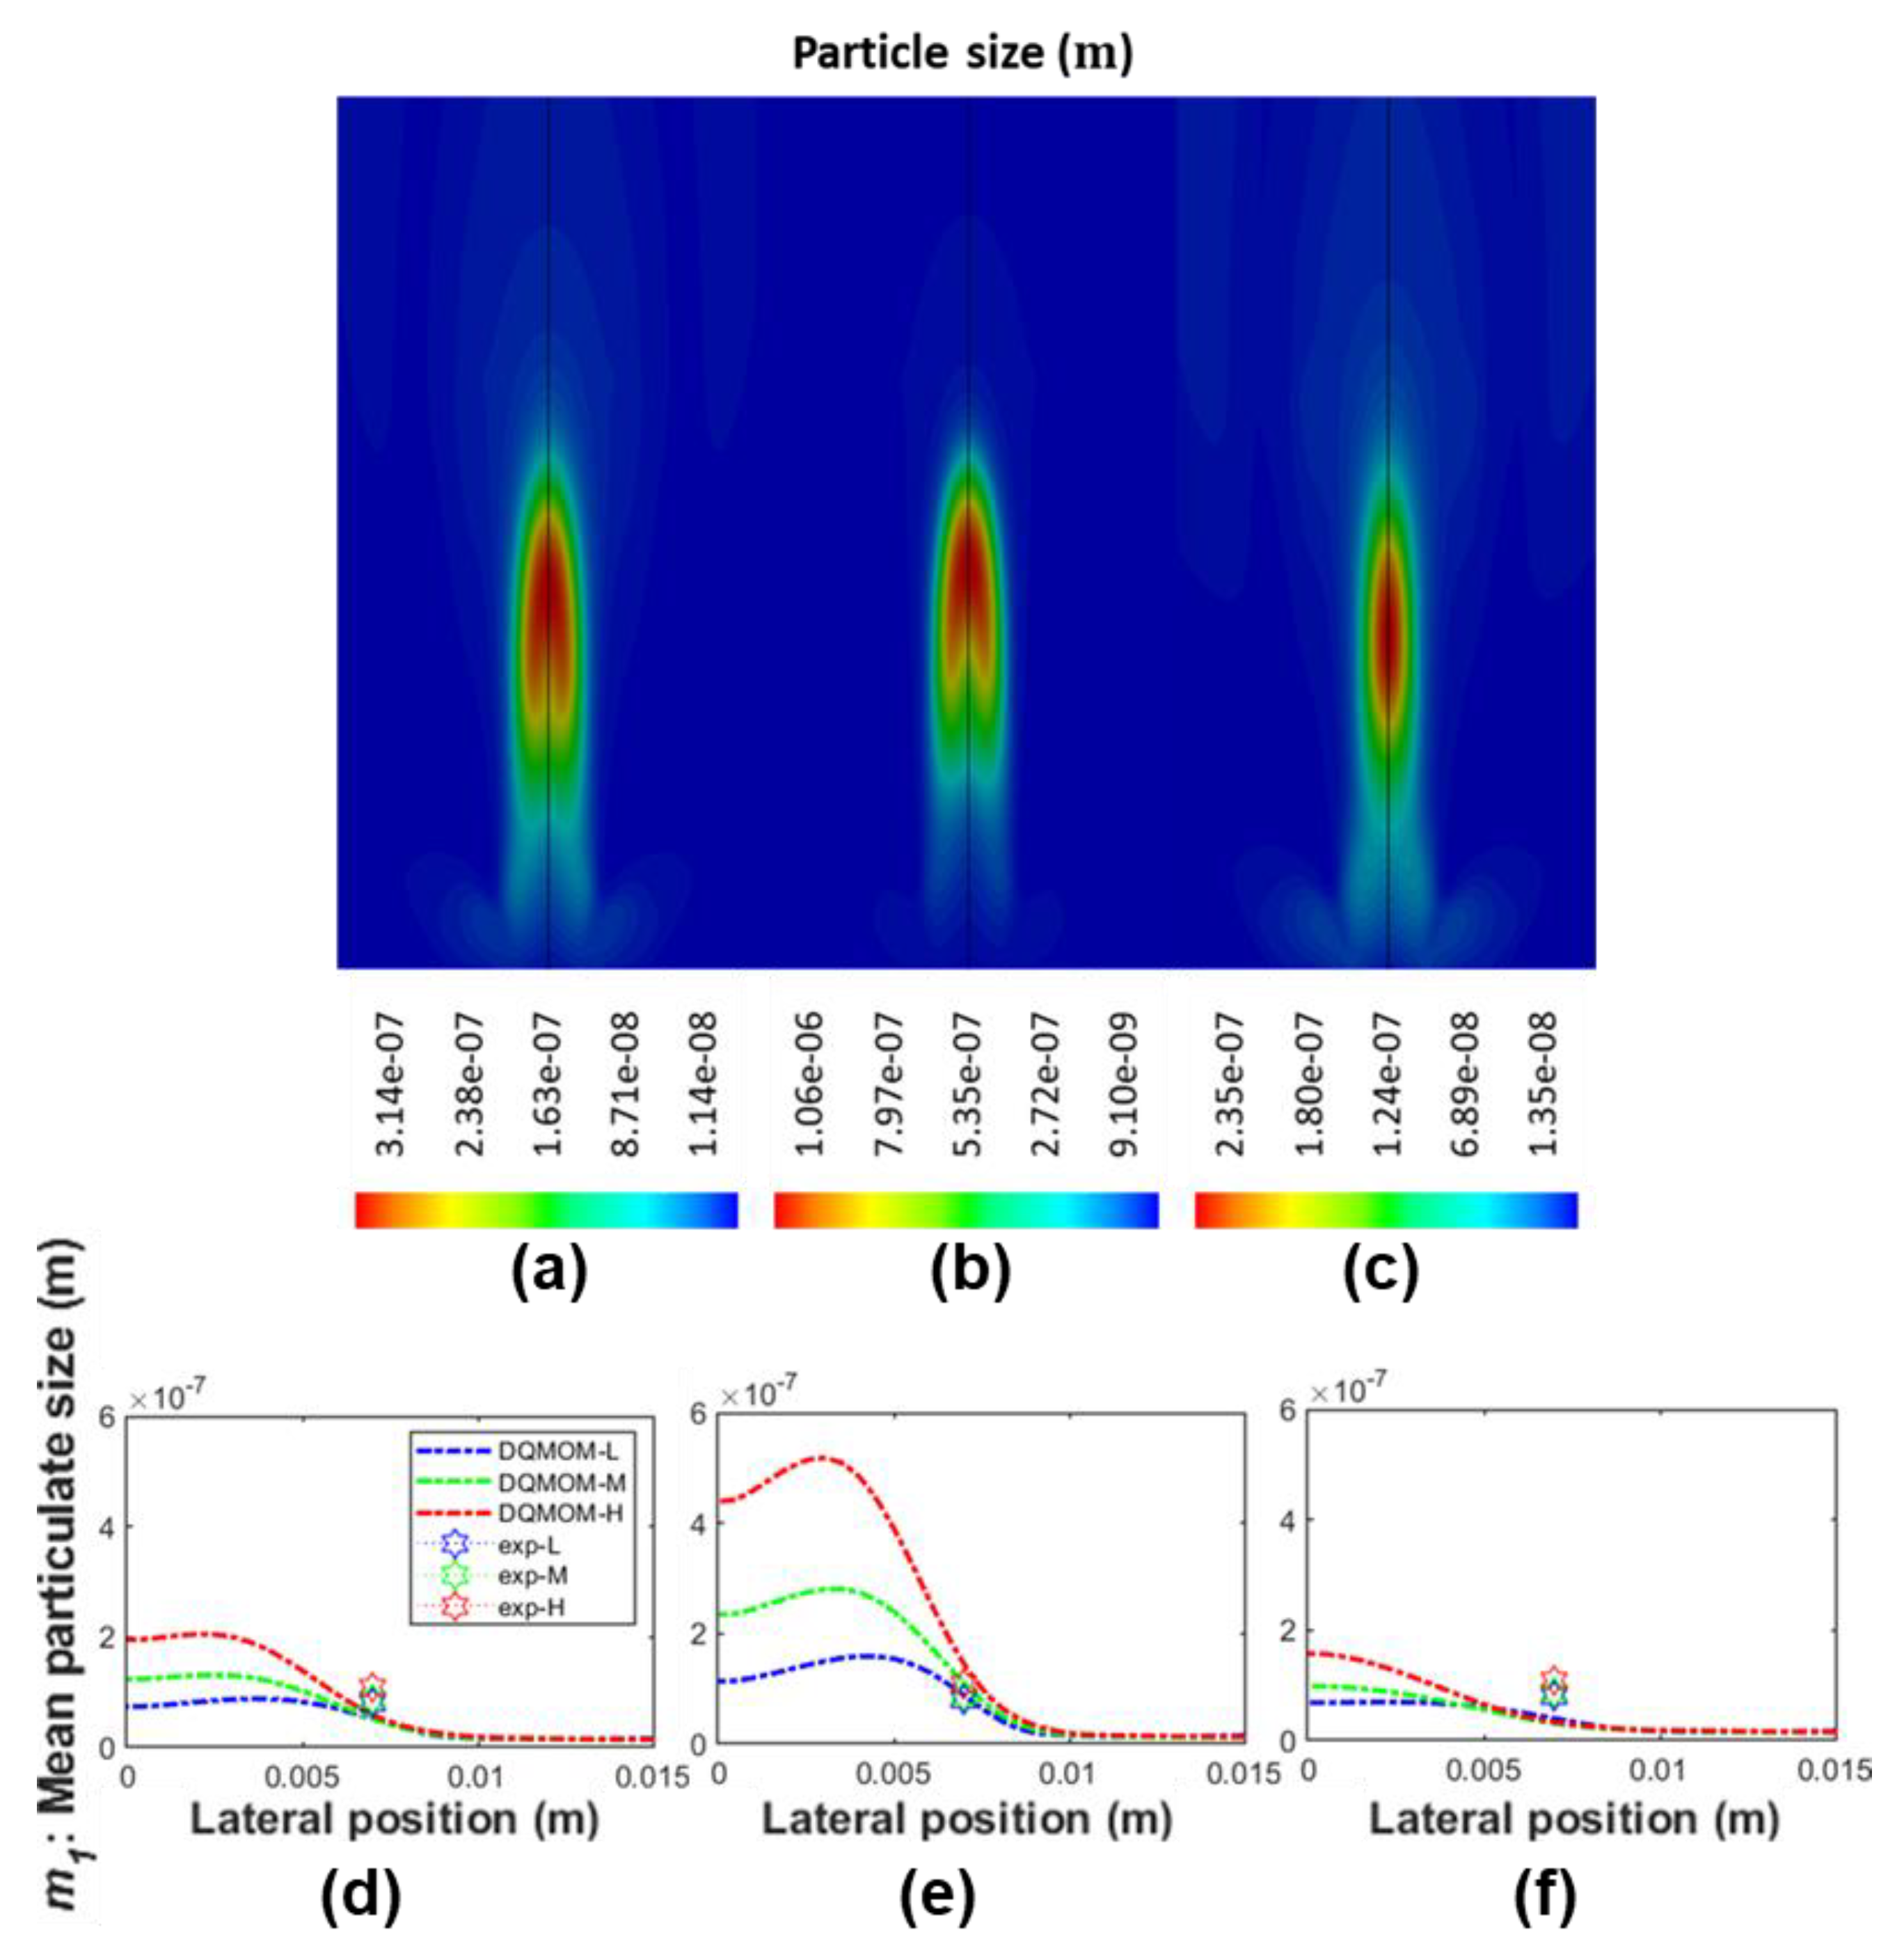
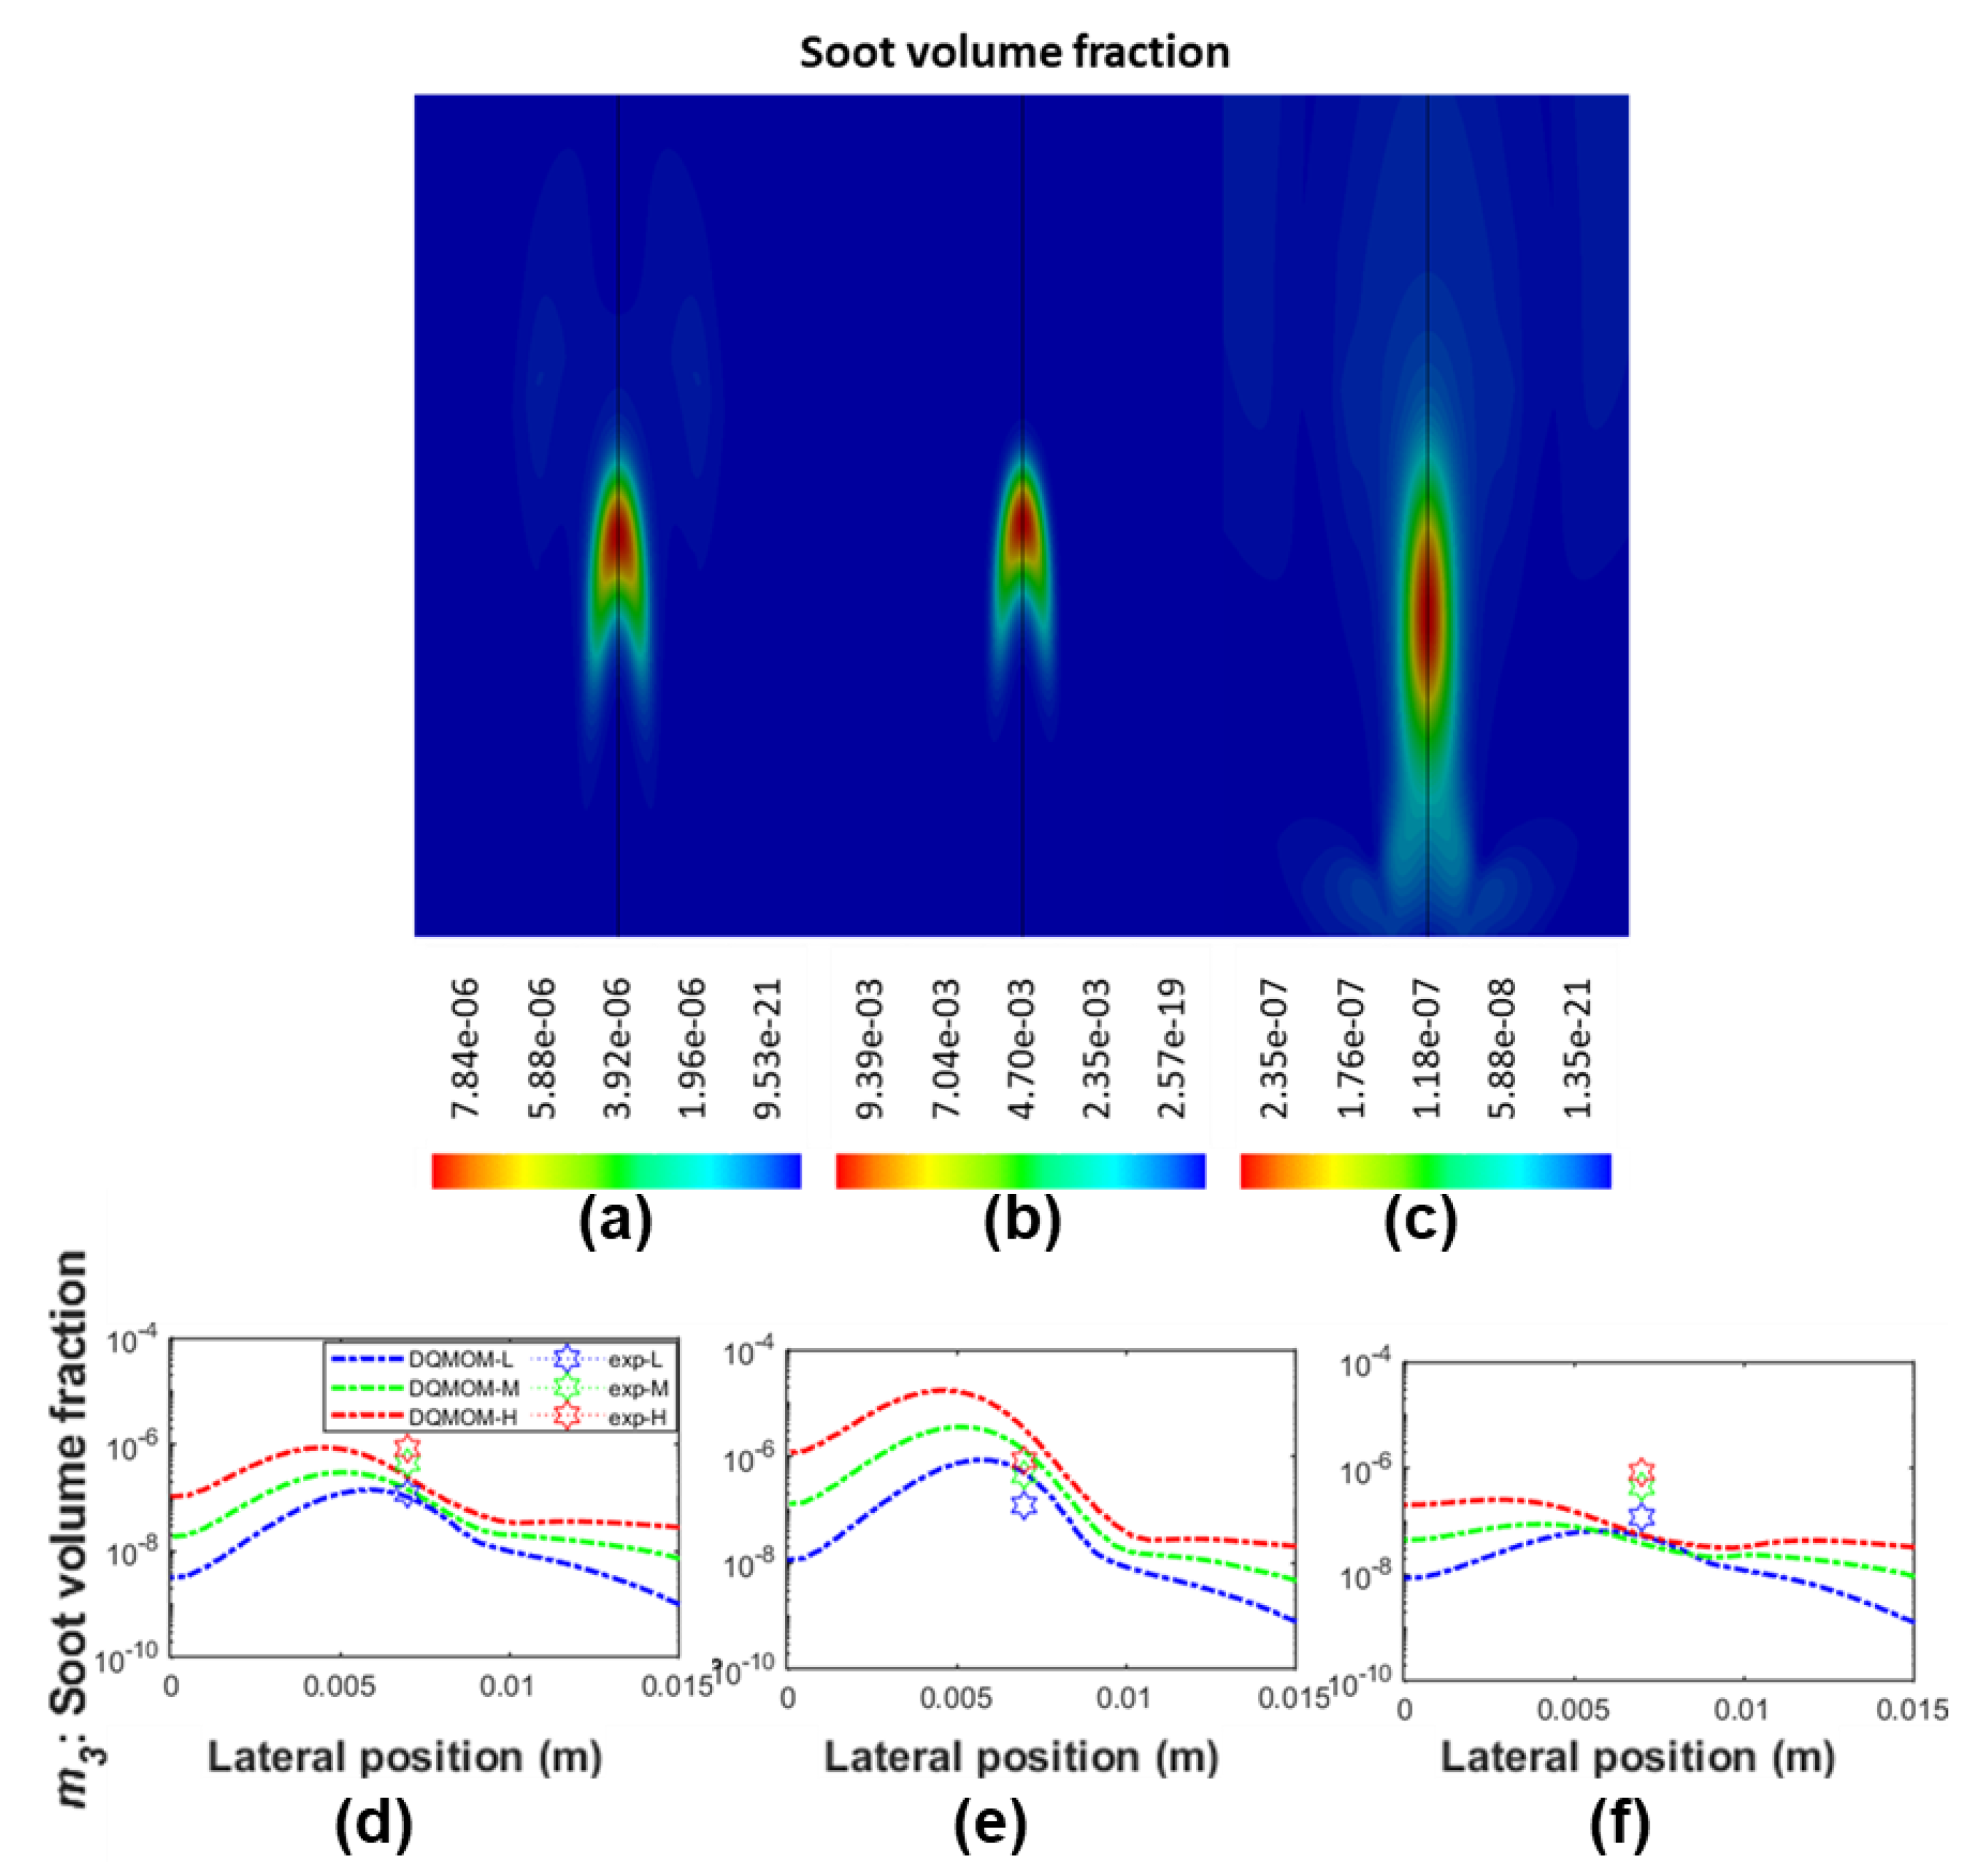
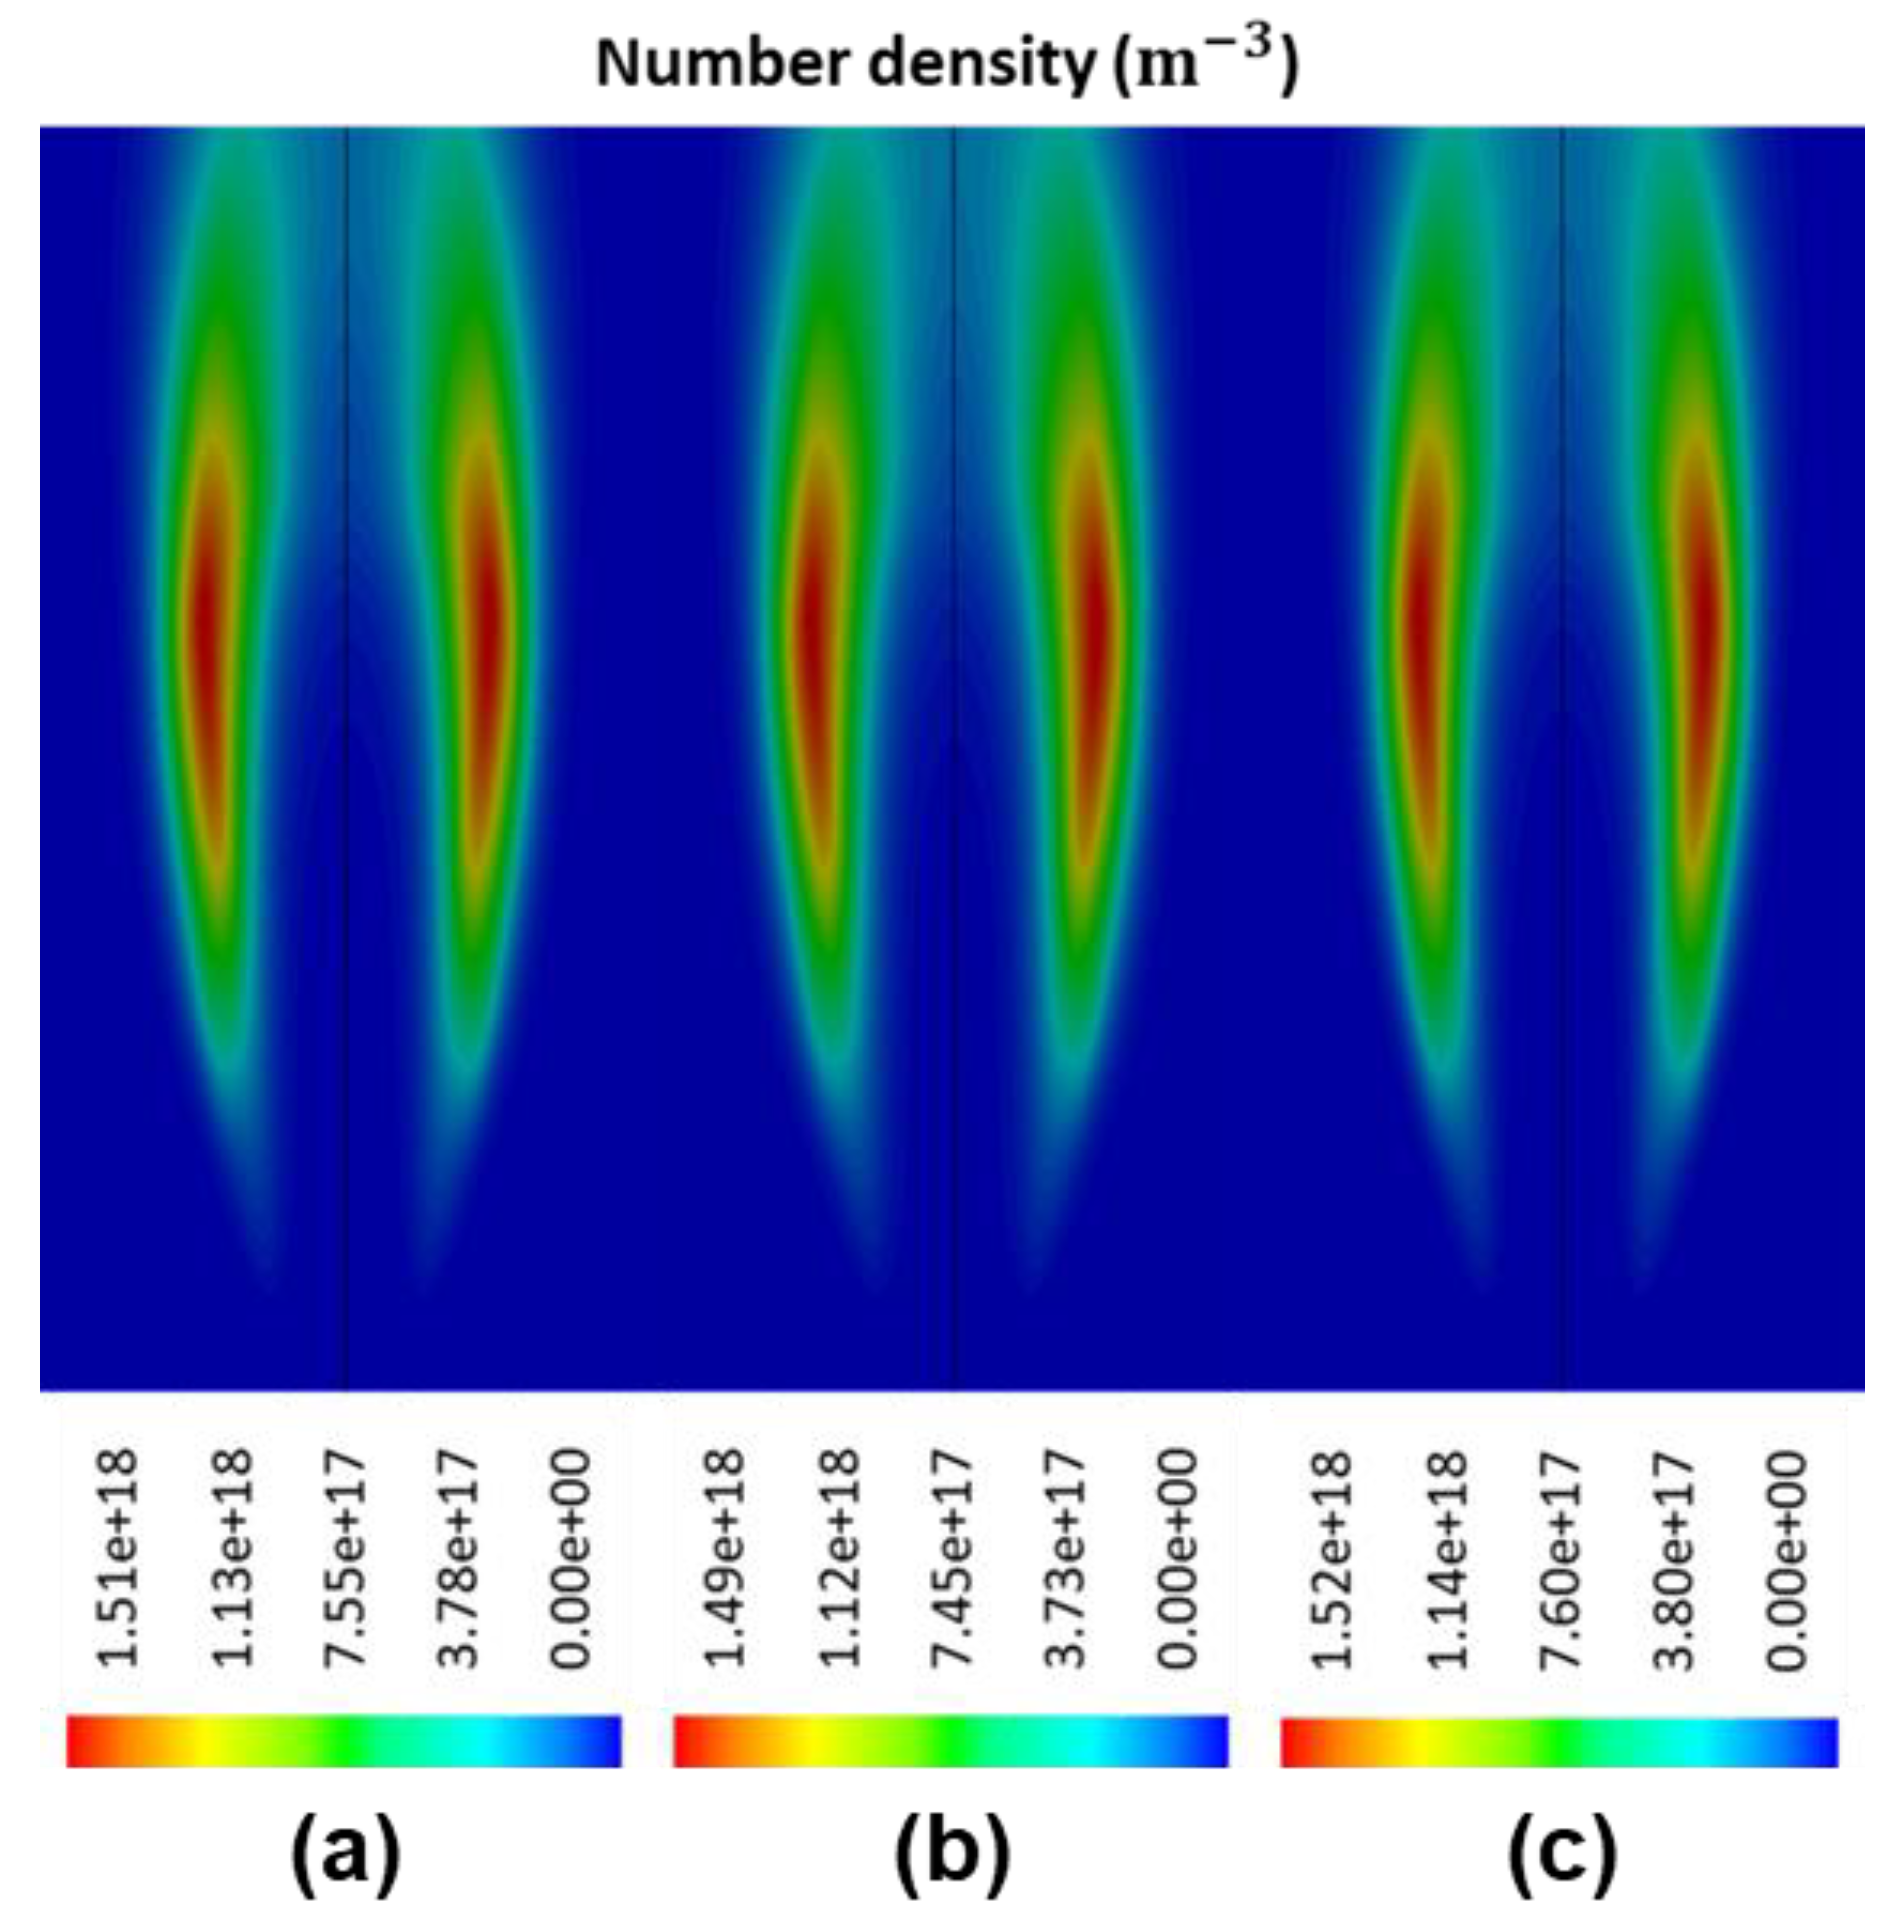
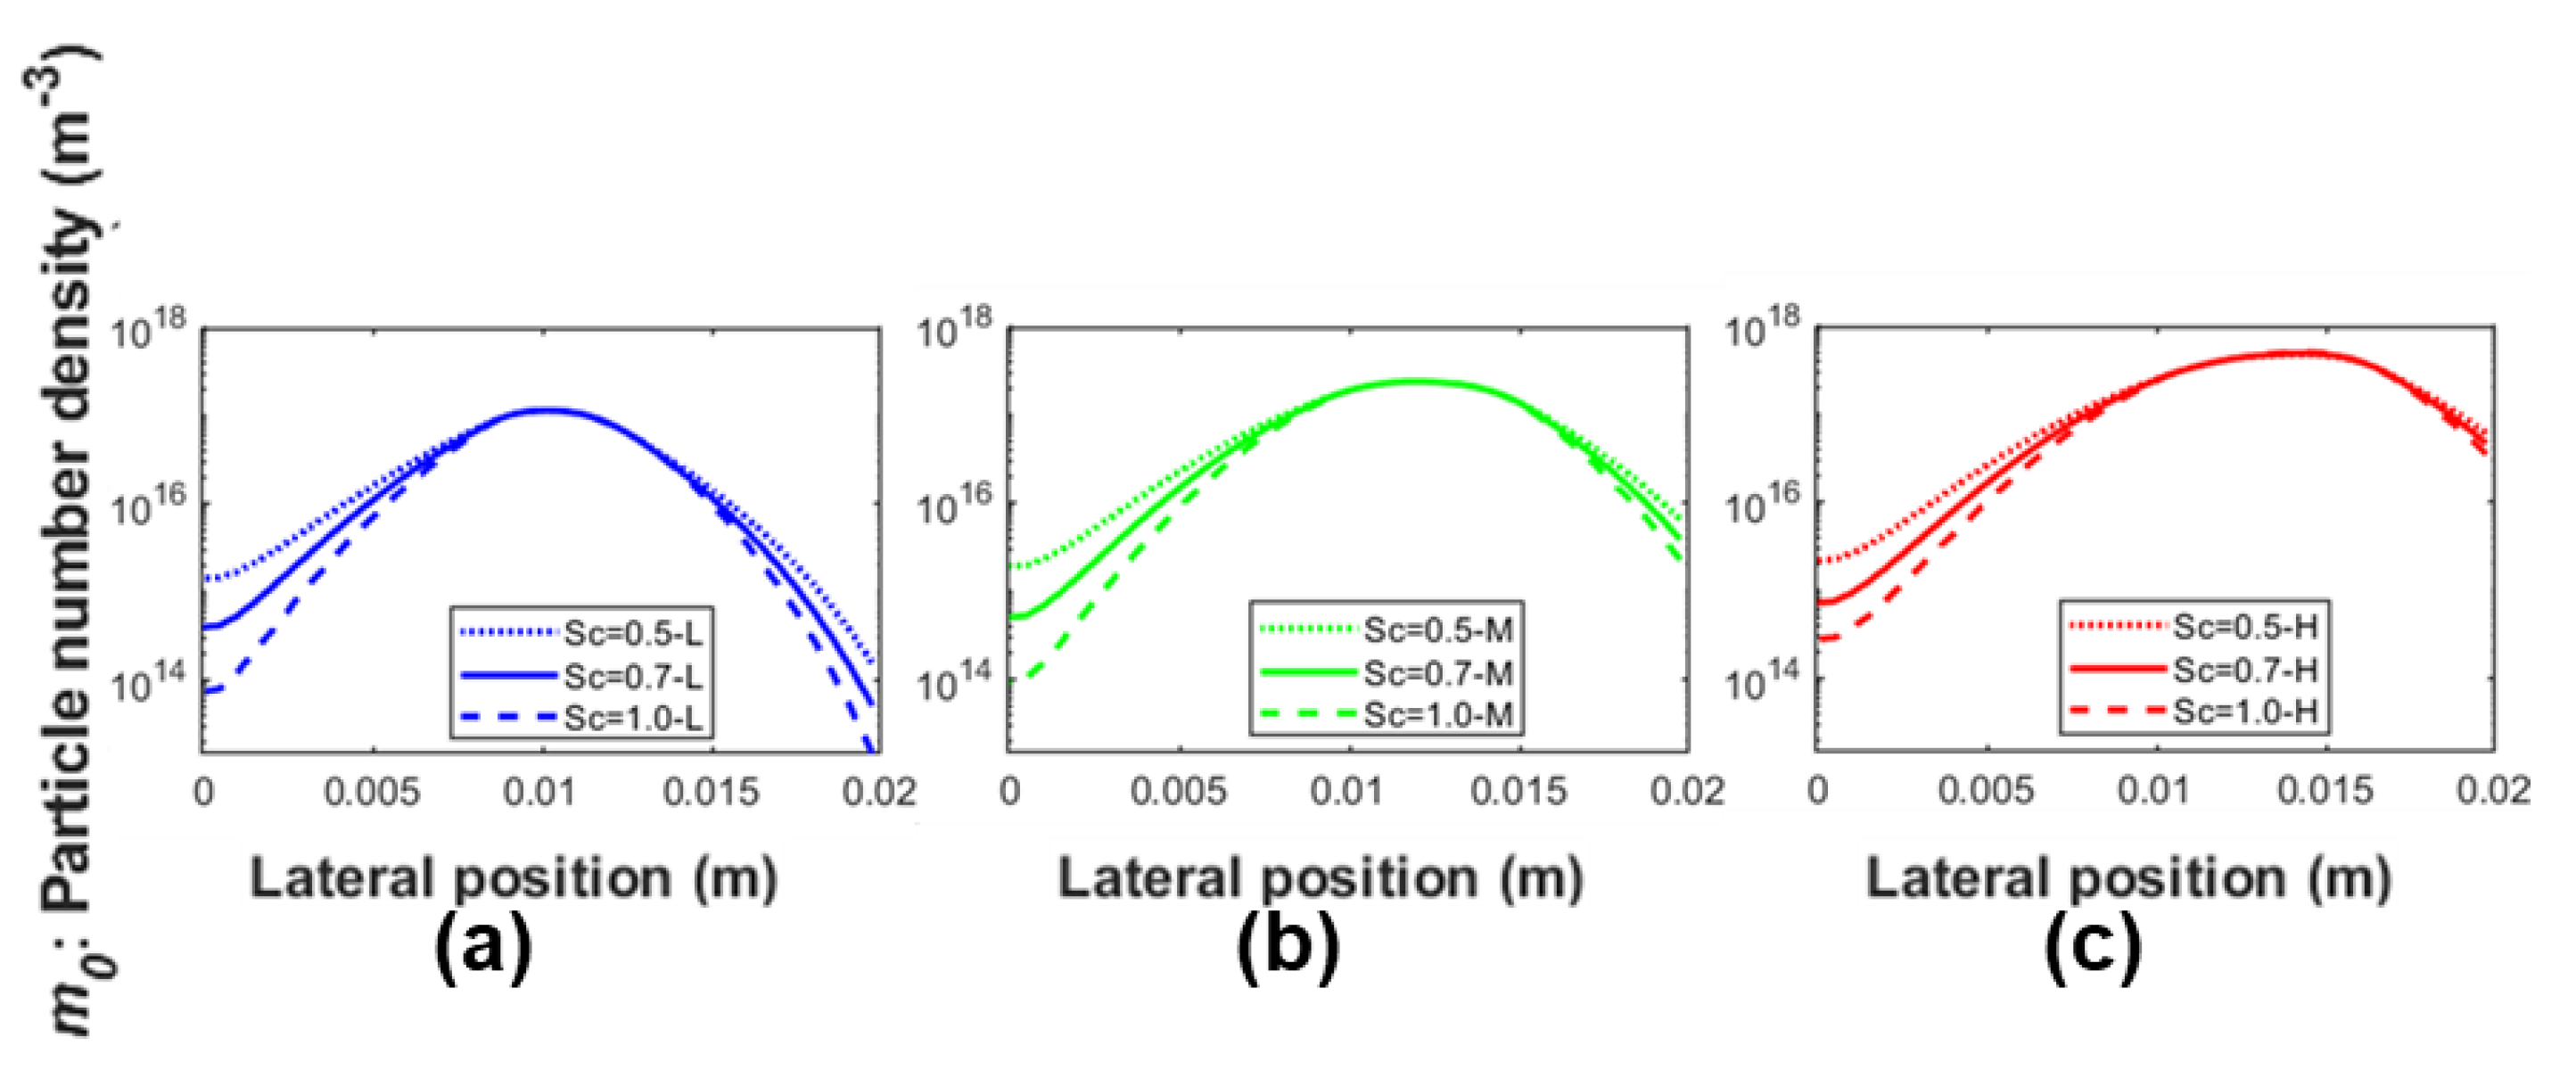
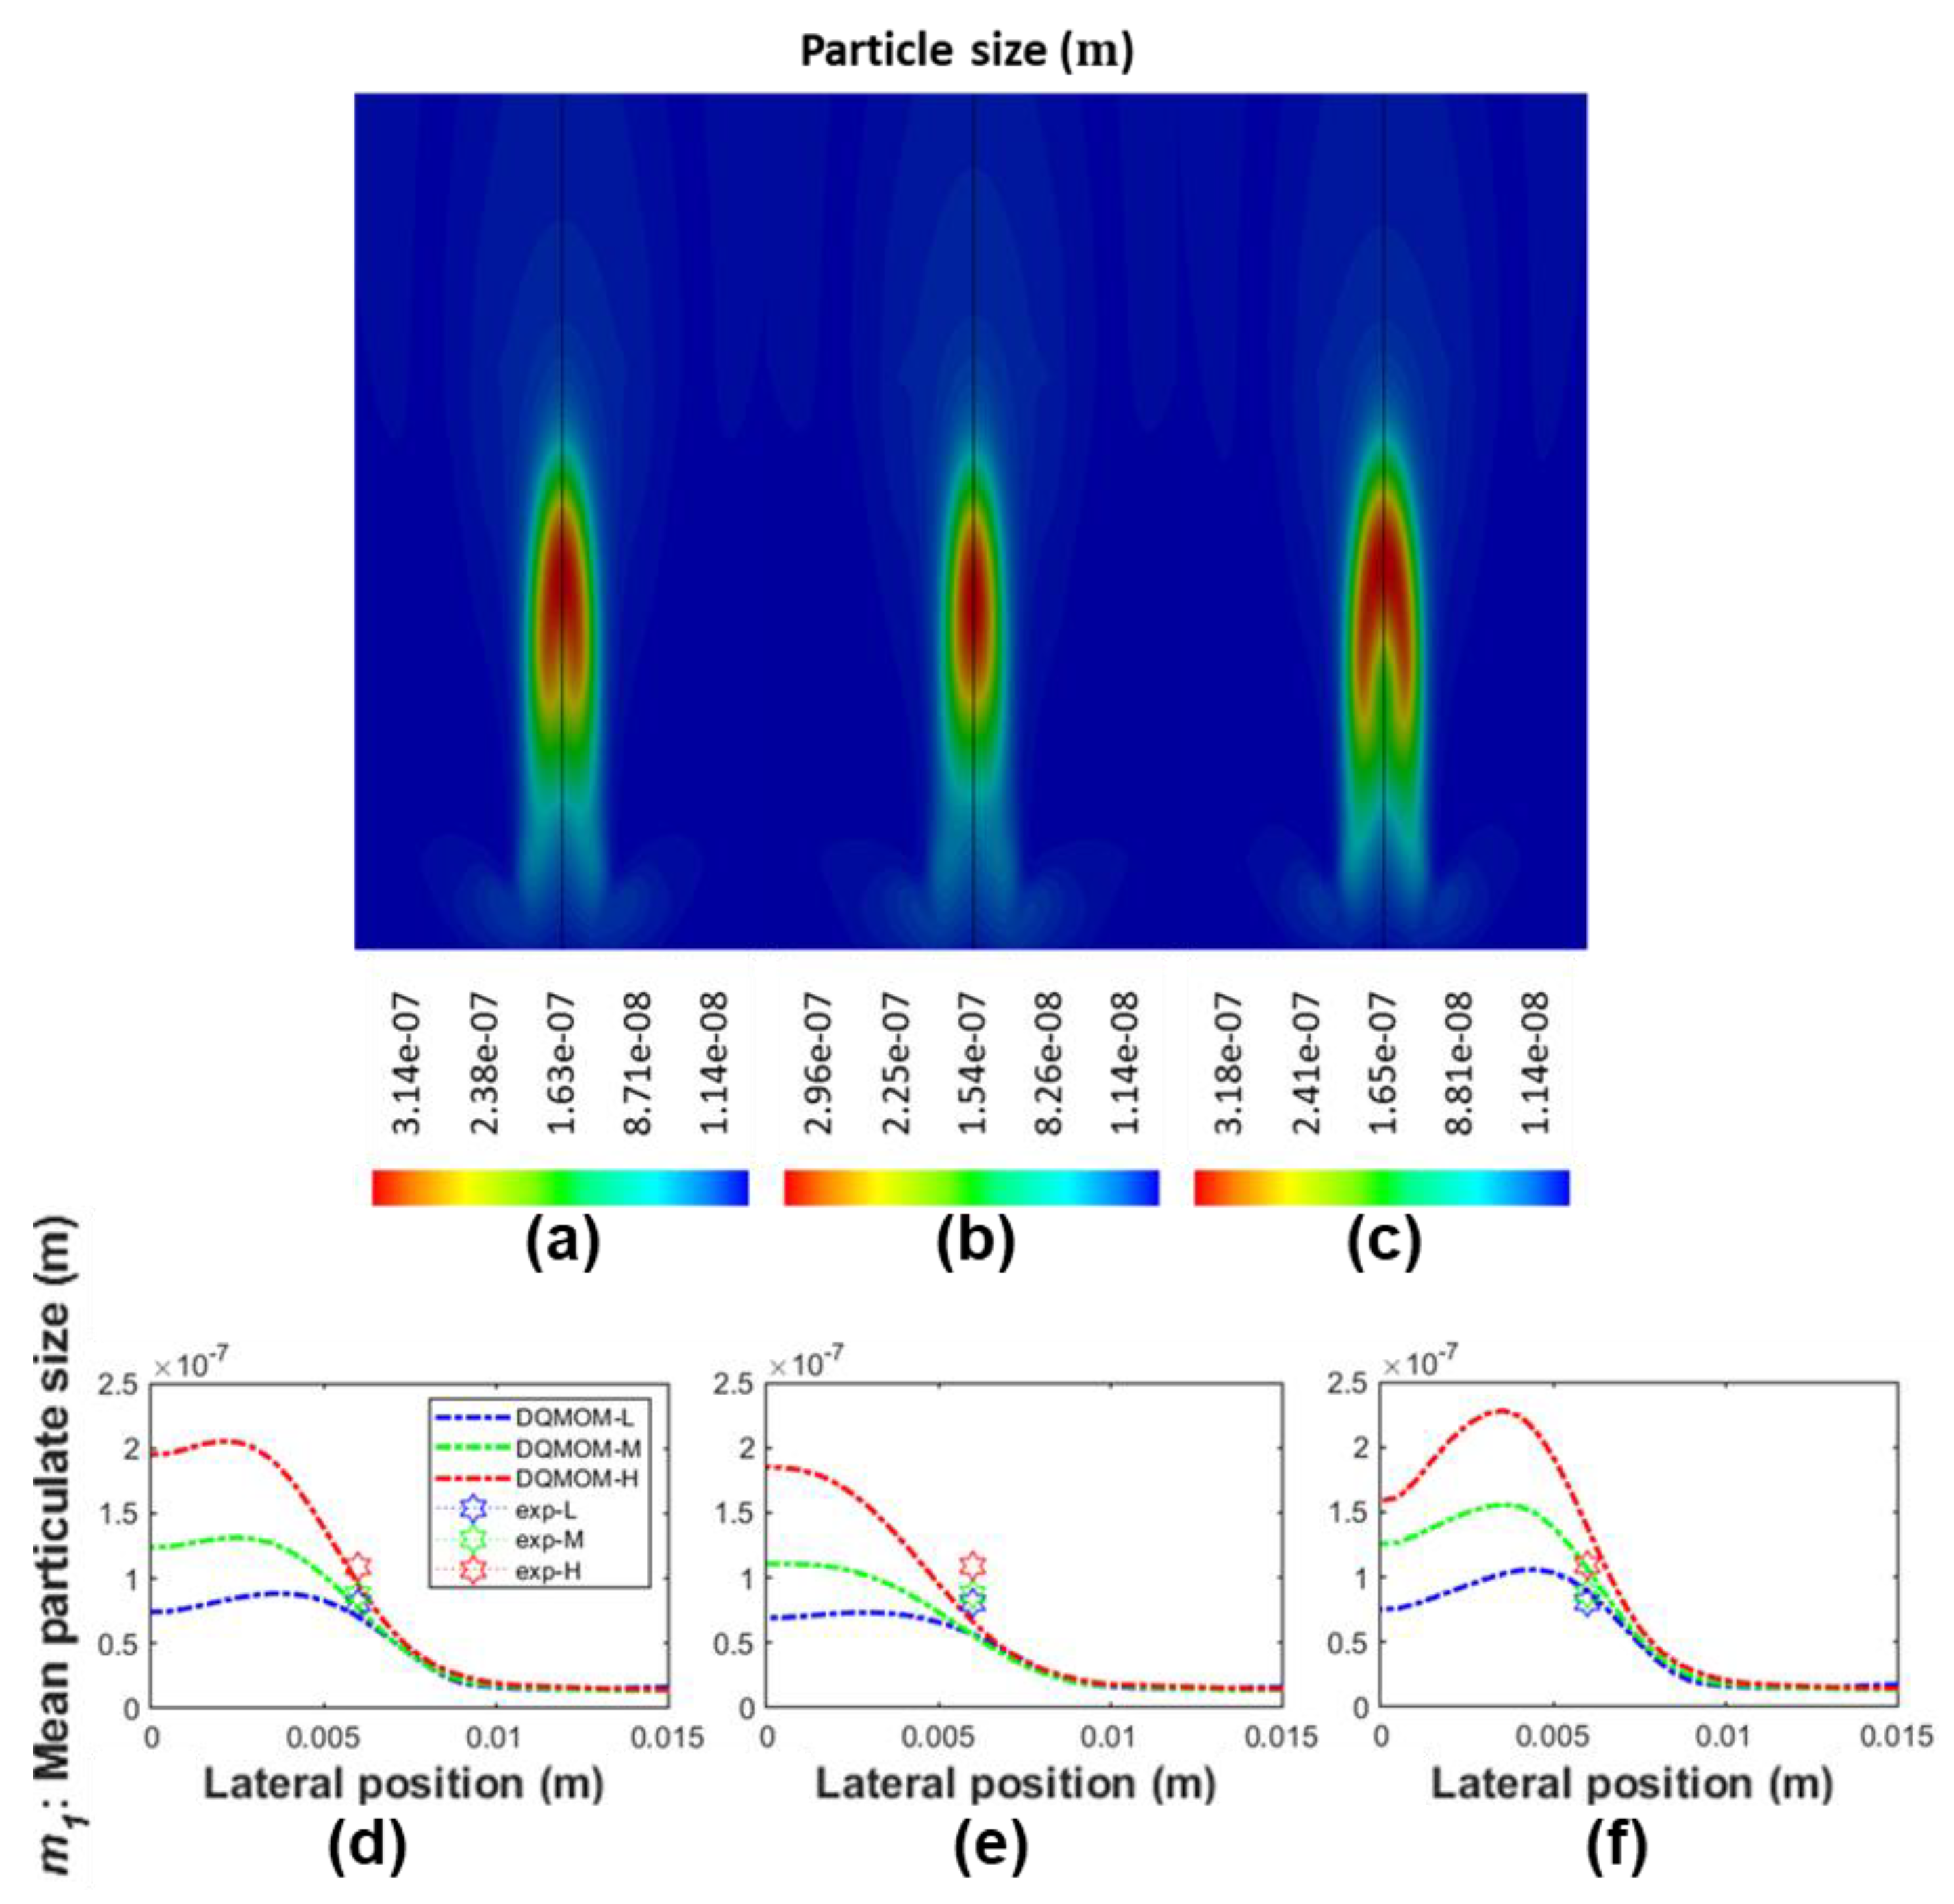
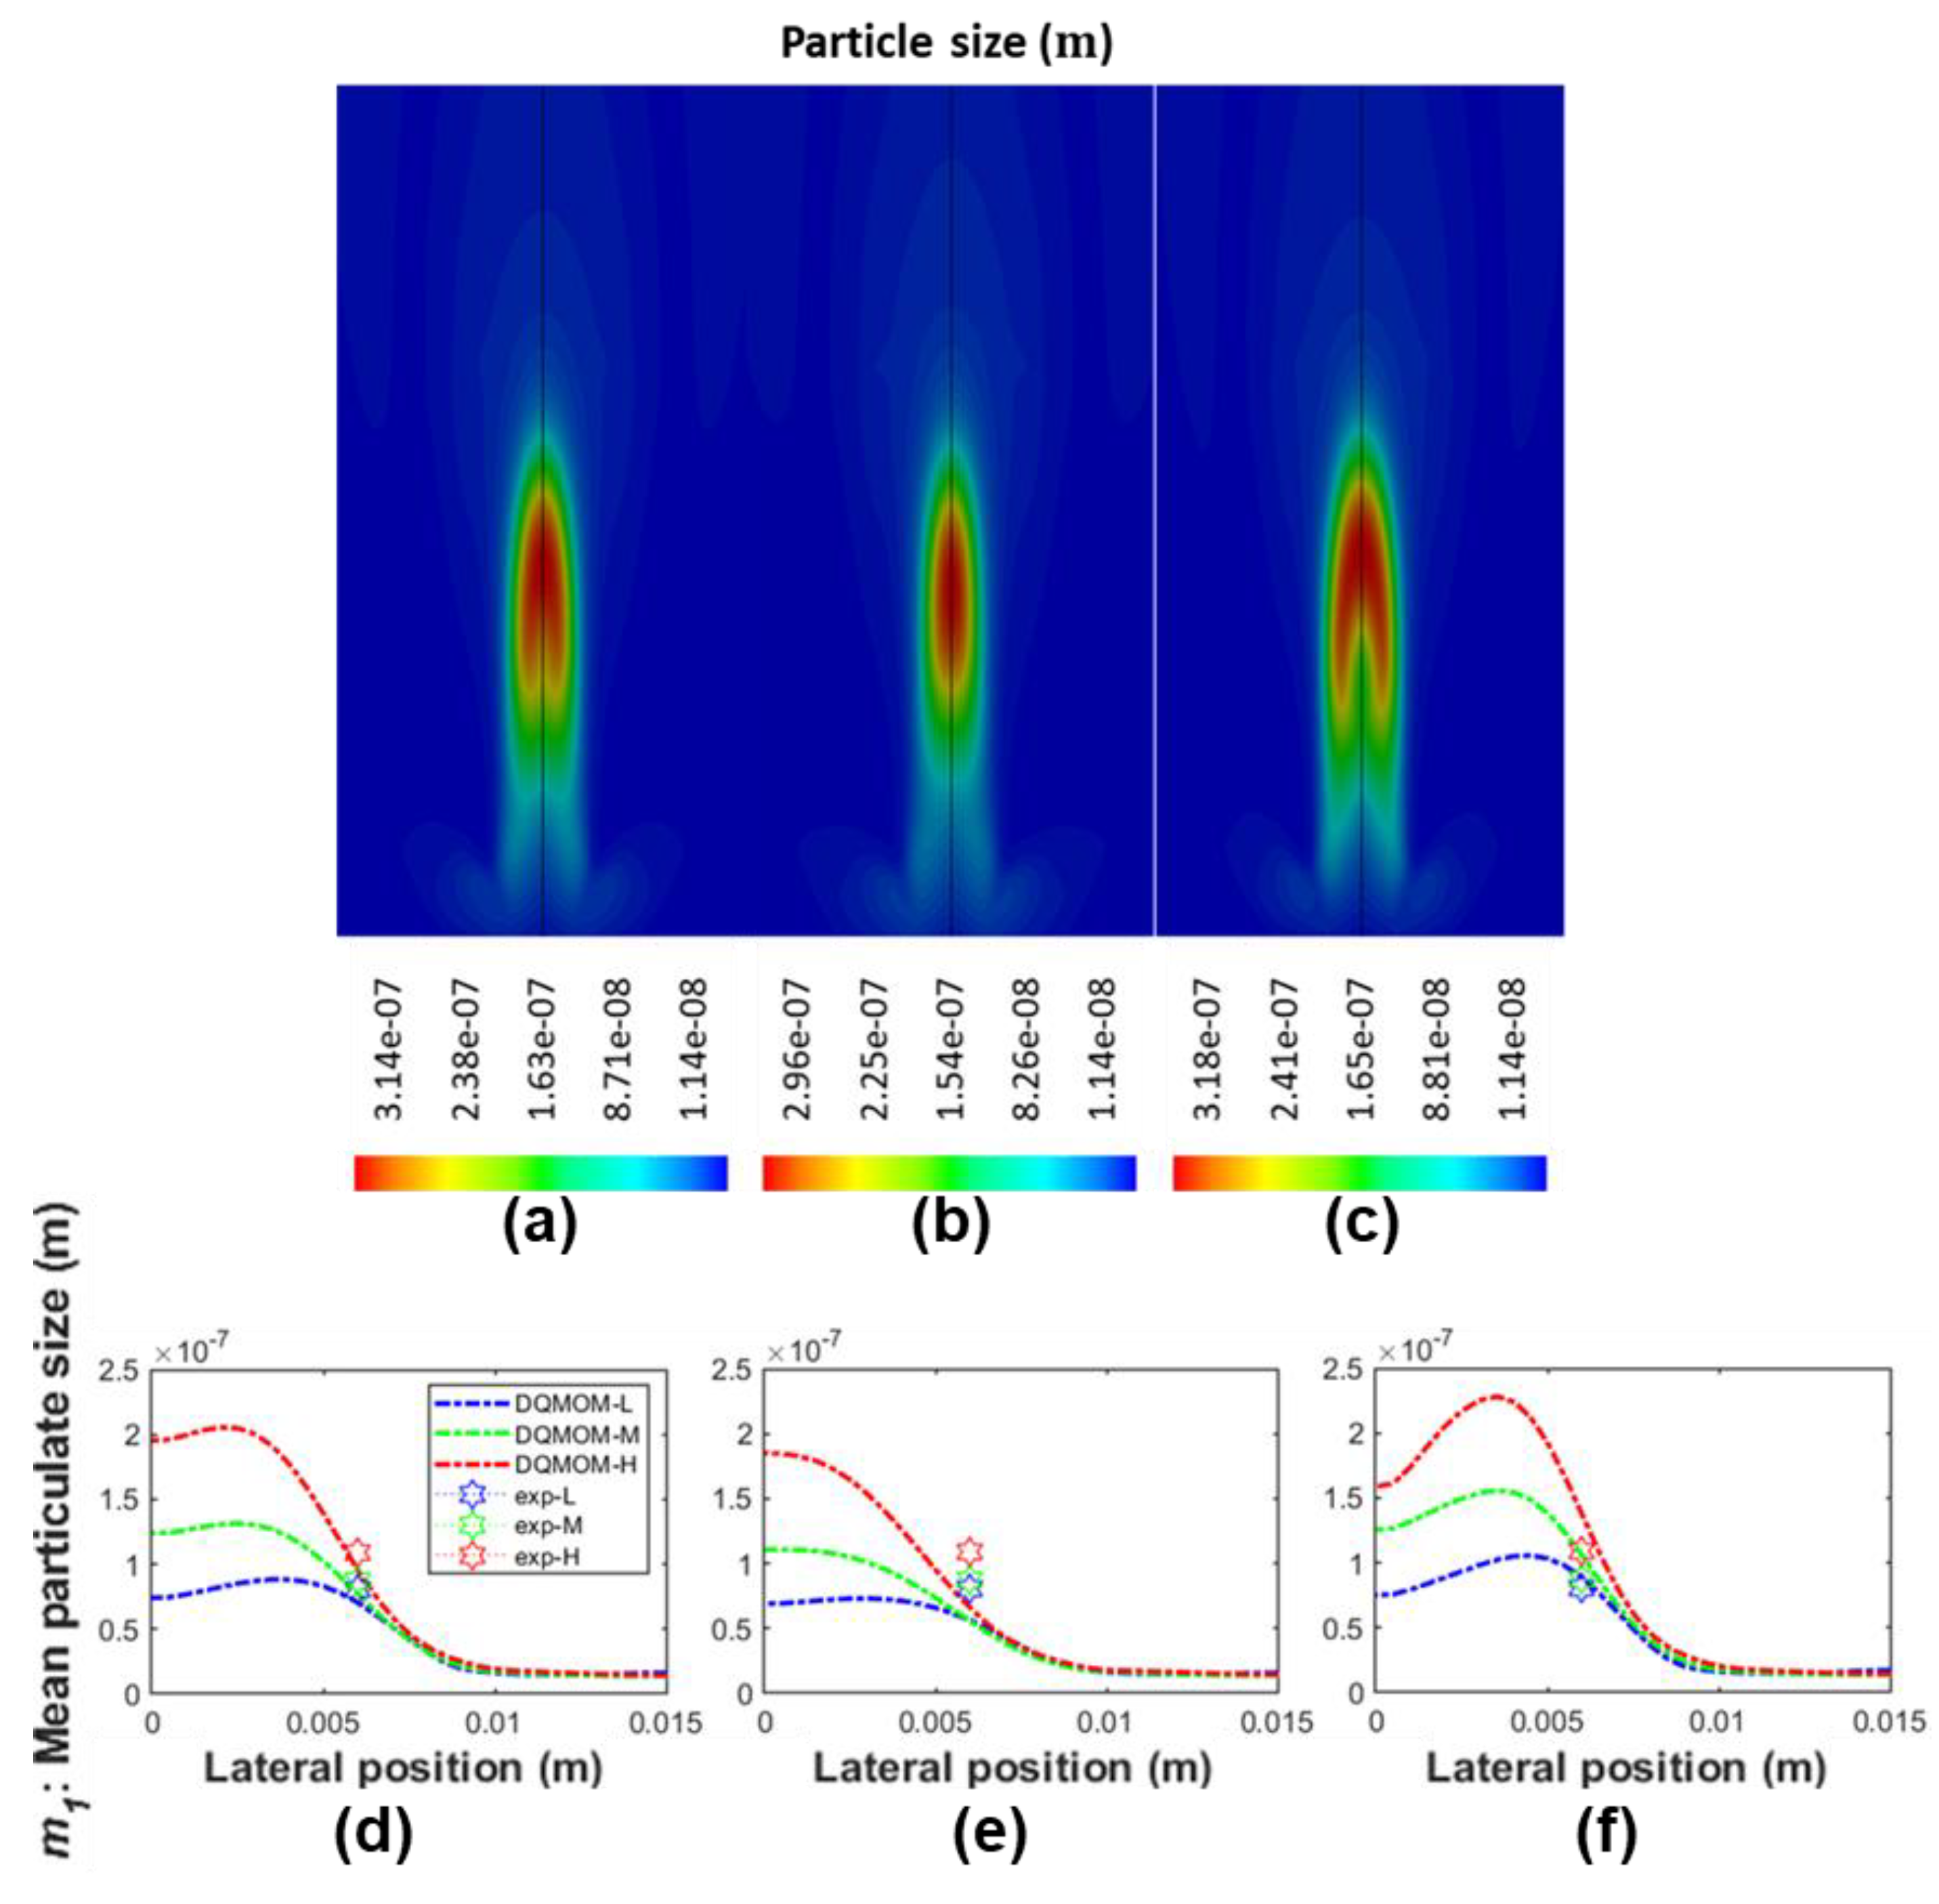
A comprehensive assessment is carried out to investigate the effect of the key components and submodules that are integrated within the framework on both the simulation result as well as the numerical stability of the system. The components and submodules of interest in this work are defined as: nucleation law, oxidation law, value of fractal dimension, and diffusivity. Nucleation and oxidation are fundamental soot mechanisms through the soot evolution. Fractal dimension is directly correlated to the evaluation of rate of soot mechanisms involving surface reactions. Diffusivity governs the spatial transportation and distribution of the soot species.
A summary of all simulation cases under investigation is tabulated in 
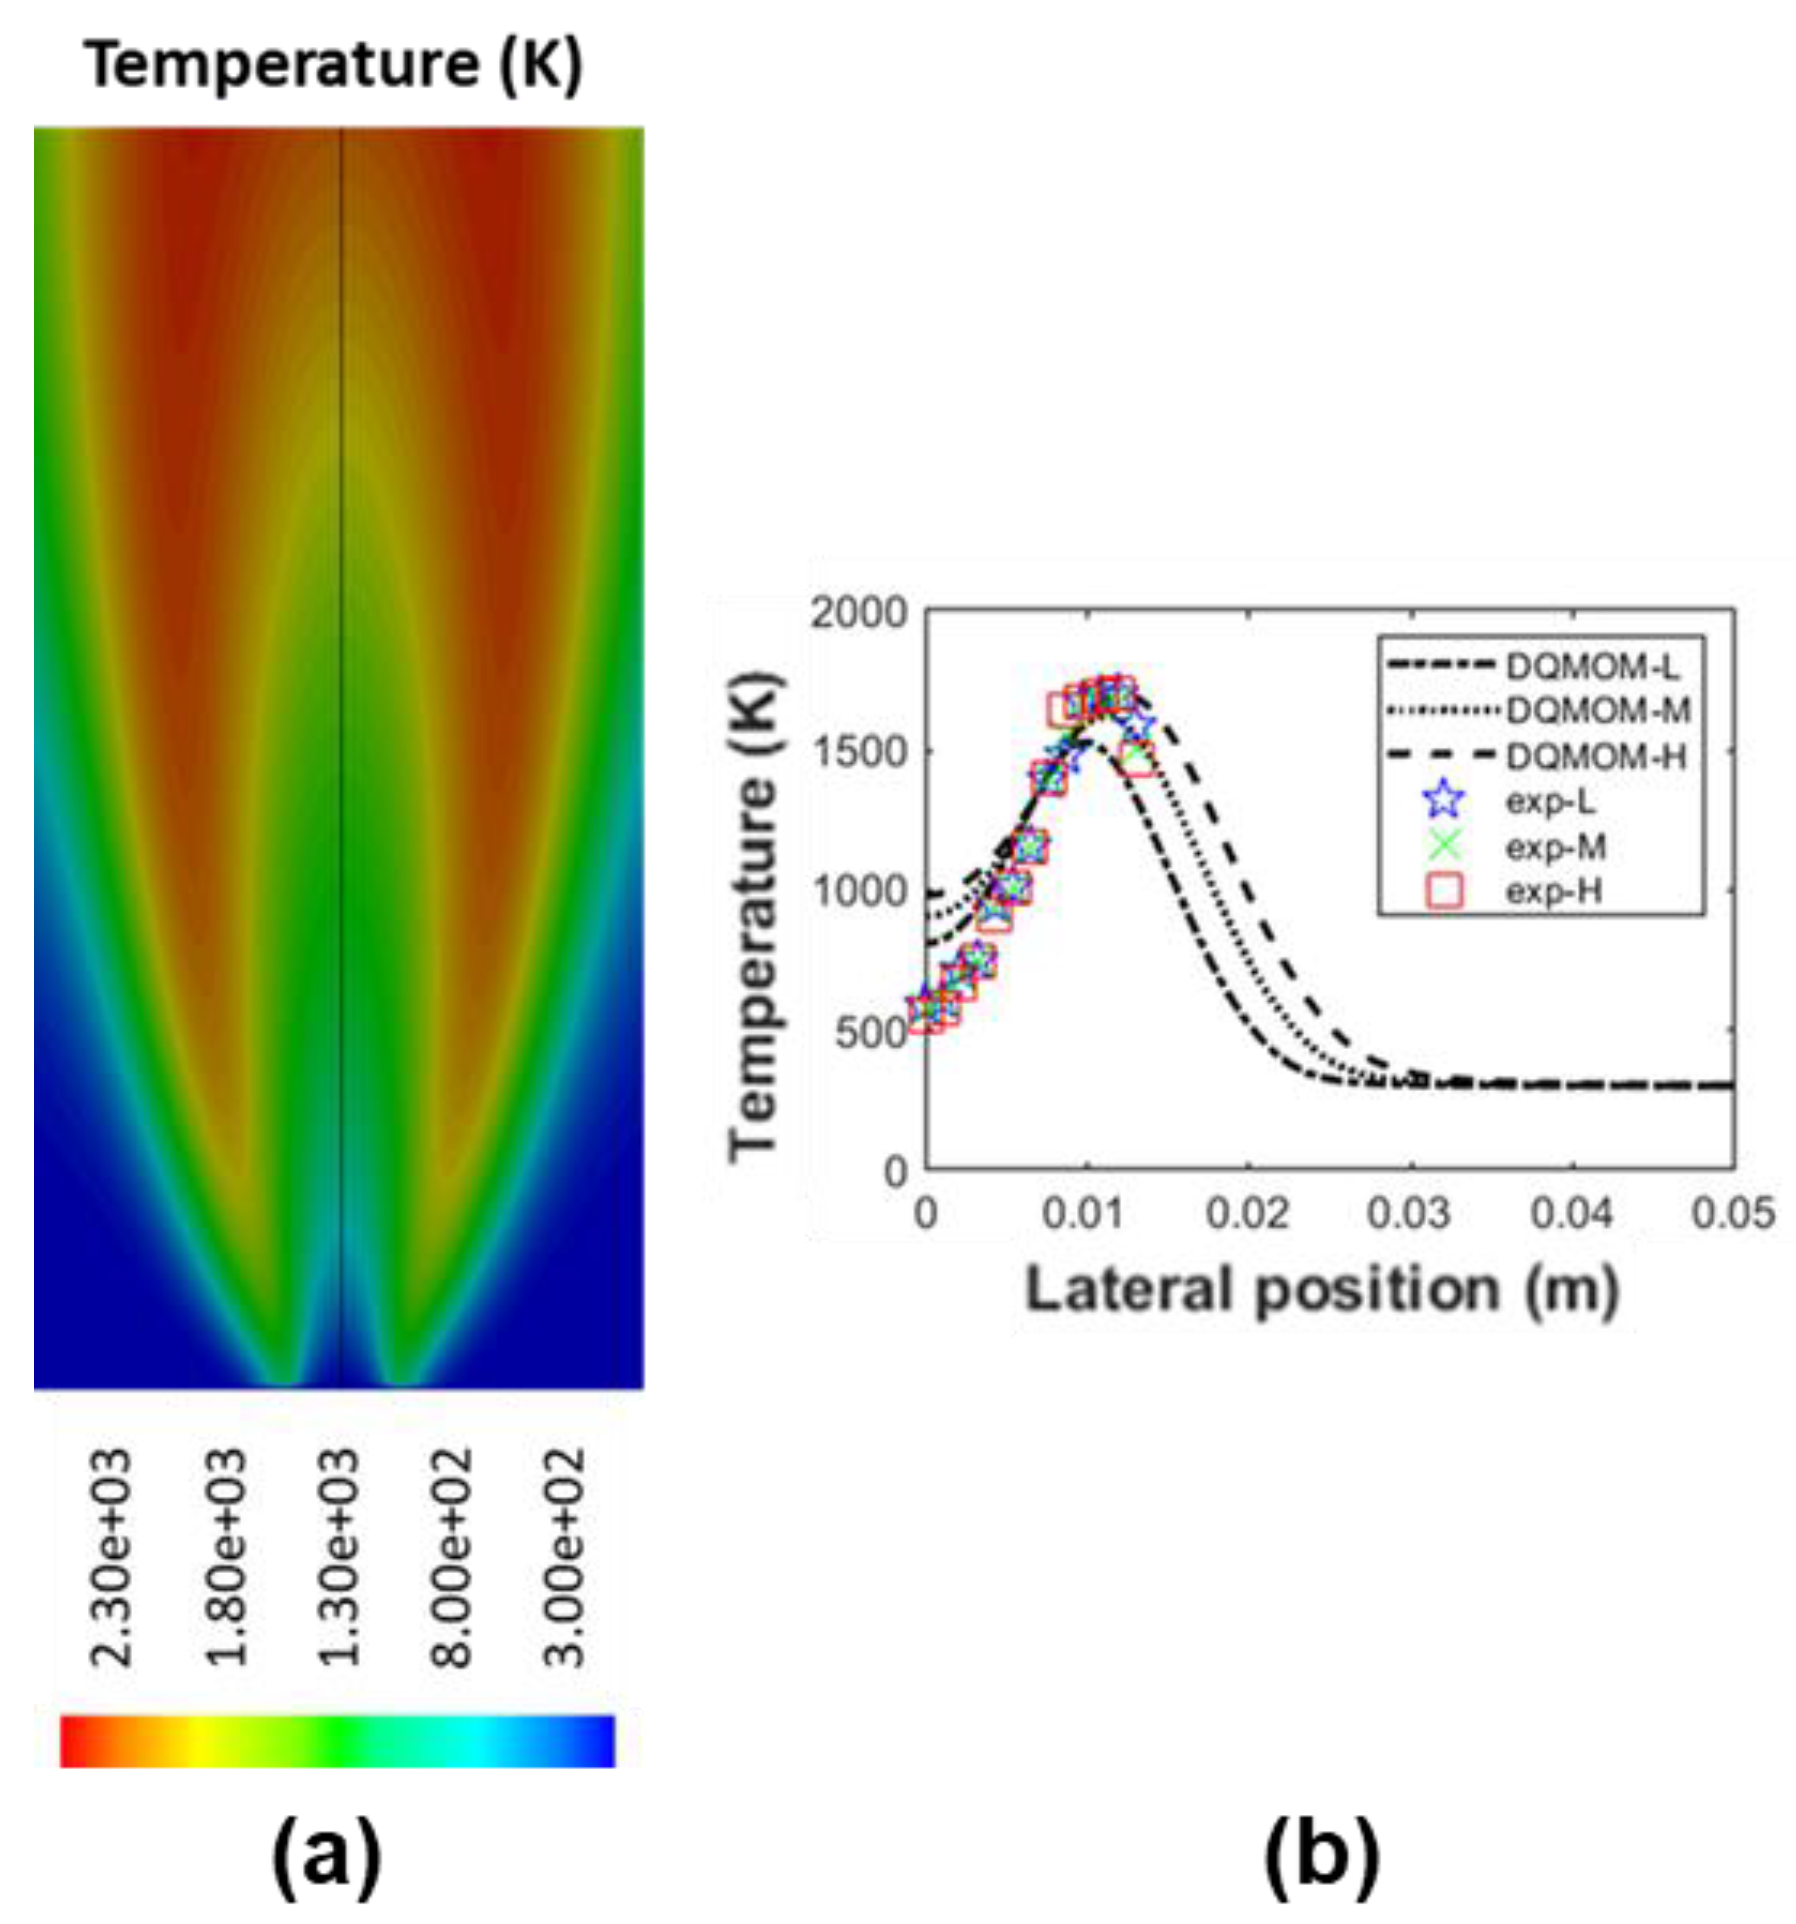
Table 1. Please note that, the simulation result generated from the baseline case (Case A) is compared with that evaluated from other cases (Case B to Case H), which have only one change in the modelling aspect made based on Case A, as well as the experimental data obtained from an in-house measurement. As mentioned earlier, the experiment measures the flame temperature and examines the soot particles using thermophoresis soot sampling and TEM imaging, at three selective height above burner (HAB). The selected HABs represent different typical stages of soot evolution within the flame, namely soot inception region ( 20   mm HAB), soot growth region ( 30   mm HAB), and soot mature region ( 40   mm HAB), and they are referred to as ‘exp_L’, ‘exp_M’, and ‘exp_H’ in the following sections, respectively. Morphological information of the soot sample, such as size of primary particles, projected area, radius of gyration, and fractal dimension of the agglomerates, as well as soot volume fraction, are subsequently derived via either direct characterisation of the TEM images or an automatic image processing algorithm. Details of the experimental setup and post image processing are provided in our previous work [47,48,49].

3. Results

In this section, the details of the flame that is generated via flamelet approach bundled with detailed chemistry is firstly presented and validated with experimental measurement. The DQMOM soot models, i.e., Case A to Case H are subsequently coupled with the combustion modules. The result of soot related properties that are generated by the proposed models are presented and assessed to evaluate the effect of the various modelling aspects on the prediction of in-flame soot evolution.

3.1. Flamelet and Combustion Process

Figure 2 and Figure 3 report typical examples of contour plots of flame temperature and reacting species concentration. These results are generated from the baseline case (Case A), with the standard k - ε turbulence model, flamelet approach for combustion, Moss law and modified NSC law for nucleation and oxidation rate evaluation, fractal dimension of 2.0 , and turbulent Schmidt number of 0.7 .
As mentioned in the previous section, in this co-flow diffusion flame configuration, the parent fuel (ethylene) is injected from the centre inlet into the computational domain and it reacted with the oxidiser (air) entrained from co-flow inlet and the surroundings. Such a rapid combustion process generates a typical diffusion combustion temperature profile, as presented in Figure 2, which is in good agreement with the thermocouple measurements of flame temperatures at several lateral positions and repeats at three heights above the burner. For instance, the peak flame temperature at various HABs, which were obtained numerically and experimentally, both occur at the intersection where fuel and oxidiser encounter and react. The discrepancy in the comparison may be attributed to the inevitable experimental uncertainties, e.g., the spatial resolution of the measurement, averaging of temperature fluctuation that is caused by flame flickering, etc.
The concentration of reacting species, as generated via detailed chemistry coupled with the flamelet approach, is presented in Figure 3. The parent fuel ethylene (C2H4) generally resides at low HAB i.e., regions close to burner front. It subsequently de-composed and reformed into other intermediate species via the pyrolysis process as it flows to the downstream. Acetylene (C2H2), the BSUs for soot particle nucleation and surface growth reaction, is capsulated within the flame sheet and its concentration increases with the heights at the low-intermediate flame region before approaching the high temperature oxidation zone. The concentration of oxidant (O2) peaks at regions that are away from the flame reaction zone and gradually decreases as the lateral position approaches the flame centreline. Unfortunately, due to the lack of available experimental resources, the validation of the concentration of reacting species is not carried out. However, the result presented above is in line with the general expectation of the spatial distribution of flammable gas mixture, as well as oxidant species of a co-flow diffusion flame configuration.
The DQMOM based soot model was subsequently coupled with the established flame profile to characterise the evolution of soot particulates. An initial assessment on the proposed model has demonstrated significant improvement in predicting soot related properties, when compared with that of a mono-dispersed PSD based Moss–Brookes soot model. A comprehensive assessment on the selective modelling aspects, i.e., nucleation law, oxidation law, value of fractal dimension, and diffusivity, is then performed to further enhance the numerical robustness and simulation accuracy of the proposed model.

3.2. Sensitivity Analysis of DQMOM Key Modelling Parameters

Herein, four key modelling aspects were integrated into the DQMOM framework, namely nucleation law, oxidation law, value of fractal dimension, and diffusivity, are taken into consideration in this sensitivity analysis.

3.2.1. Nucleation

Nucleation involves the transformation of soot particles from gas-phase BSUs to amorphous intermediate species (e.g., PAH) and finally to solid phase nuclei, and, to date, it is the least understood mechanism in the soot process. From the numerical modelling aspect, the rate of nucleation dominates the overall quantity of soot been formulated, such as number density and concentration. In the framework of the DQMOM model, the rate of nucleation governs the soot number density (i.e., weight). This weight of the internal coordinate is a key parameter in the formulation of integrated source term of k th moments describing all major soot mechanisms, such as nucleation, coagulation, surface growth, and oxidation (as stated in Equations (18), (25) and (32)). Therefore, the nucleation law that was employed in DQMOM framework could directly affect the evaluation of all weights and weighted abscissas, as well as the internal coordinate (i.e., particle size). It is the most significant aspect and it has been investigated firstly in this sensitivity analysis. Three nucleation laws namely Moss law (Case A), Leung law with nuclei size of 2.4   nm (Case B), and Fairweather law with nuclei size of 18   nm (Case C), have been adopted for assessment. The results of soot-related properties are presented in Figure 4, Figure 5, Figure 6 and Figure 7.
Figure 4 presents the rate of nucleation that is derived from the investigated nucleation laws. When compared with the Leung law and Fairweather law, the region nucleation dominants given by Moss law is more confined and it is located further downstream where the combustion process is well developed with higher flame temperature. Studies on the activation temperature of the nucleation process suggested that intensive soot formation initiates when the local temperature roughly exceeds 1250   K and terminates where the concentration level of precursor becomes low [50]. The nucleation rate profile that was generated by Leung and Fairweather appears to be less realistic when compared with the Moss law, in the implementation of the current burner configuration. Both of the approaches tend to overpredict the nucleation process at regions with high concentration of acetylene but they have relatively lower flame temperature, i.e., closer to burner front or away from reaction zone on the side towards flame centreline. The difference in spatial distribution of the nucleation dominant regions may be attributed to the deviation of the empirical constant that is used in the rate formulations, such as frequency factor and activation energy.
The soot particle number density that is reported in Figure 5 presents a profile similar to that of the nucleation rate and confirms the speculation. It is noticeable that the profile of number density of model adopting Moss law is constrained to the high temperature region. On the other hand, the profile that was predicted by the Leung Law and Fairweather law shows that a large number of soot particulates accumulate at low-intermediate flame height as well as at regions closer to the flame centreline, where local temperature is relatively low, which differs from the findings in the experimental study of similar flame configuration [8,51,52].
In the framework of the DQMOM soot model, the correlation between the nucleation rate and particle size is intricate. The size of soot particulate, calculated as a ratio between the abscissas and weight (i.e., number density), is inversely proportional to the number of particulates in the control volume. On the other hand, the integrated source term of surface reaction, such as surface growth and oxidation, is expressed as a function of number density (as stated in Equation (32)). It implies that the occurrence frequency of collision events i.e., BSU’s adhere to or oxidation radicals attack the agglomerates, should be proportionate to the concentration of the soot particulates within the control volume. Therefore, the effect of the nucleation rate on particle size is numerically ambiguous.
Nonetheless, the particle size predicted by models utilizing the three nucleation law is presented in Figure 6. From the contour plot, it can be seen that the soot particle size determined by the Fairweather law is relatively lower, whilst that provided by the Moss law and Leung law are more comparable, when compared with the experimental data at the sampling points. However, at the flame centreline, the particle size that is predicted by Moss law approach at three HABs is more scattered when compared with that estimated using the Leung law and Fairweather law. It captures the feature that the size of soot particulates increases with flame heights before approaching flame tip. Such a tendency could also be found in previous studies on in-flame soot formation [8,34].
The simulation result of soot volume fraction, when compared with experimental data, is presented in Figure 7. It is evident that the Fairweather Law severely underestimates the soot volume fraction due to the combined effects of underpredicting soot number density as well as soot particle size. The value of soot volume fraction from Moss law and Leung law is again comparable with experimental data at the sampling locations. However, a more distinguished difference in soot volume fraction between the flame centreline and the expected soot zone can be observed from the Moss law when compared with that predicted by the Leung law. Such a profile indicates that most soot species are confined in a narrow sooting region and its concentration sharply decreases as the lateral position moves away in both directions: towards flame centreline and surrounding. Again, this observation agrees well with the experimental data [8,34,53] as well as the general expectation. Therefore, based on the abovementioned analysis and comparison, the Moss law is selected as the preferred mechanism of nucleation and it is adopted in the framework of DQMOM soot model.

3.2.2. Oxidation

The effect of implementing a different law of oxidation, which functioned as the destructive mechanism of soot particle size, is assessed in this study. The analysis herein consists of the comparison of models employing a modified NSC law (Case A) and Said law (Case D), and the results are reported in from Figure 8, Figure 9, Figure 10 and Figure 11.
The oxidation rate estimated from both cases presented in Figure 8, shows a notable difference regarding the oxidation dominant region. It is generally accepted that the rate of oxidation in diffusion flame is expected to be predominant at regions where flame temperature and oxygen concentration become high i.e., alongside with the reaction zone. Despite the difference in the magnitude of oxidation rate, the oxidation profile that is provided by the Said law predominantly occurs at the downstream flame region and close to flame front where a peak temperature and high concentration of oxygen persist. This could be justified as the oxidation rate in the Said law is formulated based on the Arrhenius equation as a function of local temperature and concentration of oxidant species, as referred to in Equation (27). Alternatively, the oxidation rate evaluated from modified NSC law peak at low-intermediate flame height in the vertical direction and constrained in a narrow band close to soot layer in the lateral direction. This could be well explained as the effect of the additional coefficient of surface area that is introduced in the modified NSC law that limits the reaction region of oxidation to where larger soot particulates reside.
As mentioned previously, as a surface reaction, oxidation occurs via oxidant species attack the soot agglomerate on its active surface site. Apart from the common aspects, such as ambient condition and activation energy, the oxidation rate should be proportionate to the surface area of the soot agglomerate where the reaction is taking place. To be more specific, under the same ambient environment, e.g., with the same oxidant species concentration and local temperature, the control volume with the presence of larger particulates is expected to have a higher oxidation rate, when compared with that of smaller particulates. The Said law neglects such a correlation and hence its evaluated oxidation rate peaks near the flame tip where the soot particulates could merely be observed due to the intensive oxidation reaction. However, it underestimates the oxidation rate at a high temperature reaction region at low-intermediate HABs where larger soot particulates are formed. On the other hand, modified NSC law takes the factor of the active surface site into consideration and enhances the oxidation intensity where larger soot particulates persist, i.e., in the vicinity of soot layer. This deduction is verified by comparing the oxidation rate at low-intermediate flame height, as shown in Figure 9. It can be observed that, when compared with the modified NSC law, the Said law overlooks the effect of oxidation from flame centreline to soot and reaction zone and beyond in the lateral direction, at all three heights of interest.
A similar conclusion could be drawn when comparing the soot particle sizes that were obtained from the two oxidation kinetics, as presented in Figure 10. The particle size evaluated from the two approaches have a nearly identical profile in spatial distribution and comparable magnitude at the downstream flame regions. However, a larger size particulate has been evaluated by Said law at upstream flame heights, i.e., about 20   mm HAB in the vertical direction and from flame centreline to and beyond the reaction zone in the lateral direction, when compared with that of modified NSC law. This inaccurate description of oxidation phenomenon leads to a distinct thin layer of un-oxidized soot particles at the lateral location near and beyond the flame reaction zone in the profile of soot volume fraction generated by Said law, as presented in Figure 11. Such an un-oxidated soot layer is contrary to the findings of both the numerical and experimental studies of similar flame configuration [8,25,26,27,34,40]. Based on the abovementioned comparison in reaction rate, soot particle size, as well as the soot volume fraction, it is believed that the modified NSC law is more applicable for the flame of interest, and therefore it is selected as the preferred oxidation law to be implemented in the DQMOM model.

3.2.3. Fractal Dimension

The fractal dimension, D f , gives insights into the geometrical characteristics of fractal object, e.g., soot clusters. Soot aggregates with higher degree of compactness are generally assumed to have larger value of D f , whereas aggregates with more linear and open branched structures are characterized by a smaller D f value [54]. In the numerical simulation of soot formation, the fractal dimension is closely related to the prediction of rate of processes that involve radical species attack on reactive site and event of collision, for example, surface reactions and coagulation. Fractal dimension is a key factor in quantifying size-related properties, e.g., radius of gyration, collision radius, effective diameter, etc. For computational simplicity, a unique value of D f of soot aggregates is generally accepted and assumed in mono-variate population balance model, with a typical value that ranges between 1.8 and 3.0 . Data from previous studies on a non-premixed diffusion flame have demonstrated that the selection of fractal dimension could have a marked impact on the final prediction [26,28]. Therefore, it is important to investigate D f and evaluate its influence on the current burner configuration.
The fractal dimension of a fractal object could be quantified based on the morphological information that was obtained experimentally by examining the TEM image and is derived by least-square regression fittings to the power law relationship [55,56]:
n = k f ( r g d p ) D f
whereby k f is the empirical fractal prefactor and d p is mean diameter of primary particle within the aggregate. n is the number of primary particles per aggregate, determined based on the ratio of the projected area of the aggregate A a and average projection area of the primary particles A p observed within the aggregate, as well as the empirical constant k a and exponent α set as 1 and 1.09 , respectively:
n = k a ( A a A p ) α
r g refers to the radius of gyration of the soot aggregates, and it is determined using:
r g 2 = 1 m r i 2
where r i is the distance from the centroid of the aggregate to individual pixels and m is the number of pixels within the projection image of an aggregate. The slope of the least-square linear fits of log ( n ) and log ( r g d p ) were subsequently performed to yield the value of fractal dimension.
Examining of the TEM images of soot samples that were collected at three HABs suggests that the fractal dimension of the soot clusters that were generated from the flame of interest is within the range of 1.8 and 2.0 , which agrees well with the results that were reported in the literature [57]. Based on this observation, three values of D f , i.e., 1.8 (Case E), 2.0 (Case A), and 2.2 (Case F), have been adopted in the DQMOM soot models for assessment, and the result is reported in Figure 12, Figure 13, Figure 14 and Figure 15.
As mentioned previously, within the DQMOM soot model framework, the fractal dimension primarily affects the determination of the rate of surface reaction mechanisms. For fractal objects with equal size, i.e., the longest distance could be made from the TEM image between any two pixels within a soot aggregate, the particulates with larger D f tend to be more morphologically compact. Its effective diameter, quantified as collision radius (refers to Equation (24)), therefore will be smaller when compared with that of a particle with smaller value of D f . This implies that aggregate with larger value of D f could have limited active site for surface reaction to take place, and as a result restrain the rate of surface reaction, such as oxidation and surface growth, when compared with that of smaller value of D f . The rate of oxidation and surface growth, therefore, are compared and presented in Figure 12 and Figure 13, respectively.
The oxidation rates presented in Figure 12 generated by models with three D f are almost identical, regarding the spatial distribution of reaction region as well as the magnitude of the reaction rate. This could be attributed to the temperature dependent correction factor f O 2 in the modified NSC law. This correction factor restrains the oxidation to occur only at where the local temperature exceeds 1300   K and cut off the oxidation rate to null when the local temperature is below the threshold. This cut-off correction regulates the profile and the intensity of oxidation based on the local temperature and concentration of oxidant species, hence it dampens the effect of the fractal dimension to the evaluation of oxidation rate.
On the other hand, the rate of surface growth of the model with smaller fractal dimension ( D f = 1.8 ) is about nine-fold larger than that yield from the model with larger D f value ( D f = 2.2 ) as shown in Figure 13. The prominent increase in surface growth rate with the decrease of D f value could be explained as the surface growth rate is formulated based on the local temperature, concentration of BSUs, as well as the coefficient of surface area, as stated in Equation (26). With the previously mentioned hypothesis, the rate of surface growth is proportionate to the surface area coefficient, 6 D f ρ s ( R c R c 0 ) 3 D f 3 . The decrease of D f value will exponentially increase the surface area coefficient, and hence intensify the ensuing rate of surface growth. Similarly, the collision radius, R c , is proportional to the number of soot primary particles within the aggregate to the power of 1 D f (refer to Equation (24)). With the implementation of a smaller D f value, the collision radius will also exponentially increase and subsequently result in an exaggerated prediction of the surface growth rate.
The particle size contour and comparison between experimental data and simulation results at three measuring points are presented in Figure 14. The model adopting fractal dimension of 1.8 evaluates the particle with a size significantly larger due to the excessively intense surface growth reaction, i.e., increased about three times when compared with that of fractal dimension of 2.2. This observation is consistent with the sensitivity analysis reported in the literature that compares the particle size at flame centreline at various HAB, generated from models with a fractal dimension ranging from 1.8 to 3.0 [26]. The ensuing estimation of the soot volume fraction based on the number density and particulate size, as presented in Figure 15, again agrees well with the abovementioned speculation. The soot volume fraction evaluated with the adoption of a fractal dimension of 1.8 is significantly larger, i.e., by four orders of magnitude at flame centreline, when compared with that of model implementing the value of 2.2.
From the comparison of soot particle size and soot volume fraction with the experiment data, it could be concluded that the D f value of 2.0 provides the best agreement, whilst the D f value of 1.8 and 2.2 either overestimates and underestimates the two soot related properties. This finding is supported by the literature [26,28], and therefore value of 2.0 is selected as the preferred settings for fractal dimension and it is integrated into the proposed DQMOM soot model framework.

3.2.4. Diffusivity

The diffusion term, accounts for the transport of scalar due to concentration gradients, is also investigated in this study. In dilute species transport, the flux due to diffusion is given by Fick’s first law. Its intensity is dependent upon the steepness of the concentration gradient and it is numerically proportional to a coefficient that is referred to as diffusivity. This diffusivity could be evaluated as the summation of molecular diffusivity, Γ , and the turbulent diffusivity, Γ t . For the current study of soot formation in the co-flow diffusion flame, the molecular diffusion can be safely neglected as the turbulent diffusivity is dominant when compared with molecular one [25,26]. The turbulent diffusivity is calculated as the ratio between eddy viscosity, ν t , and turbulent Schmidt number, S c t , which describes the relative diffusion of momentum and mass due to turbulence. Therefore, the rate of mass diffusion is inversely proportional to the turbulent Schmidt number. The turbulent Schmidt number is considered as an empirical constant in the most practical fire simulation. For computational simplicity, a global value of Schmidt number i.e., S c t = 0.7 is generally prescribed as a widely accepted value in the modelling of jet flows and gas turbine combustor modelling [58]. However, other values of turbulent Schmidt number, ranging from 0.2 to 1.0 , have been used in a number of applications, e.g., the modelling of gas turbine combustor, combustor with rich burn, quick quench, and lean burn, etc. [21].
The soot evolution and the spatial transport concurrent with the flammable gases in the current study have been resolved via a mixture model approach. To be more specific, the particulates that are immersed in the gas-phased mixture are assumed to be infinitely small; hence they have negligible effect on the global flow field. A typical value of S c t = 0.7 was initially implemented when coding the transport equation for both soot species and gas mixtures. However, soot particulates exhibited a complexed phase evolution that depends on the stage in the formation pathway. i.e., from liquid-alike nascent soot precursor or PAH with amorphous internal structure, to graphitized mature soot particulate. The tendency in spatial transport due to diffusion of the soot particulate should be different when compared with gas-phased mixture. The assessment of the effect of the turbulent Schmidt number on the prediction of soot properties of the current flame configuration is therefore carried out.
Three values of S c t , 0.5 (Case G), 0.7 (Case A), and 0.9 (Case H) have been selected in this assessment. The contour plot of soot number density, as evaluated by the three models, is firstly presented in Figure 16, which are almost identical in terms of both spatial distribution as well as peak value. It is generally agreed that the effect of diffusion term on the prediction result differs from the previously exanimated soot kinetics. For example, the variation of nucleation law, oxidation law, and the value of fractal dimension vary the formulation of integrated source term and affect the ensuing prediction of the sooting processes. However, the diffusion term in transport equation does not have a direct impact on the rate of birth and death process of soot evaluation. As a result, non-distinct discrepancy in terms of peak value of number density of the three cases can be observed.
Nevertheless, as depicted in Figure 17, the quantity of soot number density evaluated by the three cases significantly varies at regions away from the soot layer, and such a trend can be observed in all selected HABs”. The result clearly demonstrates that the dispersion of soot particulates is notably affected by the diffusivity, as it governs the spatial transport of soot species from their inception region to the surrounding. For instance, with the smaller Schmidt number, i.e., S c t = 0.5 , there are more soot particles being spread away from the nucleating region towards non-active regions, such as flame centreline as well as regions away from flamelet. Whilst with a lager Schmidt number, i.e., S c t = 0.9 , most of the soot particulates are confined in a narrow band with a relatively low quantity of soot particles being observed elsewhere. The result implies that denser solid soot particles with higher S c t values are inherently more resistant to the spatial movement due to diffusion, when compared with that of a lower S c t value.
The soot particle size and the soot volume fraction are subsequently derived as the first and third moment of the number density function, and as a result, a similar trend of the two quantities is observed. For instance, the contour plot of soot particle size and soot volume fraction shown in Figure 18 and Figure 19 depict a relatively similar profile in terms of the quantity as well as the general spatial distribution. However, a close observation clearly indicates that, with the increase of S c t number from 0.5 to 0.9 , the profile of both soot particle size and soot volume fraction at low-intermediate HAB transformed from an oval-shaped distribution that peaks at the centreline to an A-shaped profile that confines the two quantities to regions close to the expected soot band. Similarly, the X-Y plot of soot particle size and soot volume fraction at the selected HABs again indicates that both quantities at all the heights of interest shift from a typical decay curve peaks at the flame centreline, to a positively skewed bell-shaped curve, with the increase of the S c t value.
From the abovementioned comparison, the conclusion could be made that, with the implementation of S c t of 0.9 , the simulation results of both soot particle size as well as soot volume fraction agree best with in-house experimental data at all sampling heights. The result evaluated with larger S c t also resembles the planar measurement from the LII techniques. This observation is again aligned with the expectation that denser soot particulate should be inherently more resistant toward spatial transport due to diffusion, as compared with other gas-phase mixtures. Therefore, the S c t of 0.9 is selected as the preferred value for diffusivity and it is integrated into the proposed DQMOM soot model framework.

4. Conclusions

In this article, a fire field model that is associated with an in-house Direct Quadrature Method of Moments (DQMOM) code was specifically developed for buoyancy-driven low-speed turbulent diffusion flames. The DQMOM model embraced all major mechanisms for soot particle evolution/disruption, including nucleation, surface growth, and oxidation and coagulation. Furthermore, it was fully coupled with detailed chemistry gas-phase combustion model, which allows for predictions of intermediate chemical species to enhance the real-time tracking of the particle size distribution. The proposed model was not only capable of providing additional information for the soot particle distribution in the computational field, but it also yielded other important secondary properties, i.e., particle number density and local volume fraction with good accuracy and effective computational cost.
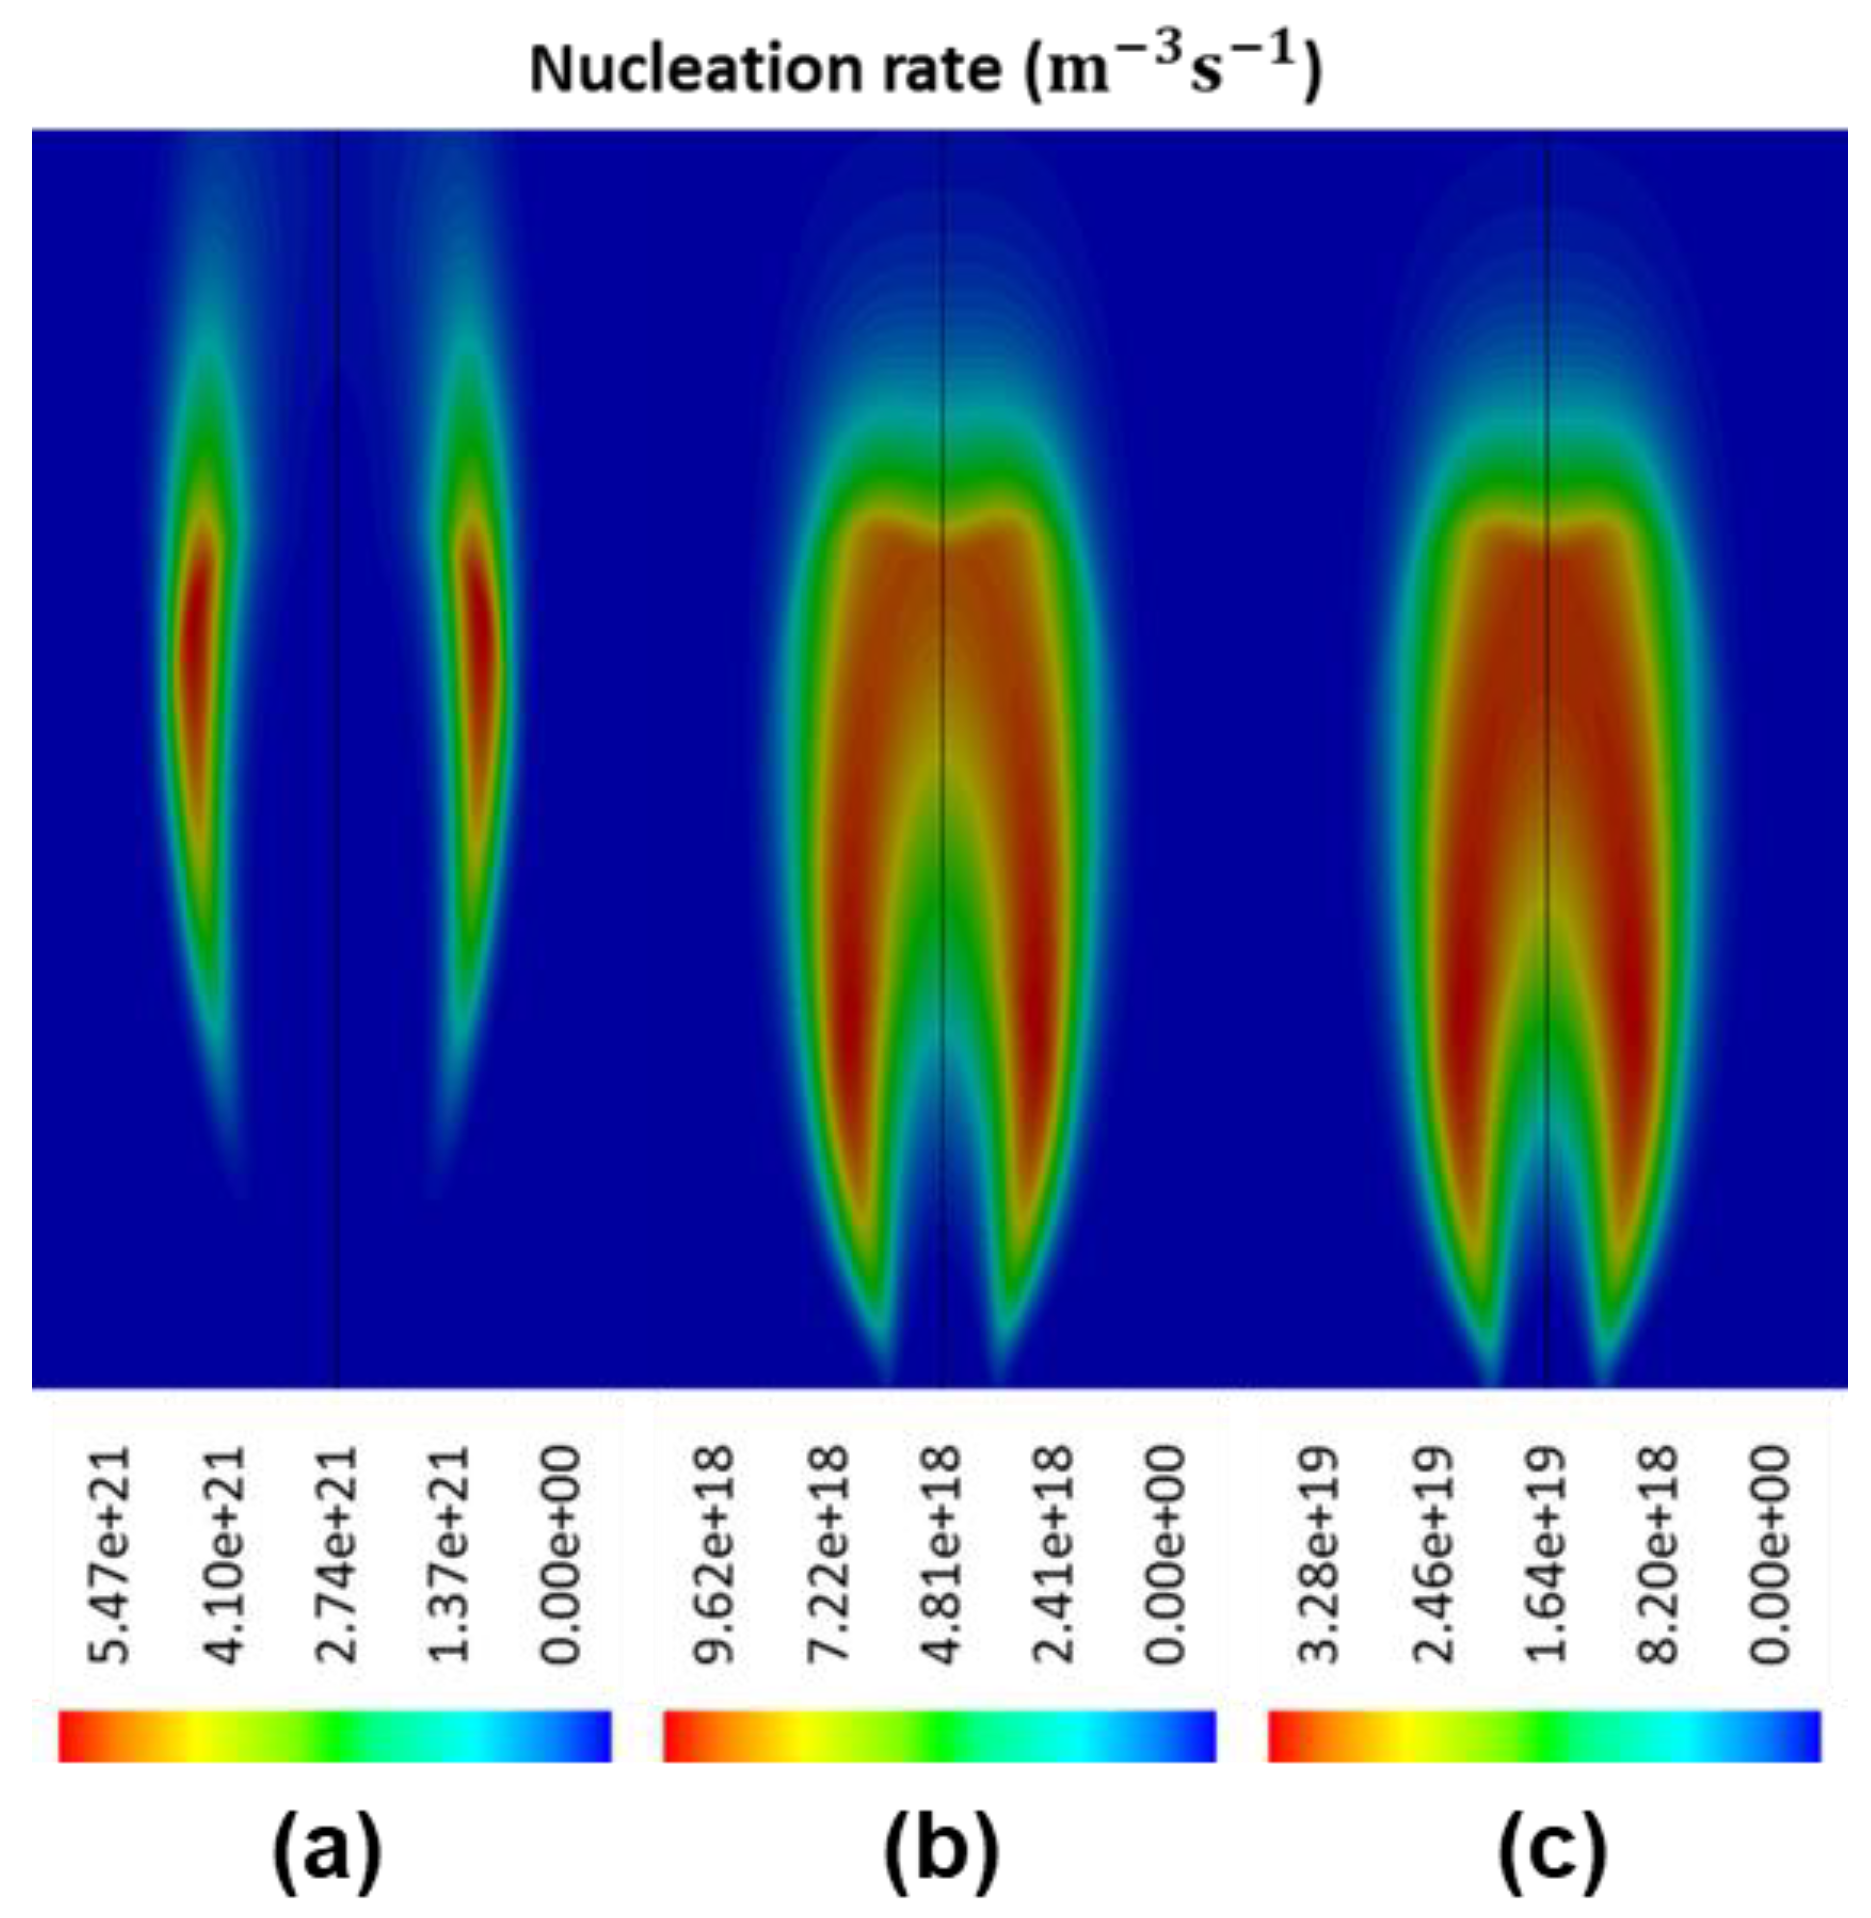
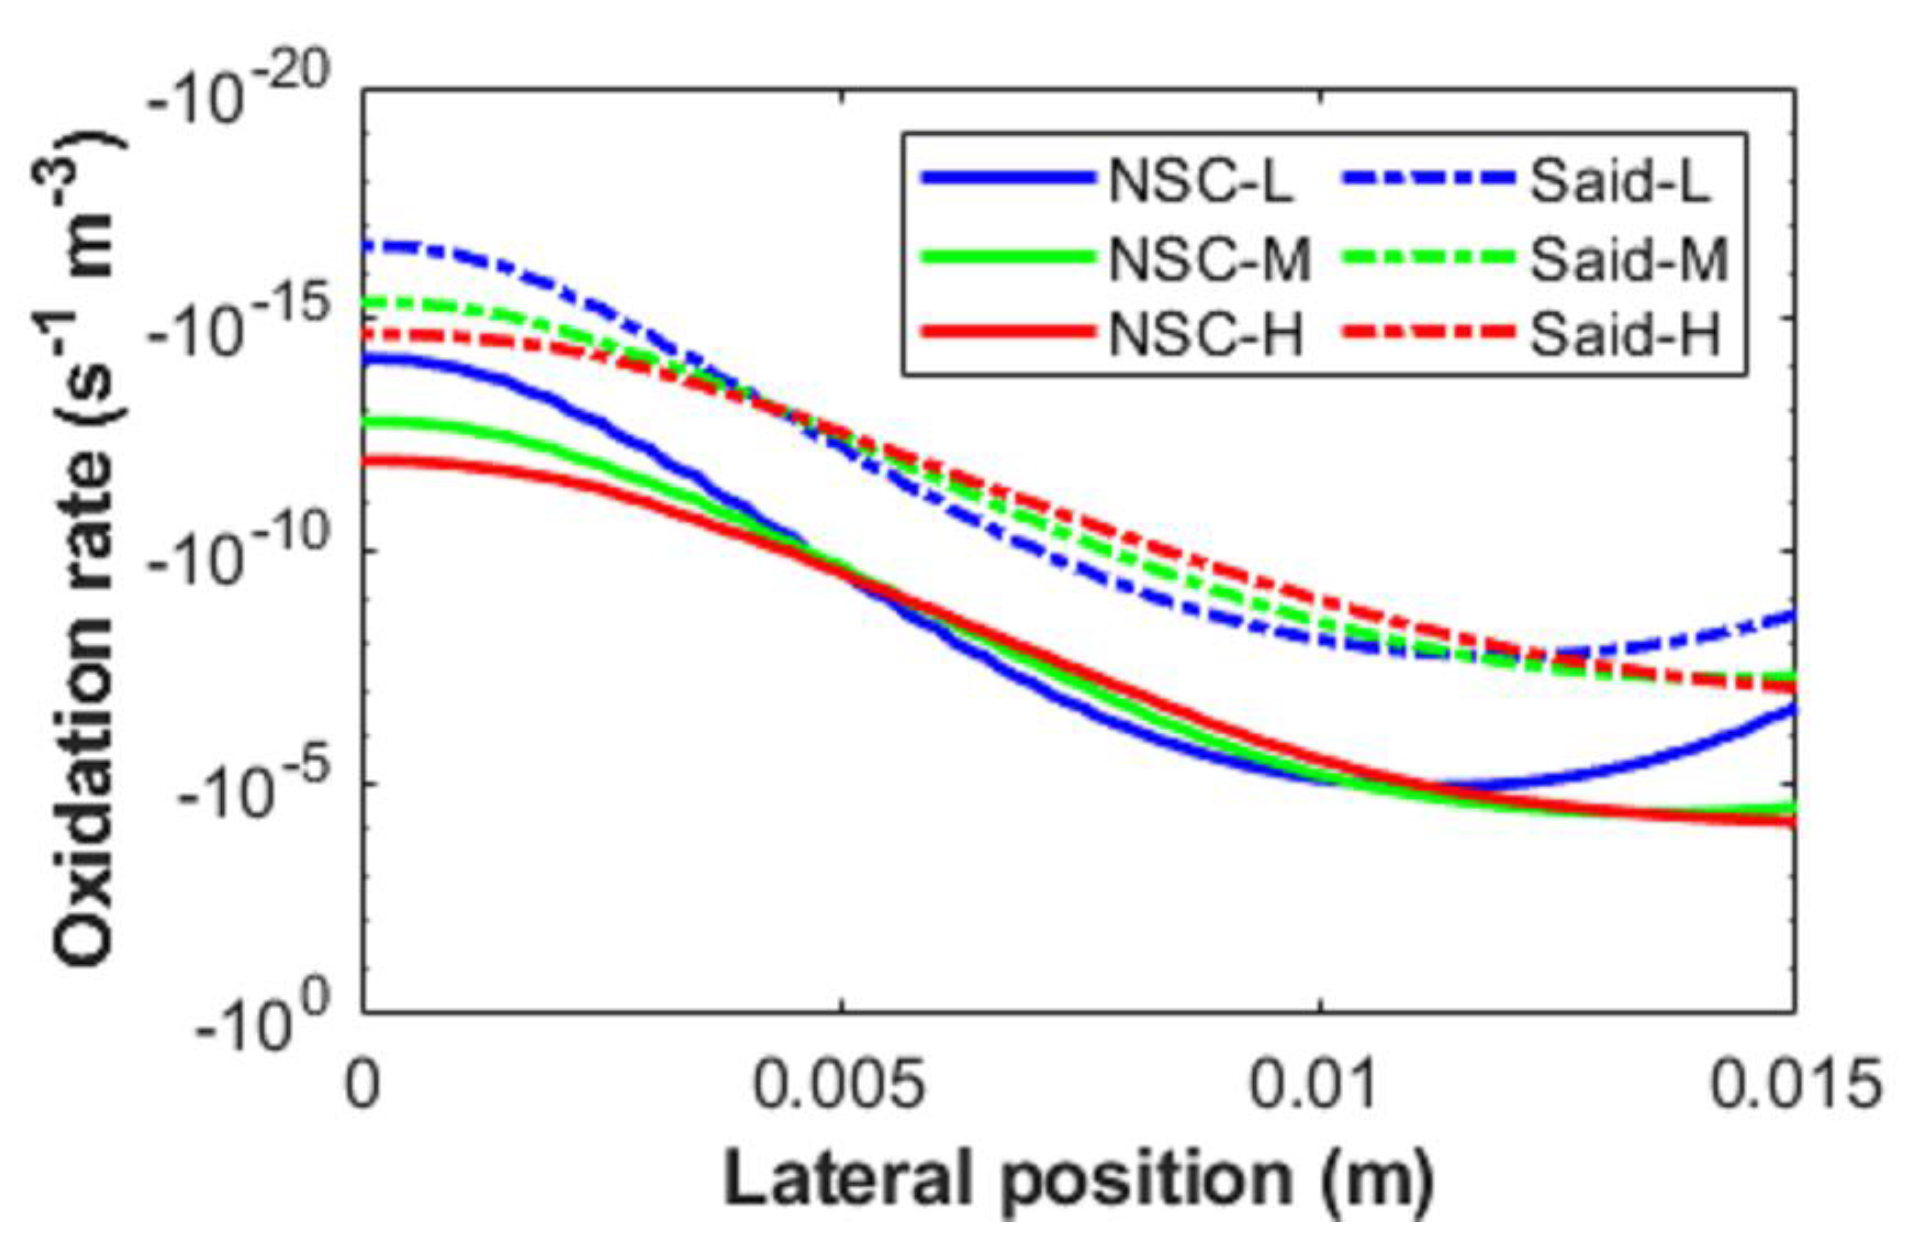
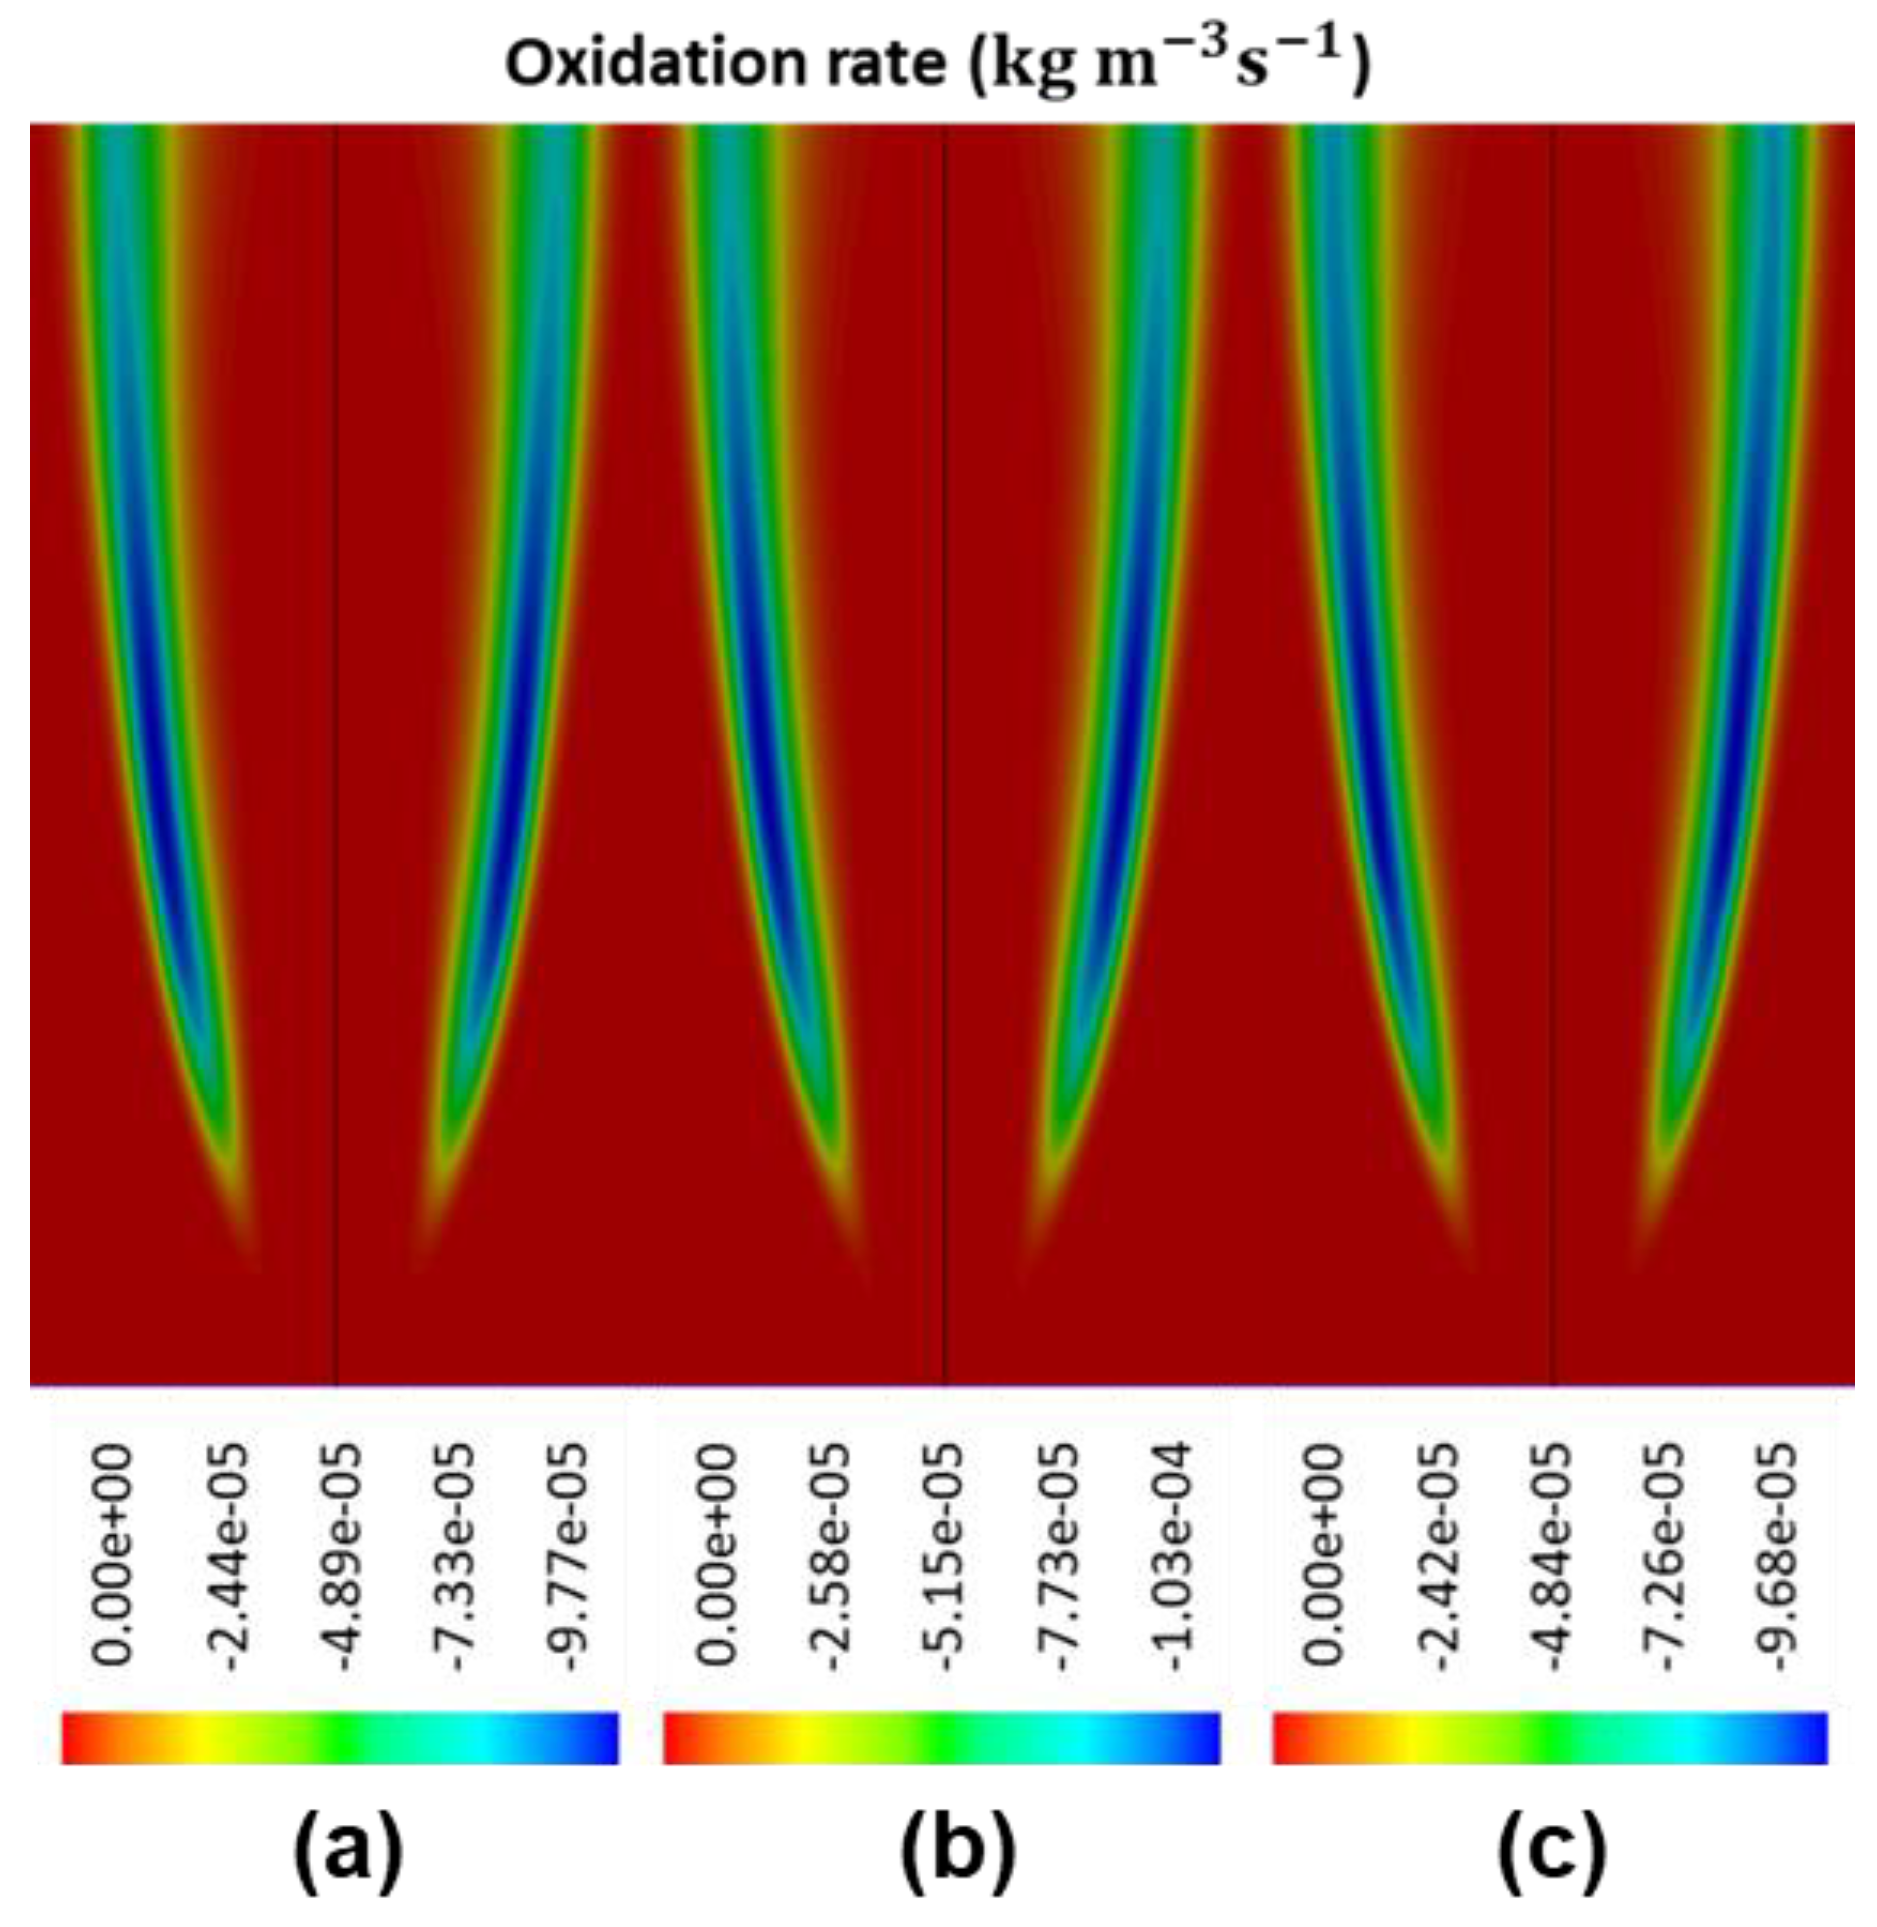
Using the proposed framework, a collection of soot nucleation and oxidation kinetics were numerically investigated and then compared against a self-conducted experiment while using ethylene/air burner with soot diagnostics imaging measurements. When compared with the Leung law and Fairweather law, it was found that the Moss nucleation law provided more accurate prediction of nucleation rate and the subsequent particle number density distribution. The Moss law was capable of limiting the soot inception to high flame temperature region. With regards to oxidation kinetics, the modified NSC law demonstrated better results when compared to the Said law. The modified NSC law constrained the oxidation rate at the surrounding region with the highest concentration of soot particulates, while the Said law under-predicted the oxidation rate at low-intermediate flame heights. In addition, the fractal dimension and Schmidt number were also examined in this study, and it was discovered that the value set of 2.0 and 0.9 yields the best result when compared with the experimental data.
In summary, combining the advantage of the improved DQMOM approach with the detailed chemistry combustion model, the proposed in-house CFD model significantly enhanced the temperature field, intermediate chemical species, and soot yield predictions, as well as providing a more comprehensive physical description of the evolution and disruption processes for soot particles. This enabled a better understanding of the nucleating region for soot particles and it agreed well against the experimental measurements. The high-fidelity prediction of soot particles will be a major advancement that is applicable to the design of fire protection engineering systems, including smoke extraction, curtains, and alarms.

Author Contributions

Conceptualization, A.C.Y.Y., S.C.-P.C. and G.H.Y.; methodology, S.C.-P.C. and G.H.Y.; software, C.W. and T.B.Y.C.; validation, C.W. and A.C.Y.Y.; formal analysis, C.W. and W.Y.; investigation, C.W. and T.B.Y.C.; resources, A.C.Y.Y., Q.N.C. and G.H.Y.; data curation, C.W. and A.C.Y.Y.; writing—original draft, C.W. and T.B.Y.C.; writing—review & editing, A.C.Y.Y., Q.N.C. and Guan Heng Yeoh; visualization, C.W.; supervision, A.C.Y.Y., Q.N.C. and G.H.Y.; project administration, A.C.Y.Y. and T.B.Y.C.; funding acquisition, A.C.Y.Y., Q.N.C., W.Y. and G.H.Y..

Funding

This research was funded by Australian Research Council (ARC Industrial Transformation Training Centre IC170100032), National Natural Science Foundation of China (51403048) and Wuhan Shuanglian-Xingxin Machinery & Equipment Co. Ltd., China.

Acknowledgments

The authors wish to acknowledge the financial support of Australian Research Council (ARC Industrial Transformation Training Centre IC170100032), National Natural Science Foundation of China (51403048) and the Australian Government Research Training Program Scholarship. It is also sponsored by Wuhan Shuanglian-Xingxin Machinery & Equipment Co. Ltd., China. The authors deeply appreciate all financial and technical supports.

Conflicts of Interest

The authors declare no conflict of interest.

References

  1. Wang, H. Formation of nascent soot and other condensed-phase materials in flames. Proc. Combust. Inst. 2011, 33, 41–67. [Google Scholar] [CrossRef]
  2. Tree, D.R.; Svensson, K.I. Soot processes in compression ignition engines. Prog. Energy Combust. Sci. 2007, 33, 272–309. [Google Scholar] [CrossRef]
  3. Silverman, D.T.; Samanic, C.M.; Lubin, J.H.; Blair, A.E.; Stewart, P.A.; Vermeulen, R.; Coble, J.B.; Rothman, N.; Schleiff, P.L.; Travis, W.D.; et al. The diesel exhaust in miners study: A nested case-control study of lung cancer and diesel exhaust. J. Natl. Cancer Inst. 2012, 104, 855–868. [Google Scholar] [CrossRef] [PubMed]
  4. Yuen, A.C.Y.; Yeoh, G.H.; Yuen, R.K.K.; Chen, T. Numerical simulation of a ceiling jet fire in a large compartment. Procedia Eng. 2013, 52, 3–12. [Google Scholar]
  5. Yuen, A.C.Y.; Yeoh, G.H. Numerical simulation of an enclosure fire in a large test hall. Comput. Therm. Sci. 2013, 5, 459–471. [Google Scholar] [CrossRef]
  6. Yang, W.; Tawiah, B.; Yu, C.; Qian, Y.-F.; Wang, L.-L.; Yuen, A.C.-Y.; Zhu, S.-E.; Hu, E.-Z.; Chen, T.B.-Y.; Yu, B.; et al. Manufacturing, mechanical and flame retardant properties of poly(lactic acid) biocomposites based on calcium magnesium phytate and carbon nanotubes. Compos. Part A Appl. Sci. Manuf. 2018, 110, 227–236. [Google Scholar] [CrossRef]
  7. Yang, W.; Yang, W.-J.; Tawiah, B.; Zhang, Y.; Wang, L.-L.; Zhu, S.-E.; Chen, T.B.Y.; Yuen, A.C.Y.; Yu, B.; Liu, Y.-F.; et al. Synthesis of anhydrous manganese hypophosphite microtubes for simultaneous flame retardant and mechanical enhancement on poly(lactic acid). Compos. Sci. Technol. 2018, 164, 44–50. [Google Scholar] [CrossRef]
  8. McEnally, C.S.; Köylü, Ü.Ö.; Pfefferle, L.D.; Rosner, D.E. Soot volume fraction and temperature measurements in laminar nonpremixed flames using thermocouples. Combust. Flame 1997, 109, 701–720. [Google Scholar] [CrossRef]
  9. Michelsen, H.A. Probing soot formation, chemical and physical evolution, and oxidation: A review of in situ diagnostic techniques and needs. Proc. Combust. Inst. 2017, 36, 717–735. [Google Scholar] [CrossRef]
  10. Chan, Q.N.; Medwell, P.R.; Nathan, G.J. Algorithm for soot sheet quantification in a piloted turbulent jet non-premixed natural gas flame. Exp. Fluids 2014, 55, 1827. [Google Scholar] [CrossRef]
  11. Mueller, M.E.; Chan, Q.N.; Qamar, N.H.; Dally, B.B.; Pitsch, H.; Alwahabi, Z.T.; Nathan, G.J. Experimental and computational study of soot evolution in a turbulent nonpremixed bluff body ethylene flame. Combust. Flame 2013, 160, 1298–1309. [Google Scholar] [CrossRef]
  12. Qamar, N.H.; Nathan, G.J.; Alwahabi, Z.T.; Chan, Q.N. Soot sheet dimensions in turbulent nonpremixed flames. Combust. Flame 2011, 158, 2458–2464. [Google Scholar] [CrossRef]
  13. Yeoh, G.H.; Yuen, K.K. Computational Fluid Dynamics in Fire Engineering; Butterworth-Heinemann: Oxford, UK, 2009; ISBN 9780750685894. [Google Scholar]
  14. Li, D.D.; Yeoh, G.H.; Timchenko, V.; Lam, H.F. Numerical Modeling of Magnetic Nanoparticle and Carrier Fluid Interactions under Static and Double-Shear Flows. IEEE Trans. Nanotechnol. 2017, 16, 798–805. [Google Scholar] [CrossRef]
  15. Yuen, A.C.Y.; Yeoh, G.H.; Alexander, B.; Cook, M. Fire scene investigation of an arson fire incident using computational fluid dynamics based fire simulation. Build. Simul. 2014, 7, 477–487. [Google Scholar] [CrossRef]
  16. Cheung, S.C.P.; Yeoh, G.H.; Tu, J.Y. On the modelling of population balance in isothermal vertical bubbly flows-Average bubble number density approach. Chem. Eng. Process. Process Intensif. 2007, 46, 742–756. [Google Scholar] [CrossRef]
  17. Cheung, S.C.P.; Deju, L.; Yeoh, G.H.; Tu, J.Y. Modeling of bubble size distribution in isothermal gas-liquid flows: Numerical assessment of population balance approaches. Nucl. Eng. Des. 2013, 265, 120–136. [Google Scholar] [CrossRef]
  18. Chen, T.B.Y.; Yuen, A.C.Y.; Wang, C.; Yeoh, G.H.; Timchenko, V.; Cheung, S.C.P.; Chan, Q.N.; Yang, W. Predicting the fire spread rate of a sloped pine needle board utilizing pyrolysis modelling with detailed gas-phase combustion. Int. J. Heat Mass Transf. 2018, 125, 310–322. [Google Scholar] [CrossRef]
  19. Chen, T.B.Y.; Yuen, A.C.Y.; Yeoh, G.H.; Timchenko, V.; Cheung, S.C.P.; Chan, Q.N.; Yang, W.; Lu, H. Numerical study of fire spread using the level-set method with large eddy simulation incorporating detailed chemical kinetics gas-phase combustion model. J. Comput. Sci. 2018, 24, 8–23. [Google Scholar] [CrossRef]
  20. Moss, J.B.; Stewart, C.D.; Young, K.J. Modeling soot formation and burnout in a high temperature laminar diffusion flame burning under oxygen-enriched conditions. Combust. Flame 1995, 101, 491–500. [Google Scholar] [CrossRef]
  21. Yuen, A.C.Y.; Yeoh, G.H.; Timchenko, V.; Cheung, S.C.P.; Chan, Q.N.; Chen, T. On the influences of key modelling constants of large eddy simulations for large-scale compartment fires predictions. Int. J. Comut. Fluid Dyn. 2017, 31, 324–337. [Google Scholar] [CrossRef]
  22. Yuen, A.C.Y.; Yeoh, G.H.; Timchenko, V.; Cheung, S.C.P.; Chen, T. Study of three LES subgrid-scale turbulence models for predictions of heat and mass transfer in large-scale compartment fires. Numer. Heat Transf. Part A Appl. 2016, 69, 1223–1241. [Google Scholar] [CrossRef]
  23. Harris, S.J.; Maricq, M.M. The role of fragmentation in defining the signature size distribution of diesel soot. J. Aerosol Sci. 2002, 33, 935–942. [Google Scholar] [CrossRef]
  24. Marchisio, D.L.; Fox, R.O. Solution of population balance equations using the direct quadrature method of moments. J. Aerosol Sci. 2005, 36, 43–73. [Google Scholar] [CrossRef]
  25. Zucca, A.; Marchisio, D.L.; Vanni, M.; Barresi, A.A. Validation of bivariate DQMOM for nanoparticle processes simulation. AIChE J. 2007, 53, 918–931. [Google Scholar] [CrossRef]
  26. Zucca, A.; Marchisio, D.L.; Barresi, A.A.; Fox, R.O. Implementation of the population balance equation in CFD codes for modelling soot formation in turbulent flames. Chem. Eng. Sci. 2006, 61, 87–95. [Google Scholar] [CrossRef]
  27. Marchisio, D.L.; Barresi, A.A. Investigation of soot formation in turbulent flames with a pseudo-bivariate population balance model. Chem. Eng. Sci. 2009, 64, 294–303. [Google Scholar] [CrossRef]
  28. Chittipotula, T.; Janiga, G.; Thévenin, D. Improved soot prediction models for turbulent non-premixed ethylene/air flames. Proc. Combust. Inst. 2011, 33, 559–567. [Google Scholar] [CrossRef]
  29. Mueller, M.E.; Blanquart, G.; Pitsch, H. Hybrid Method of Moments for modeling soot formation and growth. Combust. Flame 2009, 156, 1143–1155. [Google Scholar] [CrossRef]
  30. Yuen, A.; Chen, T.; Yang, W.; Wang, C.; Li, A.; Yeoh, G.; Chan, Q.; Chan, M. Natural Ventilated Smoke Control Simulation Case Study Using Different Settings of Smoke Vents and Curtains in a Large Atrium. Fire 2019, 2, 7. [Google Scholar] [CrossRef]
  31. Yuen, A.C.Y.; Yeoh, G.H.; Timchenko, V.; Barber, T. LES and multi-step chemical reaction in compartment fires. Numer. Heat Transf. Part A Appl. 2015, 68, 711–736. [Google Scholar] [CrossRef]
  32. Kee, R.J.; Rupley, F.M.; Miller, J.A.; Coltrin, M.E.; Grcar, J.F.; Meeks, E.; Moffat, H.K.; Lutz, A.E.; Dixon-Lewis, G.; Smooke, M.D.; et al. CHEMKIN Collection Release 3.6; Reaction Design: San Diego, CA, USA, 2000. [Google Scholar]
  33. Yuen, A.C.Y.; Yeoh, G.H.; Timchenko, V.; Cheung, S.C.P.; Barber, T.J. Importance of detailed chemical kinetics on combustion and soot modelling of ventilated and under-ventilated fires in compartment. Int. J. Heat Mass Transf. 2016, 96, 171–188. [Google Scholar] [CrossRef]
  34. Köylü, Ü.Ö.; McEnally, C.S.; Rosner, D.E.; Pfefferle, L.D. Simultaneous measurements of soot volume fraction and particle size/microstructure in flames using a thermophoretic sampling technique. Combust. Flame 1997, 110, 494–507. [Google Scholar] [CrossRef]
  35. Yuen, A.C.Y.; Yeoh, G.H.; Timchenko, V.; Chen, T.B.Y.; Chan, Q.N.; Wang, C.; Li, D.D. Comparison of detailed soot formation models for sooty and non-sooty flames in an under-ventilated ISO room. Int. J. Heat Mass Transf. 2017, 115, 717–729. [Google Scholar] [CrossRef]
  36. Kholghy, M.; Saffaripour, M.; Yip, C.; Thomson, M.J. The evolution of soot morphology in a laminar coflow diffusion flame of a surrogate for Jet A-1. Combust. Flame 2013, 160, 2119–2130. [Google Scholar] [CrossRef]
  37. Saffaripour, M.; Veshkini, A.; Kholghy, M.; Thomson, M.J. Experimental investigation and detailed modeling of soot aggregate formation and size distribution in laminar coflow diffusion flames of Jet A-1, a synthetic kerosene, and n-decane. Combust. Flame 2014, 161, 848–863. [Google Scholar] [CrossRef]
  38. Schulz, C.; Kock, B.F.; Hofmann, M.; Michelsen, H.; Will, S.; Bougie, B.; Suntz, R.; Smallwood, G. Laser-induced incandescence: Recent trends and current questions. Appl. Phys. B Lasers Opt. 2006, 83, 333–354. [Google Scholar] [CrossRef]
  39. Johansson, K.O.; Head-Gordon, M.P.; Schrader, P.E.; Wilson, K.R.; Michelsen, H.A. Resonance-stabilized hydrocarbon-radical chain reactions may explain soot inception and growth. Science 2018, 361, 997–1000. [Google Scholar] [CrossRef]
  40. Liu, F.; Guo, H.; Smallwood, G.; Gulder, O. Numerical modelling of soot formation and oxidation in laminar coflow non-smoking and smoking ethylene diffusion flames. Combust. Theory Model. 2003, 7, 301–315. [Google Scholar] [CrossRef]
  41. Fuchs, N.A. The mechanics of aerosols. Q. J. R. Meteorol. Soc. 1965, 91, 249. [Google Scholar] [CrossRef]
  42. Leung, K.M.; Lindstedt, R.P.; Jones, W.P. A simplified reaction mechanism for soot formation in nonpremixed flames. Combust. Flame 1991, 87, 289–305. [Google Scholar] [CrossRef]
  43. Said, R.; Garo, A.; Borghi, R. Soot formation modeling for turbulent flames. Combust. Flame 1997, 108, 71–86. [Google Scholar] [CrossRef]
  44. Kent, J.H.; Wagner, H.G. Why do Diffusion Flames Emit Smoke? Combust. Sci. Technol. 1984, 41, 245–269. [Google Scholar] [CrossRef]
  45. Chan, M.L.; Moody, K.N.; Mullins, J.R.; Williams, A. Low-temperature oxidation of soot. Fuel 1987, 66, 1694–1698. [Google Scholar] [CrossRef]
  46. Gordon, R.G. Error Bounds in Equilibrium Statistical Mechanics. J. Math. Phys. 1968, 9, 655–663. [Google Scholar] [CrossRef]
  47. Wang, C.; Chan, Q.N.; Zhang, R.; Kook, S.; Hawkes, E.R.; Yeoh, G.H.; Medwell, P.R. Automated determination of size and morphology information from soot transmission electron microscope (TEM)-generated images. J. Nanoparticle Res. 2016, 18, 127. [Google Scholar] [CrossRef]
  48. Wang, C.; Chan, Q.N.; Kook, S.; Hawkes, E.R.; Lee, J.; Medwell, P.R. External irradiation effect on the growth and evolution of in-flame soot species. Carbon N. Y. 2016, 102, 161–171. [Google Scholar] [CrossRef]
  49. Kook, S.; Zhang, R.; Chan, Q.N.; Aizawa, T.; Kondo, K.; Pickett, L.M.; Cenker, E.; Bruneaux, G.; Andersson, O.; Pagels, J.; et al. Automated detection of primary particles from transmission electron microscope (TEM) images of soot aggregates in diesel engine environments. SAE Int. J. Engines 2015, 9, 279–296. [Google Scholar] [CrossRef]
  50. Sunderland, P.B.; Köylü, Ü.Ö.; Faeth, G.M. Soot formation in weakly buoyant acetylene-fueled laminar jet diffusion flames burning in air. Combust. Flame 1995, 100, 310–322. [Google Scholar] [CrossRef]
  51. Kent, J.H.; Jander, H.; Wagner, H.G. Soot formation in a laminar diffusion flame. Symp. Combust. 1981, 18, 1117–1126. [Google Scholar] [CrossRef]
  52. Kholghy, M. The Evolution of Soot Morphology in Laminar Co-Flow Diffusion Flames of the Surrogates for Jet A-1 and a Synthetic Kerosene. Master’s Thesis, University of Toronto, Toronto, ON, Canada, 2012. [Google Scholar]
  53. Medwell, P.R.; Nathan, G.J.; Chan, Q.N.; Alwahabi, Z.T.; Dally, B.B. The influence on the soot distribution within a laminar flame of radiation at fluxes of relevance to concentrated solar radiation. Combust. Flame 2011, 158, 1814–1821. [Google Scholar] [CrossRef]
  54. Lapuerta, M.; Ballesteros, R.; Martos, F.J. A method to determine the fractal dimension of diesel soot agglomerates. J. Colloid Interface Sci. 2006, 303, 149–158. [Google Scholar] [CrossRef] [PubMed]
  55. Zhang, R.; Kook, S. Influence of fuel injection timing and pressure on in-flame soot particles in an automotive-size diesel engine. Environ. Sci. Technol. 2014, 48, 8243–8250. [Google Scholar] [CrossRef] [PubMed]
  56. Le, M.K.; Zhang, Y.; Zhang, R.; Rao, L.; Kook, S.; Chan, Q.N.; Hawkes, E.R. Effect of jet-jet interactions on soot formation in a small-bore diesel engine. Proc. Combust. Inst. 2017, 36, 3559–3566. [Google Scholar] [CrossRef]
  57. Köylü, Ü.Ö.; Faeth, G.M.; Farias, T.L.; Carvalho, M.G. Fractal and projected structure properties of soot aggregates. Combust. Flame 1995, 100, 621–633. [Google Scholar] [CrossRef]
  58. Jiang, L.Y.; Campbell, I. Prandtl/Schmidt number effect on temperature distribution in a generic combustor. Int. J. Therm. Sci. 2009, 48, 322–330. [Google Scholar] [CrossRef]
Figure 1. Flamelet profiles applied in the combustion model for: (a) Major chemical species; (b) Minor and intermediate chemical species for scalar dissipation rates of 0.01 (near chemical equilibrium) and 180 (approaching flame extinction).
Energies 12 00910 g001
Figure 2. (a) Temperature contour plot and (b) comparisons of numerical and experimental temperature distributions at three vertical height levels above the burner.
Energies 12 00910 g002
Figure 3. Contour plot of the mole fraction of reacting species: (a) ethylene, X C 2 H 4 ; (b) acetylene, X C 2 H 2 ; and, (c) oxygen, X O 2 .
Energies 12 00910 g003
Figure 4. Contour plot of nucleation rate, evaluated from: (a) Moss law; (b) Leung law; and, (c) Fairweather law.
Energies 12 00910 g004
Figure 5. Contour plot of soot number density, evaluated from: (a) Moss law; (b) Leung law; and, (c) Fairweather law.
Energies 12 00910 g005
Figure 6. X-Y plot of soot particle size at selected height above burners (HABs), evaluated from: (a) Moss law; (b) Leung law; and, (c) Fairweather law as compared with experimental result.
Energies 12 00910 g006
Figure 7. X-Y plot of soot volume fraction at selected HABs, evaluated from: (a) Moss law; (b) Leung law; and, (c) Fairweather law compared with experimental result.
Energies 12 00910 g007
Figure 8. Contour plot of oxidation rate, evaluated from: (a) modified NSC law and (b) Said law.
Energies 12 00910 g008
Figure 9. X-Y plot of oxidation rate at selected HABs, as evaluated from modified NSC law and Said law.
Energies 12 00910 g009
Figure 10. Contour plot of soot particle size, evaluated from: (a) modified NSC law and (b) Said law.
Energies 12 00910 g010
Figure 11. Contour plot of soot volume fraction, evaluated from: (a) modified NSC law and (b) Said law.
Energies 12 00910 g011
Figure 12. Contour plot of oxidation rate, evaluated from: fractal dimension of (a) 2.0, (b) 1.8, and (c) 2.2.
Energies 12 00910 g012
Figure 13. Contour plot of surface growth rate evaluated from: fractal dimension of (a) 2.0, (b) 1.8, and (c) 2.2.
Energies 12 00910 g013
Figure 14. Contour plot of soot particle size, evaluated from: fractal dimension of (a) 2.0, (b) 1.8, and (c) 2.2, and X-Y plot of soot particle size at selected HABs, evaluated from: fractal dimension of (d) 2.0, (e) 1.8, and (f) 2.2 as compared with experimental result.
Energies 12 00910 g014
Figure 15. Contour plot of soot volume fraction, evaluated from: fractal dimension of (a) 2.0, (b) 1.8, and (c) 2.2, and X-Y plot of soot volume fraction at selected HABs, evaluated from: fractal dimension of (d) 2.0, (e) 1.8, and (f) 2.2 as compared with experimental result.
Energies 12 00910 g015
Figure 16. Contour plot of soot number density, evaluated from: Schmidt number of (a) 0.7, (b) 0.5, and (c) 0.9.
Energies 12 00910 g016
Figure 17. X-Y plot of soot number density at selected HABs: (a) 20mm HAB, (b) 30mm HAB, and (c) 40mm HAB.
Energies 12 00910 g017
Figure 18. Contour plot of soot particle size, evaluated from: Schmidt number of (a) 0.7, (b) 0.5, and (c) 0.9, and X-Y plot of soot particle size at selected HABs, evaluated from: Schmidt number of (d) 0.7, (e) 0.5, and (f) 0.9 as compared with experimental result.
Energies 12 00910 g018
Figure 19. Contour plot of soot volume fraction, evaluated from: Schmidt number of (a) 0.7, (b) 0.5, and (c) 0.9, and X-Y plot of soot volume fraction at selected HABs, evaluated from: Schmidt number of (d) 0.7, (e) 0.5, and (f) 0.9 as compared with experimental result.
Energies 12 00910 g019
Table 1. Summary of cases in the parametric study performed in this work.
CaseNucleationOxidationFractal dimensionSchmidt Number
AMossmodified NSC2.00.7
BLeungmodified NSC2.00.7
CFairweather modified NSC2.00.7
DMossSaid2.00.7
EMossmodified NSC1.80.7
FMossmodified NSC2.20.7
GMossmodified NSC2.00.5
HMossmodified NSC2.00.9

