Article

Probabilistic Hosting Capacity Enhancement in Non-Sinusoidal Power Distribution Systems Using a Hybrid PSOGSA Optimization Algorithm

by
Sherif M. Ismael
1,*,
Shady H. E. Abdel Aleem
2,
Almoataz Y. Abdelaziz
3 and
Ahmed F. Zobaa
4,*
1
Engineering for the Petroleum and Process Industries (Enppi), Cairo 11361, Egypt
2
15th of May Higher Institute of Engineering, Mathematical and Physical Sciences, Helwan, Cairo 11731, Egypt
3
Faculty of Engineering and Technology, Future University in Egypt, Cairo 11835, Egypt
4
College of Engineering, Design & Physical Sciences, Brunel University London, Uxbridge UB8 3PH, UK
*
Authors to whom correspondence should be addressed.
Energies 2019, 12(6), 1018; https://doi.org/10.3390/en12061018
Submission received: 25 January 2019 / Revised: 10 March 2019 / Accepted: 11 March 2019 / Published: 15 March 2019

Abstract

:
The high penetration of distributed generation (DG) units with their power-electronic interfaces may lead to various power quality problems, such as excessive harmonic distortions and increased non-sinusoidal power losses. In this paper, the probabilistic hosting capacity (PHC) due to the high penetration of photovoltaic units in a non-sinusoidal power distribution system is investigated. A C-type harmonic filter is proposed, to maximize the harmonic-constrained PHC. An optimization problem is formulated by using a Monte Carlo simulation, taking into account various uncertain parameters, such as the intermittent output power of the DGs, background voltage harmonics, load alteration, and the filter parameters’ variations. In addition, different operational constraints have been considered, such as the bus voltage, line thermal capacity, power factor, and individual and total harmonic distortion limits. A swarm-based, meta-heuristic optimization algorithm known as the hybrid particle swarm optimization and gravitational search algorithm (PSOGSA) has been examined for the optimal design of the proposed filter. Besides, other optimization algorithms were examined for validation of the solution. The PHC results obtained are compared with the conventional deterministic HC (DHC) results, and it is found that the PHC levels are higher than those obtained by conservative HC procedures, practical rules of thumb, and the DHC approaches.

1. Introduction

Renewable energy resources play a vital role in current energy systems, driven by their sustainability, eco-friendliness, and techno-economic advantages [1,2]. Nowadays, the energy generation mix has been upgraded in many countries such as Germany, Australia, and the United Kingdom, to include more renewable distributed generation (DG) units instead of the conventional fossil-fuel-based resources, to solve various challenges such as future energy needs, remarkable oil price fluctuations, increasing risks of fossil-fuel pollution, and energy conservation strategies, to minimize transmission and to distribution network losses [3,4,5]. Consequently, the liberalization of electric energy markets has led to an augmented integration of DG units, such as photovoltaics (PV) and wind turbines (WT) in today’s power systems [6]. However, unplanned and excessive penetration of DG may turn its advantages into disadvantages with possible operational hazards such as increased overvoltage risks, overloading of electrical equipment, and reversal power flows, with negative impacts on the network’s protection schemes, and power quality (PQ) problems.
Electrical systems are highly vulnerable to these risks when DG penetration exceeds the maximum allowable level that ensures safe and reliable operation, the so-called system hosting capacity (HC) limit. Simply, HC analysis is of paramount importance to modern network planners and operators, in order to gain clear insight into fast-changing electrical networks that are subject to the high penetration of DGs of intermittent and unpredictable natures [7,8]. In this context, electric utilities and DG investors have paid much attention to HC enhancements, to allow greater DG integration, while ensuring safe and reliable network operation. In the near-past, different rules of thumb were used as quick DG assessment tools by distribution system operators (DSOs) in many countries, to evaluate DG integration requests. These practical rules can be categorized into three main types, based on the loading/generation ratio, short-circuit capacity considerations, and thermal capacities of equipment [1,2]. For example, South Africa uses a rule that the total DG capacities should not exceed 15% of the feeder ultimate load, complying with the loading/generation ratio. South Korea uses a rule that limits the connected DG capacities not to surpass 20% of the feeding distribution transformer rating complying with the thermal capacity of the network component, and Spain imposes a rule that the sum of the integrated DG capacities should not exceed 10% of the short-circuit thermal capability at the point of common coupling (PCC) [2].
Various methodologies have been investigated to enhance network HC [9] and can be categorized into six types, namely (1) reactive power control, (2) voltage control through on-load tap changer transformers (OLTC), (3) system reinforcement and reconfiguration, (4) energy storage technologies, (5) active power curtailment, and (6) harmonics mitigation techniques [1]. Reactive power control was found to be one of the most efficient HC enhancement techniques, as it overcomes the overvoltage problems arising from high DG penetration. Several reactive power control methods are used such as shunt capacitor banks, static Var compensators (SVC), and DG units controlled by smart inverters [10,11,12]. Usually, primary distribution transformer substations are managed by using OLTC transformers. Recently, many researchers have found that the optimal control of OLTCs has beneficial effects on enhancing the system voltage profile, thus increasing the system’s HC [13,14,15,16]. Also, distribution system reconfiguration and reinforcement are competent methodologies for HC enhancement. HC enhancement via static and dynamic methodologies was examined in [17,18,19] to reconfigure power systems with renewable energy resources. Besides, HC enhancement using the optimal conductor reinforcement framework was proposed in [20], and a new feeder reinforcement index (FRI) was proposed, to support the DSOs and network designers in determining the priority plan for the feeders’ reinforcement. It was found that the introduced reinforcement approach attained higher HC levels, compared to conventional techniques. Furthermore, energy storage systems (ESSs) allow for efficient decoupling between the load demand and energy generation. Therefore, they may help in mitigating the overvoltage arising from excessive DG integration and enhancing the system’s HC, as well as having well-known benefits such as voltage control, power loss reduction, and peak demand shedding [21,22,23]. Also, active power curtailment techniques are applied to large-scale DG units where utilities can dispatch (curtail) the output power of these units to match the demand requirements, in order to comply with the operational limits of the power system. Many curtailment techniques have been presented in the literature, such as soft and hard curtailment techniques in [24], and fixed curtailment and voltage-dependent volt/watt control methodologies in [25]. A comprehensive review of the state-of-the-art of the HC assessment and enhancement in modern power systems can be found in [1].
From a PQ perspective, on one hand, the rapidly rising adoption of nonlinear loads, such as variable frequency drives (VFDs) have a remarkable impact on the PQ of electrical distribution systems. On the other hand, the integration of large-scale grid-integrated DG systems, with their power electronic-based interfaces, may lead to highly distorted power distribution systems. Therefore, various harmonic mitigation techniques have been proposed, to enhance harmonic-constrained HCs to comply with international PQ limits, such as single-tuned passive filters in [8], C-type passive filters in [7], and active harmonic filters in [26]. In addition, inter- and supra-harmonics and their impacts on HC assessment were examined in [27]. However, a dynamic framework that employs numerous uncertain parameters such as variable DG-produced power caused by climate fluctuations, the uncertainty of DG integration location and unit ratings, daily load profile variations, and uncertainties in network modeling in the case of the absence of confirmed real-time measurements is required to express HC better. In this regard, it was found that that deterministic HC (DHC) assessment methodologies only show a conservative (worst-case) figure for a network’s capability to host more DG units [28]. For that reason, recent studies have started to use the probabilistic hosting capacity (PHC), unlike DHC studies, which ignore the uncertainty of the electrical parameters [29,30]. The Monte Carlo simulation (MCS) is commonly used to handle the uncertainty of electrical parameters [31].
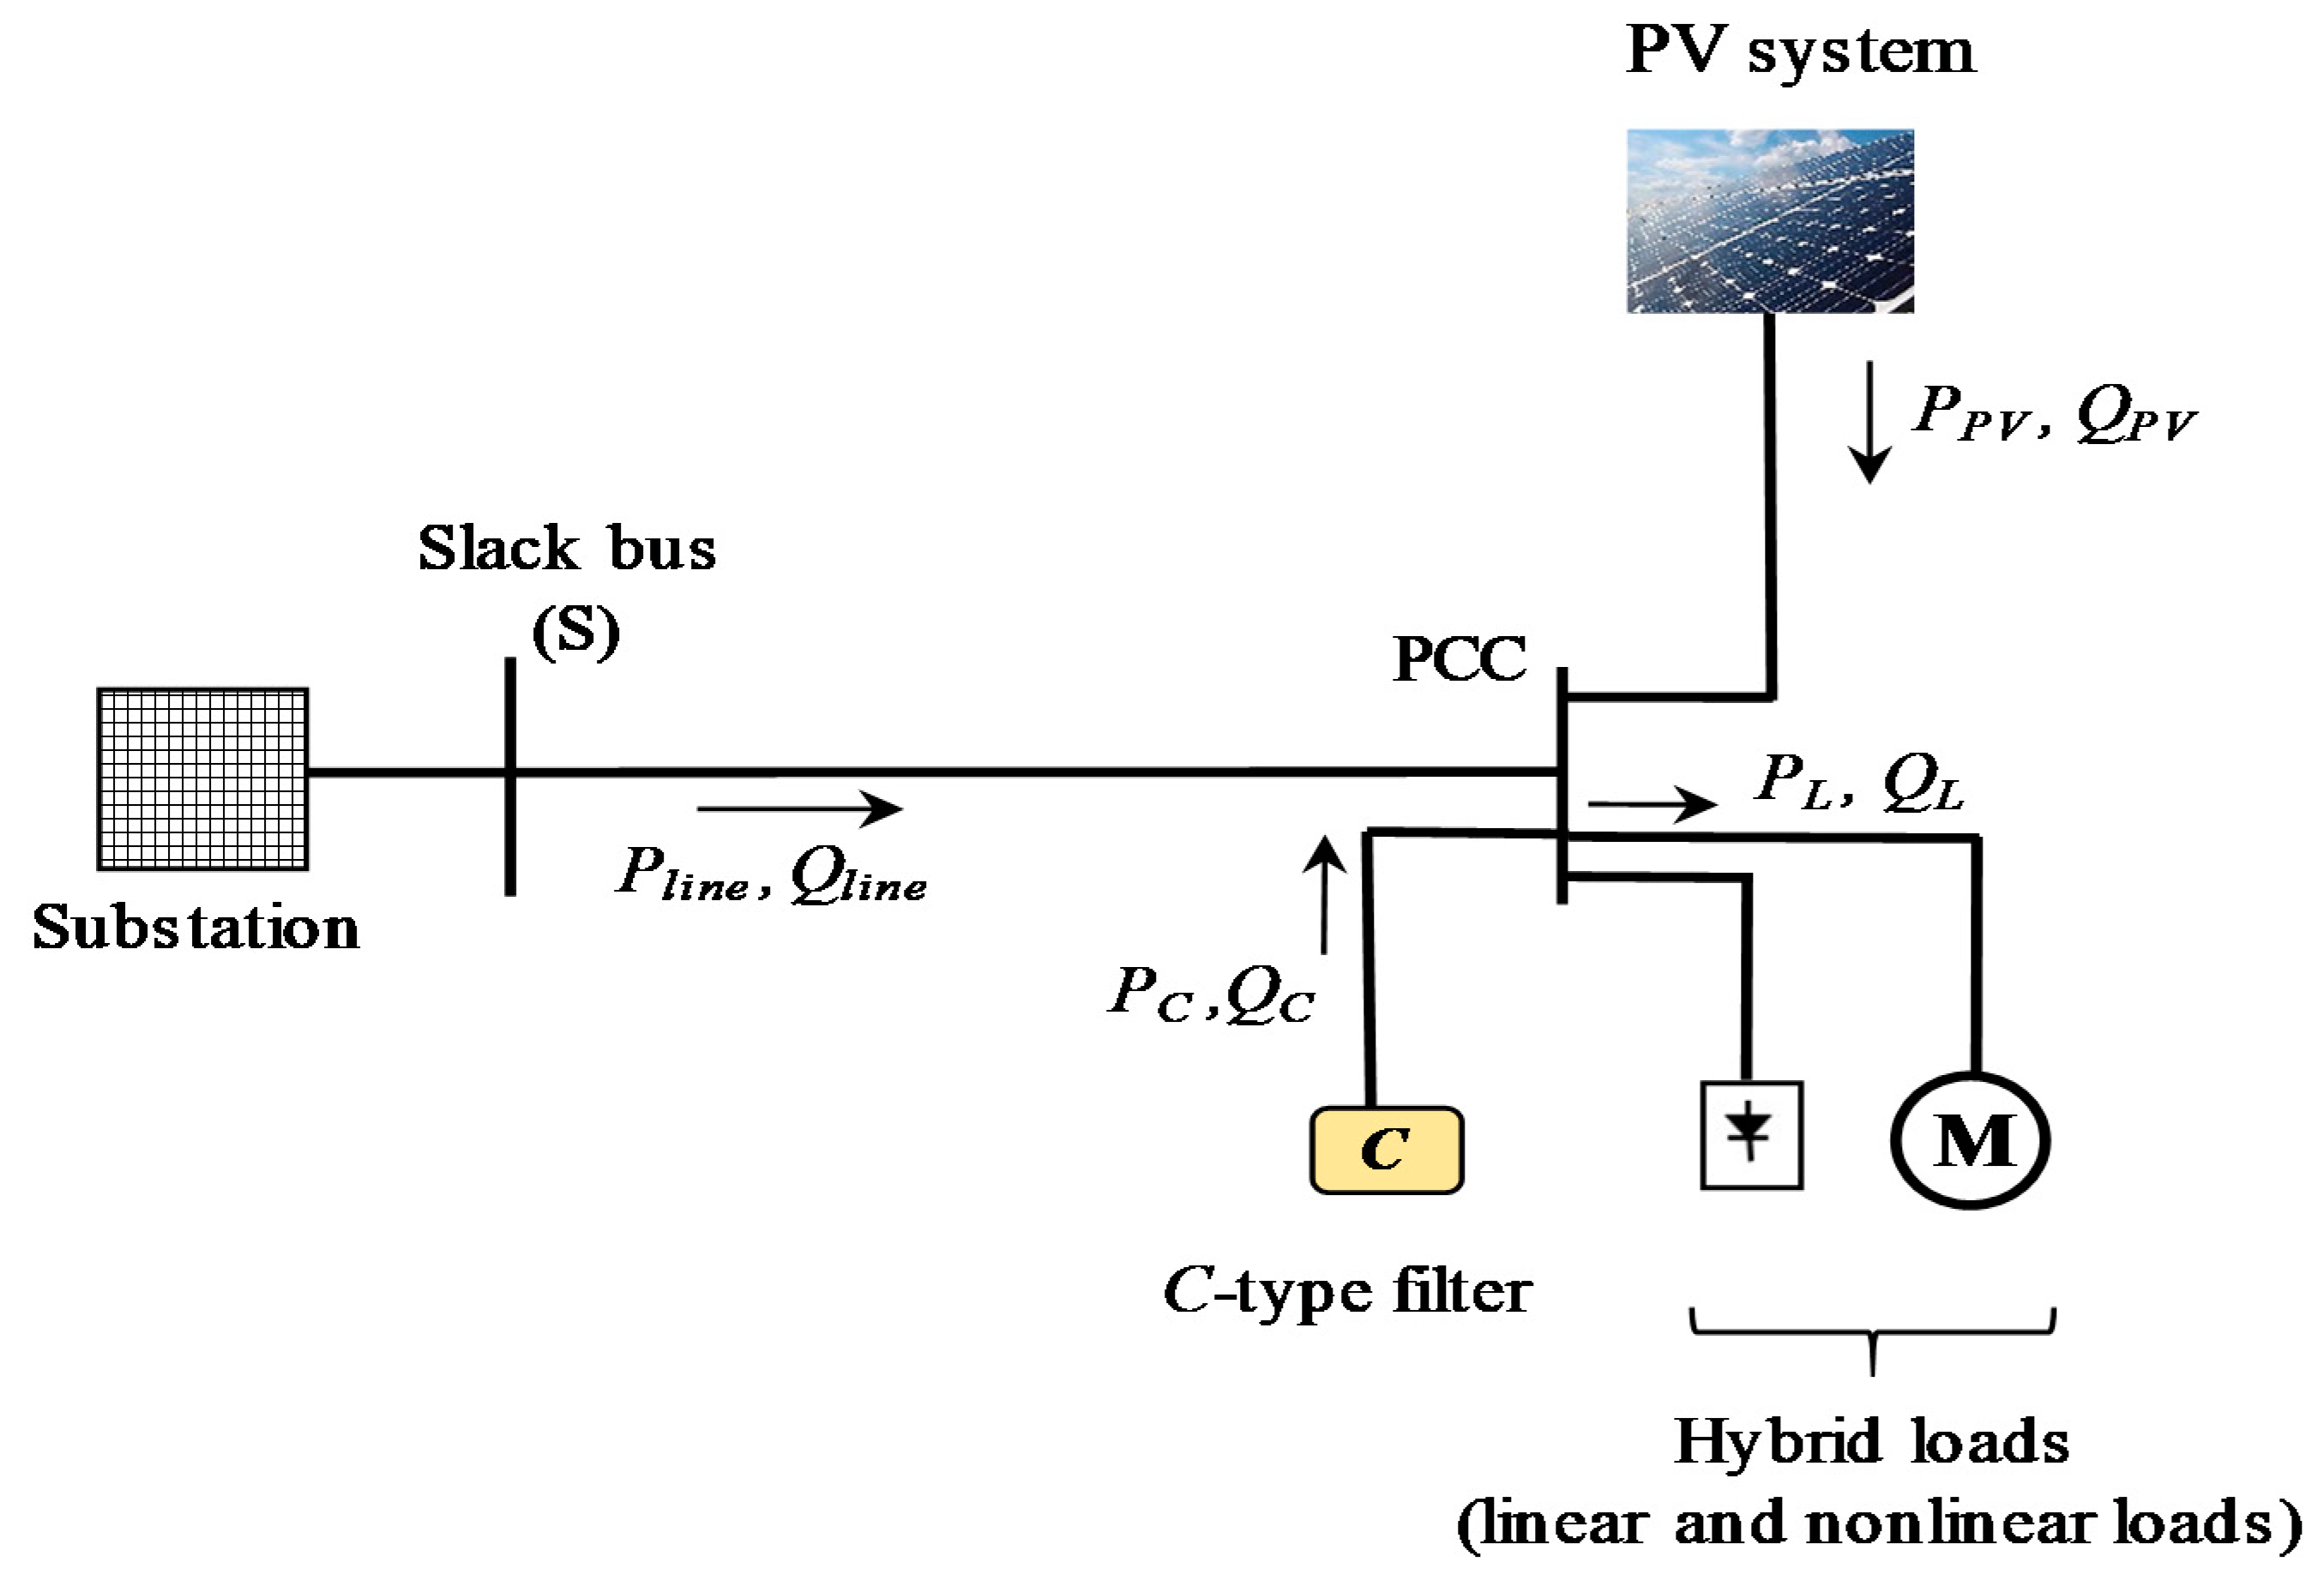
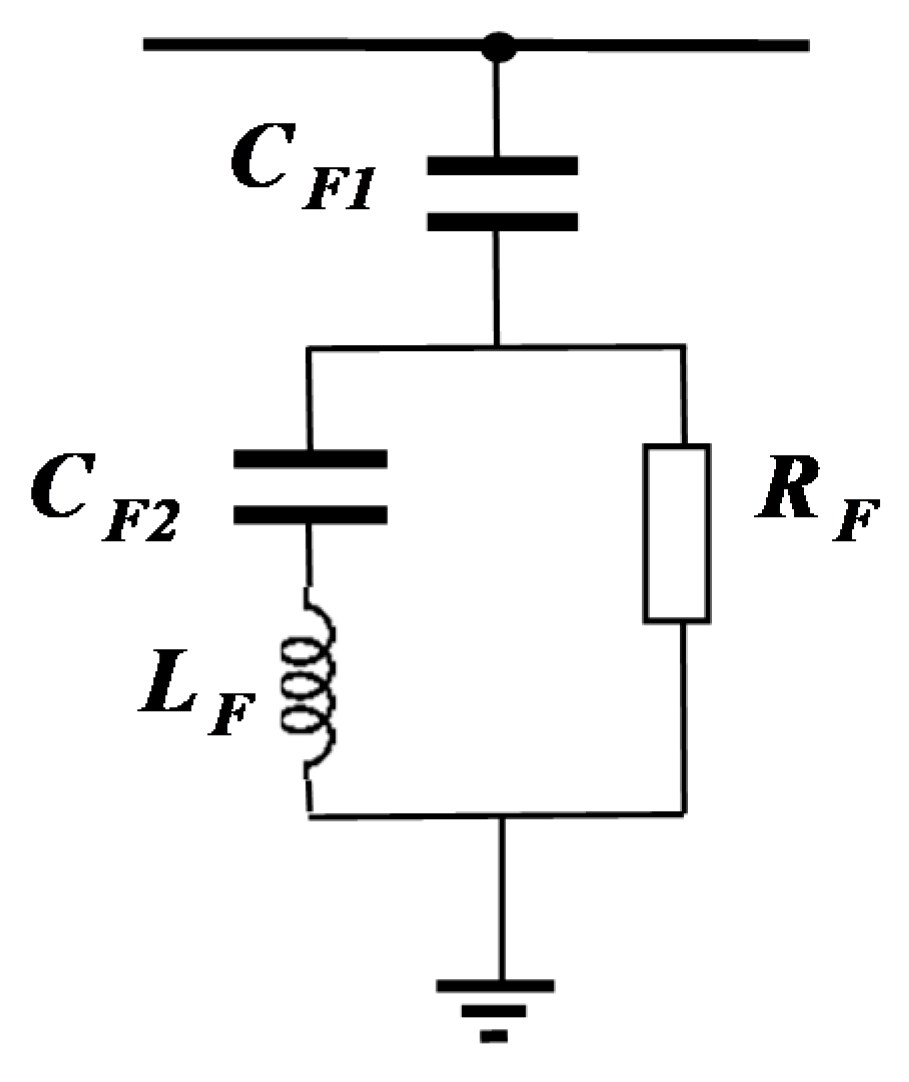
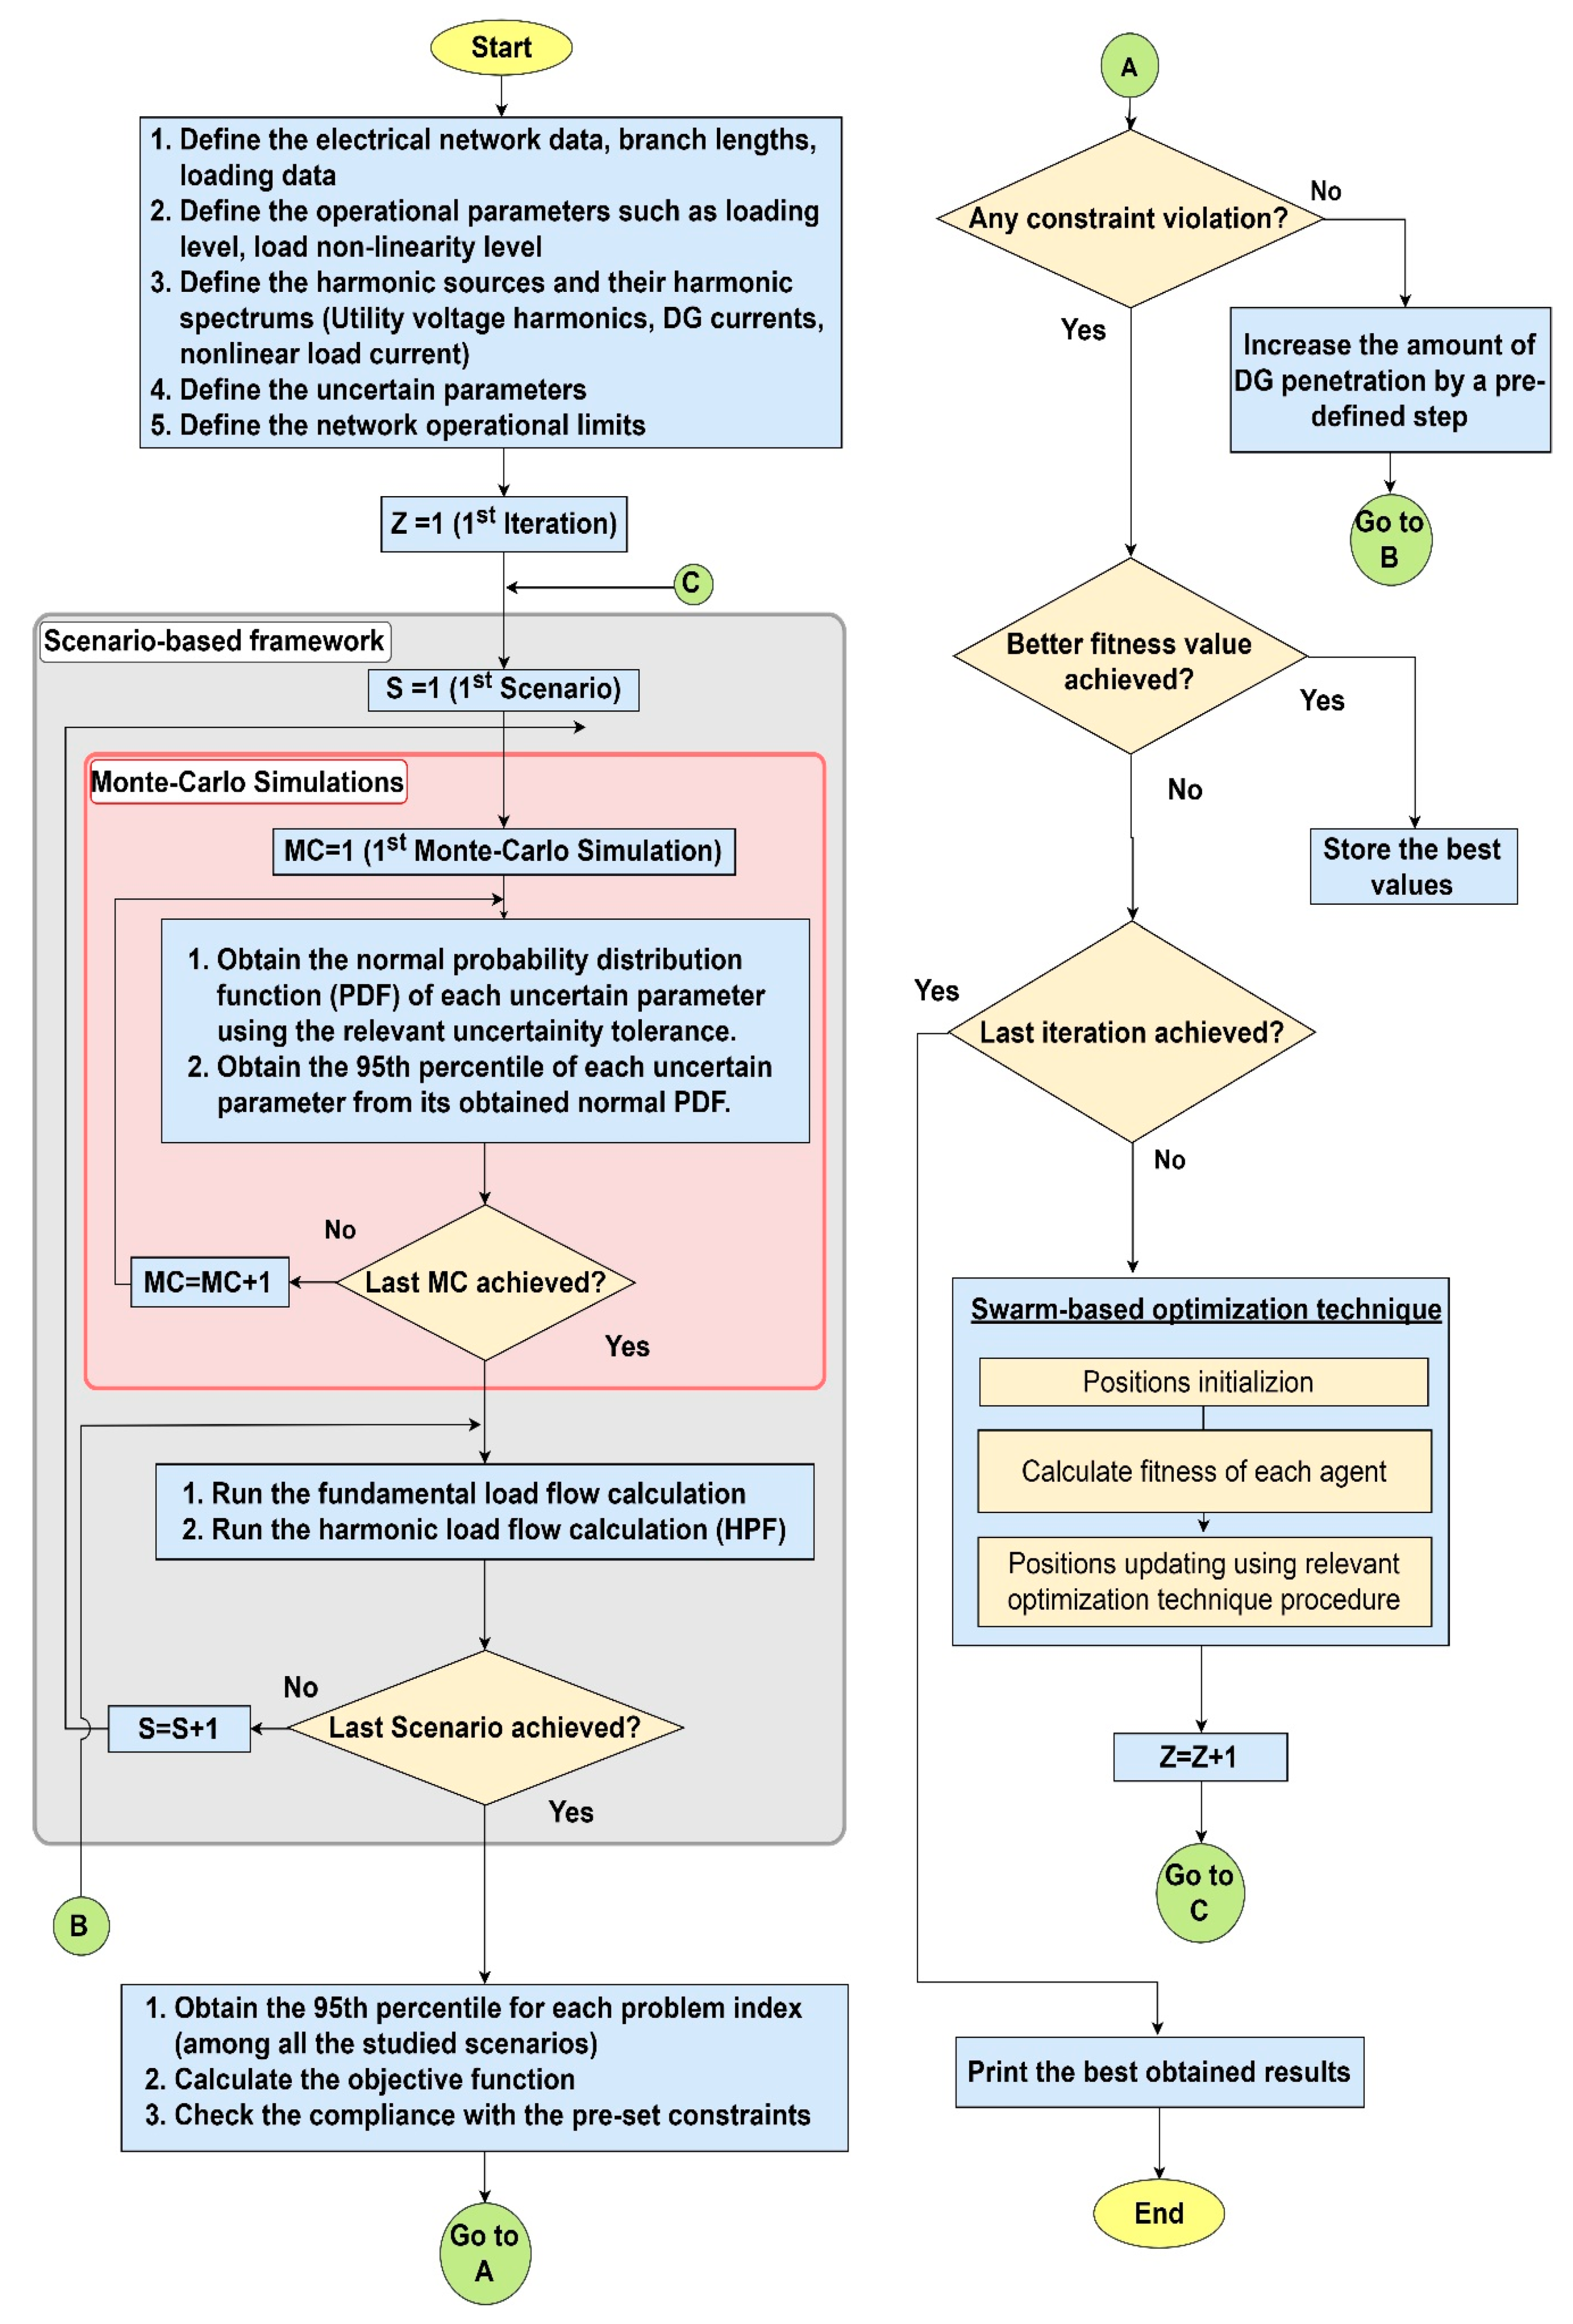
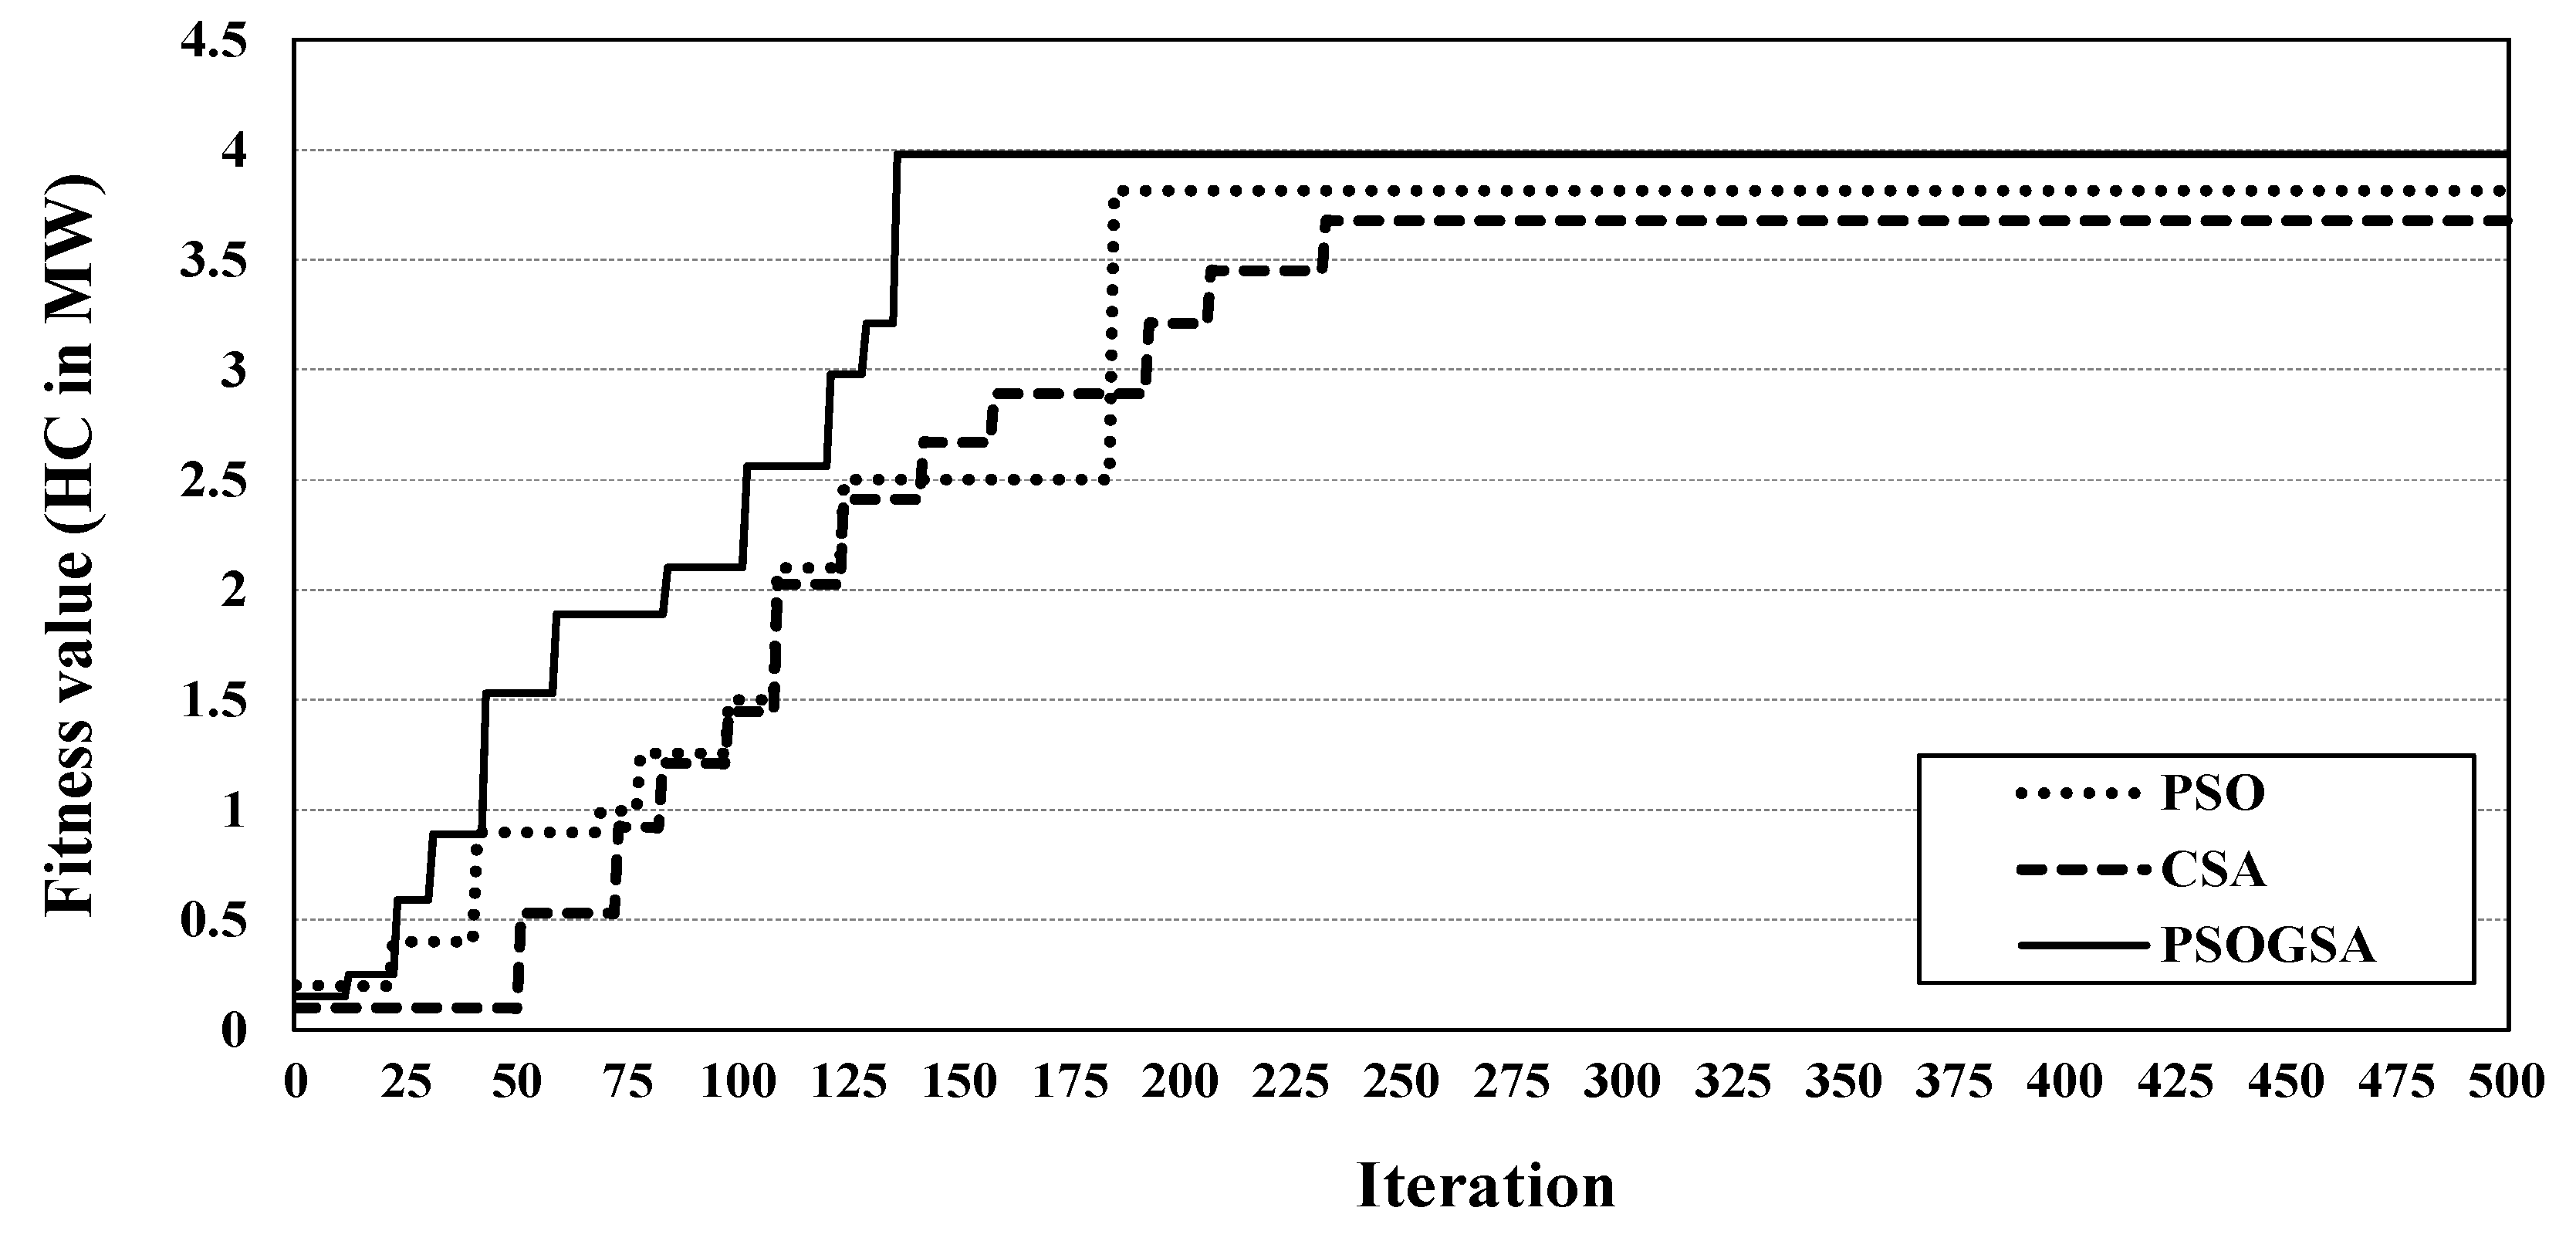
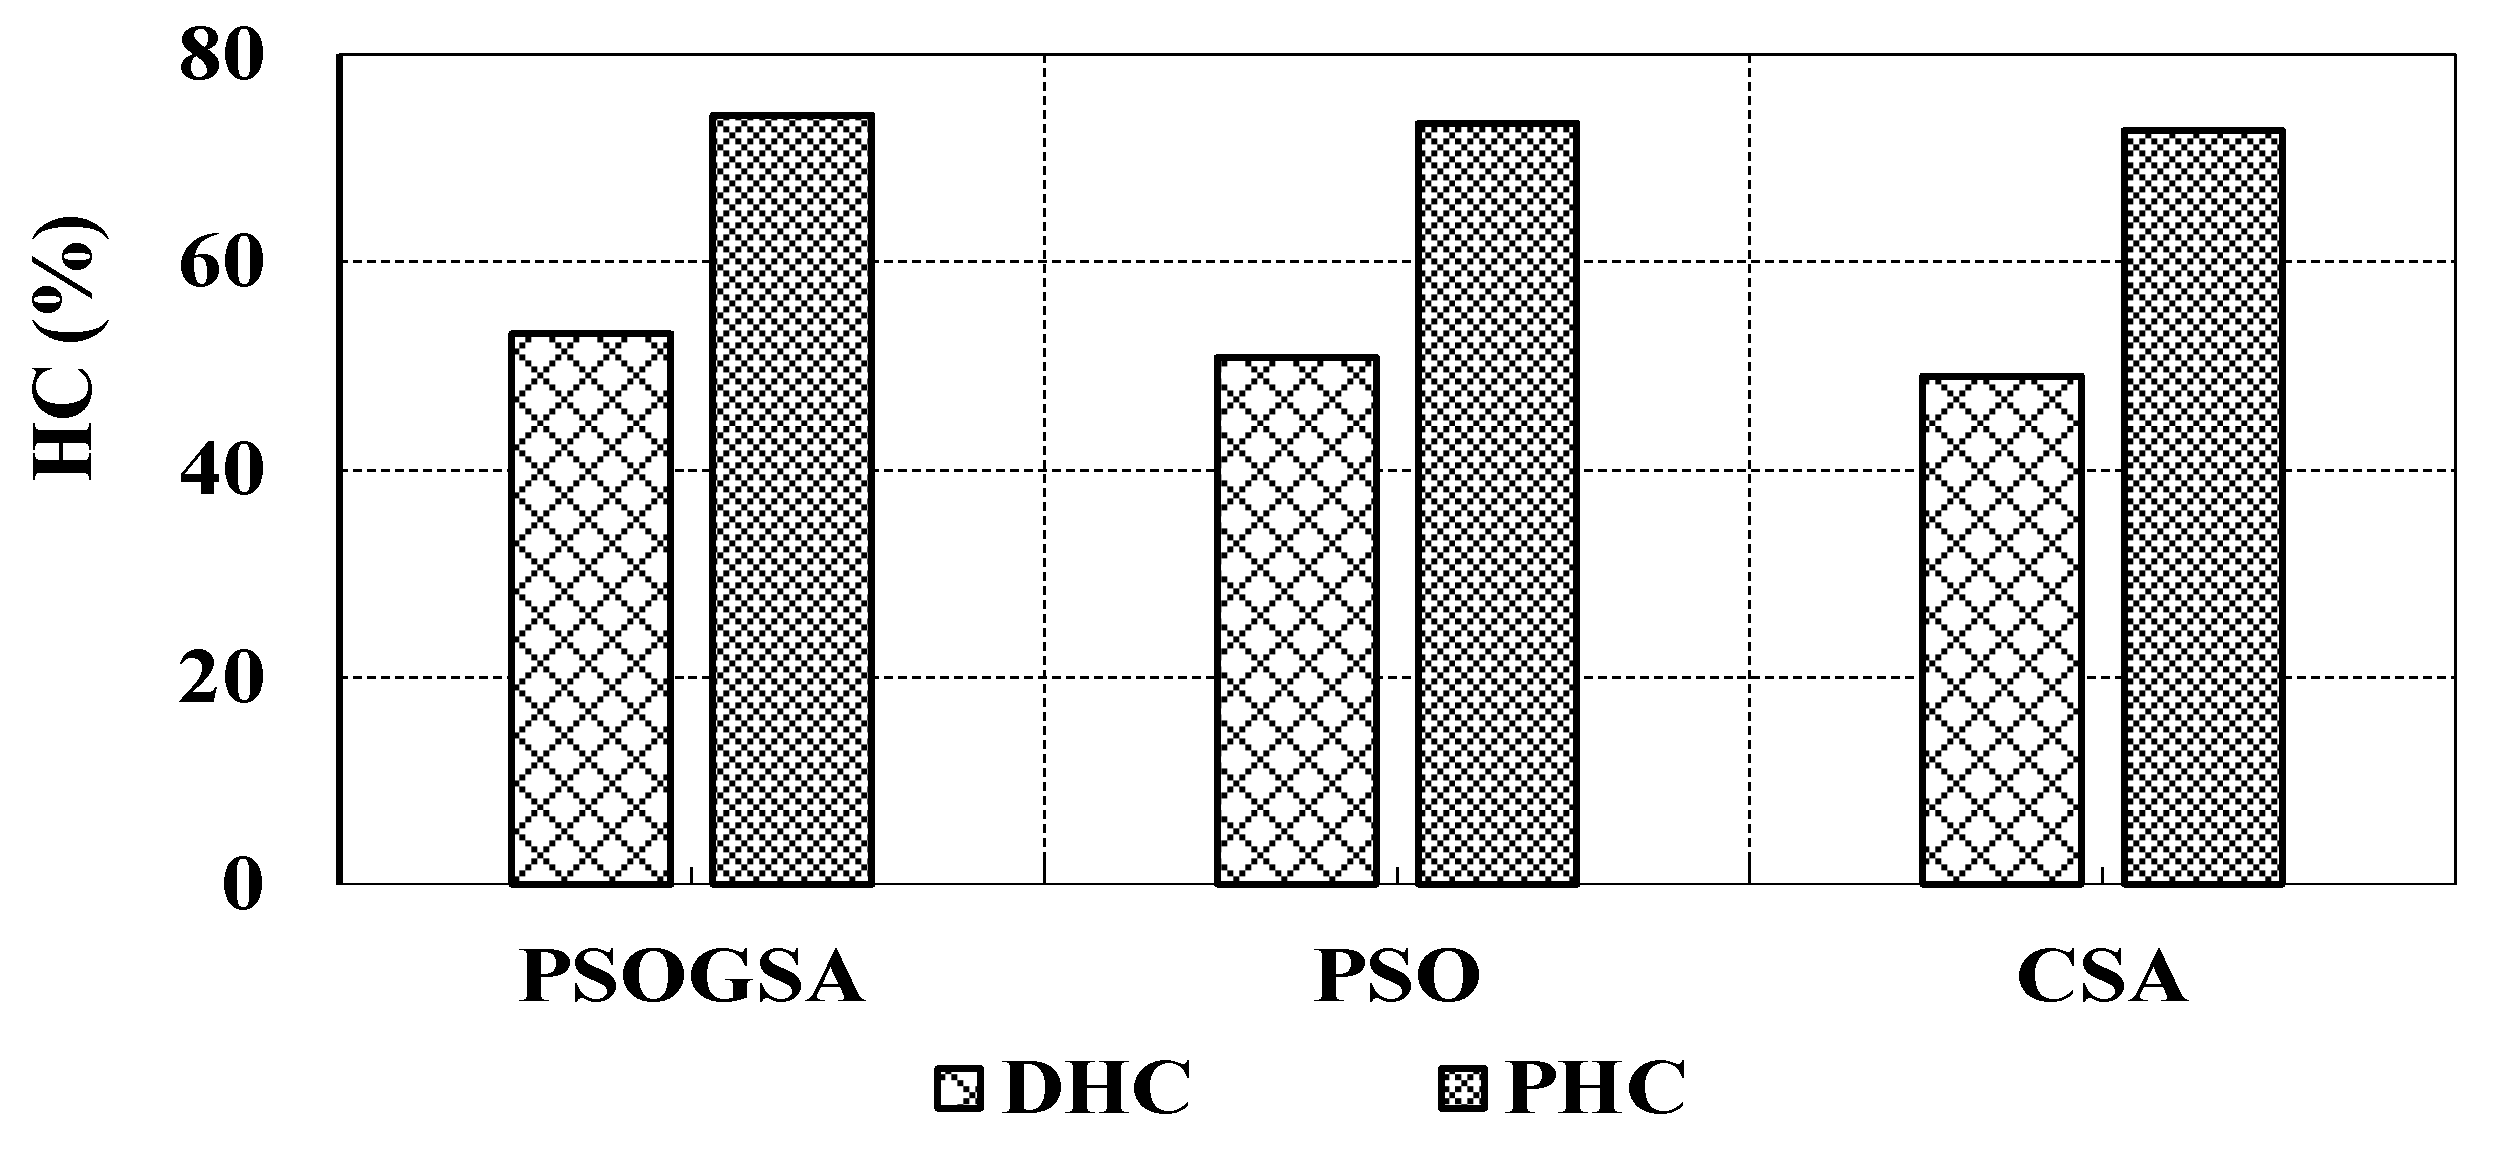
In this paper, the PHC of a harmonic-distorted power distribution system is explored in the presence of high PV penetration. A proposed C-type passive harmonic filter is proposed to maximize the harmonic-constrained PHC. The C-type harmonic filter is a high-pass passive filter, used in both utility and industrial networks, since it ensures harmonic mitigation for a wide range of harmonics, and it reduces resonance risks. In addition, the C-type filter operates as a standalone shunt capacitor bank at the fundamental frequency, and therefore its fundamental power loss is significantly lower than that of other passive filter types. An optimization problem is formulated by using the MCS framework, considering various uncertainty indices such as the intermittent output power of the DGs, background voltage harmonics, load alterations, and the filter parameters’ uncertainties. The bus voltage limits, line thermal capacity, power factor, and individual and total harmonic distortion limits have been considered as the problem constraints. A meta-heuristic swarm-based optimization algorithm known as hybrid particle swarm optimization and gravitational search optimization (PSOGSA) has been used for the optimal design of the proposed filter. The proposed filter design using PSOGSA was compared with other design approaches, using the well-known particle swarm optimization (PSO) and the crow search algorithm (CSA) and it was found that the proposed design outperforms conventional design approaches. Further, the impact of multi-pulse VFDs on the system’s PHC is investigated. The main contributions of this paper are as follows:
  • PHC assessment is performed under the presence of numerous uncertain parameters using MCS.
  • Different meta-heuristic optimization techniques are utilized for the optimal design of the proposed filter, taking into account numerous uncertainties of the parameters and the operational power quality indices.
  • A comparative analysis of the DHC and PHC results is presented.
  • The impact of multi-pulse VFDs on the system’s PHC is investigated. To the best of the authors’ knowledge, no work in the literature has considered this impact.
  • The proposed filter design using PSOGSA was compared to other design approaches, using the PSO and the CSA, and it was found to achieve higher PHC levels than the conventional HC results.
Unauthorized DG units may cause reliability and power quality (PQ) issues and implications. In this regard, the proposed PHC enhancement via harmonic mitigation is believed to provide a way forward for the development of non-sinusoidal power distribution systems with additional nonlinear loads and DG alliance room, while complying with the system operation and reliability requirements.
The rest of the paper is organized as follows: Section 2 introduces the mathematical formulation of the optimization problem. Section 3 presents the problem formulation. In Section 4, the results obtained are presented and discussed for the system under study. The impact of using multi-pulse VFDs is explored, and a comprehensive analysis of the DHC and PHC results is provided. Finally, Section 5 presents the conclusions and future works.

2. Mathematical Model Formulation

Figure 1 represents the configuration of the distribution system considered in this work. This system is a balanced, symmetric industrial distribution system consisting of a utility substation (slack bus), distribution feeder, and hybrid loads comprised of linear loads (induction motors), and nonlinear loads represented by six-pulse VFDs, and a DG unit (represented by a PV system) that is interfaced with the system through power-electronic interface inverters, and a shunt C-type harmonic filter. In this work, three possible harmonic sources are taken into consideration, namely the background voltage harmonics that are present in the utility, current harmonics injected from the PV system, and the harmonic currents due to the load nonlinearity.
When a probabilistic analysis is undertaken, the calculation of the problem’s uncertain parameters is done through MCS. The MCS is utilized to develop a large number of probabilities of the studied parameter. For each probability, the 95th percentile of the considered parameter is calculated. In this work, each normal distribution was obtained from MCS, using 1000 samples, and considering a relevant appropriate uncertainty tolerance level for each parameter.

2.1. System Modeling

In this section, the mathematical model of the examined distribution system and its probabilistic parameters are presented. In a probabilistic mathematical environment, various types of uncertainties are present. To handle them, probabilistic distributions, such as the normal probability density function (PDF) are usually utilized to represent the variations of these uncertain parameters. In this work, the normal PDF T(x) is defined by the expected mean value (μ) and the standard deviation (σ) as follows [32]:
T ( x ) = 1 σ × 2 π × exp [ ( x μ ) 2 2 ( σ ) 2 ]
If xmin and xmax are the minimum and maximum limits of the input random variable x so that (xminxxmax), then the expected mean value for a 95% confidence level (CL) that the random variable x is present within its limits (μ95) is obtained as follows [32]:
μ 95 = ( x max x min ) / 2 1.96

2.1.1. Electric Utility Model

To simulate a practical condition, the utility grid is represented as a distorted voltage source that feeds the system with a sinusoidal fundamental supply, in addition to the superimposed background voltage harmonics.

2.1.2. Line Model

For the harmonic load flow calculations, the electrical feeders or lines are represented by their hth harmonic admittances. The hth harmonic admittance of the line ( Y L h ) is given as follows:
Y L h = 1 Z L h = 1 R L h + j X L h
where Z L h is the hth impedance of the line, R L h is the line’s resistance, and X L h is the hth inductive reactance of the line.

2.1.3. Load Model

Under the deterministic considerations, the hybrid loads are generally composed of linear and nonlinear loads. Typical linear loads are lighting, small-power, and heating loads. On the other hand, nonlinear industrial loads are typically VFDs. From a mathematical modeling perspective, the typical linear load is modeled by using a parallel arrangement of a resistance and an inductive reactance, which are obtained from the fundamental load flow analysis. Thus, the equivalent admittance of the linear load is established as follows:
Y d , l i n e a r h = α l [ P L 95 | V L 1 | 2 j Q 95 L h | V L 1 | 2 ]
where P L 95 and Q L 95 are the 95th percentiles of the active and reactive powers of the load, respectively. αl represents the linear load portion with respect to the total load composition. Consequently, αnl represents the nonlinear load portion, which varies from 0 (pure linear load) to 1 (100% nonlinear load). Accordingly,
α l +   α n l = 1
As recommended by the IEEE standard 519 [33], the nonlinear load is usually modeled by a current source injecting the corresponding harmonic currents. The magnitude of the nonlinear load’s fundamental current ( I n l 1 ) can be obtained by fundamental load flow analysis, as given below:
I n l 1 = α n l [ P L 95 + j Q L 95 V L 1 ]  
Thus, for higher-order harmonic currents, the hth nonlinear load’s harmonic current ( I n l h ) is calculated by:
I n l h = β h × I n l 1
where β h denotes the ratio of the hth harmonic current to the fundamental current.

2.1.4. PV System Model

From the harmonic load flow perspective, the DG source, represented by a PV system in this work, is usually modeled as a harmonic current source [8]; thus:
I P V h = β P V h × I P V 1 I P V 1 = S P V 95 V L 1
where I P V 1 and I P V h are the fundamental and the hth harmonic currents of the PV system, respectively. In addition, β P V h denotes the ratio of the hth harmonic current to the fundamental current of the PV system, and S P V 95 is the 95th percentile of the injected apparent power of the PV system.

2.1.5. Harmonic Filter Model

The proposed C-type harmonic filter is a high-pass passive filter that guarantees proper harmonic mitigation for a wide range of harmonics, eliminates resonance risks, and has a very low power loss compared to other passive filter types as it acts as a shunt capacitor bank at the fundamental frequency [7]. Figure 2 represents the equivalent circuit of the proposed harmonic filter.
As shown in Figure 2, the proposed C-type shunt passive filter consists of a main capacitor CF1 designed to provide the required reactive power support at the fundamental frequency. This main capacitor is connected in series with a double-arm combination of an inductor (LF), an auxiliary capacitor (CF2), and a resistance (RF). The inductive reactance (XLF) and the auxiliary capacitive reactance (XCF2) should be tuned at the fundamental frequency; that is, XLF = XCF2 = XF, where XF is the filter equivalent reactance at the fundamental frequency, to bypass the resistor and to operate at a remarkably low power loss at the fundamental frequency. Accordingly, the hth harmonic impedance of the filter ( Z F h ) can be calculated as the equivalent impedance of both the impedance of the main capacitor (ZCF1) and the impedance of the double-arm branch (Zshunt), as follows:
Z F h = Z C F 1 +   Z s h u n t = j ( X C F 1 h ) + ( j R F h × ( h 2 1 ) h R F + j X F ( h 2 1 ) )

2.2. Load Flow of the System

In this work, the well-known Newton–Raphson method is used to solve the load flow problem of the test system at the fundamental frequency, in order to obtain the fundamental voltages and currents of the system. Then, harmonic power flow (HPF) analysis is performed to find the non-fundamental harmonic voltages and currents of the system. The electric utility and the studied hybrid load are modeled as the slack and PQ bus, respectively. The PV system is assumed to operate at the unity power factor (PF).
From a conventional deterministic perspective, the hth harmonic line current vector ([Ih]) can be obtained as follows:
[ Y h ] × [ V h ]   = [ I h ]
where [Vh] and [Yh] are the harmonic voltage and the network’s admittance matrices for the hth harmonic, respectively.

3. Problem Formulation

In this work, the main objective of the proposed optimization problem is to maximize the system’s PHC, considering various possible uncertainties of parameters under non-sinusoidal operations. Therefore, the proposed C-type is optimally designed to achieve the optimization objectives mentioned earlier.
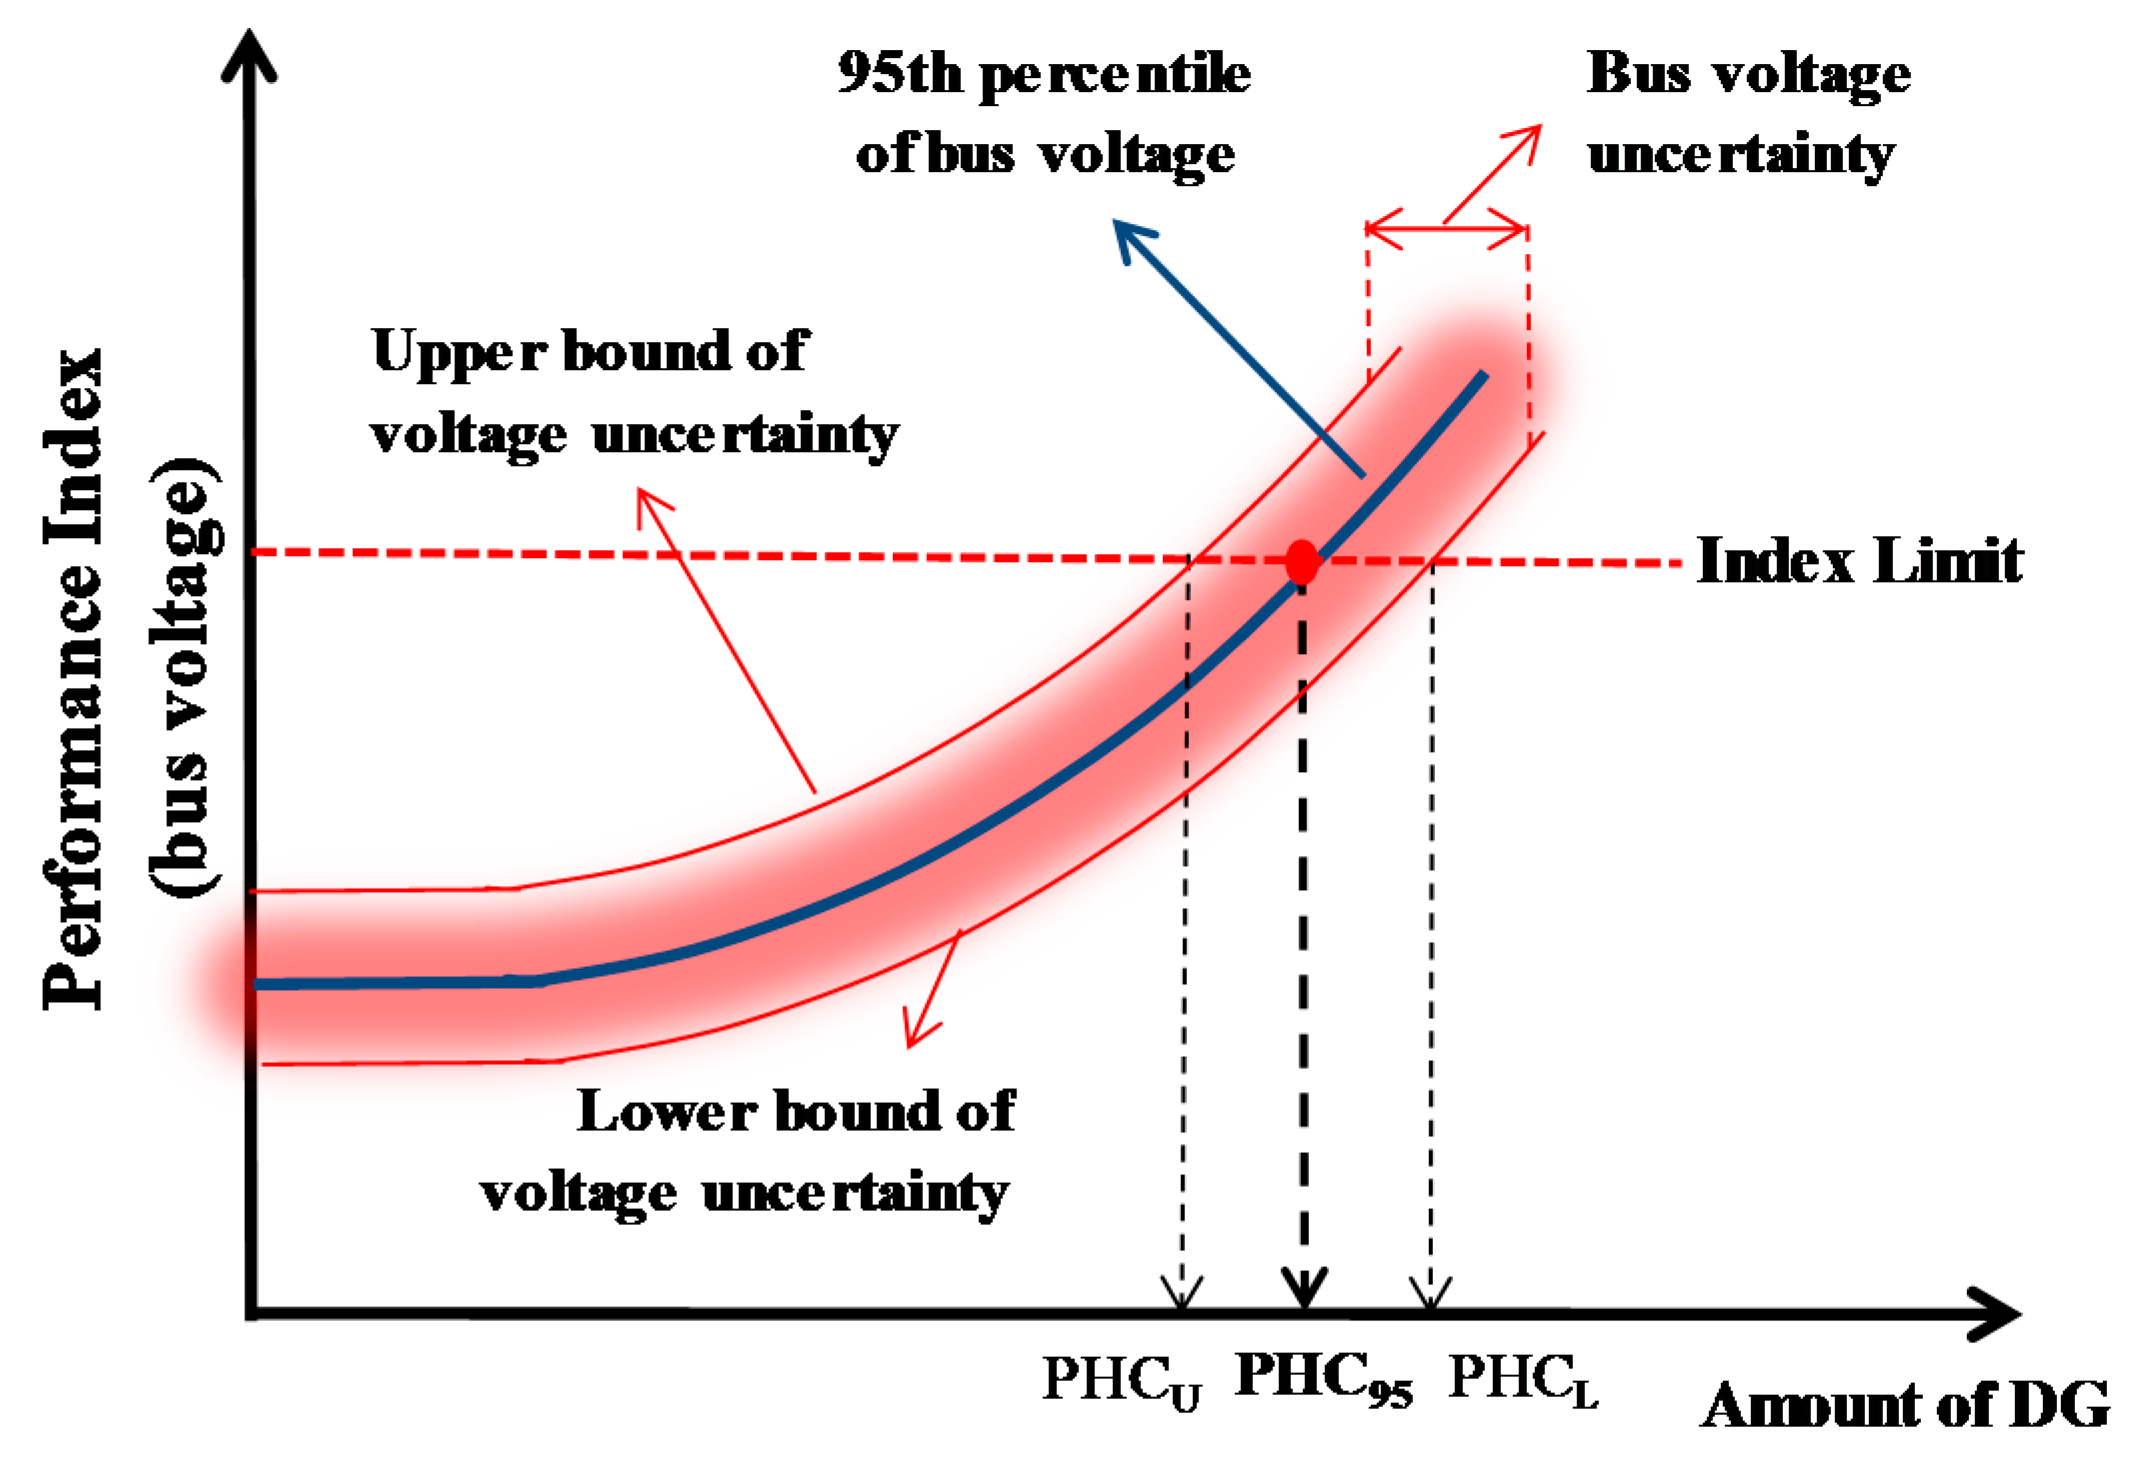
The concept of uncertainty handling in the PHC analysis is illustrated in a simplified way in Figure 3, while considering the bus voltage as an illustrative index for the PHC assessment.
As shown in Figure 3, in the PHC analysis, different results can be achieved, such as the pessimistic result (PHCU), which represents the PHC value by using the upper uncertainty level of the bus voltage, the realistic result (PHC95), which represents the PHC value by using a high percentile, such as the 95th percentile of the bus voltage, and the optimistic result (PHCL), which represents the PHC value by using the lower uncertainty level.

3.1. Objective Function

In this work, the objective function (OF) of the proposed optimization problem is to maximize the system’s PHC, as formulated below:
O F = M a x i m i z e P H C 95 = P H C 95 ( X C F 1 95 , X F 95 , R F 95 , P P V 95 )
where PHC95 represents the 95th percentile of the PHC, and where X C F 1 95 , X F 95 , and R F 95 are the 95th percentiles of the filter’s main capacitive reactance, the filter’s equivalent reactance at the fundamental frequency, and the filter’s damping resistance, respectively. P P V 95 is the 95th percentile of the injected active power of the PV system.

3.2. Constraints

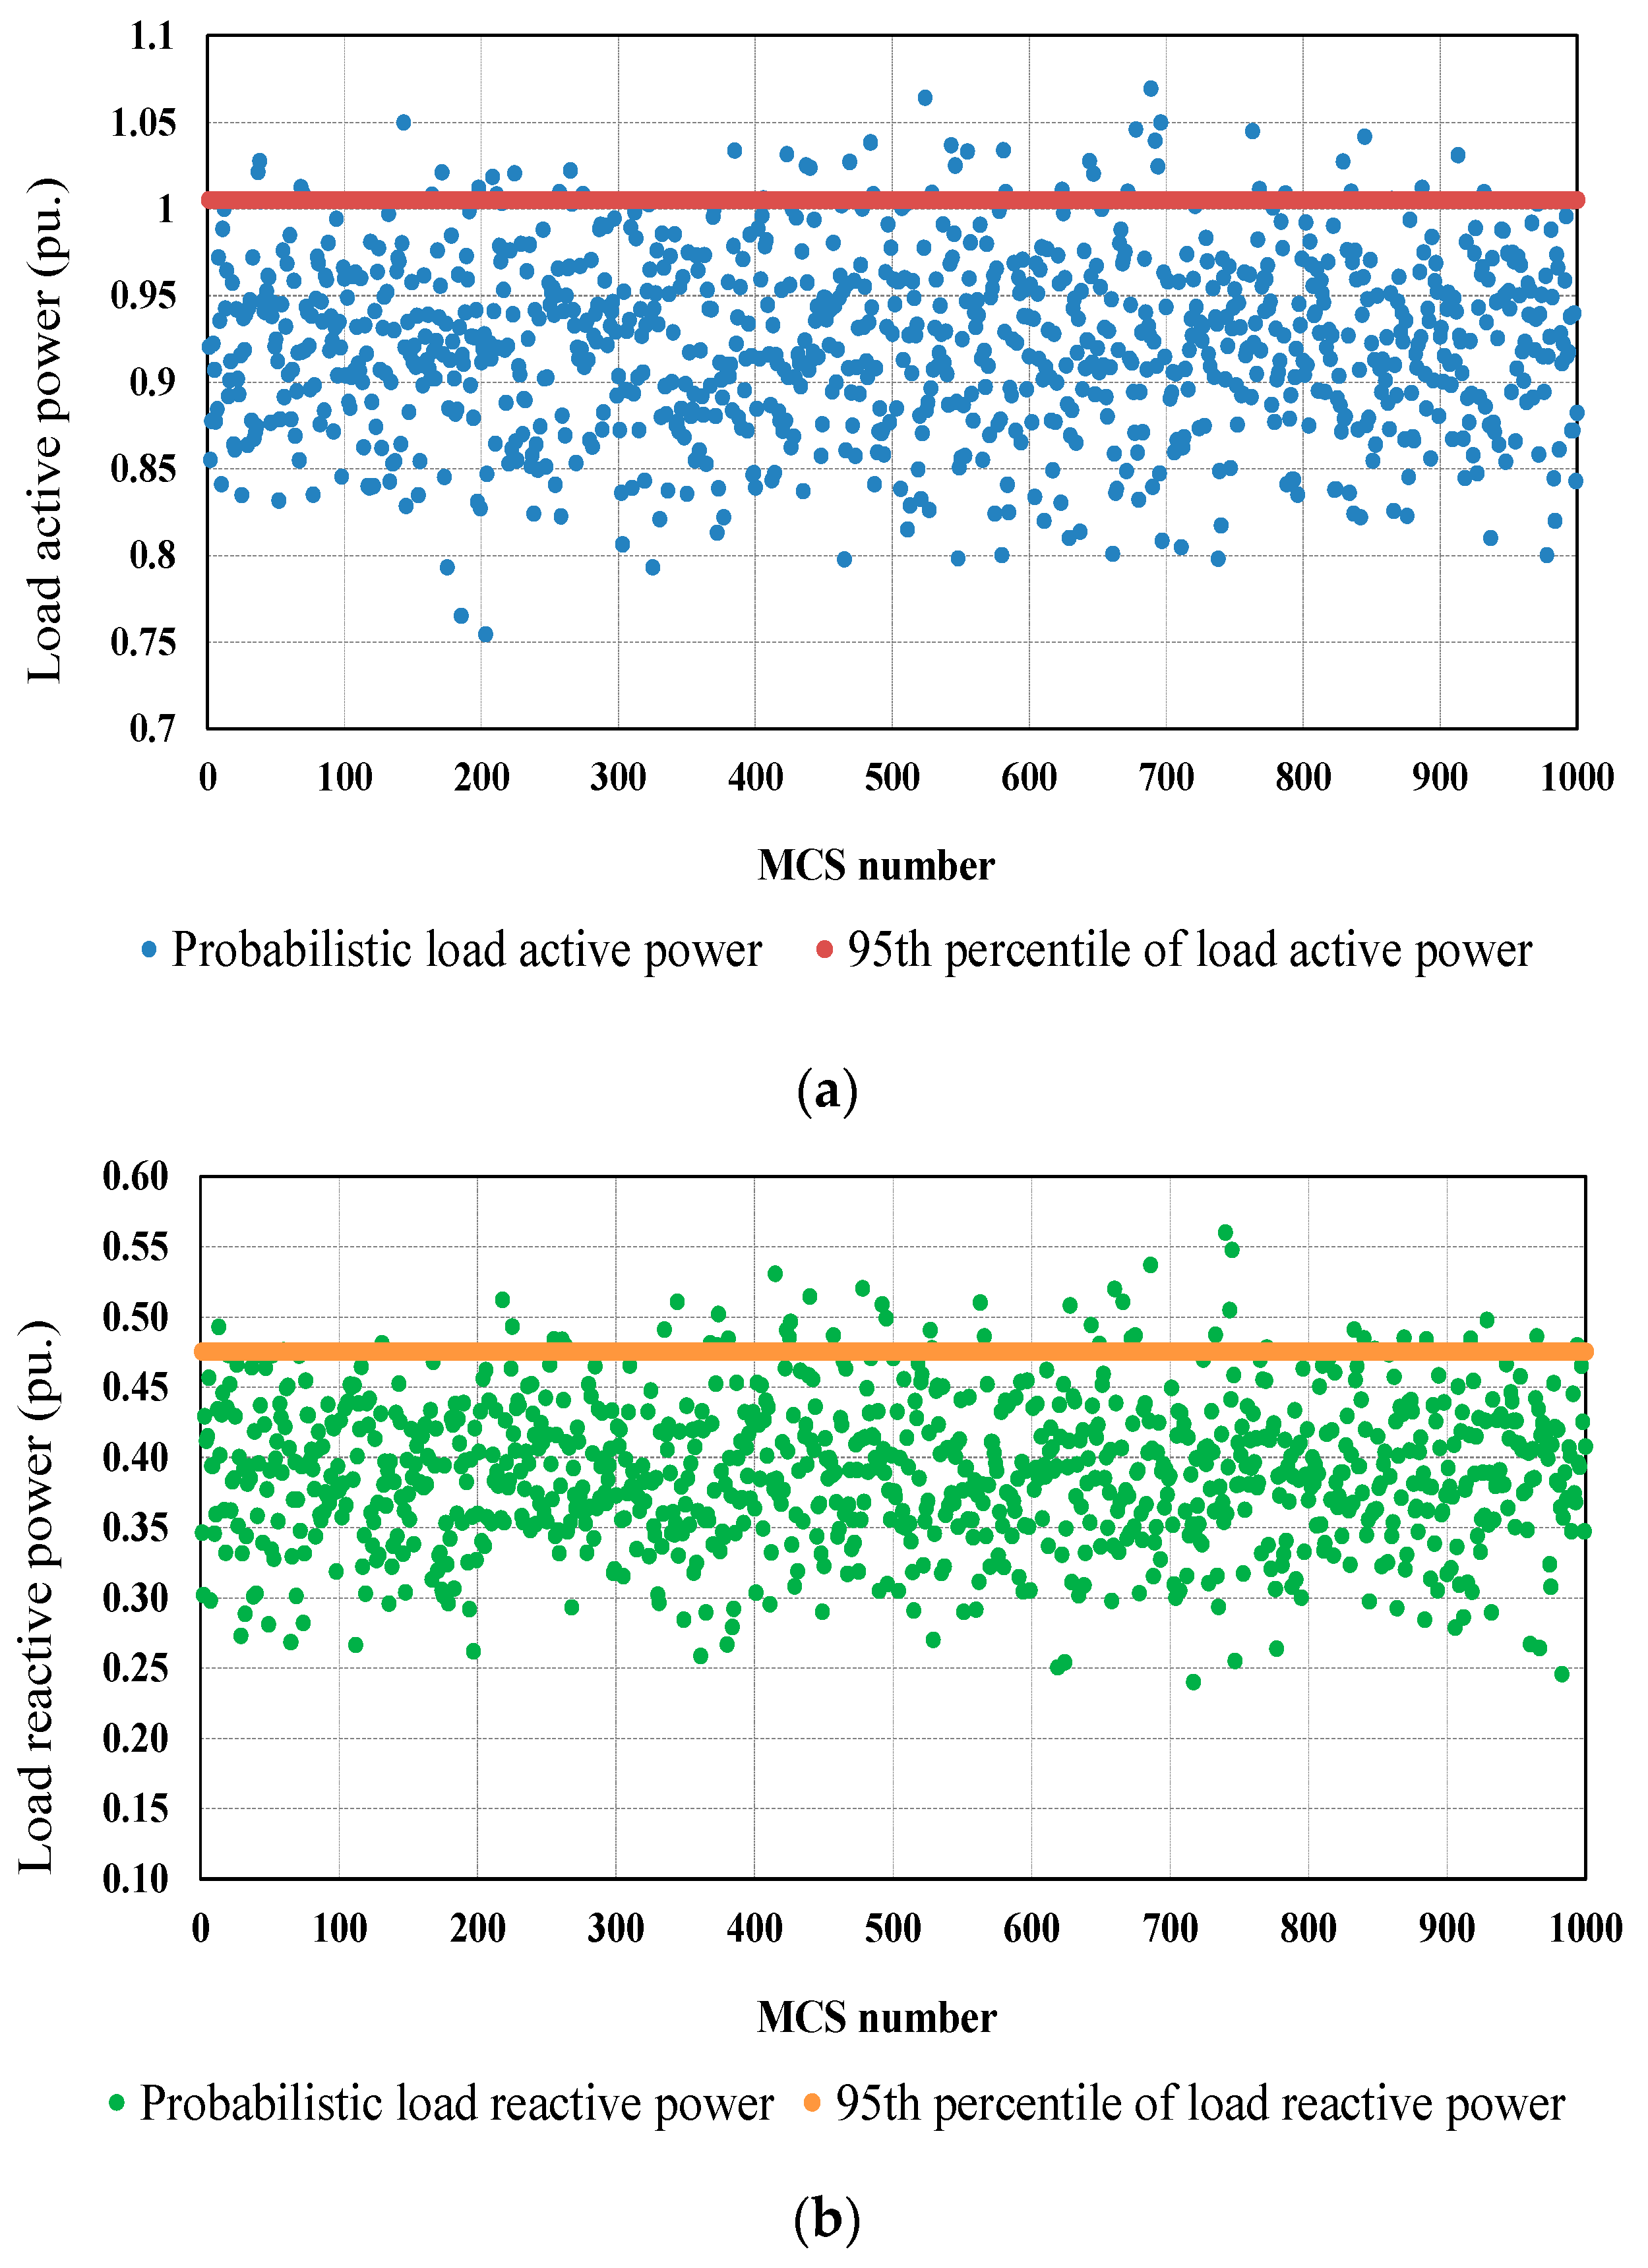
Due to the probabilistic nature of the studied network parameters, the relevant problem constraints should be selected, to account for these parameter uncertainties. Therefore, an appraisal of the problem constraints is performed by using the percentile concept to ensure that the achieved results are bounded within the preset constraints within the considered CL. In this study, five constraints are considered as follows:

3.2.1. Bus Voltage Constraint

The 95th percentile of the bus rms voltage ( V B 95 ) should be kept within its specified minimum and maximum limits; thus:
V B min V B 95 V B max
where V B min and V B max are the minimum and maximum bus voltages, respectively. In this work, the considered minimum and maximum bus voltage limits are 0.95 and 1.05 pu, respectively.

3.2.2. Line Capacity Constraint

The 95th percentile of the line’s current ( I L , R m s 95 ) is constrained by its maximum thermal capacity limit ( I L , m a x r m s ), as expressed in (13):
I L , R m s 95 I L , m a x r m s

3.2.3. DG Capacity Constraint

The 95th percentile of the total active power produced by the DG unit is bounded by the total connected load capacity, to avoid excessive reverse power flows. In this study, 100% penetration is considered as the upper boundary for the total DG penetration [19].

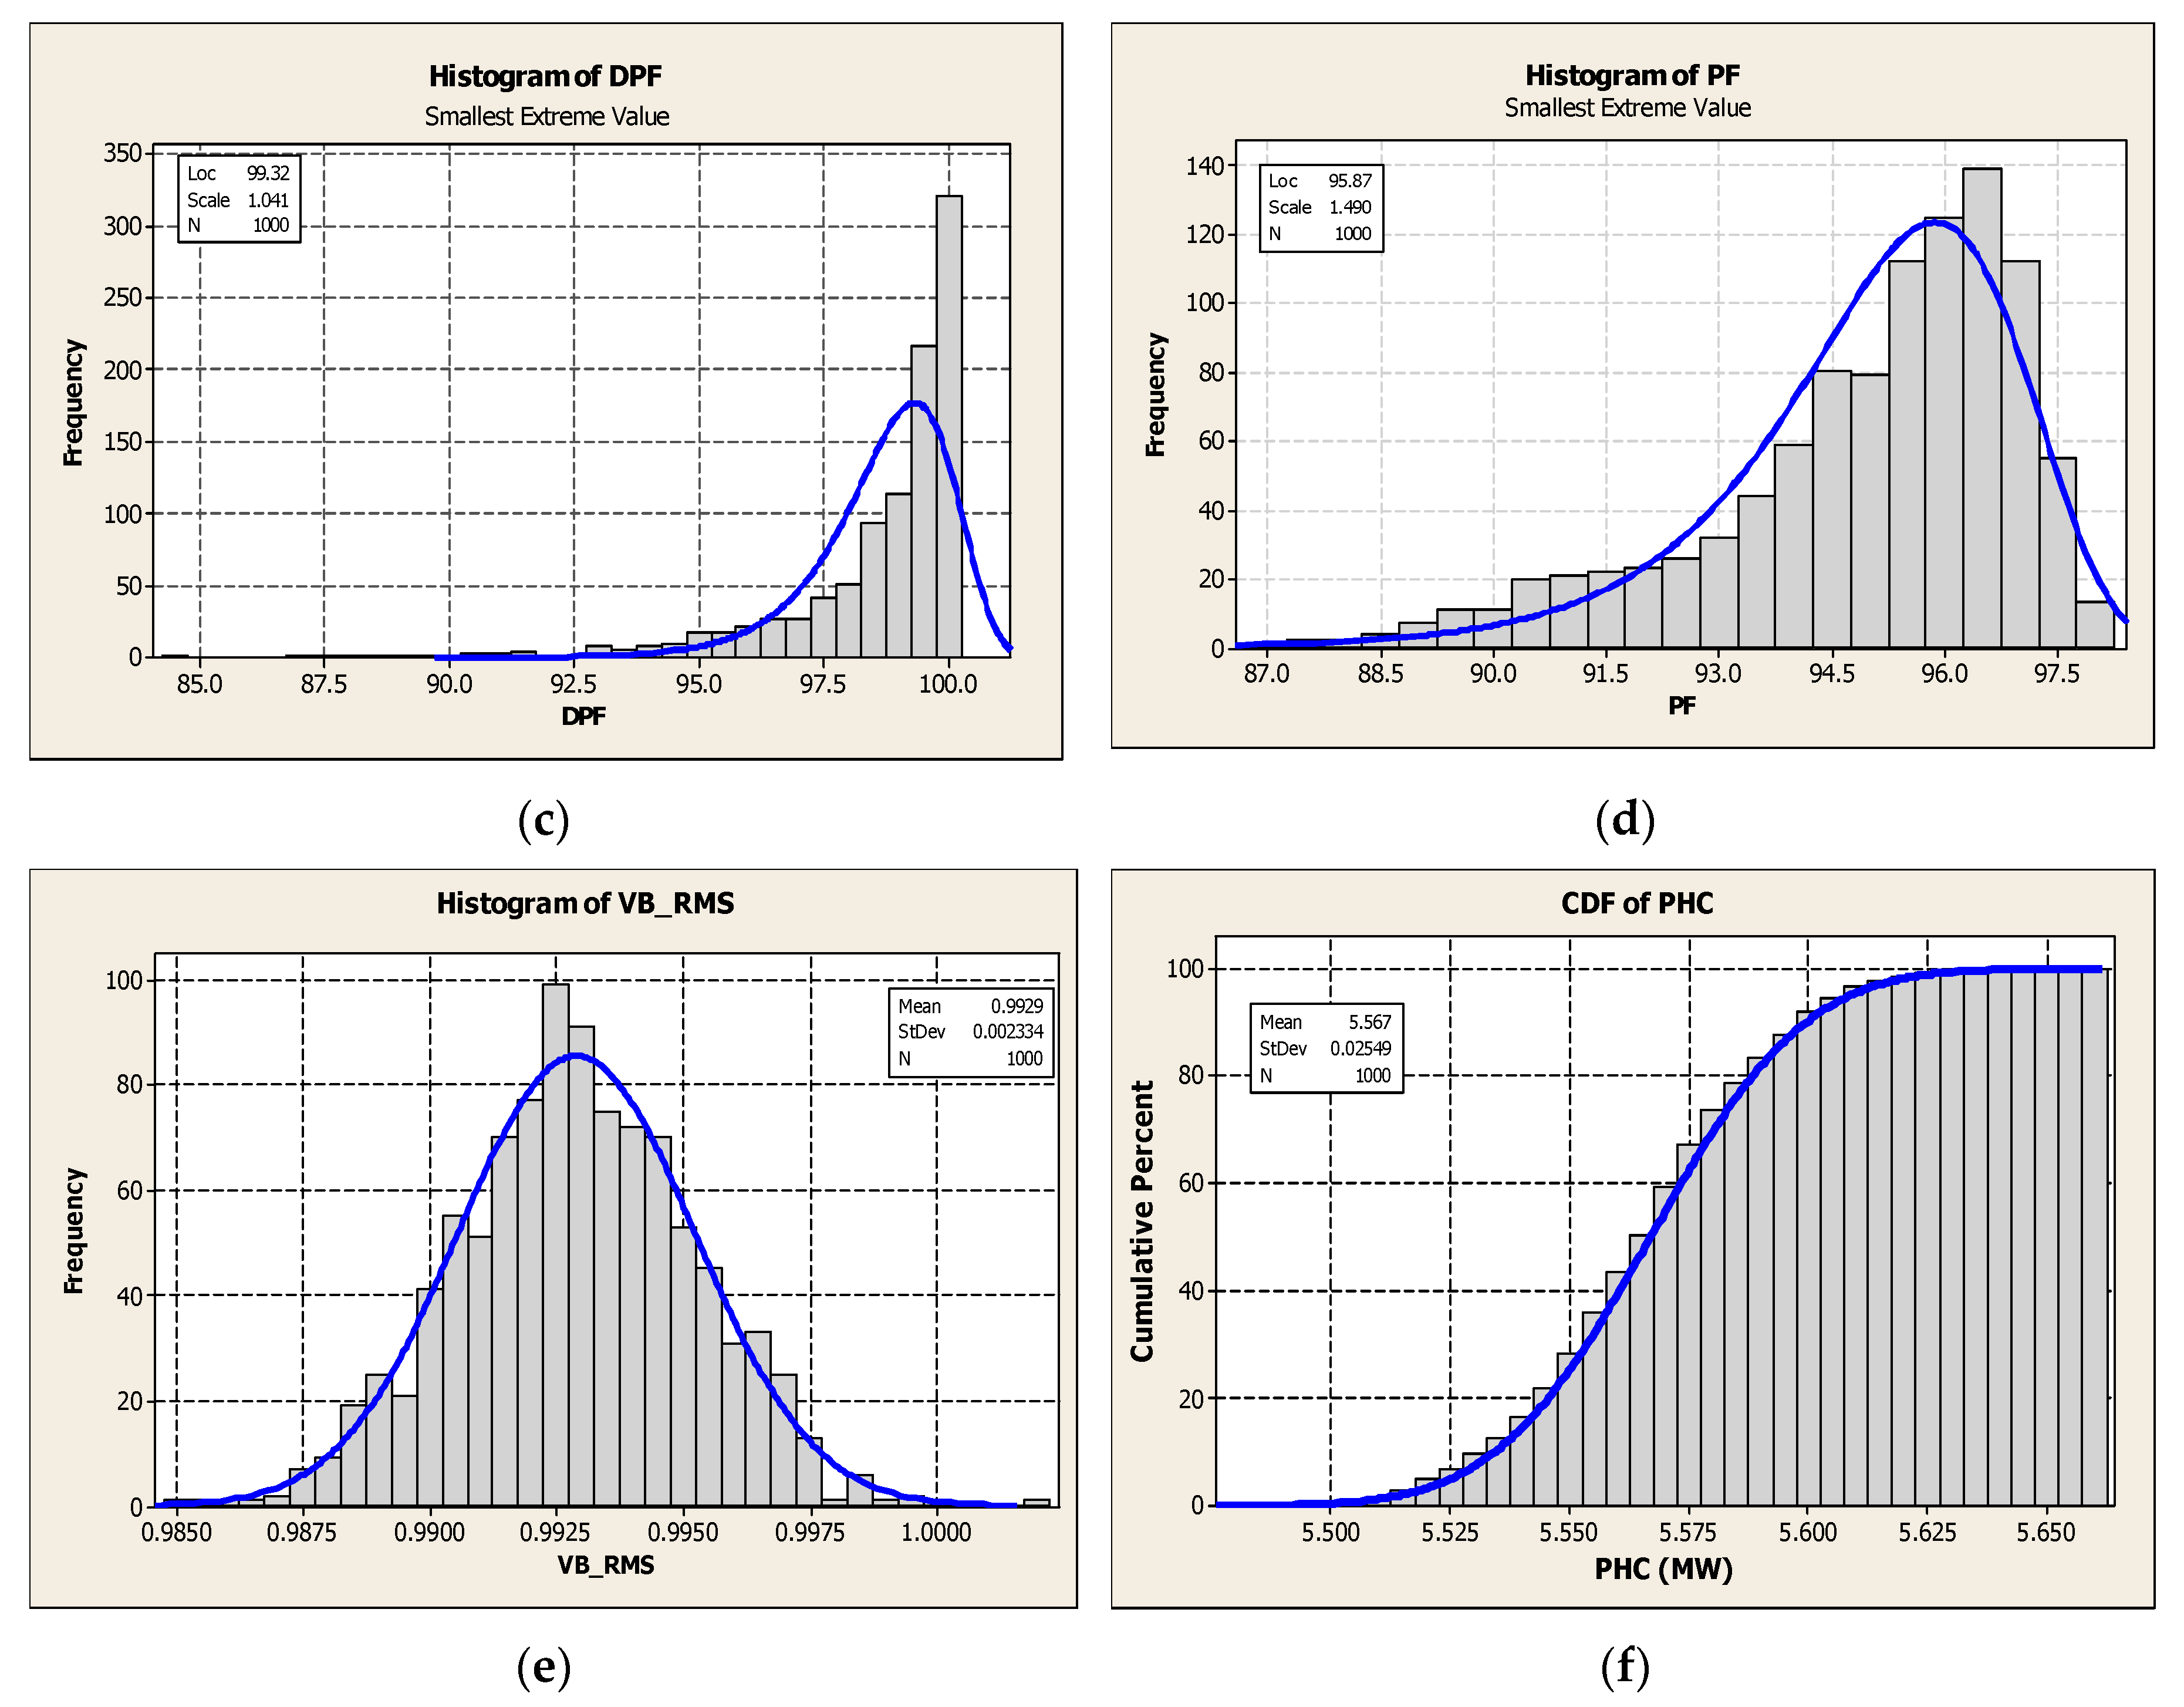
3.2.4. Displacement and True Power Factors Constraints

The 95th percentiles of both the displacement power factor (DPF95) and the power factor (PF95) at the point of common coupling (PCC) have to be sustained in their satisfactory ranges, as follows:
D P F min D P F 95 D P F max
P F min P F 95 P F max
where DPFmin and DPFmax are the minimum and maximum DPF limits, respectively. PFmin and PFmax are the minimum and maximum PF limits, respectively. In this work, DPFmin and PFmin are considered as 0.92 lagging, while DPFmax and PFmax are considered as unity, respectively [34].

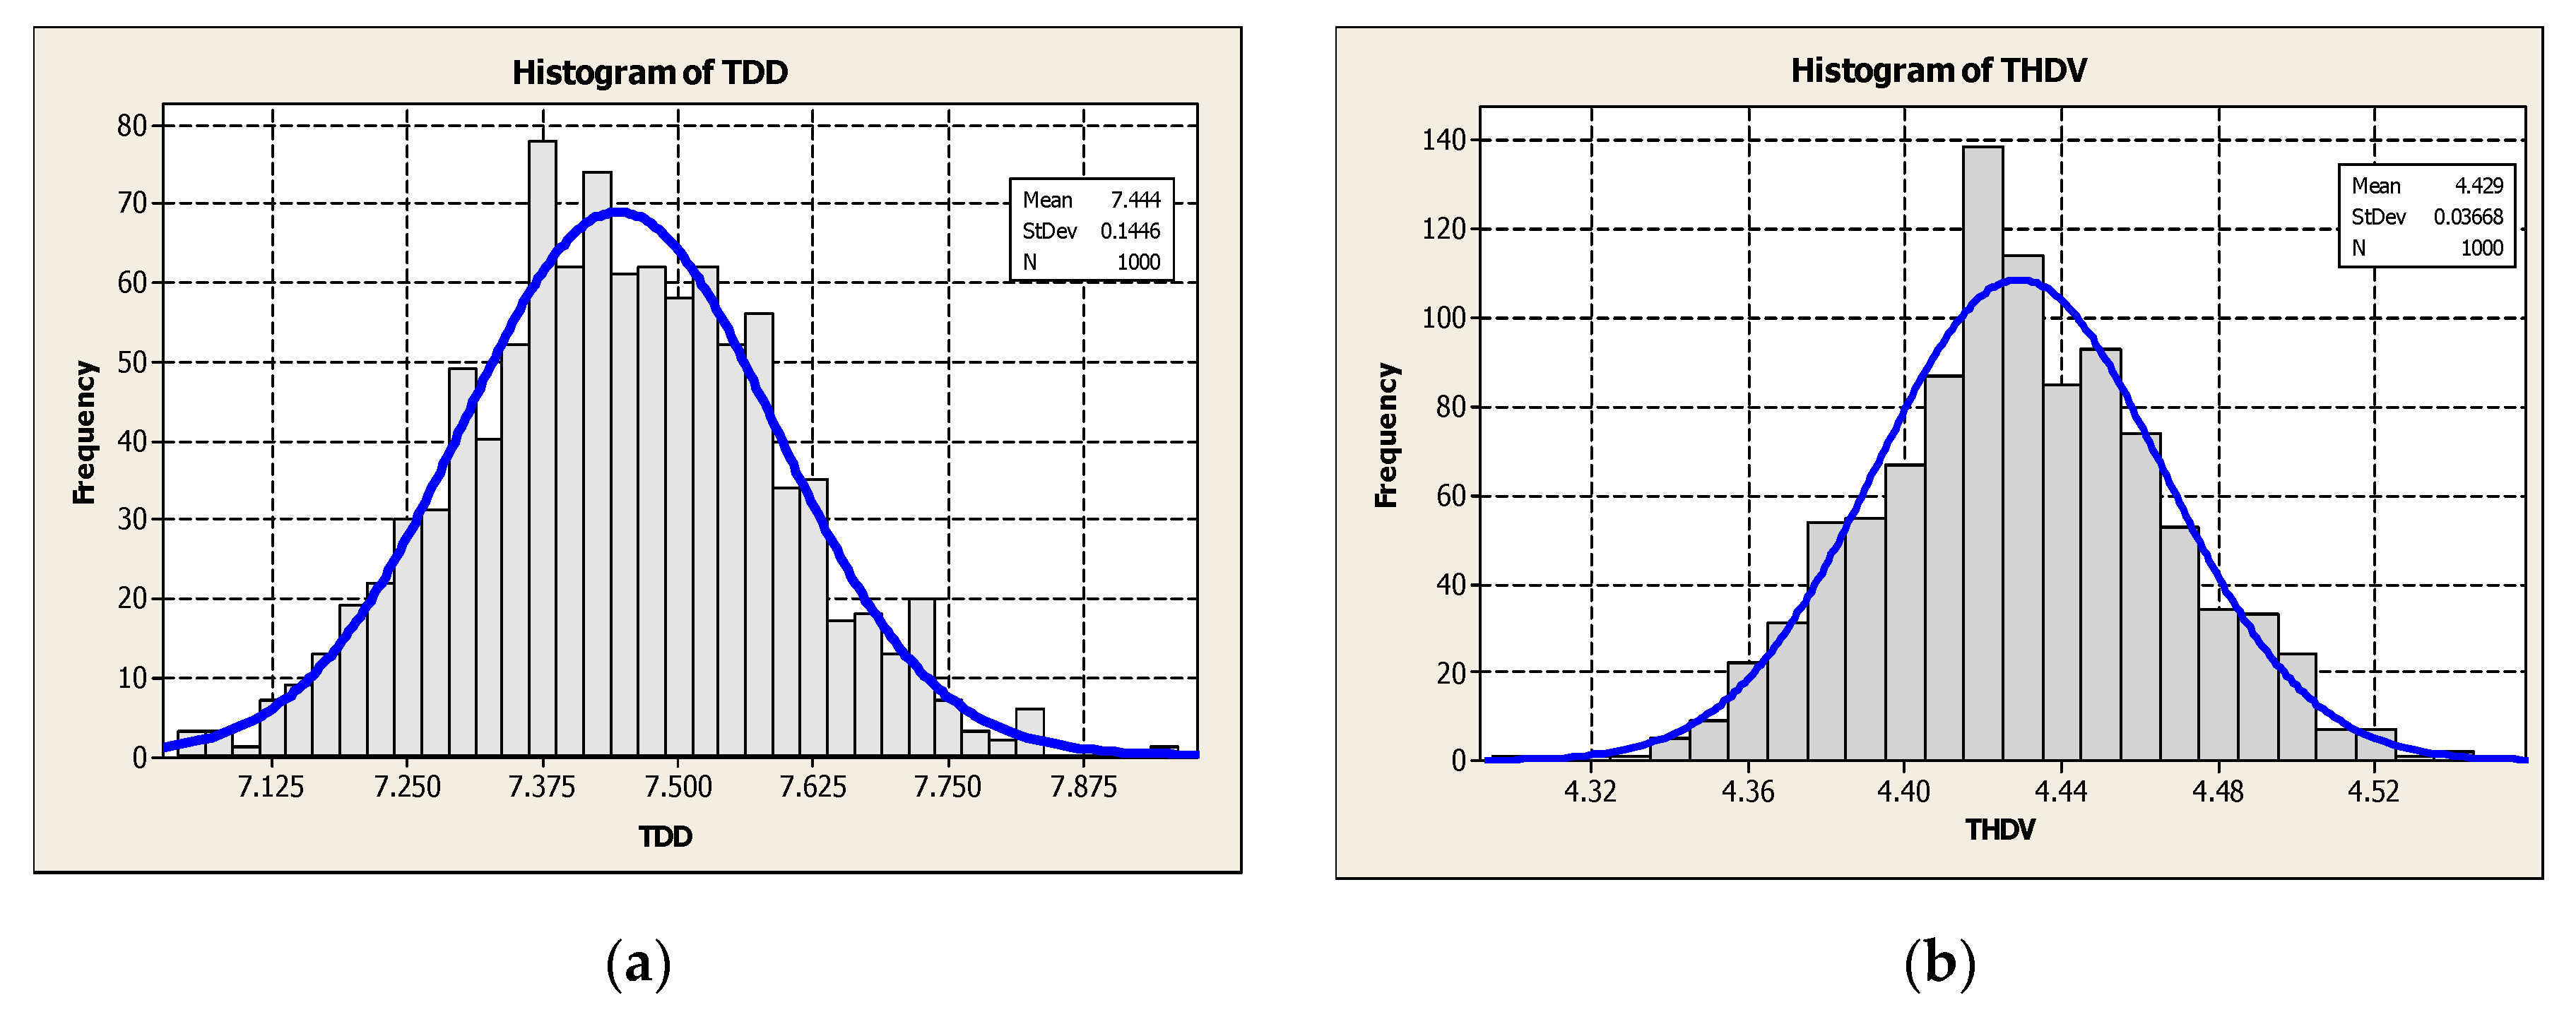
3.2.5. Harmonic Distortion Constraints

In the presence of multiple current and voltage harmonic distortion sources in the network, specific constraints should be considered, to avoid operational hazards due to excessive harmonic distortions. In our study, the IEEE Standard 519 recommended limits were followed. Accordingly, TDD95, THDV95, and the hth harmonic individual current and voltage distortions I H C D h 95 and I H V D h 95 , respectively, should be calculated and constrained as follows:
T D D 95 = h > 1   | I h , L 95 | 2 I f l   T D D max
T H D V 95 = h > 1   | V h , L 95 | 2 V L 1   T H D V max
I H C D h 95 ( % ) = | I h , L 95 | I L 1 × 100   I H C D max h
I H V D h 95 ( % ) = | V h , L 95 | V L 1 × 100   I H V D max h
where TDDmax, THDVmax, I H C D max h , and I H V D max h are the maximum allowable limits recommended by the IEEE 519 for TDD95, THDV95, I H C D h 95 , and I H V D h 95 , respectively. Ifl is the full load current (maximum demand) under normal operating conditions. I L 1 and V L 1 represent the fundamental line current and bus voltage, respectively. V L h is the hth harmonic voltage at the PCC. The 95% percentiles of the harmonic distortion limits have been considered, in accordance with the IEEE standard 519 recommendations [33].

4. Search Algorithm

Recently, numerous meta-heuristic optimization algorithms have been established, such as PSO, Differential Evolution (DE), Genetic Algorithm (GA), Ant Colony (AC), Gravitational Search Algorithm (GSA), and CSA. The main aim of these algorithms is to achieve the best result (global optimum) from all achieved outcomes, in a time-effective manner. To achieve this, two key features should be included in any optimization algorithm, to help find the desired global optimum, namely exploration and exploitation [35]. In the literature, many trials have been performed, to combine together several heuristic optimization algorithms in a hybrid technique that aims to utilize the advantages of each independent technique, which helps achieve results that are superior to what can be achieved by each algorithm individually [36]. Figure 4 represents a comprehensive flowchart of the proposed problem formulation.

4.1. PSOGSA Algorithm

In this work, the PSOGSA optimization algorithm is used for the optimal design of the proposed harmonic filter. The main idea of PSOGSA is to combine PSO’s social thinking (exploitation) capability with the GSA’s local search (exploration) ability [37,38,39,40]. Gravitational search algorithm (GSA) is one of the recent meta-heuristic optimization algorithms that was developed to mimic the Newtonian laws of gravity and motion [39]. It has shown remarkable search abilities in solving various optimization problems. However, it still has some disadvantages, such as slow convergence, and the tendency to become stuck in the local minima. In order to merge the PSO and GSA optimization algorithms, the position-updating equation of the search agent’s velocity ( ν t + 1 j ) is given as follows [35,37]:
ν t + 1 j = r 1 · ν t j + C X · r 2 · a t j + C Y · r 3 · a t j ( X b e s t X t j )     j N max
where X t j , ν t j , and a t j are the position, velocity, and acceleration of the jth agent at the tth iteration, respectively. r1, r2, and r3 are uniformly distributed random numbers in the range of [0, 1]. CX and CY are positive coefficients. Xbest is the best position achieved so far. Nmax is the maximum number of iterations.
In addition, the position of each search agent in the swarm is updated as follows:
X t + 1 j = X t j + ν t + 1 j
The parameters of PSOGSA considered in this work are summarized in Table 1. To validate the achieved solution through the PSOGSA algorithm, other optimization algorithms have been examined for solution validation, namely, the PSO and CSA optimization algorithms. The PSOGSA is proposed in this work, due to its superior performance in both the exploitation and exploration processes, and its faster convergence capability when compared to the widely known meta-heuristic algorithms such as PSO and CSA. Due to these benefits, the PSOGSA has been used to resolve various engineering problems in the literature [41,42].

4.2. PSO Algorithm

PSO is an evolutionary, heuristic-based optimization algorithm inspired by the social behavior of bird swarms. It is one of the most widely used optimization techniques in the literature. The main idea of the PSO algorithm is that it mathematically mimics the motion of a number of search agents (particles) which hover around in the search space to reach the target food location (best solution) [35,40]. The parameters of PSO considered in this work are summarized in Table 1.

4.3. CSA Algorithm

The CSA is a nature-inspired optimization algorithm that simulates the social performance of crows. Crows are considered as one of the smartest birds because they can remember faces, use tools, interconnect in complicated ways, and remember their food hiding places a long time later. In addition, crows are acquisitive birds and each crow attempts to steal other crows’ food. The mathematical model of CSA is explained in [43,44,45]. The controlling parameters of the CSA implemented in this paper are presented in Table 1.

5. Simulation Results and Discussion

5.1. System Under Study

The configuration of the power distribution system considered in this work is presented in Figure 2. This system is a balanced, symmetric industrial distribution system consisting of a utility substation (slack bus), distribution feeder, and hybrid loads comprised of linear loads (induction motors) and nonlinear loads, represented by six-pulse variable frequency drives (VFDs), and DG units (represented by a PV system) interfaced with the system through power-electronic interface inverters, and a shunt C-type harmonic filter. The base voltage and apparent power of the examined system are 13.8 kV and 7.5 MVA, respectively. The slack bus voltage is 1 pu. The system harmonic limits are observed at the load bus, and thus it is considered as the PCC. This system has a total load power factor of 0.92 lagging. Thus, the rated load active and reactive power demands are considered as 0.92 and 0.39 pu, respectively. The line and load data are obtained from [7]. The ratio of nonlinear load power to total load power is considered to be 25%. The harmonic spectrum of the considered background voltage harmonics, PV nonlinear current, and nonlinear load current are given in Appendix A. It can be easily noted from [7,34] that the uncompensated distribution system suffers from excess harmonic distortions that exceed the IEEE 519 standard limits, as presented in [34] and summarized below:
  • The THDV level of the uncompensated test system is 5.4563%, which exceeds the acceptable standard limit (5%).
  • The 25th individual current harmonic (I H C D25) of the uncompensated system is 1.0548%, which surpasses the maximum allowable limit (1%).
  • The 5th individual voltage harmonic (I H V D25) of the uncompensated system is 3.22%, which exceeds the maximum acceptable limit (3%).
Due to the above limit violations, the uncompensated system cannot host any DG unit, because of the harmonic distortion in the system. Also, DG penetration may deteriorate the system operational indices further. To solve this problem, a proposed C-type passive harmonic filter is proposed, to mitigate the harmonic distortion problems of the uncompensated system, and consequently strengthen its capability to enhance the system’s HC. Different meta-heuristic optimization techniques are investigated for the optimal design of the proposed filter, namely PSOGSA, PSO, and CSA. The following sections present the detailed results of both the DHC and the PHC assessments. Afterwards, a comparative analysis between the achieved DHC and PHC results is presented. Finally, the impact of multi-pulse VFDs on the system’s PHC is presented and discussed.

5.2. DHC Results

The DHC of the studied system is investigated under the prescribed operating conditions. The proposed C-type harmonic filter design, using the PSOGSA algorithm was compared with other design methodologies, using the PSO and CSA algorithms. Table 2 presents the optimal filter parameters and the system main operational indices, using the three examined optimization techniques.
It can be concluded from the results presented in Table 2 that the proposed filter design using the PSOGSA algorithm outperformed the other designs, using PSO and CSA, as it led to higher HC levels, an enhanced voltage profile of the system, lower TDD levels, reduced THDV levels, and increased PF and DPF values. In addition, it was noticed that the optimal filter parameters achieved by the PSOGSA led to slightly higher reactive power support from the filter than the other approaches. However, this reactive power support attained a higher bus voltage at 0.991 pu. Furthermore, the filter resistance (RF) achieved by using the PSOGSA was smaller than those obtained by other approaches, resulting in a lower filter loss, and consequently, the lowest total power loss among the studied approaches.
Although a higher HC result was obtained in [7] using the conventional GA compared to the HC level obtained using PSOGSA (1% HC increase), the PF value of the uncompensated system considered in [7] was 77.43%, which was far below the system value in Table 2. Therefore, the results presented in [7] were not included in the above comparative analysis, as they were obtained by using different reference values.
The convergence of the different design algorithms in achieving the maximum DHC is shown in Figure 5. It was shown that the PSOGSA algorithm can converge to their global solution in fewer iterations, compared with the PSO and CSA algorithms. Besides, the statistical appraisal of the results achieved using the different design algorithms indicates that the PSOGSA provides better and more stable solutions compared to the PSO and CSA.
One can notice that the DHC assessment procedure performed relies on fixed values of the system parameters, with no variations in its parameters, which could be unrealistic, as the electric parameters in the real systems are subject to perpetual variations. Accordingly, the PHC is evaluated in this work, to consider the various uncertainties present in the system such as the intermittent output power of the DGs, background voltage harmonics, load alteration, and the filter parameters’ variations.

5.3. PHC Results

HC uncertainty may arise, due to many aspects such as unknown DG sites and capacities, the DG’s output power intermittency, load alteration, and the absence of confirmed data that is used to conduct HC analysis. Accordingly, the HC assessment should not be a handled as a deterministic problem with no randomness. However, it has to be tackled from a probabilistic perspective, considering relevant parameter uncertainties. This conclusion has been recently verified by numerous studies, as it was concluded that DHC studies, which ignore the uncertainty of electrical parameters, resulting in conservative HC levels that usually lead to a noticeable underestimation of the HC levels [28,29,30]. To perform a PHC analysis, the MCS is utilized to generate an appropriate number of probabilities for the studied uncertain parameters. For each parameter, the 95th percentile is calculated over the entire number of examined MCS iterations. In this work, 1000 MCS iterations were considered for each uncertain parameter.
Afterwards, a scenario-based framework was formulated to execute the fundamental load flow calculations, and the HPF utilizing the obtained high percentiles of the examined parameters. The detailed procedure of the PHC analysis performed is presented in Figure 4. Various tolerance levels have been considered for the relevant uncertain parameters depending on the practical variation probabilities of each parameter. Table 3 shows the considered tolerances that are used for the deviations of the system parameters and filter parameters from their mean values.
The probabilistic load active and reactive powers, and their corresponding 95th percentiles, are shown in Figure 6. As shown in Table 3, large uncertainty tolerances equal to ± 10% have been considered for the load active and reactive powers, to reflect the practical uncertainty encountered with the daily load alteration. The 95th percentiles of the load active and reactive powers have been calculated by the MCS approach, considering 1000 MC samples, as presented in Figure 6.
Figure 7 presents the histograms and relevant PDFs of the probabilistic operational indices using MCS, namely TDD, THDV, DPF, PF, and the bus voltage (rms). The cumulative distribution function (CDF) of the achieved PHC is presented as well.
Figure 7a,b represent the histograms and relevant PDFs of both the probabilistic TDD and THDV results, with means of 7.44% and 4.429%, and standard deviations of 0.1446 and 0.036, respectively. The probabilistic results of both DPF and PF are constrained by the pre-set problem’s constraints. Thus, some samples were discarded, as they violated the problem constraints, which resulted in non-normally distributed results that were skewed (non-symmetric) to the left, as presented in Figure 7c,d, respectively. Based on the best-fit probability distribution procedure for the DPF and PF distributed functions; the smallest extreme value probability distribution was chosen as it best fits their probabilistic distribution in terms of the well-known measures such as AD, and p-value. For the DPF distribution, the location and scale values were 99.32 and 1.041, respectively, while for the PF distribution, the location and scale values are 95.87 and 1.49, respectively.
The probabilistic rms bus voltage (VBrms) results are shown in Figure 7e, with a mean of 0.9929 pu and a standard deviation of 0.0023 pu. For the sake of clarity, the CDF of the PHC results is presented in Figure 7f.
As shown in Table 4, under the probabilistic approach, the proposed filter design using the PSOGSA algorithm outperformed the other designs, using PSO and CSA, as it attained higher PHC levels. Besides, the DPF, PF, and voltage profile obtained, using the filter designed using the PSOGSA, were higher than those obtained with other approaches, and thus, an enhanced voltage level was achieved using this design. Furthermore, the filter-optimized resistance (RF) obtained using the PSOGSA was lower than that obtained by other approaches, which resulted in lower filter loss, and therefore the lowest total power loss among the studied approaches. It can also be noticed that the CSA and PSO succeeded in achieving better TDD and THDV levels, respectively.
In addition, comparing the DHC results in Table 2 and the PHC results in Table 4, one can clearly notice that the PHC levels achieved were higher than the DHC levels, as described earlier. Figure 8 presents an overall comparison between the achieved DHC and PHC results achieved using the three filter design approaches. As shown, it can be concluded that the PHC level achieved using the PSOGSA was 39.7% higher than the DHC result achieved by using the same design approach.
Furthermore, the system performance was examined under different operational conditions considering the proposed filter design using PSOGSA. Two operational parameters were been considered in this test, namely, the load nonlinearity level (NLL) and the background utility voltage distortion (BVD) level. The effect of varying the NLL and the BVD on the corresponding PHC level is presented in Figure 9a, while the effect of varying the operational parameters TDD and THDV on the corresponding PHC level is presented in Figure 9b.
In Figure 9a, the NLL varies from 20 to 30% with a step of 2.5%, whereas the original design is performed with 25% NLL, as explained earlier. In addition, the BVD varies from 0 to 100%m with a step of 25%, whereas the original design performed at 100% BVD level. It can be noticed that the PHC level decreases, with increases in the NLL. For example, at a BVD level of 0%, the PHC level decreased from 73% at 20% NLL to 29% at 30% NLL. It can also be concluded that the proposed C-type harmonic filter succeeded in operating satisfactorily at heavy harmonic signatures (high BVD and high NLL) simultaneously. Finally, it is clear that varying the NLL has a larger impact on the resulting PHC than variation of the BVD.
The TDD and THDV levels resulting from the above validation are presented in Figure 9b with the corresponding PHC. One can notice that the PHC level was reduced gradually with simultaneous increases of both the TDD and THDV levels. For example, the PHC level was reduced from 76% at 7.1% TDD and 3.9% THDV to 25% at 7.1% TDD and 3.9% THDV respectively, as shown in Figure 9b.

5.4. Effect of Utilizing Multi-Pulse VFD Configurations on the System’s PHC

A multi-pulse VFD is a drive that utilizes special transformer connections to cancel specific harmonics. On the market, common types of multi-pulse VFDs are available, such as the 6-, 12-, 18-, and 24 VFDs. The main advantage of using a multi-pulse VFD is that the harmonics are eliminated from their source, thus avoiding their propagation into the electrical network. However, the higher the number of pulses of a VFD, the higher the complexity and cost of the drive [46]. The impact of multi-pulse VFDs on the system’s PHC is investigated in this work; to the best of the authors’ knowledge, this has not been studied before in the literature. Three configurations of multi-pulse VFDs were studied, namely 6-, 12-, and 18-pulse VFDs. Table 5 presents the current harmonic spectrum of the examined multi-pulse VFDs.
It can be concluded from the results presented in Table 6 that the use of multi-pulse VFDs enhances the system’s PHC. Using 12-pulse VFD resulted in a PHC enhancement of 3.11%, compared to the conventional 6-pulse VFD. In addition, using the 18-pulse VFD led to a slight PHC enhancement of 3.44%, compared to the 6-pulse VFD. One can notice that the achieved PHC enhancement was bottle-necked by the system’s DPF constraint, as almost reached its maximum allowable limit (100%) in the cases of both the 12-pulse VFD and the 18-pulse VFD. This slight enhancement of the PHC level cannot be practically feasible from an economic perspective, as the cost of an 18-pulse VFD is approximately 2.5 times the cost of a 6-pulse VFD. However, further PHC enhancements can be achieved in other case studies, depending on the system data.

6. Conclusions

In this study, the PHC of a harmonic-distorted power distribution system subjected to high PV penetration is evaluated utilizing the Monte Carlo simulation. A proposed C-type harmonic filter is proposed to maximize the PHC of the examined system. An optimization problem is formulated considering various uncertainty indices, such as the intermittent output power of the DGs, background voltage harmonics, load alterations, and the filter parameters’ uncertainties. The bus voltage limits, line thermal capacity, power factor, and harmonic distortion limits have been considered as the problem constraints. The PSOGSA optimization algorithm has been used for the optimal design of the proposed filter. The proposed filter design using PSOGSA was compared with other design approaches using PSO and CSA, and it was found that the proposed design outperforms the compared design approaches. Further, the impact of multi-pulse VFDs on the system’s PHC is investigated. The PHC results obtained were compared with the conventional DHC results and it was found that the PHC level achieved using the PSOGSA design approach was 39.7% higher than the DHC level achieved by using the same design approach. Recently, it was concluded that DHC studies, which ignore the uncertainty of electrical parameters, result in optimistic results that cause a noticeable underestimation to the HC levels that are achieved from probabilistic studies.
Our study was limited to fixed, time-independent loading profiles and PV output power, and their effect on the performance of a balanced power distribution system. Furthermore, the consideration of a chronological demand profile with time-dependent DG systems in unbalanced power distribution systems, utilizing multi-objective decision-making techniques was beyond the framework of this study, and this will be included in future studies.

Author Contributions

S.M.I. and S.H.E.A.A. designed the problem under study; S.M.I. performed the simulations and obtained the results. S.H.E.A.A. analyzed the obtained results. S.M.I. wrote the paper, which was further reviewed by S.H.E.A.A., A.Y.A., and A.F.Z.

Funding

This research received no external funding.

Acknowledgments

The authors would like to thank the reviewers for their constructive comments and suggestions.

Conflicts of Interest

The authors declare no conflict of interest.

Abbreviations

BVDBackground utility voltage distortion
CDFCumulative density function
CSACrow search algorithm
DGDistributed generation
DHCDeterministic hosting capacity
DPFDisplacement power factor
DSODistribution system operator
FRIFeeder reinforcement index
GSAGravitational search algorithm
HCHosting capacity
HPFHarmonic power flow
MCSMonte Carlo simulation
NLLLoad nonlinearity level
OLTCOn-load tap changer transformers
PCCPoint of common coupling
PDFProbability density function
PFPower factor
PHCProbabilistic hosting capacity
PQPower quality
PSOParticle swarm optimization
PSOGSAHybrid particle swarm optimization and gravitational search algorithm
PVPhotovoltaics
SVCStatic Var compensators
TDDTotal demand distortion
THDVTotal voltage harmonic distortion
VFDVariable frequency drive
WTWind turbines

Nomenclature

T(x)A normally distributed probability density function
μExpected mean value
σStandard deviation
xminMinimum limit of the input random variable x
xmaxMaximum limit of the input random variable x
CLConfidence level
μ95Expected mean value of a random variable with a 95% confidence level
hHarmonic order
Y L h The hth harmonic admittance of the line
Z L h The hth impedance of the line
R L h The hth line’s resistance
X L h The hth inductive reactance of the line
P L 95 The 95th percentile of the load’s active power
Q L 95 The 95th percentile of the load’s reactive power
αlLinear load portion with respect to the total load composition
αnlNonlinear load portion, which varies from 0 (pure linear load) to 1
I n l 1 Magnitude of the nonlinear load’s fundamental current
V L 1 Magnitude of the fundamental load bus voltage
I n l h The hth nonlinear load’s harmonic current
β h The ratio of the hth harmonic current to the fundamental current
I P V 1 Fundamental harmonic current of the PV system
I P V h The hth harmonic current of the PV system
β P V h The ratio of the hth harmonic current to the fundamental current of the PV system
S P V 95 The 95th percentile of the injected apparent power of the PV system
CF1Filter’s main capacitor
LFFilter’s inductor
CF2Filter’s auxiliary capacitor
RFFilter’s resistance
XLFFilter’s inductive reactance
XCF2Auxiliary capacitive reactance of the filter
XFFilter’s equivalent reactance at the fundamental frequency
Z F h The hth harmonic impedance of the filter
ZshuntImpedance of the double-arm branch
ZCF1Impedance of the main capacitor
PHC95The 95th percentile of the PHC
X C F 1 95 The 95th percentiles of the filter’s main capacitive reactance
X F 95 The 95th percentiles of the filter’s equivalent reactance at the fundamental frequency
R F 95 The 95th percentiles of the filter’s damping resistance
P P V 95 The 95th percentile of the injected active power of the PV system
V B 95 The 95th percentile of the bus rms voltage
V B min Minimum bus voltages
V B max Maximum bus voltages
I L , R m s 95 The 95th percentile of the line’s current
I L , max r m s Maximum thermal capacity limit of the line’s current
DPF95The 95th percentile of the displacement power factor
PF95The 95th percentile of the power factor
DPFminMinimum DPF limit
DPFmaxMaximum DPF limit
PFminMinimum PF limit
PFmaxMaximum PF limit
TDDmaxMaximum limit for the 95th percentile of total demand distortion TDD95
THDVmaxMaximum limit for the 95th percentile of total harmonic voltage distortion THDV95
I H C D max h Maximum limit for the 95th percentile of individual current harmonic distortion
I H V D max h Maximum limit for the 95th percentile of individual voltage harmonic distortion
IflFull load current (maximum demand) under normal operating conditions
I L 1 Fundamental line current
V L 1 Fundamental bus voltage
V L h The hth harmonic voltage at the PCC
X t j Position of the jth agent at the tth iteration
ν t j Velocity of the jth agent at the tth iteration
a t j Acceleration of the jth agent at the tth iteration
r1, r2, r3Uniformly distributed random numbers in the range of [0, 1]
CX, CYPositive coefficients
XbestBest position achieved so far
NmaxMaximum number of iterations

Appendix A

Table A1. The harmonic current spectrum of a typical nonlinear load, and the corresponding limits [34].
h5711131719232529
Magnitude (%)2014.39.17.75.95.34.34.03.4
I H C D max h (%)7 7 3.53.52.52.5111
Table A2. A utility’s background voltage harmonics, and the corresponding limits [34].
h5711131719232529
Magnitude (%)32211110.50.5
I H V D max h (%)333333333
Table A3. The harmonic currents of a typical DG unit (PV-based) [34].
hMagnitude (%)hMagnitude (%)hMagnitude (%)
1100110.67210.5
21.13120.8220.4
33.27130.46230.2
40.26141.06240.35
53.48150.3251.33
60.12160.5260.19
71.12171.48270.61
80.82180.59281.2
90.49191.14290.9
100.84200.71300.67

References

  1. Ismael, S.M.; Abdel Aleem, S.H.E.; Abdelaziz, A.Y.; Zobaa, A.F. State-of-the-art of hosting capacity in modern power systems with distributed generation. Renew. Energy 2019, 130, 1002–1020. [Google Scholar] [CrossRef]
  2. Papathanassiou, S.; Hatziargyriou, N.; Anagnostopoulos, P.; Aleixo, L.; Buchholz, B.; Carter-Brown, C.; Drossos, N.; Enayati, B.; Fan, M.; Gabrion, V.; et al. Capacity of Distribution Feeders for Hosting DER; CIGRE Working Group C6.24; CIGR: Paris, France, 2014; Available online: https://www.cigreaustralia.org.au/assets/ITL-SEPT-2014/3.1-Capacity-of-Distribution-Feeders-for-hosting-Distributed-Energy-Resources-DER-abstract.pdf (access on 15 February).
  3. Abdel Aleem, S.H.A.; Zobaa, A.F.; Mageed, H.M.A. Assessment of energy credits for the enhancement of the Egyptian green pyramid rating system. Energy Policy 2015, 87, 407–416. [Google Scholar] [CrossRef]
  4. Stetz, T.; Marten, F.; Braun, M. Improved low voltage grid-integration of photovoltaic systems in Germany. IEEE Trans. Sustain. Energy 2013, 4, 534–542. [Google Scholar] [CrossRef]
  5. Horizon Power. Renewable Energy: Available Hosting Capacity, Australia. 2017. Available online: https://www.horizonpower.com.au/media/1592/hosting-capacities-fact-sheet-030317.pdf (accessed on 21 January 2019).
  6. Chattopadhyay, D.; Alpcan, T. Capacity and Energy-Only Markets under High Renewable Penetration. IEEE Trans. Power Syst. 2016, 31, 1692–1702. [Google Scholar] [CrossRef]
  7. Sakar, S.; Balci, M.E.; Abdel Aleem, S.H.E.; Zobaa, A.F. Increasing PV hosting capacity in distorted distribution systems using passive harmonic filtering. Electr. Power Syst. Res. 2017, 148, 74–86. [Google Scholar] [CrossRef]
  8. Sakar, S.; Balci, M.E.; Abdel Aleem, S.H.E.; Zobaa, A.F. Integration of large-scale PV plants in non-sinusoidal environments: Considerations on hosting capacity and harmonic distortion limits. Renew. Sustain. Energy Rev. 2018, 82, 176–186. [Google Scholar] [CrossRef]
  9. Deuse, J.; Benintendi, D. Power System and Market Integration of DER, the EU-Deep approach. In Proceedings of the 18th International Conference and Exhibition on Electricity Distribution, Turin, Italy, 6–9 June 2005. [Google Scholar]
  10. Meuser, M.; Vennegeerts, H.; Schäfer, P. Impact of voltage control by distributed generation on hosting capacity and reactive power balance in distribution grids. IET Conf. Proc. 2012. [Google Scholar] [CrossRef]
  11. Mende, D. Increasing the hosting capacity of distribution networks for distributed generation using reactive power control-potentials and limits. In Proceedings of the 2nd International Workshop on Integration of Solar Power into Power Systems, Lisbon, Portugal, 12–13 November 2012; pp. 153–159. [Google Scholar]
  12. Seuss, J.; Reno, M.J.; Broderick, R.J.; Grijalva, S. Improving distribution network PV hosting capacity via smart inverter reactive power support. IEEE Power Energy Soc. Gen. Meet. 2015. [Google Scholar] [CrossRef]
  13. Arshad, A.; Lindner, M.; Lehtonen, M. An analysis of photo-voltaic hosting capacity in Finnish low voltage distribution networks. Energies 2017, 10. [Google Scholar] [CrossRef]
  14. Rauma, K.; Cadoux, F.; Hadj-Saïd, N.; Dufournet, A.; Baudot, C.; Roupioz, G. Assessment of the MV/LV on-load tap changer technology as a way to increase LV hosting capacity for photovoltaic power generators. IET Conf. Proc. 2016. [Google Scholar] [CrossRef]
  15. Bletterie, B.; Kadam, S.; Bolgaryn, R.; Zegers, A. Voltage Control with PV Inverters in Low Voltage Networks-In Depth Analysis of Different Concepts and Parameterization Criteria. IEEE Trans. Power Syst. 2017, 32, 177–185. [Google Scholar] [CrossRef]
  16. Long, C.; Ochoa, L.F. Voltage control of PV-rich LV networks: OLTC-fitted transformer and capacitor banks. IEEE Trans. Power Syst. 2016, 31, 4016–4025. [Google Scholar] [CrossRef]
  17. Capitanescu, F.; Ochoa, L.F.; Margossian, H.; Hatziargyriou, N.D. Assessing the potential of network reconfiguration to improve distributed generation hosting capacity in active distribution systems. IEEE Trans. Power Syst. 2015, 30, 346–356. [Google Scholar] [CrossRef]
  18. Takenobu, Y.; Kawano, S.; Hayashi, Y.; Yasuda, N.; Minato, S.I. Maximizing hosting capacity of distributed generation by network reconfiguration in distribution system. In Proceedings of the 19th Power Systems Computation Conference (PSCC), Genoa, Italy, 20–24 June 2016. [Google Scholar] [CrossRef]
  19. Fu, Y.Y.; Chiang, H.D. Toward optimal multi-period network reconfiguration for increasing the hosting capacity of distribution networks. IEEE Power Energy Soc. Gen. Meet. 2018. [Google Scholar] [CrossRef]
  20. Ismael, S.M.; Abdel Aleem, S.H.E.; Abdelaziz, A.Y.; Zobaa, A.F. Practical Considerations for Optimal Conductor Reinforcement and Hosting Capacity Enhancement in Radial Distribution Systems. IEEE Access 2018, 6, 27268–27277. [Google Scholar] [CrossRef]
  21. Palacios-Garcia, E.J.; Moreno-Muñoz, A.; Santiago, I.; Moreno-Garcia, I.M.; Milanés-Montero, M.I. PV hosting capacity analysis and enhancement using high resolution stochastic modeling. Energies 2017, 10. [Google Scholar] [CrossRef]
  22. Jayasekara, N.; Masoum, M.A.S.; Wolfs, P.J. Optimal operation of distributed energy storage systems to improve distribution network load and generation hosting capability. IEEE Trans. Sustain. Energy 2016, 7, 250–261. [Google Scholar] [CrossRef]
  23. Zhao, J.; Wang, J.; Xu, Z.; Wang, C.; Wan, C.; Chen, C. Distribution Network Electric Vehicle Hosting Capacity Maximization: A Chargeable Region Optimization Model. IEEE Trans. Power Syst. 2017, 32, 4119–4130. [Google Scholar] [CrossRef]
  24. Etherden, N.; Bollen, M.H.J. Overload and overvoltage in low-voltage and medium-voltage networks due to renewable energy-Some illustrative case studies. Electr. Power Syst. Res. 2014, 114, 39–48. [Google Scholar] [CrossRef]
  25. Etherden, N.; Bollen, M.H.J. Increasing the hosting capacity of distribution networks by curtailment of renewable energy resources. In Proceedings of the IEEE PES Trondheim PowerTech: The Power of Technology for a Sustainable Society, POWERTECH, Trondheim, Norway, 19–23 June 2011. [Google Scholar]
  26. Sun, W.; Harrison, G.P.; Djokic, S.Z. Incorporating harmonic limits into assessment of the hosting capacity of active networks. In Proceedings of the CIRED Workshop: Integration of Renewables into the Distribution Grid, Lisbon, Portugal, 29–30 May 2012; p. 325. [Google Scholar] [CrossRef]
  27. Bollen, M.H.J.; Rönnberg, S.K. Hosting capacity of the power grid for renewable electricity production and new large consumption equipment. Energies 2017, 10, 1325. [Google Scholar] [CrossRef]
  28. Abad, M.S.; Zhang, J.M.; Ahmadyar, A.S.; Marzooghi, H. Sensitivity of hosting capacity to data resolution and uncertainty modeling. In Proceedings of the Australasian Universities Power Engineering Conference (AUPEC), Auckland, New Zealand, 27–30 November 2018. [Google Scholar]
  29. Al-Saadi, H.; Zivanovic, R.; Al-Sarawi, S.F. Probabilistic Hosting Capacity for Active Distribution Networks. IEEE Trans. Ind. Inform. 2017, 13, 2519–2532. [Google Scholar] [CrossRef]
  30. Bollen, M.H.J. Overvoltages due to wind power -hosting capacity, deterministic and statistical approaches. Electr. Power Qual. Util. Mag. 2008, 3, 2–15. [Google Scholar]
  31. El-Khattam, W.; Hegazy, Y.G.; Salama, M.M.A. Investigating distributed generation systems performance using Monte Carlo simulation. IEEE Trans. Power Syst. 2006, 21, 524–532. [Google Scholar] [CrossRef]
  32. Pérez Abril, I. Passive filters’ placement considering parameters’ variations. Int. Trans. Electr. Energy Syst. 2018. [Google Scholar] [CrossRef]
  33. IEEE Recommended Practices and Requirements for Harmonic Control in Electrical Power Systems; IEEE 519; IEEE: Piscataway, NJ, USA, 2014.
  34. Ismael, S.M.; Abdel Aleem, S.H.E.; Abdelaziz, A.Y. Hosting Capacity Enhancement of Electrical Distribution Systems under Sinusoidal and Non-Sinusoidal Conditions. In Proceedings of the 20th International Middle East Power Systems Conference (MEPCON), Cairo, Egypt, 18–20 December 2018. [Google Scholar]
  35. Jordan, R. Metaheuristic Optimization in Power Engineering, 1st ed.; The Institution of Engineering and Technology (IET): London, UK, 2018. [Google Scholar] [CrossRef]
  36. Panigrahi, B.K.; Suganthan, P.N.; Das, S.; Dash, S.S. Swarm, Evolutionary, and Memetic Computing. In Proceedings of the Third International Conference (SEMCCO), Bhubaneswar, India, 20–22 December 2012. [Google Scholar]
  37. Talbi, E. A Taxonomy of Hybrid Metaheuristics. J. Heuristics 2002, 8, 541–546. [Google Scholar] [CrossRef]
  38. Mirjalili, S.; Hashim Siti, Z.M. A new hybrid PSOGSA algorithm for function optimization. In Proceedings of the IEEE International Conference on Computer and Information Application (ICCIA), Tianjin, China, 3–5 December 2010; pp. 374–377. [Google Scholar]
  39. Rashedi, E.; Nezamabadi, S.; Saryazdi, S. GSA: A Gravitational Search Algorithm. Inf. Sci. 2009, 179, 2232–2248. [Google Scholar] [CrossRef]
  40. Zobaa, A.F.; Abdel Aleem, S.H.E.; Abdelaziz, A.Y. Classical and Recent Aspects of Power System Optimization, 1st ed.; Elsevier Academic Press: Amsterdam, The Netherlands, 2018; ISBN 9780128124413. [Google Scholar]
  41. Radosavljević, J. A Solution to the Combined Economic and Emission Dispatch Using Hybrid PSOGSA Algorithm. Appl. Artif. Intell. 2016, 30, 445–474. [Google Scholar] [CrossRef]
  42. Tolba, M.; Rezk, H.; Tulsky, V.; Diab, A.; Abdelaziz, A.; Vanin, A. Impact of Optimum Allocation of Renewable Distributed Generations on Distribution Networks Based on Different Optimization Algorithms. Energies 2018, 11, 245. [Google Scholar] [CrossRef]
  43. Askarzadeh, A. A novel metaheuristic method for solving constrained engineering optimization problems: Crow search algorithm. Comp. Struct. 2016, 169, 1–12. [Google Scholar] [CrossRef]
  44. Abdel Aleem, S.H.E.; Zobaa, A.F.; Balci, M.E. Optimal resonance-free third-order high-pass filters based on minimization of the total cost of the filters using Crow Search Algorithm. Electr. Power Syst. Res. 2017, 151, 381–394. [Google Scholar] [CrossRef]
  45. Ali, Z.M.; Alenezi, F.Q.; Kandil, S.S.; Abdel Aleem, S.H.E. Practical considerations for reactive power sharing approaches among multiple-arm passive filters in non-sinusoidal power systems. Int. J. Electr. Power Energy Syst. 2018, 103, 660–675. [Google Scholar] [CrossRef]
  46. Abdelaziz, A.Y.; Mekhamer, S.F.; Ismael, S.M. Technical considerations in harmonic mitigation techniques applied to the industrial electrical power systems. In Proceedings of the 22nd International Conference and Exhibition on Electricity Distribution (CIRED), Stockholm, Sweden, 10–13 June 2013. [Google Scholar]
Figure 1. The test system under study.
Energies 12 01018 g001
Figure 2. The per-phase equivalent circuit of the proposed C-type shunt passive filter.
Energies 12 01018 g002
Figure 3. The concept of uncertainty handling in PHC analysis.
Energies 12 01018 g003
Figure 4. A comprehensive flowchart for the proposed problem formulation.
Energies 12 01018 g004
Figure 5. Convergence characteristics of PSOGSA, PSO, and CSA.
Energies 12 01018 g005
Figure 6. Probabilistic load parameters and their corresponding 95th percentiles: (a) Active power demand, (b) reactive power demand.
Energies 12 01018 g006
Figure 7. Results of the probabilistic performance indices and their corresponding PDFs: (a) total demand distortion (TDD), (b) total harmonic distortion for the voltage (THDV), (c) displacement power factor (DPF), (d) power factor (PF), and (e) bus voltage (rms); (f) cumulative distribution function of the PHC.
Energies 12 01018 g007aEnergies 12 01018 g007b
Figure 8. Overall comparison between the DHC and PHC results, achieved by using different design approaches.
Energies 12 01018 g008
Figure 9. Contour plots of operational performance indices and the corresponding PHC levels: (a) PHC (%) versus NLL (%) and BVD (%), (b) PHC (%) versus TDD (%) and THDV (%).
Energies 12 01018 g009
Table 1. Numerical values of the parameters used.
AlgorithmParameterValue
PSOGSANumber of search agents20
CX0.5
CY1.5
Gravitational search algorithm (GSA)-controlling constant (α)20
GSA initial gravitational constant (G0)1
Maximum number of iterations (Nmax) 500
PSONumber of search agents20
Cognitive coefficient (C1) 2
Acceleration coefficient (C2)2
Minimum inertia weight0.1
Maximum inertia weight1.1
Maximum number of iterations500
CSANumber of search agents20
Flight length (fl)2
Awareness probability (AP)0.1
Maximum number of iterations500
Table 2. Operational parameters and deterministic HC (DHC) results obtained using the designed filters.
ParameterBase SystemCompensated System
PSOGSAPSOCSA
Optimized filter parameters Qfilter (MVar), RF (pu), Xl (pu)4.2060.6320.1893.9020.6620.1733.8940.6770.165
Vmin (pu)0.94930.9910.9880.987
TDD (%)6.63027.96828.0008.000
THDV (%)5.45634.04044.10234.1233
Line loss (pu)0.037660.003220.003770.00419
Filter loss (pu)0.00340.00340.0034
Total power loss (pu)0.037660.00660.00720.0076
DPF (%)92.0099.999599.229899.2716
PF (%)91.691997.118896.786397.0521
DHC (%)Nil53.0950.8449.03
Table 3. Tolerances used for the deviations of the studied parameters from their mean values.
Parameter Tolerance
Δ P L 95 ± 10%
Δ Q L 95 ± 10%
Δ S P V 95 ± 5%
Δ Q F i l t e r 95 ± 1%
Δ R F 95 ± 1%
Δ X L F 95 ± 1%
Δ I n l h , 95 ± 1%
Δ I P V h , 95 ± 1%
Δ V U t i l i t y h , 95 ± 1%
Table 4. Operational parameters and PHC results that are obtained using the designed filters.
ParameterPSOGSAPSOCSA
Optimized filter parameters Qfilter (MVar), RF (pu), Xl (pu)2.9111.0710.1792.6051.1010.2052.8131.1090.239
Vmin (pu)0.99290.99280.9941
TDD (%)7.4447.34177.1713
THDV (%)4.4294.19294.4322
Line loss (pu)0.001470.001350.00166
Filter loss (pu)0.00160.00270.0025
Total power loss (pu)0.00310.00410.0042
DPF (%)98.585398.457297.5713
PF (%)94.814594.177091.5357
PHC (%)74.1573.3872.65
Table 5. Harmonic spectrum of the examined multi-pulse VFD systems.
Harmonic OrderHarmonic Current Magnitude (%)
6-Pulse VFD12-Pulse VFD18-Pulse VFD
1100100100
52000
714.300
119.18.30
137.76.700
175.905.8
195.305.26
234.300.2
254.02.800.2
293.42.300.16
Table 6. Operational parameters and PHC results obtained using multi-pulse VFD configurations.
Parameter6-Pulse VFD12-Pulse VFD18-Pulse VFD
Vmin (pu)0.99760.99650.9970
TDD (%)7.28295.95375.9002
THDV (%)4.25623.85523.7731
Line loss (pu)0.001470.001180.00107
Filter loss (pu) 0.00160.00160.0016
Total power loss (pu)0.00310.002780.00276
DPF (%)97.255399.998899.9906
PF (%)91.875595.642195.2566
PHC (%)74.1576.456876.7057

