Thermal Characterization of a Heat Management Module Containing Microencapsulated Phase Change Material


1
Department of Mechanical Engineering, Southern Taiwan University of Science and Technology, Tainan 710, Taiwan
2
Department of Creative Design, National Yunlin University of Science and Technology, Douliou 640, Taiwan
3
Department of Civil Engineering, National Cheng Kung University, Tainan 701, Taiwan
*
Author to whom correspondence should be addressed.
Energies 2019, 12(11), 2164; https://doi.org/10.3390/en12112164
Submission received: 7 April 2019
/
Revised: 27 May 2019
/
Accepted: 3 June 2019
/
Published: 6 June 2019
(This article belongs to the Section D: Energy Storage and Application)
Abstract
:In this study, a heat management module containing a microencapsulated phase change material (mPCM) was fabricated from mPCM (core material: paraffin; melting temperature: 37 °C) and aluminum honeycomb structures (8 mm core cell). The aluminum honeycomb functioned both as structural support and as a heat transfer channel. The thermal management performance of the proposed module under constant-temperature boundary conditions was investigated experimentally. The thermal protection period of the module decreased as the Stefan number increased; however, increasing the subcooling factor could effectively enhance the thermal protection performance. When the cold-wall temperature TC was fixed at 17 °C and the initial hot wall temperature was 47–67 °C, the heat dissipation of the module was complete 140 min after the hot-wall heat supply was stopped. The time required to complete the heat dissipation increased to 280 min when TC increased to 27 °C.
1. Introduction
Phase change material (PCM) can effectively store and release a large amount of latent heat during the solid-liquid phase transition (melting or solidification). Therefore, PCM is an important candidate for applications of energy storage and environmental control materials. For example, PCM-partitioned walls inside buildings can be used to regulate the room temperature [1,2]; PCM-containing temperature-control devices in space equipment can compensate for the large temperature difference between the day and night in space [3]; thermal management by PCMs in electronic devices, batteries, and biochemical storage tanks enables these systems to operate at nominal temperatures [4]; PCMs can be integrated in the design of clothing insulation [5]; the injection of PCM particles into the working fluid in heat flow lines can enhance the heat transfer efficiency [6]; and PCM can also be used in the development of thermal actuators [7]. Kalnæs and Jelle [8] summarized the PCM requirements into high latent heat per unit volume and mass, suitable phase change temperature, capability to operate at low pressure, stable chemical properties, low corrosion rates, nontoxic, recrystallizable, high crystallization rate, low supercooling, small volume change during phase transition, high thermal conductivity, and low cost.
During the phase transition, PCMs may have issues such as uneven melting/solidification and phase separation; the microencapsulation of a PCM (mPCM) can effectively reduce this unevenness, prevent the occurrence of phase separation, and increase the heat transfer area [9]. Moreover, the PCM may have an effect on the construction structure and vary the properties of the matrix substances, or leakage may be a problem over the operation lifetime. However, the mPCM may change this situation, and it is thus a very promising material choice for energy applications [10,11]. Comprehensive reviews on mPCM, including their thermophysical properties, operation stability, preparation methods, applications in building energy, and thermal performance analyses, as well as the advantages and disadvantages of various encapsulation techniques and application limitations, are found in the literature [12,13,14,15,16,17].
Hasse et al. [18] filled an aluminum honeycomb board with PCM to improve the thermal conductivity and prevent PCM leakage. Mahmoud et al. [19] introduced PCM into portable electronic devices to prevent overheating. Six different PCMs were studied, including paraffin wax, two mixtures of inorganic hydrated salts, two mixtures of organic substances, and a mixture of organic and inorganic substances. Additionally, six PCM sinks were tested, including one with a pure PCM, two with a parallel fin array, two with a cross fin configuration, and one with a honeycomb board. The results showed that increasing the number of fins could enhance heat distribution. In addition, the incorporation of the honeycomb board could improve the heat dissipation performance.
Zhu et al. [20] experimentally investigated the transient performance of a PCM-based heat sink with copper foam. The effects of the filling height ratio of the copper foam, the pore size of the copper foam, and the heating energy were explored parametrically. The results showed that the PCM-based heat sink could restrain the temperature excursions during the heating period and that the performance could be improved monotonously with an increase in the filling height ratio. Khattak and Ali [21] reviewed the air-cooled heat sink geometries subjected to forced flow. The outcome of their study validates the concept of an improved heat transfer approach, provides useful data for innovative design and helps better understand the cooling capabilities of the pin-fin technology. Wang et al. [22] combined an mPCM and aluminum honeycomb boards to construct an mPCM honeycomb wallboard, and experimentally investigated the daily thermal behaviors of this wallboard. The results showed that the indoor air conditions have a certain influence on the thermal performance of the wallboard and that the PCM inside the wallboard can effectively dissipate heat during the heat-releasing period at night.
To improve the low thermal conductivity of the mPCM and achieve the required structural stiffness, our previous study [11] proposed incorporating an mPCM into aluminum honeycombs to fabricate an mPCM honeycomb prototype that provided better control over the surface temperature than the other modules (mPCM only, mPCM + EG (expanded graphite), and mPCM + iron-wire). Potential applications of the prototype include building environment control, adaptation to solar heating shock, thermal management to limit temperature spikes in electronics, biomedical devices, and spacecraft transportation, etc. The objective of the present study is to understand the thermal management capacity of the module during thermal shocks and provide insights into its application, as little or no information is currently available. In doing so, experiments during endothermic and exothermic processes have been performed under constant-temperature boundary conditions.
2. Materials and Method
In this study, the heat management module was prepared from an mPCM and aluminum honeycomb board. The heat absorption and dissipation processes of the test module were investigated experimentally. The test module and peripheral devices are shown in Figure 1. One side of the test module was in contact with the hot wall. Three hot-wall temperatures TH of 47, 57, and 67 °C (with Stefan numbers (Equation (5)) of 0.2, 0.4, and 0.6, respectively) were maintained by controlling the input power. The cold-wall temperature was controlled by adjusting the temperature of the circulating water from the refrigerated circulator. Two cold-wall temperatures TC of 17 and 27 °C were used with subcooling factors (Equation (6)) of 0.54 and 0.27, respectively. The thermal performance of the test module was analyzed by measuring the interior and surface temperatures of the module.
2.1. Test Module
To advance the low thermal conductivity of the mPCM layer and achieve the required stiffness, aluminum honeycomb (25.4 mm thick; 8 mm core cell; 7.8 kg/m2; k = 210 W/m K (aluminum sheet)) was used as a structural skeleton, as well as a thermal channel to enhance the heat transfer within the test module. The module dimensions were 10 cm (H) × 2.54 (W) cm × 10 cm (L). mPCM powder was placed in a dehumidification container for one hour to remove water attached to the mPCM powder surfaces, thus reducing any weight deviation from an uneven allocation. It was then poured and pressed into the honeycomb board. The weight of the mPCM used in both test modules was 120.0 g. To reduce the amount of heat loss to the environment, the test module was positioned on a Balsa board box (with a board thickness of 2 mm) and then covered with cotton thermal insulation. The module was finally placed into a wooden box, to assist in the elimination of outside interference.
2.1.1. The mPCM Capsule Employed
The mPCM (model MPCM 37-D) used in this study was manufactured by Microtek Laboratories, Inc. (Dayton, OH, USA). The core material was paraffin, the mean particle size was 17–20 microns, the capsule composition was 85–90 wt.% PCM and 10–15wt.% polymer shells, and the specific gravity was 0.9. The melting point, freezing point, latent heat, and specific heat of the mPCM employed in the experiment were measured using a differential scanning calorimeter (DSC) (DSC1, Mettler-Toledo, Columbus, OH, USA). The heating/cooling rate was 1 °C/min, and the measurement range was 20–50 °C. The melting temperature and melting latent heat values were obtained from the peak value and convex (or concave) area of the DSC heating curve. In the heating process, the onset, peak, and end temperatures were 25.5, 37.0, and 42.4 °C, respectively, and the latent heat was 166.54 kJ/kg [11]. At the first stage of the cooling process, the onset, peak, and end temperatures were 37.5, 33.0, and 27.0 °C, respectively, and the latent heat was 110.20 kJ/kg; at the second stage, the onset, peak, and end temperatures were 27.0, 22.8, and 20.0 °C, respectively, and the latent heat was 35.52 kJ/kg. The thermal conductivity was measured with a KD2-pro instrument. The measurement principle was the same as that in the metal transient hot-wire method. The instrument error was less than ±5%, and the measurement range was 10–60 °C. Before and after mPCM melting, the average specific heat values were 3.21 and 2.70 kJ/kg °C, respectively [11].
2.1.2. Hot Wall with Constant Temperature TH
A hot wall was created by attaching the main heating sheet (Figure 1a) (10 cm × 10 cm mica heater) to a 1-mm thick copper plate (Figure 1b). The purpose of the copper plate was to uniformly distribute the heat within the hot wall to provide the constant temperature TH condition required for the experiment. In addition, to reduce the heat loss of the hot wall to the environment, another 10 cm × 10 cm mica heater was used as the auxiliary heating sheet, positioned 2 cm from the main heating sheet (Figure 1c). In the experiment, the input wattage of the main heating sheet was controlled to enable the hot wall temperature TH to attain the set value. The input wattage of the auxiliary heating sheet was also controlled to ensure that the surface temperature of the auxiliary heating sheet () was equal to that of the main heating sheet (). Hence, heat from the main heating sheet was transferred to the test module in a single direction.
2.1.3. Cold Wall with Constant Temperature Tc
The cold wall (Figure 1d) consisted of a constant-temperature plate. The constant-temperature plate was a 180 mm × 180 mm aluminum block with a thickness of 1.3 cm, including a labyrinth waterway. Thermoregulated water from the refrigerated circulator flowed rapidly through the waterway to allow the constant-temperature plate to quickly reach the set temperature Tc.
2.2. Measurements in the Experiment
In this study, type K thermocouples were used to measure the temperature at various positions. Five thermocouples were placed on the constant-temperature plate to monitor the cold-wall temperature. Five thermocouples were placed on the surface of the main heating sheet to monitor . Five thermocouples were placed on the surface of the auxiliary heating sheet to monitor . Five thermocouples were placed on the surface of the copper plate to monitor the hot-wall temperature. Ten thermocouples were placed at 10 different positions on the mPCM and the surface of the aluminum honeycomb board to observe the temperature changes in the test module. Another two temperature-measuring points were set at the inlet and the outlet of the refrigerated circulator connected to the constant temperature plate to monitor the temperature change of the cooling end. Heat flows outward, toward the exterior side of the module, and inward, into the cold wall, were measured directly using heat flux sensors.
The equipment and the data acquisition system required for this experiment included a data acquisition unit (MX-100, YOKOGAWA Co., Ltd., Tokyo, Japan), a personal computer, a DC power supply (SPD-3606, Good Will Instrument Co., Ltd, New Taipei City, Taiwan), a refrigerated circulator (RCB-412, Double Eagle Enterprise Co., Ltd, New Taipei City, Taiwan), a differential scanning calorimeter (DSC) (DSC1, Mettler-Toledo, Columbus, OH, USA), a KD2-pro instrument (Decagon Devices, Inc., Pullman, WA, USA), and heat flux sensors (MF-180, EKO Instruments, Tokyo, Japan).
2.3. Experimental Procedure
Before the experiment, the overall temperature of the test module was set to the cold-wall temperature. At the beginning of the experiment, a large amount of power was supplied to the heating sheet to quickly obtain a hot wall with a constant temperature. The input power was reduced when the hot-wall temperature TH approached the set temperature. During the test, because the mPCM in the test module gradually melted, the hot-wall temperature would gradually increase or decrease depending on the amount of melting. Therefore, the input power of the power supply must constantly be adjusted to maintain a stable hot-wall temperature. The input power of the auxiliary heating sheet also required adjustments to ensure that the surface temperature of the auxiliary heating sheet was equal to that of the main heating sheet.
2.4. Experiment Data
Major data includes the temperature measured by each thermocouple, the output voltage, and current from the power supply. The heat transfer is then calculated as follows:
(1) Calculation of input heat,
Voltage V (V) and current I (A) from the power supply were extracted using the data acquisition unit. The input heat (W) was calculated by the formula .
(2) Heat loss estimation, [20]
During the experiment, it was difficult to adjust the temperature of the auxiliary heating sheet to perfectly match the temperature of the main heating sheet. Therefore, the heat transfer between the main and auxiliary heating sheets was considered. The distance between the two heating sheets was 2 cm. The heat transfer between the main and auxiliary heating sheets was calculated for two cases:
(2a) , and apply Equation (1) as follows:
(2b) and apply Equation (2) as follows:
where was calculated by Equation (3) as follows:
The parameter range is as follows: , , .
The Rayleigh numbers () were calculated by Equation (4) as follows:
where is the thermal conductivity of air, is the surface temperature of the main heating sheet, is the surface temperature of the auxiliary heating sheet, A is the hot-wall area, w is the distance between the two heating sheets, and are the surface emissivities of the two heating sheets (=0.074), is the Stefan–Boltzmann constant (=5.67 × 10⁻⁸ W/m2K4), is the thermal expansion coefficient of air, is the temperature difference between the main and auxiliary heating sheets, is the thermal diffusion coefficient of air, and is the kinematic viscosity of air.
(3) Corrected input heat,
After calculating the heat loss, the corrected input heat was obtained by subtracting from the input heat . The calculated was positive when the temperature of the auxiliary heating sheet was lower than that of the main heating sheet, and vice versa.
(4) Modified Stefan number (Ste*)
The Stefan number was calculated from the latent heat , the specific heat , the phase change temperature ( = 37 °C) of the mPCM and the hot-wall temperature (an experimental variable):
(5) Modified subcooling factor (Sb*)
The modified subcooling factor was determined from the cold-wall temperature and the phase-change temperature as follows:
2.5. Experimental Uncertainty
Uncertainties in the measurement for this study were estimated to be ±0.1 °C for the temperature, ±0.05 W for the heat input, as measured by an electronic Watt meter, and ±2% in the heat flux measured by the heat flow meter. These errors are believed to be inconsequential to the results of the experiment. The heat fluxes (out of the test module) to the cooling end and the sides were measured synchronously. To repeat the heat transfer behavior of the tested module during service and to reduce the sideways heat flow, thermal insulation was applied around the lateral sides of the module. From the heat flow measurement at the periphery, the average accumulated heat flow of the case with = 47 °C and = 27 °C was 1.8% of the total inward heating. All the lateral heat flows were within an acceptable level. These errors are believed to be inconsequential to the results of the experiment.
3. Results and Discussion
3.1. The Melting Process
In this study, 37 °C (the melting point of the used PCM) was used to determine the location of the melting interface (volumetric melting fraction), which meant that the mPCM in the module between the melting interface and the hot wall was considered to be in the molten state. In contrast, the mPCM between the melting interface and the cold wall was considered to be in the solid state, i.e., had not melted.
The melting fraction and the interior temperature as a function of time at TC = 27 °C and various TH values are shown in Figure 2. Because the cold-wall temperature was fixed, the modified subcooling factor (Sc*) was constant. The modified Stefan number (Ste*) varied as the hot-wall temperature changed. The x-coordinate in the figure is the experimental time. The y-coordinate in the upper graphs is the melting fraction. No melting to full melting is represented by a value from 0 to 1.
When the hot-wall temperature TH was 47 °C, and the cold-wall temperature TC was 27 °C, the PCM began to melt at 11 min in the experiment. The melting rate was very low before the melting fraction equaled to 0.25 but started to increase after the melting fraction equaled to 0.25. The time required to reach the final melting interface location (melting fraction = 1) was approximately 90 min. When the hot-wall temperature TH was increased to 57 °C and the cold wall temperature TC was 27 °C, the melting tendency was the same as before; however, the melting rate was significantly higher. The PCM began to melt at 3 min, and the time required to reach the final melting fraction was approximately 47 min. When the hot-wall temperature TH was further increased to 67 °C and the cold wall temperature TC was 27 °C, the PCM began to melt at 2 min, and the time required to reach the final melting fraction was approximately 32 min.
The melting fraction and the interior temperature as a function of time at TC = 17 °C and various TH values are shown in Figure 3. When the hot-wall temperature TH was 47 °C and the cold-wall temperature TC was 17 °C, the PCM began to melt at 19 min, and the time required to reach the final melting fraction of 0.5 was approximately 174 min. When the hot-wall temperature TH was increased to 57 °C and the cold-wall temperature TC was 17 °C, the melting tendency was somewhat different from the previous cases, and the melting rate was significantly higher than in the previous cases. The PCM began to melt at 7 min, and the time required to reach the final melting fraction of 1 was approximately 90 min. When the hot-wall temperature TH was further increased to 67 °C and the cold-wall temperature TC was 17 °C, the PCM began to melt at 4 min, and the time required to reach the final melting fraction of 1 was approximately 56 min.
Figure 2 and Figure 3 show that when the cold-wall temperature was fixed, as the hot-wall temperature increased, the time at which the PCM began to melt was gradually advanced, and the melting rate increased. The heating curves of all temperature measurement points gradually stabilized toward their steady states with time, and the temperature differences between each point inside the mPCM (T2–T4) were not significant. The aluminum honeycomb used for the structural support and heat transfer channel quickly transferred the heat flow into the mPCM layer, where the temperatures within the whole module rose gradually and uniformly. The temperatures within the mPCM layer rose up to the PCM melting point and then reached the first plateaus.
The melting fraction as a function of the dimensionless time, i.e., the Fourier number (, α: thermal diffusivity of the mPCM, t: time (sec); and W: width of the module (2.54 cm)), is shown in Figure 4. At Ste* = 0.2 (hot-wall temperature TH = 47 °C, symbol ◇), the melting started relatively late. The melting rate was initially low but instantly increased. At the higher Ste* values, the melting started relatively early, and the melting rate was high. It can be seen that the increase in Ste* accelerates the melting process of the mPCM layer.
The data in Figure 2 and Figure 3 show that under continuous high-temperature heating, the interior temperature of the proposed heat management module started to increase after the PCM was completely melted. When using the proposed module as thermal protection, the protection performance will be greatly reduced after the PCM is entirely molten. The dimensionless time required for the proposed module to achieve complete melting (melting fraction = 1) was defined as Fo,cr and is plotted in Figure 5. The time interval from the beginning of the heating to the time Fo,cr could be regarded as an effective thermal-protection period. It was found that Fo,cr decreased rapidly as Ste* increased but could be increased effectively by increasing Sc*.
3.2. The Heat Dissipation Process in the Module
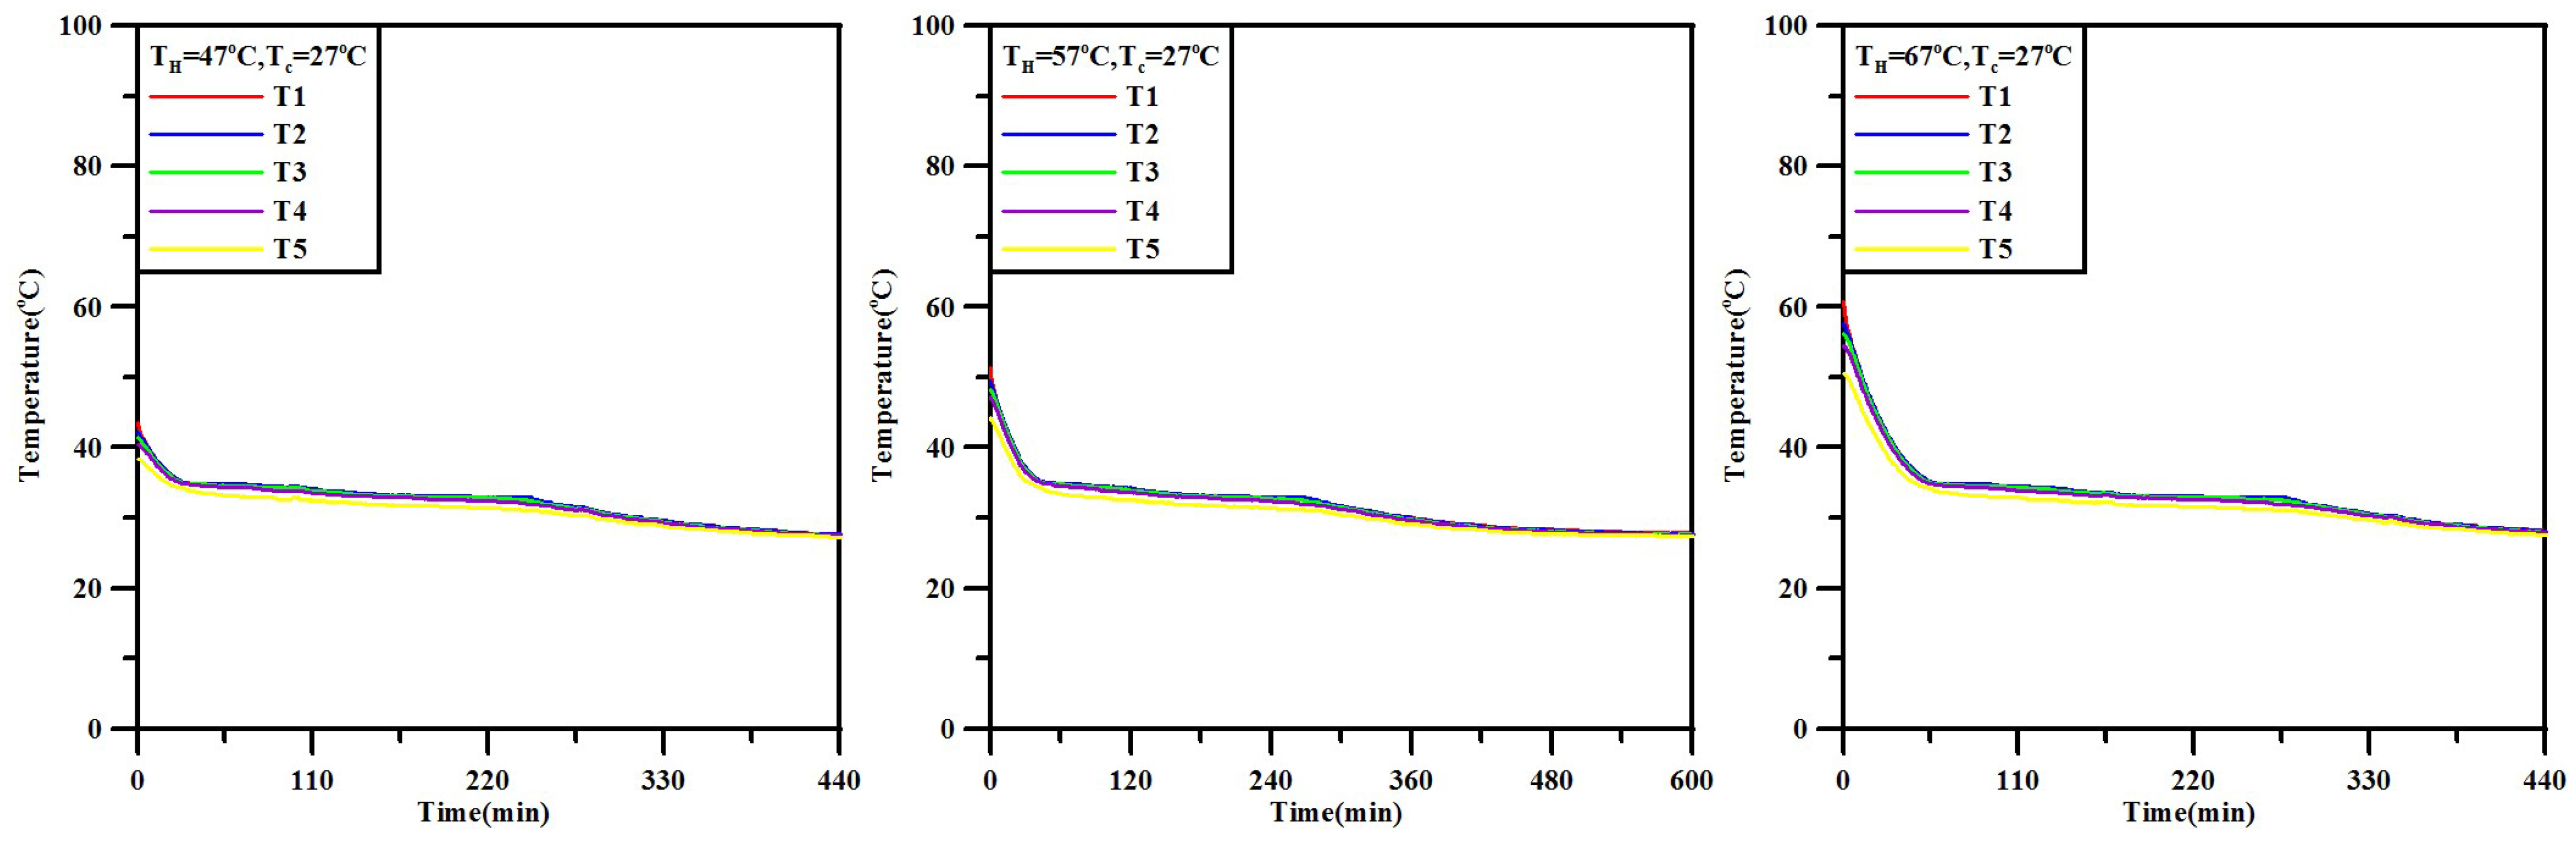
In Figure 6, the interior temperature change of the test module at TC = 27 °C after the heat supply was stopped is shown. When the initial hot-wall temperature reached 47, 57, and 67 °C, the hot-wall heat supply was stopped. The solidification of PCM began at 25, 40, and 55 min. The final solidification interface location was reached at approximately 250, 270, and 280 min.
The data in Figure 7 show that when the hot-wall heat supply was stopped at the initial temperature of 47 °C and TC was kept at 17 °C; the PCM started to solidify from the location of the melting fraction = 0.5. The solidification of PCM began 15 min into the experiment, and the time required to reach the final solidification interface location was approximately 105 min. When the initial hot-wall temperatures were 57 and 67 °C, the solidification of PCM began at 26 and 33 min, respectively, and the time required to reach the final solidification interface location was approximately 130 and 140 min, respectively.
When the cold wall temperature was fixed, as the initial hot-wall temperature increased, the time at which the PCM began to solidify was delayed while the solidification rate did not change. T1 and T5 represent the mPCM temperature near the hot wall and near the cold wall, respectively. After the phase-change temperature was reached, the temperature differences between each point inside the mPCM were not significant. In addition, the solidification point in each case was lower than the melting point, which was caused by the supercooling effect of the phase change material. The supercooling effect of the mPCM module was approximately 2.5 °C.
4. Conclusions
In this study, an mPCM module (10 cm × 10 cm × 2.54 cm) was prepared by incorporating mPCM (core material: paraffin; melting temperature: 37 °C) into aluminum honeycomb board (8 mm core cells). The thermal characteristics of the test module were investigated by measuring the temperature changes. The hot wall was maintained at constant temperatures of 47, 57, and 67 °C (Stefan numbers were 0.2, 0.4, and 0.6, respectively); the cold wall was maintained at constant temperatures of 17 and 27 °C (subcooling factors were 0.54 and 0.27, respectively). The proposed configuration can be found in practices, e.g., the thermal control module in exterior wall assemblies subjected to solar thermal shocks and indoor air-conditioning. The following conclusions result from this study:
- The thermal protection period of the test module decreases rapidly as the Stefan number increases; however, increasing the subcooling factor can effectively enhance the thermal protection performance.
- When the cold-wall temperature TC is fixed at 27 °C, at TH = 47, 57, and 67 °C (Stefan number = 0.2, 0.4, and 0.6, respectively), the effective thermal-protection periods are 90, 47, and 32 min. When the cold-wall temperature TC is fixed at 17 °C, the effective thermal-protection periods are infinitely large, 90 min, and 56 min.
- The cold-wall temperature has an effect on the time required for the PCM of the test module to completely solidify. When the cold wall temperature TC is 27 °C, and the initial hot-wall temperature is between 47–67 °C, the heat dissipation of the test module is completed 280 min after stopping the heating. When the cold-wall temperature TC is 17 °C, the heat dissipation of the test module is completed 140 min after stopping the heating.
The thermal protection period and the time to recovery to the original thermal condition in the representative thermal shock scenarios in this study provide informative strategies for thermal management in practical applications. However, the results are limited to the used mPCM and the chosen specific application configuration. To explore other applications, mPCM with different melting points could be tested.
Author Contributions
C.-M.L. and Y.-P.L. conceived and designed the model; H.M.S. and L.P.L. performed the experimental work; H.M.S. and C.-M.L. analyzed the data; and Y.-P.L. and C.-M.L. wrote the paper.
Funding
Support from the Ministry of Science and Technology of Taiwan through grant No. MOST 106-2221-E-006-194-MY3 is gratefully acknowledged.
Conflicts of Interest
The authors declare no conflict of interest.
References
- Errebai, F.B.; Chikh, S.; Derradji, L. Experimental and numerical investigation for improving the thermal performance of a microencapsulated phase change material plasterboard. Energy Convers. Manag. 2018, 174, 309–321. [Google Scholar] [CrossRef]
- Figueiredo, A.; Vicente, R.; Lapa, J.; Cardoso, C.; Rodrigues, F.; Kämpf, J. Indoor thermal comfort assessment using different constructive solutions incorporating PCM. Appl. Energy 2017, 208, 1208–1221. [Google Scholar] [CrossRef]
- Kim, T.; Hyun, B.-S.; Lee, J.-J.; Rhee, J. Numerical study of the spacecraft thermal control hardware combining solid–liquid phase change material and a heat pipe. Aerosp. Sci. Technol. 2013, 27, 10–16. [Google Scholar] [CrossRef]
- Huang, Y.H.; Cheng, W.L.; Zhao, R. Thermal management of Li-ion battery pack with the application of flexible form-stable composite phase change materials. Energy Convers. Manag. 2019, 182, 9–20. [Google Scholar] [CrossRef]
- Shaid, A.; Wang, L.; Padhye, R. The thermal protection and comfort properties of aerogel and PCM-coated fabric for firefighter garment. J. Ind. Text. 2016, 45, 611–625. [Google Scholar] [CrossRef]
- Ho, C.J.; Hsu, H.Y.; Tu, F.-J.; Lai, C. Numerical simulation of the heat transfer characteristics of a U-shaped thermosyphon containing a PCM suspension. Appl. Therm. Eng. 2016, 108, 1076–1085. [Google Scholar] [CrossRef]
- Ho, C.J.; Wang, W.J.; Lai, C.-M. Dynamic response of a thermally activated paraffin actuator. Int. J. Heat Mass Transf. 2016, 103, 894–899. [Google Scholar] [CrossRef]
- Kalnæs, S.E.; Jelle, B.P. Phase change materials and products for building applications: A state-of-the-art review and future research opportunities. Energy Build. 2015, 94, 150–176. [Google Scholar] [CrossRef] [Green Version]
- Salunkhe, P.; Shembekar, P. A review on effect of phase change material encapsulation on the thermal performance of a system. Renew. Sustain. Energy Rev. 2012, 16, 5603–5616. [Google Scholar] [CrossRef]
- Schossig, P.; Henning, H.; Gschwander, S.; Haussmann, T. Micro-encapsulated phase-change materials integrated into construction materials. Sol. Energy Mater. Sol. Cells 2005, 89, 297–306. [Google Scholar] [CrossRef]
- Lai, C.; Hokoi, S. Thermal performance of an aluminum honeycomb wallboard incorporating microencapsulated PCM. Energy Build. 2014, 73, 37–47. [Google Scholar] [CrossRef]
- Milián, Y.E.; Gutierrez, A.; Grágeda, M.; Ushak, S. A review on encapsulation techniques for inorganic phase change materials and the influence on their thermophysical properties. Renew. Sustain. Energy Rev. 2017, 73, 983–999. [Google Scholar] [CrossRef]
- Alva, G.; Lin, Y.; Liu, L.; Fang, G. Synthesis, characterization and applications of microencapsulated phase change materials in thermal energy storage: A review. Energy Build. 2017, 144, 276–294. [Google Scholar] [CrossRef]
- Yataganbaba, A.; Ozkahraman, B.; Kurtbas, I. Worldwide trends on encapsulation of phase change materials: A bibliometric analysis (1990–2015). Appl. Energy 2017, 185, 720–731. [Google Scholar] [CrossRef]
- Chandel, S.; Agarwal, T. Review of current state of research on energy storage, toxicity, health hazards and commercialization of phase changing materials. Renew. Sustain. Energy Rev. 2016, 67, 581–596. [Google Scholar] [CrossRef]
- Huang, X.; Zhu, C.; Lin, Y.; Fang, G. Thermal properties and applications of MPCM for thermal energy storage: A review. Appl. Therm. Eng. 2019, 147, 841–855. [Google Scholar] [CrossRef]
- Giro-Paloma, J.; Alkan, C.; Chimenos, J.; Fernández, A. Comparison of microencapsulated phase change materials prepared at laboratory containing the same core and different shell material. Appl. Sci. 2017, 7, 723. [Google Scholar] [CrossRef]
- Hasse, C.; Grenet, M.; Bontemps, A.; Dendievel, R.; Sallée, H. Realization, test and modelling of honeycomb wallboards containing a phase change material. Energy Build. 2011, 43, 232–238. [Google Scholar] [CrossRef]
- Mahmoud, S.; Tang, A.; Toh, C.; Al-Dadah, R.; Soo, S.L. Experimental investigation of inserts configurations and PCM type on the thermal performance of PCM based heat sinks. Appl. Energy 2013, 112, 1349–1356. [Google Scholar] [CrossRef]
- Zhu, Z.-Q.; Huang, Y.-K.; Hu, N.; Zeng, Y.; Fan, L.-W. Transient performance of a PCM-based heat sink with a partially filled metal foam: effects of the filling height ratio. Appl. Therm. Eng. 2018, 128, 966–972. [Google Scholar] [CrossRef]
- Khattak, Z.; Ali, H. Air cooled heat sink geometries subjected to forced flow: a critical review. Int. J. Heat Mass Transf. 2019, 130, 141–161. [Google Scholar] [CrossRef]
- Wang, S.-M.; Matiasovsky, P.; Mihalka, P.; Lai, C.-M. Experimental investigation of the daily thermal performance of a mPCM honeycomb wallboard. Energy Build. 2017, 159, 419–425. [Google Scholar] [CrossRef]
Figure 1.
Test module.

Figure 2.
The melting interface location (melting fraction) and the interior temperature of the mPCM as a function of time at TC = 27 °C and various TH values.
Figure 2.
The melting interface location (melting fraction) and the interior temperature of the mPCM as a function of time at TC = 27 °C and various TH values.

Figure 3.
The melting interface location (Melting fraction) and interior temperature of the mPCM as a function of time at TC = 17 °C and various TH values.
Figure 3.
The melting interface location (Melting fraction) and interior temperature of the mPCM as a function of time at TC = 17 °C and various TH values.

Figure 4.
The melting fraction as a function of dimensionless time Fo under constant temperature boundary conditions.
Figure 4.
The melting fraction as a function of dimensionless time Fo under constant temperature boundary conditions.

Figure 5.
Relation between Fo,cr with Ste* and Sc* under constant temperature boundary conditions.

Figure 6.
The solidification interface location (melting fraction) and the interior temperature of the mPCM as a function of time at TC = 27 °C after the heat supply was stopped (initial hot wall temperature TH).
Figure 6.
The solidification interface location (melting fraction) and the interior temperature of the mPCM as a function of time at TC = 27 °C after the heat supply was stopped (initial hot wall temperature TH).

Figure 7.
The solidification interface location (melting fraction) and the interior temperature of the mPCM as a function of time at TC = 17 °C after the heat supply was stopped (initial hot wall temperature TH).
Figure 7.
The solidification interface location (melting fraction) and the interior temperature of the mPCM as a function of time at TC = 17 °C after the heat supply was stopped (initial hot wall temperature TH).

© 2019 by the authors. Licensee MDPI, Basel, Switzerland. This article is an open access article distributed under the terms and conditions of the Creative Commons Attribution (CC BY) license (http://creativecommons.org/licenses/by/4.0/).
Share and Cite
MDPI and ACS Style
Shih, H.M.; Lin, Y.-P.; Lin, L.P.; Lai, C.-M. Thermal Characterization of a Heat Management Module Containing Microencapsulated Phase Change Material. Energies 2019, 12, 2164. https://doi.org/10.3390/en12112164
AMA Style
Shih HM, Lin Y-P, Lin LP, Lai C-M. Thermal Characterization of a Heat Management Module Containing Microencapsulated Phase Change Material. Energies. 2019; 12(11):2164. https://doi.org/10.3390/en12112164
Chicago/Turabian StyleShih, H.M., Yi-Pin Lin, L.P. Lin, and Chi-Ming Lai. 2019. "Thermal Characterization of a Heat Management Module Containing Microencapsulated Phase Change Material" Energies 12, no. 11: 2164. https://doi.org/10.3390/en12112164
Note that from the first issue of 2016, this journal uses article numbers instead of page numbers. See further details here.