Aerodynamically Interacting Vertical-Axis Wind Turbines: Performance Enhancement and Three-Dimensional Flow

1
Mechanical Engineering, Stanford University, Stanford, CA 94305, USA
2
Mechanical Engineering and Civil & Environmental Engineering, Stanford University, Stanford, CA 94305, USA
*
Author to whom correspondence should be addressed.
Energies 2019, 12(14), 2724; https://doi.org/10.3390/en12142724
Submission received: 14 June 2019
/
Revised: 11 July 2019
/
Accepted: 15 July 2019
/
Published: 16 July 2019
(This article belongs to the Special Issue State of the Art of Wind Farm Optimization)
Abstract
:This study examined three-dimensional, volumetric mean velocity fields and corresponding performance measurements for an isolated vertical-axis wind turbine (VAWT) and for co- and counter-rotating pairs of VAWTs with varying incident wind direction and turbine spacings. The purpose was to identify turbine configurations and flow mechanisms that can improve the power densities of VAWT arrays in wind farms. All experiments were conducted at a Reynolds number of . In the paired arrays, performance enhancement was observed for both the upstream and downstream turbines. Increases in downstream turbine performance correlate with bluff–body accelerations around the upstream turbine, which increase the incident freestream velocity on the downstream turbine in certain positions. Decreases in downstream turbine performance are determined by its position in the upstream turbine’s wake. Changes in upstream turbine performance are related to variations in the surrounding flow field due to the presence of the downstream rotor. For the most robust array configuration studied, an average 14% increase in array performance over approximately a 50° range of wind direction was observed. Additionally, three-dimensional vortex interactions behind pairs of VAWT were observed that can replenish momentum in the wake by advection rather than turbulent diffusion. These effects and their implications for wind-farm design are discussed.
1. Introduction
There is growing interest in the potential for vertical-axis wind turbine (VAWT) arrays to produce higher footprint energy densities than traditional horizontal-axis wind turbine (HAWT) arrays [1,2,3,4,5,6,7,8]. In field demonstrations, small VAWT arrays have achieved 24 W/m2 of output at 10 m/s wind speeds [9,10], compared to 3 W/m2 measured in state-of-the-art horizontal-axis wind farms in similar conditions [11]. This VAWT array performance was achieved without optimizing for power generation, suggesting an opportunity for even further improvement with optimization across parameters such as incident wind direction, turbine spacing, and rotational orientation.
Prior investigations have focused on the mechanisms that result in higher power densities in VAWT arrays [2,3,6,12,13,14,15,16]. Field studies have shown that wake recovery behind VAWTs can occur in as few as 4–6 turbine diameters [2,3,9] versus 15–20 D behind a HAWT [17]. The spatial extent of this recovery can be reduced by increasing the solidity [15] or tip-speed ratio [6] of the turbine. This rapid recovery has been hypothesized to be due to an induced mean vertical flow in the wake of the turbine. This mean-flow effect has been observed in the wake of an isolated turbine [12] and in an array of analogous rotating cylinders [14], which have been shown to have similar flow features to VAWTs (cf. [15,18,19]). Turbulent vertical mixing from above the array can also contribute to wake recovery, as observed in the wake of a single turbine in wind tunnel experiments [13] as well as in turbine arrays in both fieldwork [3] and simulations [16]. This turbulence-flux effect is well-documented in the literature (e.g., [20]), while the effects of an induced mean flow have not been extensively characterized.
In addition to the induced vertical flow phenomena hypothesized to be responsible for the rapid wake recovery behind VAWTs, a growing body of work has demonstrated flow phenomena which result in synergistic interactions between turbines. Numerical simulations focusing on linear arrays of turbines perpendicular to the freestream have demonstrated that the average array performance is higher for turbines in both co- and counter-rotating configurations than in isolation [6,21]. Further improvements in array performance have been observed in numerical [4,5,22,23], experimental [1], and field studies [8] of turbines that are angled with respect to the incident freestream. Expanding this concept to larger arrays of turbines, experimental studies of turbine triplets [7] and numerical simulations of larger arrays [5,24,25] have demonstrated that these effects can be compounded to form larger arrays with higher average performance than turbines in isolation. Notably, these beneficial effects are highly sensitive to wind direction, particularly when downstream turbines operate in the wake of upstream turbines [4]. Wake effects can be stronger than the potential enhancements, thus it is imperative to develop a fundamental understanding of the flow physics governing these competing effects when designing an array for environments with variable wind direction.
The majority of previous flow field measurements around VAWTs have been limited to planar techniques [2,12,26,27,28,29]. A study by Caridi et al. [30] investigated the tip vortices shed by single blades of a VAWT in three dimensions using time-resolved tomographic PIV, but the small field of view meant that properties of the overall flow field around the turbine were not measured. The only three-dimensional laboratory measurements around an entire VAWT were performed by Ryan et al. [31]. This work measured the three-dimensional, volumetric velocity measurements around a single VAWT using magnetic resonance velocimetry (MRV) at , where is the mean freestream flow speed, D is the rotor diameter, and ν is the kinematic viscosity. Other three-dimensional VAWT flow field investigations have been numerical studies [32,33,34,35]. This work has demonstrated the three-dimensional and asymmetric nature of the flow around VAWT, motivating the use of three-dimensional measurement techniques in the present work to study the interactions between multiple rotors.
The primary objective of this study was to characterize the aerodynamic interactions between pairs of VAWTs through both time-averaged, three-dimensional, three-component velocity measurements and turbine performance measurements. Specifically, this study considered three principal array design parameters for a paired turbine array: the wind direction, the spacing between the turbines, and relative rotational orientation of the turbines (i.e., co- or counter-rotating). To enable controlled studies of these three parameters, other design features such as the turbine solidity, aspect ratio, and loading were held constant. The results of this parametric study will allow aerodynamic considerations to more directly inform the arrangement of VAWTs in wind farms for optimal power generation.
The remainder of this work is organized as follows. Section 2 describes the experimental methods used, including the procedure for measuring turbine performance and three-dimensional, three-component velocity fields. Section 3 describes the results of performance and flow-field experiments on an isolated turbine and a turbine pair. Section 4 relates the turbine performance measurements to the measured three-dimensional flow fields and discusses the implications of this work for wind farm optimization. Section 5 summarizes the contributions of this work.
2. Experimental Methods
2.1. Facility and Wind Turbines
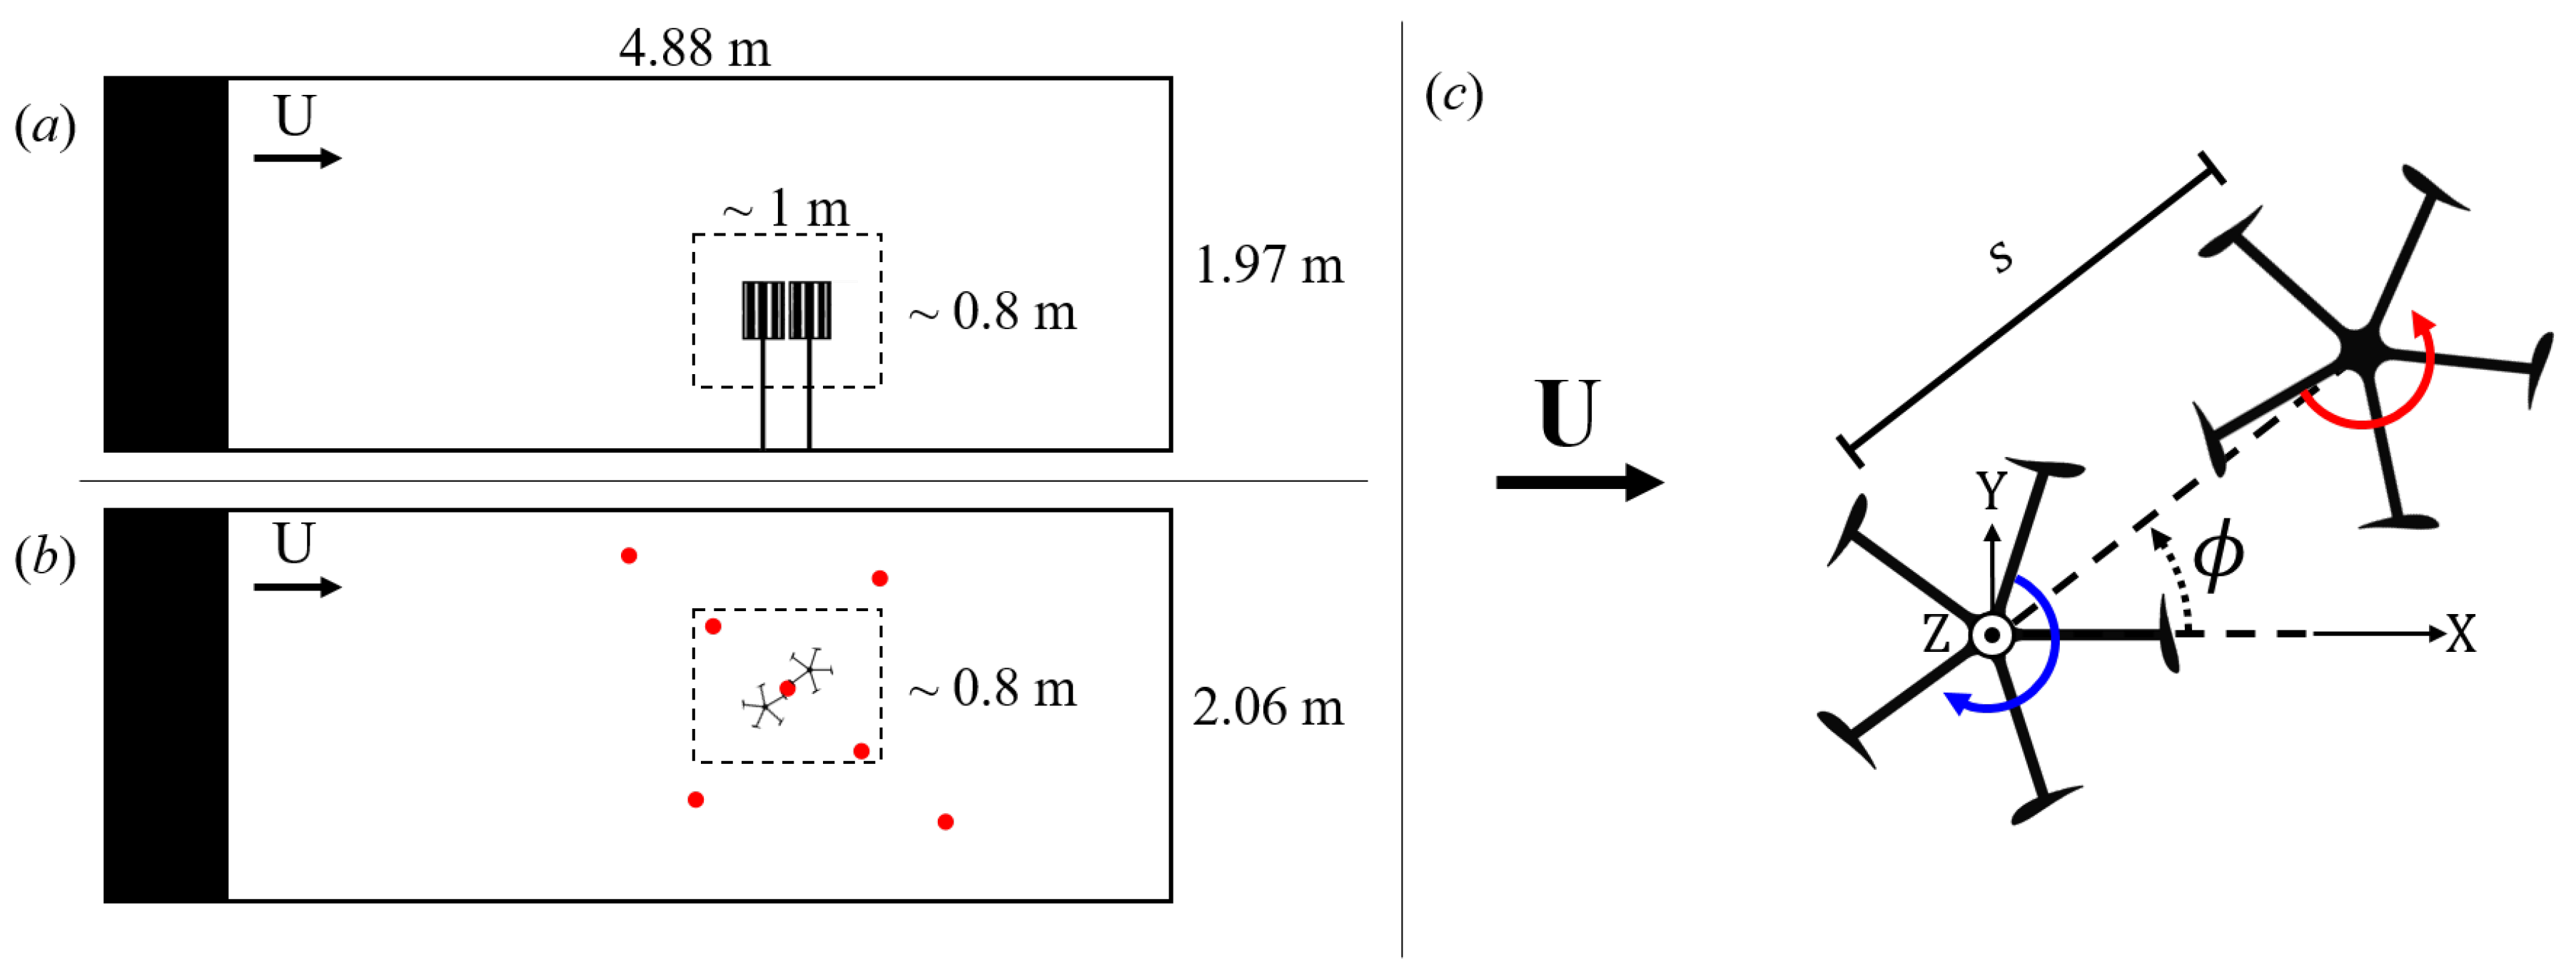
Experiments were conducted in an open-circuit, subsonic wind tunnel. The test section geometry is sketched in Figure 1a,b. The flow in this tunnel was provided by a 4 × 4 grid of fans (Phoenix 4025200) located at the tunnel inlet. The test section has a cross section measuring 2.06 m in width by 1.97 m in height, and it is 4.88 m in length. Two commercially available VAWTs (Aleko WGV15) were studied in this facility. Each turbine comprised a 5-bladed rotor that rotated a 3-phase AC permanent magnet generator. The 5-blade configuration, although not necessarily optimal for efficient power generation, was chosen to parallel the turbines currently installed at the Field Laboratory for Optimized Wind Energy (FLOWE) (cf. [36]). The rotors were modified to have a diameter (D) of 0.20 m. The blades had a constant NACA 6415 airfoil shape with the pressure side of the airfoil oriented to the outside of the rotor, chord length (c) of 0.045 m, pitch angle of −10°, and span (S) of 0.31 m. This corresponds to an aspect ratio of 1.55 and a stationary turbine solidity of 0.36. The total height of each turbine, including the tower mounted below the rotor, was 0.898 m. Both turbines could be oriented to rotate clockwise or counter-clockwise, as viewed from above, by reversing the blade orientations. The maximum blockage ratio in this facility, based on the total frontal projected area of both turbine rotors, was 3.1%.
The mean freestream speed measured in the particle tracking measurement domain, illustrated in Figure 1a,b, was 5.6 ± 0.3 m/s, resulting in a Reynolds number based on the turbine diameter of approximately . At this freestream speed, the two turbines freely rotated at rotational rates of rev/s and rev/s. This free-spinning case (i.e., no load) was used for all experiments and corresponds to a tip-speed ratio for the turbines of and . This tip-speed ratio was defined for all experiments using the free-stream flow velocity in the wind tunnel (), which, being a far-field measurement, is a more reliable metric for comparisons than the flow conditions immediately upstream of each turbine. This tip-speed ratio matches the optimal tip-speed ratio for the full-scale 2-kW VAWTs at the FLOWE field site, a result shown both in field data and in laboratory experiments at full dynamic similarity [36]. Such low tip-speed ratios are characteristic of turbines with relatively high solidities (e.g., [37]), since the optimal tip-speed ratio for VAWT operation decreases with increasing solidity [38,39,40,41]. The application of the results shown in this paper to turbines with lower solidity (e.g., [42]) is discussed in more detail in Section 4.
To study the interactions between the two turbines in different incident wind directions, the turbines were oriented in a polar coordinate system defined by the turbine center-to-center spacing and the array angle with respect to the freestream. The origin of this coordinate system was located in the center of the upstream turbine rotor. This array geometry is illustrated in Figure 1c. The upstream turbine was defined as Turbine 1 and was at a fixed position of 2.81 m (14.05 D) from the test section inlet and in the center of the tunnel width (i.e., 5.15 D from the sides of the tunnel). The downstream turbine, Turbine 2 , was positioned within and at turbine spacings within . Therefore, for all of the arrays studied, the closest blade on the downstream turbine was always from the tunnel walls.
2.2. Performance Measurements
To quantify the performance of each turbine, the voltage between each pair of the three phases of the turbine generator was collected using a data acquisition device (NI USB-6210). The measured voltage was reduced using a 2:1 voltage divider to keep the signal within the range of the acquisition device rated input. The induction generator used with the turbines was operated within its linear regime, such that higher rotation rates produced proportionally higher induced currents and thus proportionally higher torque [43]. Thus, the generator rotational rate was used as a surrogate for turbine performance since it is proportional to the peak-to-peak voltage measured and the energy extracted by the turbine. This method was shown by Brownstein et al. [8] to correlate with power measurements with an value of 0.99, and was used in these experiments to provide a lower-noise measure of performance than the power measurements. The net aerodynamic torque generated by the turbines was only resisted by the bearing friction. While this is not a power-producing regime, the operation regime of net zero torque was shown by Araya and Dabiri [44] to be physically relevant for studying the flow around VAWTs.
Data were collected by moving the turbines into position, followed by a 90-s period for the turbine rotational rates to reach steady state. Three 10-s time-histories of the performance measurement were subsequently recorded at 5 kHz, with a 20-s temporal spacing between sequential measurements. Each turbine position was measured two or more times, resulting in a minimum of six time-histories of the performance measurement per array configuration tested.
Turbine performance measurements were collected for the turbine pair in co-rotating and counter-rotating configurations. For the co-rotating array, data were collected at turbines spacings of 1.25 D, 1.5 D, 2 D, and 3 D. The turbines were oriented to rotate clockwise when viewed from above. For the counter-rotating array, data were collected only at a turbine spacing of 1.25 D, because this spacing corresponded to significant performance enhancement due to aerodynamic interactions between the VAWT pair. Two mirror-symmetric cases were measured with the upstream turbine being clockwise or counter-clockwise oriented when viewed from above. Due to the geometric symmetry of these two configurations, these cases are identical with respect to the adjusted array angle, , where is an indicator function to designate the orientation of a turbine:
For all experiments, data were collected in 10° increments within . For comparison to the paired turbine performance measurements, data were also collected with the individual turbines in the same positions as in the array, but with the other turbine removed. This allowed for normalization of the turbine performances in the paired configurations as described by:
where is the rotational rate of turbine i in a given array configuration; is the rotational rate of turbine i at a given position without the other turbine present; is the normalized rotational rate of turbine i in a given array configuration; and i = 1 or 2, corresponding to Turbine 1 or 2. This normalization removed the effects of small spatial variations in the incident wind speed so that comparisons could be made between the performances of the various array configurations. This normalization also removes potential for wall effects from the data in the cases where the downstream turbine is closest to the wind tunnel walls.
2.3. Flow Velocity Measurements
2.3.1. Tracking Technique and Data Collection
To quantify the flow field around the turbines, three-dimensional particle tracking velocimetry (3D-PTV) was used. Since this study sought to characterize the entire flow field around two VAWTs, resolving dynamic-stall effects on individual blades, which are generally confined to a region relatively close to the blade surface, was not possible (cf. [30]). Since the amplitudes of the angle-of-attack variations were high and the corresponding reduced frequency was relatively low (), given the turbine’s low tip-speed ratio, dynamic-stall effects were expected to appear as bluff–body separation events that would not change much under the conditions explored in this study [45]. The use of time-averaged 3D-PTV data served to emphasize general trends in flow–momentum distribution and wake geometry between different test cases over unsteady effects.
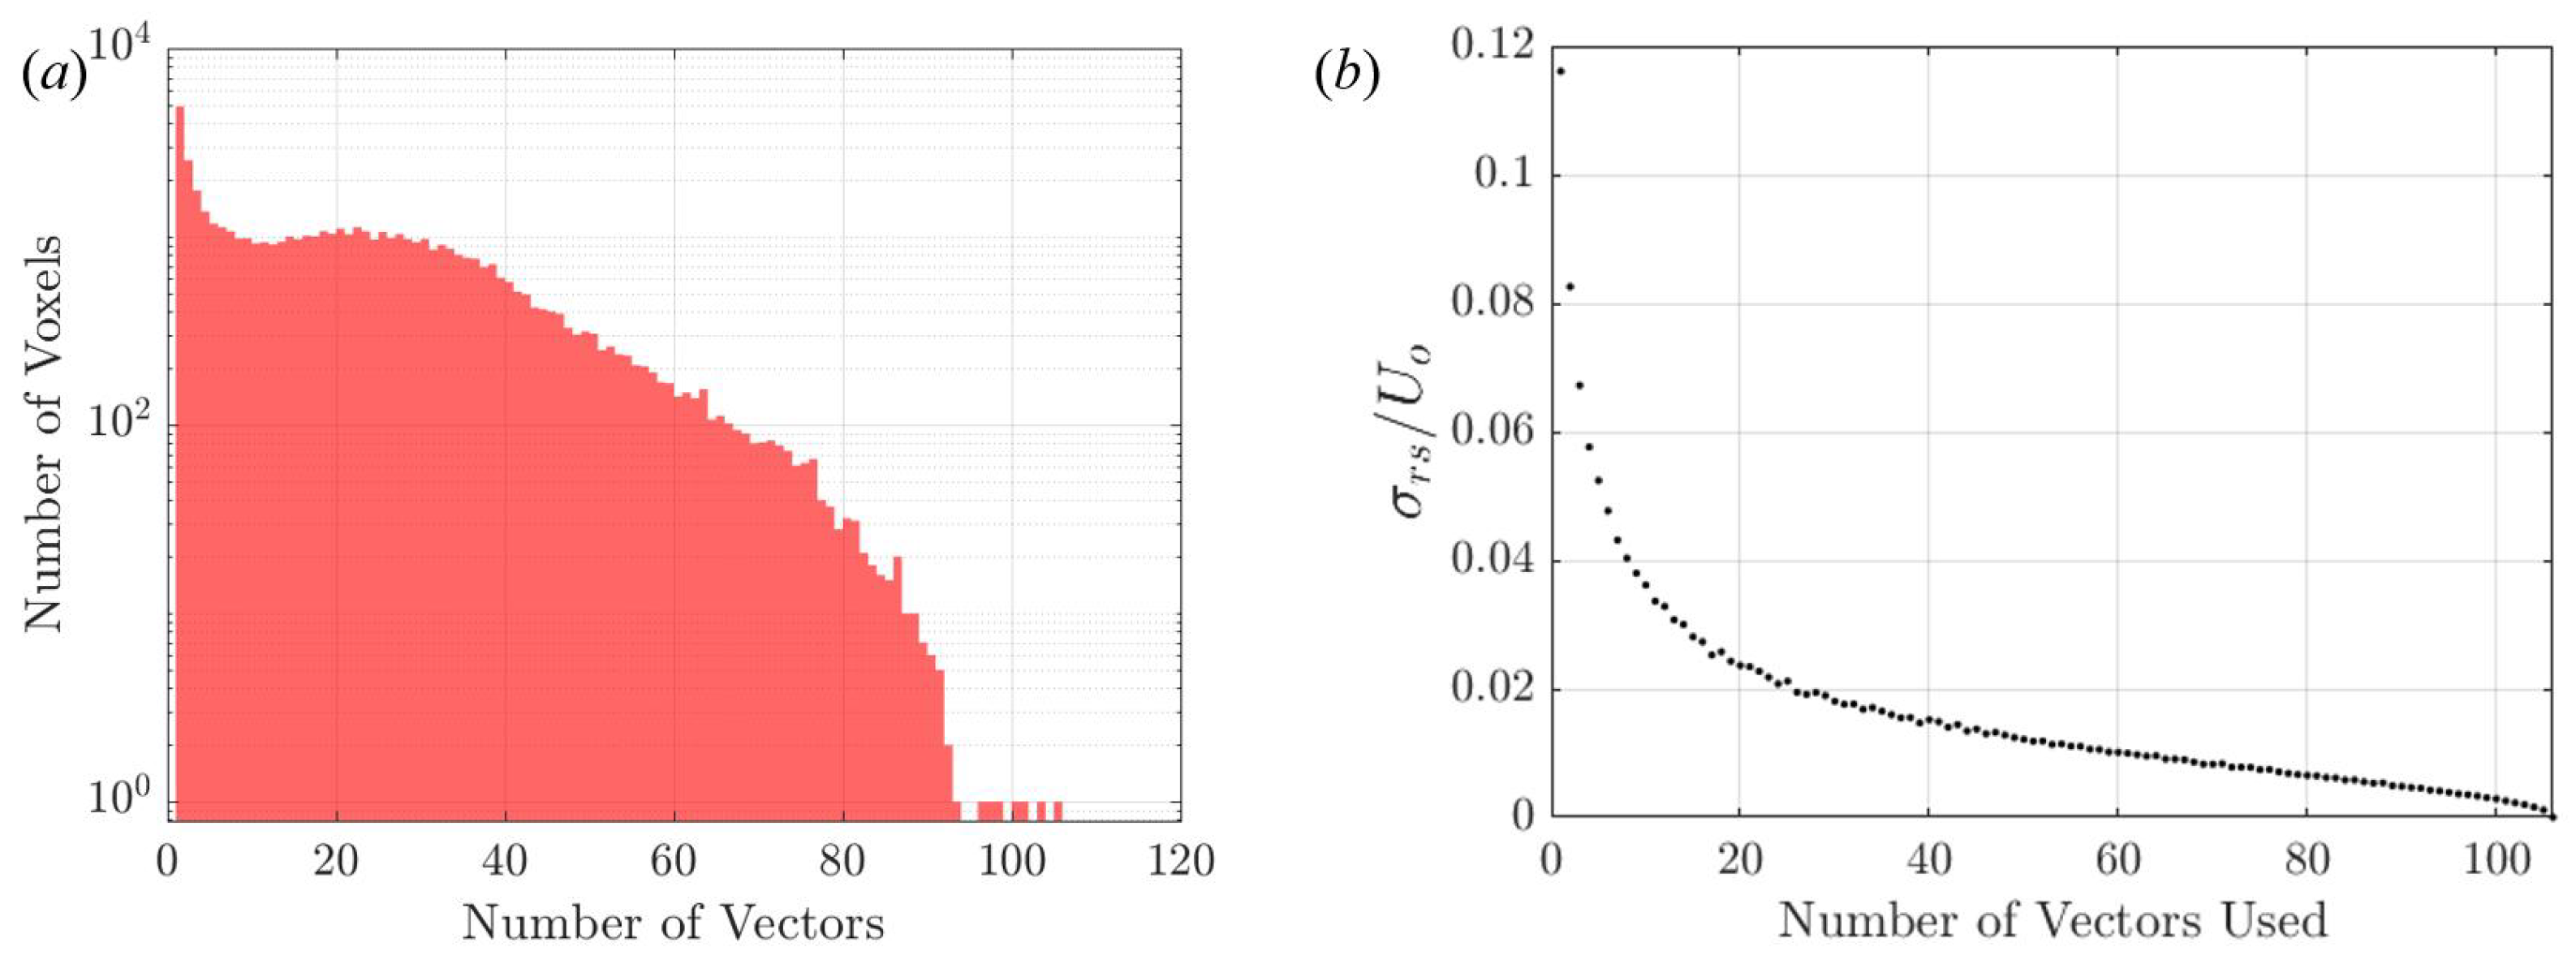
Neutrally buoyant helium filled soap bubbles (HFSB) measuring ∼1 mm in diameter (Sage Action Model 5) were released at the tunnel inlet and illuminated by two ellipsoidal lights (Source Four Jr., 575 W halogen bulb). The bubbles were recorded using seven hardware-synchronized cameras (Adimec N-5A100) positioned above the wind tunnel. The cameras were arranged in a cross pattern above the tunnel, as shown in Figure 1b. Their positions and the maximum extent of their mutual field of view, which was centered around the pair of turbines, are also depicted schematically in the figure. The relative positions and orientations of the cameras were calibrated using the protocol developed by Theriault et al. [46]. For flow measurements, images were captured at a resolution of 1440 × 1440 pixels and at 250 Hz. Particles were identified in each image using a thresholding technique after masking the rotor. The identified particle positions in each image plane were translated into three-dimensional space using epipolar geometry [47]. Particles were only triangulated into three-dimensional space when they appeared on at least three cameras. This reduced the number of ghost particles created in the three-dimensional reconstruction [48], so that the final velocity fields would be free from spurious vectors. These three-dimensional positions were translated into particle trajectories and differentiated numerically to obtain velocities using a multi-frame predictive tracking method [49,50]. Time-averaged mean velocity fields were then calculated by averaging the flow in voxels measuring (2 cm)3. This voxel size was chosen to balance the resolution in the time-averaged velocity and vorticity fields reported in this study and the uncertainty associated with low vector counts. For this resolution, the distribution of the number of vectors per voxel from the freestream measurement is shown in Figure 2a. Bootstrapping methods described by Efron [51] were used on the voxel with the largest number of vectors to estimate the variability in voxel time-averaged means for which less data are collected. This was done by taking 2000 re-samplings of the data and calculating the standard deviation of means from the re-sampled data (). The resulting standard deviations are plotted in Figure 2b. These figures show that a majority of voxels contained ten or more vectors, enough to produce a stable average as indicated by . To limit voxels that represent the influence of instantaneous fluctuations, voxels containing fewer than three velocity measurements were excluded from the final vector fields. Vorticity fields were then calculated by numerically differentiating the time-averaged velocity field using a five-point stencil. The smoothing inherent in the time-averaging procedure was sufficient to resolve vortical structures upon spatial differentiation of the velocity field, despite the higher noise levels in the vorticity fields.
Using this setup, three-dimensional velocity measurements were collected for the freestream flow, a single turbine, and for turbine pairs. These data were recorded over eight- or ten-minute measurement periods, resulting in approximately 4000–5000 turbine rotations. For the single turbine, data were collected for both clockwise and counter-clockwise orientations. Due to the symmetry between these experiments and the offset measurement domain, the results were combined into a single dataset with a larger effective measurement domain. For the turbine pairs, a single turbine spacing and array angle were studied ( and ) for all four combinations of rotational configurations (i.e., clockwise co-rotating, counter-clockwise co-rotating, reverse doublet, and doublet). According to conventions established in the wind-turbine literature (e.g., [14,52]), the rotational configuration is defined to be a doublet when the blades between the rotors are advancing upstream and a reverse doublet when the blades between the rotors are retreating downstream. These cases were isolated because they lay in the s-ϕ regime where significant performance enhancement was observed, so that the flow mechanisms responsible for these enhancements could be identified.
In addition to the three-dimensional measurements, vertically aggregated (i.e., along the blade span (S)) two-dimensional particle trajectories were obtained for the same turbine configurations for which three-dimensional data were collected. For these measurements, the illumination was constrained to within to minimize three-dimensional effects. These data were collected with the camera centered above the turbines recording at 250 Hz for one minute. Particle trajectories were then visualized by making a composite image such that each pixel value is the maximum value at that pixel location measured over the recording. Because these images showed individual particle tracks up to the edge of the swept area of the turbine, they were used to show qualitatively where the flow separated from the turbine profile.
2.3.2. Characterization of Wind Tunnel
The HFSB tracers were used in this study due to their ability to provide optical flow measurements in large measurement domains in a wind tunnel [53,54,55,56]. In previous studies, HFSBs have been identified as valid tracers for measuring quantitative flow features as long as they are neutrally buoyant [57,58]. In this study, the HFSB were restricted to being neutrally buoyant using a filter which removes lighter and heavier than air tracers from the flow. The Stokes number, i.e., the ratio of the particle response time to a characteristic time scale of the flow (), was calculated to quantify how faithfully the HFSBs used in this study follow the flow. The particle response time of each bubble was calculated using the relation for a small sphere reported by Crowe et al. [59], where s. In this relation, is the density of the bubble, d is the diameter of the bubble, and is the dynamic viscosity of air. Since mean flow fields will be investigated in this study, the time scale of the flow is estimated as the ratio between the dominant scales in the flow, i.e., the turbine diameter (D) and freestream velocity (). This results in s. This corresponds to the threshold below which Tropea et al. [60] noted that flow tracking accuracy errors are typically below 1%.
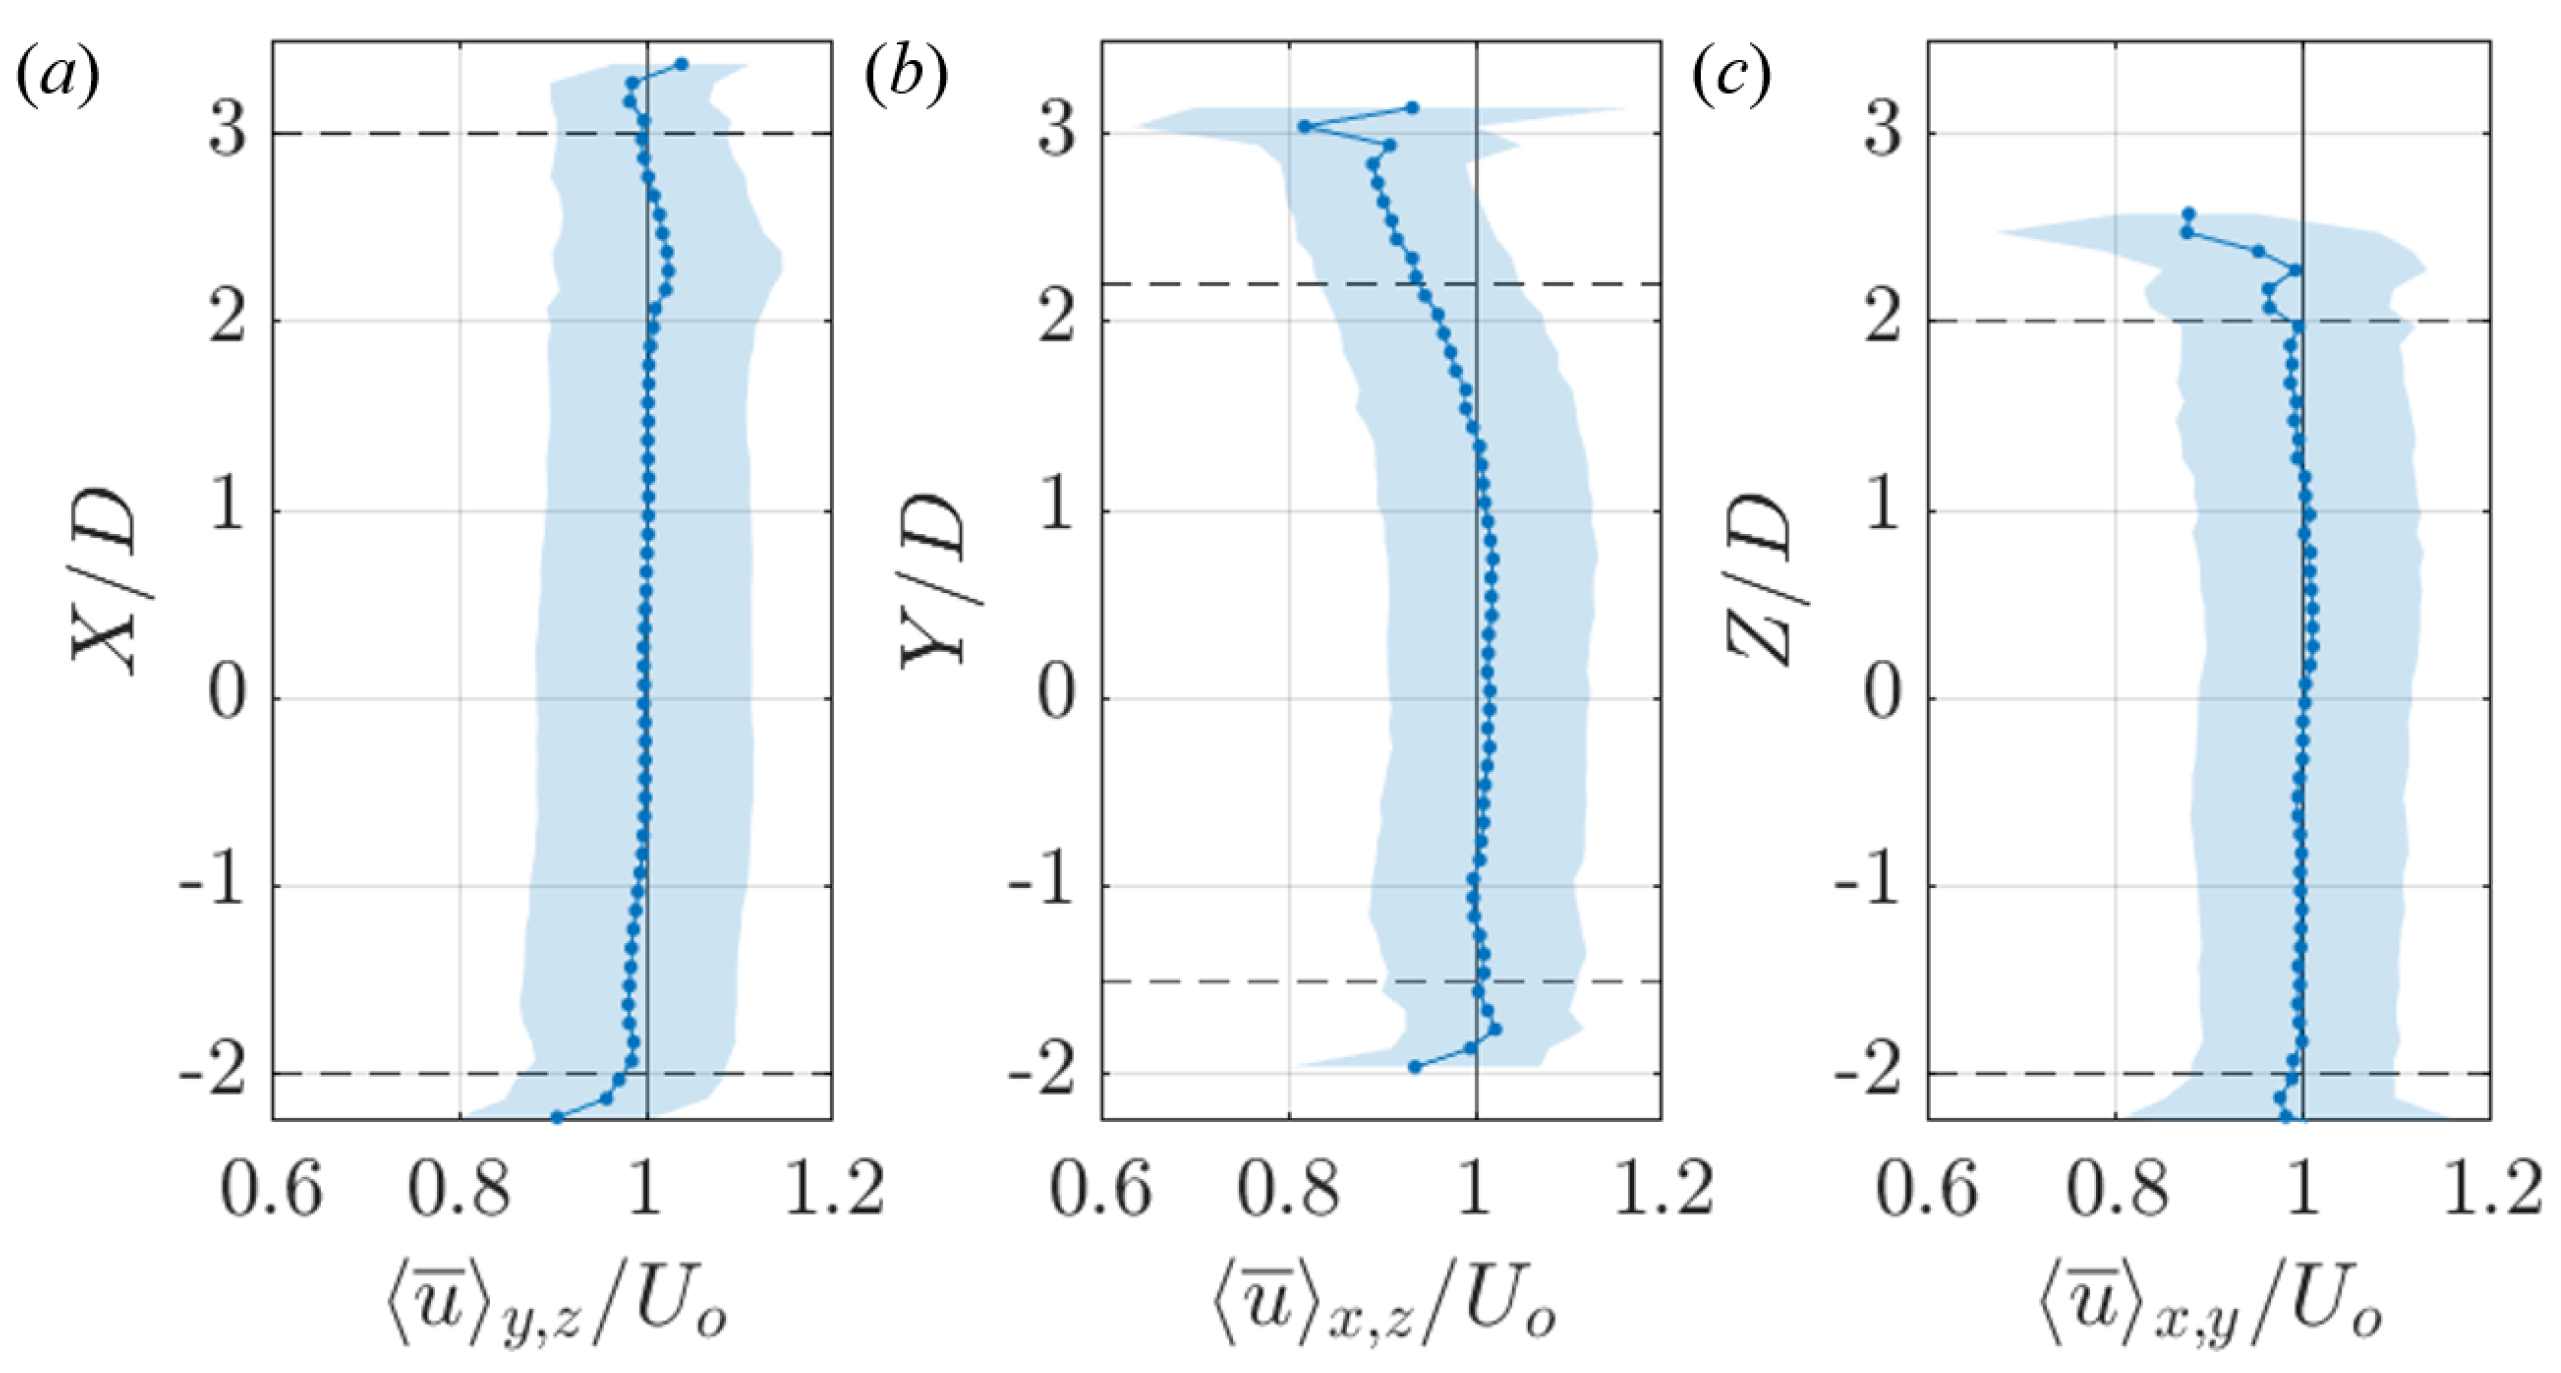
To characterize the wind tunnel freestream, 3D-PTV measurements were recorded with an empty test section. Three profiles of the normalized streamwise velocity are plotted in Figure 3. The observed standard deviations correspond to the turbulence intensity in the tunnel, . These profiles were used to determine the maximum extent of the particle tracking domain based on where the flow was sufficiently uniform. Additionally, the discontinuities at the edges of the domain are caused by relatively fewer vectors passing through the edges of the domain defined by the cameras’ mutual field of view.
3. Results
3.1. Performance Adjustments in Paired Turbine Arrays
In this section, the performance characteristics of paired turbines are demonstrated. This is followed by a more detailed investigation of the flow-field features responsible for the performance trends identified from these experiments. An extended discussion of the results presented in these subsections follows as Section 4.
3.1.1. Performance Dependence on Relative Turbine Orientation
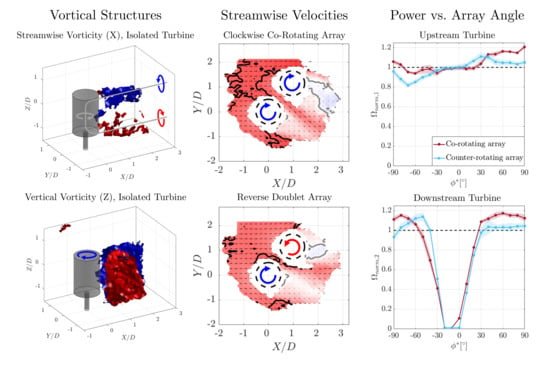
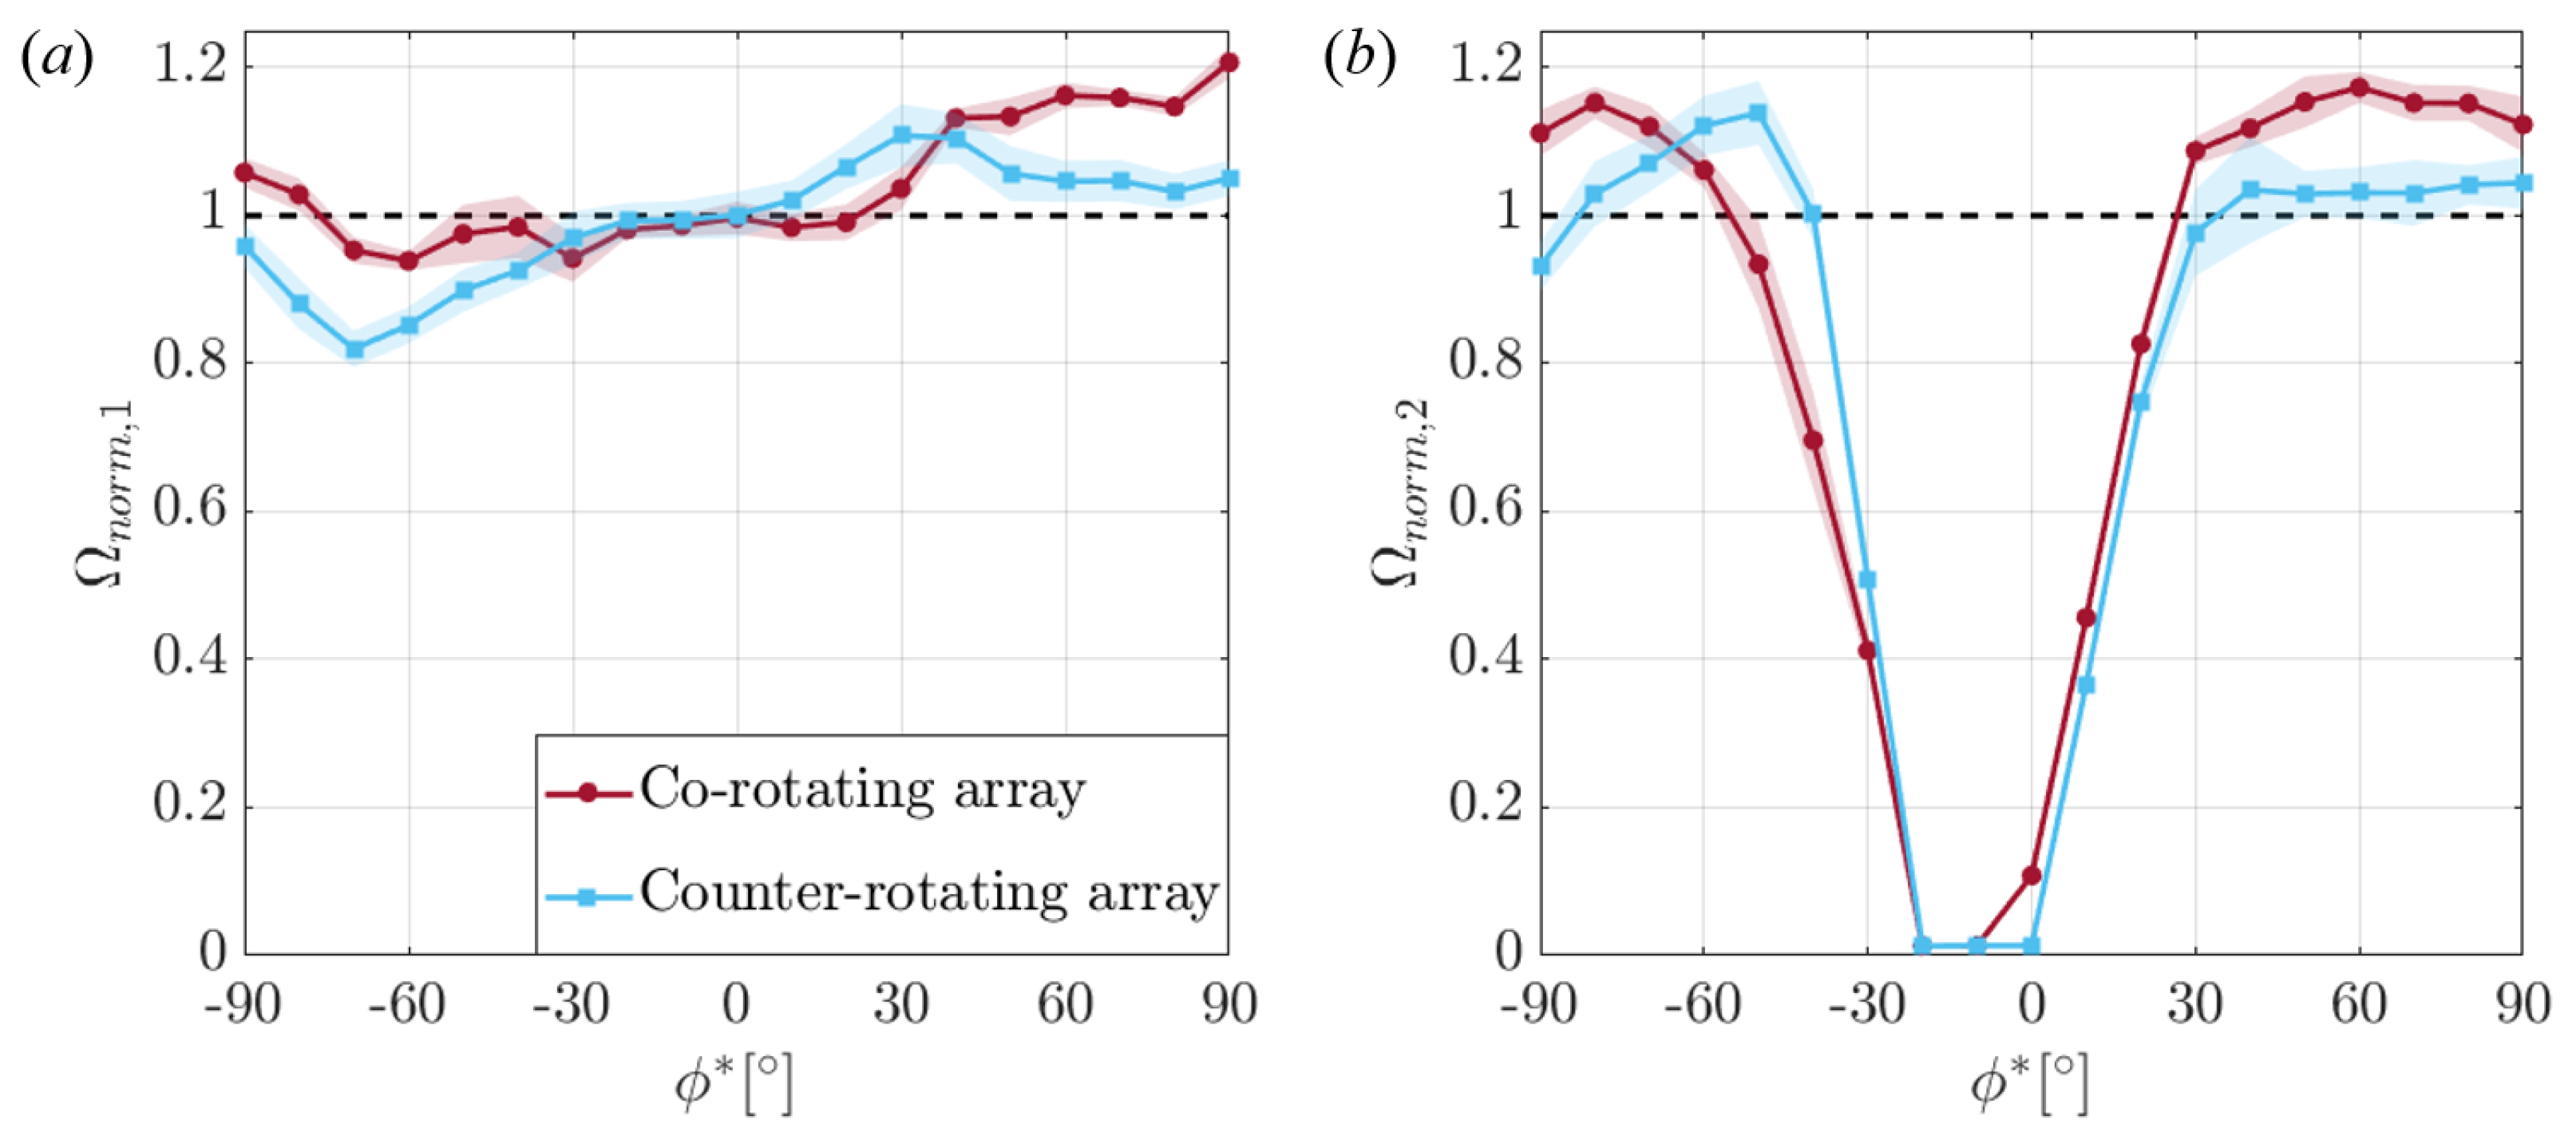
The normalized performances of both turbines in co-rotating and counter-rotating arrays for the smallest turbine spacing tested, , are plotted in Figure 4 versus . These results demonstrate that the performance of both turbines exhibits three distinct regimes in , based on the location of the downstream turbine relative to the wake of the upstream turbine.
The first regime , where the downstream turbine lies within the region of reduced flow speed behind the upstream turbine, is characterized by strong gradients in the normalized performance of the downstream turbine. Thus, we call this the wake regime. The performance of the downstream turbine decays far below its isolated performance until it is completely arrested at and in both the co- and counter-rotating arrays. In contrast to the downstream turbine, the upstream turbine performance in this regime is relatively level around its performance in isolation. A qualitatively similar result has been shown in 2D numerical simulations using a simplified momentum-source model to represent the turbine pair [22].
In the second regime , both the upstream and downstream turbines rotate at or above their performance in isolation. The measured enhancement is most significant for both turbines in the co-rotating configuration. The results in this regime exhibit similar trends to 2D simulations of a pair of co- and counter-rotating three-bladed VAWTs () [4] and an array of three Savonius-type turbines () [5].
In the third regime , the upstream turbine performance drops below that of its performance in isolation. In the co-rotating case, this drop is less significant than in the counter-rotating case. In contrast to the upstream turbine, the downstream turbine performance has a strong peak at in the counter-rotating case and in the co-rotating case.
These data indicate that the orientation of each turbine plays a role in the performance of the other turbine. Significantly, not only does the upstream turbine orientation affect the performance of the downstream turbine, which as been observed in previous work [4,5,8,22,23]; however, the downstream turbine orientation also affects the performance of the upstream turbine.
Of note, the upstream and downstream turbine performance at and was not identical in the co-rotating case, as would be expected on the basis of geometric similarity. This asymmetry was attributable to the corresponding mild asymmetry in the tunnel freestream flow presented in Figure 3.
3.1.2. Performance Dependence on Turbine Spacing
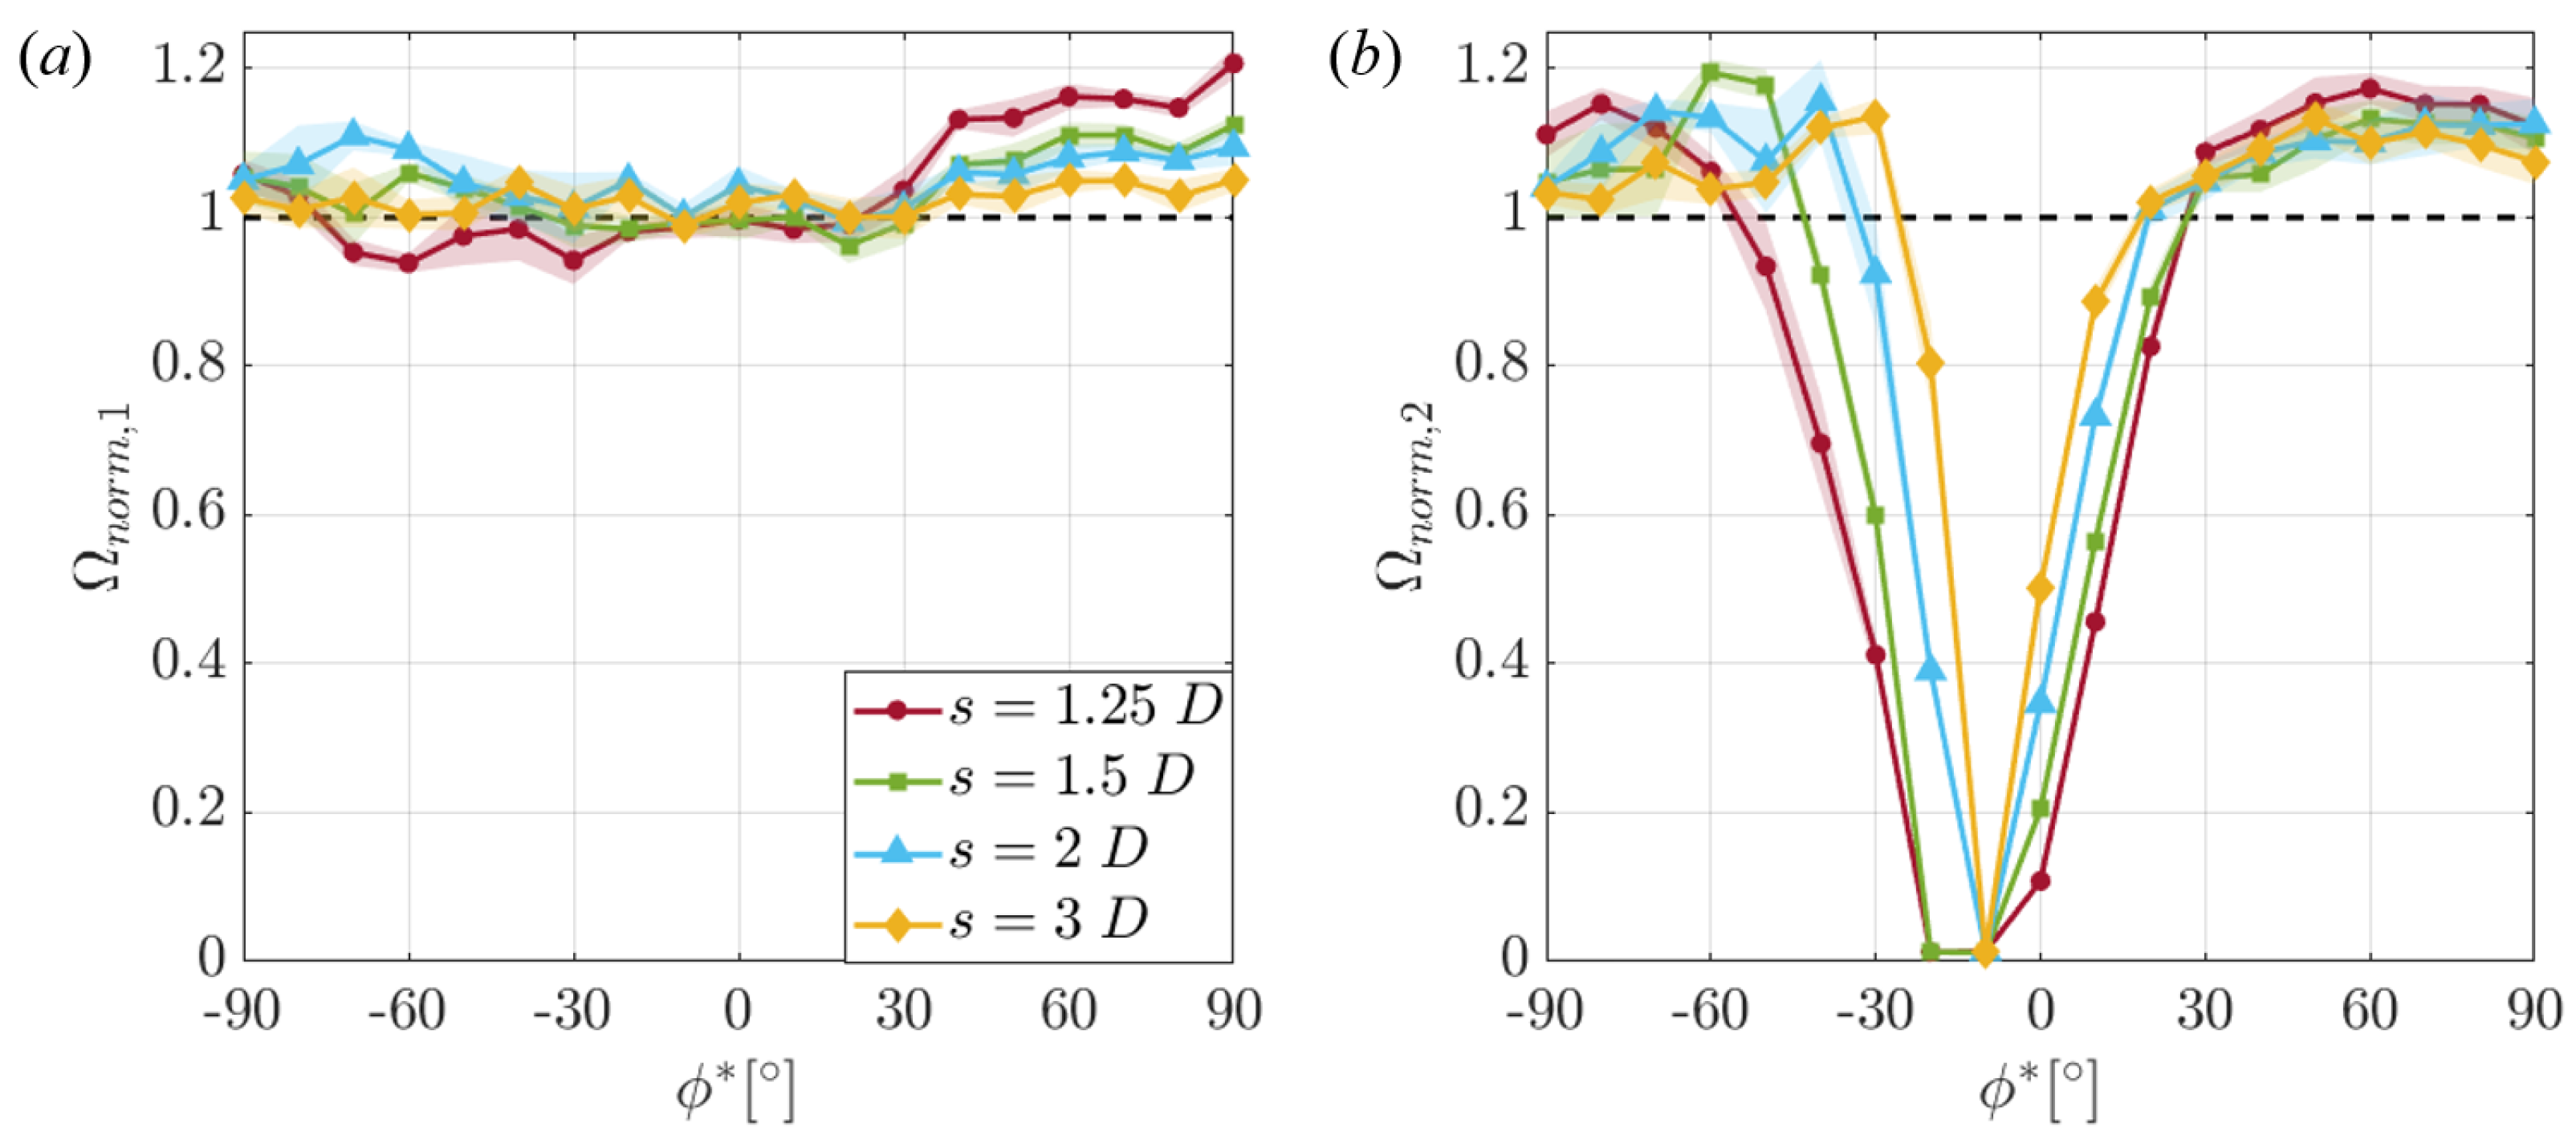
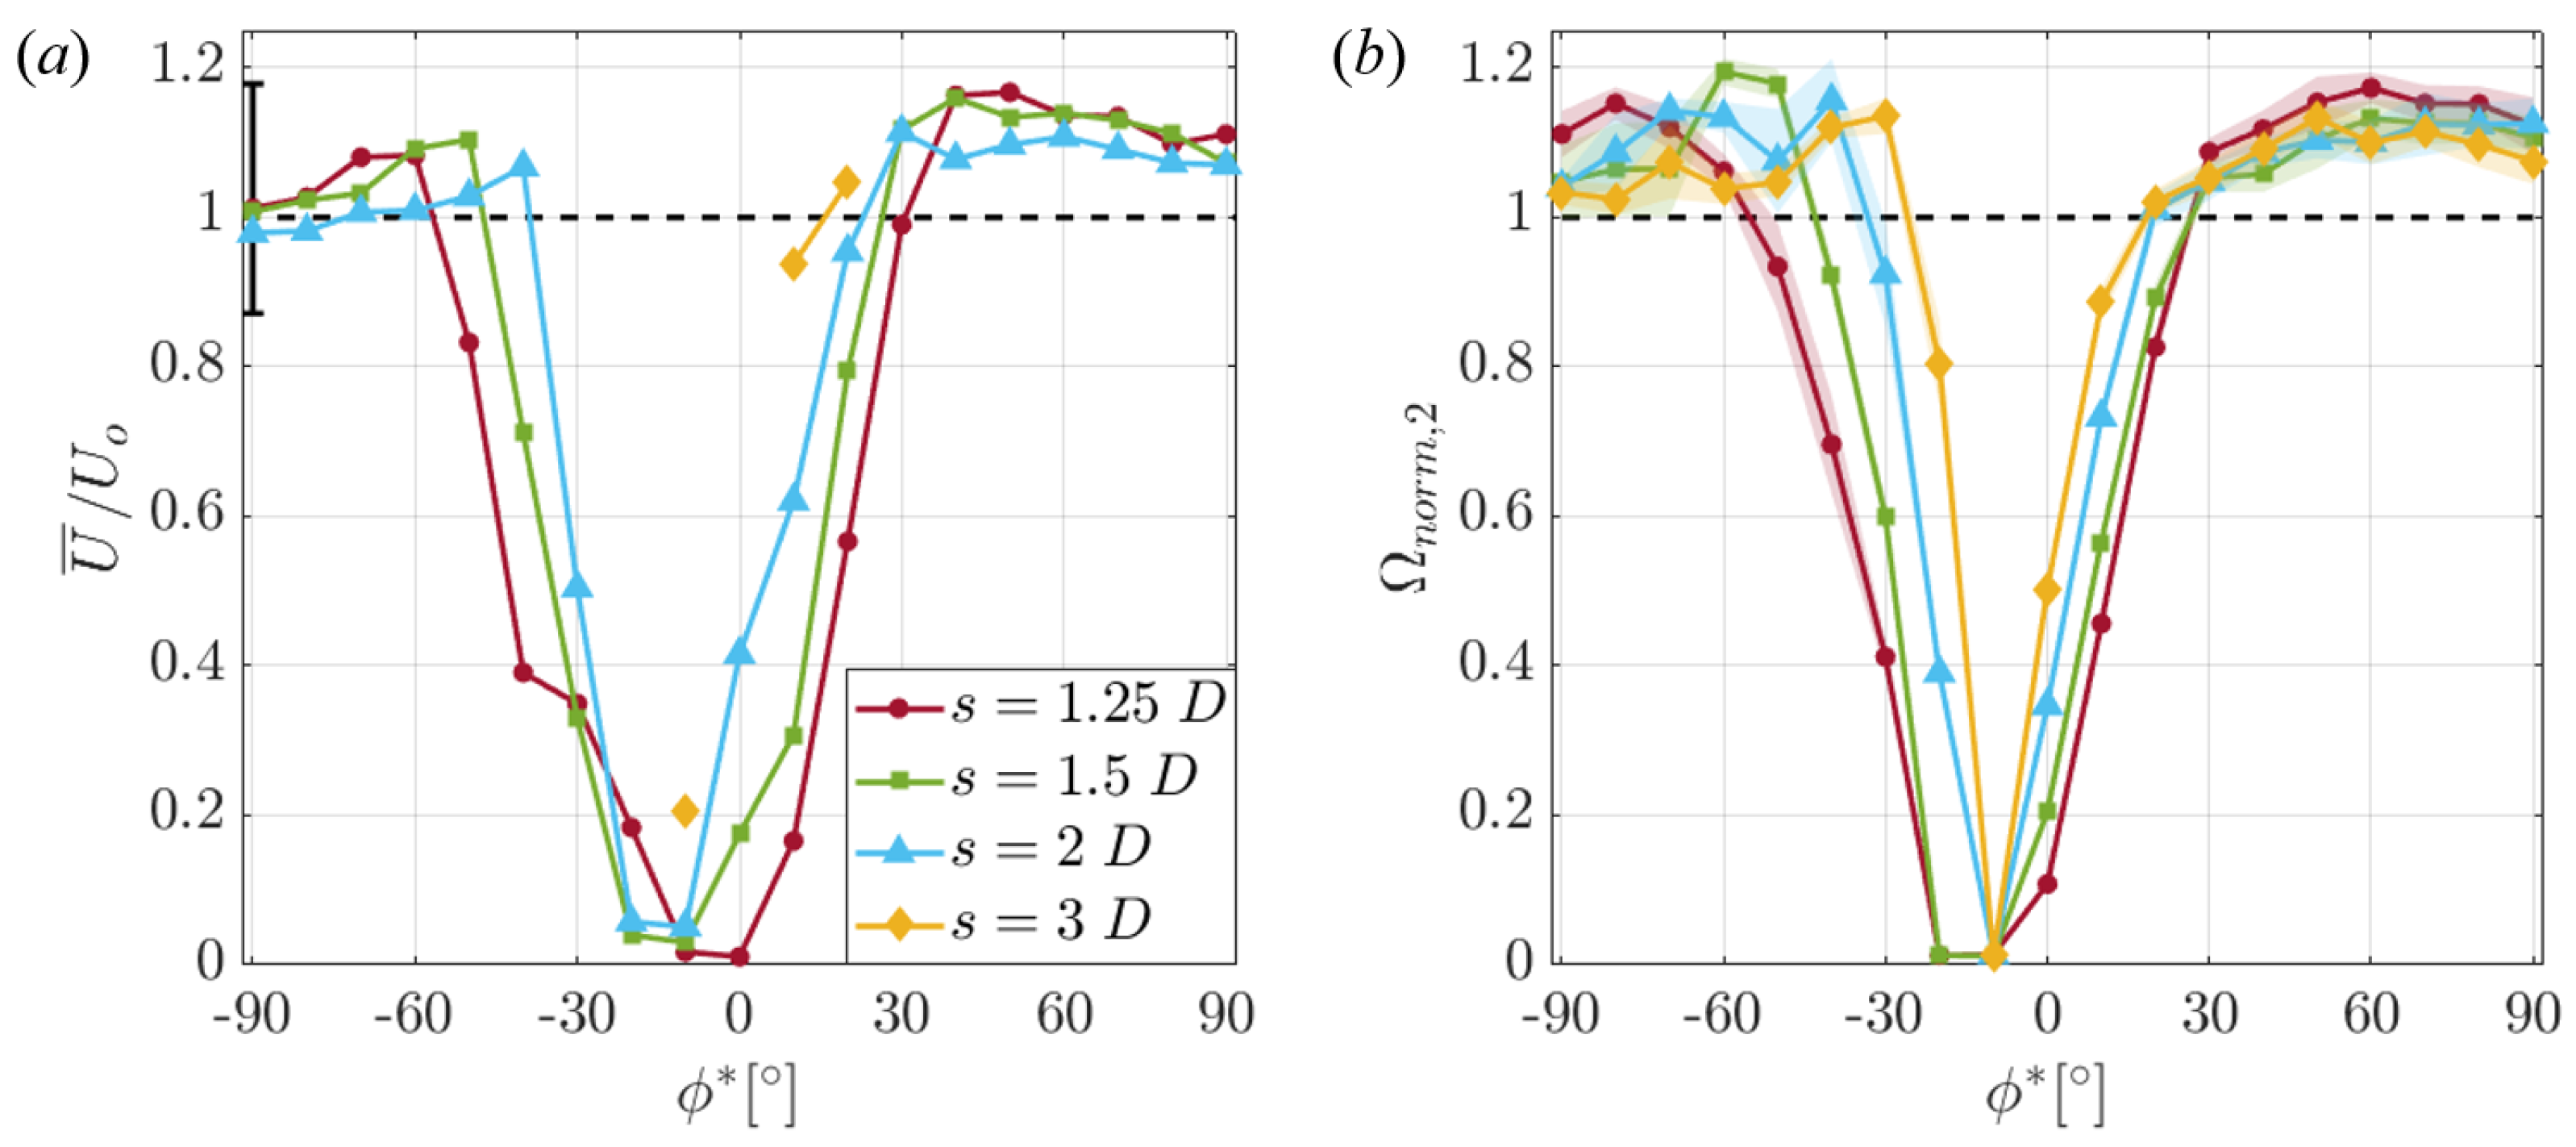
The normalized performance of both turbines at four turbine spacings, , , , and , versus are plotted in Figure 5 for the co-rotating array. As in the results presented for the smallest turbine spacing in the previous section, the performance of both turbines is approximately broken into the same three regimes in .
Similar to the array cases, the wake regime is characterized by strong gradients in the normalized performance of the downstream turbine. Notably, the strength of these gradients increases with increased array spacing. The effect of the wake also decays with increased array spacing. Additionally, for all spacings, the upstream turbine performance is similar to its performance in isolation.
In the second regime , a broad enhancement is observed for both turbines. In this region, the maximum enhancement occurs for the closest array spacing and decays uniformly with increased array spacing. This decay is more rapid for the upstream turbine than the downstream turbine.
In the third regime , downstream turbine performance enhancement is observed in a limited range of values, i.e., the downstream turbine quickly reaches a peak enhancement before decaying back toward its isolated performance as . In this regime, the maximum peak enhancement of the downstream turbine is observed for an array spacing of . Notably, within the resolution of adjusted array angles measured , these peak performances occur at the same cross-stream coordinate with a median location at for the co-rotating cases. This coordinate corresponds with the enhancement region observed downstream of an isolated VAWT in Figure 6. For the upstream turbine, this regime in is characterized by relatively level performance.
To understand how the flow field around the pair of turbines corresponds to these changes in performance, a representative array angle of was selected, at which varying degrees of performance enhancement were observed for all combinations of turbine rotation directions. An intermediate spacing of was chosen to maximize the observed performance enhancement while still allowing the accelerated flow region between the two turbines to be fully resolved.
3.2. Flow Features of an Isolated Turbine
3.2.1. Velocity Field around an Isolated Turbine
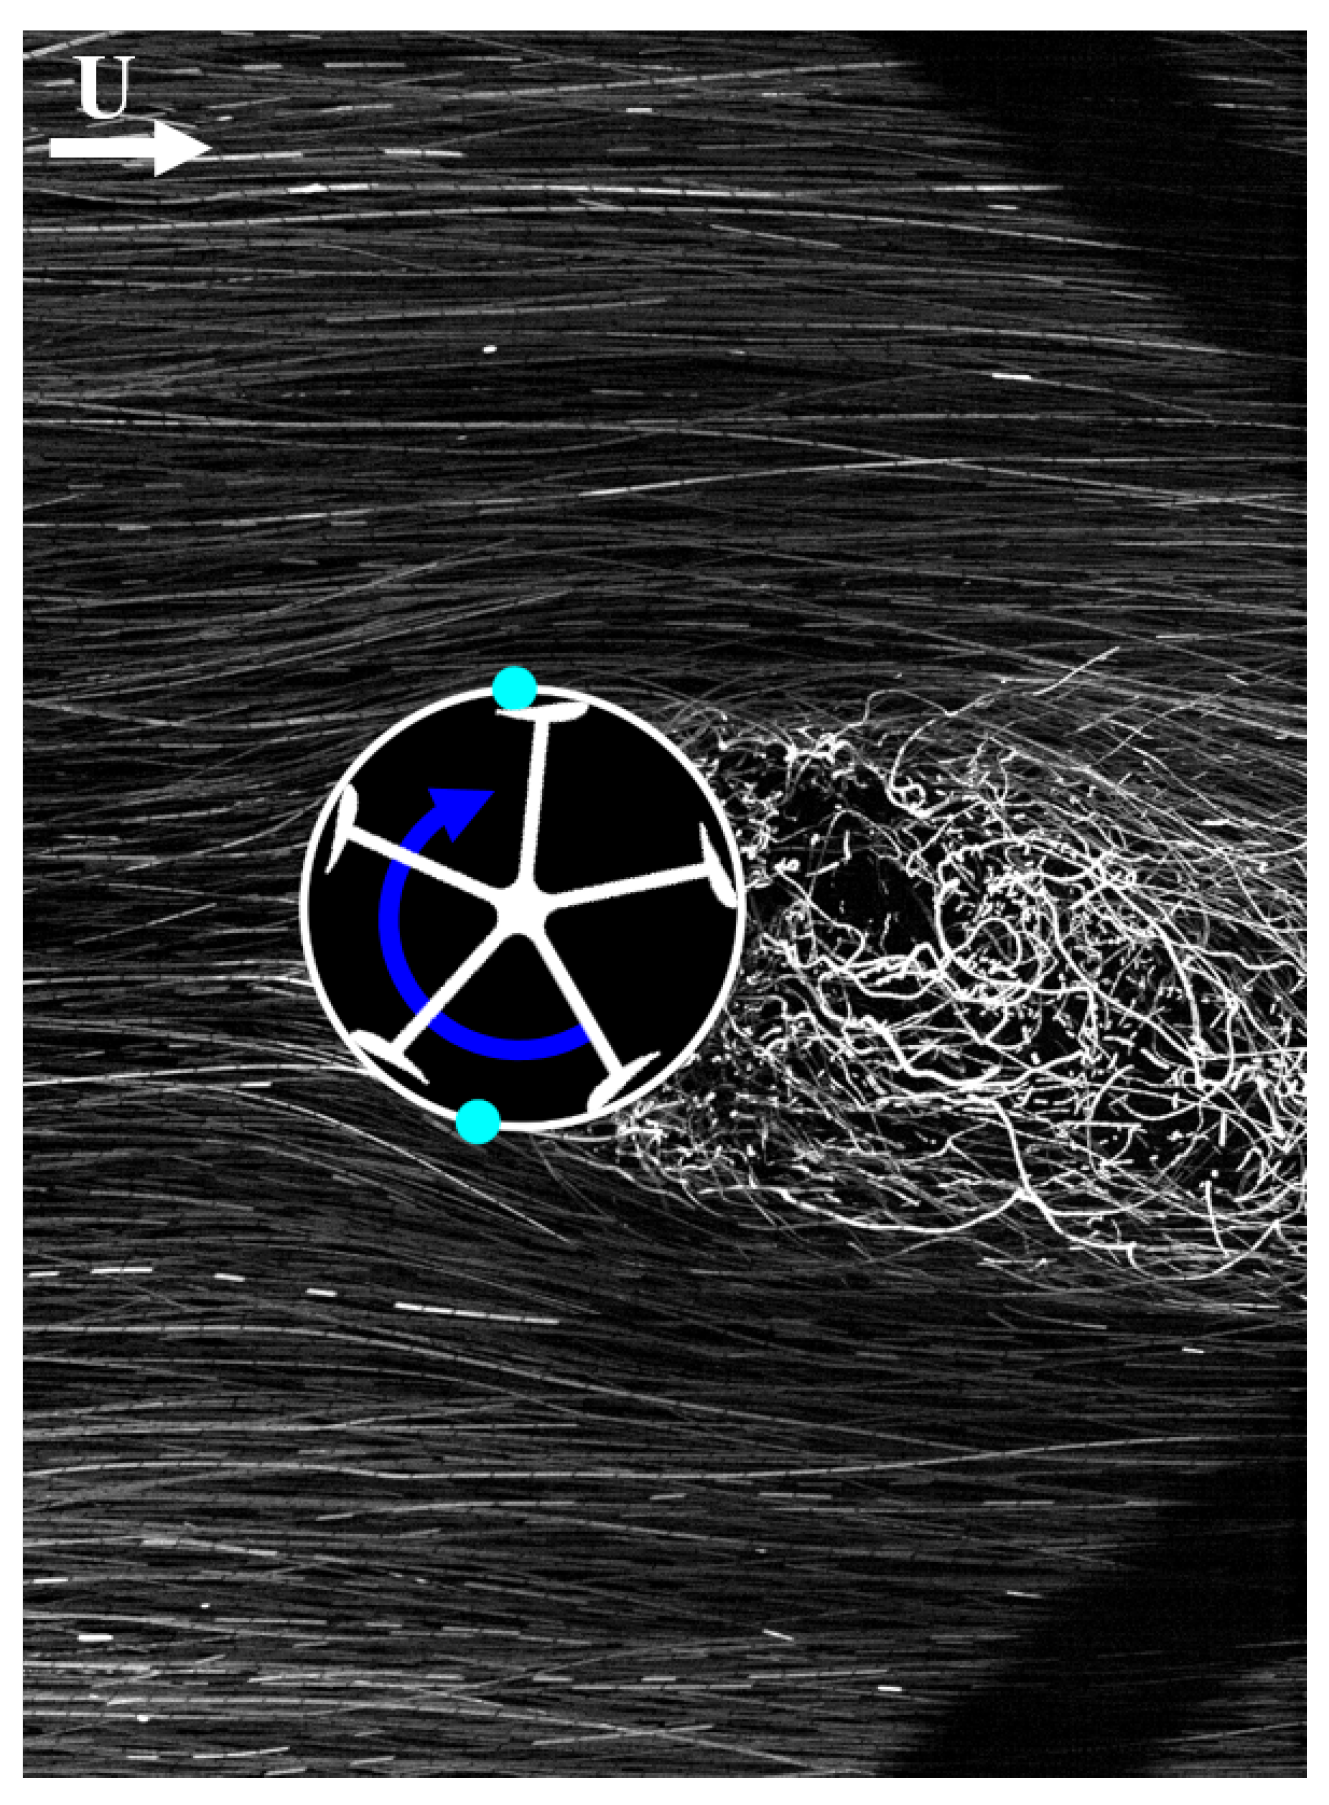
Before paired-turbine interactions were studied, flow patterns around an isolated VAWT were recorded in the wind tunnel to serve as a baseline. A qualitative quasi-two-dimensional view of the flow around a single VAWT is depicted in Figure 7. This image shows blade span-aggregated particle trajectories around the mid-span of a clockwise rotating turbine. Particle tracks bending around the rotor demonstrate flow acceleration around the turbine. Additionally, the slow moving (i.e., bright) trajectories downstream of the turbine illustrate the turbulent wake behind the rotor. The wake is slightly deflected as it extends downstream due to the rotation of the turbine. The cyan dots shown on the rotor represent points at which the flow visibly “detaches” from the rotor, serving as an approximate indicator of the radial extent of the wake region. This idea is developed further in the context of the turbine pair.
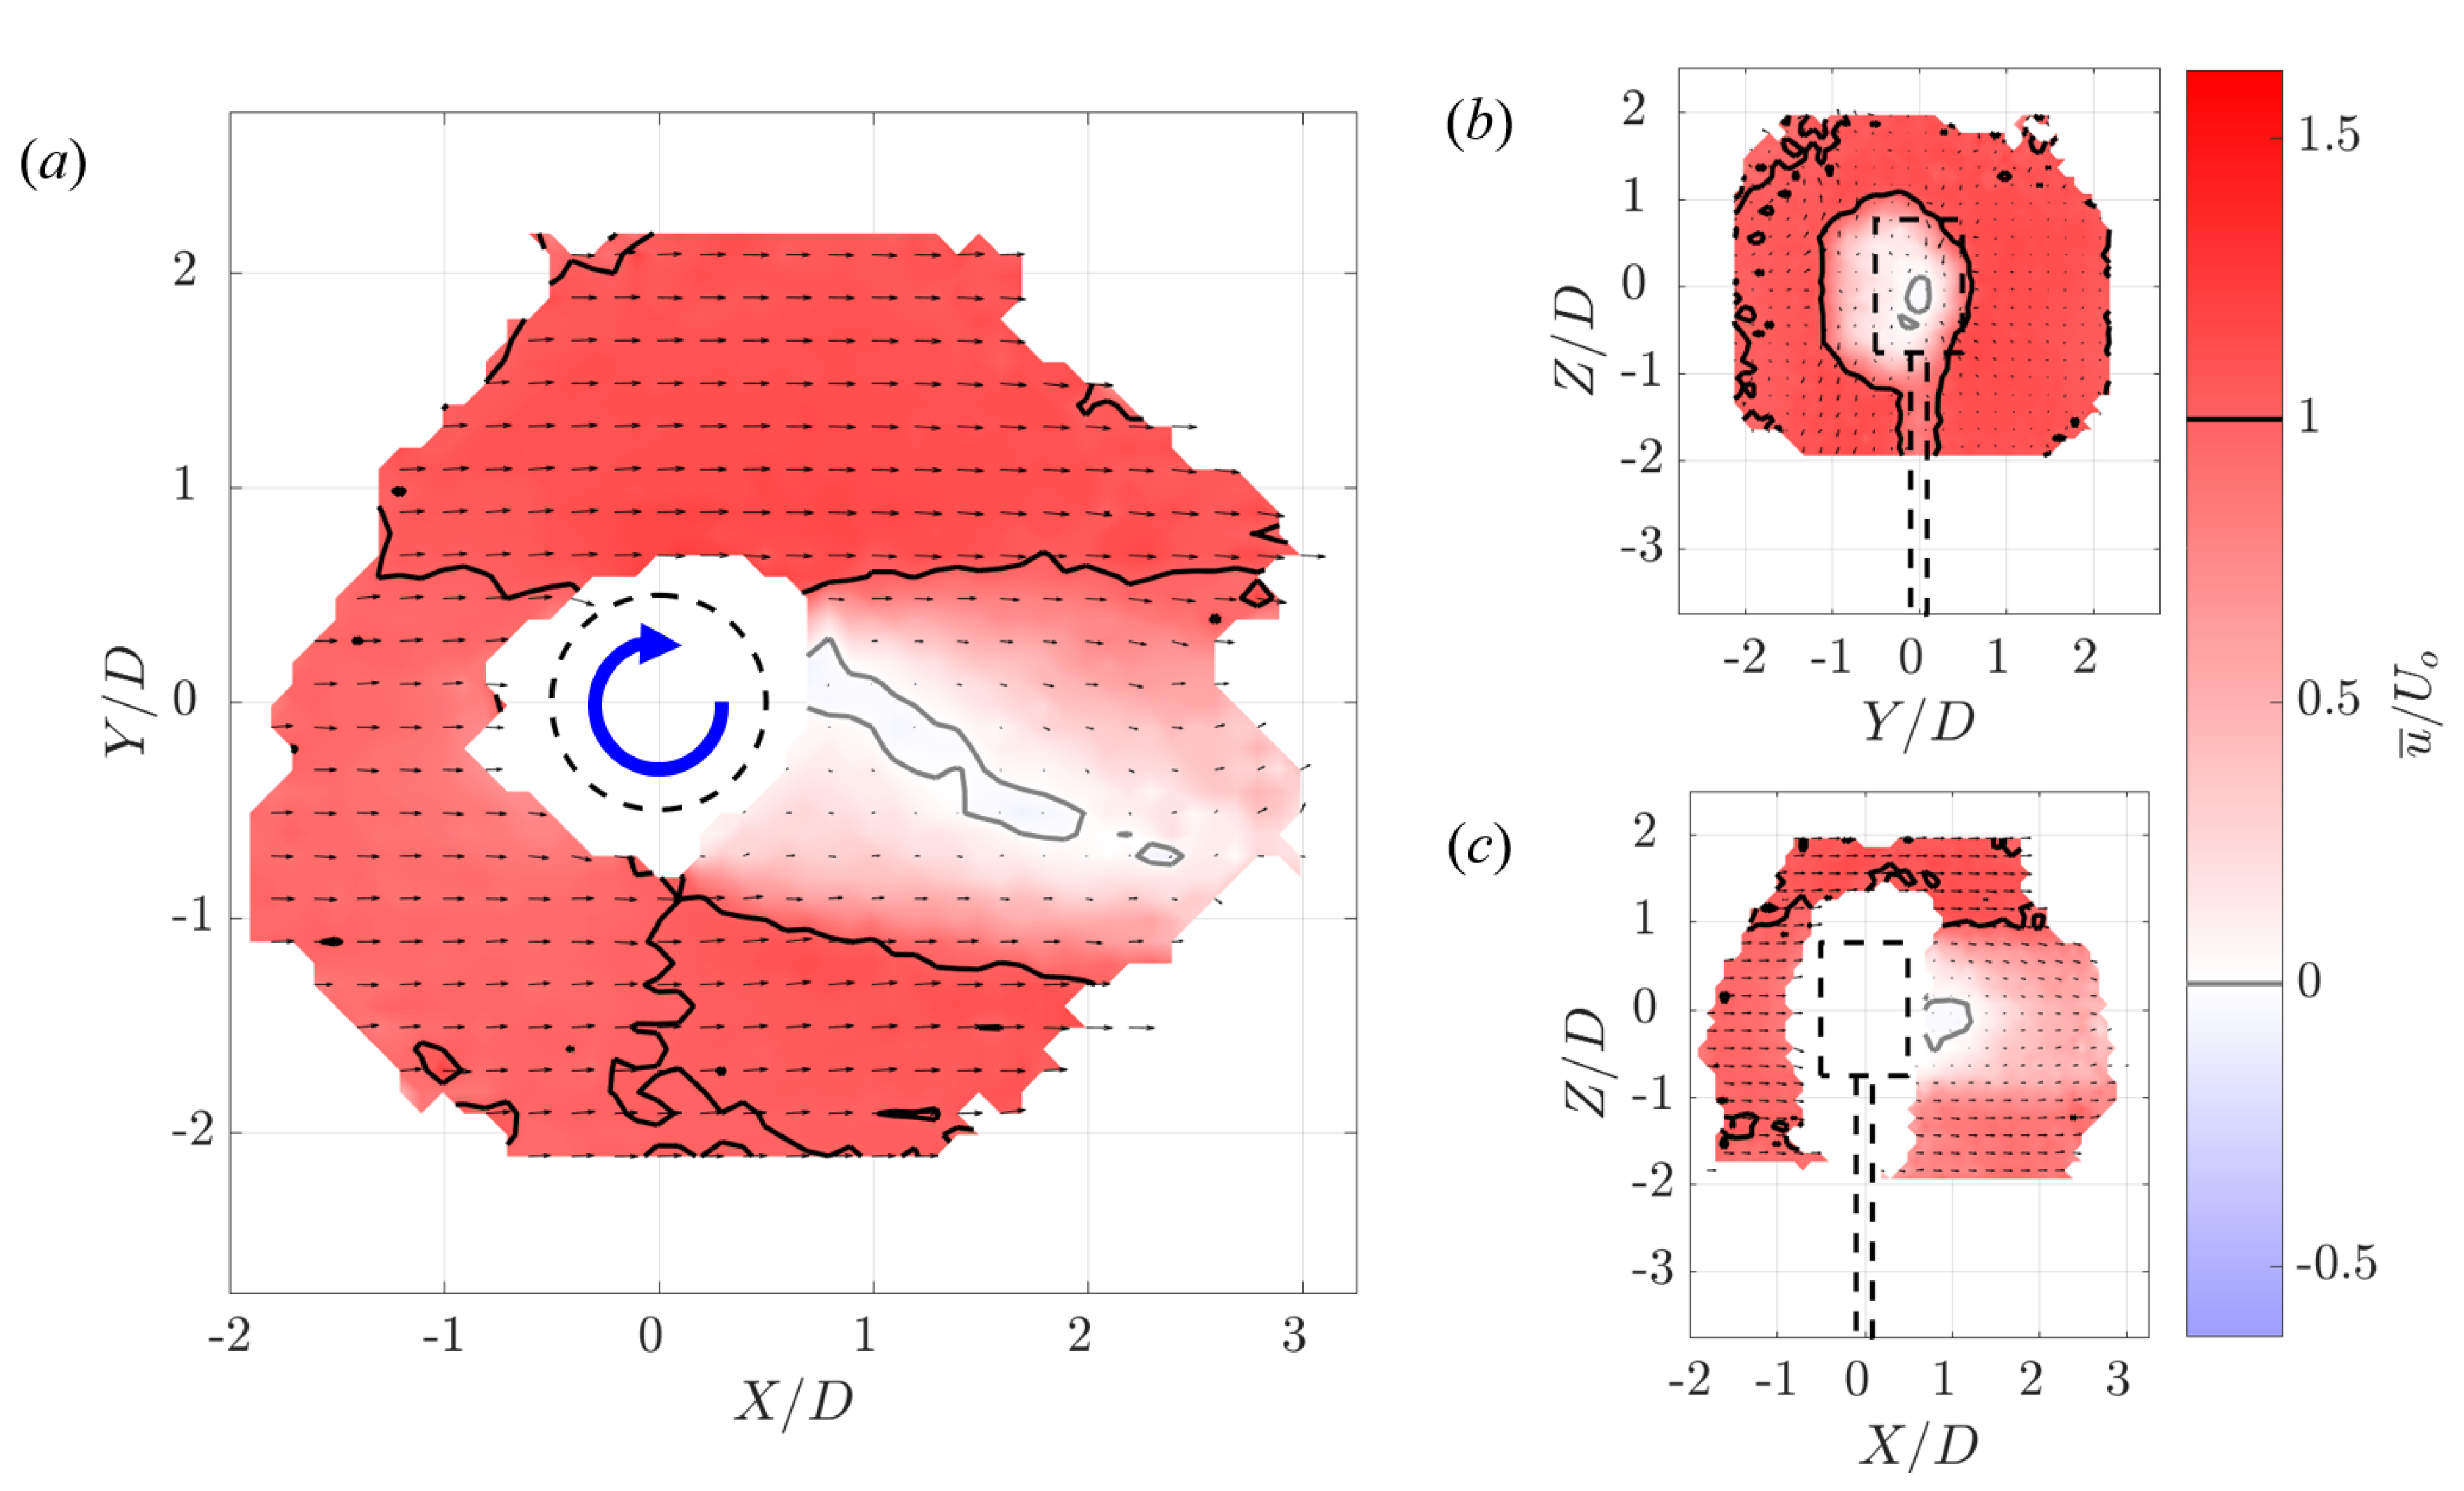
A quantitative view of this flow is provided in Figure 6, which shows three cross-sections of the normalized streamwise velocity () around a clockwise rotating VAWT. These three views together demonstrate the spatial extent of both the wake behind the turbine as well as the regions of accelerated flow around the turbine. In Figure 6a, it is observed that the spatial extent of the accelerated flow is asymmetric. On the side of the rotor where the blades are passing downstream (), the accelerated flow region is broad and persists throughout the field of view laterally away from the rotor and the wake boundary. On the other side of the rotor, where the blades are advancing upstream toward the tunnel inlet (), the spatial extent of the accelerated flow is limited and extends ∼1 D laterally from the wake boundary and downstream of the rotor center (). Additionally, this view quantifies the observation made in Figure 7 that the wake is deflected. In the center of this deflected wake, a reverse flow region, which extends from the rotor is observed. Similar reverse flow regions have been observed in previous studies of VAWTs [13,15,29,31].
In Figure 6b, it is observed that the accelerated flow region surrounds the entire wake region. Additionally, this plane highlights the deflection of the wake, as it is not centered on the projection of the turbine. Figure 6c provides another view of the wake recovery and the acceleration of the flow above the rotor. A relatively fast recovery of the tower wake is also observed.
3.2.2. Vortical Structures Downstream of an Isolated Turbine
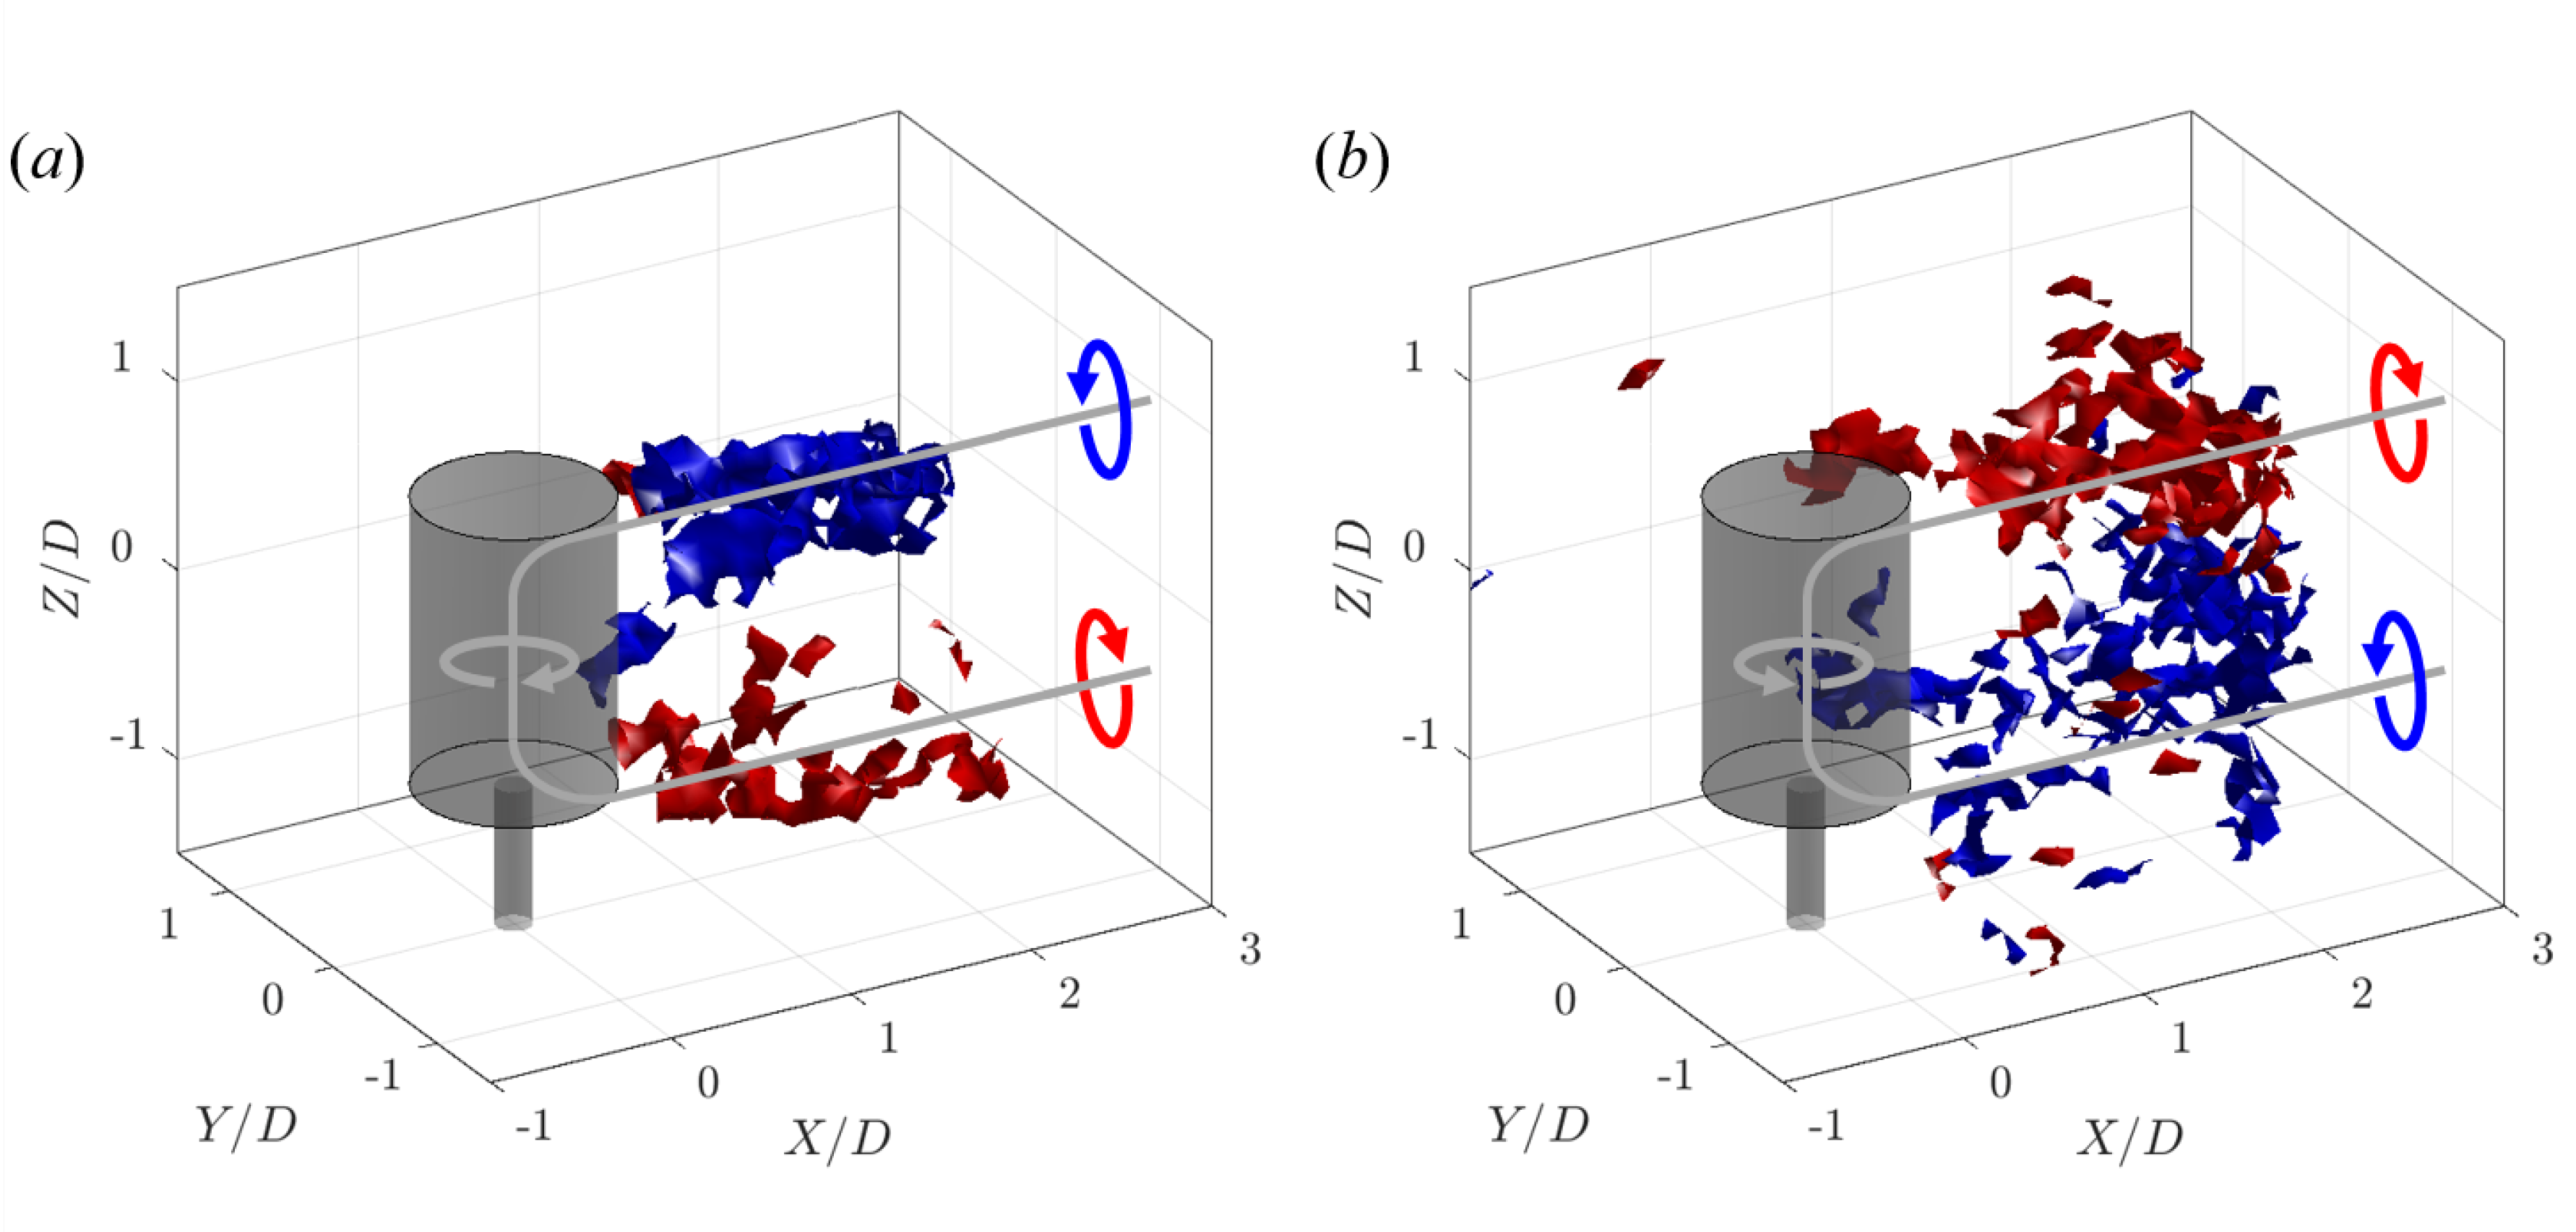
Isosurfaces of the streamwise vorticity () around a clockwise and counter-clockwise rotating VAWT can be seen in Figure 8. The isosurface value of represents the vorticity expected to be shed based on the dynamic characteristics of the turbine (cf. [31,61]). These structures extend from the top and bottom of the rotors and propagate downstream. Similar structures were observed by Ryan et al. [31], who demonstrated that at a higher tip-speed ratio the strength of these structures increases. This study adds to previous work by observing that these structures are symmetric in their streamwise spatial extent when sufficiently far from any tunnel boundaries. Additionally, the differences in Figure 8a,b demonstrate that the rotational orientation of these structures are dependent on the rotational orientation of the turbine. While data were not collected directly adjacent to the rotor, the sign of the vorticity in these wake structures suggests that they originate from the vorticity imparted to the flow by the spinning rotor. As this vorticity extends beyond the rotor it is bent by the flow and aligns with the direction of the freestream. This linked U-shaped vortical structure is illustrated by the grey vortex lines and rotational arrows drawn on Figure 8.
A comparison with vortical structures observed in the case of a finite wall-mounted cylinder provides some helpful context to these results. Analogies between VAWTs and rotating cylinders were explored by Araya et al. [15] and Craig et al. [62], but they did not capture the full 3D flow field. A short cylinder mounted to a wall sheds counter-rotating tip vortices from its top surface that are directed downstream of the cylinder [63]. Although the VAWT is neither solid nor wall-mounted, one would still expect the same kind of tip vortices to form. The velocity induced by the rotation of the turbine on the downstream side feeds one of these vortices and interferes with the other, which is why only one vortex line is visible in the data. Since the lower end of the VAWT is not fixed to a wall, the presence of a corresponding structure with opposite sign emanating from the underside of the turbine is expected. Since these structures are typically thin and stretched by the freestream flow above them (e.g., [61,64]), it makes sense that they would not be cleanly visualized given the nature of the 3D-PTV experiment. Lastly, the induced velocity of the rotating turbine accounts for the spanwise shift of these structures in relation to their reported locations in the wall-mounted cylinder literature.
Figure 9 show isosurfaces of the transverse vorticity () and vertical vorticity () around a clockwise rotating turbine. Together, the counter-rotating structures found in these vorticity components form a single coherent ringed vortical structure, which is positioned within the wake boundary (). This structure is a manifestation of fast-moving fluid outside the wake being pulled inward as the wake recovers. Unlike the streamwise vorticity, the orientation of this coherent vortical structure is insensitive to the rotational orientation of the turbine. The structure is similar to the so-called arch vortex observed behind finite wall-mounted cylinders [61,65]. This structure stems from bluff–body separation behind the cylinder, and thus its sign invariance relative to the rotation of the VAWT is expected.
3.3. Flow Features of a Pair Turbines
3.3.1. Velocity Fields around a Pair of Turbines
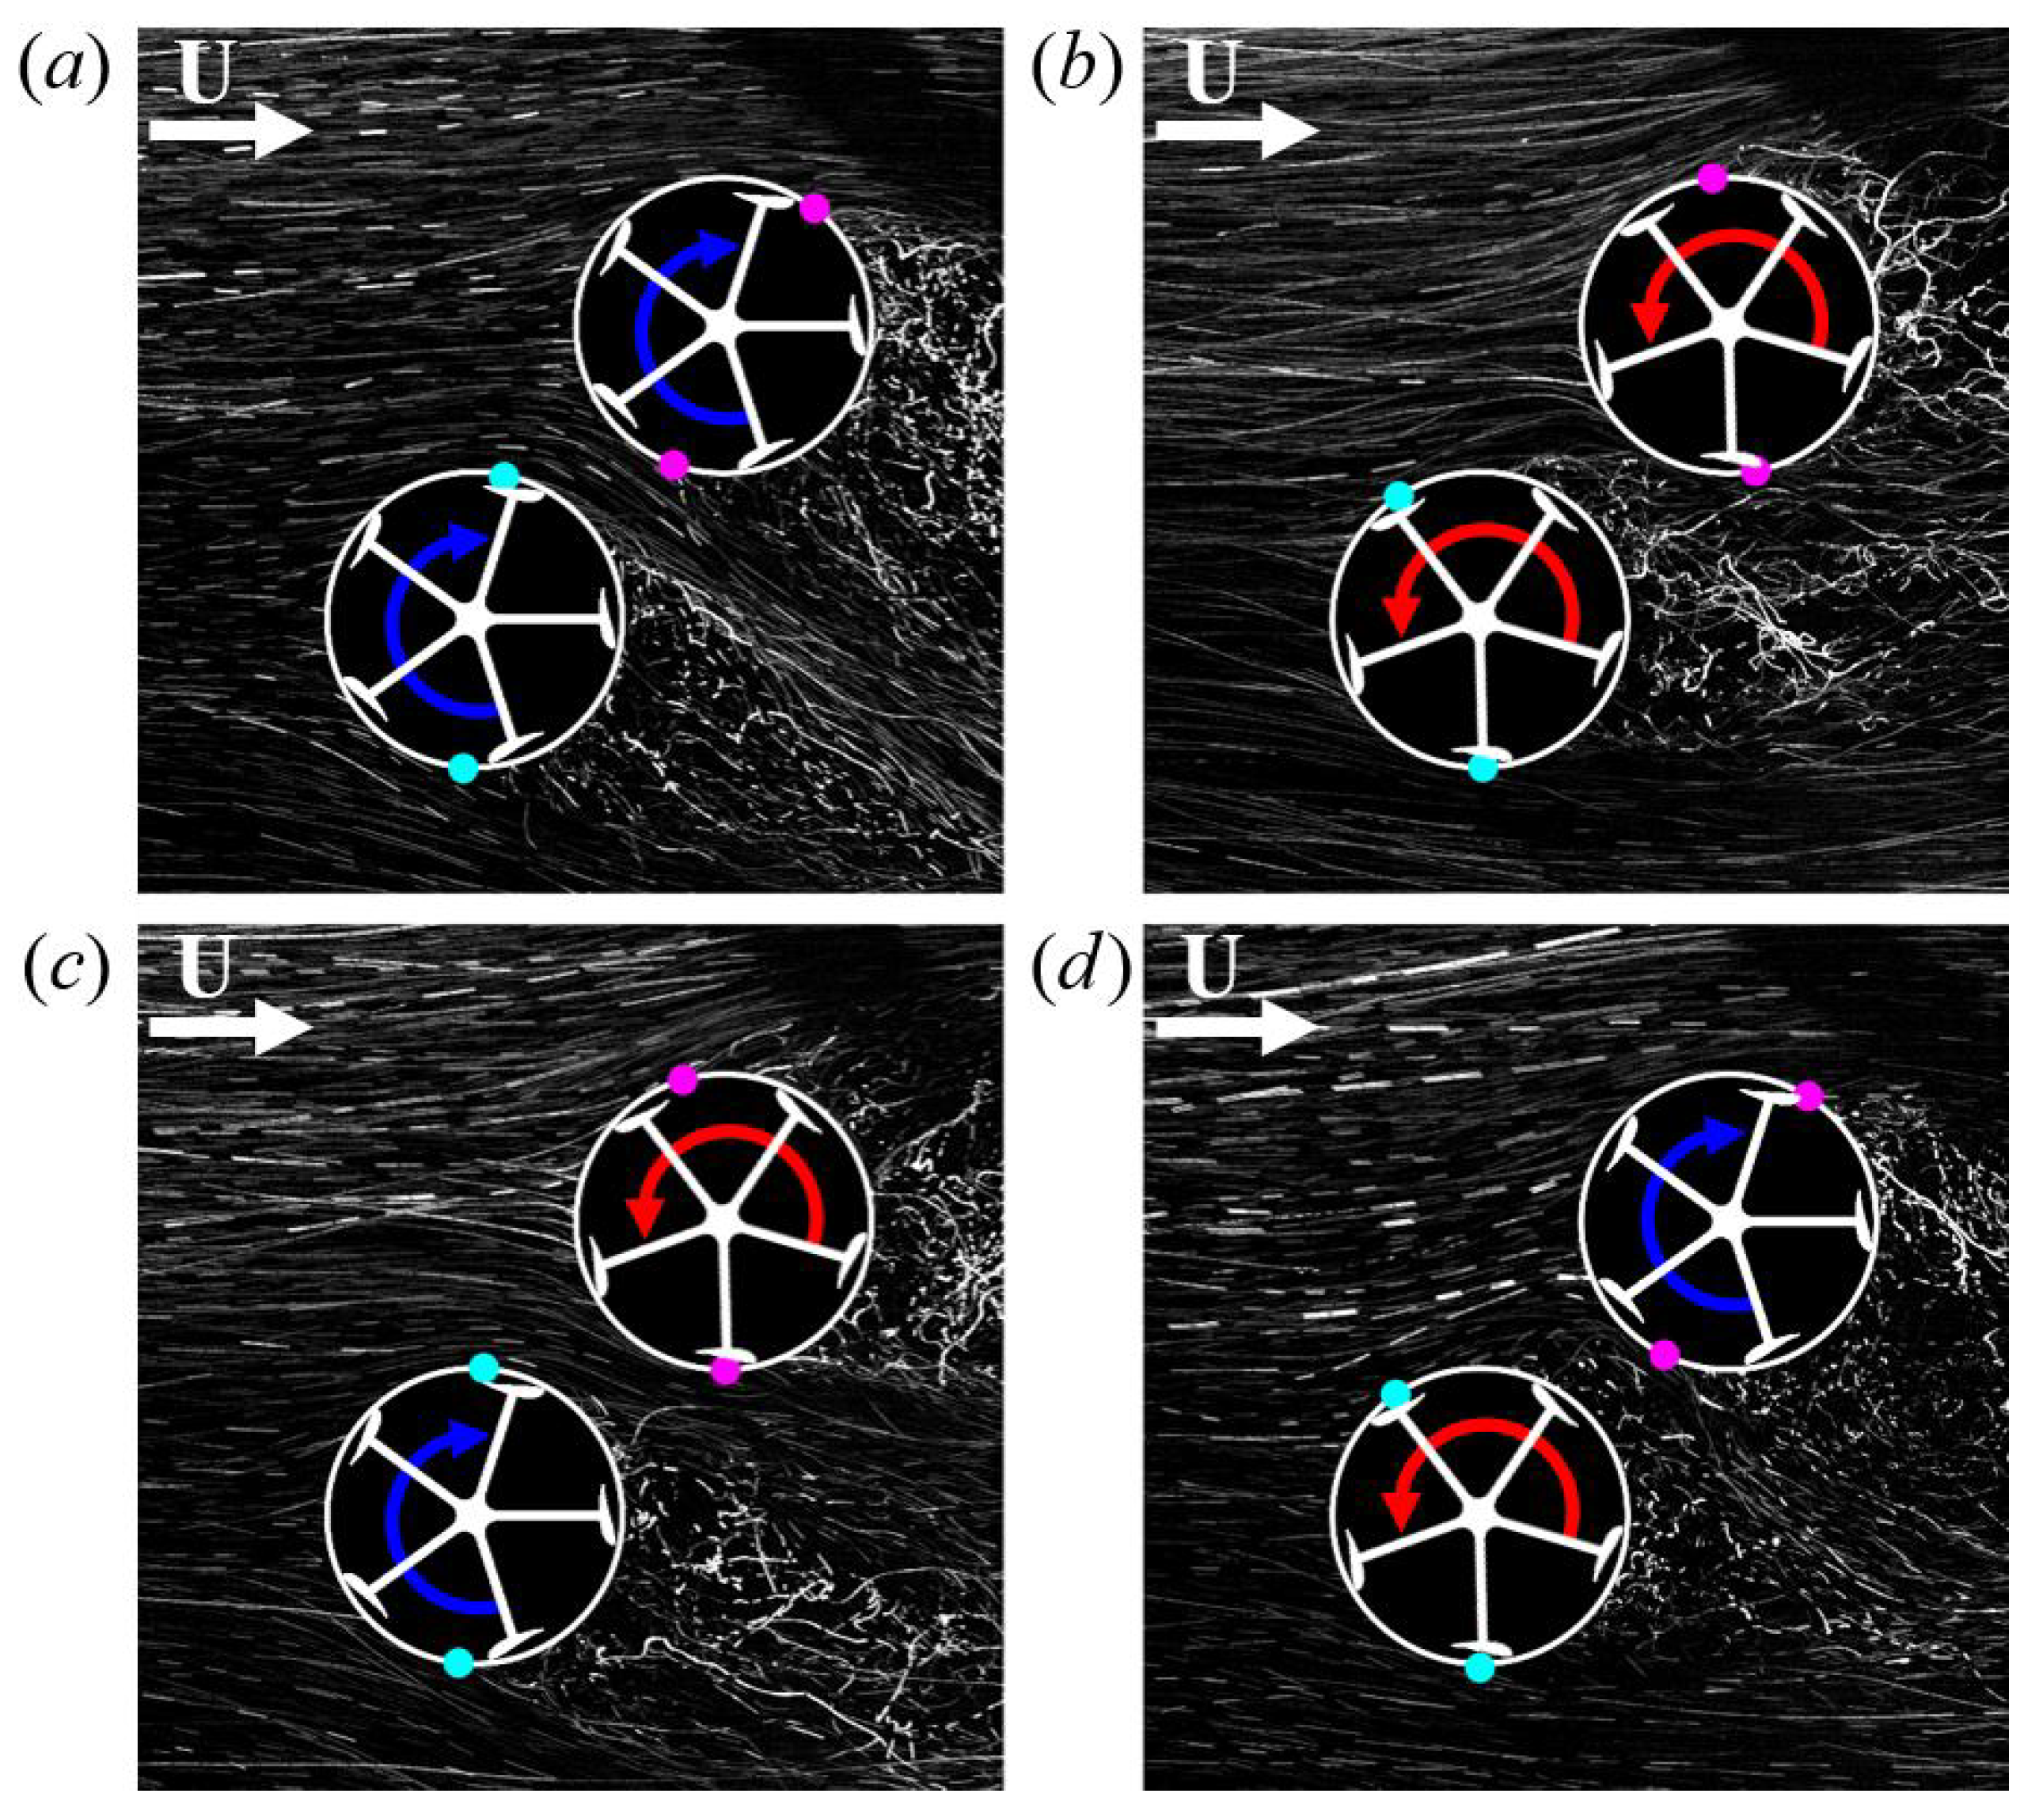
Once the baseline flow conditions around an isolated turbine were established, the flow fields around a pair of VAWTs could be characterized. Blade span-aggregated particle trajectories of the flow around four configurations of VAWT pairs are presented in Figure 10 in order to show schematically the differences in flow topology. It is observed in all four cases that the flow between the rotors is significantly modified when compared to the upstream turbine in isolation (i.e., in Figure 7). In the clockwise co-rotating case, Figure 10a, a coherent jet-like structure is formed which propagates downstream at an ∼90° angle from the line between the rotor centers. A less prominent form of this jet-like structure is formed for the reverse doublet and doublet arrays, Figure 10c,d. In these cases, the deflection of the jet is less pronounced.
In addition to the flow between the rotors being modified, the shape of the wakes behind the individual rotors is modified by the presence of the second rotor. This can be visualized near the rotors by the location where the particle trajectories “detach” from the rotor. While the concept of flow separation for a porous rotating body is not a precisely defined concept, the points of detachment are defined here as the locations where the trajectories turn away from the rotor. In Figure 10, these points are marked by the cyan dots for the upstream turbines and the magenta dots for the downstream turbines. The locations of these detachments are discussed further in Section 4.1.2.
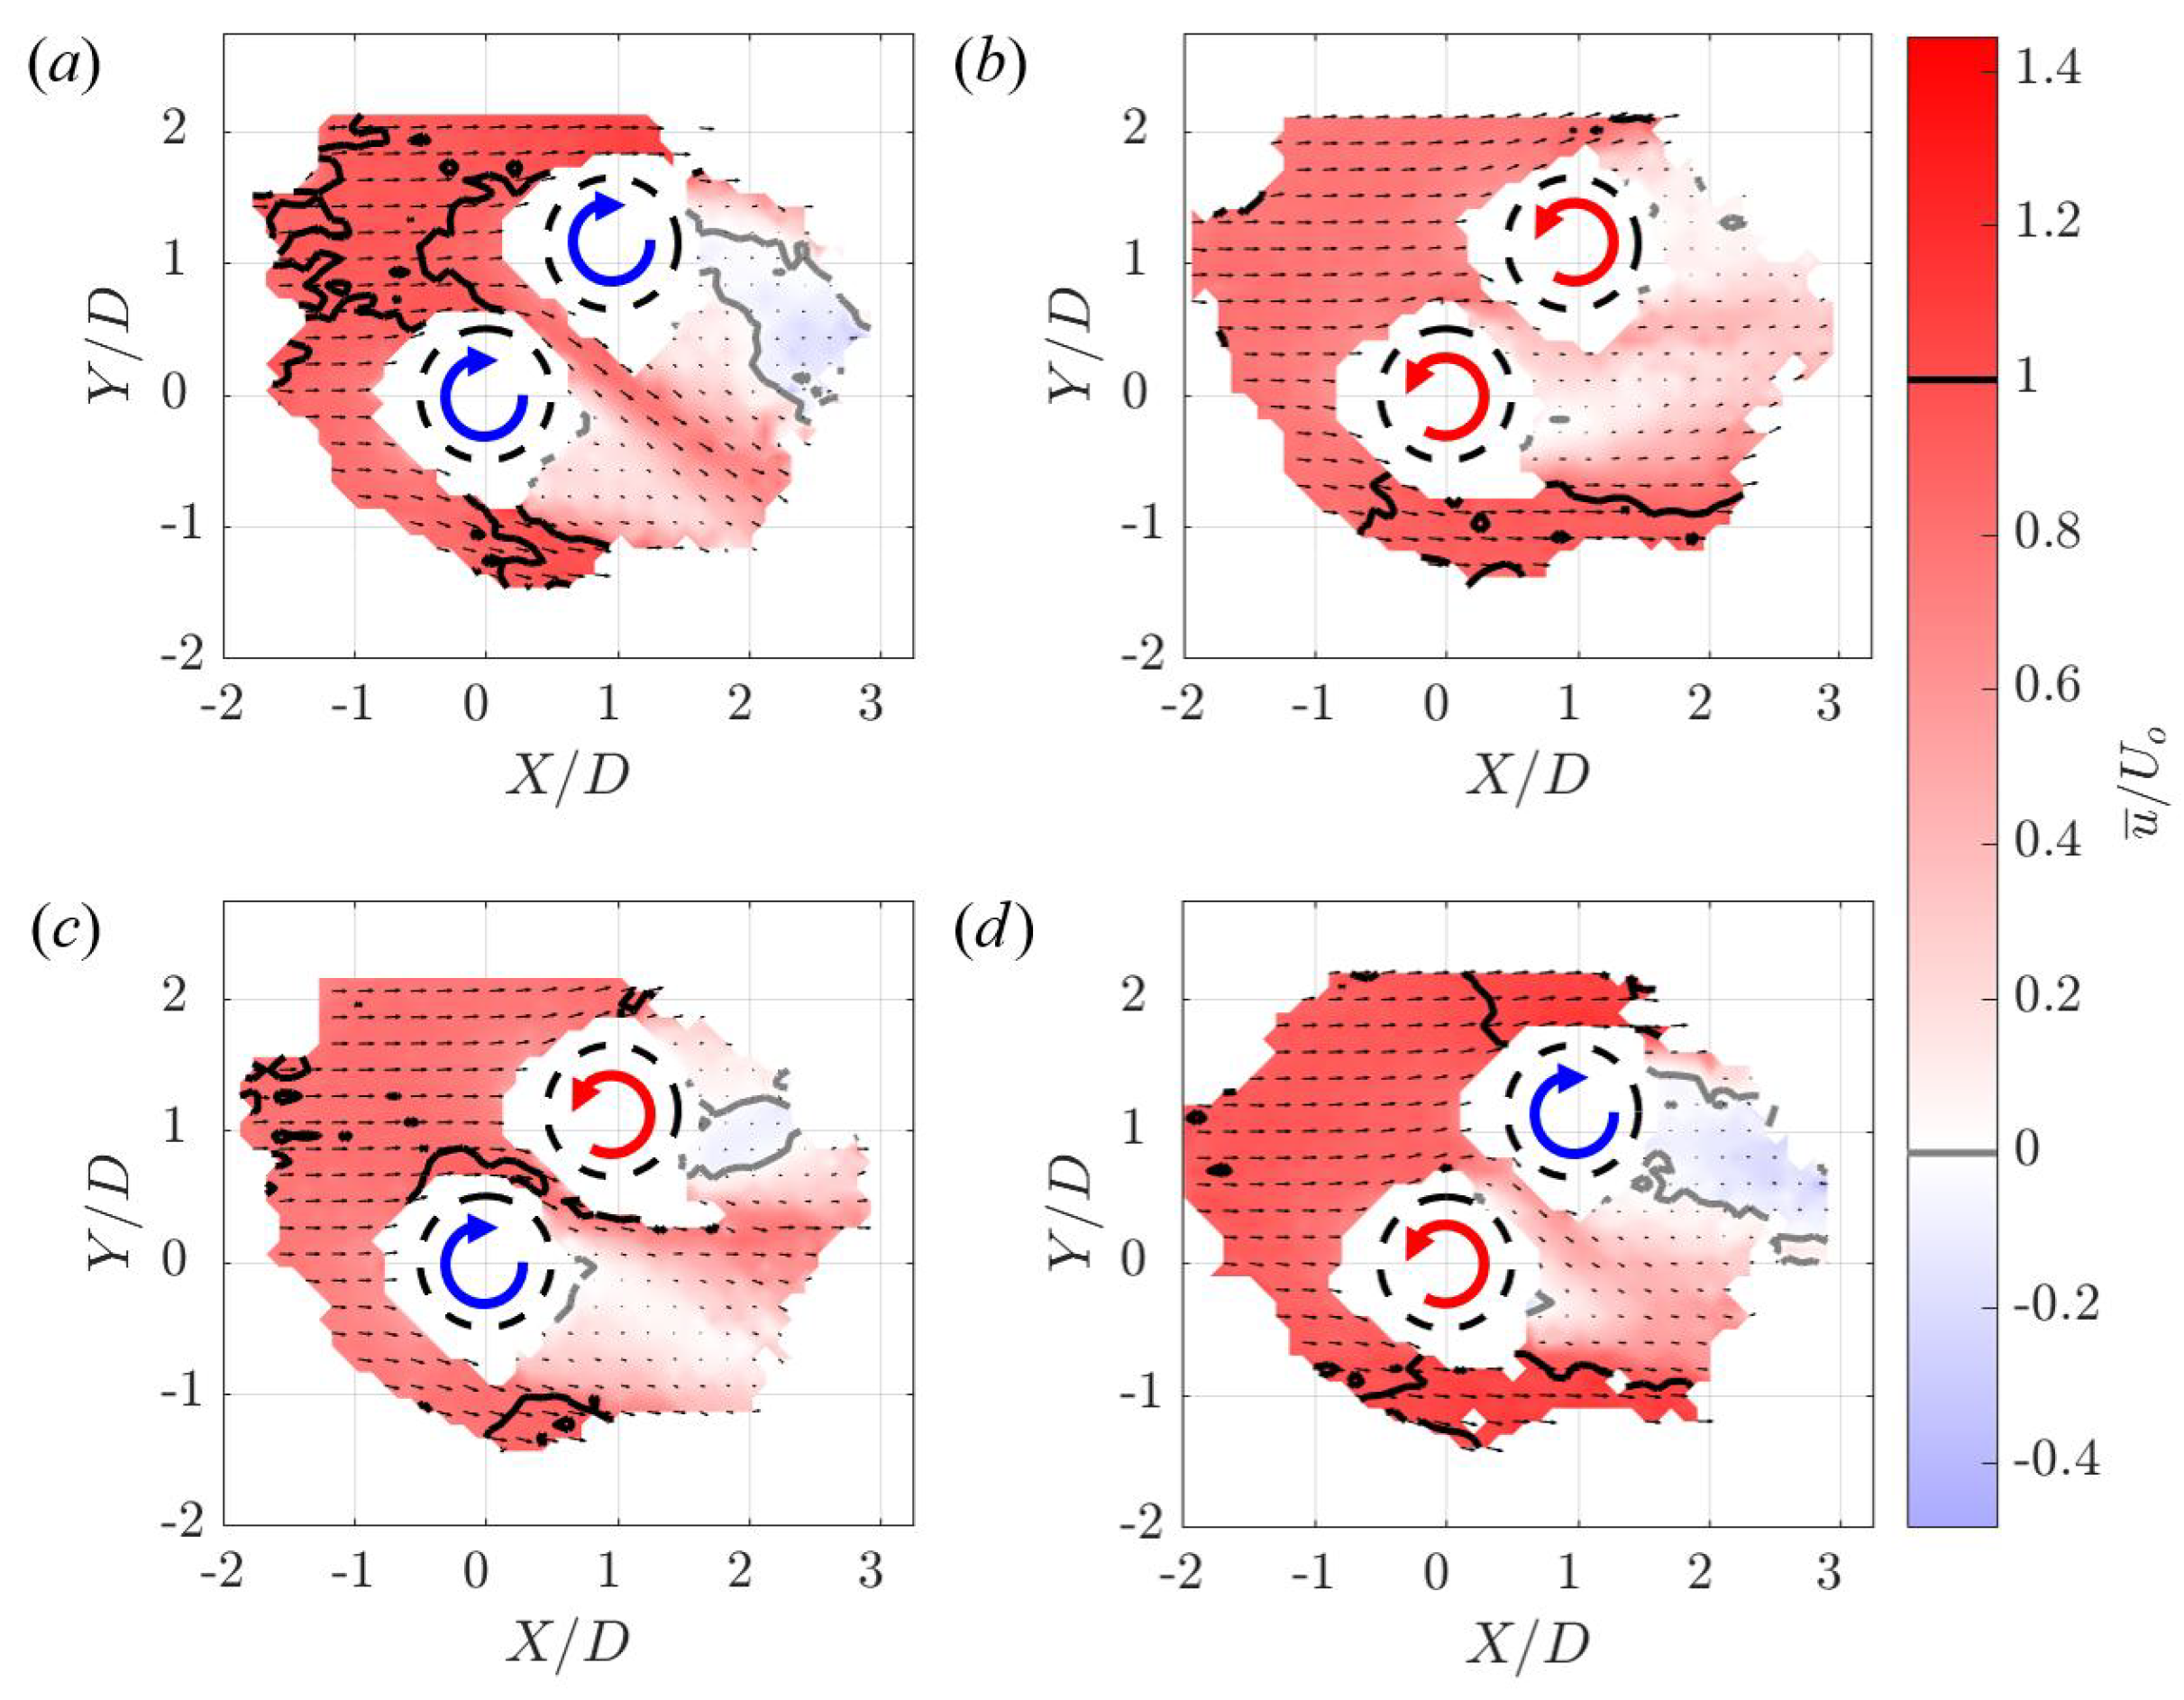
To quantify these flow modifications in more detail, cross-sections of the flow through the rotor mid-spans (), derived from the measured time-averaged three-dimensional flow field around these turbine configurations, are shown in Figure 11. These contours provide a more precise method of evaluating the flow features identified in the spanwise aggregated particle trajectory views in Figure 10. The jet-like features observed in the particle trajectory images are also observed in these contour plots. These structures transport high momentum fluid into the wake of the turbine pair. Notably, in the reverse doublet array (Figure 11c), the flow is accelerated to values of between the rotors. Additionally, it is observed that the flow incoming to the rotors in the clockwise co-rotating case is accelerated by the turbine pair before passing through the downstream turbine and a portion of the upstream turbine. In the cases where the upstream turbine is counter-clockwise rotating, accelerated regions are only observed toward the outer lateral edges of the array.
In addition to transport of high momentum fluid through the array, Figure 11 demonstrates significant wake suppression or enhancement due to the turbine interactions. In all of the array configurations measured, the wake of the upstream turbine is suppressed such that there is no significant reverse flow region. This type of suppression is also observed for the downstream turbine in the counter-clockwise co-rotating case (Figure 11b). For the other cases, a significant reverse-flow region is present. In the clockwise co-rotating and doublet arrays (Figure 11a,d), this reverse-flow region is significantly larger than it would be if the downstream turbine were operating in isolation. The presence of the reverse-flow region appears to depend primarily on the flow accelerations from the upstream turbine—namely, the acceleration of flow on the side of the turbine rotating with the wind, and the deceleration of flow on the side of the turbine rotating into the wind. These properties dictate the distribution of flow momentum around the rotors. This suggests that the marked performance enhancement observed for this case is associated with the redirection of momentum in the vicinity of the turbines.
3.3.2. Vortical Structures Downstream of a Pair of Turbines
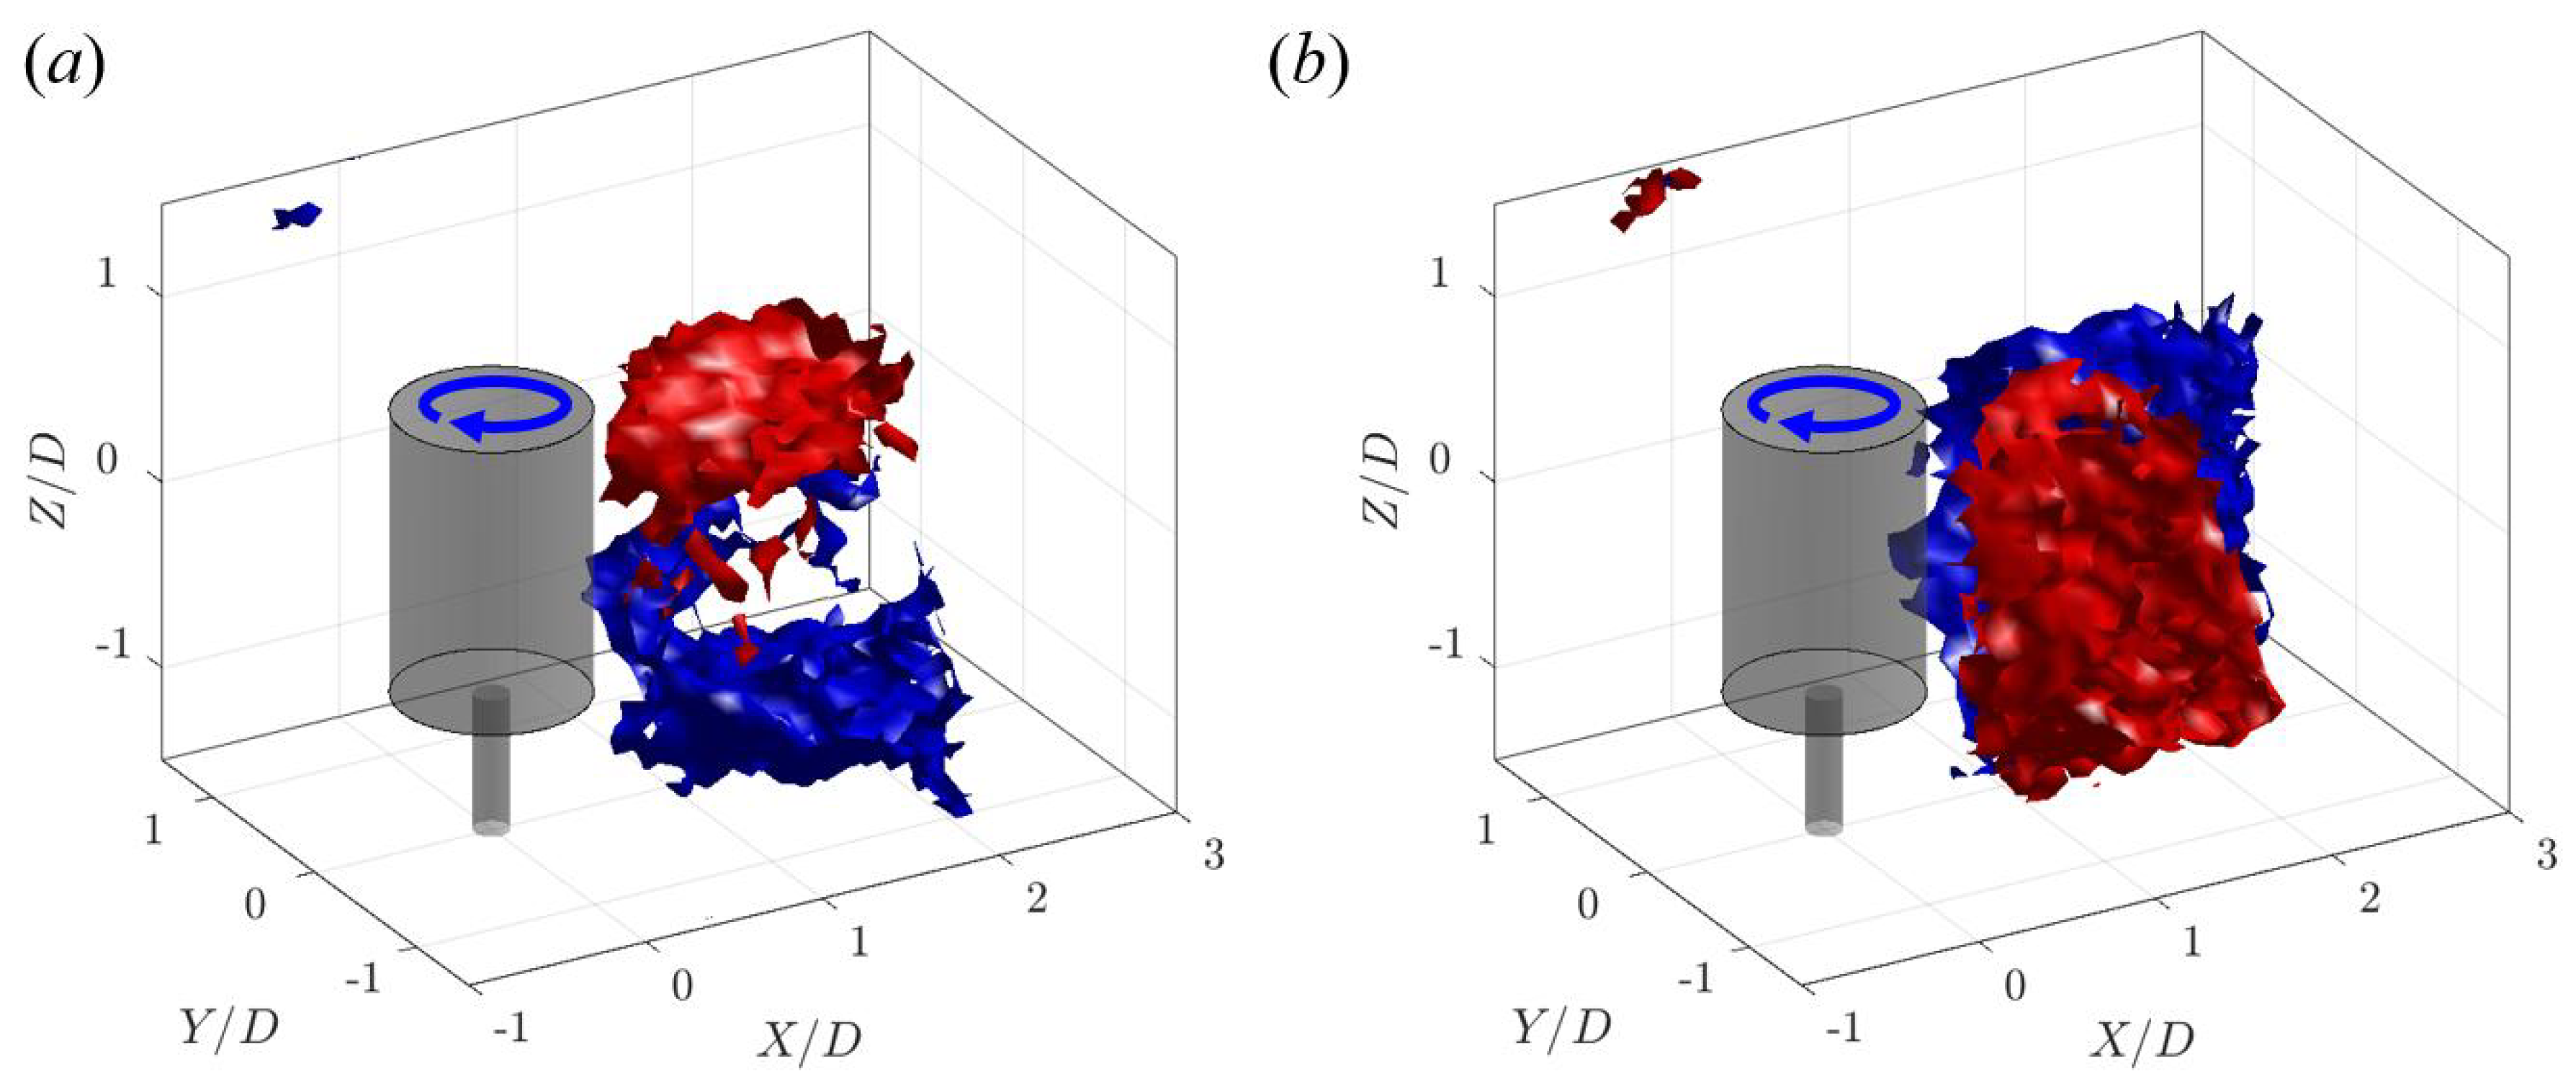
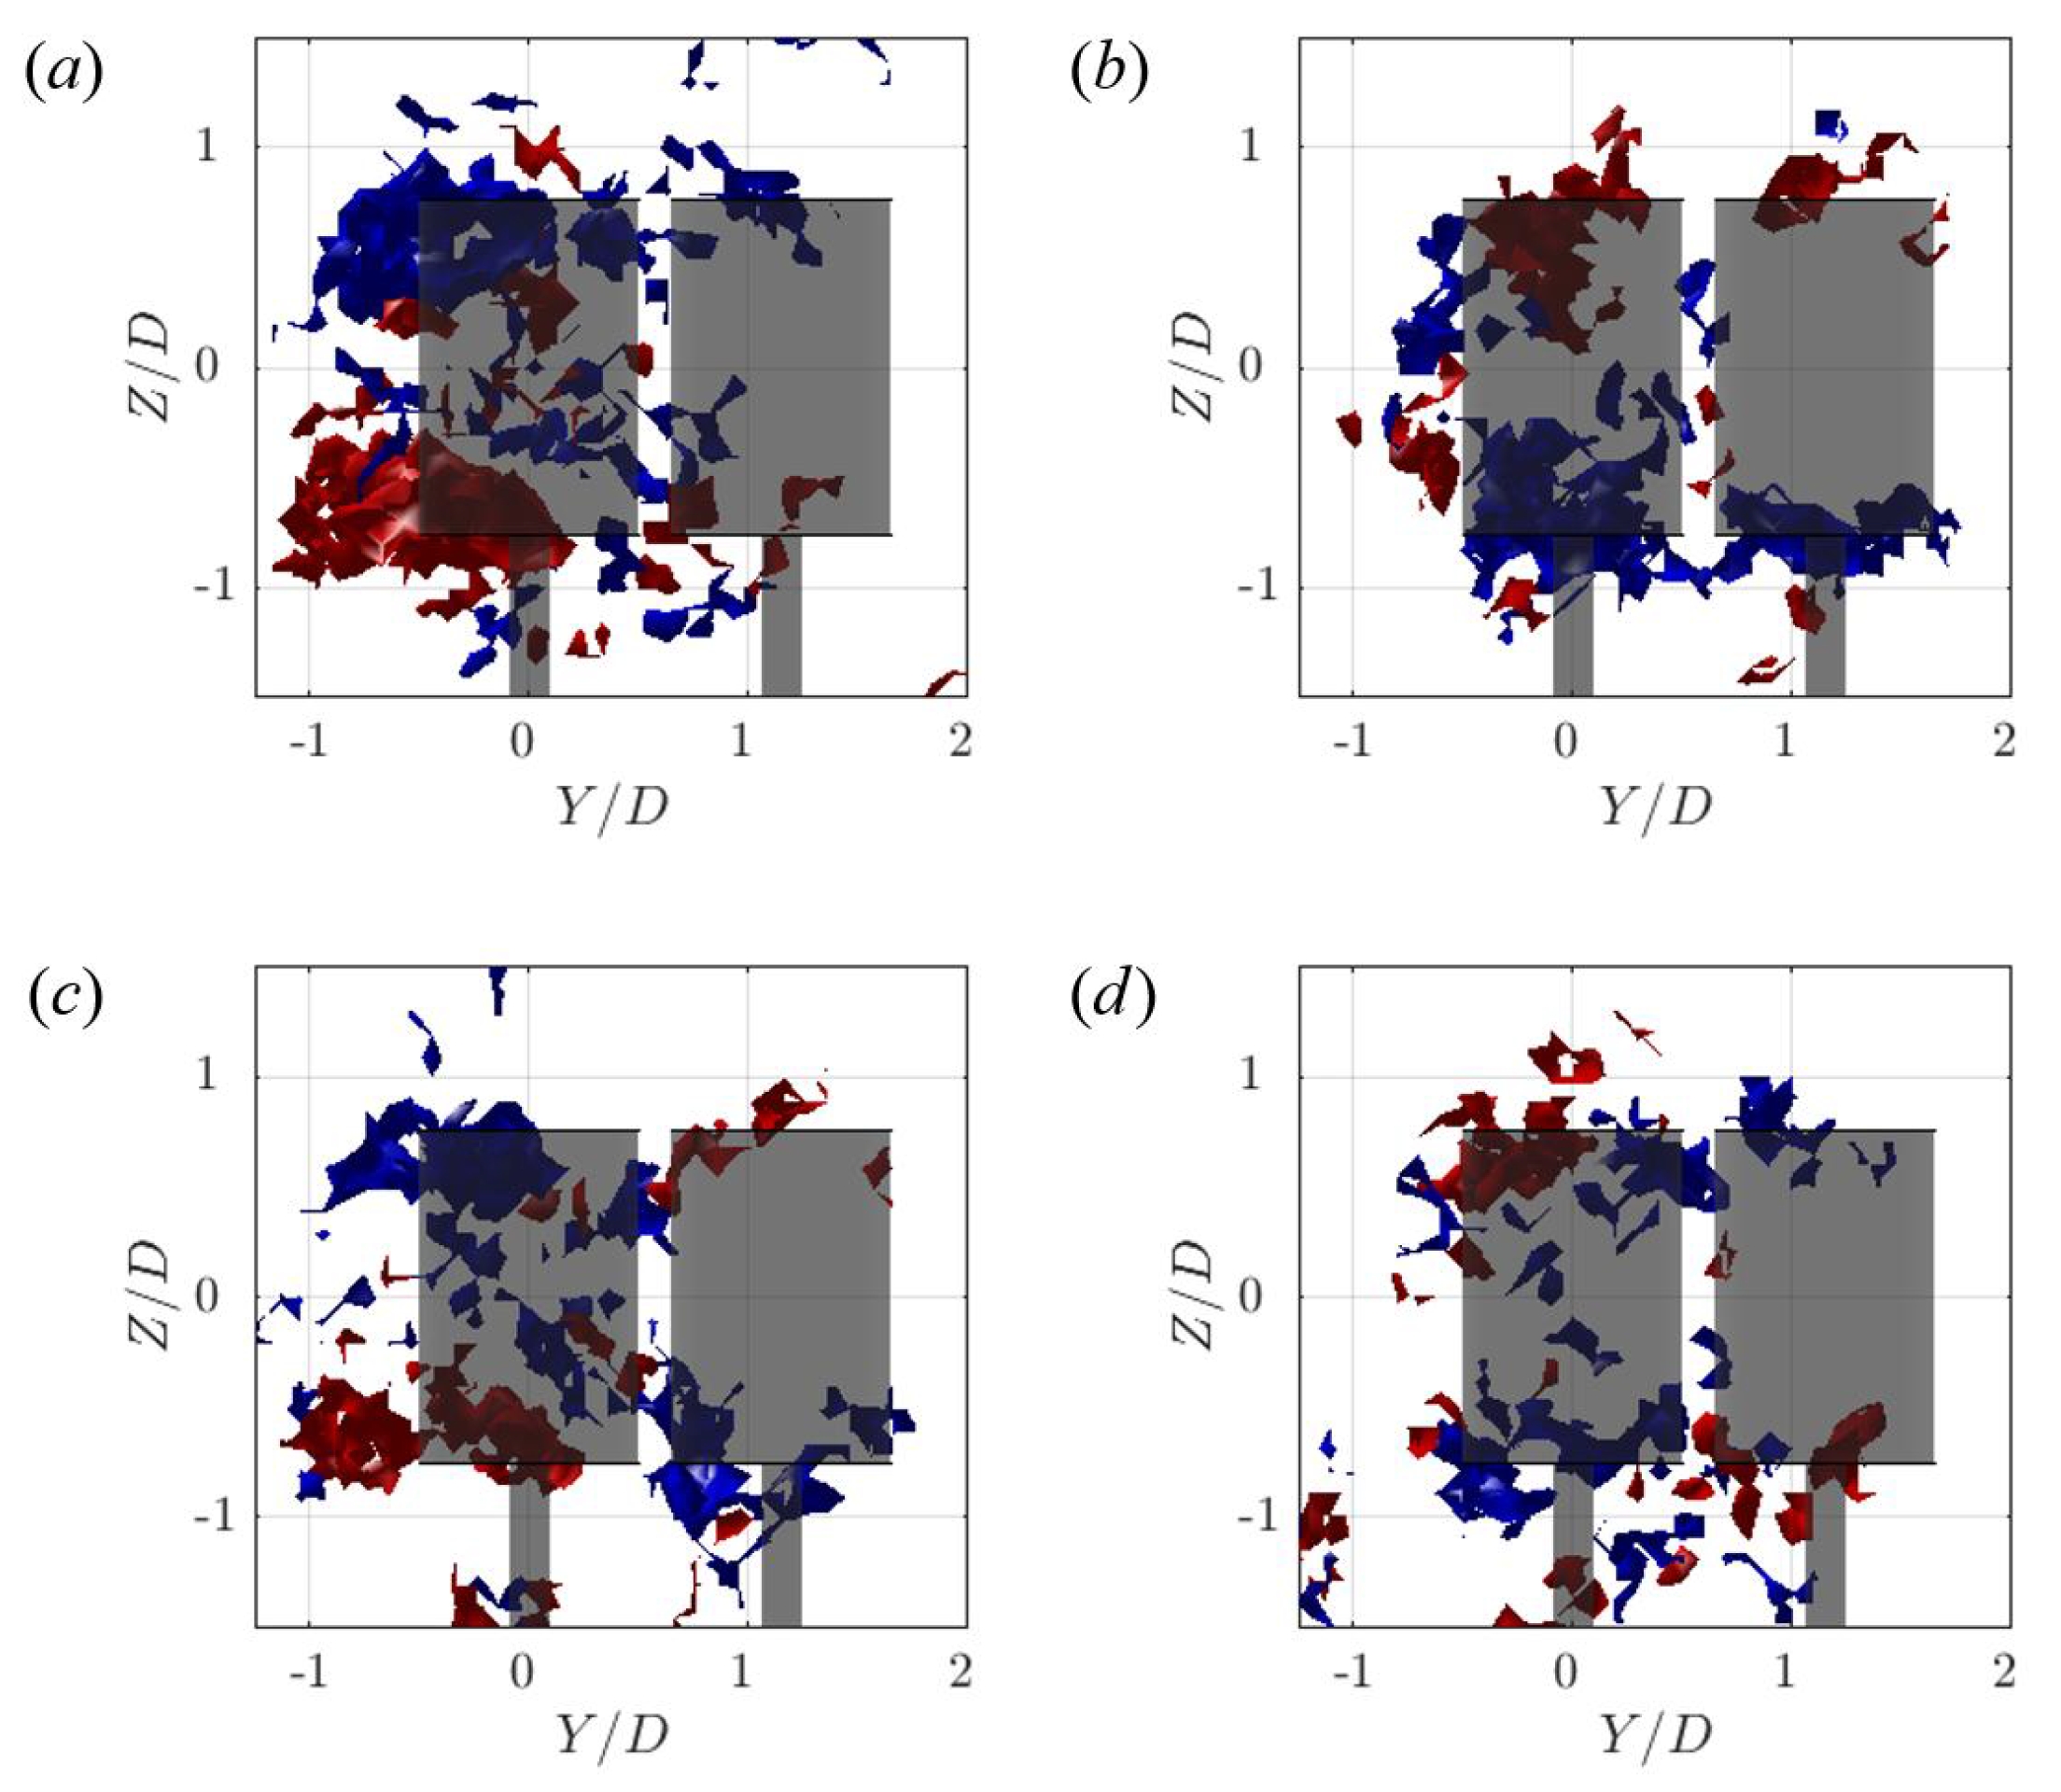
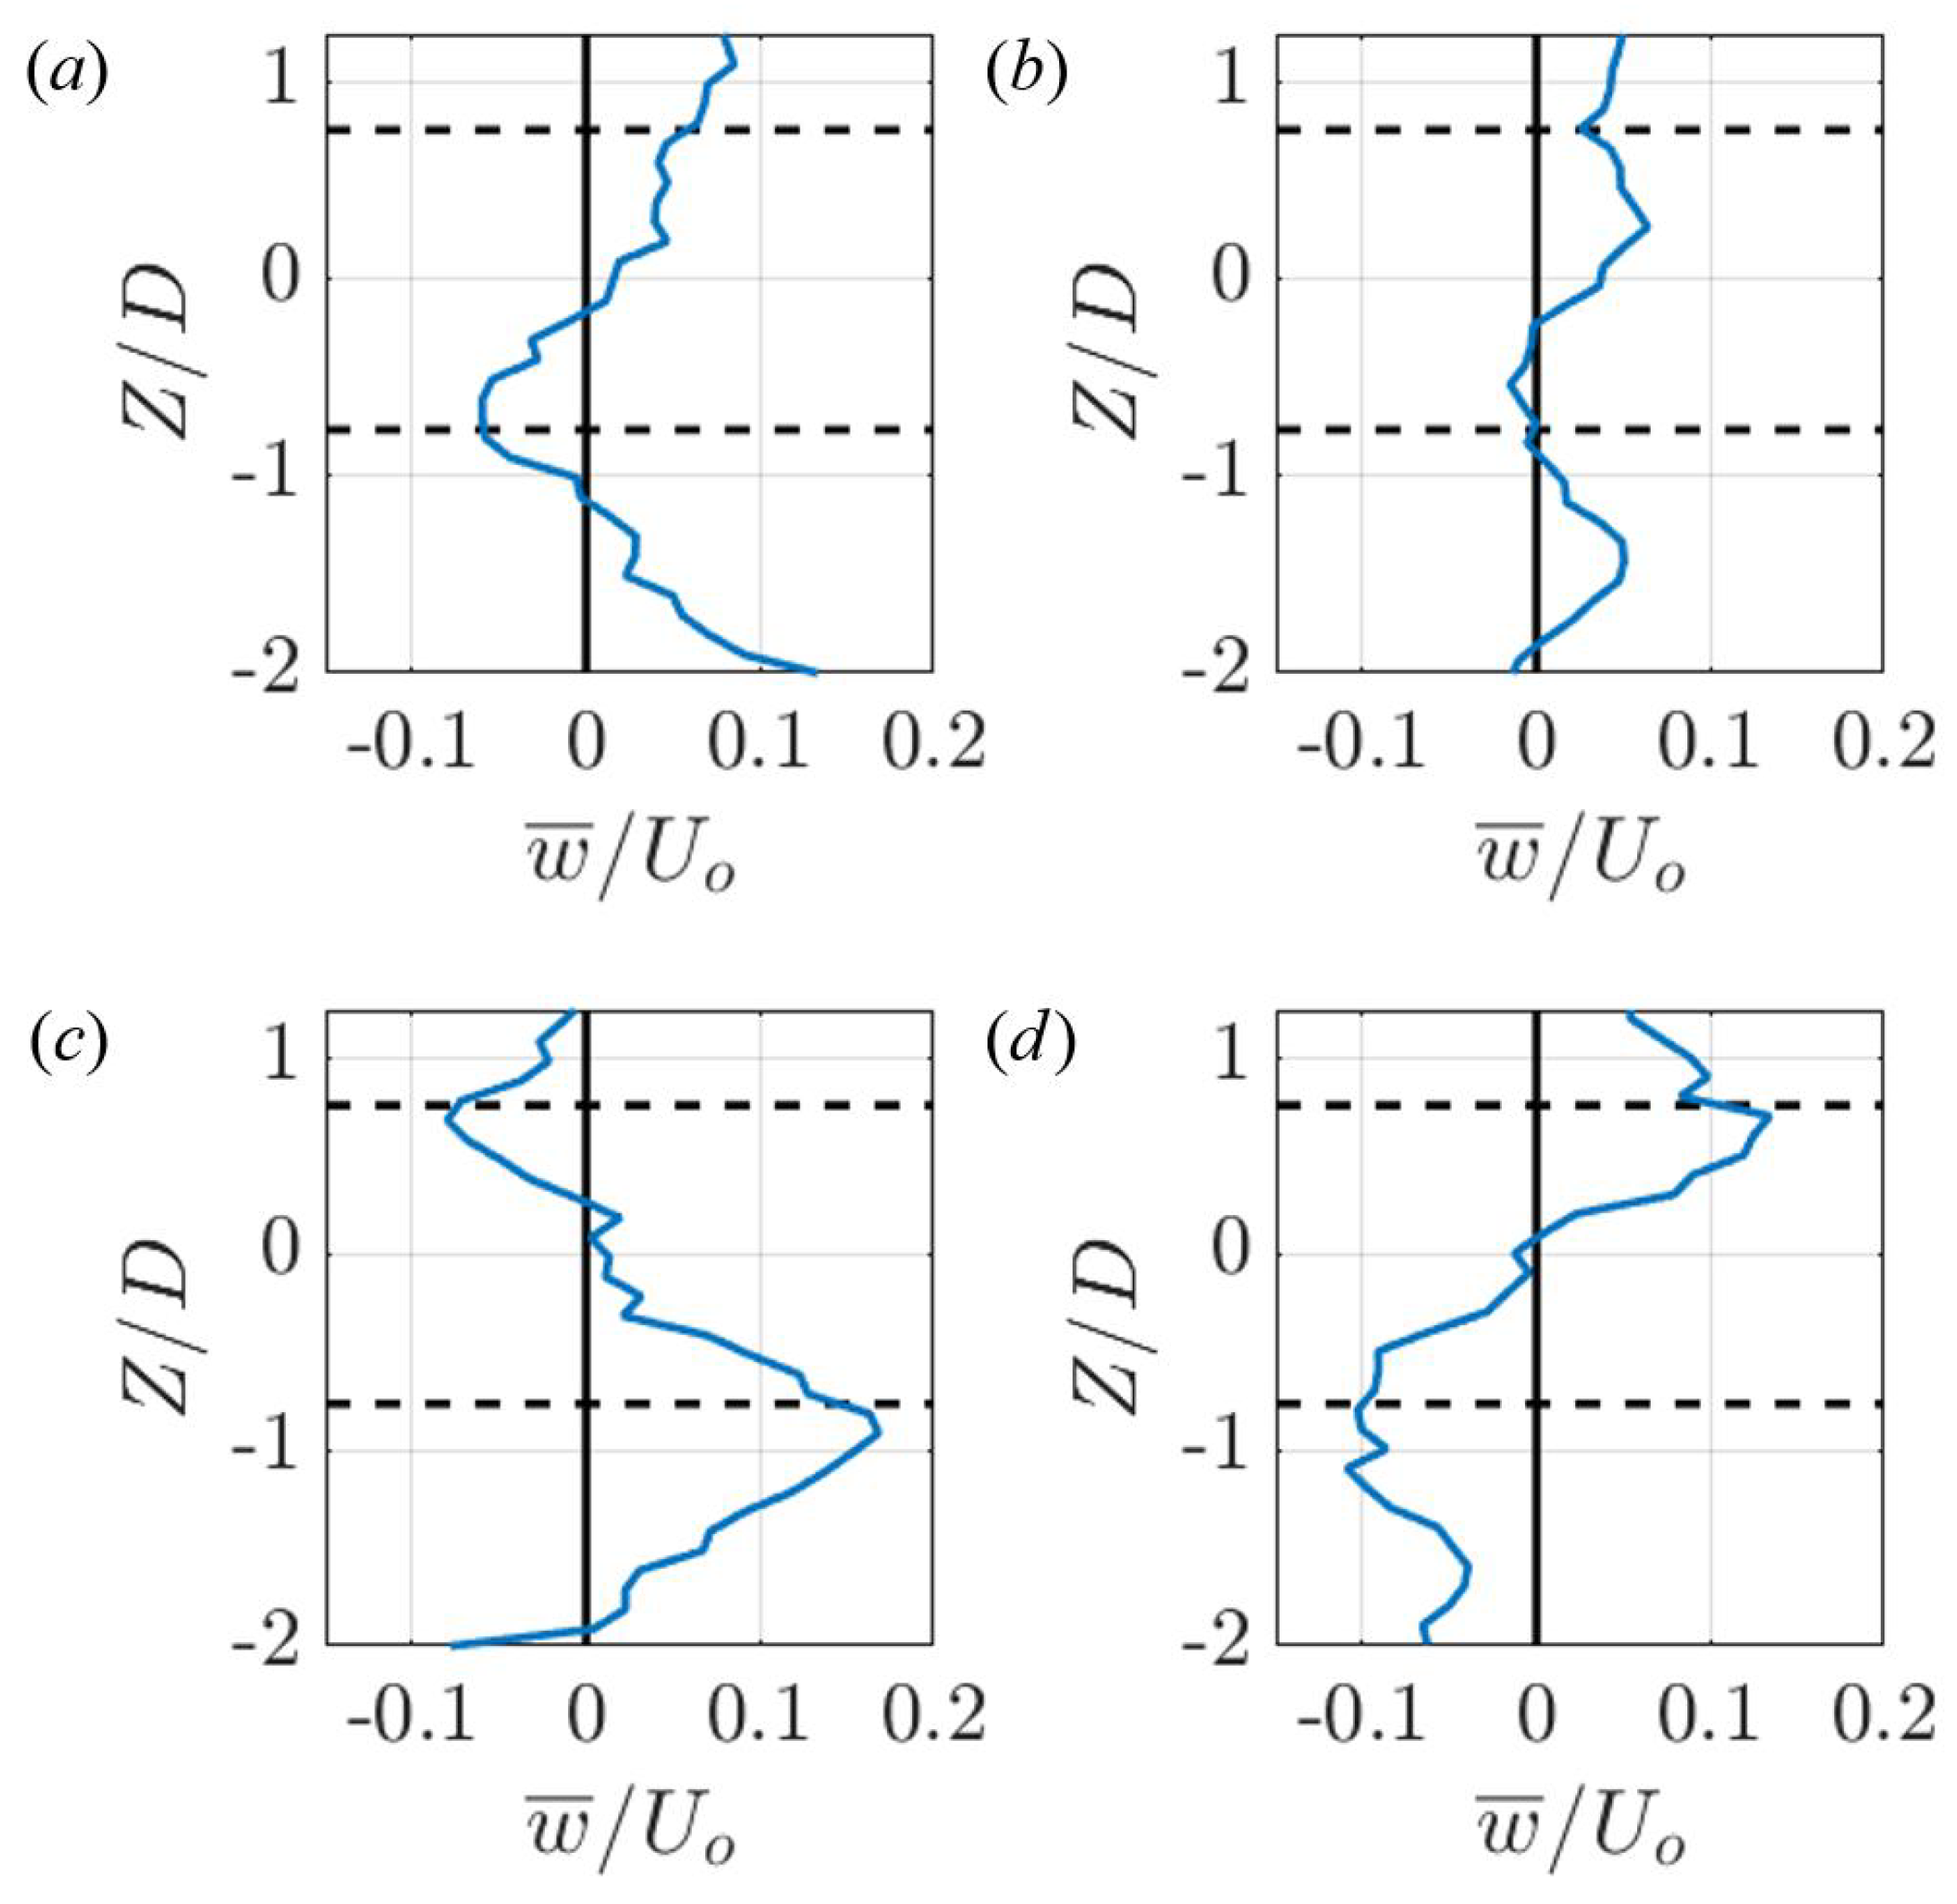
Isosurfaces of the streamwise vorticity () around the four paired turbine configurations are shown in Figure 12. As in the single turbine cases (Figure 8), these structures primarily extend from the top and bottom of the rotor and propagate downstream. Due to this preferential alignment and the complex nature of these structures, the views in Figure 12 are oriented facing upstream from behind the turbines for ease of discussion. While the streamwise vortical structures are less coherent in the paired arrays than in the isolated turbine cases, the dominant rotational sense of the structures compared to that of the VAWT that they propagate from is consistent with the single turbine observations. Specifically, for the co-rotating cases, the top and bottom of the turbine pair are primarily populated with streamwise vorticity of a single sign. In the counter-rotating cases, the turbines are shedding streamwise vorticity with opposite rotational orientation of the neighboring turbine. These structures interact to either pull fluid into the wake of the two turbine system or repel fluid outward. This is quantified in Figure 13, which shows transects of the normalized vertical velocity () between the rotors and downstream of the array. Specifically, in Figure 13c, it is noted that momentum is pulled into the reverse doublet array wake from above and below the rotor. In contrast, Figure 13d shows momentum is pulled out of the doublet array wake in both directions. In both cases, the sign change in the vertical velocity occurs around the rotor center (). These effects have not been captured in previous numerical or experimental work, which have generally only studied flow features in two dimensions (e.g., [4,5,8,22,23]).
4. Discussion
4.1. Relating Performance Variations and Flow Measurements
In this section, the results presented in the previous section are further discussed, in order to show that performance enhancements in a pair of VAWTs are due to changes in the mean flow field around both the upstream and downstream turbines.
4.1.1. Downstream Turbine Performance
As hypothesized by Araya et al. [23] and Brownstein et al. [8], the flow and performance measurements in this study suggest that the performance enhancement of the downstream turbine in a turbine pair is primarily governed by flow accelerations around the upstream turbine. This has already been shown in the previous section (cf. Figure 11), where the flow accelerations from the upstream turbine visibly affected the flow field encountered by the downstream turbine. This effect is further demonstrated in Figure 14, which shows the normalized velocity magnitude () around an isolated clockwise rotating VAWT and the normalized performance of the downstream turbine in a clockwise co-rotating array at the same locations. A comparison of these data suggests that accelerations of the flow passing around the upstream turbine are the primary source of downstream turbine enhancement. Relatively fine features, such as the maximum performance enhancement for occurring at a turbine spacing of , are replicated between these independent measurements. Furthermore, when the downstream turbine is in the wake of the upstream turbine, the shape of the downstream turbine performance decay has a similar shape to the skewed wake behind an isolated VAWT. The similar trends in these data illustrate the strong correlation between these measurements.
4.1.2. Upstream Turbine Performance
Previous works have addressed the average array enhancement that occurs when turbines are aligned perpendicular to the freestream [6,21] and at other array angles [66]. In these numerical studies, it has been observed that the performance enhancement is due to modifications in the angle of attack on the blades caused by the influence of the adjacent rotor. These changes increase the torque produced by the rotor blades, increasing the turbine performance.
The flow measurements in this study cannot be used to quantify angle of attack or incident flow speed changes on the blades of the rotors due to the lack of resolution of the data at the blade surfaces. However, the near-rotor resolution in the spanwise aggregated particle trajectory images in Figure 7 and Figure 10 can be used to define a surrogate for the modifications in these parameters. In the wake region of the rotor, the flow speeds are too low for significant torque to be produced by the rotor blades. Therefore, the range of azimuthal positions where the flow is “attached” to the rotor () can be used as a rough surrogate for the percentage of the rotor where useful torque is produced. In Figure 10 these points are marked by the cyan dots for the upstream turbines and the magenta dots for the downstream turbines. Using these measurements, the values of for both turbines in the array can be normalized by the range of attached azimuthal positions for the isolated turbine () to give a normalized metric which can be used to approximate the changes in a rotor’s net torque production ().
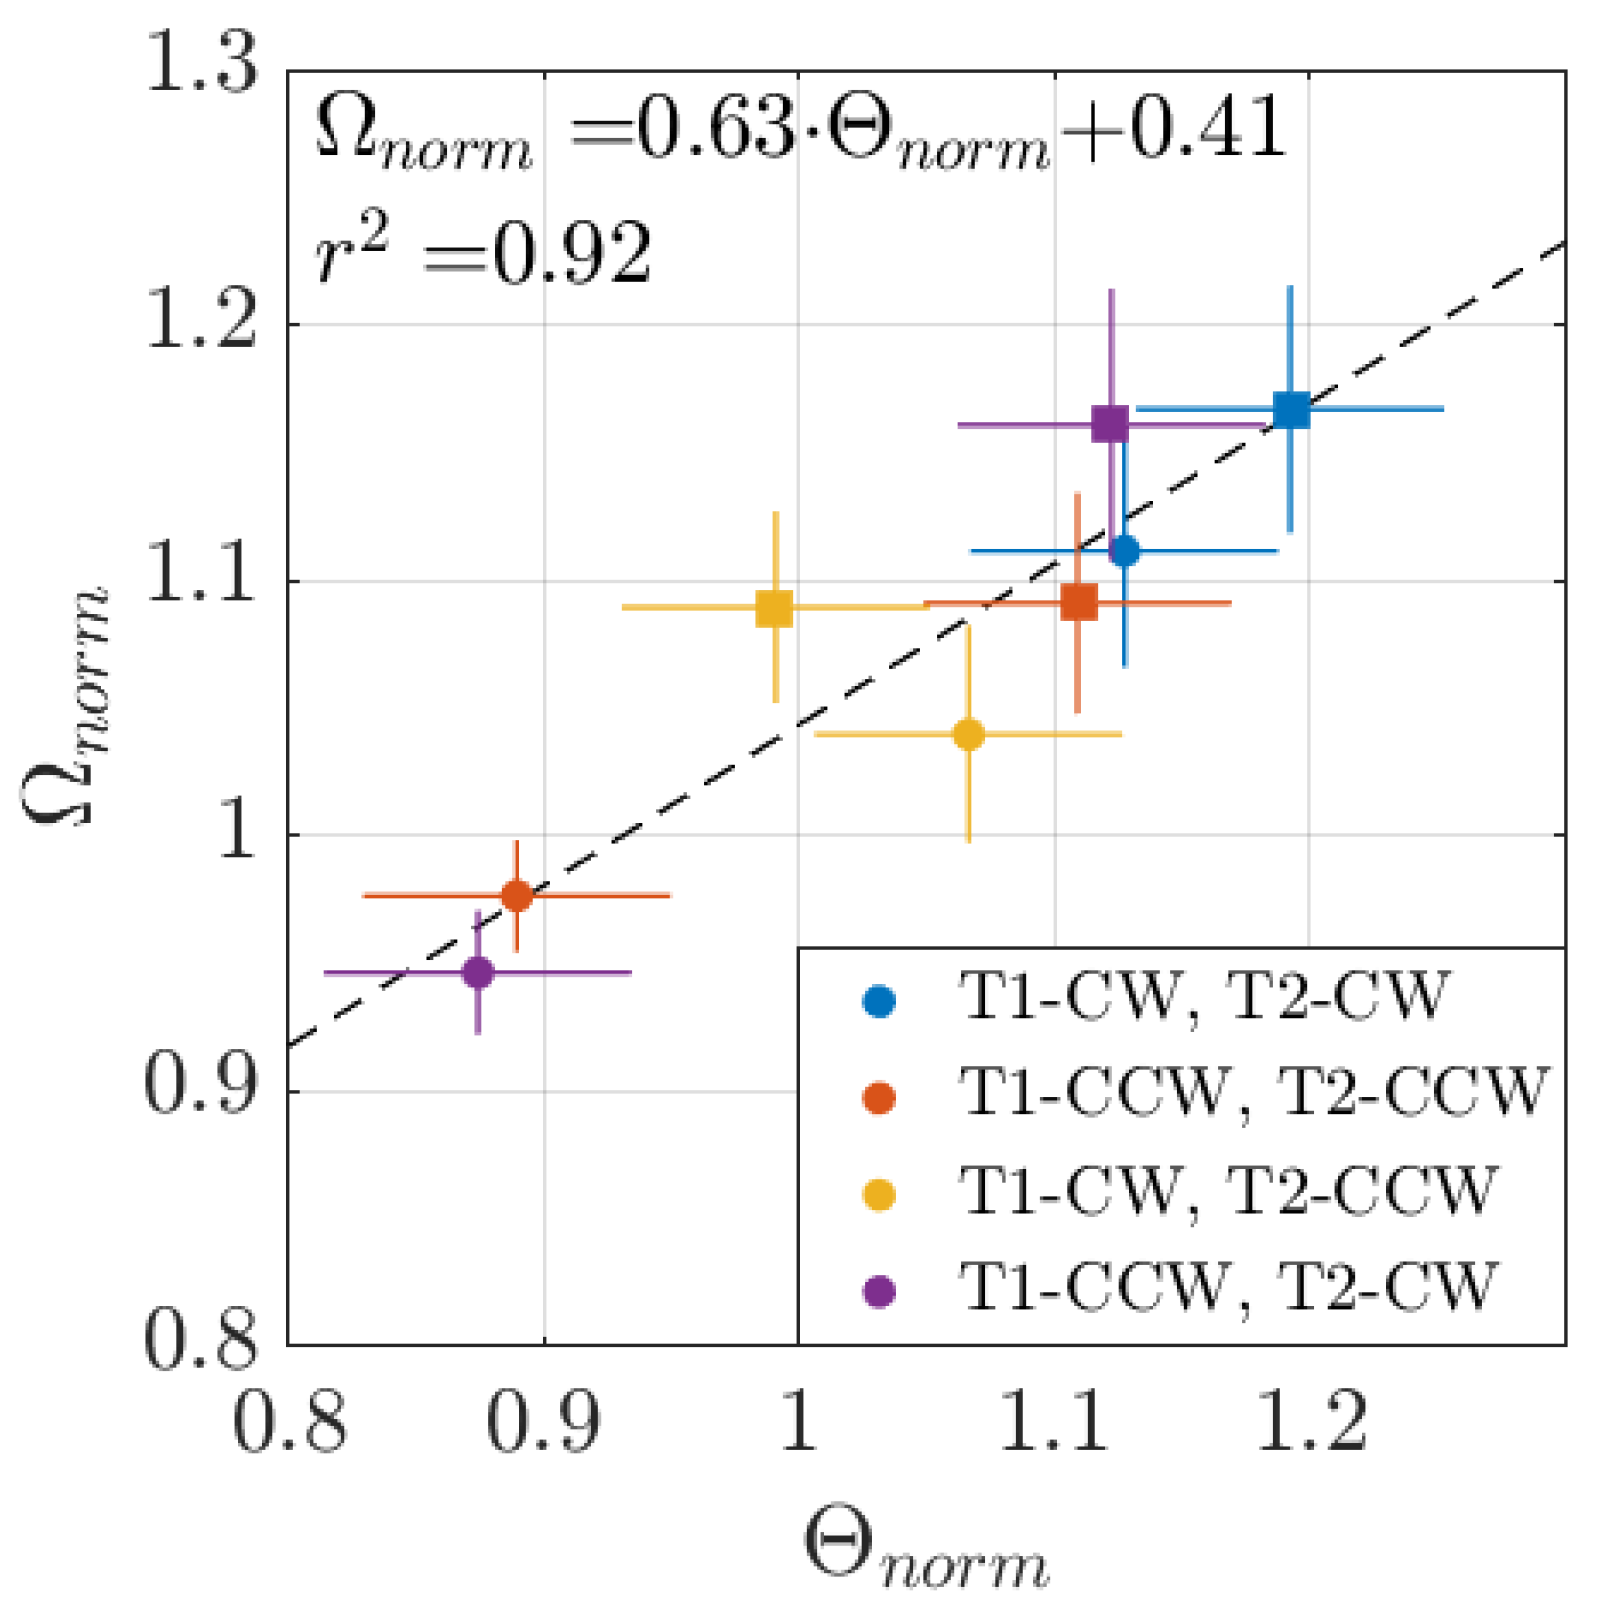
Figure 15 shows this metric plotted against the normalized performance of the turbines in the four configurations of turbine pairs for which spanwise aggregated particle trajectory images were taken. Of note, the error bars in represent plus or minus in the identification of the range of azimuthal positions where the flow is attached to account any ambiguity in selecting this range. This trend demonstrates a relationship between the percentage change in where useful torque can be produced and the normalized performance of the turbine. Hence, the influence of the downstream turbine on the upstream one can be conceptualized as a modification to the azimuthal extent where the flow around the blades of the upstream turbine can produce useful torque.
4.2. Implications for Wind Farm Performance
The time-averaged flow measurements in this report demonstrate significant turbine interactions in paired arrays of VAWTs. These interactions have significant implications for both the power output of the turbine pair and for additional downstream turbines in a larger array. In the context of a larger array, the near-wake suppression and enhancement observed directly behind the turbines will affect the energy available for extraction by turbines further downstream. Additionally, the streamwise vortex interactions which occur downstream of the turbine pair can be utilized to hasten wake recovery by exciting mean vertical flow of momentum into the wake from above and below the turbines. From this perspective, the reverse-doublet configuration is well suited for entraining momentum from above the array and therefore increasing the energy available within the wake to turbines downstream of the VAWT pair.
Because of the sensitivity of VAWT dynamics to the tip-speed ratio, it is important to consider how the effects shown in this study may be modified at higher tip-speed ratios. The strength of the streamwise vortical structures responsible for momentum replenishment in the wake appears to scale proportionally with tip-speed ratio (cf. [31]). The effect is thus a consequence of the turbine’s dynamics, and not the details of the rotor geometry. The streamwise vortices and associated induced flow accelerations identified in this study are therefore expected to be even stronger in turbines operating at higher tip-speed ratios, such as the turbine presented by Möllerström et al. [42], despite the lower solidity of these turbines. Lower-solidity turbines will, however, likely exhibit decreases in the strengths of the bluff–body vortex structures shed from the individual turbines, which would decrease these structures’ contributions to turbulent entrainment of momentum into the wake. Higher aspect ratios would imply that the momentum replenishment of the streamwise vortices would be confined to a proportionally smaller percentage of the total wake area. The wake recovery due to the mechanisms isolated in this study for turbines of higher aspect ratios would therefore likely be slower than that of the turbines used in these experiments; however, the mechanisms are still expected to be significant factors in the replenishment of momentum into the wake. Future studies could more quantitatively determine the precise momentum-entrainment properties of VAWT arrays as functions of solidity, tip-speed ratio, and aspect ratio.
Other considerations related to turbine efficiency, sensitivity to wind direction, and fatigue loading will also be important to consider. For example, power production will be a function of the annual variation in the site wind magnitude and directions. To maximize power output at a site where the wind direction is variable, an array that outputs near-maximum power over the observed range of wind directions is needed. As shown previously in Figure 5, the performance of the co-rotating pair of turbines exhibits the desired robust performance enhancement over large ranges of array angles. At its peak, this case results in an average of 14% increase in array performance between at the closest spacing measured. This region persists for all spacings measured, with a decreasing average enhancement for larger turbine spacings. Therefore, the co-rotating configuration would be well-suited for wind farms based on a well-spaced unit cell layout where the wind direction is variable.
5. Conclusions
The conclusions of this work are outlined as follows: (1) Performance enhancement was measured for both the upstream and downstream turbines in paired configurations of VAWTs. While previous studies have observed performance enhancement for the downstream turbine, upstream turbine enhancement was observed here for the first time. (2) The turbine spacings and incident wind directions which result in increased performance for the downstream turbine were demonstrated to be spatially correlated with bluff–body accelerations around the upstream turbine. These accelerations increase the incident freestream velocity on appropriately positioned downstream turbines. (3) For the upstream turbine, changes in performance are related to modifications to the surrounding flow field due to the presence of the downstream rotor. (4) Three-dimensional velocity measurements revealed streamwise vortical structures shed by the rotors, which induce mean wake replenishment from above and below the rotor.
The data demonstrate regions of increased performance for both the upstream and downstream turbines, which can be used to increase the performance of VAWT arrays using a turbine pair as a unit cell in the design. While these relations were found using a surrogate for the torque produced by the upstream and downstream rotor, future work may seek to relate changes in performance to changes in the induced angle of attack and resultant freestream on the upstream turbine blades. Measurements of the induced angle of attack would be particularly useful in characterizing the effects of dynamic stall on the flow-field properties, especially across a range of tip-speed ratios.
The streamwise vortical structures identified in this study can also be incorporated in the design of large wind farms with more optimal wake-recovery characteristics. If large arrays of VAWTs are designed with these structures in mind, the replenishment of lost momentum in the wakes of turbines deep within the array could be facilitated so that these turbines are able to extract more energy from the flow. These observations highlight the role of vortex dynamics in the near wakes of VAWT arrays, and should be taken into account in the optimization of wind farms for maximum power density.
Although this study focused on modifying array parameters for a fixed turbine design, it is important to acknowledge that turbine design parameters could also affect this optimization. The turbine solidity, tip-speed ratio, aspect ratio, Reynolds number, and loading conditions all affect both the individual efficiency of the turbines in isolation and the strength of turbine interactions. Future work will quantify these dependencies and validate the assumptions used to model the performance of the upstream turbine.
Author Contributions
Conceptualization, I.D.B. and J.O.D.; methodology, I.D.B. and J.O.D.; software, I.D.B., N.J.W. and J.O.D.; experiments, I.D.B.; data analysis, I.D.B., N.J.W., and J.O.D.; writing, I.D.B., N.J.W. and J.O.D.; and funding acquisition, I.D.B. and J.O.D.
Funding
The authors gratefully acknowledge funding from the Gordon and Betty Moore Foundation through Grant No. 2645 and the Stanford University TomKat Center for Energy Sustainability.
Acknowledgments
The authors would like to thank Jen Cardona for her work in setting up and characterizing the wind tunnel and camera system used in these experiments.
Conflicts of Interest
The authors declare no conflict of interest.
References
- Shigetomi, A.; Murai, Y.; Tasaka, Y.; Takeda, Y. Interactive flow field around two Savonius turbines. Renew. Energy 2011, 36, 536–545. [Google Scholar] [CrossRef]
- Kinzel, M.; Mulligan, Q.; Dabiri, J.O. Energy exchange in an array of vertical-axis wind turbines. J. Turbul. 2012, 13, 1–13. [Google Scholar] [CrossRef]
- Kinzel, M.; Araya, D.B.; Dabiri, J.O. Turbulence in vertical axis wind turbine canopies. Phys. Fluids 2015, 27, 115102. [Google Scholar] [CrossRef] [Green Version]
- Giorgetti, S.; Pellegrini, G.; Zanforlin, S. CFD investigation on the aerodynamic interferences between medium-solidity Darrieus Vertical Axis Wind Turbines. Energy Procedia 2015, 81, 227–239. [Google Scholar] [CrossRef]
- Shaheen, M.; Abdallah, S. Development of efficient vertical axis wind turbine clustered farms. Renew. Sustain. Energy Rev. 2016, 63, 237–244. [Google Scholar] [CrossRef]
- Bremseth, J.; Duraisamy, K. Computational analysis of vertical axis wind turbine arrays. Theor. Comput. Fluid Dyn. 2016, 30, 387–401. [Google Scholar] [CrossRef]
- Ahmadi-Baloutaki, M.; Carriveau, R.; Ting, D.S.K. A wind tunnel study on the aerodynamic interaction of vertical axis wind turbines in array configurations. Renew. Energy 2016, 96, 904–913. [Google Scholar] [CrossRef]
- Brownstein, I.; Kinzel, M.; Dabiri, J. Performance enhancement of downstream vertical-axis wind turbines. J. Renew. Sustain. Energy 2016, 8, 053306. [Google Scholar] [CrossRef]
- Dabiri, J.O. Potential order-of-magnitude enhancement of wind farm power density via counter-rotating vertical-axis wind turbine arrays. J. Renew. Sustain. Energy 2011, 3, 043104. [Google Scholar] [CrossRef] [Green Version]
- Dabiri, J.O.; Greer, J.R.; Koseff, J.R.; Moin, P.; Peng, J. A New Approach To Wind Energy: Opportunities And Challenges. AIP Conf. Proc. 2015, 1652, 51–57. [Google Scholar]
- MacKay, D.J. Sustainable Energy—Without the Hot Air; UIT: Tromsø, Norway, 2009. [Google Scholar]
- Tescione, G.; Ragni, D.; He, C.; Ferreira, C.J.S.; Van Bussel, G.J.W. Near wake flow analysis of a vertical axis wind turbine by stereoscopic particle image velocimetry. Renew. Energy 2014, 70, 47–61. [Google Scholar] [CrossRef]
- Rolin, V.; Porté-Agel, F. Wind-tunnel study of the wake behind a vertical axis wind turbine in a boundary layer flow using stereoscopic particle image velocimetry. J. Phys. Conf. Ser. 2015, 625, 012012. [Google Scholar] [CrossRef] [Green Version]
- Craig, A.E.; Dabiri, J.O.; Koseff, J.R. A Kinematic Description of the Key Flow Characteristics in an Array of Finite-Height Rotating Cylinders. J. Fluids Eng. 2016, 138, 070906. [Google Scholar] [CrossRef]
- Araya, D.B.; Colonius, T.; Dabiri, J.O. Transition to bluff-body dynamics in the wake of vertical-axis wind turbines. J. Fluid Mech. 2017, 813, 346–381. [Google Scholar] [CrossRef] [Green Version]
- Hezaveh, S.H.; Bou-Zeid, E. Mean kinetic energy replenishment mechanisms in vertical-axis wind turbine farms. Phys. Rev. Fluids 2018, 3, 094606. [Google Scholar] [CrossRef]
- Hau, E. Wind Turbines Fundamentals, Technologies, Application, Economics; Springer: Berlin/Heidelberg, Germany, 2013. [Google Scholar]
- Mittal, S.; Kumar, B. Flow past a rotating cylinder. J. Fluid Mech. 2003, 476, 303–334. [Google Scholar] [CrossRef] [Green Version]
- Feng, L.H.; Wang, J.J.; Pan, C. Proper orthogonal decomposition analysis of vortex dynamics of a circular cylinder under synthetic jet control. Phys. Fluids 2011, 23, 014106. [Google Scholar] [CrossRef]
- Calaf, M.; Meneveau, C.; Meyers, J. Large eddy simulation study of fully developed wind-turbine array boundary layers. Phys. Fluids 2010, 22, 015110. [Google Scholar] [CrossRef] [Green Version]
- De Tavernier, D.; Ferreira, C.; Li, A.; Paulsen, U.S.; Madsen, H.A. VAWT in double-rotor configuration: The effect on airfoil design. In Proceedings of the Wind Energy Symposium, Kissimmee, FL, USA, 8–12 January 2018. [Google Scholar]
- Rajagopalan, R.G.; Rickerlt, T.L.; Klimasj, P.C. Aerodynamic Interference of Vertical Axis Wind Turbines. J. Propuls. 1990, 6, 645–653. [Google Scholar] [CrossRef]
- Araya, D.B.; Craig, A.E.; Kinzel, M.; Dabiri, J.O. Low-order modeling of wind farm aerodynamics using leaky Rankine bodies. J. Renew. Sustain. Energy 2014, 6, 063118. [Google Scholar] [CrossRef] [Green Version]
- Zanforlin, S.; Burchi, F.; Bitossi, N. Hydrodynamic interactions between three closely-spaced Vertical Axis Tidal Turbines. Energy Procedia 2016, 101, 520–527. [Google Scholar] [CrossRef]
- Hezaveh, S.H.; Bou-Zeid, E.; Dabiri, J.O.; Kinzel, M.; Cortina, G.; Martinelli, L. Increasing the Power Production of Vertical-Axis Wind-Turbine-Farms using Synergistic Clustering. Bound. Layer Meteorol. 2018, 169, 275–296. [Google Scholar] [CrossRef]
- Brochier, G.; Fraunie, P.; Beguierj, C. Water Channel Experiments of Dynamic Stall on Darrieus Wind Turbine Blades. J. Propuls. 1986, 2. [Google Scholar] [CrossRef]
- Hofemann, C.; Ferreira, C.S.; Dixon, K.; Van Bussel, G.; Van Kuik, G.; Scarano, F. 3D Stereo PIV study of tip vortex evolution on a VAWT. In Proceedings of the European Wind Energy Conference, Brussels, Belgium, 31 March–3 April 2008. [Google Scholar]
- Ferreira, C.S.; van Kuik, G.; van Bussel, G.; Scarano, F. Visualization by PIV of dynamic stall on a vertical axis wind turbine. Exp. Fluids 2009, 46, 97–108. [Google Scholar] [CrossRef]
- Parker, C.M.; Araya, D.B.; Leftwich, M.C. Effect of chord-to-diameter ratio on vertical–axis wind turbine wake development. Exp. Fluids 2017, 58, 168. [Google Scholar] [CrossRef]
- Caridi, G.C.A.; Ragni, D.; Sciacchitano, A.; Scarano, F. HFSB-seeding for large-scale tomographic PIV in wind tunnels. Exp. Fluids 2016, 57, 190. [Google Scholar] [CrossRef] [Green Version]
- Ryan, K.J.; Coletti, F.; Elkins, C.J.; Dabiri, J.O.; Eaton, J.K. Three–dimensional flow field around and downstream of a subscale model rotating vertical axis wind turbine. Exp. Fluids 2016, 57, 38. [Google Scholar] [CrossRef]
- Howell, R.; Qin, N.; Edwards, J.; Durrani, N. Wind tunnel and numerical study of a small vertical axis wind turbine. Renew. Energy 2009, 35, 412–422. [Google Scholar] [CrossRef]
- Bazilevs, Y.; Korobenko, A.; Deng, X.; Yan, J.; Kinzel, M.; Dabiri, J. Fluid-Structure Interaction Modeling of Vertical-Axis Wind Turbines. J. Appl. Mech. 2014, 81. [Google Scholar] [CrossRef]
- Shamsoddin, S.; Porté-Agel, F. Large Eddy Simulation of Vertical Axis Wind Turbine Wakes. Energies 2014, 7, 890–912. [Google Scholar] [CrossRef]
- Posa, A.; Balaras, E. Large Eddy Simulation of an isolated vertical axis wind turbine. J. Wind Eng. Ind. Aerodyn. 2018, 172, 139–151. [Google Scholar] [CrossRef]
- Miller, M.; Duvvuri, S.; Brownstein, I.; Lee, M.; Dabiri, J.; Hultmark, M. Vertical-axis wind turbine experiments at full dynamic similarity. J. Fluid Mech. 2018, 844, 707–720. [Google Scholar] [CrossRef] [Green Version]
- Han, D.; Heo, Y.G.; Choi, N.J.; Nam, S.H.; Choi, K.H.; Kim, K.C. Design, Fabrication, and Performance Test of a 100-W Helical-Blade Vertical-Axis Wind Turbine at Low Tip-Speed Ratio. Energies 2018, 11, 1517. [Google Scholar] [CrossRef]
- Delafin, P.; Nishino, T.; Wang, L.; Kolios, A. Effect of the number of blades and solidity on the performance of a vertical axis wind turbine. J. Phys. Conf. Ser. 2016, 753, 022033. [Google Scholar] [CrossRef] [Green Version]
- Eboibi, O.; Danao, L.A.M.; Howell, R.J. Experimental investigation of the influence of solidity on the performance and flow field aerodynamics of vertical axis wind turbines at low Reynolds numbers. Renew. Energy 2016, 92, 474–483. [Google Scholar] [CrossRef]
- Miller, M.A.; Duvvuri, S.; Kelly, W.D.; Hultmark, M. Rotor Solidity Effects on the Performance of Vertical-Axis Wind Turbines at High Reynolds Numbers; IOP Conference Series; IOP Publishing: Milan, Italy, 2018; Volume 1037. [Google Scholar]
- Rezaeiha, A.; Montazeri, H.; Blocken, B. Towards optimal aerodynamic design of vertical axis wind turbines: Impact of solidity and number of blades. Energy 2018, 165, 1129–1148. [Google Scholar] [CrossRef]
- Möllerström, E.; Gipe, P.; Beurskens, J.; Ottermo, F. A historical review of vertical axis wind turbines rated 100 kW and above. Renew. Sustain. Energy Rev. 2019, 105, 1–13. [Google Scholar] [CrossRef]
- Von Meier, A. Electric Power Systems; John Wiley & Sons: Hoboken, NJ, USA, 2006. [Google Scholar]
- Araya, D.B.; Dabiri, J.O. A comparison of wake measurements in motor-driven and flow-driven turbine experiments. Exp. Fluids 2015, 56, 150. [Google Scholar] [CrossRef]
- Widmann, A.; Tropea, C. Parameters influencing vortex growth and detachment on unsteady aerodynamic profiles. J. Fluid Mech. 2015, 773, 432–459. [Google Scholar] [CrossRef]
- Theriault, D.H.; Fuller, N.W.; Jackson, B.E.; Bluhm, E.; Evangelista, D.; Wu, Z.; Betke, M.; Hedrick, T.L. A protocol and calibration method for accurate multi-camera field videography. J. Exp. Biol. 2014, 217, 1843–1848. [Google Scholar] [CrossRef]
- Hartley, R.; Zisserman, A. Multiple View Geometry, 2nd ed.; Cambridge University Press: Cambridge, UK, 2003. [Google Scholar]
- Elsinga, G.E.; Westerweel, J.; Scarano, F.; Novara, M. On the velocity of ghost particles and the bias errors in Tomographic-PIV. Exp. Fluids 2010, 50, 825–838. [Google Scholar] [CrossRef] [Green Version]
- Ouellette, N.T.; Xu, H.; Bodenschatz, E. A quantitative study of three-dimensional Lagrangian particle tracking algorithms. Exp. Fluids 2006, 40, 301–313. [Google Scholar] [CrossRef]
- Xu, H. Tracking Lagrangian trajectories in position-velocity space. Meas. Sci. Technol. 2008, 19, 075105. [Google Scholar] [CrossRef]
- Efron, B. Bootstrap Methods: Another Look at the Jackknike. Ann. Stat. 1979, 7, 1–26. [Google Scholar] [CrossRef]
- Chan, A.S.; Dewey, P.A.; Jameson, A.; Liang, C.; Smits, A.J. Vortex suppression and drag reduction in the wake of counter-rotating cylinders. J. Fluid Mech. 2011, 679, 343–382. [Google Scholar] [CrossRef] [Green Version]
- Resagk, C.; Lobutova, E.; Rank, R.; Müller, D.; Putze, T.; Maas, H.G. Measurement of large-scale flow structures in air using a novel 3D particle tracking velocimetry technique. In Proceedings of the 3th International Symposium on Applications of Laser Techniques to Fluid Mechanics, Lisbon, Portugal, 26–29 June 2006. [Google Scholar]
- Biwole, P.H.; Yan, W.; Zhang, Y.; Roux, J.J. A complete 3D particle tracking algorithm and its applications to the indoor airflow study. Meas. Sci. Technol. 2009, 20, 115403. [Google Scholar] [CrossRef]
- Bosbach, J.; Kühn, M.; Wagner, C. Large scale particle image velocimetry with helium filled soap bubbles. Exp. Fluids 2009, 46, 539–547. [Google Scholar] [CrossRef]
- Kühn, M.; Ehrenfried, K.; Bosbach, J.; Wagner, C. Large–scale tomographic particle image velocimetry using helium-filled soap bubbles. Exp. Fluids 2011, 50, 929–948. [Google Scholar] [CrossRef]
- Kerho, M.F.; Bragg, M.B. Neutrally buoyant bubbles used as flow tracers in air. Exp. Fluids 1994, 16, 393–400. [Google Scholar] [CrossRef]
- Scarano, F.; Ghaemi, S.; Carlo, G.C.A.; Bosbach, J.; Dierksheide, U.; Sciacchitano, A. On the use of helium-filled soap bubbles for large-scale tomographic PIV in wind tunnel experiments. Exp. Fluids 2015, 56, 42. [Google Scholar] [CrossRef]
- Crowe, C.T.; Schwarzkopf, J.D.; Sommerfeld, M.; Tsuji, Y. Multiphase Flows with Droplets and Particles, 2nd ed.; CRC Press: Boca Raton, FL, USA, 2012. [Google Scholar]
- Tropea, C.; Yarin, A.L.; Foss, J.F. Springer Handbook of Experimental Fluid Mechanics; Springer: Berlin, Germany, 2007. [Google Scholar]
- Zhu, H.Y.; Wang, C.Y.; Wang, H.P.; Wang, J.J. Tomographic PIV investigation on 3D wake structures for flow over a wall-mounted short cylinder. J. Fluid Mech. 2017, 831, 743–778. [Google Scholar] [CrossRef]
- Craig, A.E.; Dabiri, J.O.; Koseff, J.R. Low order physical models of vertical axis wind turbines. J. Renew. Sustain. Energy 2017, 9, 013306. [Google Scholar] [CrossRef] [Green Version]
- Kawamura, T.; Hiwada, M.; Hibino, T.; Mabuchi, I.; Kumada, M. Flow around a Finite Circular Cylinder on a Flat Plate. Bull. JSME 1984, 27, 2142–2151. [Google Scholar] [CrossRef]
- Fröhlich, J.; Rodi, W. LES of the flow around a circular cylinder of finite height. Int. J. Heat Fluid Flow 2004, 25, 537–548. [Google Scholar] [CrossRef]
- Pattenden, R.J.; Turnock, S.R.; Zhang, X. Measurements of the flow over a low-aspect-ratio cylinder mounted on a ground plane. Exp. Fluids 2005, 39, 10–21. [Google Scholar] [CrossRef]
- Zanforlin, S.; Nishino, T. Fluid dynamic mechanisms of enhanced power generation by closely spaced vertical axis wind turbines. Renew. Energy 2016, 99, 1213–1226. [Google Scholar] [CrossRef] [Green Version]
Figure 1.
(a) Side-view and (b) top view of the wind tunnel test section with the two turbine array shown. In both views. the filled black rectangles represent the fan grid and the dashed black rectangles represent the maximum extent of the particle tracking measurement domain. The red dots illustrate the configuration of the seven-camera setup above the wind tunnel. All cameras were installed at the same height above the tunnel, and were oriented such that the turbine pair was in the center of the frame. (c) Illustration of the two turbine array geometry and the coordinate system used in the wind tunnel. Turbine 1 was defined as the upstream turbine and is located at a fixed position at . Turbine 2 is the downstream turbine and could be located at angles with respect to the freestream within and turbine spacings within . Both turbines could be oriented to rotate either clockwise or counter-clockwise.

Figure 2.
(a) Distribution of number of vectors per (2 cm)3 voxel in the freestream measurement with an empty test section. (b) Standard deviation of the means of calculated from 2000 re-samplings of data () versus the number of vectors used in the re-sampling. Data are from the voxel with the most vectors in the freestream measurement.

Figure 3.
Profiles of the normalized streamwise velocity averaged in both time and two spatial dimensions (). Dashed lines indicate the maximum extent of the measurement domain used in particle tracking.
Figure 3.
Profiles of the normalized streamwise velocity averaged in both time and two spatial dimensions (). Dashed lines indicate the maximum extent of the measurement domain used in particle tracking.

Figure 4.
Normalized performance of (a) Turbine 1 and (b) Turbine 2 versus adjusted array angle () for a turbine spacing of . Error bands represent plus or minus one standard deviation from the mean measurement.
Figure 4.
Normalized performance of (a) Turbine 1 and (b) Turbine 2 versus adjusted array angle () for a turbine spacing of . Error bands represent plus or minus one standard deviation from the mean measurement.

Figure 5.
Normalized performance of (a) Turbine 1 and (b) Turbine 2 versus adjusted array angle for turbine spacings of , , , and in a clockwise, co-rotating array. Error bands represent plus or minus one standard deviation from the mean measurement.
Figure 5.
Normalized performance of (a) Turbine 1 and (b) Turbine 2 versus adjusted array angle for turbine spacings of , , , and in a clockwise, co-rotating array. Error bands represent plus or minus one standard deviation from the mean measurement.

Figure 6.
Contours of the normalized time-averaged streamwise velocity () around a clockwise rotating VAWT at the planes: (a) ; (b) ; and (c) . The grey and black contour levels denote and , respectively. The dashed black lines denote the projection of the turbine on the plane. The overlaid vectors denote the in-plane velocity. Vectors are shown at 25% of the recorded resolution for visual clarity. The direction of the VAWT rotation is denoted by the blue arrow. The empty regions in the immediate vicinity of the turbine represent zones in which particles were not able to be tracked in multiple camera views.

Figure 7.
Particle trajectories of neutrally buoyant HFSB tracers around a clockwise rotating VAWT. Particle trajectories are only visualized between . The rotor projected on the image is in an arbitrary orientation and the white circle denotes the boundaries of its rotation. The direction of the rotor rotation is denoted by the blue arrow. The cyan dots denote the position where the trajectories “detach” from the rotor.

Figure 8.
Three-dimensional isosurfaces of the time-averaged streamwise vorticity for around (a) clockwise and (b) counter-clockwise rotating VAWT. Positive vorticity is depicted as red and negative vorticity as blue. The transparent cylinders represent the maximum extent of the rotor and the turbine tower. The direction of the VAWT rotation is denoted by the grey arrows in the center of the rotors. The grey curve represents the hypothesized connecting vortex line between the turbine and the counter-rotating isosurfaces.

Figure 9.
Three-dimensional isosurfaces of the time-averaged (a) transverse vorticity () and (b) vertical vorticity () for around a clockwise rotating VAWT. Positive vorticity is depicted as red and negative vorticity as blue. The transparent cylinders represent the maximum extent of the rotor and the turbine tower. The blue arrows on top of the rotors denote the direction of the turbine rotation. These structures roughly correspond to bluff–body wake structures shed by a finite wall-mounted cylinder.

Figure 10.
Particle trajectories of neutrally buoyant HFSB tracers around four turbine pairs at a turbine spacing of and an array angle of . The four turbine configurations represented are: (a) clockwise co-rotating; (b) counter-clockwise co-rotating; (c) reverse doublet; and (d) doublet arrays. Particle trajectories are only visualized between . The rotor projected on the image is in an arbitrary orientation and the white circle denotes the boundaries of its rotation. The direction of the rotor rotation is denoted by the blue (clockwise) and red (counter-clockwise) arrows. The cyan and magenta dots denote the position where the trajectories “detach” from the upstream and downstream rotors, respectively.

Figure 11.
Contours of the normalized time-averaged streamwise velocity () around: (a) clockwise co-rotating; (b) counter-clockwise co-rotating; (c) reverse doublet; and (d) doublet arrays at the plane . The arrays have a turbine spacing of and are at an array angle of . The grey and black contour levels denote and , respectively. The dashed black lines denote the projection of the turbine on the plane. The overlaid vectors denote the in-plane velocity. Vectors are shown at 25% of the recorded resolution for visual clarity. The direction the individual VAWT rotations are denoted by the blue (clockwise) and red (counter-clockwise) arrows. As in Figure 6, the empty regions around the turbines correspond to locations where particles could not be tracked in multiple cameras.

Figure 12.
Three-dimensional isosurfaces of the time-averaged streamwise vorticity at the value around: (a) clockwise co-rotating; (b) counter-clockwise co-rotating; (c) reverse doublet; and (d) doublet arrays. The arrays have a turbine spacing of and are at an array angle of . Positive vorticity is red and negative vorticity is blue. The transparent cylinders represent the maximum extent of the rotor and the turbine tower.

Figure 13.
Vertical transects of the normalized time-averaged vertical velocity () at downstream and laterally between the rotors (). Data are shown for: (a) clockwise co-rotating; (b) counter-clockwise co-rotating; (c) reverse doublet; and (d) doublet arrays. The arrays have a turbine spacing of and are at an array angle of . The dashed black lines denote the top and bottom of the rotors in the array. The transects were smoothed using a five-point moving average.

Figure 14.
(a) Normalized time-averaged velocity magnitude () around an isolated clockwise rotating VAWT at the turbine mid-span () and at the same positions were the downstream turbine is located in the adjacent figure. The single black error bar represents plus or minus one average standard deviation of the measurements plotted. (b) (Replotted from Figure 5b) Normalized performance of Turbine 2 versus adjusted array angle for turbine spacings of , , , and in a clockwise, co-rotating array. Error bands represent plus or minus one standard deviation from the mean measurement.

Figure 15.
Range of azimuthal positions where the flow is attached to the turbine normalized by the range in azimuthal positions for an isolated turbine () versus the normalized performance of both the upstream turbines (circles) and downstream turbines (squares) () in four turbine pair configurations. In all four arrays, the turbine spacing was and the array angle was . Vertical error bands represent plus or minus one standard deviation from the mean measurement. Horizontal error bands represent plus or minus 10° in the identification of the range of azimuthal positions where the flow is attached.

© 2019 by the authors. Licensee MDPI, Basel, Switzerland. This article is an open access article distributed under the terms and conditions of the Creative Commons Attribution (CC BY) license (http://creativecommons.org/licenses/by/4.0/).
Share and Cite
MDPI and ACS Style
Brownstein, I.D.; Wei, N.J.; Dabiri, J.O. Aerodynamically Interacting Vertical-Axis Wind Turbines: Performance Enhancement and Three-Dimensional Flow. Energies 2019, 12, 2724. https://doi.org/10.3390/en12142724
AMA Style
Brownstein ID, Wei NJ, Dabiri JO. Aerodynamically Interacting Vertical-Axis Wind Turbines: Performance Enhancement and Three-Dimensional Flow. Energies. 2019; 12(14):2724. https://doi.org/10.3390/en12142724
Chicago/Turabian StyleBrownstein, Ian D., Nathaniel J. Wei, and John O. Dabiri. 2019. "Aerodynamically Interacting Vertical-Axis Wind Turbines: Performance Enhancement and Three-Dimensional Flow" Energies 12, no. 14: 2724. https://doi.org/10.3390/en12142724
Note that from the first issue of 2016, this journal uses article numbers instead of page numbers. See further details here.