A Photovoltaic Greenhouse with Passive Variation in Shading by Fixed Horizontal PV Panels


Department of Agricultural and Forest Sciences, University of Tuscia, Via San Camillo de Lellis, s.n.c., 01100 Viterbo, Italy
*
Author to whom correspondence should be addressed.
Energies 2019, 12(17), 3269; https://doi.org/10.3390/en12173269
Submission received: 31 July 2019
/
Revised: 21 August 2019
/
Accepted: 22 August 2019
/
Published: 25 August 2019
Abstract
:The traditional shading systems that greenhouses use cause some of the solar radiation that is reflected or absorbed to be lost and, therefore, not used by the plants under cultivation. An interesting solution to these problems is to position photovoltaic (PV) panels on the roofs of greenhouses. All of the photovoltaic greenhouses that have been realized in Mediterranean areas are characterized by a fixed position of the PV panels and excessive shading, especially in autumn and winter. The purpose of this study is to describe a prototype of a photovoltaic greenhouse with both fixed and horizontal PV panels that exploit the natural variation in the elevation angle of the sun’s rays during the year to allow for “passive” variation in shading. The considerable variation in the elevation angle of the sun’s rays (from 24.4° to 71.1°) results in a high variation in shading (from 39.4% to 72.6%), with the highest values in the summer months and the lowest values in the winter months. This trend is favorable for meeting the photosynthetically active radiation (PAR) needs of greenhouse plants. If the plants under cultivation require more solar energy, it is necessary to increase the distance between the panels. We implement a specific mathematical relationship to define the precise distance to be assigned to the photovoltaic panels on the roof pitch.
1. Introduction
Climate changes in recent decades have been causing adverse weather conditions to occur more frequently. Crops in the open field are subject to strong tensions that can cause deficits in agricultural production and undermine the satisfaction of growing demand. All this requires the cultivation of a substantial number of crops in a protected environment. The use of greenhouses is one way to maintain crops and increase plant production despite a difficult and unstable external climate [1].
Badgery-Parker defines a greenhouse as “a covered structure that provides plants with an optimally controlled environment for the adjustment of climate growth conditions to reduce the cost of production and increase crop yields” [2]. The parameters that characterize the microclimate inside the greenhouse can be kept under control thanks to specific cooling and heating systems; it is not possible to do the same with open-field crops [3]. In this way, greenhouse cultivation can be functional [4] and predictable [5]. These systems for monitoring the internal environment of the greenhouse allow for an increase in crop yields and quality [6]. During hot seasons, the temperature inside the greenhouse can increase a lot during the day; therefore, cooling systems, such as ventilation and/or shading, are needed. In winter or during the night, the temperatures are reduced and not favorable to growth; therefore, heating systems are needed [7].
The climate and the available technology and resources influence the choice of methods for controlling a protected environment [8]. For example, mechanical ventilation and water evaporation are the preferred ‘active’ cooling methods in countries with cold climates, an abundance of economic resources, significant water resources, and low levels of solar radiation [9,10,11]. ‘Passive’ cooling methods are more widespread in countries with hot climates, limited water resources, and a scarcity of economic resources. Indeed, they are less expensive in terms of both initial investment costs and subsequent costs, as they require less energy and water [8]. According to Leyva et al., these systems are widespread in “Mediterranean climates characterized by summer temperatures above 35 °C, high solar radiation (about 30 MJ m−2 d−1), a relative humidity below 20% around midday, and limited water resources generated with a loss of yield in crops” [12].
Several authors have studied cooling systems that can be used in different climatic areas [1,13]. The design of an adequate cooling system is not simple because it depends on the native environmental conditions, on the crops chosen, on how simple it is to operate the system, and, therefore, on its maintenance costs and economic profitability [14]. Sethi et al. say that “cooling technologies for agricultural greenhouse applications can be classified as ventilation (natural and forced), shading, evaporative cooling, and composite (heat exchanger) systems” [15]. Cooling through shading regulates the entry of solar radiation [16,17] in order to facilitate plant cultivation [18]. The shading can be performed with different systems: whitening [19,20], which is an economic method but limited in time due to rain washout; “external shade cloths” [21,22,23]; “fixed or mobile reflective screens or curtains” [24,25,26,27]; and “plastic nets” [28,29,30,31,32]. So, “the purpose of all shading methods is to regulate the amount of solar energy that enters the greenhouse to reduce the heating load” during hot periods, as mentioned by Abdel-Ghany et al. [33], to reduce water consumption [34,35,36,37,38,39,40,41], and to defend the crops from heat fatigue [42], chloroplast damage [43], and foliar burns [44,45,46,47]. When a greenhouse has shading, the intensity of the light that reaches the plants is reduced, creating a gradient of air temperature between the internal and external environment of the greenhouse [5]. Kittas et al. [48] state that “a 50% shaded greenhouse roof can be effective in lowering the internal greenhouse temperature by 10 °C”, and it can also considerably reduce the temperature of the leaf surface [5]. Based on the materials that are used for shading, according to Glenn et al., it is possible to hypothesize “a reduction of light from 20% to 80% and the decrease of light sufficient for most greenhouse applications is between 30% and 50%” [49].
Ross et al. define photosynthetically active radiation (PAR) as “the radiative flux contained in the spectral regions between 400 and 700 nm” [50], because plants can convert only the energy possessed by solar photons of this spectral range into chemical energy [51]. Sun Z. et al. report that “the PAR can be expressed in terms of solar radiation (Wm−2) or photosynthetic photon flux (μmol m−2 s−1)” [52]. Alados et al. state that the “PAR is a necessary input in applications concerning plant physiology, biomass production and natural lighting in greenhouses” [53].
The FAO established a trophic solar radiation limit of 8.4 MJ m−2 d−1 in 1990, below which summer crops cannot grow [54]. This limit was confirmed in a study conducted on tomato plants in southern Brazil by Andriolo et al. [55]. However, Sandri et al. found, in another study carried out on shaded tomato plants, a daily solar radiation limit value of 5.0 MJ m−2. This means that the limit identified by the FAO cannot be considered to apply on a global scale [30]. There is little information in the literature regarding the upper limit of solar radiation beyond which plants do not survive. However, climatic restrictions related to the upper limit have been imposed at the air temperature that causes harm to the respiration and photosynthesis of plants [56,57].
In reality, it is not clear if solar radiation can be used alone as a parameter to guarantee the correct growth and development of plants because other climatic variables can play a decisive role. For example, the air temperature, even if correlated with solar radiation, does not change linearly with it in time and space and, therefore, it would be appropriate to study the effects of the interactions among different parameters [55].
Excessive shading can modify some morphological, anatomical, and biochemical traits in a more or less marked and more or less sudden way based on the variety of plant [58], type of plant [59], duration and intensity of the shading [60], and the period of development of the plant in which the shading is applied. Some studies have been done on the effect of shading on plant growth. For example, Marchiori et al. observed that it produces “thinner and elongated stems” [61,62,63]. According to Allison et al. “the leaf nitrogen content decreases linearly with slight reductions from top to bottom of the vegetable crown” [64,65], while for Lemaire et al. “the leaves become senescent if the light intensity is lower than the light compensation point” [66]. According to studies by Cai et al., shading delays flowering [67]; in fact, it reduces the transport of sugar to the buds [68] and modifies the productivity of the crops. Finally, for Cockshull et al., “the growth rates and the quality of agricultural production are directly influenced by the amount of solar radiation received during the period of growth” [69].
There are many studies on the effects of the intensity of shading, the duration of shading, and the type of shading system on agricultural production. For example, Kosma et al. studied the effects of shading on the production and nutritional quality of lettuce. In winter and spring, the plants were cultivated with four different levels of intensity of photosynthetically active radiation (26%, 47%, 73%, and 100%). “The results showed that the stomatal conductance and the speed of photosynthesis decreased significantly in the shaded plants, leading to less biomass and production in both seasons and the nutritional value (ascorbic acid concentration)” was also found to be significantly decreased [70]. Shifriss et al. showed that pepper plants, when subjected to 60% humidity for 35 days, did not produce any fruit [71].
These shading systems have two disadvantages. From an energy point of view, the portion of radiation that is reflected or absorbed will be lost and therefore not used by the plants. From the point of view of vegetable cultivation, it would be advisable to create mobile shading systems to regulate the PAR on crops according to their needs. Mobile shading, when applied only during sunny periods, has been proven to be less harmful than fixed shading to tomato production [72].
Illić et al. state that “when mobile shading was applied under intense sunlight in Spain, it increased the yield by 10%” [73], and El-Gizawy et al. observed that “the highest tomato production was achieved with a shading of 35% and more shade eliminated the sunscreen on fruit” [74]. Moreover, El-Aidy et al. noted that a shading of 40% resulted in an increase in tomato production [75].
An interesting solution to the first problem is to position the photovoltaic (PV) panels on the roofs of greenhouses to create agrivoltaic (AVS) systems, which Dupraz et al. define as “mixed systems that combine solar panels and culture at the same time on the same area” [76].
Photovoltaic greenhouses are more diffuse in Mediterranean areas [77]. Moreover, all of the photovoltaic greenhouses that have been realized in these areas are characterized by a fixed position of the PV panels and excessive shading, especially in autumn and winter [78].
Excessive shading can have significant effects on crop growth and yield [79]. Excessive shading and an irregular distribution of light can cause an increase in fruit pathologies and defects (e.g., cracking), for which new agronomic strategies are needed [80,81,82].
To solve problems of excessive shading and to vary the shading within wide limits, mobile PV panels can be used to realize a self-sufficient greenhouse from an energy point of view—a “zero-impact greenhouse” [78]—to optimize energy production [83] and agricultural production. A constant shading value is functional only for certain periods of the year and day and under particular external weather conditions, such as in the case of clear skies.
To date, research has only developed greenhouses with photovoltaic shielding in a fixed position. This research gap may be filled by photovoltaic greenhouses with variable shading.
In addition to a solution with mobile PV panels and mirrors [84], it is possible to conceive of photovoltaic greenhouses that, despite having fixed panels, allow us to vary the shading based on the climatic conditions and the needs of the plants.
In this study, we present a prototype of a photovoltaic greenhouse with fixed and horizontal PV panels that exploit the natural variation in the elevation angle of the sun’s rays during the year to allow for a “passive” variation in shading. This system allows one to vary the shading within wide limits, increasing it from the autumn and winter months to the summer months in a way that is favorable to meeting the needs of the plants under cultivation.
In this research, we do the following:
- analyze the variation over time of the internal and external solar radiation with the horizontal fixed PV panels;
- determine the shading value that is necessary to reach the minimum and maximum thresholds of solar radiation for some plant species;
- compare these shading values with those obtained from the fixed and horizontal PV panels in the different months of the year; and
- identify a simple mathematical model to determine the optimal distance between the fixed and horizontal PV panels.
2. Materials and Methods
At the didactic experimental farm “N. Lupori” of the University of Tuscia of Viterbo (42°25′38″ N, 12°04′51″ E; 306 m above sea level), a dynamic photovoltaic greenhouse prototype was built whose shading could be varied through the rotation of PV panels and mirrors.
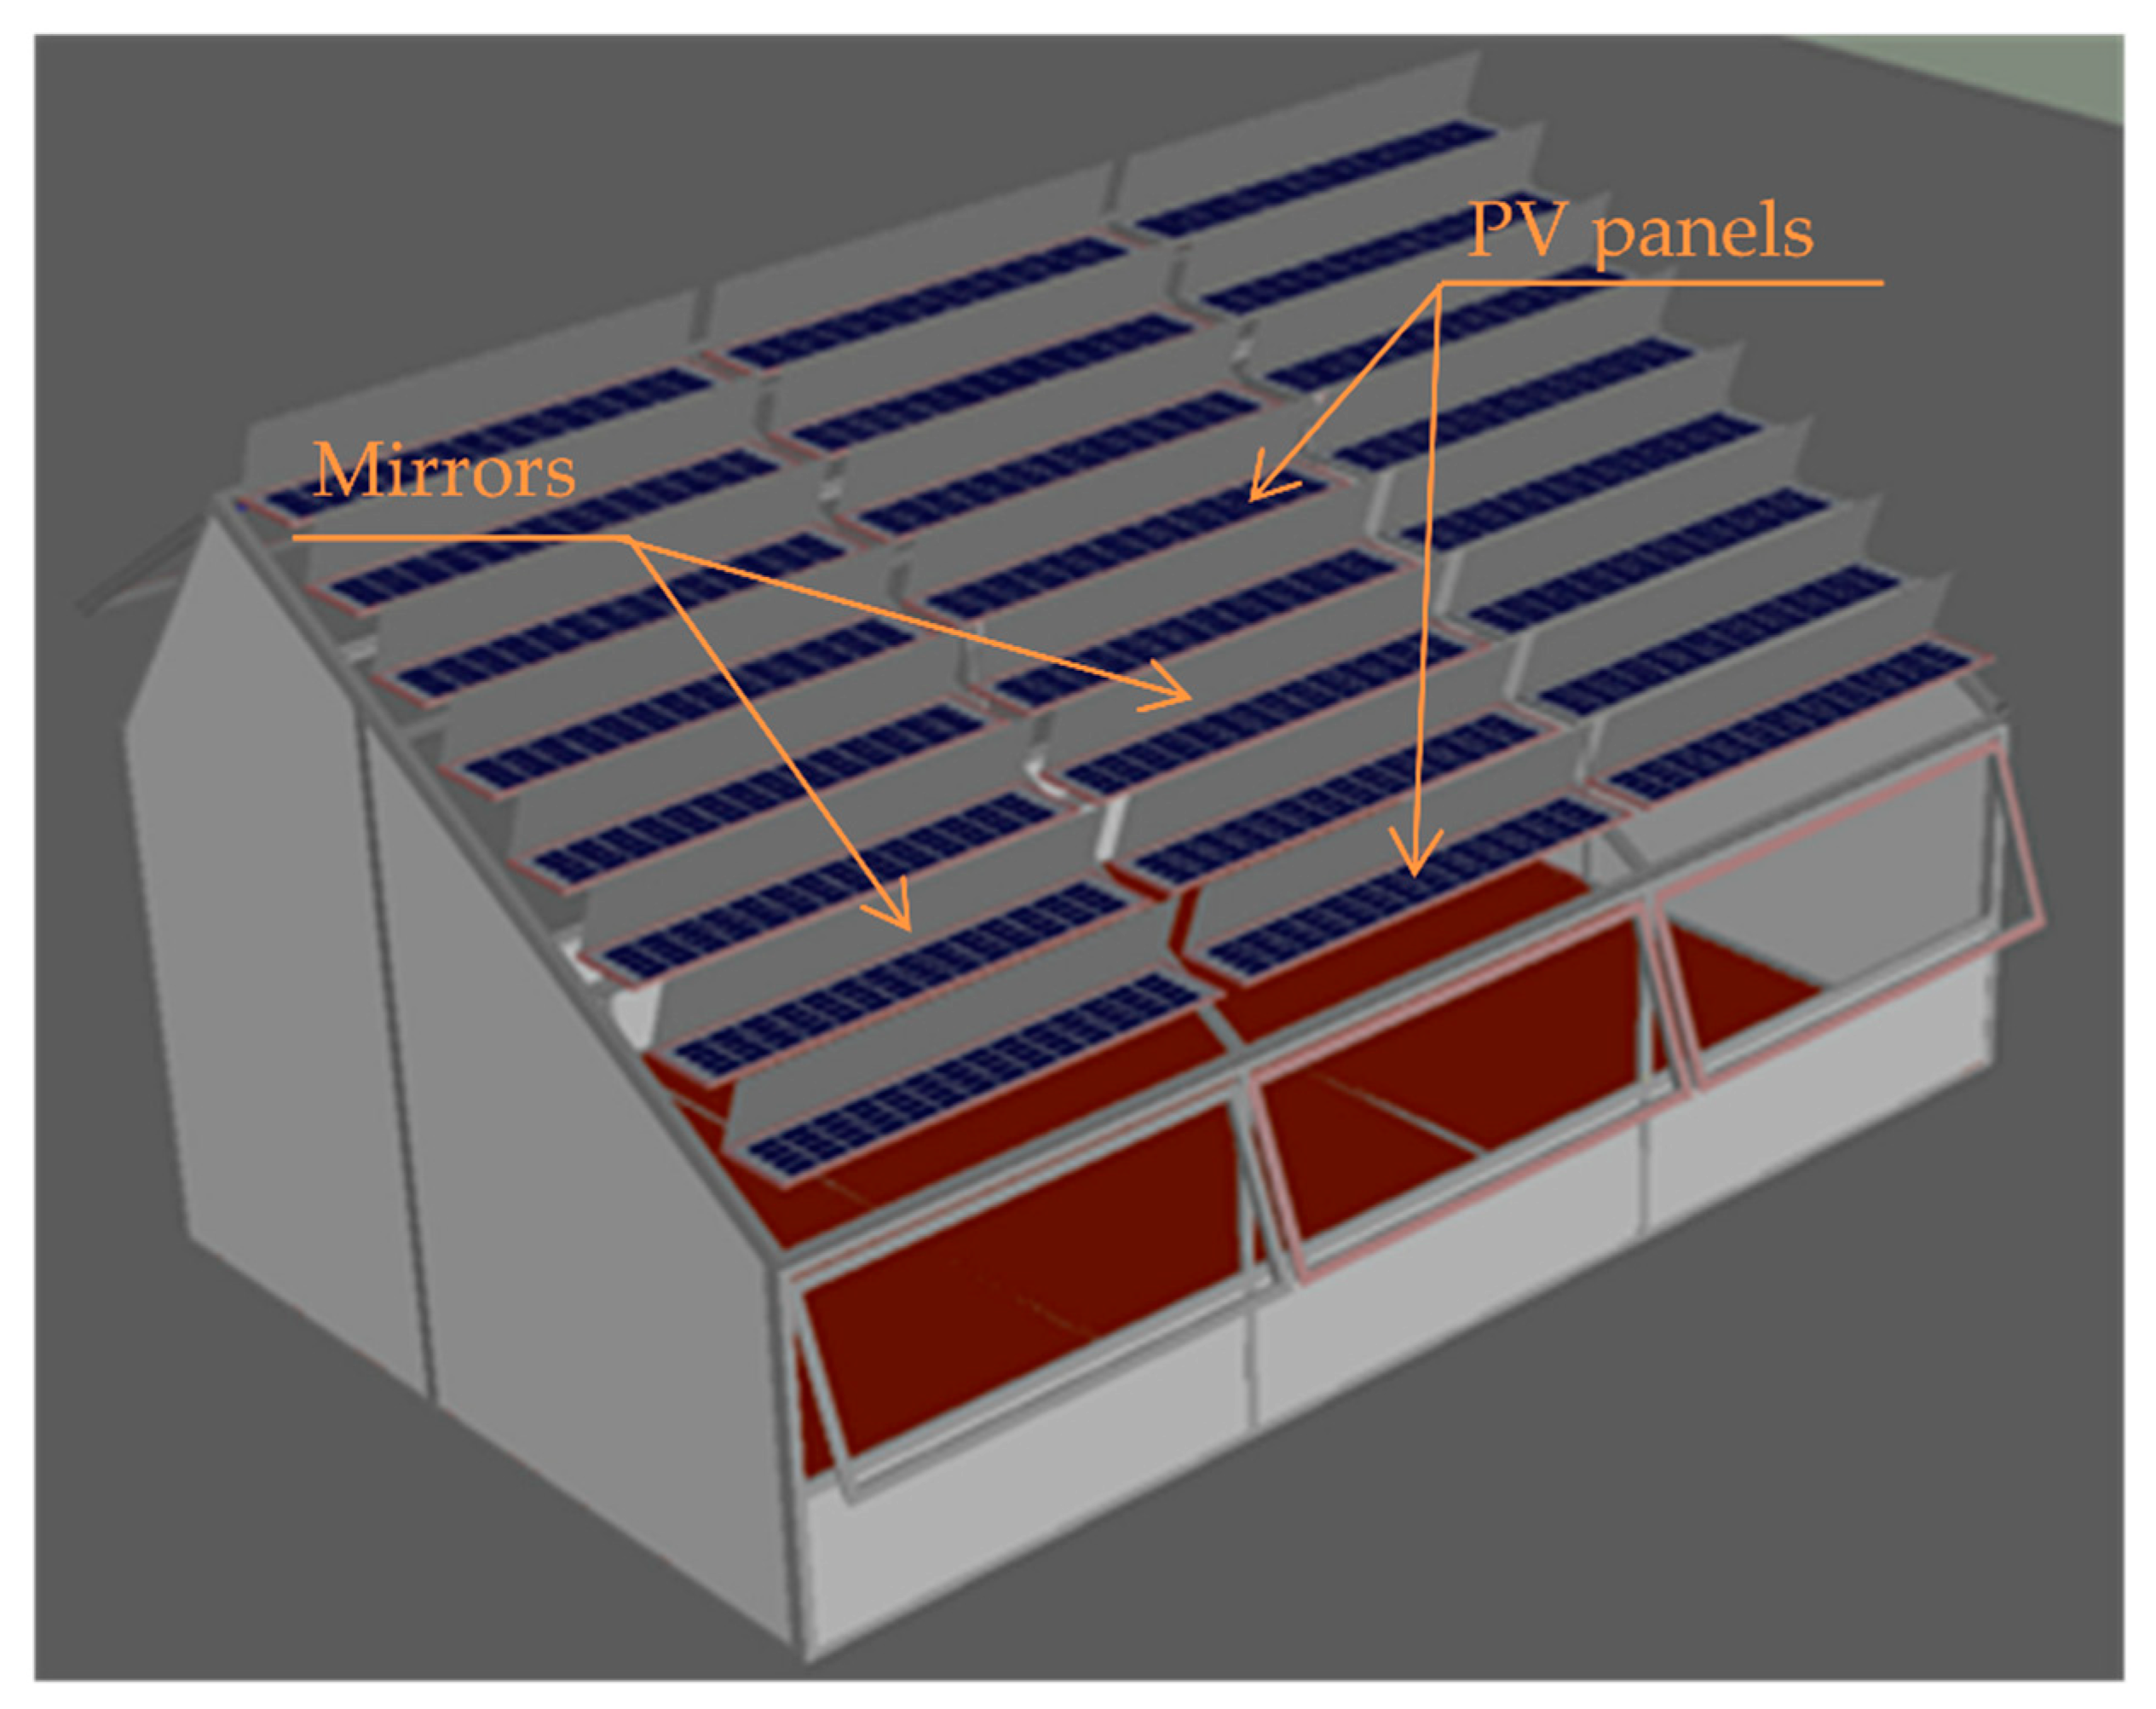
The prototype greenhouse’s orientation was in the east–west direction and it had an asymmetrical section. In this way, the pitch of the south-facing roof had a larger size than the one to the north, and, based on the latitude of the experimental site, the angle of inclination was found to be optimal for photovoltaic production. A height angle of 33° was obtained with the average of the values of the angles obtained the 15th day of each month and weighted with the average global daily radiation. These features have allowed us to position a large number of PV panels and, therefore, maximize the production of electricity to safeguard agricultural production (Figure 1).
The geometrical characteristics of and technical data on the greenhouse prototype are described in more detail in Marucci et al. [78]. The main details are shown in the Table 1.
The proposed dynamic coverage system allows for continuous shading variation to optimize the shading’s value according to the needs of the plants under cultivation and external climatic conditions [84]. The result is a technologically very advanced greenhouse that is extremely flexible but complex, as it is equipped with control and movement systems for both the PV panels and mirrors.
The actions of external forces (permanent and accidental loads such as snow and wind) were taken into consideration in the design of the structure. The panels are fixed and horizontal, while the mirrors are mobile and in extreme adverse conditions can be closed and placed over the PV panels.
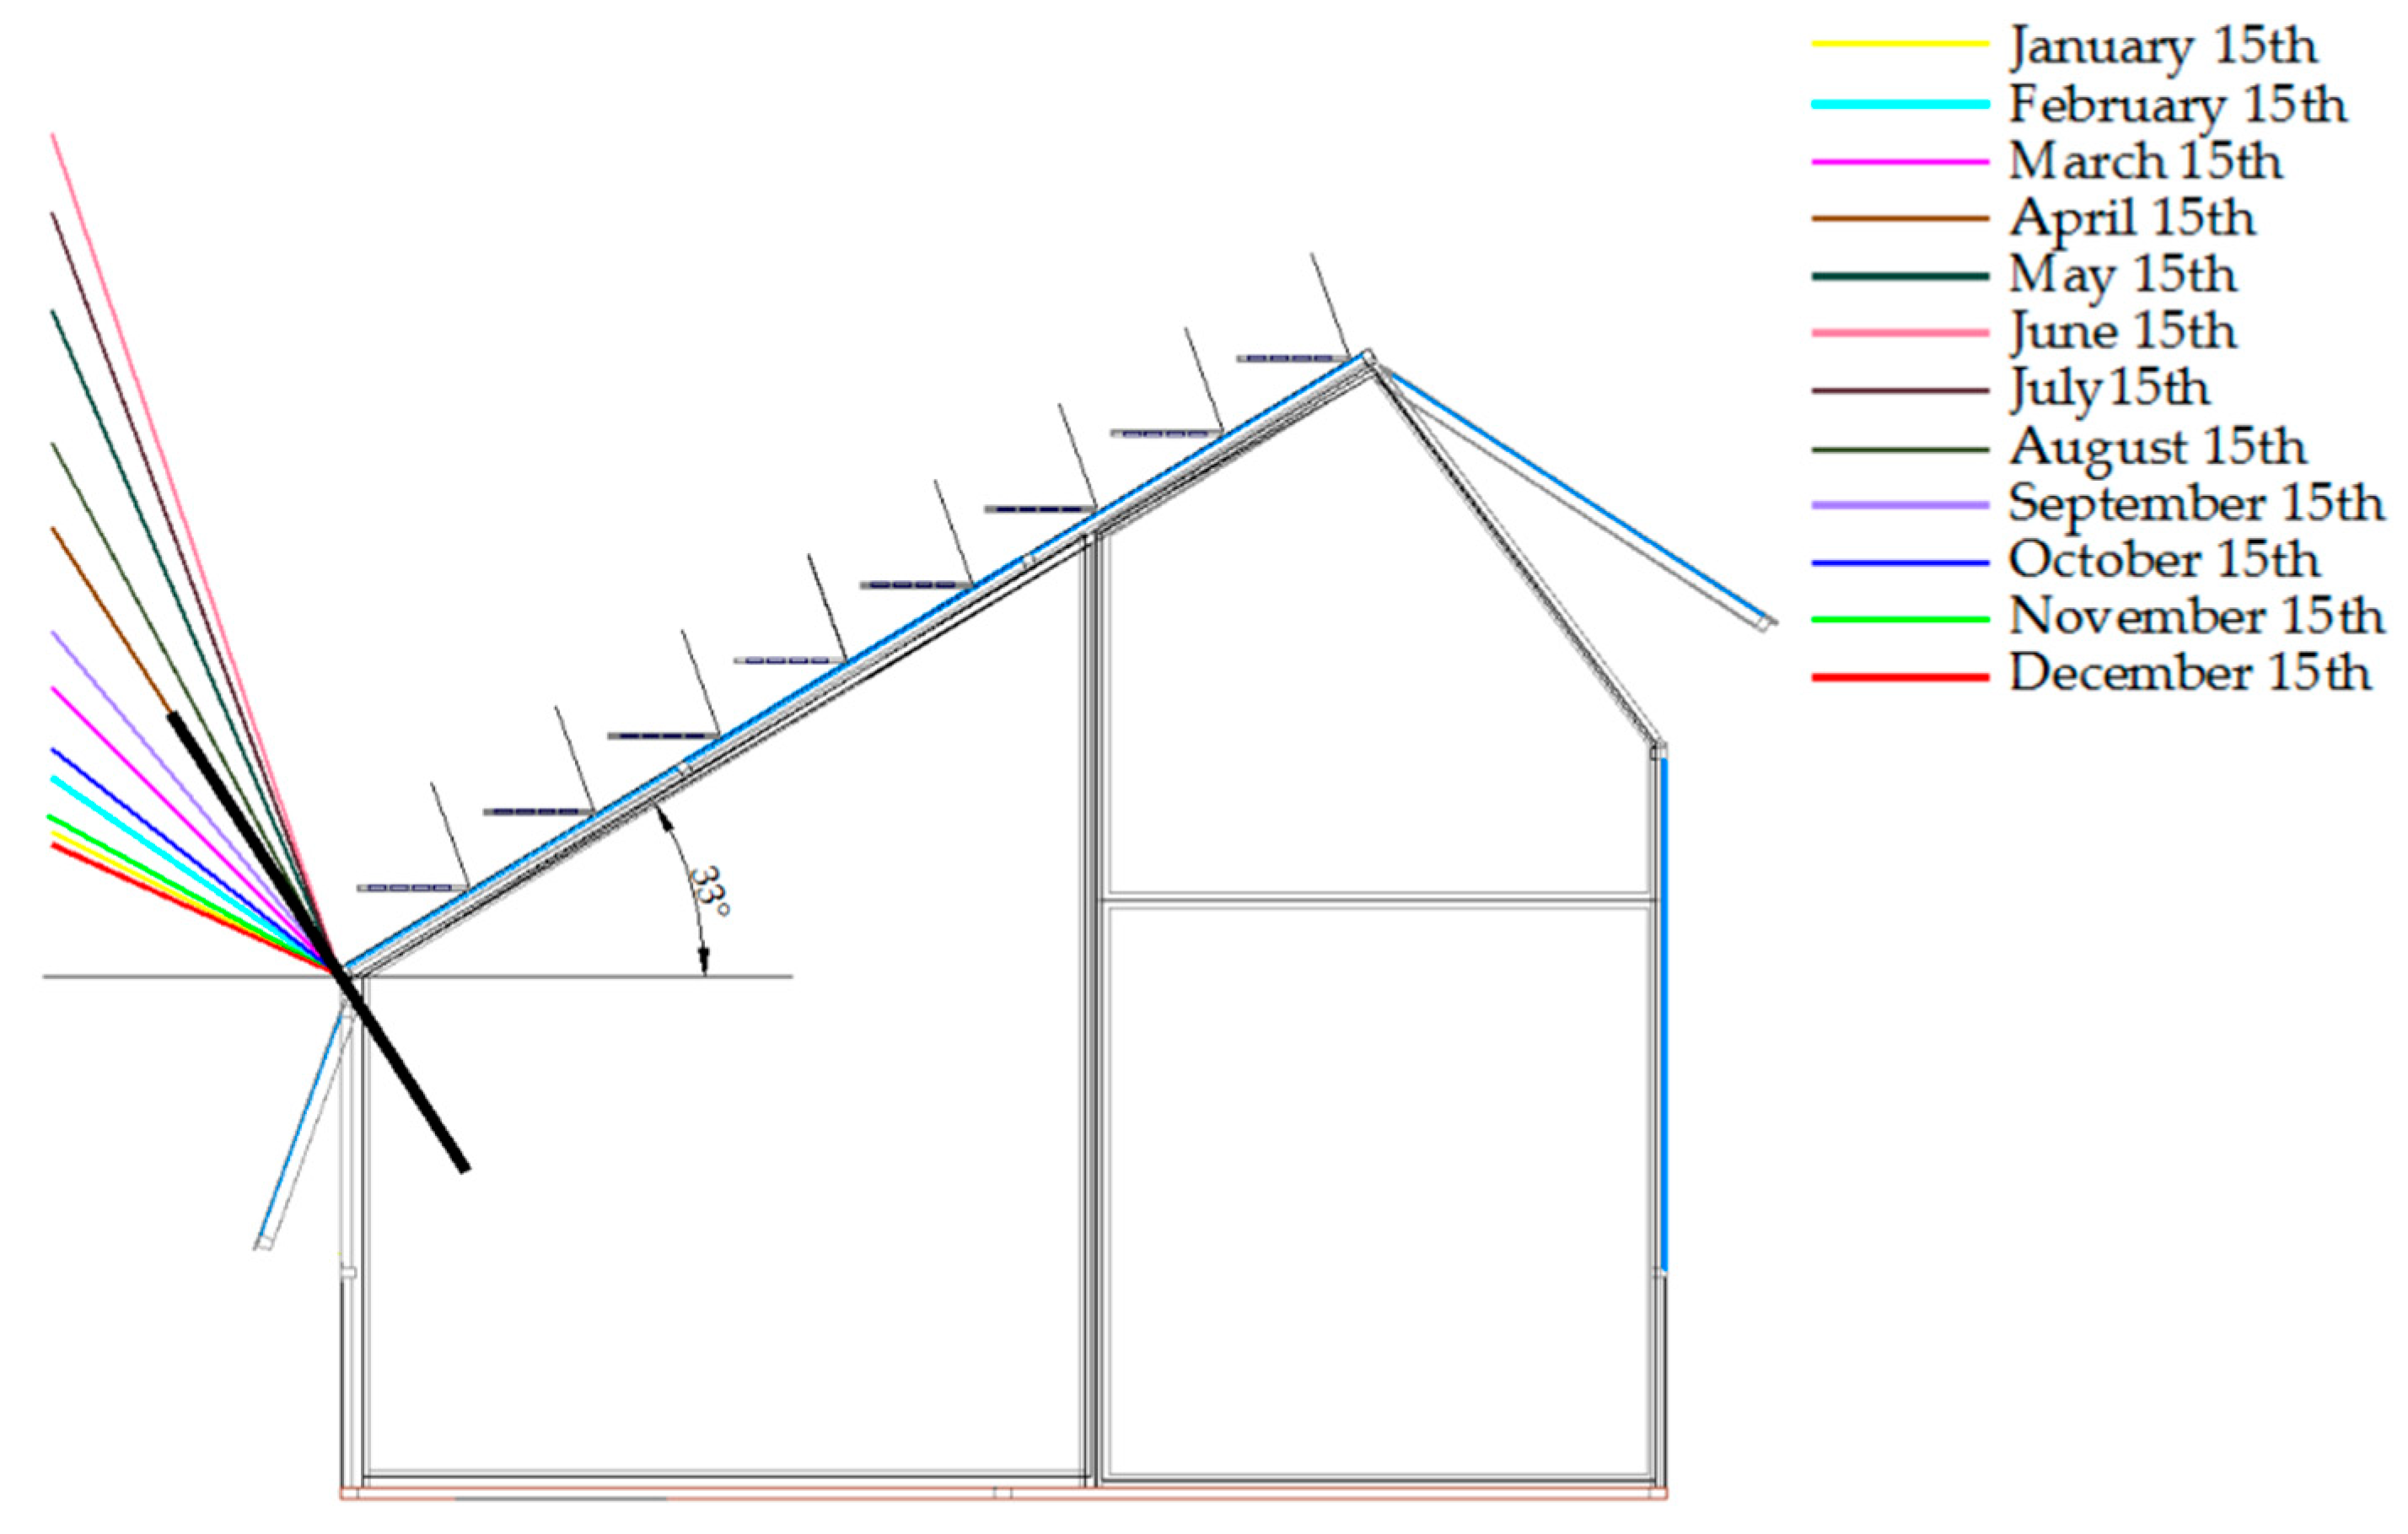
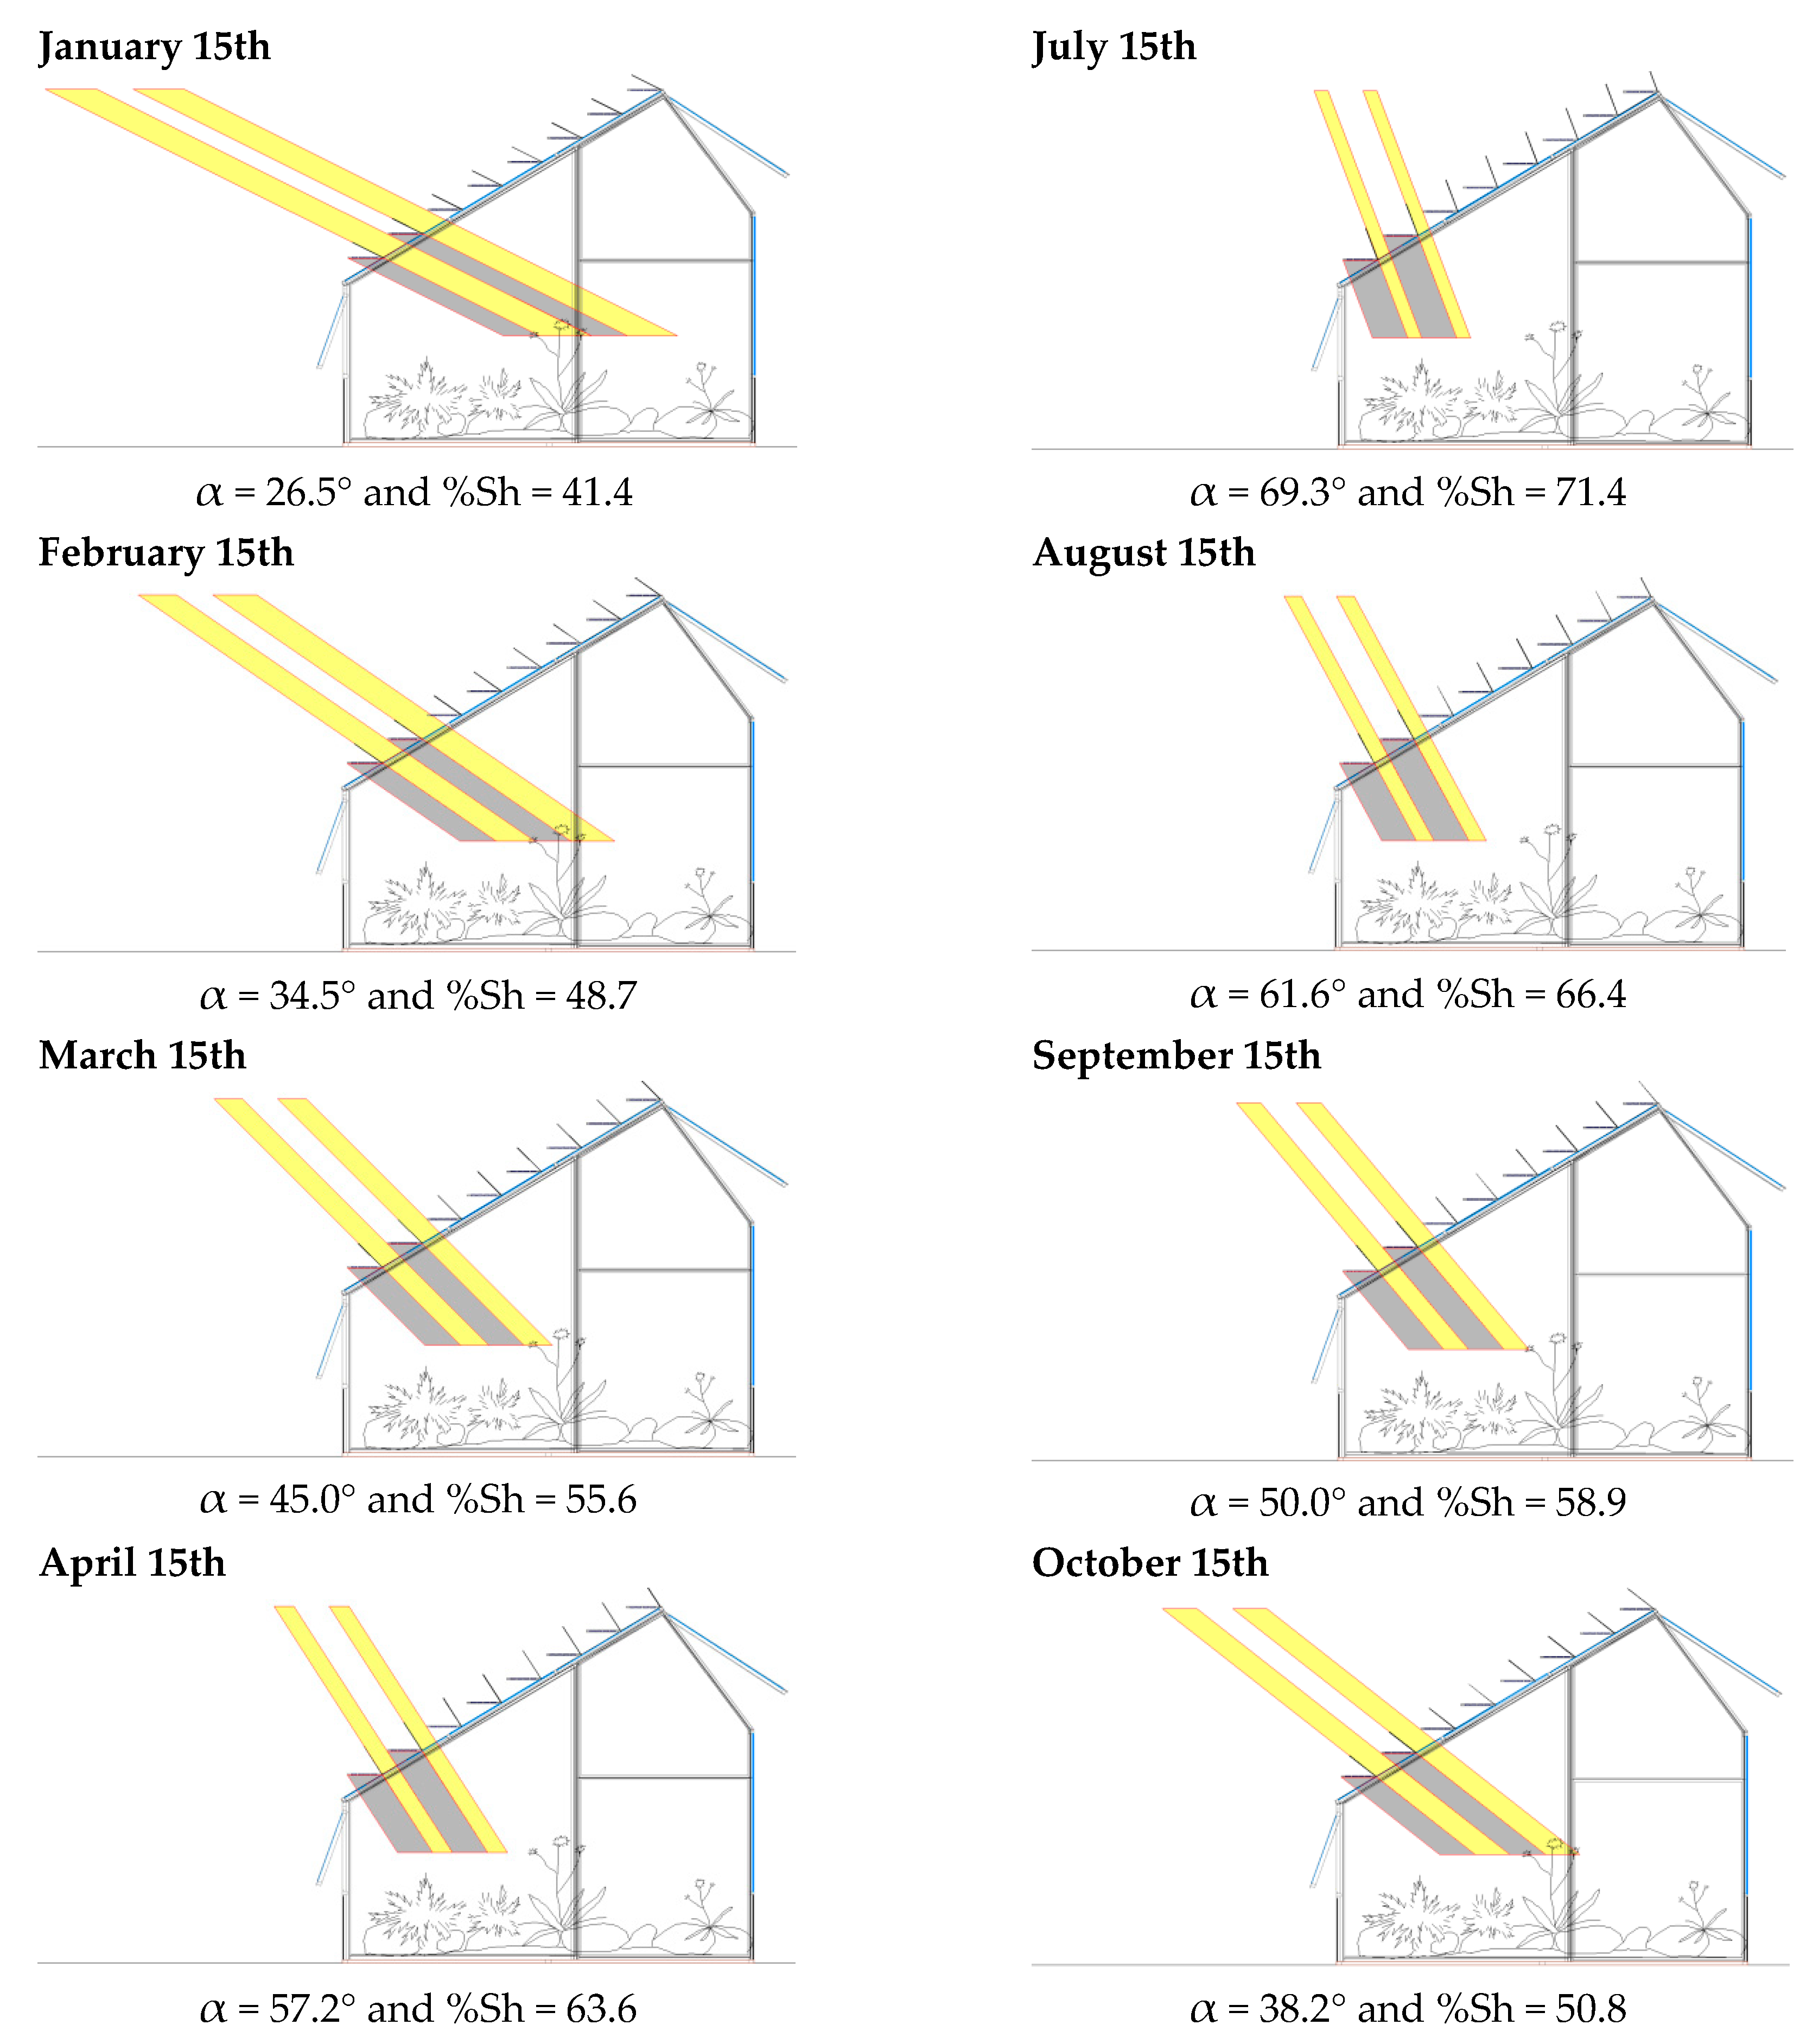
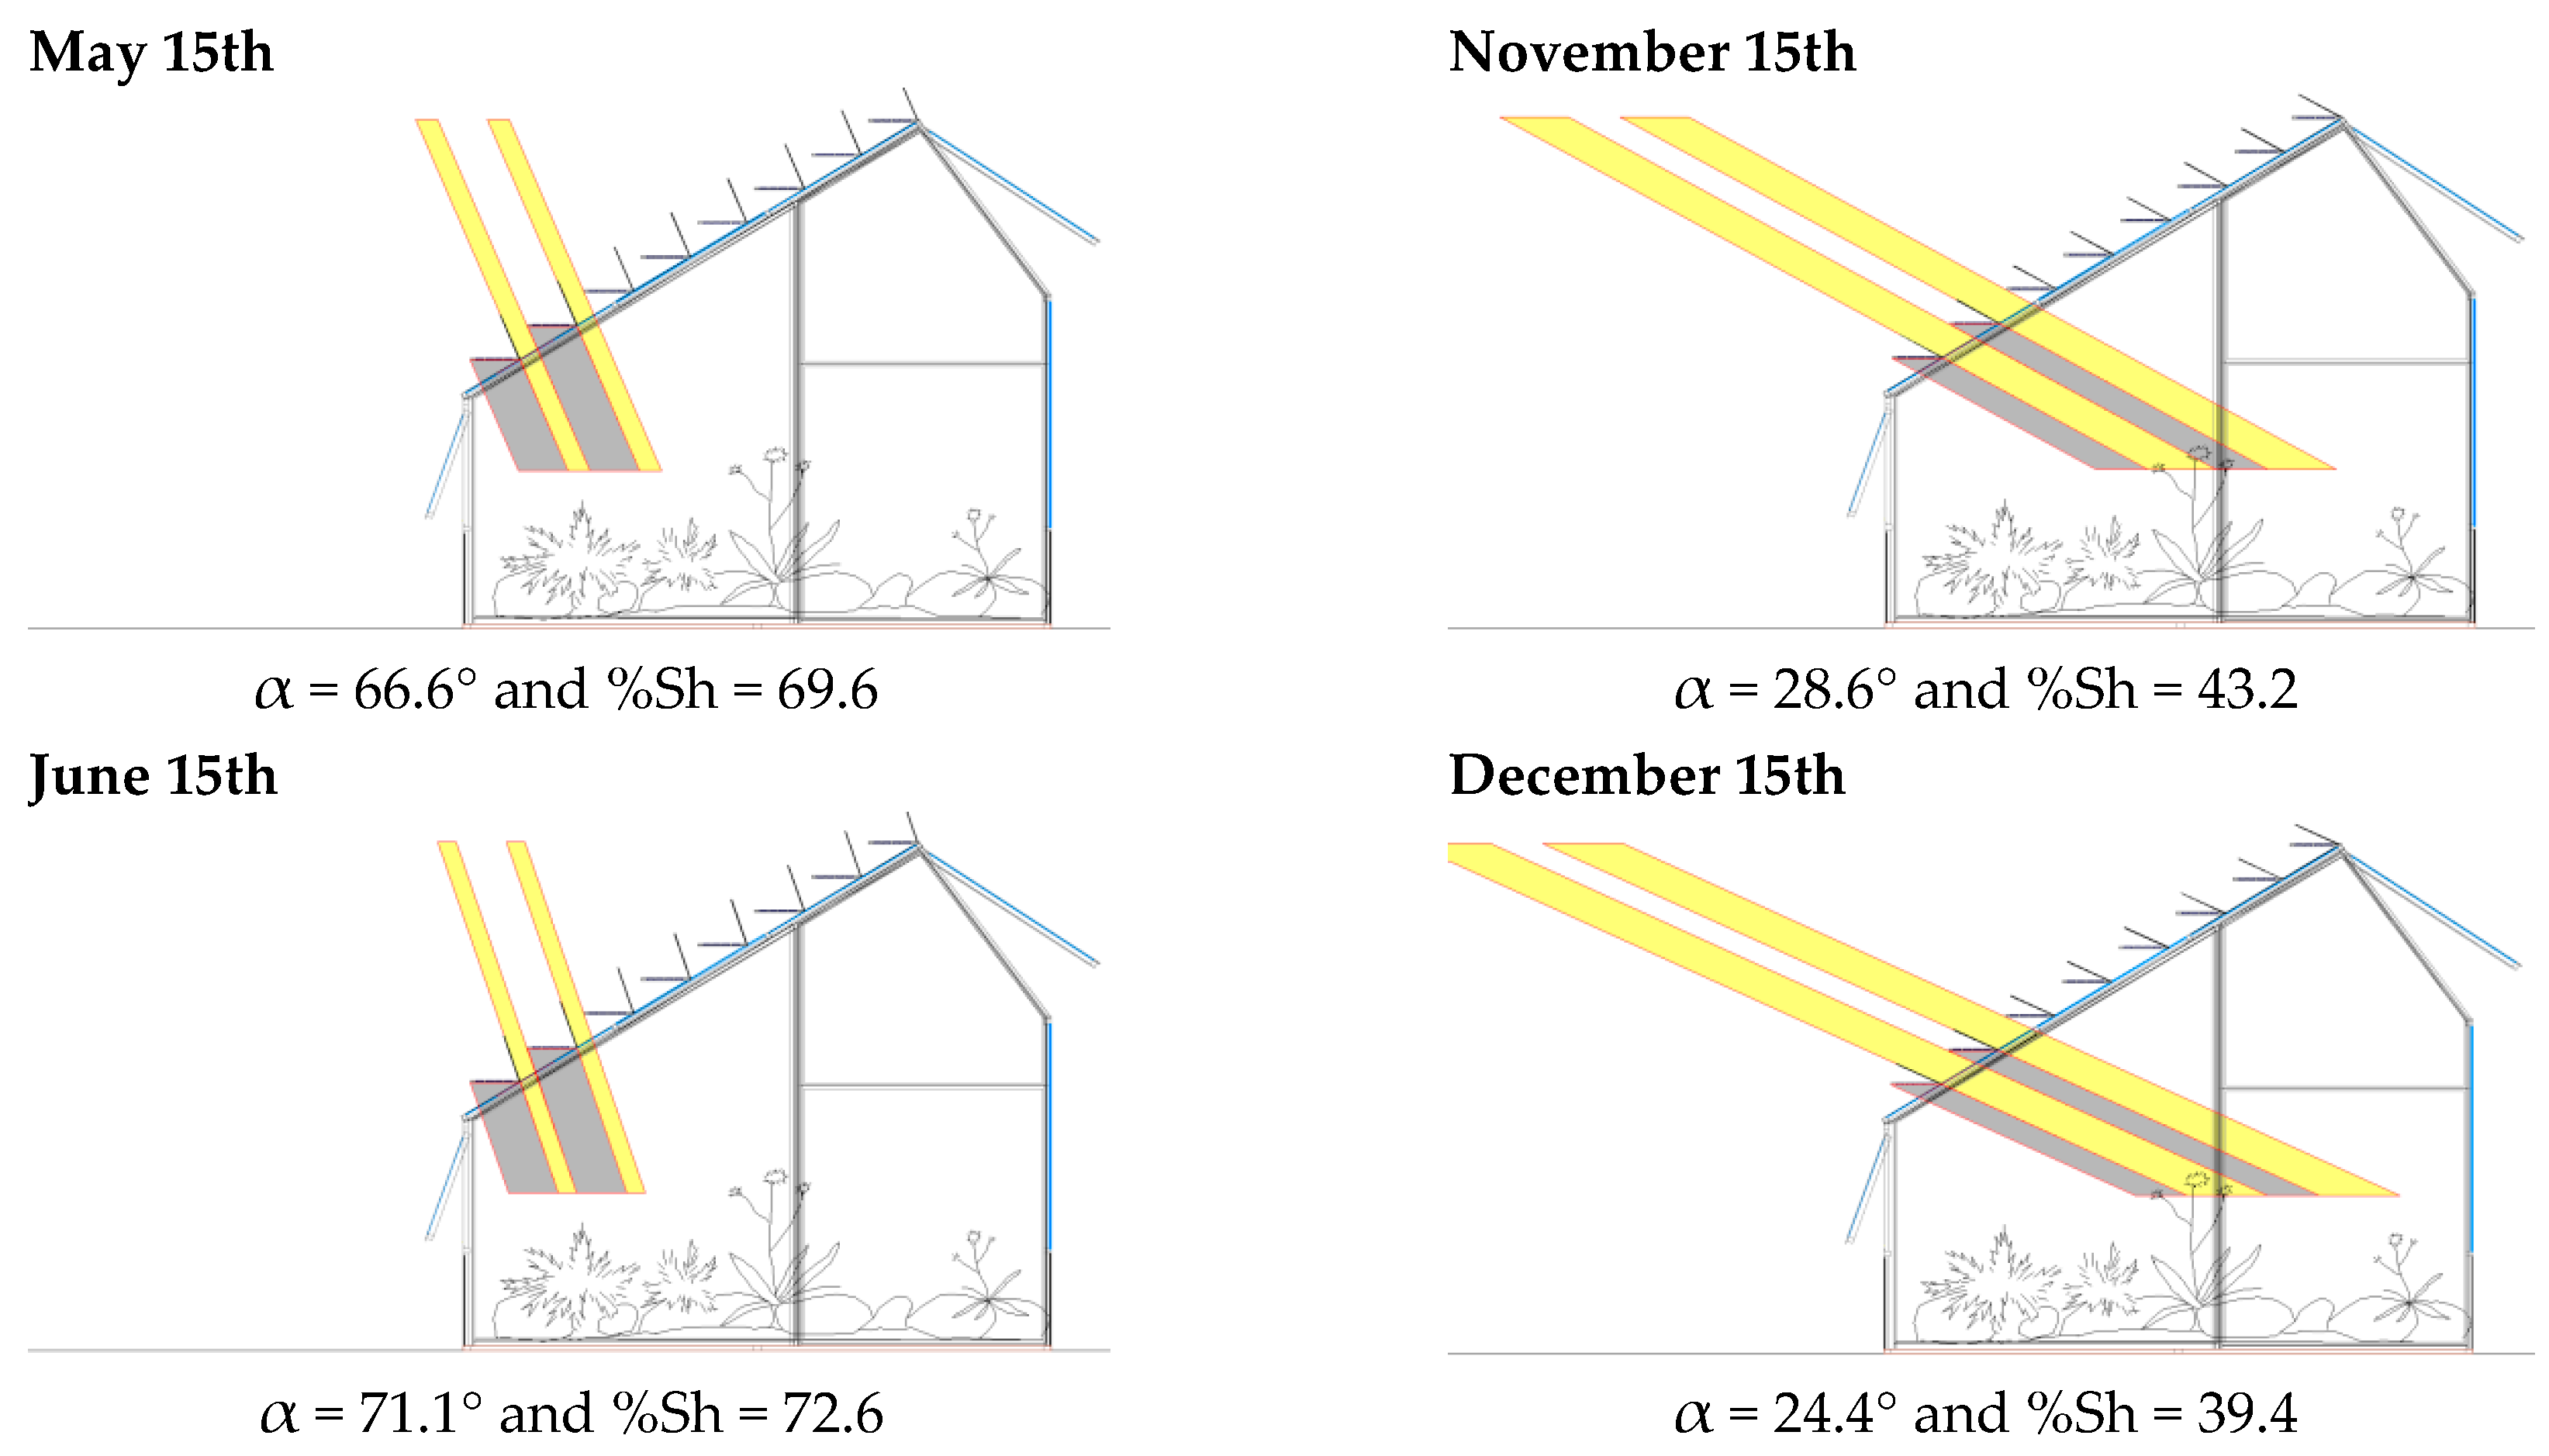
However, a simpler way to operate the prototype is with the PV panels positioned horizontally and fixed, which allows us to passively vary the shading to take advantage of the considerable variation in the height angle of the sun’s rays: from 24.3° to 71.2°, if located at a latitude of 42.2° North. In this way, variation in shading can be obtained that is less flexible than the above-described shading but still sufficient to keep the internal solar radiation almost constant during the year, at least during the central hours of the day. More precisely, with this solution, in the autumn and winter months when the height angle of the sun’s rays is significantly lower than that during the summer months, there is less shading and, therefore, more solar radiation incoming into the greenhouse.
Figure 2 shows the strong variability in the inclination angle of the sun’s rays during the year. The values refer to the latitude of 42.2° North.
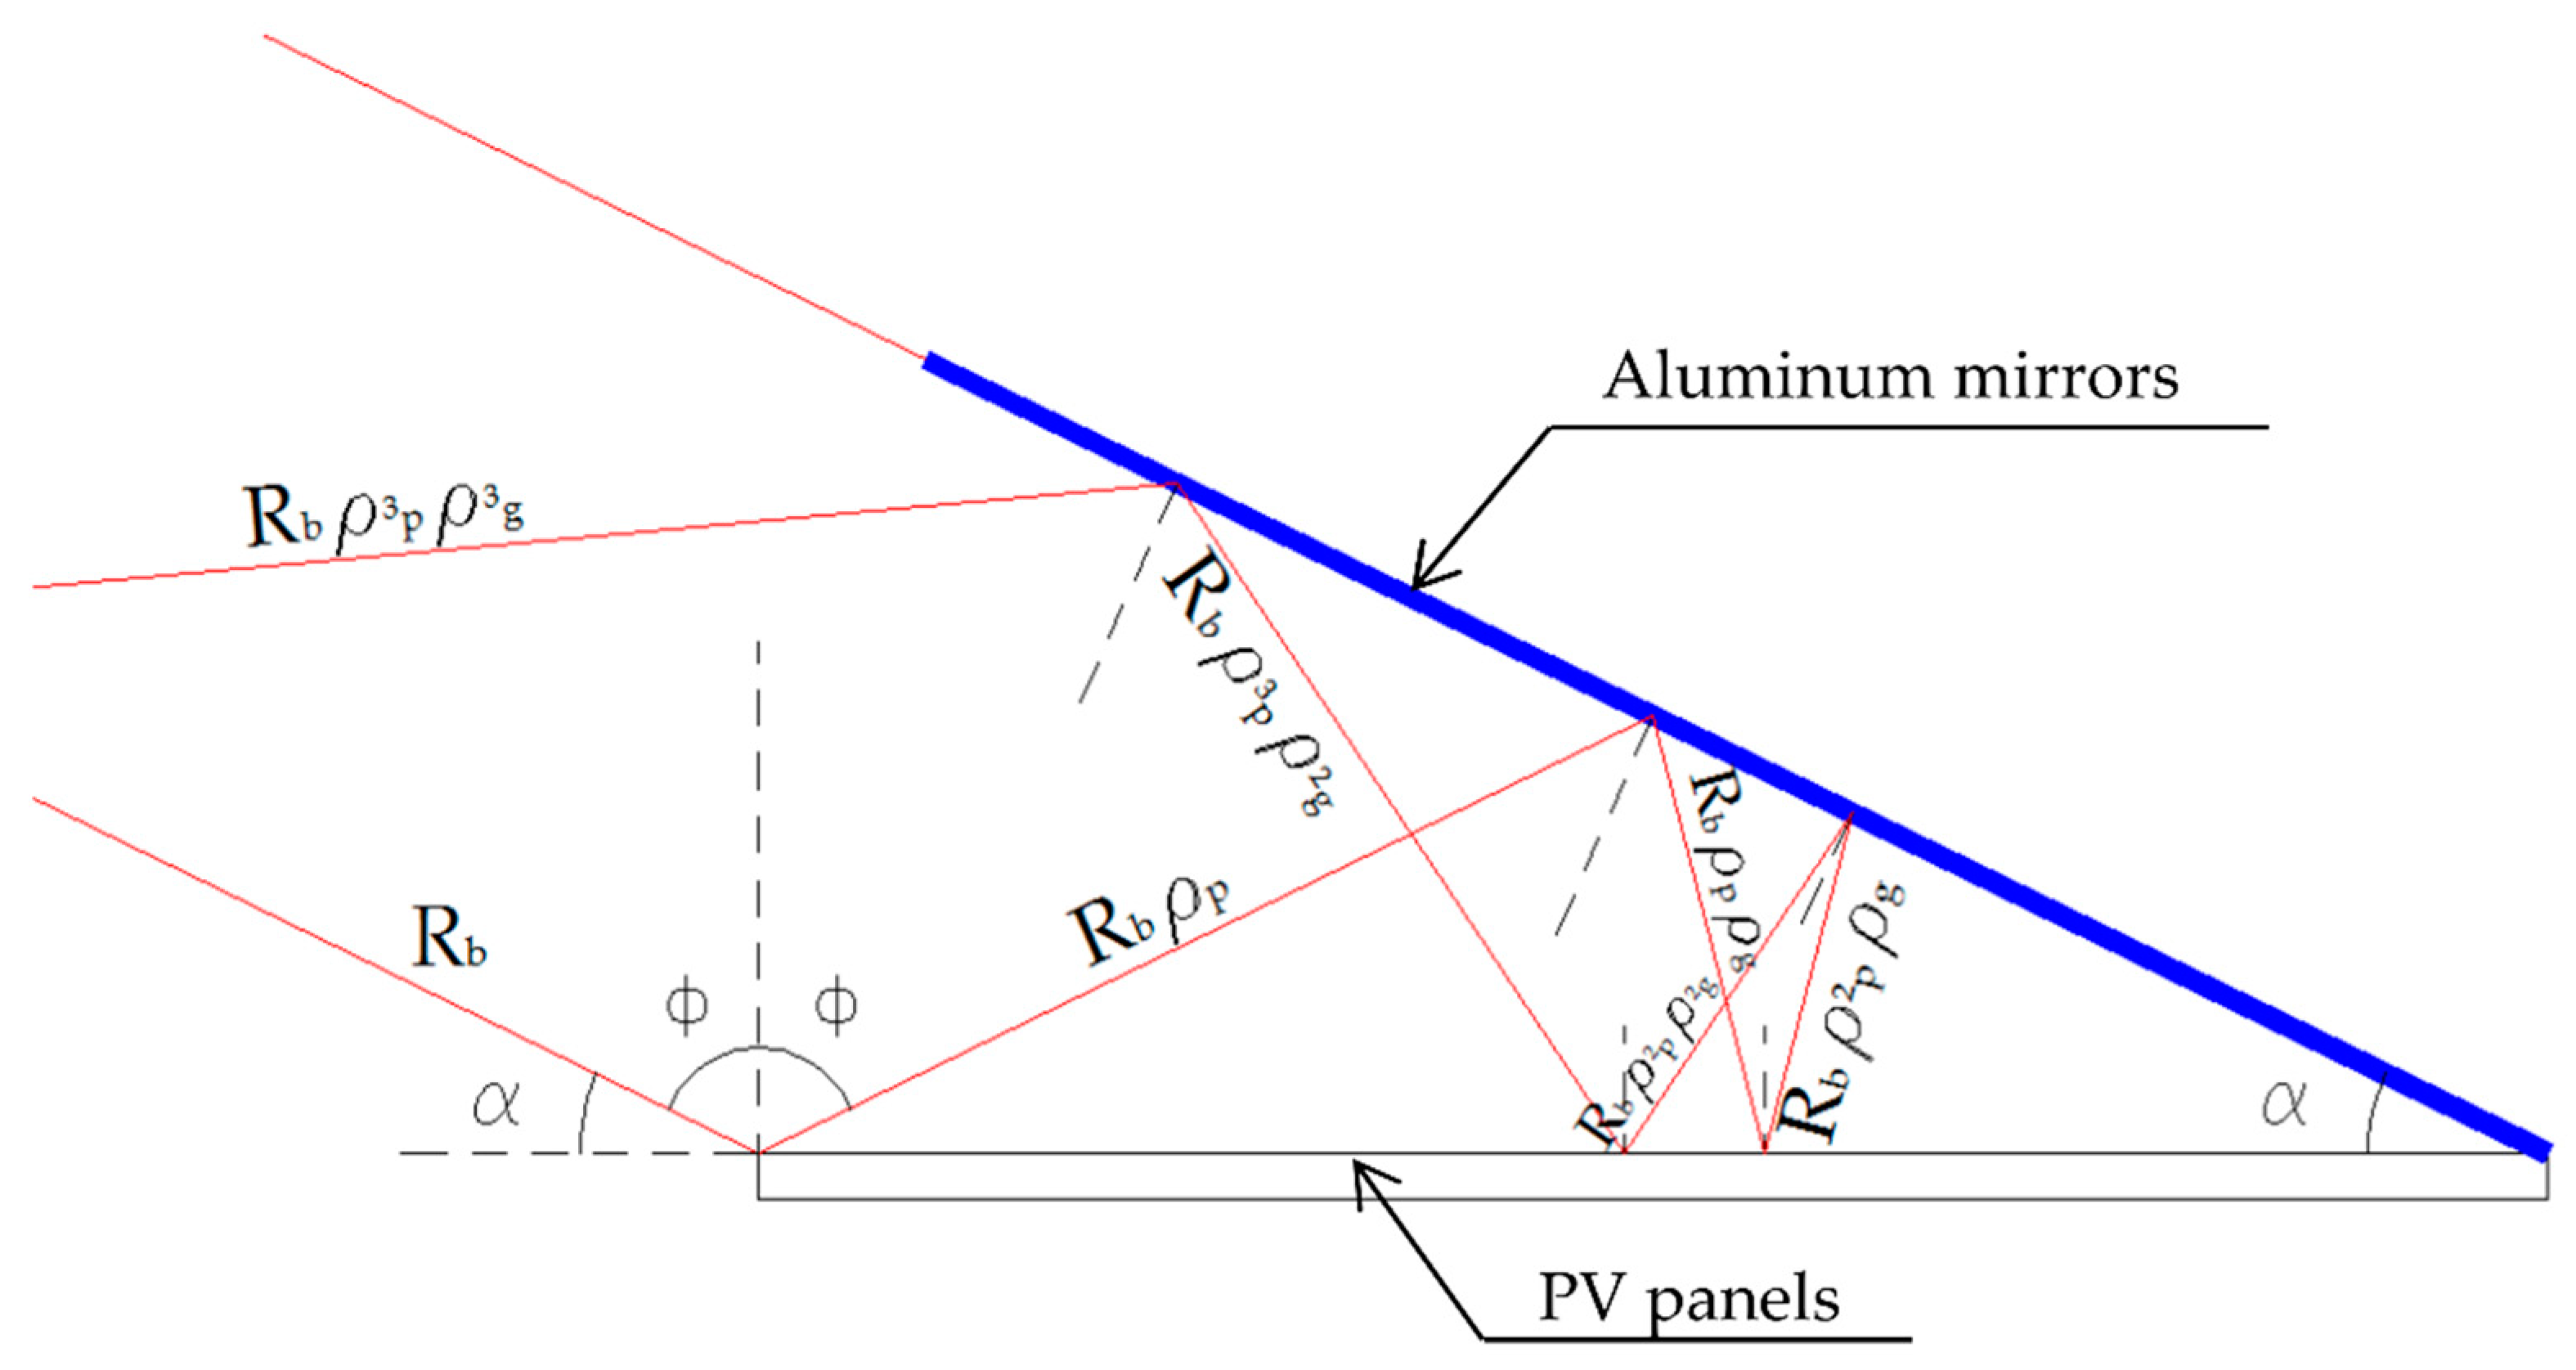
With the fixed and horizontal PV panels, in the autumn and winter months, the angle of incidence of solar rays is high with consequent losses of electric energy due to reflection. The solution that we have designed to reduce these losses consists of using high-reflectivity aluminum mirrors that allow for the collection of a large part of the lost energy. The mirrors rotate parallel to the longitudinal axis so as to remain constantly aligned with the sun’s rays. Figure 3 shows the principles of physics that allow for the recovery of energy lost by reflection [78].
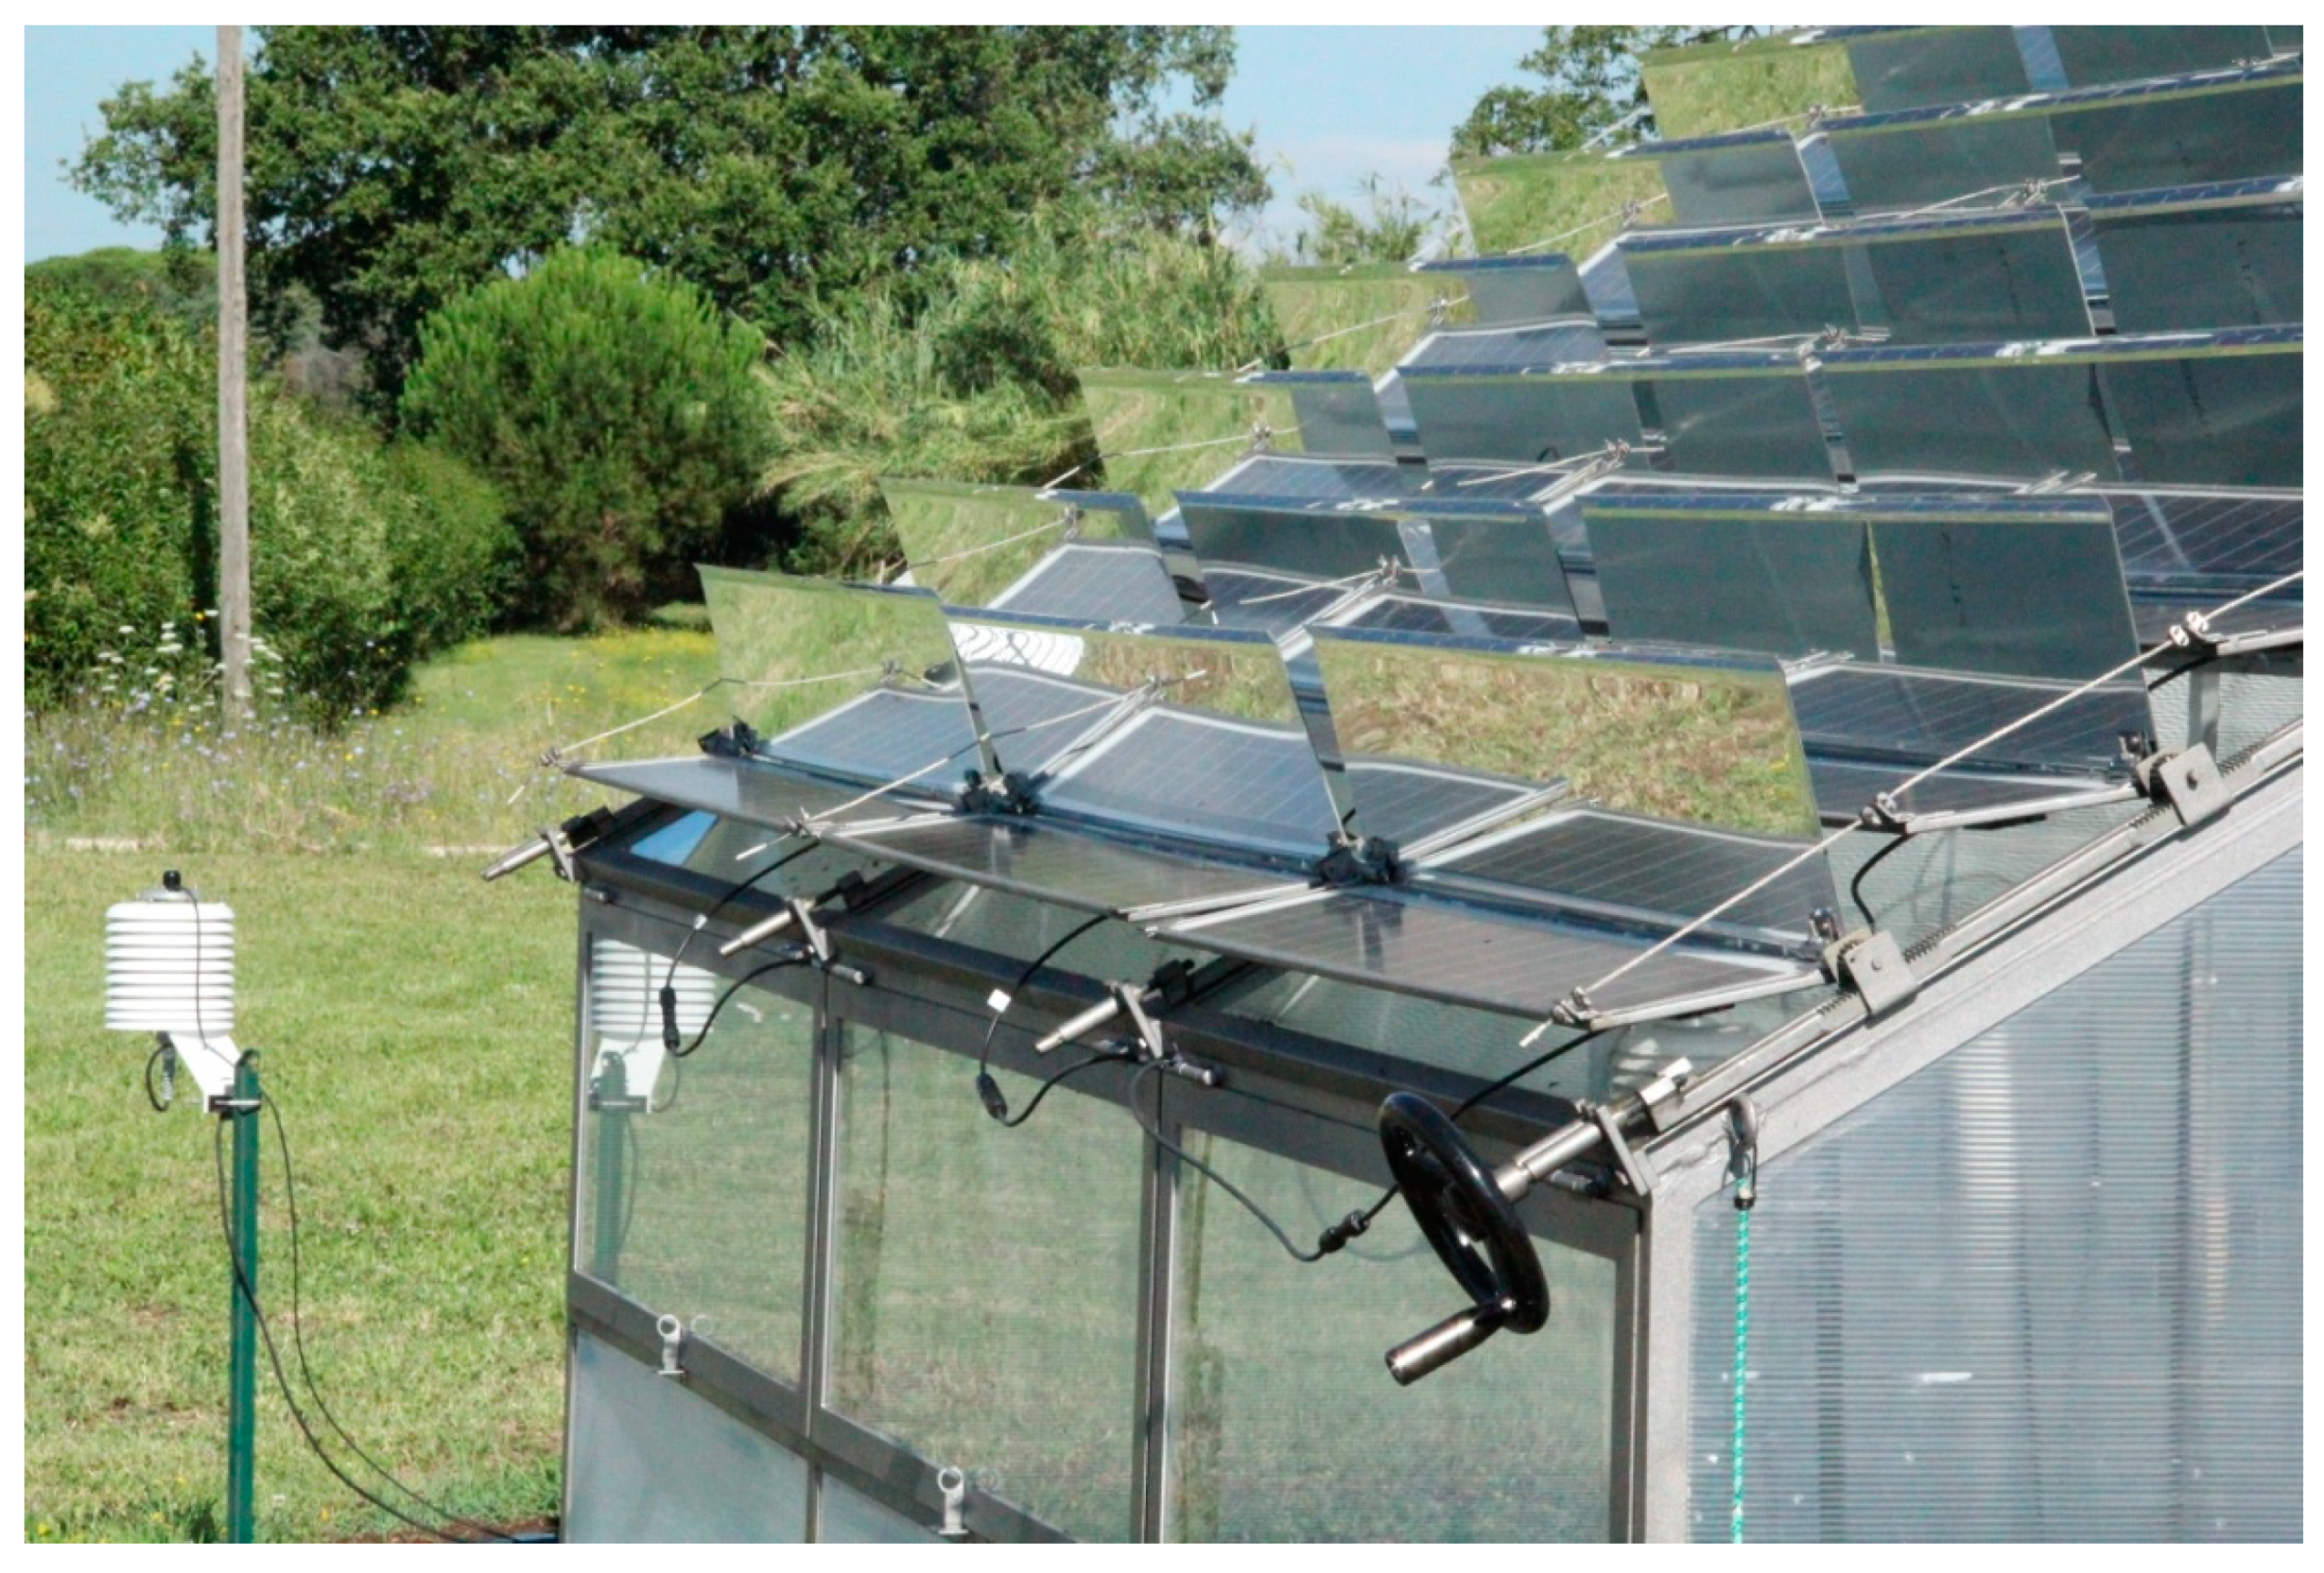
Figure 4 shows the PV panels in the fixed horizontal position and the mobile reflective mirrors in the greenhouse prototype.
For the subsequent analysis, it was necessary to calculate the elevation angle of the sun’s rays and the corresponding shading with the horizontal PV panels.
The following formulas were used to calculate the elevation angle of the sun’s rays:
where n = Julian day, φ = latitude (°), h = hour of the day; and ω = hour angle (°);
where δ = declination of the sun (°).
From (1) and (2), we find the cosine of the zenithal angle:
Finally, the elevation angle of sun rays α is
Figure 5 shows the elevation angle of the sun’s rays and the degree of shading that was obtained with the horizontal fixed PV panels. Both were calculated on the 15th day of each month at a latitude of 42.2° North.
For the more clear days close to the 15th of each month of 2018, the external and internal global solar radiation were measured using a Pyranometer CS300 (Campbell Scientific INC, Logan, UT, USA), and the production of electricity was measured using a Current Transducer (CE-IZ04-35A2-1.0/0-50A, DC, Phidgets, Calgary, AB, Canada) and a Voltage Sensor (CE-VZ02-32MS1-0.5, DC 0–200 V, Phidgets, Calgary, AB, Canada). All sensors were connected to a Campbell CR1000 data acquisition system [78].
The degree of shading, moreover, should respect as much as possible and at any time a request for solar radiation from the plants under cultivation inside the greenhouse.
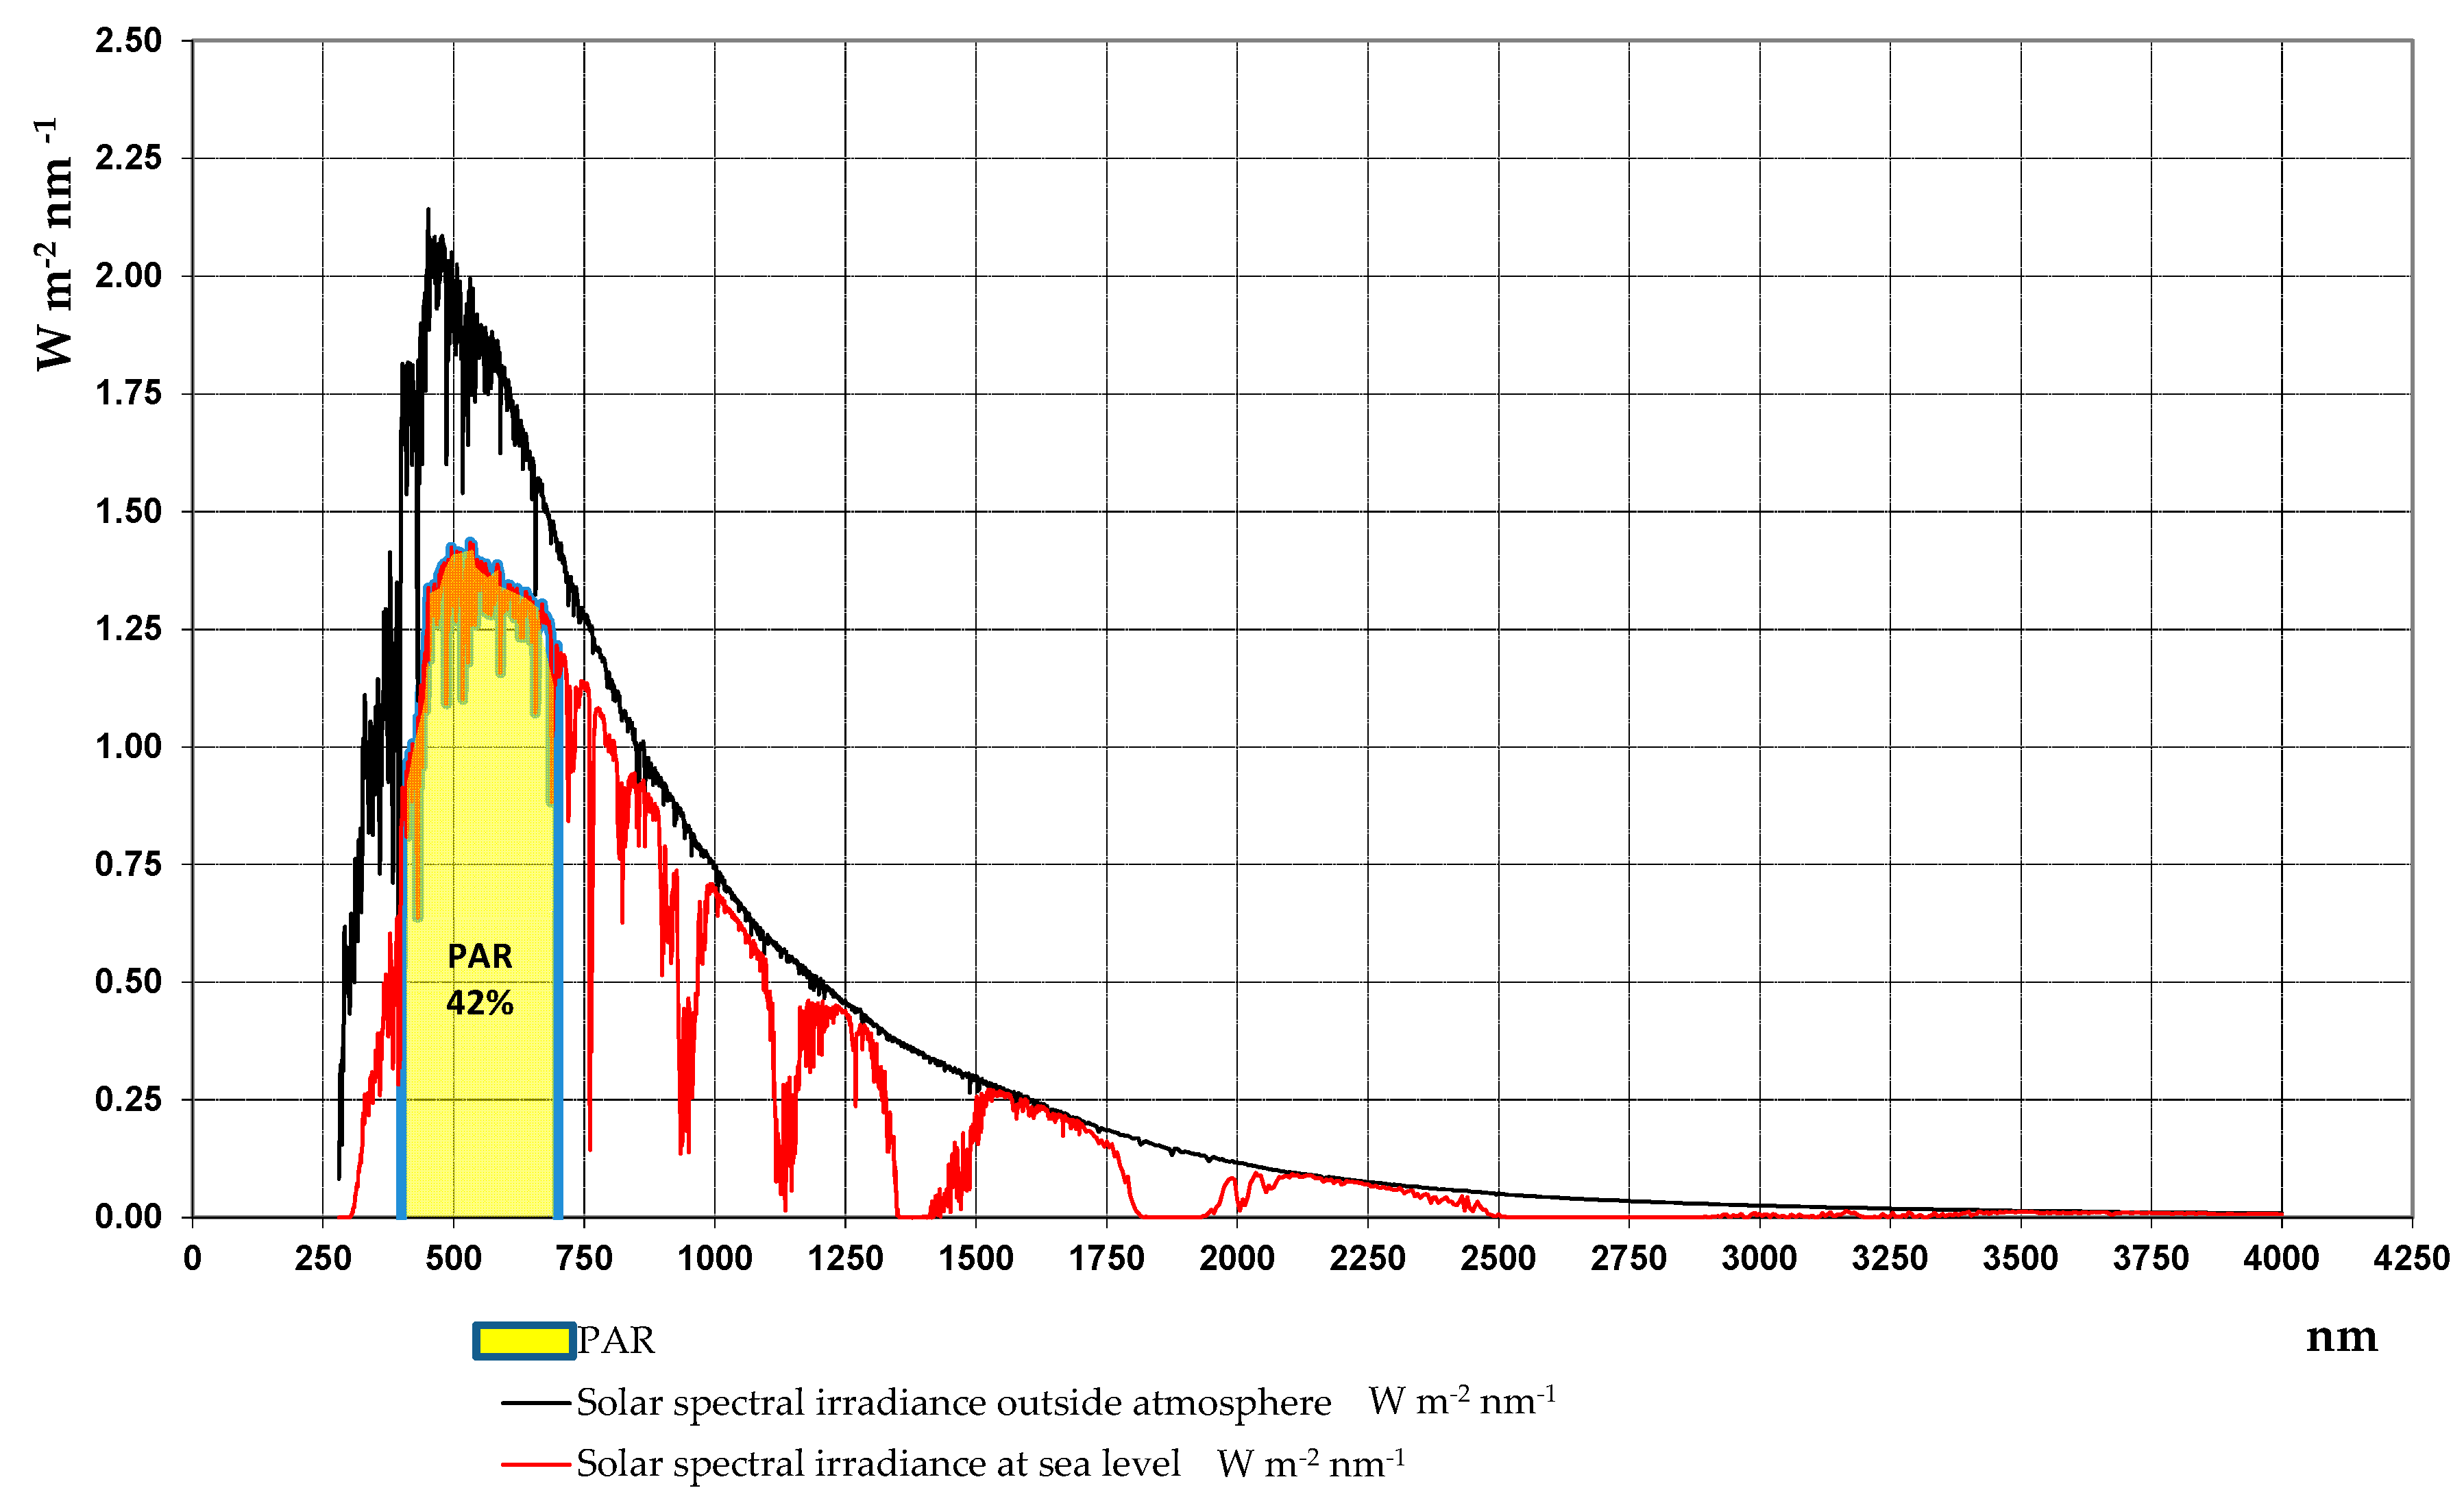
The solar radiation requirement of the plants is expressed in PAR as the visible solar radiation between 400 and 700 nm.
The American Society for Testing and Materials (ASTM) [85] and the photovoltaic industry have defined the standard spectral distributions of extraterrestrial solar radiation and the global total on the 37th sun facing a tilted surface, which have been modeled using SMARTS2 (version 2.9. 2), a simple model for Atmospheric Transmission of Sunshine of Gueymard [86,87,88].
The spectra of solar radiation at sea level and the PAR, which is about 42% of the total solar radiation with these spectra, are shown in Figure 6.
The PAR value that is necessary for normal plant development varies with the considered species. Table 2 shows the values, expressed in μmol m−2 s−1, suggested by L. D. Albright [89].
For the purposes of this research, the PAR (μmol m−2 s−1) was divided by 4.6 and by 0.42 and, therefore, converted into solar radiation (Wm−2). The results obtained are reported in Table 2.
With the thresholds thus converted, the corresponding shading was compared with that obtained from the fixed horizontal PV panels for the different values of solar radiation. At the latitude of 42.2° North, the solar radiation under clear skies at 12:00 passes from about 400 W m−2 in December to around 900 W m−2 in June. Considering the levels of external solar radiation included between these values, with an interval of 100 Wm−2, it was possible to identify the percentage of shading to be applied with the photovoltaic roof to ensure the achievement of the solar radiation thresholds needed for the species of plants shown in Table 2.
The percentage of shading was calculated as follows:
where % Sh is percentage shading, R0 is external global solar radiation (W m−2), Ri is total radiation inside the greenhouse (W m−2), and τ is coverage material transmittance.
A further elaboration was made by applying Formulas (1)–(4). Considering the 15th day of each month, the value of the elevation angle of the sun’s rays and the corresponding value of the external solar radiation at 12:00, through the model described by Marucci et al., were calculated [83].
Applying Equation (5), we then calculated the percentage of shading that it was necessary to have within the greenhouse to achieve the maximum and minimum radiation thresholds for the plant species shown in Table 2. Finally, the degree of shading necessary to maintain the minimum and maximum thresholds required for the plants was compared with the degree of shading that was obtained by positioning the fixed horizontal PV panels in the realized photovoltaic greenhouse prototype.
With this type of greenhouse (horizontal and fixed PV panels), the degree of shading that the panels provide depends on their distance on the roof pitch. The distance must be determined in the design phase in accordance with the needs of the plants to be cultivated. For this purpose, a specific mathematical calculation relationship was determined.
3. Results and Discussion
From the sections shown in Figure 5, it can be observed that the maximum value of the shading degree, equal to 72.6%, occurs on 15 June 2018 when the elevation angle of the sun’s rays is equal to 71.1°. The minimum value of the degree of shading obtained is 39.4% and occurs on 15 December 2018 when the elevation angle of the sun’s rays is 24.4°. The range of variation in the elevation angle of the sun’s rays is equal to 46.7°, while the range of variation in the corresponding shading is 33.2% at the latitude considered and for the 15th day of each month.
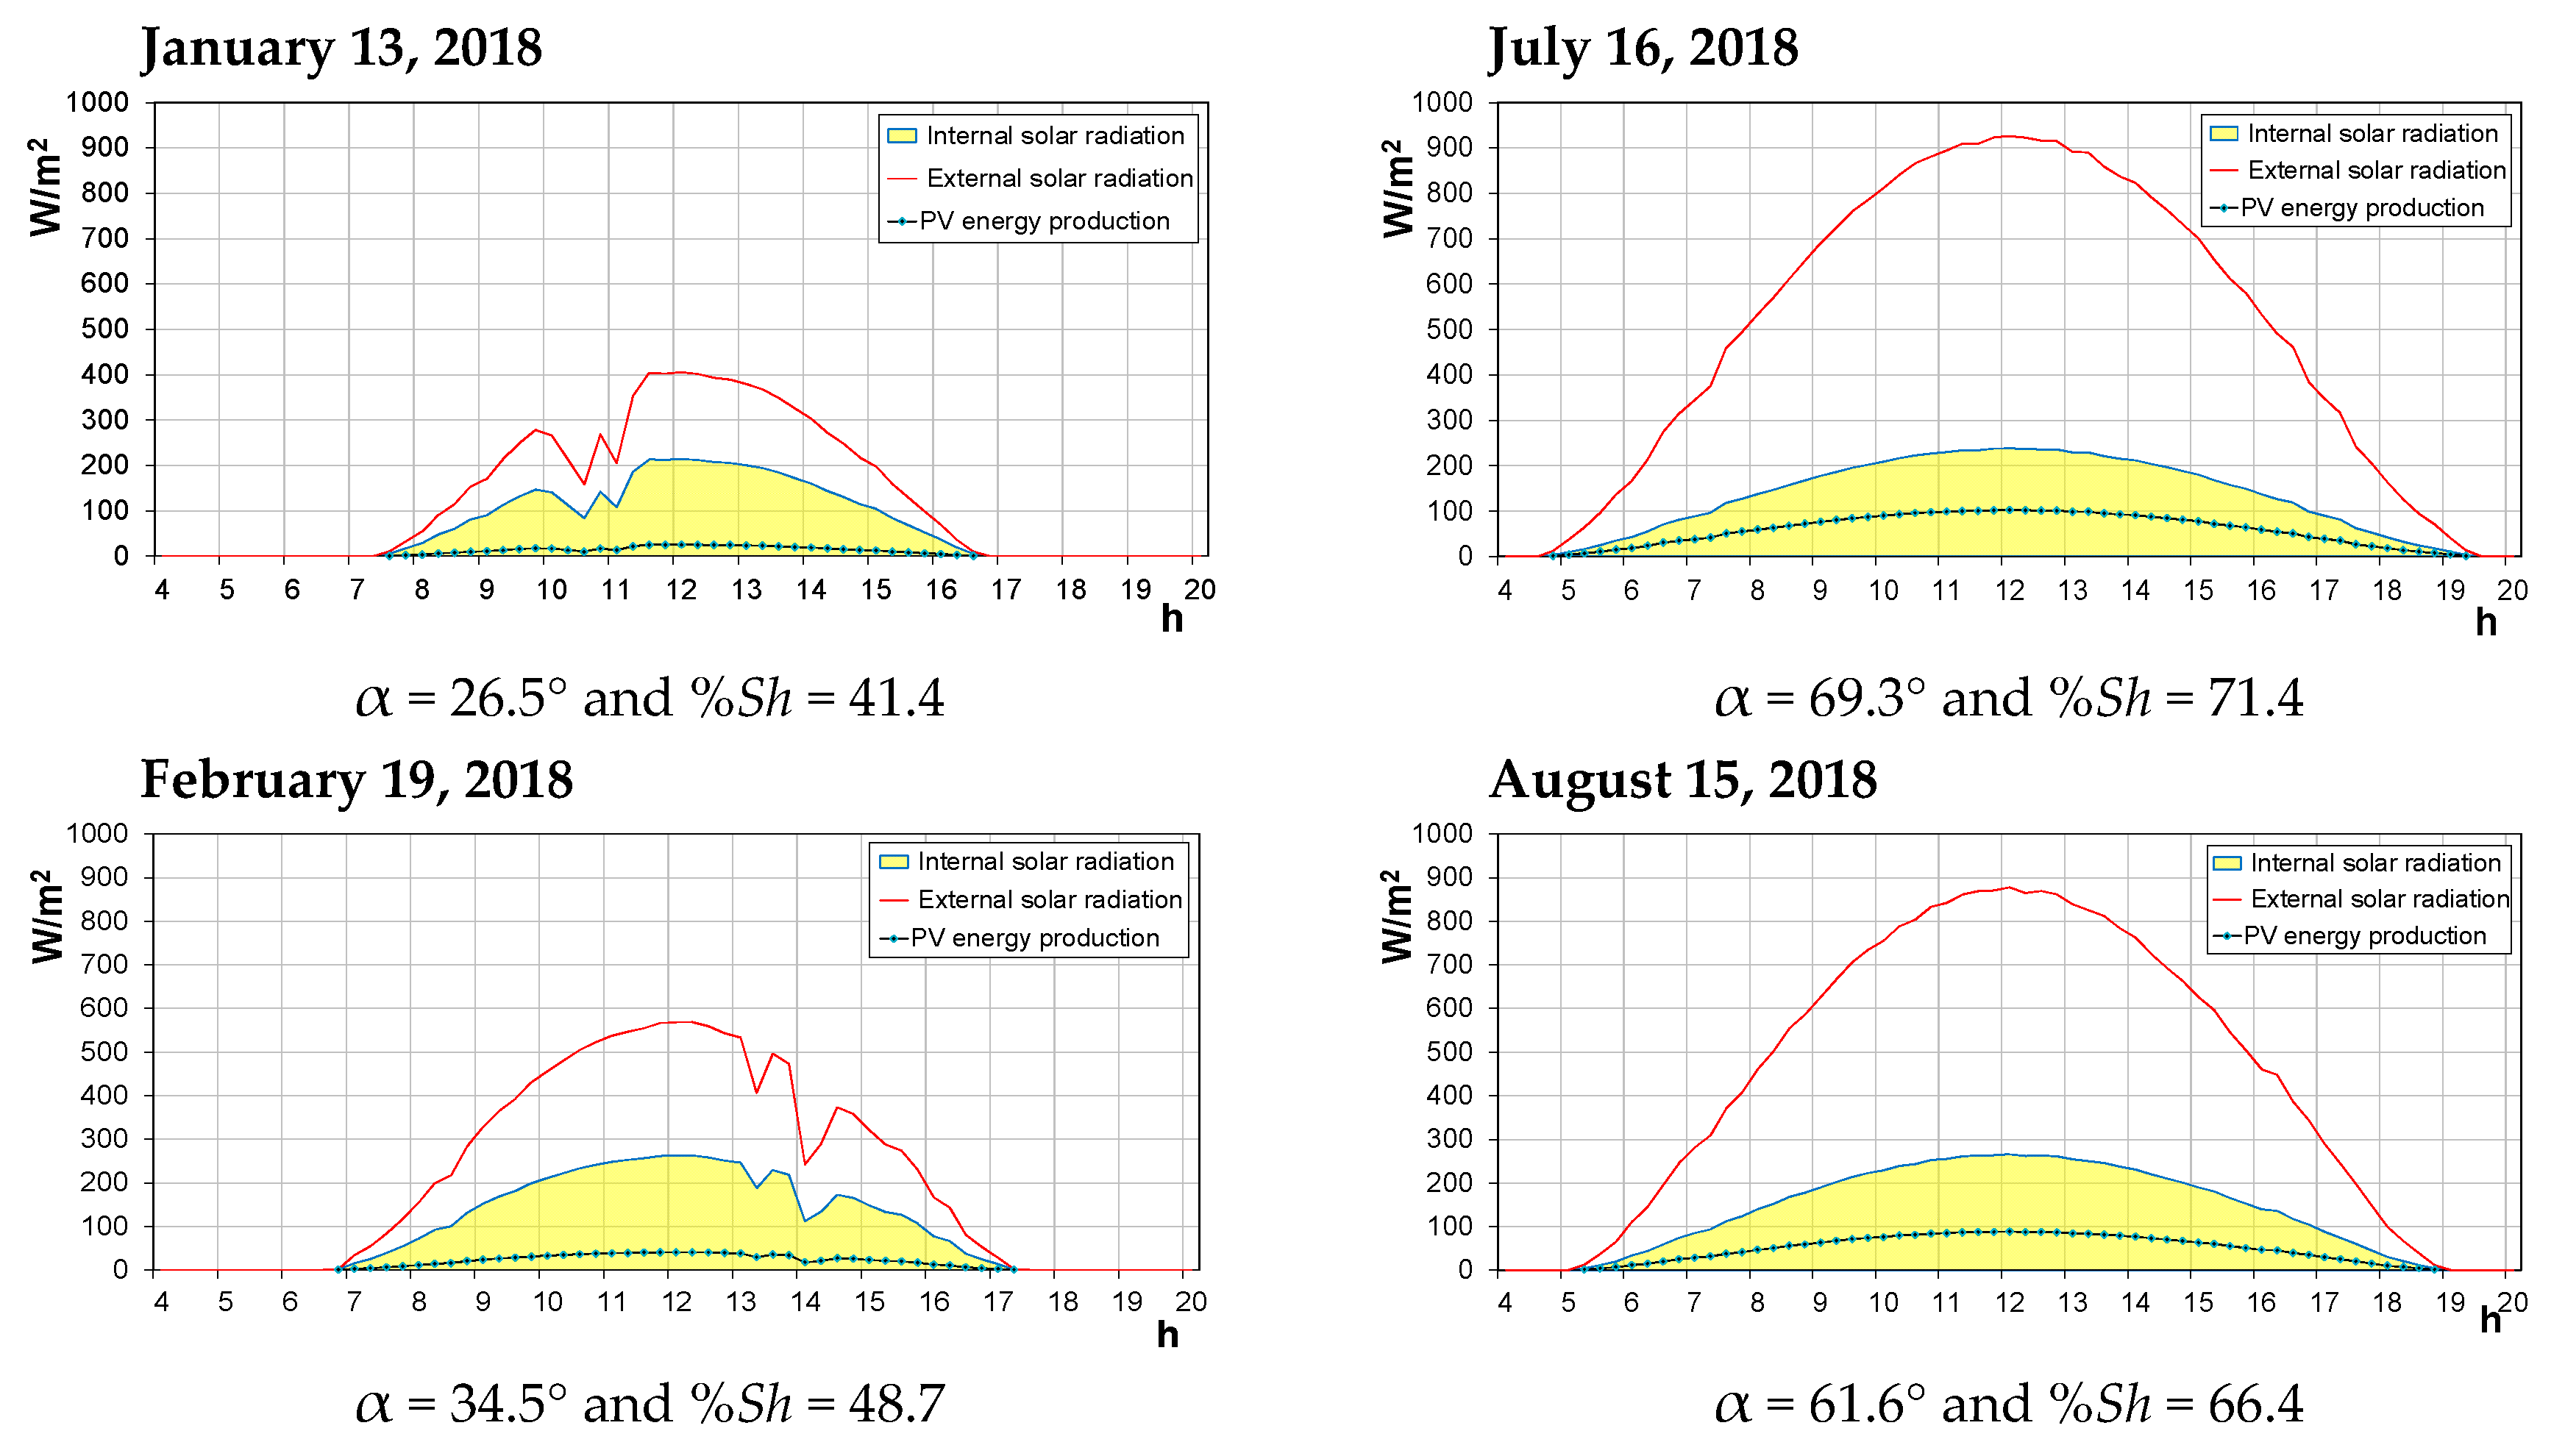
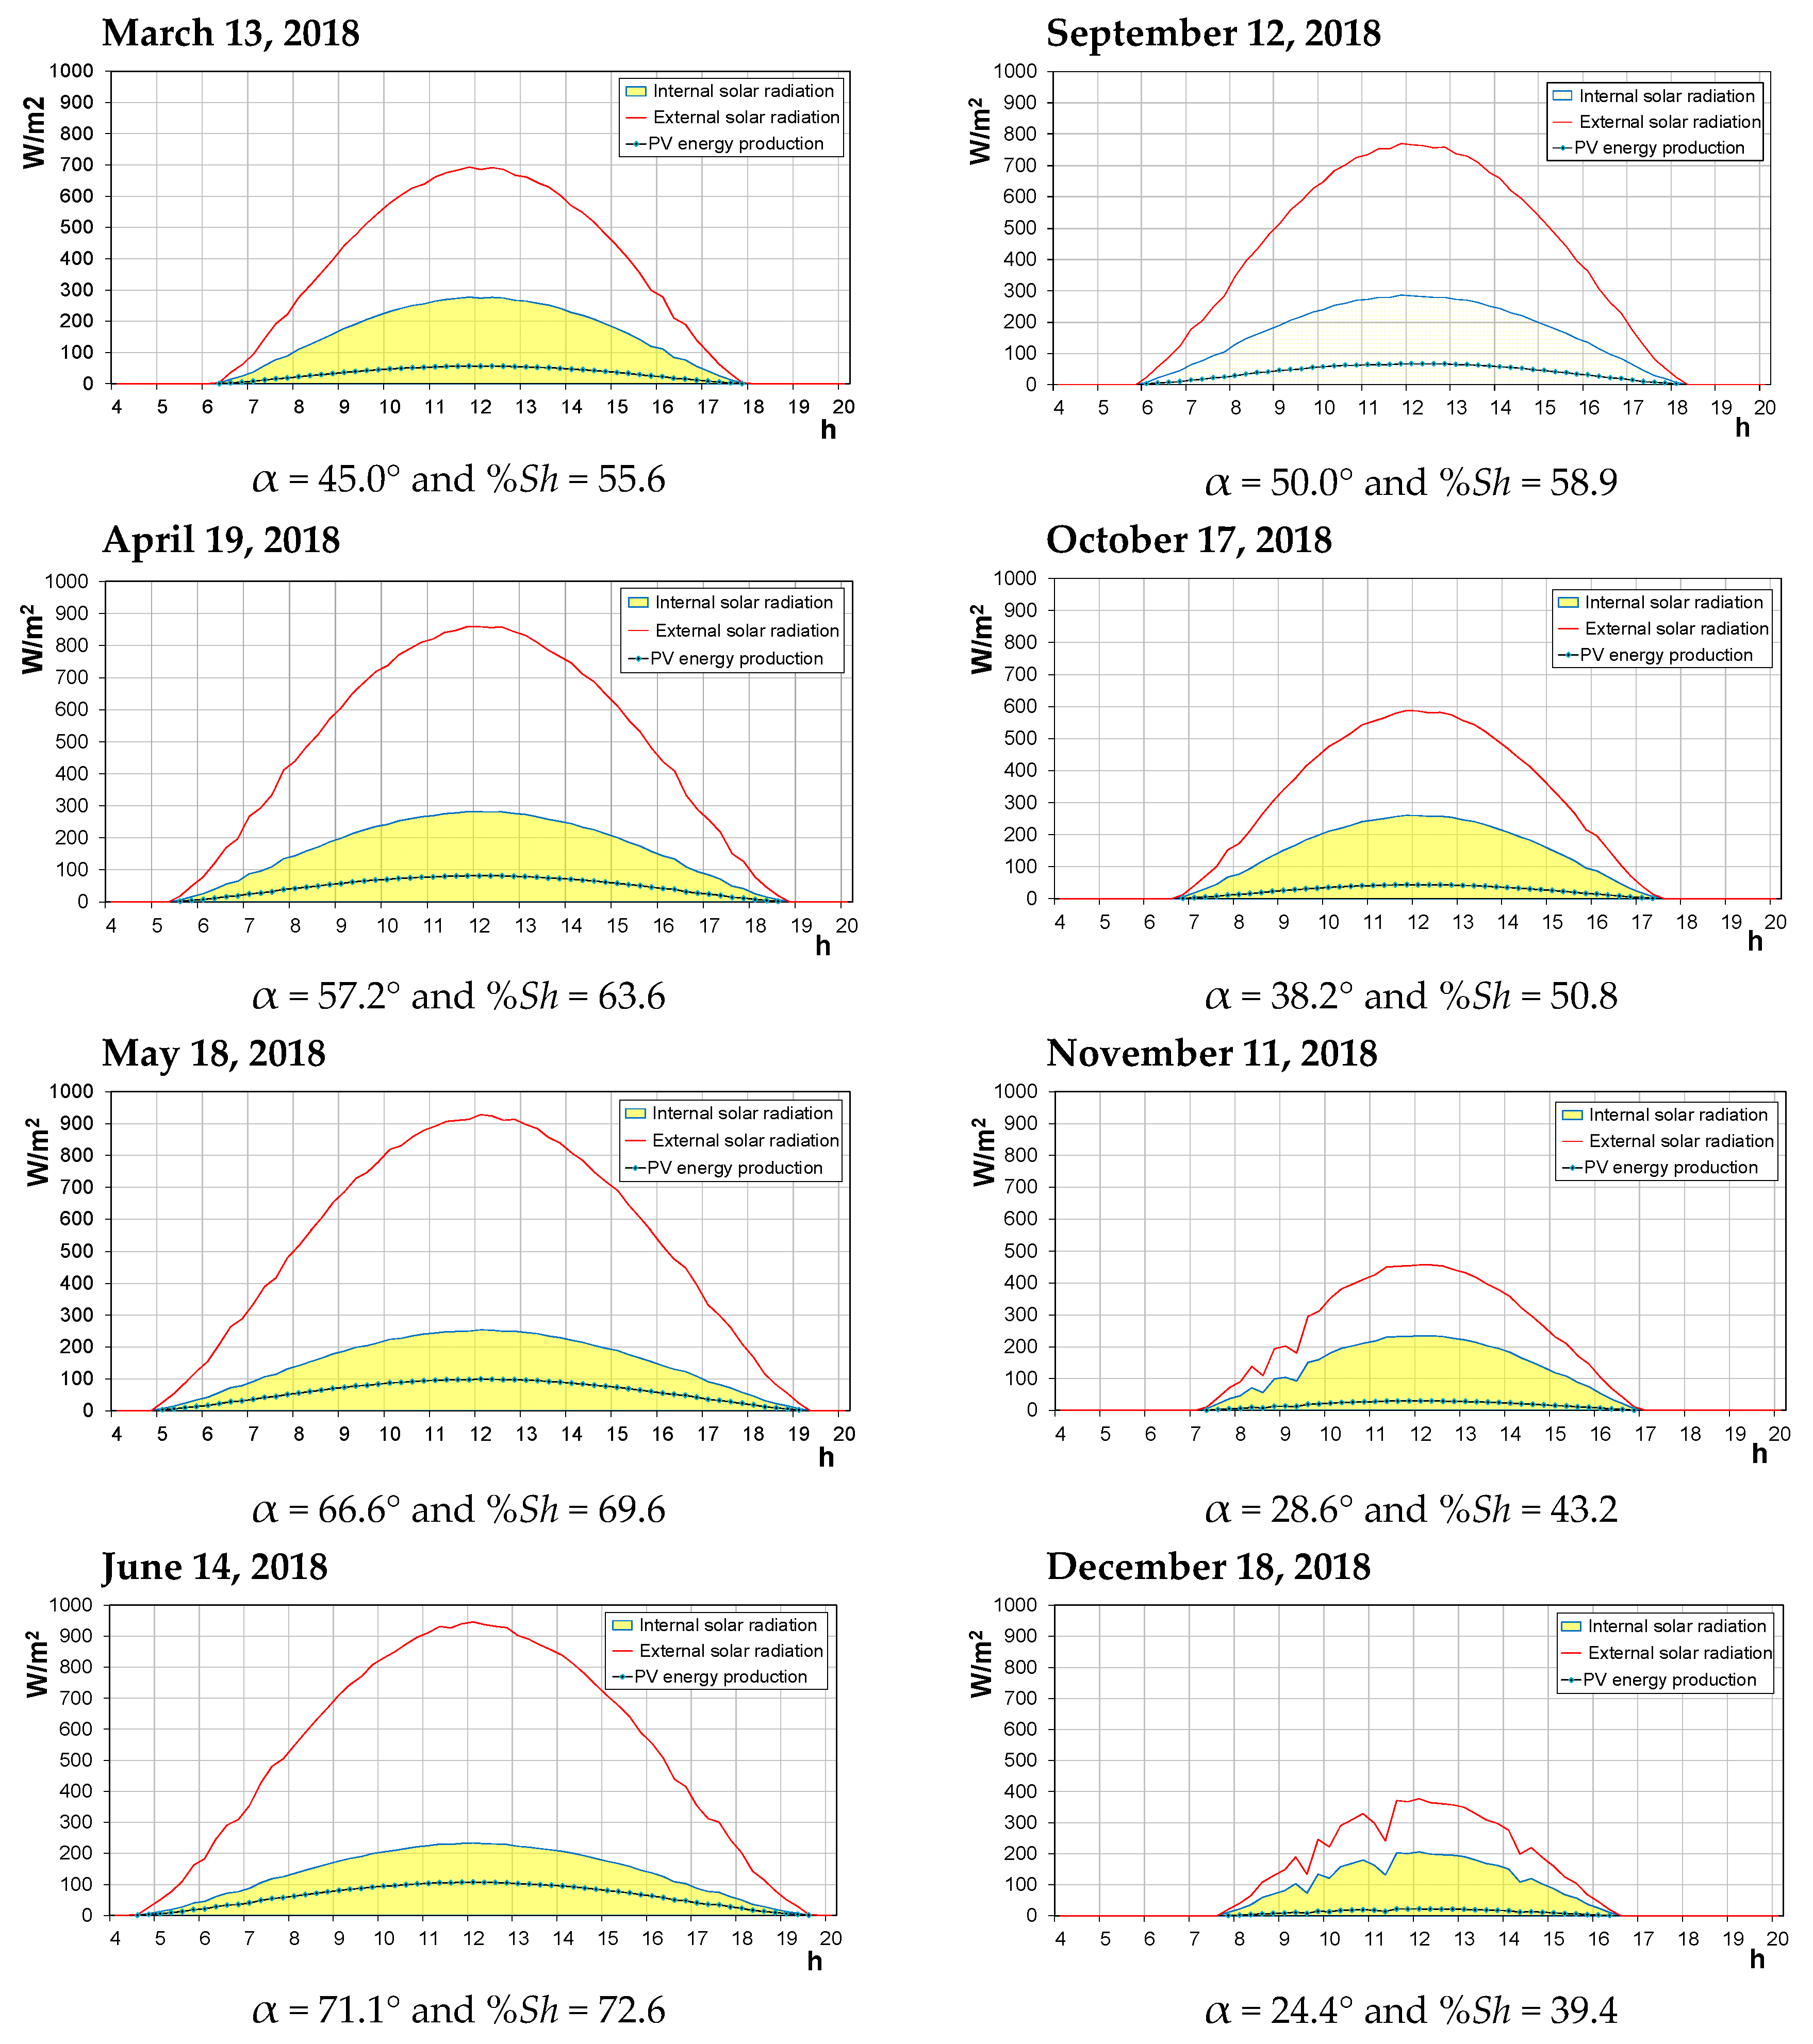
Figure 7 shows the results of the first elaborations on the measured radiation and the electricity production data, on a clear day representative of each month of the year. In the winter months we took the least cloudy day because there were no perfectly clear days.
The trend of the measurements made (Figure 7) shows that in the different months of the year and during the central hours of the day, there is a limited variation in the solar radiation inside the greenhouse (a maximum value between 206 and 285 W m−2), and a variation in the external solar radiation of 377–945 W m−2, which favors the optimization of plant production and electricity. In other words, the system allows for the maintenance of a high level of solar radiation for the plants even in the winter months due to the passive reduction in shading.
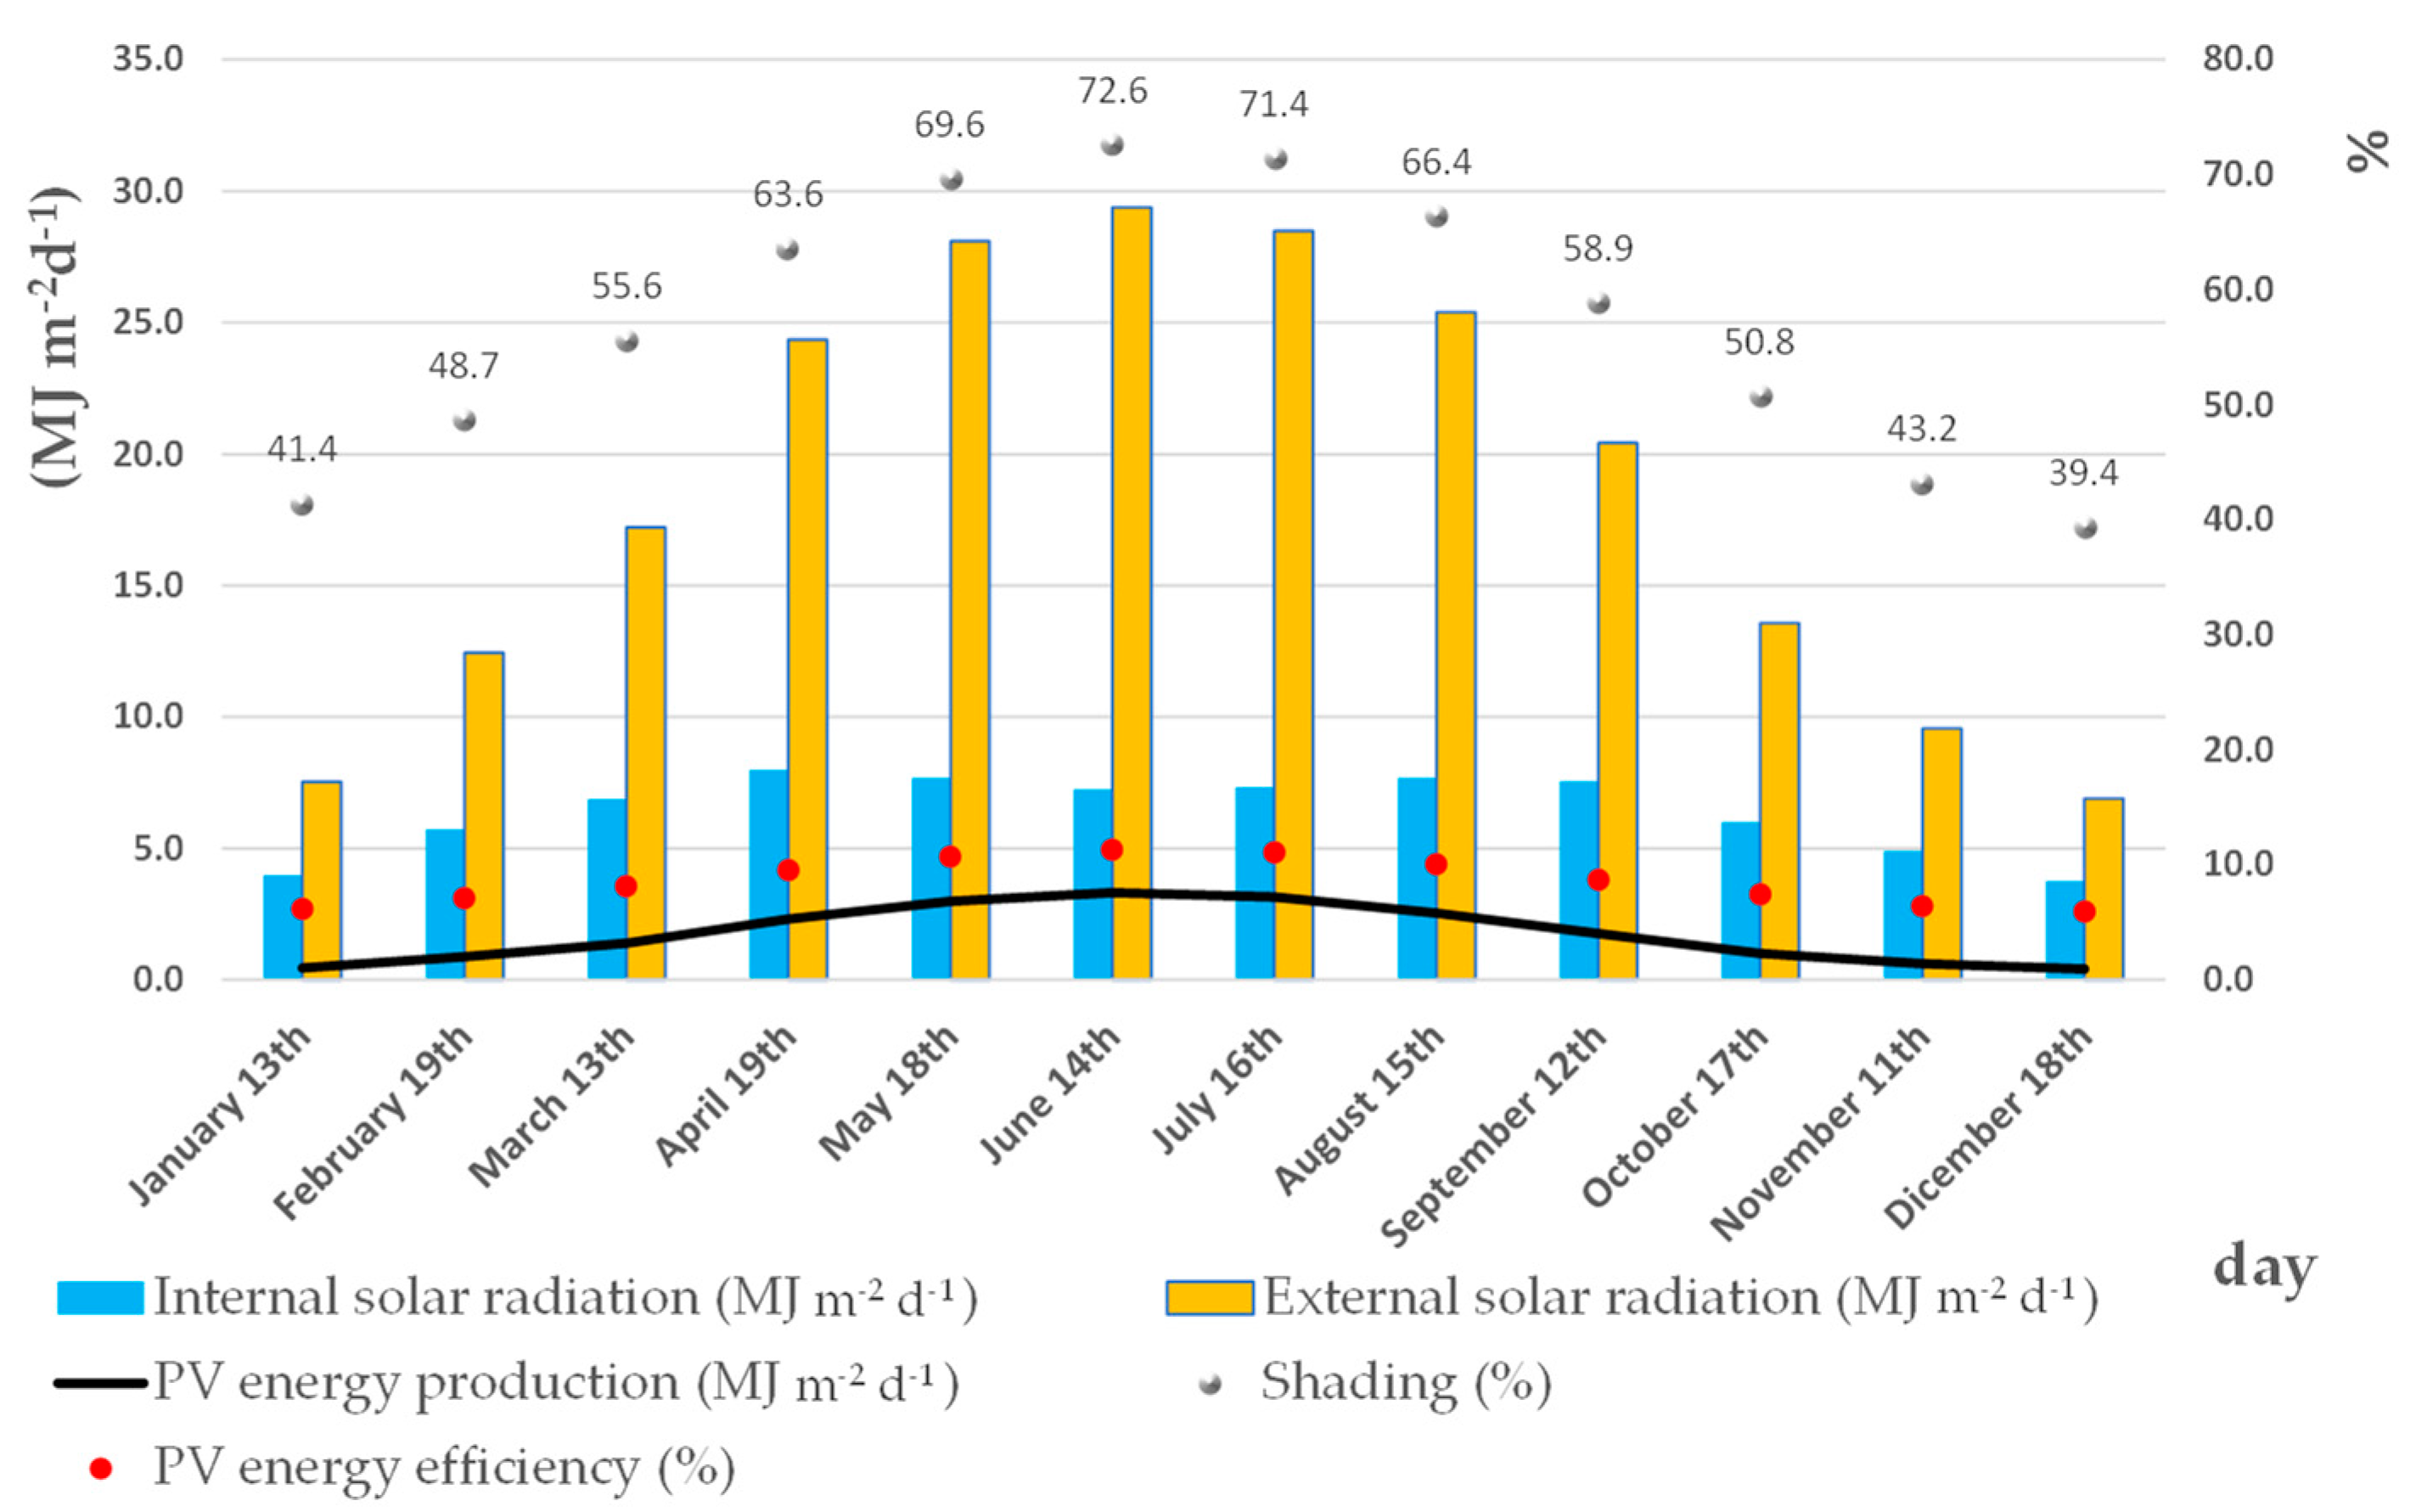
However, the effect due to the reduction in the length of the day remains, which limits the total amount of solar energy that is available to plants each day in the winter months, limiting the effect of the reduction in passive shadowing. Figure 8 shows the values of the total daily energy that were determined with the measured data.
The total amount of solar radiation that is available to the plants each day is almost constant in the period from March 2018 to October 2018, with an average value of 7.3 MJ m−2 d−1. The critical months are January, February, November, and December, with an average total internal radiation of 4.6 MJ m−2 d−1 and this, as mentioned above, is mainly due to the reduction of the day’s length.
Nevertheless, it is interesting to note that the total amount of internal solar radiation in the four critical winter months represents more than 50% of the global external solar radiation. In the summer months, only 25%–30% of the external solar radiation reaches the inside of the greenhouse and, consequently, the crops.
These results are due to the particular shading system that the greenhouse employs, with horizontal and fixed PV panels, in which there is favorable variation in the shading that is caused by the natural variation in the elevation angle of the sun’s rays. As the elevation angle of the sun’s rays increases, the external solar radiation and the degree of shading increase and, consequently, the production of electricity and the efficiency of the photovoltaic panels also increase, according to the trend observed in Figure 8. It should be emphasized, however, that the energy efficiency of the horizontal panels, as compared to those in an optimal position (a 33° elevation angle), is reduced by about one-third. However, the energy produced may still be sufficient for technical installations.
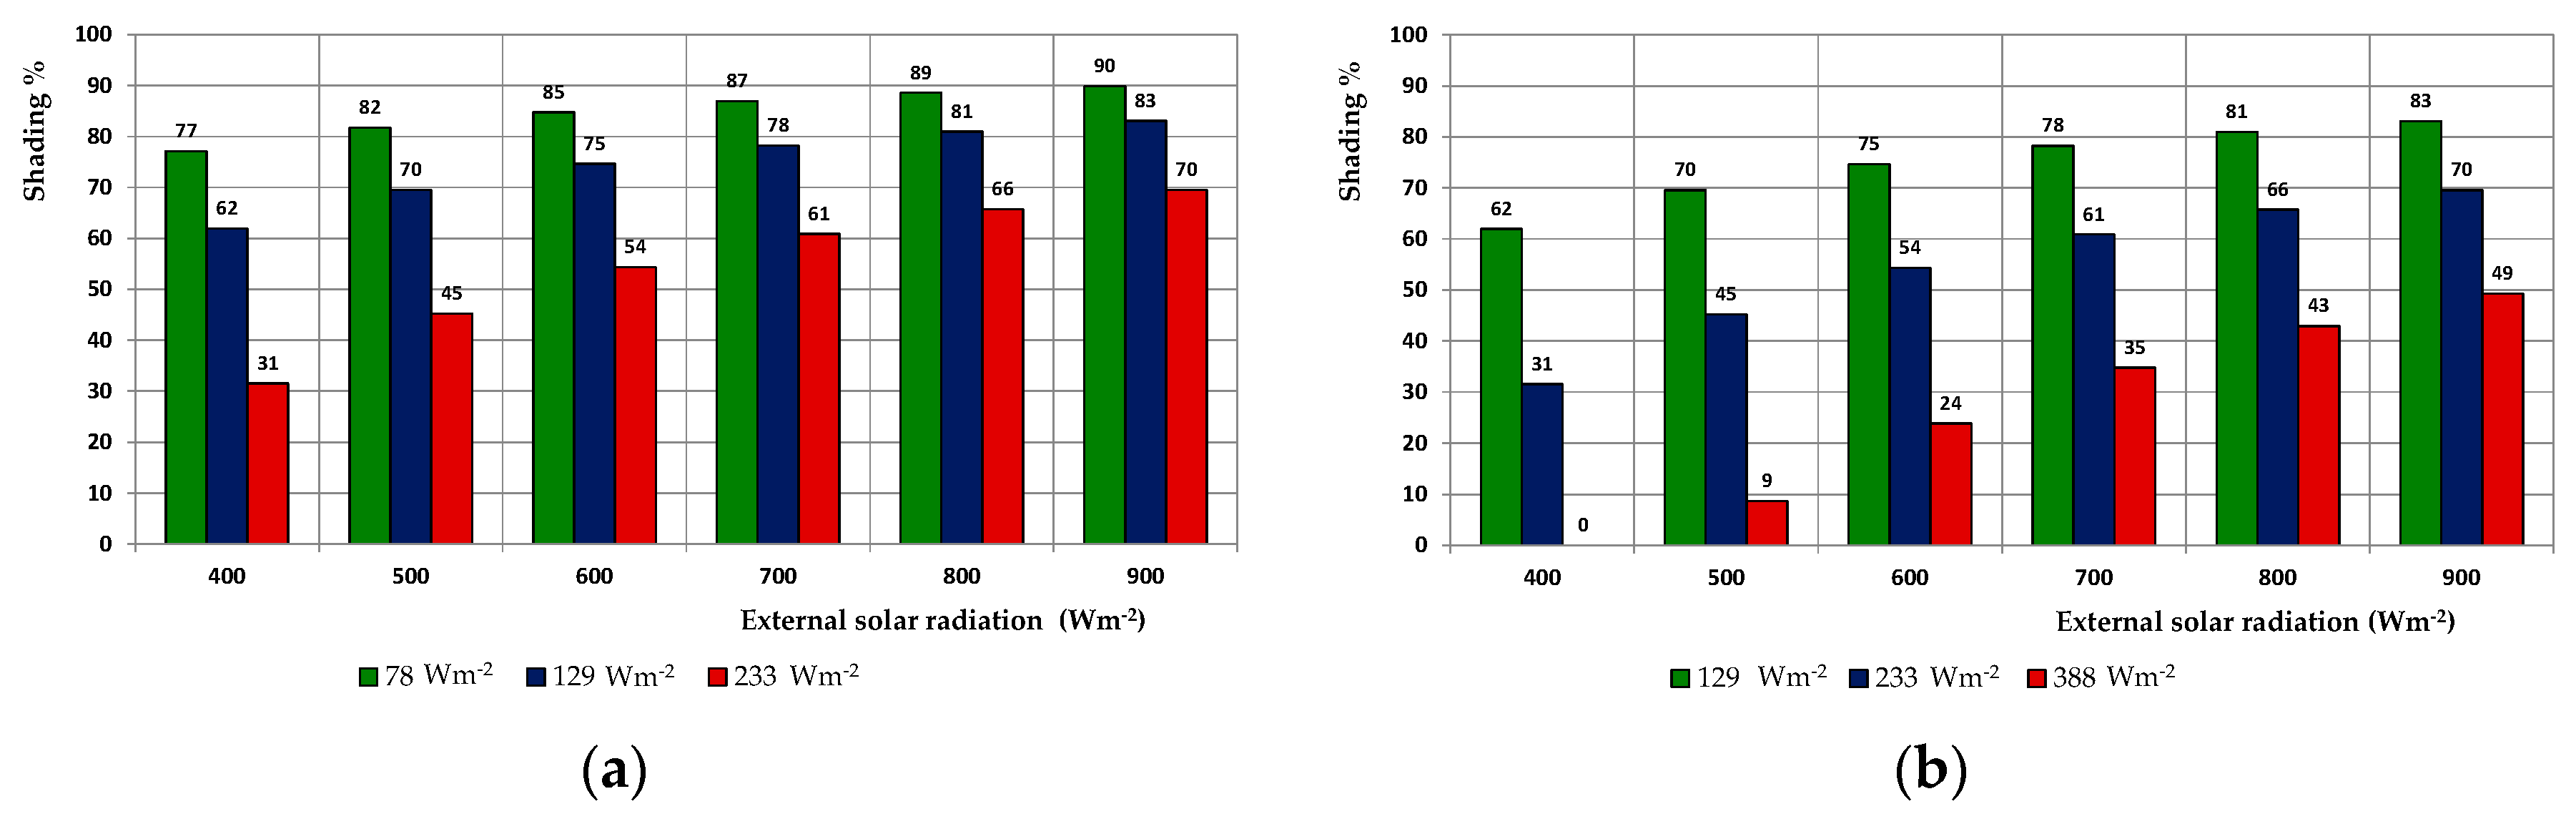
Regarding the growth and optimal development of the plant species shown in Table 2, the minimum and maximum values of the solar radiation thresholds have been reported previously (Table 2). To reach these thresholds, a certain degree of shading is necessary, depending on the global external solar radiation. Figure 9 shows the calculated value of the shading percentage that is necessary to guarantee that the minimum and maximum radiation thresholds are met.
Figure 9a shows the shading values that are necessary to maintain the minimum radiation thresholds (78, 129, and 233 W m−2) needed for the plants grown in the photovoltaic greenhouse based on external solar radiation values of 400, 500, 600, 700, 800, and 900 W m−2, which are typical of Mediterranean areas. Figure 9b instead shows the same comparison, but for the maximum radiation thresholds required by the plants (129, 233, and 388 W m−2). It can be observed that the percentage of required shading increases with the external solar radiation and decreases with the threshold of solar radiation that is necessary for the plants. The values range from a minimum of 31% to a maximum of 90% for the minimum thresholds, while the degree of shading that is necessary for maintaining the maximum thresholds of solar radiation in the greenhouse ranges from a minimum of 0% to a maximum of 83%.
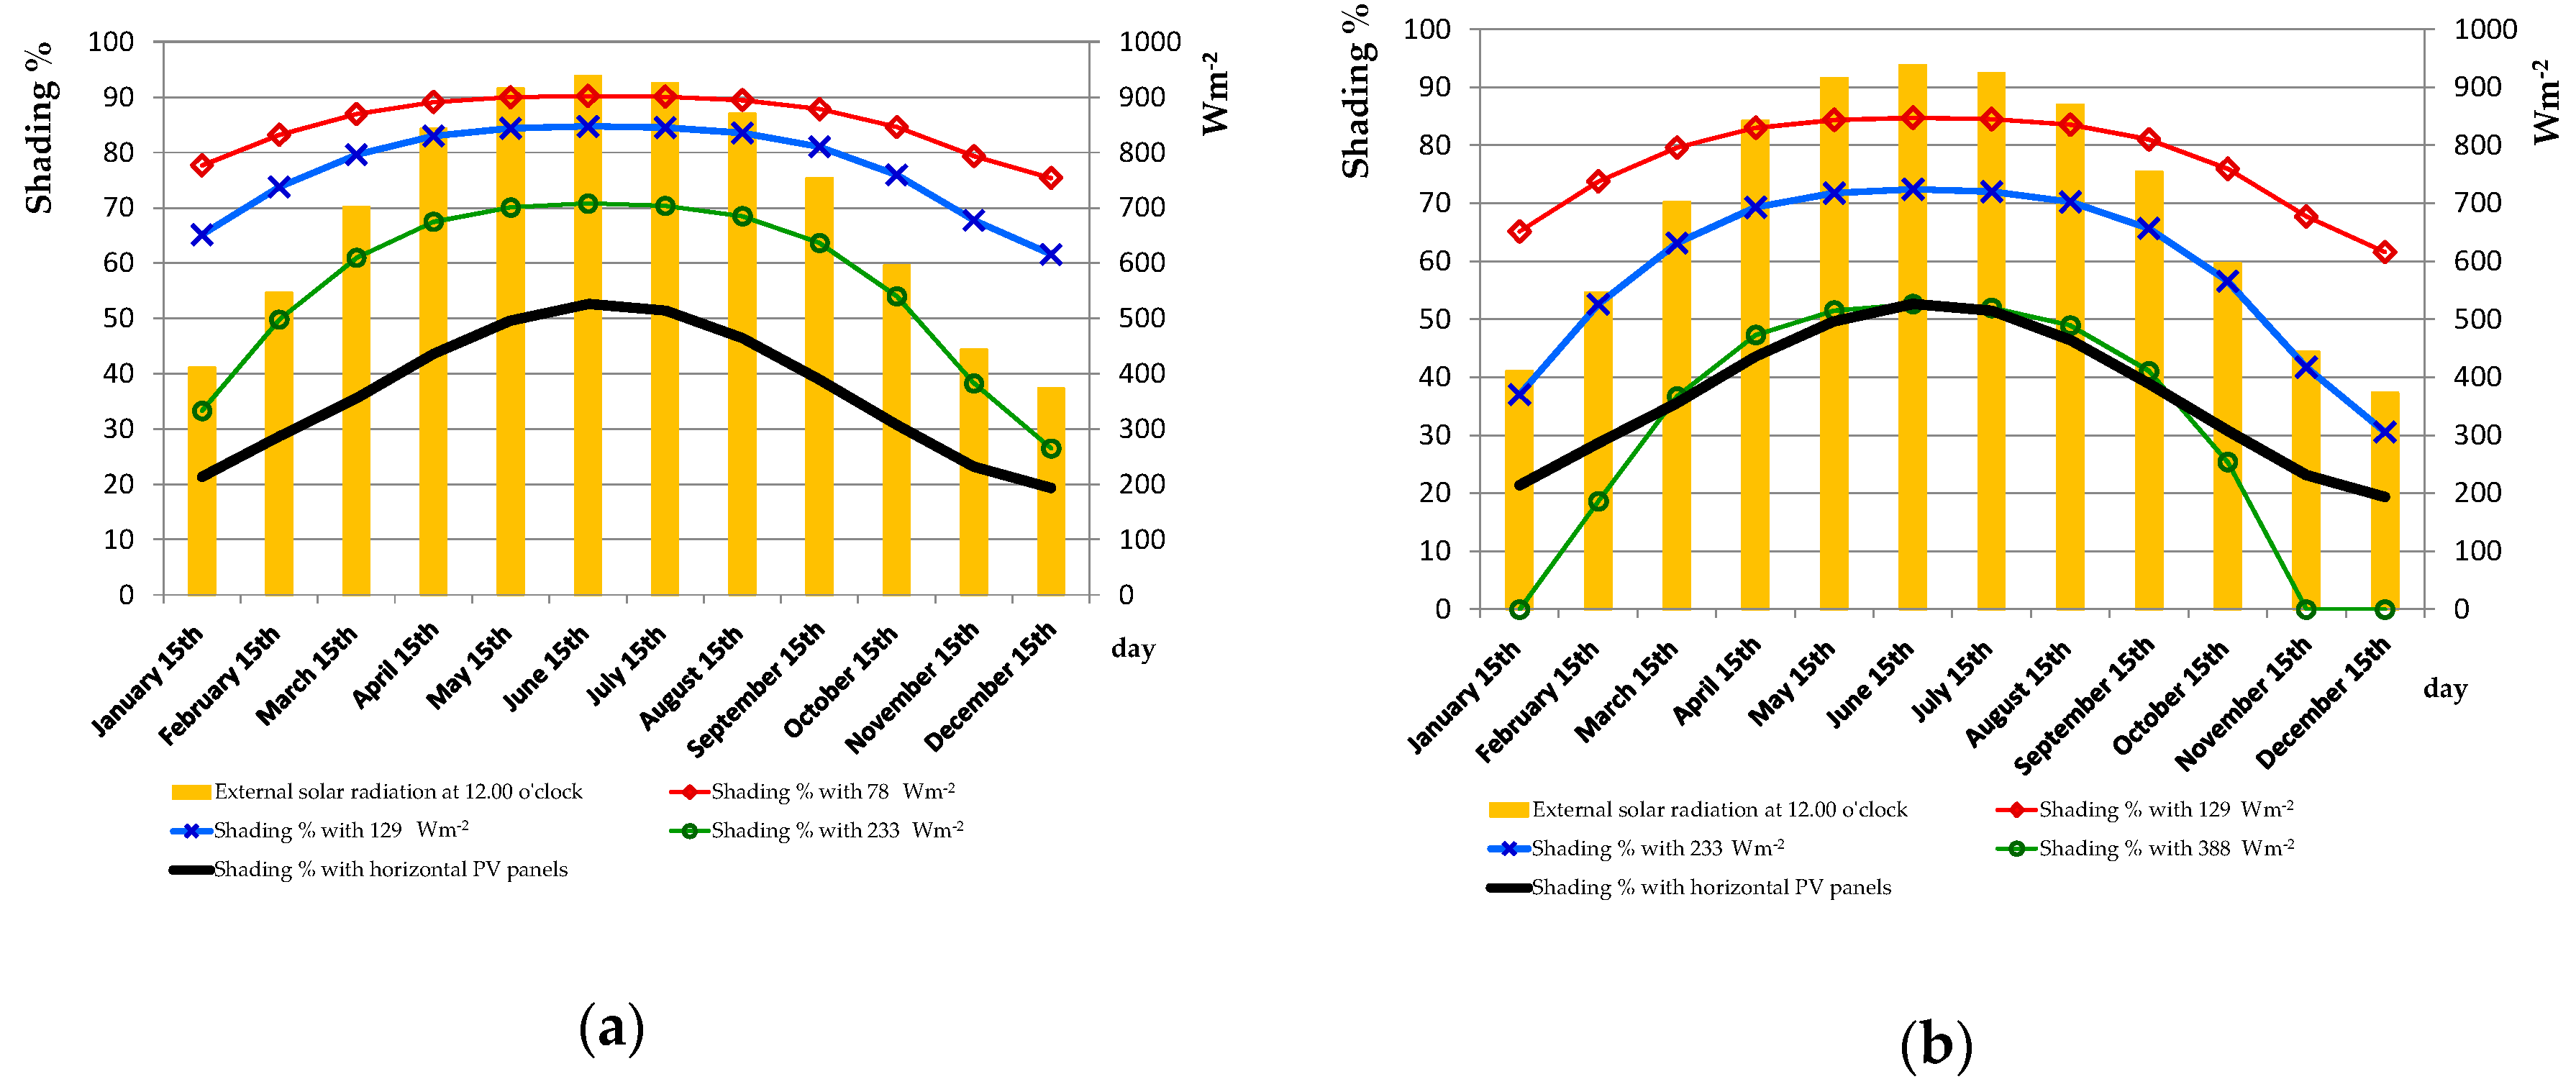
Next, we compared the shading values necessary to reach the thresholds with those obtained from the photovoltaic roof with the fixed and horizontal panels, with reference to the central hours of the day (Figure 10).
Looking at Figure 10a, the degree of shading obtained with the horizontal and fixed PV panels allows for the maintenance of the minimum thresholds of 78, 129, and 233 Wm−2, except in the months of January, November, and December for the threshold of 233 Wm−2. Regarding the maximum threshold, Figure 10b shows that the degree of shading obtained with the studied arrangement of the photovoltaic panels is too high to guarantee the maximum solar radiation limit of 388 Wm−2.
Ultimately, the studied type of photovoltaic greenhouse is very effective and efficient at varying, easily and economically, the shading during the year.
The studied solution, with panels of 20 cm positioned every 27 cm, was found to be appropriate for most of the considered crops (Table 2). The shading was found to be excessive only for the maximum threshold of 388 Wm−2. To reduce the degree of shading, it is necessary to increase the distance between the panels during the design phase. This distance depends on the following parameters: the elevation angle of the sun’s rays, the angle of the pitch height, the width of the PV panel, and the shading of the internal area to be determined based on the needs of the plants that will be grown.
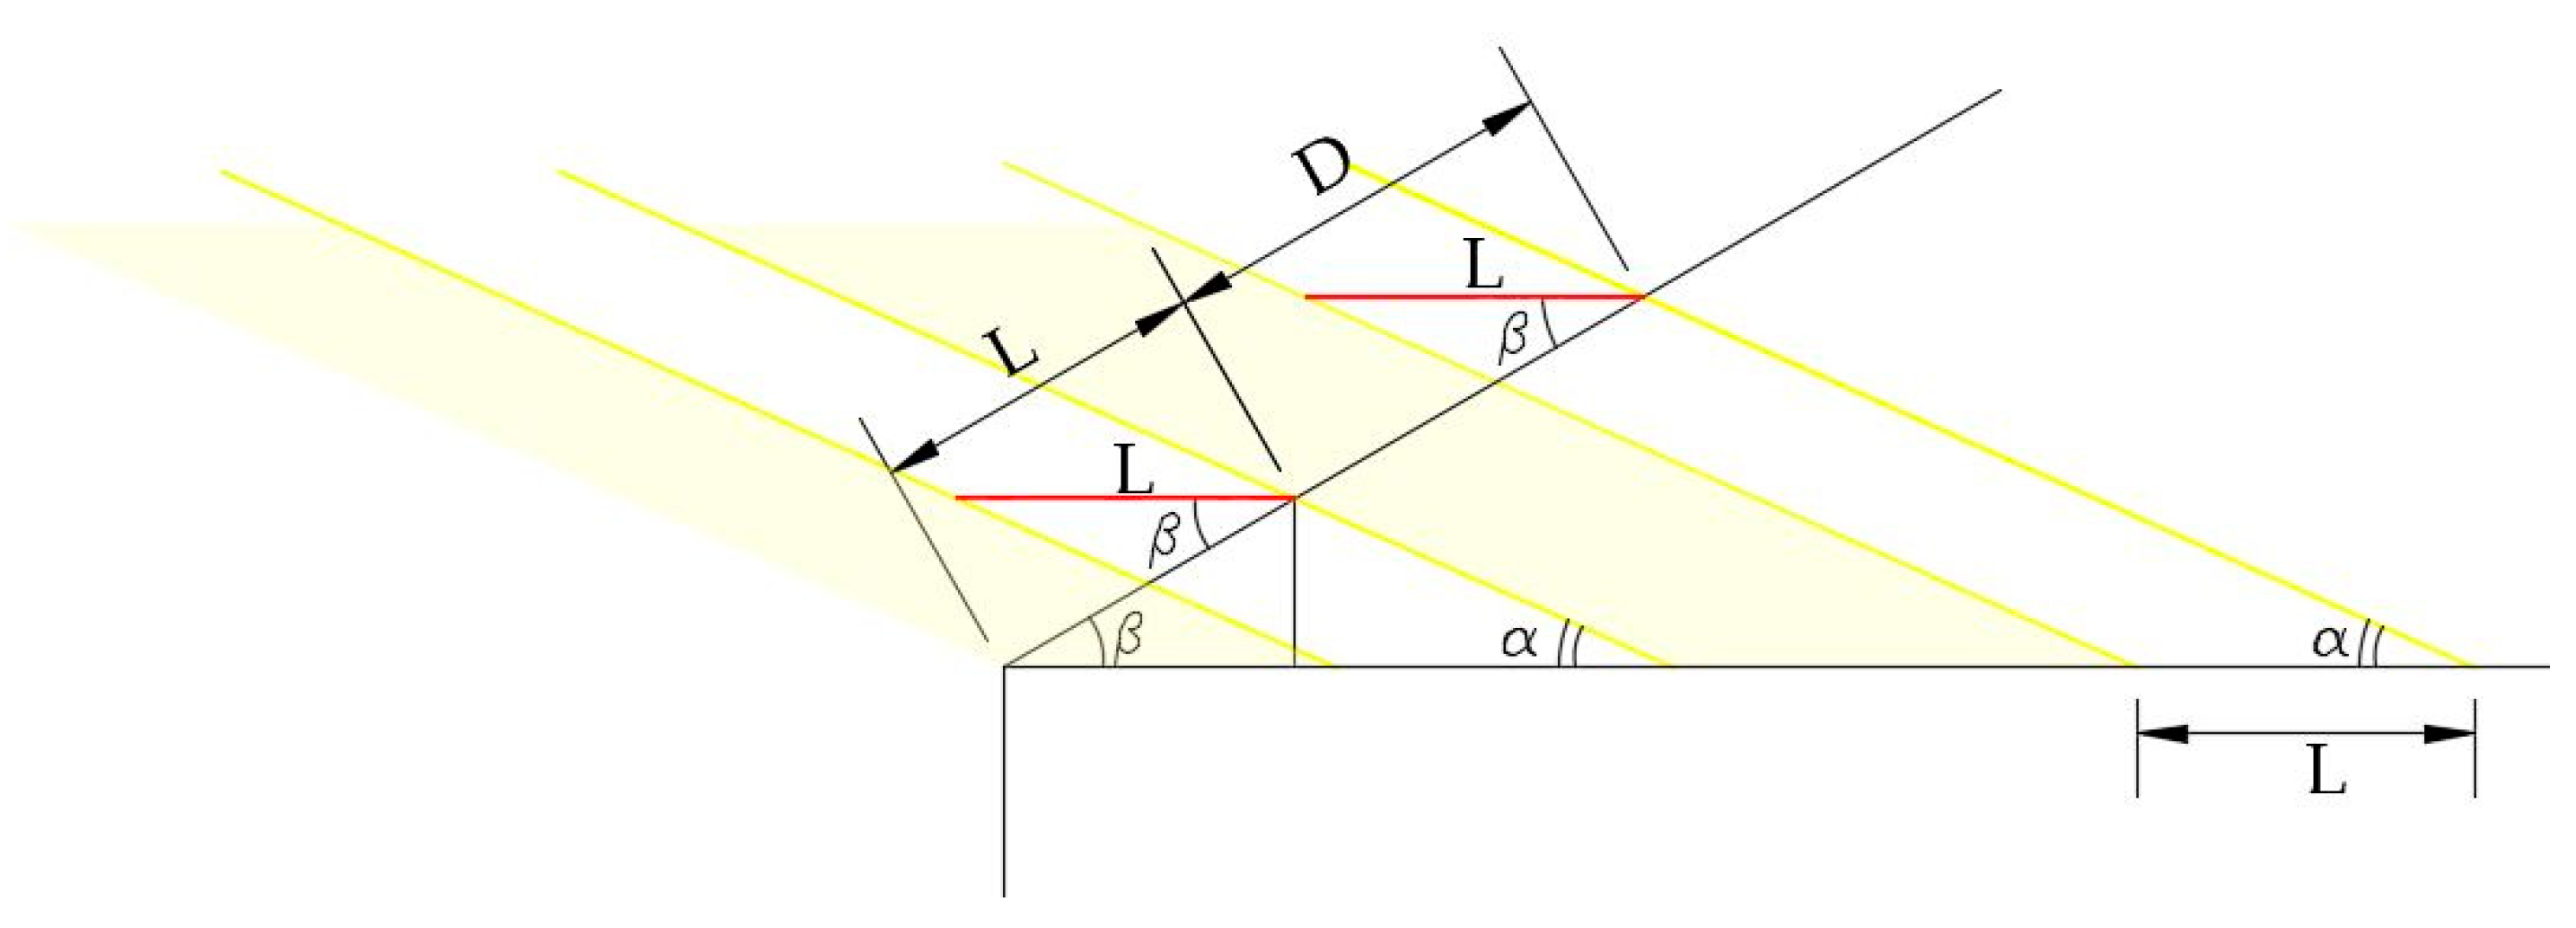
To precisely define the distance between the horizontal and fixed PV panels, the following function has been obtained (Figure 11):
where D = distance between the PV panels, L = width of the PV panels, β = height angle of the pitch, α = elevation angle of the sun’s rays, and Sh = shading.
By applying Formula (6), we found that to reach the maximum solar radiation threshold required by the plants listed in Table 2, the distance between the panels on the roof pitch of the studied prototype greenhouse should be increased by 15 cm, from 27 cm to 42 cm.
Economic Feasibility
Payback periods estimate the length of time (in years) required to recover the cost of an investment, which is calculated by dividing the amount of the initial investment by the cumulative net cash flow for each period. The costs that must be analyzed include the cost of the greenhouse (structure, photovoltaic panels, mirrors, glass, handling system, and storage batteries) and the maintenance and insurance costs (1% of the initial cost) [78]. The payback period calculated with incentive is around 6 years. The estimated annual production of photovoltaic energy supplied to the photovoltaic greenhouse is difficult to assess because it varies with the degree of cloudiness in the sky. In clear skies and at a latitude of 42.2° North, photovoltaic energy production is about 750 kW h.
4. Conclusions
The results obtained from the research described in this paper show that it is possible to vary the shading passively with fixed horizontal PV panels and using the natural variation of the angle of elevation of the sun’s rays. The considerable variation in the elevation angle of the sun’s rays (from 24.4° to 71.1°) was found to result in a high variation in shading (from 39.4% to 72.6%), with the highest values in the summer months and the lowest values in the winter months. This trend is favorable for meeting the PAR needs of greenhouse plants. The energy efficiency of the horizontal PV panels, as compared to those in the optimal position, was reduced by about one-third; however, the amount of energy produced may still be sufficient to make technical installations work. The shading obtained during the year with the fixed horizontal PV panels of the used greenhouse prototype (a panel width of 20 cm, a distance between panels of 27 cm, and a roof pitch height of 33°) allows us to meet the minimum and maximum solar radiation requirements of the plants in most of the considered cases. If the cultivated plants require more solar energy, it is necessary to increase the distance between the panels. A specific mathematical relationship has been established to define the precise distance to be assigned to the photovoltaic panels on the roof pitch. Future research may concern the actual behavior of the plants under this photovoltaic coverage, a more accurate definition of the solar radiation needs of the plants under cultivation, and the use on the roof of photovoltaic elements different from those studied in terms of shape and size.
Author Contributions
Conceptualization, S.M. and A.M.; methodology, A.M.; software, S.M.; validation, S.M.; formal analysis, S.M. and A.M.; investigation, S.M. and A.M.; resources, A.M.; data curation, S.M.; writing—original draft preparation, S.M.; writing—review and editing, S.M.; visualization, S.M.; supervision, A.M.; project administration, A.M.; funding acquisition, A.M.
Funding
This research received no external funding.
Conflicts of Interest
The authors declare no conflict of interest.
References
- Xu, J.; Li, Y.; Wang, R.Z.; Liu, W.; Zhou, P. Experimental performance of evaporative cooling pad systems in greenhouses in humid subtropical climates. Appl. Energy 2015, 138, 291–301. [Google Scholar] [CrossRef]
- Badgery-Parker, J. The Greenhouse; Agnote DPI/249; New South Wales Agriculture: New South Wales, Australia, 1999.
- Daviesa, P.A.; Zaragozab, G. Ideal performance of a self-cooling greenhouse. Appl. Therm. Eng. 2019, 149, 502–511. [Google Scholar] [CrossRef]
- Kadowaki, M.; Yano, A.; Ishizu, F.; Tanak, T.; Noda, S. Effects of greenhouse photovoltaic array shading on Welsh onion growth. Biosyst. Eng. 2012, 111, 290–297. [Google Scholar] [CrossRef]
- Shamshiri, R.; Ismail, W.I.W. A Review of Greenhouse Climate Control and Automation Systems in Tropical Regions. J. Agric. Sci. Appl. 2013, 2, 176–183. [Google Scholar] [CrossRef]
- Hanan, J.J. Greenhouses: Advanced Technology for Protected Horticulture, 1st ed.; CRC Press: Boca Raton, FL, USA, 1998. [Google Scholar]
- Bakker, J.C.; Adams, S.R.; Boulard, T.; Montero, J.I. Innovate technologies for an efficient use of energy. Acta Hortic. 2008, 801, 49–62. [Google Scholar] [CrossRef]
- Naijun Zhou, N.; Yu, Y.; Jinping Yi, J.; Liu, R. A study on thermal calculation method for a plastic greenhouse with solar energy storage and heating. Sol. Energy 2017, 142, 39–48. [Google Scholar] [CrossRef]
- Bailey, B.J. The environment in evaporative cooled greenhouses. Acta Hortic. 1990, 287, 59–66. [Google Scholar]
- Boulard, T.; Baille, A. A simple greenhouse climate control model incorporating effects of ventilation and evaporative cooling. Agric. For. Meteorol. 1993, 65, 145–157. [Google Scholar] [CrossRef]
- Jain, D.; Tiwari, G.N. Modeling and optimal design of evaporative cooling system in controlled environment greenhouse. Energy Convers. Manag. 2002, 43, 2235–2250. [Google Scholar] [CrossRef]
- Leyva, R.; Constán-Aguilar, C.; Sánchez-Rodríguez, E.; Romero-Gámez, M.; Soriano, T. Cooling systems in screenhouses: Effect on microclimate, productivity and plant response in a tomato crop. Biosyst. Eng. 2015, 129, 100–111. [Google Scholar] [CrossRef]
- Ganguly, A.; Ghosh, S. A Review of Ventilation and Cooling Technologies in Agricultural Greenhouse Application. Iran. J. Energy Environ. 2011, 2, 32–46. [Google Scholar]
- Sethi, V.P.; Sharma, S.K. Experimental and economic study of a greenhouse thermal control system using aquifer water. Energy Convers. Manag. 2007, 48, 306–319. [Google Scholar] [CrossRef]
- Sethi, V.P.; Sharma, S.K. Survey of cooling technologies for worldwide agricultural greenhouse applications. Sol. Energy 2007, 81, 1447–1459. [Google Scholar] [CrossRef]
- Kumar, K.S.; Tiwari, K.N.; Jha, M.K. Design and technology for greenhouse cooling in tropical and subtropical regions: A review. Energy Build. 2009, 41, 1269–1275. [Google Scholar] [CrossRef]
- Stanghellini, C.; Van Meurs, W.T.M. Environmental control of greenhouse crop transpiration. J. Agric. Eng. Res. 1992, 51, 297–311. [Google Scholar] [CrossRef]
- Hashem, F.A.; Medany, M.A.; Abd El-Moniem, E.M.; Abdallah, M.M.F. Influence of greenhouse cover on potential evapotranspiration and cucumber water requirements. Ann. Agric. Sci. 2011, 56, 49–55. [Google Scholar] [CrossRef]
- Baille, A.; Kittas, C.; Katsoulas, N. Influence of whitening on greenhouse microclimate and crop energy portioning. Agric. For. Meteorol. 2001, 107, 293–306. [Google Scholar] [CrossRef]
- Mashonjowa, E.; Ronsse, F.; Mhizha, T.; Milford, J.R.; Lemeur, R.; Pieters, J.G. The effects of whitening and dust accumulation on the microclimate and canopy behavior of rose plants (Rosa hybrida) in a greenhouse in Zimbabwe. Sol. Energy 2010, 84, 10–23. [Google Scholar] [CrossRef]
- Willits, D.H. The effect of cloth characteristics on the cooling performance of external shade cloths for greenhouses. J. Agric. Eng. Res. 2001, 79, 331–340. [Google Scholar] [CrossRef]
- Willits, D.H. The effect of cloth temperature on the cooling efficiency of shade cloths in greenhouses. Trans. ASAE 2003, 46, 1215–1221. [Google Scholar] [CrossRef]
- Ghosal, M.K.; Tiwari, G.N.; Srivastava, N.S.L. Modeling and experimental validation of a greenhouse with evaporative cooling by moving water film over external shade cloth. Energy Build. 2003, 35, 843–850. [Google Scholar] [CrossRef]
- Vladimirova, S.V.; Bucklin, R.A.; McConnell, D.B. Influence of shade level, wind velocity, and wind direction on interior air temperature of model shade structures. Trans. ASAE 1996, 39, 1825–1830. [Google Scholar] [CrossRef]
- Soni, P.; Salokhe, V.M.; Tantau, H.J. Effect of screen mesh size on vertical temperature distribution in naturally ventilated tropical greenhouses. Biosyst. Eng. 2005, 92, 469–482. [Google Scholar] [CrossRef]
- Ali, H.M.; Moustafa, S.; El-Mansy, H. An efficient greenhouse design for hot climates. Energy Convers. Manag. 1990, 30, 433–437. [Google Scholar] [CrossRef]
- Kittas, C.; Rigakis, N.; Katsoulas, N.; Bartzanas, T. Influence of shading screens on microclimate, growth and productivity of tomato. Acta Hortic. (ISHS) 2009, 807, 97–102. [Google Scholar] [CrossRef]
- Harmanto, M.; Tantau, H.J.; Salokhe, V.M. Microclimate and air exchange rates in greenhouses covered with different nets in the humid tropics. Biosyst. Eng. 2006, 94, 239–253. [Google Scholar] [CrossRef]
- Al-Helal, I.M. Effects of ventilation rate on the environment of a fan-pad evaporatively cooled shaded greenhouse in extreme arid climates. Appl. Eng. Agric. 2007, 23, 221–230. [Google Scholar] [CrossRef]
- Sandri, M.A.; Andriolo, J.L.; Witter, M.; Dal Ross, T. Effect of shading on tomato plants grow under greenhouse. Hortic. Bras. 2003, 21, 642–645. [Google Scholar] [CrossRef] [Green Version]
- Medany, A.M.; Hassanein, M.K.; Farag, A.A. Effect of black and white nets as alternative covers in sweet pepper production under greenhouses in Egypt. Acta Hortic. (ISHS) 2009, 807, 121–126. [Google Scholar] [CrossRef]
- Briassoulis, D.; Mistriotis, A.; Eleftherakis, D. Mechanical behavior and properties of agricultural nets—Part II: Analysis of the performance of the main categories of agricultural nets. Polym. Test. 2007, 26, 970–984. [Google Scholar] [CrossRef]
- Abdel-Ghany, A.M.; Picuno, P.; Al-Helal, I.; Alsadon, A.; Ibrahim, A.; Shady, M. Radiometric characterization, solar and thermal radiation in a greenhouse as affected by shading configuration in an arid climate. Energies 2015, 8, 13928–13937. [Google Scholar] [CrossRef]
- Kim, G.; Lim, H.S.; Lim, T.S.; Schaefer, L.; Kim, J.T. Comparative advantage of an exterior shading device in thermal performance for residential buildings. Energy Build. 2012, 46, 105–111. [Google Scholar] [CrossRef]
- Kim, S.H.; Shin, K.J.; Choi, B.E.; Jo, J.H.; Cho, S.; Cho, Y.H. A study on the variation of heating and cooling load according to the use of horizontal shading and venetian blinds in office buildings in Korea. Energies 2015, 8, 1487–1504. [Google Scholar] [CrossRef]
- Huang, K.T.; Liu, K.F.R.; Liang, H.H. Design and energy performance of a buoyancy driven exterior shading device for building application in Taiwan. Energies 2015, 8, 2358–2380. [Google Scholar] [CrossRef]
- Picuno, P. Innovative material and improved technical design for a sustainable exploitation of agricultural plastic film. Polym. Plast. Technol. Eng. 2014, 53, 1000–1011. [Google Scholar] [CrossRef]
- Sethi, V.P.; Dubey, R.K.; Dhath, A.S. Design and evaluation of modified screen net house for off-season vegetable raising in composite climate. Energy Convers. Manag. 2009, 50, 3112–3128. [Google Scholar] [CrossRef]
- Schettini, E.; De Salvador, F.R.; Scarascia-Mugnozza, G.; Vox, G. Evaluation of colored nets in peach protected cultivation. Acta Hortic. (ISHS) 2011, 893, 235–242. [Google Scholar] [CrossRef]
- Sica, C.; Picuno, P. Spectro-radiometrical characterization of plastic nets for protected cultivation. Acta Hortic. (ISHS) 2008, 801, 245–252. [Google Scholar] [CrossRef]
- Al-Helal, I.M.; Abdel-Ghany, A.M. Measuring and evaluating solar radiative properties of plastic shading nets. Sol. Energy Mater. Sol. Cells 2011, 95, 677–683. [Google Scholar] [CrossRef]
- Al-Arifi, A.; Short, T.; Ling, P. Influence of shading ratio, air velocity and evapotranspiration on greenhouse crop microclimate. In Proceedings of the ASAE International Meeting, Toronto, ON, Canada, 19–21 July 1999. [Google Scholar]
- Nelson, P.V. Chapter 12. Light and Temperature. In Greenhouse Operation and Management, 6th ed.; Prentice Hall: Englewoods Cliffs, NJ, USA, 2003; p. 400. [Google Scholar]
- Kessler, J.R.; Armitage, A.M. Effects of shading on growth rate, flower initiation and flower development of Begonia semperflorens-cultorum. J. Hortic. Sci. 1992, 67, 849–854. [Google Scholar] [CrossRef]
- Quigley, M.F.; Mulhall, S. Effects of variable shading in a greenhouse study on rhizome weight, root length, and bud proliferation in goldenseal. Hortic. Technol. 2002, 12, 717–720. [Google Scholar] [CrossRef]
- Santos, M.M.; Morales-Payan, J.P.; Bewick, T.A.; Shilling, D.G. Effects of shading on the growth of nutsedges. Weed. Sci. 1997, 45, 670–673. [Google Scholar]
- Thompson, M.; Thompson, E.J. Begonias: The Complete Reference; Times Books: New York, NY, USA, 1981. [Google Scholar]
- Kittas, C.; Bartzanas, T.; Jaffrin, A. Greenhouse evaporative cooling: Measurement and data analysis. Trans. ASAE 2001, 44, 683. [Google Scholar] [CrossRef]
- Glenn, E.P.; Cardran, P.; Thompson, T. Seasonal effects of shading on growth of greenhouse lettuce and spinach. Sci. Hortic. 1984, 24, 231–239. [Google Scholar] [CrossRef]
- Ross, J.; Sulev, M. Sources of errors in measurements of PAR. Agric. For. Meteorol. 2000, 100, 103–125. [Google Scholar] [CrossRef]
- Asrar, G.; Myneni, R.; Kanemasu, E.T. Estimation of plant canopy attributes from spectral reflectance measurements. Theory and application of optical remote sensing. Life Earth Health Sci. 1989, 252–295. Available online: https://eurekamag.com/research/002/100/002100130.php (accessed on 25 August 2019).
- Sun, Z.; Hong, L.; Jingmiao, L.; Guoping, S. Estimation of photosynthetically active radiation using solar radiation in the UV–visible spectral band. Sol. Energy 2017, 153, 611–622. [Google Scholar] [CrossRef]
- Alados, I.; Foyo-Moreno, I.; Alados-Arboledas, L. Photosynthetically active radiation: Measurements and modelling. Agric. For Meteorol. 1996, 78, 121–131. [Google Scholar] [CrossRef]
- FAO. Plant Production and Protection Paper, 90. Protected Cultivation in the Mediterranean Climate; FAO: Rome, Italy, 1990; p. 313. [Google Scholar]
- Andriolo, J.L.A.; Streck, N.A.; Buriol, G.A.; Ludke, L.; Duarte, T.S. Growth, development and dry matter distribution of a tomato crop as affected by environment. J. Hortic. Sci. Biotechnol. 1998, 73, 125–130. [Google Scholar] [CrossRef]
- Lapuerta, J.C. Anatomia y fisiologia de la planta. In El Cultivo del Tomate; Nuez, F., Ed.; Mundi-Prensa: Madrid, Spain, 1995; pp. 43–91. [Google Scholar]
- CTIFL. Maîtrise de la Conduite Climatique; Centre Technique Interprofessionel des Fruits e des Légumes: Paris, France, 1995; p. 127. [Google Scholar]
- Wang, L.; Deng, F.; Ren, W.J. Shading tolerance in rice is related to better light harvesting and use efficiency and grain filling rate during grain filling period. Field Crops Res. 2015, 180, 54–62. [Google Scholar] [CrossRef]
- Li, H.W.; Jiang, D.; Wollenweber, B.; Dai, T.B.; Cao, W.X. Effects of shading on morphology, physiology and grain yield of winter wheat. Eur. J. Agron. 2010, 33, 267–275. [Google Scholar] [CrossRef]
- Kleinhenz, M.D.; French, D.G.; Gazula, A.; Scheerens, J.C. Variety, shading, and growth stage effects on pigment concentrations in lettuce grown under contrasting temperature regimens. Hortic. Technol. 2003, 13, 677–683. [Google Scholar] [CrossRef]
- Marchiori, P.E.R.; Machado, E.C.; Ribeiro, R.V. Photosynthetic limitations imposed by self-shading in field-grown sugarcane varieties. Field Crops Res. 2014, 155, 30–37. [Google Scholar] [CrossRef]
- Caradus, J.R.; Chapman, D.F. Variability of stolon characteristics and response to shading in two cultivars of white clover (Trifolium repens L.). N. Z. J. Agric. Res. 1991, 34, 239–247. [Google Scholar] [CrossRef]
- Vityakon, P.; Sae-Lee, S.; Seripong, S. Effects of tree leaf litter and shading on growth and yield of paddy rice in northeast Thailand. Kasesart J. Nat. Sci. 1993, 27, 219–222. [Google Scholar]
- Allison, J.C.S.; Williams, H.T.; Pammenter, N.W. Effect of specific leaf nitrogen content on photosynthesis of sugarcane. Ann. Appl. Biol. 1997, 131, 339–350. [Google Scholar] [CrossRef]
- Li, H.; Zhao, C.; Huang, W.; Yang, G. Non-uniform vertical nitrogen distribution within plant canopy and its estimation by remote sensing. Field Crops Res. 2013, 142, 75–84. [Google Scholar] [CrossRef]
- Lemaire, G.; Van Oosterom, E.; Sheehy, J.; Jeuffroy, M.H.; Massignam, A.; Rossato, L. Is crop N demand more closely related to dry matter accumulation or leaf area expansion during vegetative growth? Field Crops Res. 2007, 100, 91–106. [Google Scholar] [CrossRef]
- Cai, Z.Q. Shade delayed flowering and decreased photosynthesis, growth and yield of Sacha Inchi (Plukenetia volubilis) plants. Ind. Crops Prod. 2011, 34, 1235–1237. [Google Scholar] [CrossRef]
- Aloni, B.; Karni, L.; Rylski, I.; Zaidman, Z. The effect of nitrogen fertilization and shading on the incidence of color spots in sweet pepper (Capsicum annuum) fruit. J. Hortic. Sci. Biotechnol. 1994, 69, 767–773. [Google Scholar] [CrossRef]
- Cockshull, K.E.; Graves, C.J.; Cave, C.R.J. The influence of shading on yield of glasshouse tomatoes. J. Hortic. Sci. 1992, 67, 11–24. [Google Scholar] [CrossRef]
- Kosma, C.; Triantafyllidis, V.; Papasavvas, A.G.; Salahas, G.; Patakas, A. Yield and nutritional quality of greenhouse lettuce as affected by shading and cultivation season. Emir. J. Food Agric. 2013, 25, 974–979. [Google Scholar] [CrossRef]
- Shifriss, C.; Pilowsky, M.; Benyamin Aloni, B. Variation in flower abscission of peppers under stress shading conditions. Euphytica 1994, 78, 133–136. [Google Scholar]
- Adams, S.R.; Valdes, V.M.; Cave, C.R.J.; Fenlon, J.S. The impact of changing light levels and fruit load on the pattern of tomato yields. J. Hortic. Sci. Biotechnol. 2001, 76, 368–374. [Google Scholar] [CrossRef]
- Ilić, Z.S.; Milenković, L.; Stanojević, L.; Cvetković, D.; Fallik, E. Effects of the modification of light intensity by color shade nets on yield and quality of tomato fruits. Sci. Hortic. 2012, 139, 90–95. [Google Scholar] [CrossRef]
- El-Gizawy, A.M.; Abdallah, M.M.F.; Gomaa, H.M.; Mohamed, S.S. Effect of different shading levels on tomato plants 2. Yield and fruit quality. Acta Hortic. 1992, 323, 349–354. [Google Scholar] [CrossRef]
- El-Aidy, F.; El-Afry, M. Influence of shade on growth and yield of tomatoes cultivated during the summer season in Egypt. Plasticulture 1983, 47, 2–6. [Google Scholar]
- Dupraz, C.; Marrou, H.; Talbot, G.; Dufour, L.; Nogier, A.; Ferard, Y. Combining solar photovoltaic panels and food crops for optimising land use: Towards new agrivoltaic schemes. Renew. Energy 2010, 36, 2725–2732. [Google Scholar] [CrossRef]
- Cossu, M.; Cossu, A.; Deligios, P.A.; Ledda, L.; Li, Z.; Fatnassie, H.; Poncete, C.; Yano, Y. Assessment and comparison of the solar radiation distribution inside the main commercial photovoltaic greenhouse types in Europe. Renew. Sustain. Energy Rev. 2018, 94, 822–834. [Google Scholar] [CrossRef]
- Marucci, A.; Cappuccini, A. Dynamic photovoltaic greenhouse: Energy efficiency in clear sky conditions. Appl. Energy 2016, 170, 362–376. [Google Scholar] [CrossRef]
- Stagnari, F.; Galieni, A.; Pisante, M. Shading and nitrogen management affect quality, safety and yield of greenhouse-grown leaf lettuce. Sci. Hortic. 2015, 192, 70–79. [Google Scholar] [CrossRef]
- Allardyce, C.S.; Fankhauser, C.; Zakeeruddin, S.M.; Grätzel, M.; Dyson, P.J. The influence of greenhouse-integrated photovoltaics on crop production. Sol. Energy 2017, 155, 517–522. [Google Scholar] [CrossRef]
- Gent, M.P.N. Effect of degree and duration of shade on quality of greenhouse tomato. Hortic. Sci. 2007, 42, 514–520. [Google Scholar] [CrossRef]
- Gent, M.P.N. Density and duration of shade affect water and nutrient use in greenhouse tomato. J. Am. Soc. Hortic. Sci. 2008, 133, 619–627. [Google Scholar] [CrossRef]
- Marucci, A.; Cappuccini, A. Dynamic photovoltaic greenhouse: Energy balance in completely clear sky condition during the hot period. Energy 2016, 102, 302–312. [Google Scholar] [CrossRef]
- Moretti, S.; Marucci, A. A Photovoltaic Greenhouse with Variable Shading for the Optimization of Agricultural and Energy Production. Energies 2019, 12, 2589. [Google Scholar] [CrossRef]
- ASTM International. Available online: http://www.astm.org (accessed on 10 June 2019).
- NREL Transforming ENERGY Solar Spectral. Available online: https://www.nrel.gov/grid/solar-resource/spectra.html (accessed on 10 June 2019).
- Gueymard, C. Parameterized transmittance model for direct beam and circumsolar spectral irradiance. Sol. Energy 2001, 71, 325–346. [Google Scholar] [CrossRef]
- Gueymard, C. The sun’s total and spectral irradiance for solar energy applications and solar radiation models. Sol. Energy 2002, 76, 443–467. [Google Scholar] [CrossRef]
- Albright, L.D. Plant Growth Chamber Handbook; Iowa Agriculture and Home Economics Experiment Station Special Report No. 99; Cornell University: Ithaca, NY, USA, 1998. [Google Scholar]
Figure 1.
A three-dimensional (3D) model, created with AutoCAD, of the dynamic photovoltaic (PV) greenhouse prototype in which the PV panels and mirrors are visible.
Figure 1.
A three-dimensional (3D) model, created with AutoCAD, of the dynamic photovoltaic (PV) greenhouse prototype in which the PV panels and mirrors are visible.

Figure 2.
Photovoltaic panels in the fixed horizontal position and the different inclination angles of the sun’s rays during the year. The values refer to the 15th of each month. The latitude is 42.2° North.
Figure 2.
Photovoltaic panels in the fixed horizontal position and the different inclination angles of the sun’s rays during the year. The values refer to the 15th of each month. The latitude is 42.2° North.

Figure 3.
Functioning of aluminum reflective mirrors.

Figure 4.
The greenhouse prototype with PV panels fixed in the horizontal position and reflective mirrors aligned with the sun’s rays.
Figure 4.
The greenhouse prototype with PV panels fixed in the horizontal position and reflective mirrors aligned with the sun’s rays.

Figure 5.
The elevation angle of the sun’s rays and the percentage shading (%Sh) with the fixed horizontal panels at a latitude of 42.2° North and calculated on the 15th day of each month.
Figure 5.
The elevation angle of the sun’s rays and the percentage shading (%Sh) with the fixed horizontal panels at a latitude of 42.2° North and calculated on the 15th day of each month.


Figure 6.
The solar spectral irradiance and photosynthetic active radiation (PAR) (μ mol s−1 m−2).

Figure 7.
Annual distribution of internal solar radiation for different percentage shading (%Sh) and PV energy production.
Figure 7.
Annual distribution of internal solar radiation for different percentage shading (%Sh) and PV energy production.


Figure 8.
The total available internal solar radiation, the PV energy production and efficiency under different degrees of shading, and the maximum value of the internal solar radiation for the considered days.
Figure 8.
The total available internal solar radiation, the PV energy production and efficiency under different degrees of shading, and the maximum value of the internal solar radiation for the considered days.

Figure 9.
(a) Percentage of shading in the photovoltaic greenhouse to guarantee that the minimum radiation threshold that is necessary for the plants is met; (b) percentage of shading in the photovoltaic greenhouse to guarantee that the maximum threshold that is necessary for the plants is met.
Figure 9.
(a) Percentage of shading in the photovoltaic greenhouse to guarantee that the minimum radiation threshold that is necessary for the plants is met; (b) percentage of shading in the photovoltaic greenhouse to guarantee that the maximum threshold that is necessary for the plants is met.

Figure 10.
(a) Comparison of the percentage of shading available in the greenhouse with the fixed horizontal PV panels and the percentage of shading necessary to guarantee the minimum threshold; (b) comparison of the percentage of shading available in the greenhouse with the fixed horizontal PV panels and the percentage of shading necessary to guarantee the maximum threshold.

Figure 11.
Parameters for calculating the distance D between the PV panels.


Table 1.
Geometric characteristics of the prototype greenhouse.
| Geometric Elements | Dimensions | Unit of Measure |
|---|---|---|
| Length | 3.79 | m |
| Width | 2.41 | m |
| Ridge height | 2.05 | m |
| Eave height (south wall) | 0.94 | m |
| Eave height (north wall) | 1.36 | m |
| Photovoltaic surface | 8.15 | m2 |
| Photovoltaic pitch slope (south) | 33 | ° |
| Non-photovoltaic pitch slope (north) | 51 | ° |
| Glass thickness | 3 | mm |
Table 2.
Minimum and maximum levels of PAR (μmol m−2 s−1) required by some plant species and converted into visible solar radiation (W m−2).
Table 2.
Minimum and maximum levels of PAR (μmol m−2 s−1) required by some plant species and converted into visible solar radiation (W m−2).
| Plant Species | PAR (μ mol s−1 m−2) | Solar Radiation (W m−2) |
|---|---|---|
| African Violet (Saintpaulia ionantha) | 150–250 | 78–129 |
| Ornamental leaf plants | 150–250 | 78–129 |
| Carnation (Dianthus caryophyllus) | 250–450 | 129–233 |
| Chrysanthemum (Dendranthema grandiflorum) | 250–450 | 129–233 |
| Lily (Lilium spp.) | 250–450 | 129–233 |
| Geranium (Pelargonium spp.) | 250–450 | 129–233 |
| Poinsettia (Euphorbia pulcherrima) | 250–450 | 129–233 |
| Cucumber (Cucumis sativus L.) | 250–450 | 129–233 |
| Lettuce (Lactuca sativa L.) | 250–450 | 129–233 |
| Cultivated strawberry (Fragaria x ananassa Duch) | 250–450 | 129–233 |
| Rose (Rosa multiflora Thunb) | 450–750 | 233–388 |
| Tomato (Lycopersicon esculentum) | 450–750 | 233–388 |
© 2019 by the authors. Licensee MDPI, Basel, Switzerland. This article is an open access article distributed under the terms and conditions of the Creative Commons Attribution (CC BY) license (http://creativecommons.org/licenses/by/4.0/).
Share and Cite
MDPI and ACS Style
Moretti, S.; Marucci, A. A Photovoltaic Greenhouse with Passive Variation in Shading by Fixed Horizontal PV Panels. Energies 2019, 12, 3269. https://doi.org/10.3390/en12173269
AMA Style
Moretti S, Marucci A. A Photovoltaic Greenhouse with Passive Variation in Shading by Fixed Horizontal PV Panels. Energies. 2019; 12(17):3269. https://doi.org/10.3390/en12173269
Chicago/Turabian StyleMoretti, Simona, and Alvaro Marucci. 2019. "A Photovoltaic Greenhouse with Passive Variation in Shading by Fixed Horizontal PV Panels" Energies 12, no. 17: 3269. https://doi.org/10.3390/en12173269
Note that from the first issue of 2016, this journal uses article numbers instead of page numbers. See further details here.