Online Remaining Useful Life Prediction for Lithium-Ion Batteries Using Partial Discharge Data Features
by
 , , , ,
Muhammad Umair Ali
1 ,
,
Amad Zafar
2,
Sarvar Hussain Nengroo
1 ,
,
Sadam Hussain
1 ,
,
Gwan-Soo Park
1 and
Hee-Je Kim
1,* 1
School of Electrical Engineering, Pusan National University, Pusan 46241, Korea
2
Department of Electrical Engineering, Wah Engineering College, University of Wah, Wah Cantt 47040, Pakistan
*
Author to whom correspondence should be addressed.
Energies 2019, 12(22), 4366; https://doi.org/10.3390/en12224366
Submission received: 20 October 2019
/
Revised: 11 November 2019
/
Accepted: 13 November 2019
/
Published: 15 November 2019
(This article belongs to the Special Issue Battery Aging and Life Prediction for Electric Vehicles, Energy Storage Systems and Portable Electronics)
Abstract
:Online accurate estimation of remaining useful life (RUL) of lithium-ion batteries is a necessary feature of any smart battery management system (BMS). In this paper, a novel partial discharge data (PDD)-based support vector machine (SVM) model is proposed for RUL prediction. The proposed algorithm extracts the critical features from the voltage and temperature of PDD to train the SVM models. The classification and regression attributes of SVM are utilized to classify and predict accurate RUL. The different ranges of PDD were analyzed to find the optimal range for training the SVM model. The SVM model trained with optimal PDD features classifies the RUL into six different classes for gross estimation, and the support vector regression is used to estimate the accurate value of the last class. The classification and predictive performance of SVM model trained using the full discharge data and PDD are compared for publicly available data. Results show that the SVM classification and regression model trained with PDD features can accurately predict the RUL with low storage pressure on BMS. The PDD-based SVM model can be utilized for online RUL estimation in electric vehicles.
1. Introduction
With the ongoing increase in oil prices and environmental pollution, different types of electric vehicles (EVs) are becoming a secondary source of transportation [1]. The EVs are expected to penetrate the present transportation market, and around 100 million EVs are expected to be on-road by the end of 2050 [2]. The energy storage system (ESS) and motors are the main parts of EVs. Due to their high energy density, long lifetime, low weight, and low self-discharge rate, lithium-ion batteries are currently considered as an optimal choice for the ESS of EVs and smart grids [3,4,5]. A smart battery management system (BMS) is necessary to ensure a safe and reliable function under rough conditions [6,7]. The accurate online estimation of the state of health (SOH), remaining useful life (RUL), and state of charge (SOC) of the battery are essential parts of a smart BMS. The SOH specifies the time to replace battery packs [8], RUL shows the remaining number of cycles within satisfactory performance [9], and SOC indicates the remaining available charge of the battery [10,11]. There are several of techniques reported in the literature to estimate the SOC of the battery [12,13]. The accurate SOH estimation of battery is important to avoid over-charge/over-discharge condition.
Numerous studies have been reported in the literature to estimate the SOH and RUL of lithium-ion batteries [14], which can be categorized into four distinct methods: (i) direct measurement methods; (ii) model-based methods; (iii) data-driven methods, and (iv) hybrid methods. In the direct measurement methods, the SOH of the battery is estimated by utilizing a lookup table that defines the relationship between the open-circuit voltage/internal resistance and SOH of the battery [15]. The relationship between internal resistance and temperature is required to be established for SOH estimation [16,17]. These methods are quite simple to implement but they require a rigorous testing and highly accurate measurement instruments to estimate the SOH.
Model-based methods are most widely studied techniques for estimation of the battery state [18]. In model-based methods, the adaptive filters and adaptive observers are mostly employed for estimation of lithium-ion batteries states. Adaptive filters consist of Kalman filter family [19], particle filters [20,21], and H infinity filters. In a study [22], the Kalman filter and unscented Kalman filter were utilized to estimate the SOC and SOH of the battery. The genetic algorithm was also used to determine the parameters of an electric circuit model [23]. Results showed that their proposed technique determines the battery degradation with high accuracy. Kim et al. [24] utilized a dual-sliding-mode observer to check the behaviors of resistance and capacity degradation in real-time. The model-based methods are highly accurate for real-time applications, but these methods have very high complexity.
The data-driven models are empirical or semiempirical models that are created using routinely gathered data. These models were constructed by utilizing the probabilistic, statistical, and machine learning-based approaches. These methods did not require any information regarding the complex electrochemical operation of the battery, but they required plenty of experimental data for training. Data-driven methods such as neural network [25], Bayesian network [26], relevance vector machine [27], Gaussian process regression [27], autoregressive moving average [28], and support vector machines [9] are extensively employed to estimate the RUL of the lithium-ion battery. Tang et al. [29] proposed a Brownian motion-based RUL predictor. They utilized the truncated normal distribution to estimate the exact and closed-form of RUL distribution; the maximum likelihood estimation method was used to improve the estimation accuracy. In another study [30], fractional Brownian motion a variant of Brownian motion was utilized to estimate the exact value of RUL. In [31], the neural network was trained to estimate the RUL by utilizing the features of the terminal voltage of the battery. Although, their proposed model shows high accuracy but it requires a large amount of data for training. Selina et al. [26] trained the naive Bayes model to predict the RUL of the lithium-ion battery. Like a neural network, the accuracy of the Bayes model mainly depends upon the volume of training data. To overcome this issue, the support vector machine (SVM)/support vector regression (SVR) methods are applied to estimate the RUL. Comparatively, SVM/SVR utilized less amount of training data samples. This method converts the low dimensional space nonlinear into a high dimensional space linear problem. In [32], resistance and capacity were considered to estimate the SOH of the battery, and the SVM model was trained to determine the terminal voltage of the lithium-ion battery. Recently, Zhao et al. [9] used the time intervals of an equal charging and discharging voltage differences as a feature to train the SVR model. The features extracted from partial voltage charging data was utilized for the training of the SVM model to predict the SOH [33]. Patil et al. [34] classified the battery RUL into four different classes, and they trained a regression model to measure the exact value of RUL for the last class. They utilized complete data of discharging for extraction of the features that required a large amount of data to build and train the SVM model. As the size of training data sets increase, the number of support vectors also increase linearly, which means that it requires more time for training as well as for prediction. Beside it, in real time the battery is not likely to fully discharged during every cycle.
In this paper, two real-time measurable battery parameters of the partial discharging data (PDD) were analyzed, one is partial discharge voltage (PDV) data, and the other is partial discharge temperature (PDT) data. The SVM model was trained using different ranges of PDV and PDT. The optimum range of PDD was determined after the comprehensive training and testing of SVM. The proposed methodology classified the RUL into six different classes, and the regression model was only applied to train the last class (i.e., sixth class). The classification before the regression step eliminates the need to perform regression across the complete battery life cycle data, which results in less computational complexity. The different lithium-ion battery was tested to validate the classification and prediction accuracy of the proposed algorithm.
2. Remaining Useful Life (RUL)
In this work, the RUL of a lithium-ion battery expressed in terms of its capacity, it can be written as:
where , , and denotes the present capacity, nominal capacity, and end-of-life capacity of the lithium-ion battery, respectively. The online measurement of the capacity of lithium-ion batteries is not a simple task because it cannot be measured directly using any sensor [33]. The most accurate and commonly used method is the offline discharge test. In this method, the battery is discharged at some certain constant conditions such as temperature and discharge current. This method cannot be employed for online prediction, and it is also very time-consuming. For the online measurement of RUL, the online extraction of features from battery data is very pivotal. The selected features should show good variation against battery capacity for accurate RUL prediction.
In this work, publicly available battery cycling data is utilized (provided by the Prognostics Center of Excellence at the NASA Ames Research Center, Washington, DC, USA) [35]. The cyclic battery data contains battery voltage, battery current, load voltage, load current, time, battery capacity, and battery temperature values. The specifications and operating conditions of the battery data used in this work are listed in Table 1.
The parameters of the battery vary with the increase of the cycle number. Figure 1a,b show some of the battery discharging parameters profile of B0005 lithium-ion battery.
Figure 1a,b show the profiles of the discharging voltage and temperature of the lithium-ion battery. It is evident from Figure 1 that the battery degradation has a direct relation with these battery parameters. The battery temperature increased rapidly as the cycle number increases. This employs that the relation between RUL and variation of these discharging parameters can be established for prediction of RUL, which is also discussed in [34].
In this work, the novel RUL prediction approach has been proposed based upon PDV and its corresponding PDT data. The partial data region of the discharging voltage curve selected in a way that every discharge cycle number should reflect in that region. Figure 2a,b show the discharging voltage data of two different regions (3.75–3.5) and (3.1–2.85).
The selection of a voltage region is a very important part, because if the regions do not reflect every cycle data in it, then it will be difficult to estimate the correct value of RUL. The range of the region should be chosen optimally so that the data storage size should be reduced without affecting its prediction accuracy.
3. Classification and Regression Using Support Vector Machine
3.1. Support Vector Machine
This section briefly explains the fundamental idea of SVM to solve classification and regression problems [36,37]. In classification mode, the SVM supervised classifier that can describe several classes (two or more) by calculating the maximum class separation (the so-called maximum margin hyperplane). In this algorithm, the highly nonlinear input data mapped into a high dimensional feature space. It tries to increase the distance between the hyperplanes and the nearest training data point, also known as support vectors (SVs). For simplification purposes, the algorithm is presented here is for a case of a binary classification problem. The splitting hyperplane for data set is given by the following equation, where is the input and are class labels:
where , which maps the input vector to high dimensional feature space, is the weight of , and is the deviation. To find the optimum solution for this problem, the distance between training data points and hyperplane can increase by minimizing the following cost function:
subject to:
where and are the user-defined positive regularization value and measure of misclassification training error, respectively. Equation (3) is the trade-off between maximum boundary margin and the misclassification error. The Lagrange multiplier method can be utilized to solve this optimization problem:
where and are the Lagrange multiplier, the values of and are not equal to zero for small subset of input vectors, these small subsets are also known as SVs.
The SVR algorithm can be utilized for a regression problem, where the main goal is to find an optimal function:
The main work of SVR is to obtain a function that has the maximum deviation between the function and training set with less than the defined value . The resultant cost function can be written as:
subject to:
Again, the Lagrange multiplier method can be introduced to resolve this optimization problem:
3.2. Extraction of Features from Battery Discharge Data
Generally, the modeling of SVM consists of following five-step; first is the extraction of critical features, the second one is the processing of data, third is the selection of optimum values of SVM parameters, fourth is the training of the model (Training), and last is the data estimation (Testing). The detail of the lithium-ion battery used in this work is listed in Table 1.
The feature selection is the most important part of the accurate estimation of any data using SVM. The selected features of discharge data should reflect variations for different cycles of the lithium-ion battery. Wang et al. [39] presented the cycle life model of the lithium-ion battery, which can be written as:
where , , , , , , and denotes the gas constant, absolute battery temperature, pre-exponential factor, activation energy, different C rates during discharging, power-law factor, and capacity loss. So, the different features can be extracted from the discharging data to correlate with the capacity degradation. In this study, the extracted features are energy of the discharge voltage and its corresponding temperature signals (), capacity (, logarithmic band power of voltage and temperature signals (, and means of voltage and temperature signals (. The values of these features can be extracted by using given equations [33,34,40]:
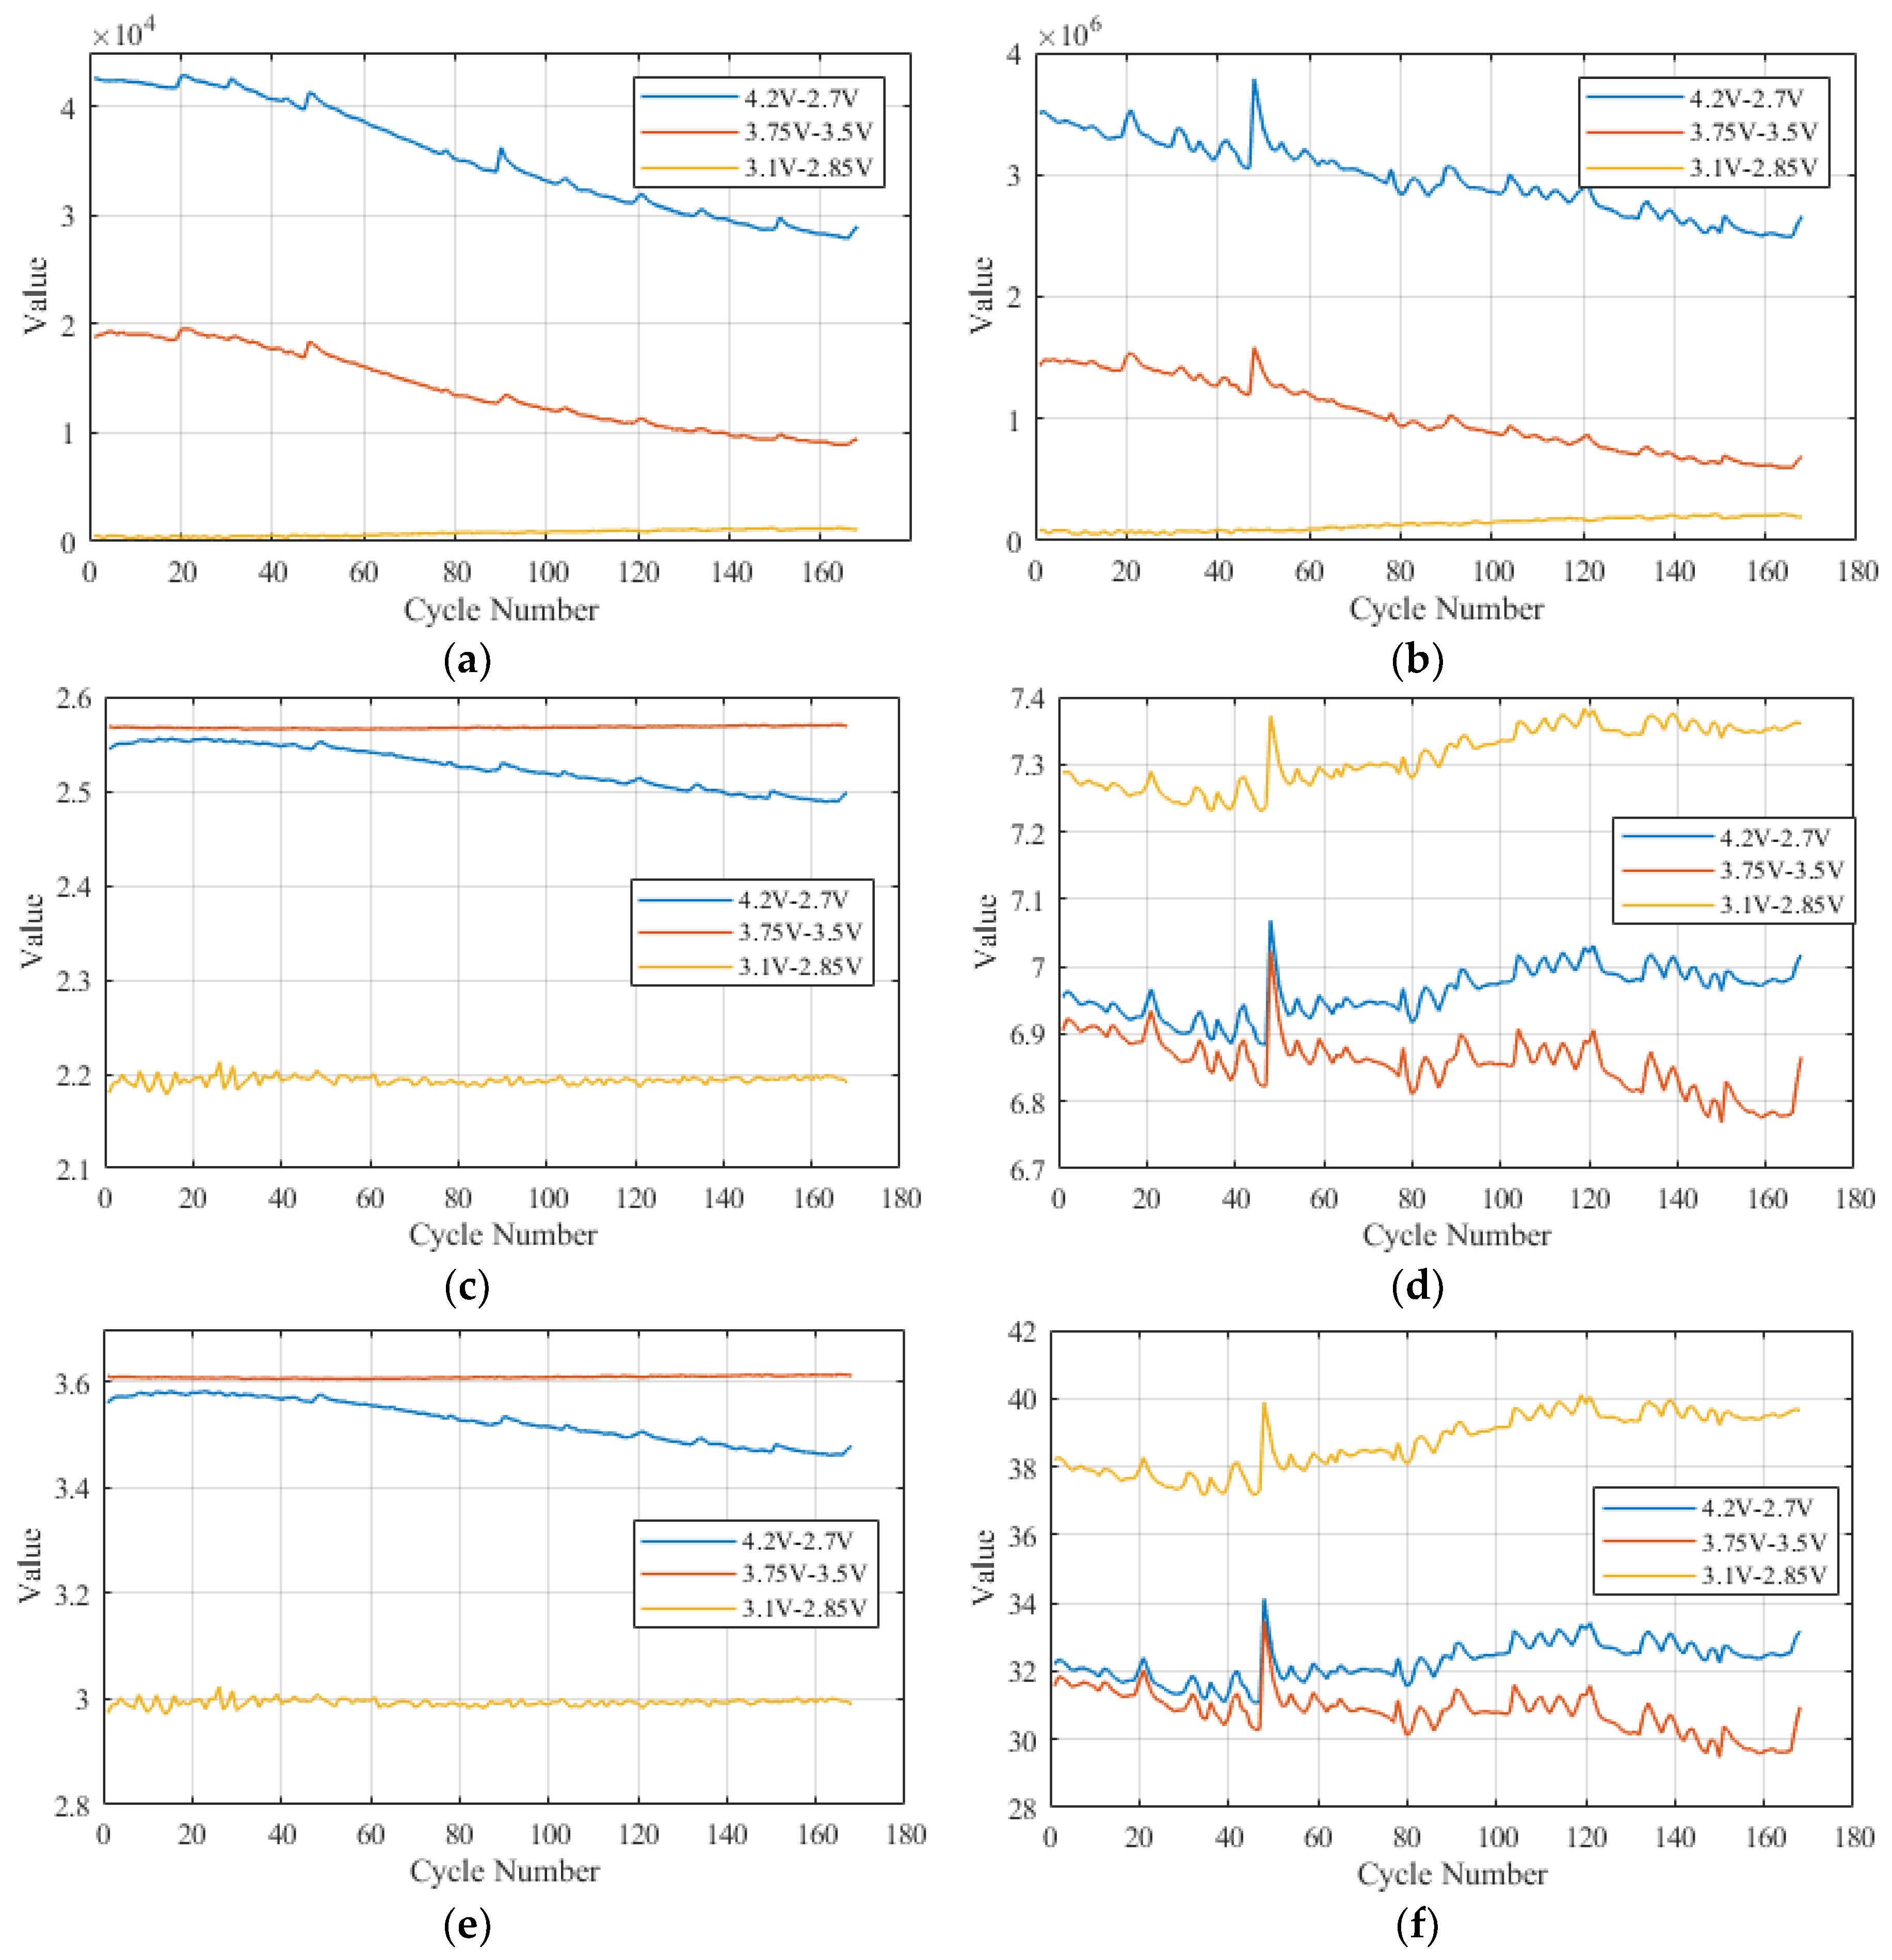
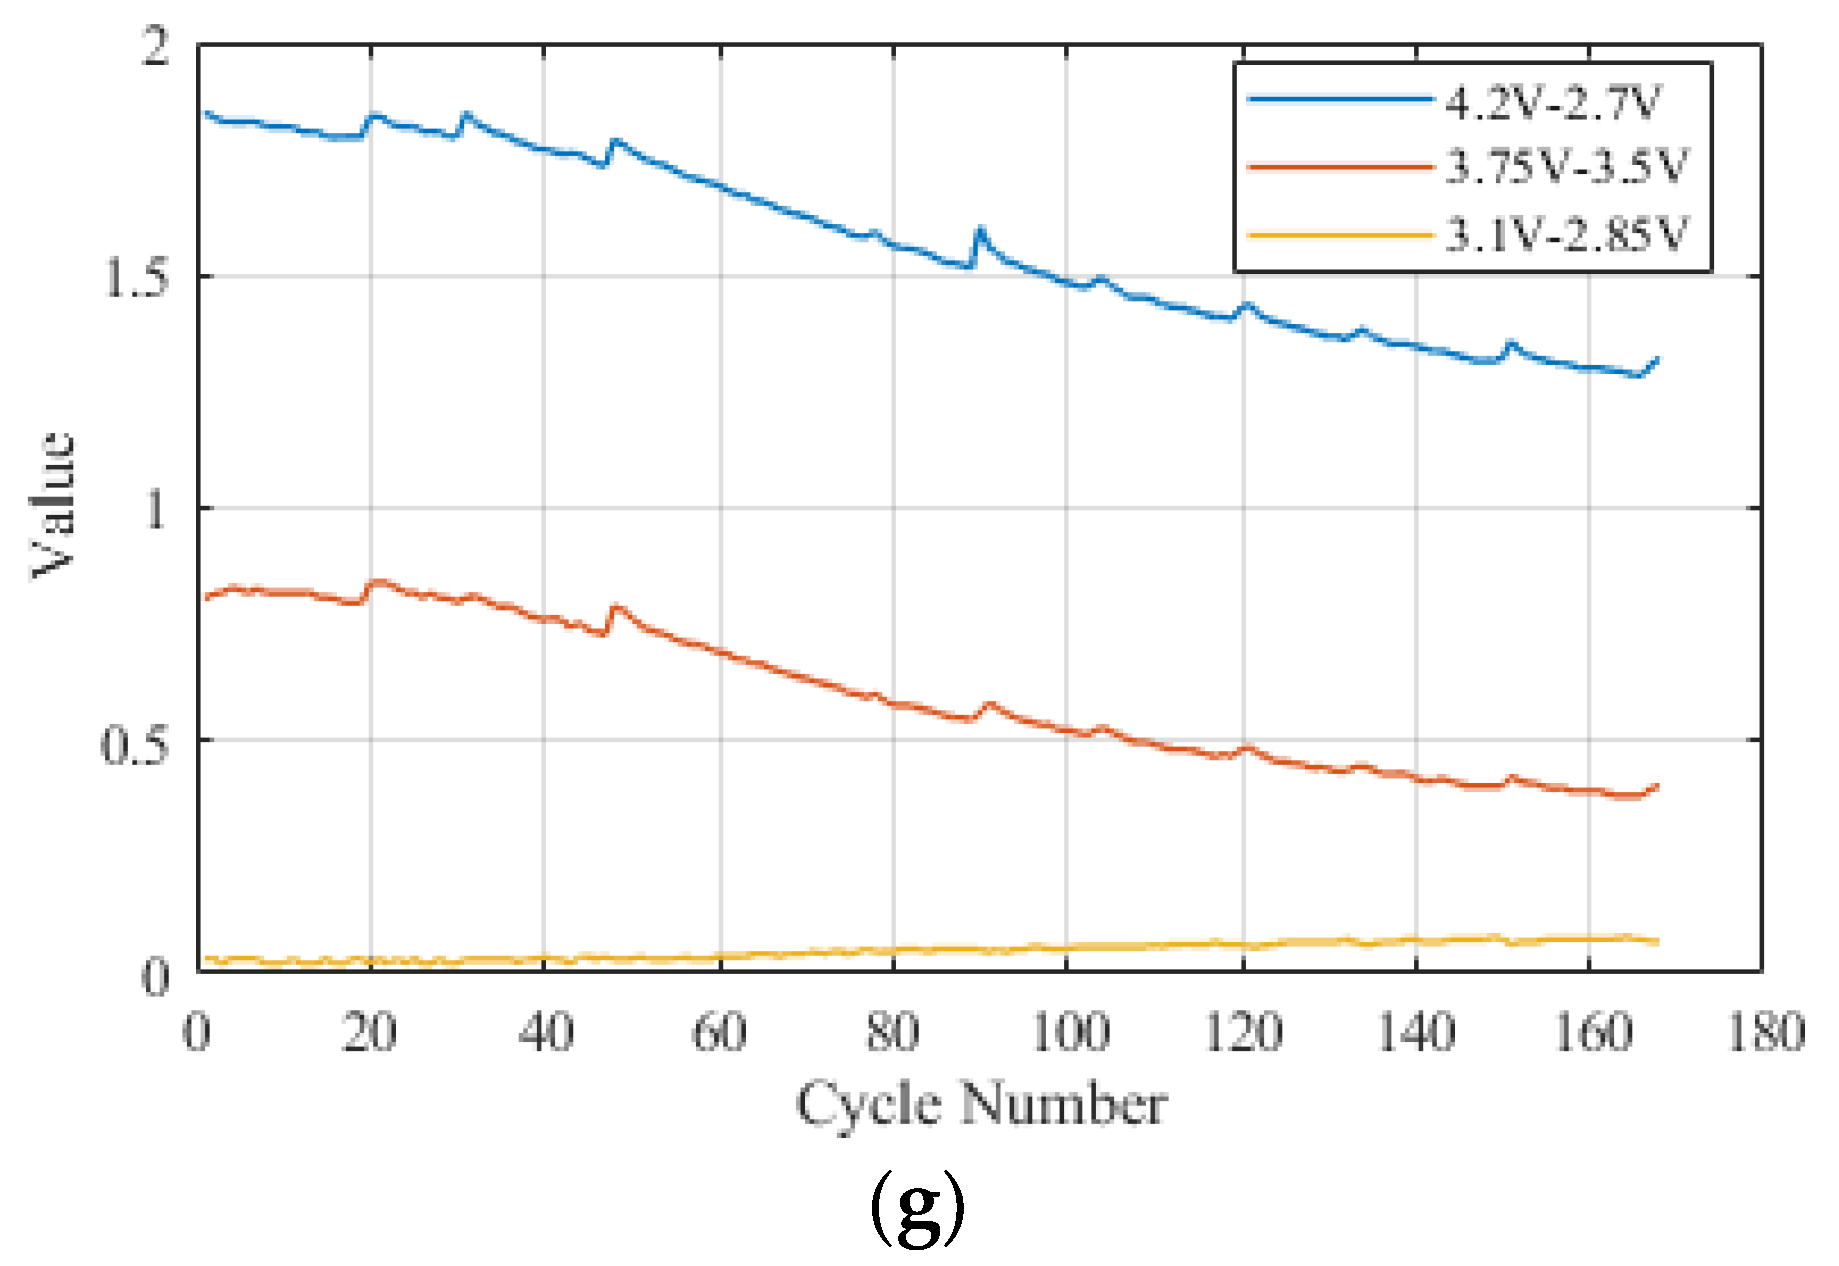
where , , , and represents the signal at time , discharge current value, power of the signal, and data values, respectively. The energy of voltage and temperature signals are denoted by ( and (. and denoted the logarithmic band power of voltage and temperature signal. The means of voltage and temperature denoted by and , respectively. These features of full discharge data and PDD are shown in Figure 3.
Figure 3a,b show the energies of voltage and temperature signals. It is evident from these figures that the energy of the signals decreases with the increase of cycle number. The energies of PDV and PDT for two different regions (3.75–3.5 and 3.1–2.85) were also calculated to check their respective relation with capacity degradation. The energies of PDD almost have similar relation as of full discharge data. and of the full discharge data and PDD are shown in Figure 3c,d. The responses of , , and are shown in Figure 3e–g, respectively. It is clear that and almost shown the same behavior. Similarly, , , and also shown the same response with battery degradation. After carefully analyzing the features, and features were selected to train the SVM model for this work.
3.3. Classification and Regression Model for RUL Prediction
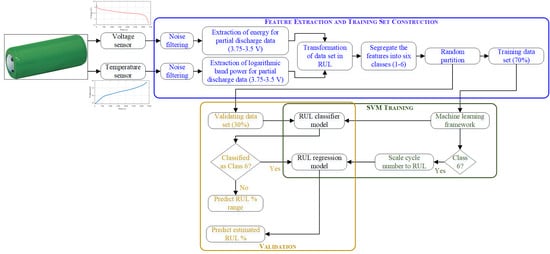
This section explains the design of the classification and regression model for RUL prediction. The machine learning toolbox of MATLABTM (2019a, MathWorks, Natick, MA, USA) was used for training and testing of the models. For the classification model, the total number of discharge cycles of each cell are counted until it reaches its end of life. The total number of cycles were divided into 6 classes (Class 1–6). Like, battery 0005 and 0006 have a total of 168 discharge cycles, as listed in Table 1. Each class of these two batteries contains 28 discharge cycles. Battery 0036 has 32 discharge cycles in the first five classes and 37 cycles in the last class. Similarly, battery 0056 has 17 cycles in each class. The SVM based classifier model was built by using RBF as a kernel. The grid search algorithm can be used for optimal kernel parameters [33]. The regression model used for accurate prediction of RUL. The only features of discharging data which belongs to Class 6 were used to train the regression model by using regression the learner app of MATLABTM. The RBF kernel function showed the best accuracy to train the regression model. The general flow chart of training and testing of regression and classification models is shown in Figure 4.
4. Results and Analysis
In this section, the performance accuracy of classification and regression models is investigated. The discharging data of battery B0005 was thoroughly analyzed to find the optimum PDD. The 70% (118 cycles of B0005) of the discharge data features were used to train the classification and regression models and the remaining 30% (50 cycles of B0005) were utilized for testing purposes. To check the effectiveness of the proposed methodology the results of both models (full discharge data model and PDD data model) have been compared. In the end, three more battery cells namely B0006, B0036, and B0056 were utilized to validate the proposed technique.
4.1. Remaining Useful Life Prediction Using Full Discharge Data
The discharging data of B0005 was used to train the classification and regression models as discussed in Section 3.3. The 70% features of full discharge data were used to train the model, the noted training accuracy of classification model was 94.60%.
The model was tested by using remaining features of full discharge data. The classification results of RUL classifier are listed in Table 2, where the diagonal values are correctly classified classes. The results reveal that the full discharge data trained model classifies the testing data with 94.11% accuracy. All the test samples which belong to Class 6 are correctly classified. The other 70% samples of Class 6 (18) were utilized to training the regression model for accurate RUL prediction. The results of RUL prediction presented in Figure 5.
The results reveal that the RUL prediction RMSE of the test data is 0.1929%.
4.2. Remaining Useful Life Prediction Using Partial Discharge Data
The classification and regression model were trained by using different range of PDD. The training accuracy and error results of both the models are listed in Table 3.
It is evident from Table 3 that the ranges of PDD have an impact on the accuracy of both training models. The range 4.2–3.9 V shows only 71.40% accuracy for classification with 0.19607 RMSE in regression model training. The PDD region between 4.0–3.5 V has 91.10% training accuracy for classification model, its corresponding RMSE, MAE, and MSE for regression model training are 0.16607, 0.14091, and 0.034821, respectively. So, after carefully analyzing the results, it was found that the best classification accuracy and low regression model error lies in the range of 3.75–3.5 V.
The PDD trained models of range 3.75–3.5 V were tested using the remaining samples (50). The classification results of the classifier listed in Table 4.
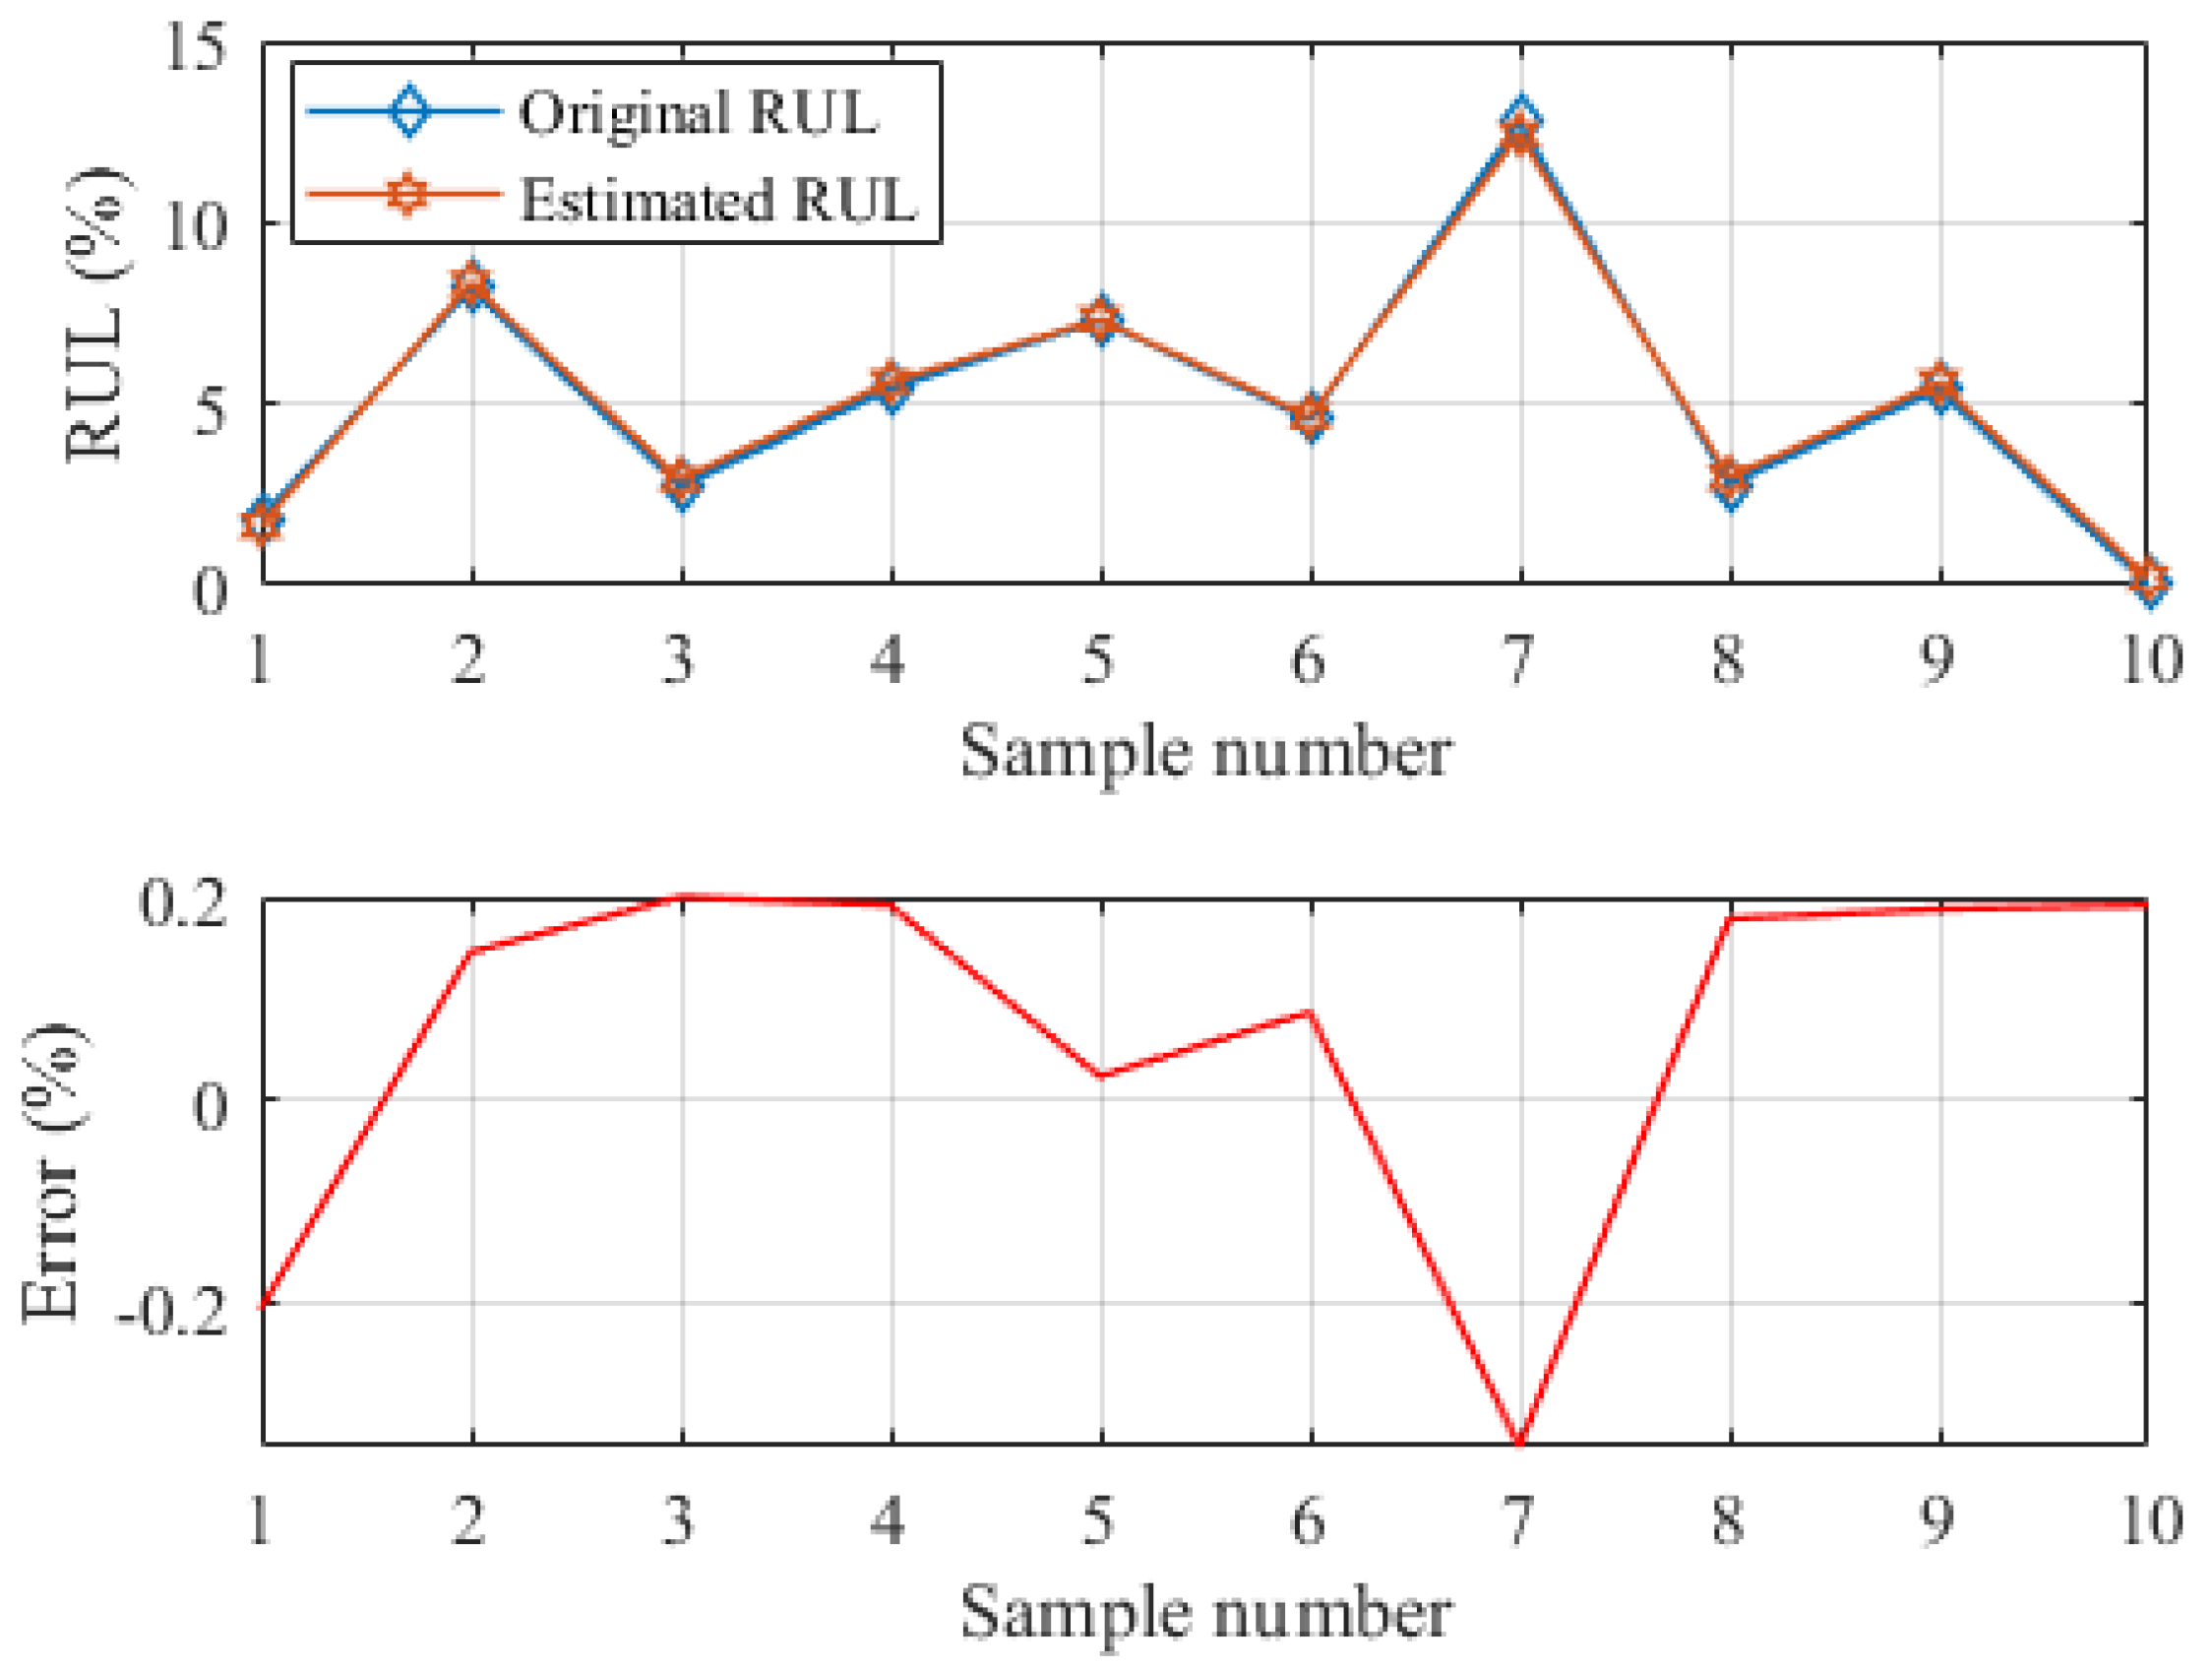
The classifier accurately classified the 46 samples out of 50 into their respective classes. The 10 samples of Class 6 were used to predict the estimated RUL. Figure 6 shows the accuracy of the predicted RUL.
The PDD models were also tested for B0006, B0036, and B0056 batteries. The results of classification accuracy and RUL prediction error are summed up in Table 5.
5. Discussion
The accurate estimation of RUL is an essential component of a smart BMS. In [34], the authors classified the RUL estimation into four different classes. They trained a regression model to estimate the exact value of RUL for the final class. The regression model was trained by using the full discharge data features of only the last class. They used full discharge data features (energy and fluctuation index) of the voltage signal to train the classification and regression models. The shortcoming of this technique is that in real-time applications, the features of full discharge data are not likely to correlate with the testing feature in each cycle because the battery is not fully discharged every time. In addition to this, large storage capacity required to train the SVM models.
In this work, the PDD features (energy of voltage signal and logarithmic band power of temperature signal) were used to train the SVM models. The classifier distributes the RUL in different six classes, and the regression model was utilized to predict the exact value of RUL for the sixth class. Different discharging data ranges were used to train the classifier and regression model (refer to Table 3). After carefully analyzing the training results, we conclude that the best accuracy lies between the range of 3.75–3.5 V, and the SOC level of the batteries is around 70–50% for this range. In the best of the authors’ knowledge, the battery does not get recharged beyond 70–50% of SOC in most cases. So, it means in every cycle the features of this range can easily be extracted for accurate RUL prediction, and it also requires less storage capacity for training.
To validate our claim, full discharge data and PDD trained models were compared. Full discharge data of battery B0005 correctly classified 48 samples out of 51 (see Table 2), and the RUL prediction RMSE was only 0.1929% (Figure 5). On the other hand, PDD (3.75–3.5 V) trained model correctly classified the 46 samples out of 50 (see Table 4). The regression prediction model almost has a similar RMSE of 0.2159% (see Figure 6) and take almost 12–24 min for the extraction of these features. Full discharge data and PDD used 63,641 and 23,483 samples to train the model and utilized 0.68 ms and 0.31 ms computation time, respectively (for battery B0005). It means the PDD model almost requires 3 times lesser storage space than the full discharge data model with almost the same accuracy. Three more batteries were tested to check the effectiveness of the proposed algorithm. The results validated that the proposed methodology classify and predict the RUL with high accuracy (see Table 5). In the future, the authors will investigate the accuracy of the proposed approach under dynamic conditions such as different operating temperatures, C-rates, and charging modes. Being a data-driven approach, the accuracy of the approach should be checked by training the model using data of one battery and test it by using the data of other battery.
6. Conclusions
In this work, a novel SVM-based RUL predictive algorithm is presented. The proposed algorithm trains the SVM models using the features (energy of voltage signal and logarithmic band power of temperature signal) of PDD. Firstly, the multiclass algorithm classifies the samples into six classes, and if the classified class is near to the EOL, then the regression model predicts the actual value of RUL. After extensive training of SVM, the optimal PDD range of 3.75–3.5 V was found. The PDD based SVM classifies and predicts the RUL with high accuracy. The prediction results of four different batteries validated the effectiveness of the proposed SVM models. The proposed PDD based SVM is adaptable for on-board RUL prediction in electric vehicles.
Author Contributions
Conceptualization, M.U.A., A.Z. and H.-J.K.; Data curation, S.H. and G.-S.P.; Formal analysis, M.U.A. and S.H.; Funding acquisition, H.-J.K.; Investigation, M.U.A.; Methodology, M.U.A., A.Z. and S.H.N.; Project administration, H.-J.K.; Resources, H.-J.K.; Software, M.U.A., A.Z., S.H.N. and G.-S.P.; Validation, A.Z.; Writing—original draft, M.U.A.; Writing—review & editing, A.Z., S.H. and H.-J.K.
Funding
This research was supported by Basic Research Laboratory through the National Research Foundations of Korea funded by the Ministry of Science, ICT, and Future Planning (NRF-2015R1A4A1041584).
Conflicts of Interest
The authors declare no conflict of interest.
References
- Umair Ali, M.; Hussain Nengroo, S.; Adil Khan, M.; Zeb, K.; Ahmad Kamran, M.; Kim, H.J. A real-time simulink interfaced fast-charging methodology of lithium-ion batteries under temperature feedback with fuzzy logic control. Energies 2018, 11, 1122. [Google Scholar] [CrossRef]
- Tanaka, N. Technology Roadmap: Electric and Plug-in Hybrid Electric Vehicles; Technical Report; International Energy Agency: Paris, France, 2011.
- Ali, M.U.; Zafar, A.; Nengroo, S.H.; Hussain, S.; Alvi, M.J.; Kim, H.J. Towards a Smarter Battery Management System for Electric Vehicle Applications: A Critical Review of Lithium-Ion Battery State of Charge Estimation. Energies 2019, 12, 446. [Google Scholar] [CrossRef]
- Hussain Nengroo, S.; Umair Ali, M.; Zafar, A.; Hussain, S.; Murtaza, T.; Junaid Alvi, M.; Raghavendra, K.; Jee Kim, H. An Optimized Methodology for a Hybrid Photo-Voltaic and Energy Storage System Connected to a Low-Voltage Grid. Electronics 2019, 8, 176. [Google Scholar] [CrossRef]
- Nengroo, S.; Kamran, M.; Ali, M.; Kim, D.H.; Kim, M.S.; Hussain, A.; Kim, H. Dual battery storage system: An optimized strategy for the utilization of renewable photovoltaic energy in the United Kingdom. Electronics 2018, 7, 177. [Google Scholar] [CrossRef]
- Hussain, S.; Ali, M.U.; Nengroo, S.H.; Khan, I.; Ishfaq, M.; Kim, H.J. Semiactive Hybrid Energy Management System: A Solution for Electric Wheelchairs. Electronics 2019, 8, 345. [Google Scholar] [CrossRef]
- Khan, M.; Zeb, K.; Sathishkumar, P.; Ali, M.; Uddin, W.; Hussain, S.; Ishfaq, M.; Khan, I.; Cho, H.G.; Kim, H.J. A novel supercapacitor/lithium-ion hybrid energy system with a fuzzy logic-controlled fast charging and intelligent energy management system. Electronics 2018, 7, 63. [Google Scholar] [CrossRef]
- Hu, C.; Jain, G.; Zhang, P.; Schmidt, C.; Gomadam, P.; Gorka, T. Data-driven method based on particle swarm optimization and k-nearest neighbor regression for estimating capacity of lithium-ion battery. Appl. Energy 2014, 129, 49–55. [Google Scholar] [CrossRef]
- Zhao, Q.; Qin, X.; Zhao, H.; Feng, W. A novel prediction method based on the support vector regression for the remaining useful life of lithium-ion batteries. Microelectron. Reliab. 2018, 85, 99–108. [Google Scholar] [CrossRef]
- Ali, M.U.; Zafar, A.; Nengroo, S.H.; Hussain, S.; Kim, H.J. Effect of Sensors Sensitivity on Lithium-Ion Battery Modeled Parameters and State of Charge: A Comparative Study. Electronics 2019, 8, 709. [Google Scholar] [CrossRef]
- Ali, M.; Kamran, M.; Kumar, P.; Nengroo, S.; Khan, M.; Hussain, A.; Kim, H.J. An online data-driven model identification and adaptive state of charge estimation approach for lithium-ion-batteries using the lagrange multiplier method. Energies 2018, 11, 2940. [Google Scholar] [CrossRef]
- How, D.N.; Hannan, M.; Lipu, M.H.; Ker, P.J. State of Charge Estimation for Lithium-Ion Batteries Using Model-Based and Data-Driven Methods: A Review. IEEE Access 2019, 7, 136116–136136. [Google Scholar] [CrossRef]
- Hannan, M.A.; Lipu, M.H.; Hussain, A.; Mohamed, A. A review of lithium-ion battery state of charge estimation and management system in electric vehicle applications: Challenges and recommendations. Renew. Sustain. Energy Rev. 2017, 78, 834–854. [Google Scholar] [CrossRef]
- Barré, A.; Deguilhem, B.; Grolleau, S.; Gérard, M.; Suard, F.; Riu, D. A review on lithium-ion battery ageing mechanisms and estimations for automotive applications. J. Power Sources 2013, 241, 680–689. [Google Scholar] [CrossRef]
- Chiang, Y.H.; Sean, W.Y.; Ke, J.C. Online estimation of internal resistance and open-circuit voltage of lithium-ion batteries in electric vehicles. J. Power Sources 2011, 196, 3921–3932. [Google Scholar] [CrossRef]
- Remmlinger, J.; Buchholz, M.; Meiler, M.; Bernreuter, P.; Dietmayer, K. State-of-health monitoring of lithium-ion batteries in electric vehicles by on-board internal resistance estimation. J. Power Sources 2011, 196, 5357–5363. [Google Scholar] [CrossRef]
- Tsang, K.M.; Chan, W.L. State of health detection for Lithium ion batteries in photovoltaic system. Energy Convers. Manag. 2013, 65, 7–12. [Google Scholar] [CrossRef]
- Rezvanizaniani, S.M.; Liu, Z.; Chen, Y.; Lee, J. Review and recent advances in battery health monitoring and prognostics technologies for electric vehicle (EV) safety and mobility. J. Power Sources 2014, 256, 110–124. [Google Scholar] [CrossRef]
- Plett, G.L. Extended Kalman filtering for battery management systems of LiPB-based HEV battery packs: Part 3. State and parameter estimation. J. Power Sources 2004, 134, 277–292. [Google Scholar] [CrossRef]
- Saha, B.; Goebel, K.; Poll, S.; Christophersen, J. Prognostics Methods for Battery Health Monitoring Using a Bayesian Framework. IEEE Trans. Instrum. Meas. 2009, 58, 291–296. [Google Scholar] [CrossRef]
- Liu, D.; Luo, Y.; Liu, J.; Peng, Y.; Guo, L.; Pecht, M. Lithium-ion battery remaining useful life estimation based on fusion nonlinear degradation AR model and RPF algorithm. Neural Comput. Appl. 2014, 25, 557–572. [Google Scholar] [CrossRef]
- Andre, D.; Appel, C.; Soczka-Guth, T.; Sauer, D.U. Advanced mathematical methods of SOC and SOH estimation for lithium-ion batteries. J. Power Sources 2013, 224, 20–27. [Google Scholar] [CrossRef]
- Mosallam, A.; Medjaher, K.; Zerhouni, N. Data-driven prognostic method based on Bayesian approaches for direct remaining useful life prediction. J. Intell. Manuf. 2016, 27, 1037–1048. [Google Scholar] [CrossRef]
- Kim, I.S. A technique for estimating the state of health of lithium batteries through a dual-sliding-mode observer. IEEE Trans. Power Electron. 2010, 25, 1013–1022. [Google Scholar] [CrossRef]
- Eddahech, A.; Briat, O.; Bertrand, N.; Delétage, J.Y.; Vinassa, J.M. Behavior and state-of-health monitoring of Li-ion batteries using impedance spectroscopy and recurrent neural networks. Int. J. Electr. Power Energy Syst. 2012, 42, 487–494. [Google Scholar] [CrossRef]
- Ng, S.S.Y.; Xing, Y.; Tsui, K.L. A naive Bayes model for robust remaining useful life prediction of lithium-ion battery. Appl. Energy 2014, 118, 114–123. [Google Scholar] [CrossRef]
- Liu, D.; Pang, J.; Zhou, J.; Peng, Y.; Pecht, M. Prognostics for state of health estimation of lithium-ion batteries based on combination Gaussian process functional regression. Microelectron. Reliab. 2013, 53, 832–839. [Google Scholar] [CrossRef]
- Wu, W.; Hu, J.; Zhang, J. Prognostics of machine health condition using an improved ARIMA-based prediction method. In Proceedings of the 2007 2nd IEEE Conference on Industrial Electronics and Applications, Harbin, China, 23–25 May 2007; pp. 1062–1067. [Google Scholar]
- Tang, S.; Yu, C.; Wang, X.; Guo, X.; Si, X. Remaining Useful Life Prediction of Lithium-Ion Batteries Based on the Wiener Process with Measurement Error. Energies 2014, 7, 520–547. [Google Scholar] [CrossRef]
- Zhang, H.; Chen, M.; Xi, X.; Zhou, D. Remaining Useful Life Prediction for Degradation Processes With Long-Range Dependence. IEEE Trans. Reliab. 2017, 66, 1368–1379. [Google Scholar] [CrossRef]
- Wu, J.; Wang, Y.; Zhang, X.; Chen, Z. A novel state of health estimation method of Li-ion battery using group method of data handling. J. Power Sources 2016, 327, 457–464. [Google Scholar] [CrossRef]
- Klass, V.; Behm, M.; Lindbergh, G. A support vector machine-based state-of-health estimation method for lithium-ion batteries under electric vehicle operation. J. Power Sources 2014, 270, 262–272. [Google Scholar] [CrossRef]
- Chen, Z.; Sun, M.; Shu, X.; Xiao, R.; Shen, J. Online State of Health Estimation for Lithium-Ion Batteries Based on Support Vector Machine. Appl. Sci. 2018, 8, 925. [Google Scholar] [CrossRef] [Green Version]
- Patil, M.A.; Tagade, P.; Hariharan, K.S.; Kolake, S.M.; Song, T.; Yeo, T.; Doo, S. A novel multistage Support Vector Machine based approach for Li ion battery remaining useful life estimation. Appl. Energy 2015, 159, 285–297. [Google Scholar] [CrossRef]
- Saha, B.; Goebel, K. Battery data set. In NASA AMES Prognostics Data Repository; NASA: Washington, DC, USA, 2007. Available online: https://ti.arc.nasa.gov/tech/dash/groups/pcoe/prognostic-data-repository/ (accessed on 1 November 2019).
- Herbrich, R. Learning Kernel Classifiers: Theory and Algorithms; MIT Press: Cambridge, MA, USA, 2002. [Google Scholar]
- Cristianini, N.; Shawe-Taylor, J. An Introduction to Support Vector Machines and Other Kernel-Based Learning Methods; Cambridge University Press: Cambridge, UK, 2000. [Google Scholar]
- Smola, A.J.; Schölkopf, B. A tutorial on support vector regression. Stat. Comput. 2004, 14, 199–222. [Google Scholar] [CrossRef] [Green Version]
- Wang, J.; Liu, P.; Hicks-Garner, J.; Sherman, E.; Soukiazian, S.; Verbrugge, M.; Tataria, H.; Musser, J.; Finamore, P. Cycle-life model for graphite-LiFePO4 cells. J. Power Sources 2011, 196, 3942–3948. [Google Scholar] [CrossRef]
- Hong, K.S.; Khan, M.J.; Hong, M.J. Feature extraction and classification methods for hybrid fNIRS-EEG brain-computer interfaces. Front. Hum. Neurosci. 2018, 12, 246. [Google Scholar] [CrossRef] [PubMed]
Figure 1.
Discharging data profiles at different battery cycles: (a) Terminal voltage; (b) Battery temperature.
Figure 1.
Discharging data profiles at different battery cycles: (a) Terminal voltage; (b) Battery temperature.


Figure 2.
Discharging terminal voltage profiles at different battery cycles: (a) Voltage Region 3.75–3.5 V; (b) Voltage Region 3.1–2.85 V.
Figure 2.
Discharging terminal voltage profiles at different battery cycles: (a) Voltage Region 3.75–3.5 V; (b) Voltage Region 3.1–2.85 V.


Figure 3.
Extracted features of lithium-ion battery (B0005) discharge data: (a) of full discharge data and PDD; (b) of full discharge data and PDD; (c) of full discharge data and PDD; (d) of full discharge data and PDD; (e) of full discharge data and PDD; (f) of full discharge data and PDD; (g) of full discharge data and PDD.


Figure 4.
General flow chart of training and testing of classification and regression models for RUL prediction.
Figure 4.
General flow chart of training and testing of classification and regression models for RUL prediction.

Figure 5.
Prediction of RUL using features of full discharge data.

Figure 6.
Prediction of RUL using features of feature of PDD (range 3.75–3.5).


Table 1.
Specifications and operating conditions of batteries [35].
Table 1.
Specifications and operating conditions of batteries [35].
| Battery Type | Battery Positive Electrode Material | Battery Number | Battery Capacity (mAh) | Battery Discharge Ending Voltage (V) | Battery Discharge Current (A) | Operating Temperature (°C) | No. of Cycles |
|---|---|---|---|---|---|---|---|
| 18,650 Lithium-ion battery | LiNi0.8Co0.15 Al0.05O2 | B0005 | 2000 | 2.7 | 2 | 24 | 168 |
| B0006 | 2.5 | 2 | 24 | 168 | |||
| B0036 | 2.7 | 2 | 24 | 197 | |||
| B0056 | 2.7 | 2 | 4 | 102 |
Table 2.
Test results of RUL classification model using full discharge data features.
| Classified as | ||||||
|---|---|---|---|---|---|---|
| Class No. | Class 1 | Class 2 | Class 3 | Class 4 | Class 5 | Class 6 |
| Class 1 | 7 | - | 1 | - | - | - |
| Class 2 | 1 | 6 | - | - | - | - |
| Class 3 | - | - | 9 | 1 | - | - |
| Class 4 | - | - | - | 7 | - | - |
| Class 5 | - | - | - | - | 9 | - |
| Class 6 | - | - | - | - | - | 10 |
Table 3.
Performance of classification and regression models under different PDD range.
| Range of Discharge Data (V) | Classification | Regression Model | ||
|---|---|---|---|---|
| Training Accuracy | Root Mean Square Error (RMSE) | Mean Average Error (MAE) | Mean Square Error (MSE) | |
| 4.2–3.9 | 71.40% | 0.19607 | 0.14638 | 0.039031 |
| 4.2–3.7 | 81.50% | 0.21118 | 0.16373 | 0.042453 |
| 4.0–3.5 | 91.10% | 0.16607 | 0.14091 | 0.034821 |
| 4.0–3.75 | 87.50% | 0.1789 | 0.14123 | 0.034012 |
| 3.75–3.5 | 93.50% | 0.14195 | 0.10699 | 0.02145 |
| 3.6–3.5 | 86.30% | 0.16218 | 0.12876 | 0.028954 |
| 3.6–3.3 | 87.50% | 0.17678 | 0.13085 | 0.031245 |
| 3.5–3.3 | 77.40% | 0.16191 | 0.12016 | 0.027865 |
| 3.4–3.2 | 85.70% | 0.16867 | 0.13084 | 0.029756 |
| 3.3–3.1 | 82.10% | 0.21805 | 0.16672 | 0.046891 |
| 3.2–3.0 | 85.70% | 0.20317 | 0.14746 | 0.039856 |
| 3.1–2.9 | 81.50% | 0.17385 | 0.14947 | 0.034958 |
| 3–2.6 | 76.80% | 0.15124 | 0.11542 | 0.024658 |
Table 4.
Test results of the RUL classification model using feature of PDD (range 3.75–3.5).
| Class No. | Classified as | |||||
|---|---|---|---|---|---|---|
| Class 1 | Class 2 | Class 3 | Class 4 | Class 5 | Class 6 | |
| Class 1 | 6 | - | - | - | - | - |
| Class 2 | 1 | 8 | - | - | - | - |
| Class 3 | - | - | 8 | - | - | - |
| Class 4 | - | - | 1 | 7 | 1 | - |
| Class 5 | - | - | - | - | 8 | - |
| Class 6 | - | - | - | - | 1 | 9 |
Table 5.
Classification and estimation results of different batteries using features of PDD.
| Battery Number | Classification | Regression | ||
|---|---|---|---|---|
| Accurately Classified Samples | Total Number of Samples | Accuracy (%) | RMSE (%) | |
| B0005 | 46 | 50 | 92.0 | 0.2159 |
| B0006 | 47 | 50 | 94.0 | 0.3108 |
| B0036 | 55 | 60 | 91.6 | 0.2250 |
| B0056 | 36 | 40 | 90.0 | 0.4267 |
© 2019 by the authors. Licensee MDPI, Basel, Switzerland. This article is an open access article distributed under the terms and conditions of the Creative Commons Attribution (CC BY) license (http://creativecommons.org/licenses/by/4.0/).
Share and Cite
MDPI and ACS Style
Ali, M.U.; Zafar, A.; Nengroo, S.H.; Hussain, S.; Park, G.-S.; Kim, H.-J. Online Remaining Useful Life Prediction for Lithium-Ion Batteries Using Partial Discharge Data Features. Energies 2019, 12, 4366. https://doi.org/10.3390/en12224366
AMA Style
Ali MU, Zafar A, Nengroo SH, Hussain S, Park G-S, Kim H-J. Online Remaining Useful Life Prediction for Lithium-Ion Batteries Using Partial Discharge Data Features. Energies. 2019; 12(22):4366. https://doi.org/10.3390/en12224366
Chicago/Turabian StyleAli, Muhammad Umair, Amad Zafar, Sarvar Hussain Nengroo, Sadam Hussain, Gwan-Soo Park, and Hee-Je Kim. 2019. "Online Remaining Useful Life Prediction for Lithium-Ion Batteries Using Partial Discharge Data Features" Energies 12, no. 22: 4366. https://doi.org/10.3390/en12224366
Note that from the first issue of 2016, this journal uses article numbers instead of page numbers. See further details here.