Optimization of Galloping Piezoelectric Energy Harvester with V-Shaped Groove in Low Wind Speed

Tianjin Key Laboratory of Nonlinear Dynamics and Control, School of Mechanical Engineering, Tianjin University, Tianjin 300350, China
*
Author to whom correspondence should be addressed.
Energies 2019, 12(24), 4619; https://doi.org/10.3390/en12244619
Submission received: 30 October 2019
/
Revised: 2 December 2019
/
Accepted: 3 December 2019
/
Published: 5 December 2019
(This article belongs to the Special Issue Diagnostics and Condition Monitoring Technologies for Assuring Asset Performances)
Abstract
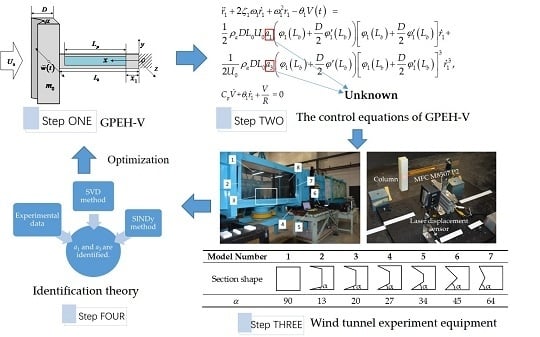
:A square cylinder with a V-shaped groove on the windward side in the piezoelectric cantilever flow-induced vibration energy harvester (FIVEH) is presented to improve the output power of the energy harvester and reduce the critical velocity of the system, aiming at the self-powered supply of low energy consumption devices in the natural environment with low wind speed. Seven groups of galloping piezoelectric energy harvesters (GPEHs) were designed and tested in a wind tunnel by gradually changing the angle of two symmetrical sharp angles of the V-groove. The GPEH with a sharp angle of 45° was selected as the optimal energy harvester. Its output power was 61% more than the GPEH without the V-shaped groove. The more accurate mathematical model was made by using the sparse identification method to calculate the empirical parameters of fluid based on the experimental data and the theoretical model. The critical velocity of the galloping system was calculated by analyzing the local Hopf bifurcation of the model. The minimum critical velocity was 2.53 m/s smaller than the maximum critical velocity at 4.69 m/s. These results make the GPEH with a V-shaped groove (GPEH-V) more suitable to harvest wind energy efficiently in a low wind speed environment.
1. Introduction
Energy harvesting is usually the process of converting waste or useless energy into electrical energy in the external environment, providing electrical energy for low-power electronic components. The ultimate goal is to develop self-powered sensors, actuators, and other electronic devices. The research on energy harvesters has always been one of the hot topics in the literature, and a large number of researchers have made extensive research in this field. The energy harvester based on vibration has attracted widespread attention because mechanical vibration can make energy in many places where thermal or light energy is not suitable [1]. For example, it can provide power for electromechanical systems and actuators, and can also be applied to environmental monitoring equipment, medical transplantation, and wireless sensors. In addition, due to the limited battery life and the cost and time required for maintenance, the vibration energy harvester (VEH) can also be employed to replace some small batteries. Generally speaking, the VEH mainly includes piezoelectric, electromagnetic, and electrostatic types, among which the piezoelectric energy harvester (PEH) has outstanding advantages such as high force electric coupling effect and energy density, no electromagnetic interference, and easy miniaturization process. These advantages make PEH ideal for low-power wireless sensor nodes [2].
PEH uses piezoelectric effect to convert mechanical energy into electrical energy. The external environment vibration causes mechanical deformation of the piezoelectric body, and polarization occurs inside it. Then positive charges and negatives appear on a pair of electrode faces of the piezoelectric wafer. The voltage can be obtained through an external resistance. The power of energy harvesting depends primarily on the form and amount of vibrational energy, as well as the performance of the harvester. In previous studies, VEH mainly focused on harvesting energy from foundation vibration, because it is a simple and common vibration mode [3]. A significant number of papers were issued to discuss the scheme of improving the level of energy harvester based on different mechanisms and techniques. [4]. Most researchers increase the efficiency of the PEH by using a nonlinear electronic interface circuit [5]. Wang et al. [6] proposed a model and experiment of a broadband piezoelectric vehicle with four-stable caused by the contact nonlinearity and magnetoelasticity interaction of the cantilever beam surface. Wang et al. [7] considered a tri-stable PEH with two external magnets.
However, with the development of energy acquisition, flow-induced vibration energy harvester (FIVEH) has attracted increasing attention over the last few years [8,9]. There are three main types of flow-induced vibrations (FIV) that cause periodic vibration of the energy harvester: vortex-induced vibration (VIV), flutter, and galloping. In the natural environment, VIV is a relatively common vibration mode in FIV. When the vortex falls off at a frequency close to one of the natural frequencies of the vibration system, the system will lock or synchronize, and then a large vibration will occur due to the resonance phenomenon. The vibration gets the characteristics of stability, self-limitation, and large amplitude, and based on the above characteristics, it is employed in the research of energy acquisition. A series of scientific research have been issued to probe the performance of different types of vortex-induced vibration energy harvesters (VIVEHs) [10,11,12,13]. Nevertheless, due to the existence of the frequency lock-in phenomenon, the energy harvester can only produce large vibration in a certain range of velocity [14]. The energy harvester of the wing-based plate based on the flutter principle was designed to work normally over a wide range of velocity. When the flow velocity increases from zero, such a fluid–solid coupling system may have a critical velocity, commonly referred to as the flutter velocity. At this flutter velocity, self-excited motion begins to occur because the absolute value of the structural damping is exactly equal to the absolute value of the damping caused by the aerodynamic effect [15]. As there is not any frequency lock-in phenomenon in flutter, the energy harvester can work normally as long as the flow velocity exceeds the critical velocity [16,17,18]. It is characterized by high frequency and small amplitude, because flutter belongs to multi-modal coupling vibration [19], which is not conducive to the transduction of energy by piezoelectric materials.
Based on the deficiency of the above two kinds of FIVEHs, the method and concept of a galloping energy harvester (GEH) are proposed [20,21,22]. Therefore, in order to make full use of the FIVEH, a lot of researches were carried out, which was on the basis of the cylindrical FIVEH by changing the cross-sectional shape of the cylinder to stimulate the galloping motion of the system. During galloping, transverse self-excited vibration is generated by a structure in a stable flow field perpendicular to the direction of flow [23]. Some structures with non-streamlined or asymmetrical cross sections (rectangular, D-shaped, hexagonal, triangular, etc.) may undergo galloping at a certain inflow velocity and direction [24,25]. The galloping has a larger amplitude and a wider vibration frequency band than the VIV, and is generally considered to be a vibration of a single mode, which provides a more effective guarantee for stable acquisition of energy [26]. The structure of the circular cross section does not gallop, because for a circular cross-section, if no vortex shedding occurs, no lift will occur [27]. When the cylinder is vibrating perpendicular to the direction of the fluid, the force of the fluid is consistent with the direction of the relative flow velocity, and the component in the direction of the structural vibration is opposite to the direction of motion of the structure. This is a positive damping force and does not generate self-excitation vibration. Therefore, in order to make full use of the FIVEH, a lot of research has been carried out, which is on the basis of the columnar FIVEH changing the cross-sectional shape of the cylinder to stimulate the galloping motion of the system [28,29,30]. Barrero-Gil et al. [31] investigated the influence of section geometry on transverse galloping of a single degree of freedom system. Liu et al. [32] designed a galloping piezoelectric energy harvester (GPEH) with a Y-type three-blade bluff body. Amin et al. [33] studied the characteristics of the GPEH with a square cylinder under combined base excitations and galloping. Javed et al. [34,35] investigated the influence of different aerodynamic load expressions on galloping response in square cylinder GPEHs. Abdelmoula et al. [36] investigated the performance of a square cylinder GPEH when considering complex circuit systems.
To sum up, there have been numerous reports on the research of FIVEHs in academic circles, and many achievements have been achieved. Although most researchers only study the vibration characteristics of some basic shape section columns (such as circle, triangle, square, rectangle, and trapezoid). There is little research on the special section shape. In previous research, an acceleration sensor was installed on the square cylinder to collect the fluid force directly. This method is simple in principle and convenience in operation. However, in this study, due to the relatively small mass of the cylinder, the mass of the acceleration sensor may not be ignored, and the error of the results may not be predicted. Therefore, in this paper, the laser displacement sensor is used to evaluate the displacement signal of the cylinder. If the method of direct derivation of the data is used to obtain the fluid force, a large error will occur. Therefore, based on the system identification theory, combined with the singular value decomposition (SVD) and sparse identification algorithm (SINDy) [37], we get the empirical coefficient of fluid force. Based on the SVD theory, the noise reduction method has excellent robustness and the SINDy has the ability to make the governing equations sparse in a high-dimensional nonlinear function pace.
Based on the Euler–Lagrange equation and the principle of virtual work, combined with Galerkin discrete method, the control equation of GPEH-V is established, the main factors affecting the flow force are analyzed, and the structure of a V-shape on the windward side of the square cylinder is proposed to improve its amplitude in low velocity fluid. Through the wind tunnel experiment, the characteristics of different models to GPEH are analyzed.
2. Electromechanical Modeling of the Galloping
Inspired by the GPEH [31], we proposed the concept of the GPEH-V. Its schematic diagram shown in Figure 1. It is mainly composed of a piezoelectric cantilever beam and a square cylinder. The piezoelectric cantilever beam is composed of a 0.8 mm thick beryllium bronze support layer and its bonded macro fiber composite (MFC M8507 P2). At the free end of the cantilever beam, a square cylinder with a V-shaped groove on the windward side is connected. When the wind velocity exceeds the critical value, the cylinder will be subjected to the transverse wave force generated by the airflow. The blue part in Figure 1 represents the MFC piezoelectric sheet attached to the cantilever beam, which is connected in series with the resistance through two plane electrodes with negligible thickness. The geometric dimensions and physical parameters of the energy harvester are shown in Table 1. The shear deformation and moment of inertia of the cantilever can be ignored, because the thickness of the cantilever is very small relative to its length.
Based on the Lagrangian equation and the virtual work principle, combined with the Galerkin discrete method, the governing equations of the GPEH are established. Therefore, expressions of kinetic energy T, total potential energy U, and the non-conservative work W due to fluid force and damping force should be established first. Considering the moment of inertia caused by the lateral movement of the cylinder, the expressions of kinetic energy and potential energy are given as:
The strains and stresses in the piezoelectric layer and substrate are expressed as:
where Eb and Ep represent Young’s modulus under a constant electric field, and E3 is the electric field in the direction of polarization [14]. The relationship between the generated voltage V(t) and the electric field E3 is E3 = −V(t)/tp [38]. Additionally, the expression for D3 [14] is written as:
The work done by non-conservative forces includes three parts: one is the power generated by the circuit, the other is the work done by fluid force F(t), and the third is the work done by the damping force of structural system. The variation expression of work done by the non-conservative force is as follows:
where
The external force is expressed as:
where the selection of ai value is related to the shape of the cylinder [36].
Using the extended Hamilton principle, the governing equations of motion and boundary conditions of the galloping systems are expressed as:
The associated boundary conditions are given by:
where the equivalent bending stiffness and mass can be expressed as:
where
We express the displacement in the form:
Bibo et al. [33] proved that for galloping motion, the first mode in the Galerkin procedure is enough to obtain the accurate response of the system, so the first mode results of the system are taken into account in the subsequent calculation. Therefore, the control equations of the first order vibration model of GPEH-V based on galloping are as follows:
where
The detailed derivation process of GPEH-V control equation using generalized Hamiltonian principle can refer to Abdelkefi et al. [39] and Varoto [40]. By solving Equation (12) with the Runge–Kutta method, the numerical solution of the displacement and voltage response of the piezoelectric coupling system can be obtained.
The expression of the total efficiency of the energy harvester or the electromechanical efficiency of the air is defined as:
where Pavg is the average resonance power output of the energy harvester. Pf is the mechanical power output by the fluid, and its expression is proportional to the cube of the external velocity [31]:
3. Galloping Characteristics Analysis
Galloping is a kind of self-excited vibration. The motion of the object causes the force along the direction of motion of the object. At this time, the fluid works on the object. When the force exceeds the energy dissipation of the system, dynamic instability occurs, so the vibration is induced. It develops into a large amplitude vibration. In other words, when the direction of action of the lift is consistent with the direction of motion of the structure, energy is continuously obtained from the fluid, and the amplitude is gradually increased. This process continues until the damping has a non-linear effect or other non-linear effects. The frequency of lift variation is the same as the natural frequency of the structure. This frequency is generally much lower than the frequency fS of St, and its reduction speed Vr is more than 10.
3.1. The Influence Lateral Force Coefficient on the Critical Velocity
To calculate the critical velocity Ug of galloping wind velocity (i.e., the initial velocity of galloping), a linear analysis of the system is carried out. In Equation (12), the motion equation can be expressed in the state space by neglecting the nonlinear term of the fluid force. The correlation linear matrix of the state space formula is written as follows:
According to Equation (12), when the linear term of the fluid force is equal to the damping force of the system, the critical velocity can be calculated as:
It can be seen from Equation (16) that linear matrix A has three eigenvalues, and the first two eigenvalues are complex conjugate term ; however for all wind velocity, the third eigenvalue is negative. The real part of the conjugate complex reflects the coupling damping of the system and also controls the dynamics of the system. As the wind velocity in the environment gradually increases, the linear term of the fluid force of the system gradually increases. When the linear term is greater than the electromechanical damping of the GPEH-V, the real part of the complex conjugate becomes positive, and the system begins to gallop. Any wind velocity greater than the critical value will make the real part of and positive, and make the system galloping. It is worth noting that the natural frequency ω1 represents the first natural frequency of the system, because the first mode is enough to produce galloping oscillation. The experimental and theoretical results show that the value of ω1 is between 13 Hz and 14 Hz, which is of great value for obtaining energy from piezoelectric materials.
It can be seen from Equation (17) that when the piezoelectric cantilever beam of the system is confirmed, the critical velocity is mainly related to the area of the windward side of the cylinder and the coefficient of the linear term of the fluid force a1. When the area of the windward side of the cylinder is constant, the value of a1 determines the critical velocity. It can be seen from Equation (17) that the critical velocity Ug is inversely proportional to a1, and when a1 increases, Ug decreases. The value of a1 is determined by the section shape of the cylinder. When the section of the cylinder is square, a1 = 2.3 [34]. Therefore, a1 is supposed to study near 2.3 in this paper. As showed in Figure 2, when the value of a1 changes nearly 1–4, the corresponding critical velocity Ug changes between 1–7 m/s, and the critical velocity decreases with the diminish of mass of the cylinder.
3.2. Fluid Force Analysis
When the piezoelectric sheet is not attached, the system can be simplified into a single degree of freedom system:
where
where Fy is the instantaneous fluid force in the transverse direction to the incident flow.
In this study, we used quasi-static assumptions to express fluid forces. This is because the essential feature of the transverse galloping phenomenon is that the timescale of the system vibration () is much larger than the characteristic timescale of the fluid flow (). For the convenience of theoretical calculations, the fluid force Fy can be approximated as a polynomial function of the cylinder velocity. For our purposes a cubic polynomial can be used to approximate the vertical fluid force [34]. Where a1 and a3 are empirical coefficients of fluid force. When the length of the cylinder is constant, their values are only related to the cross-sectional shape of the cylinder [31]. Since the cylinder vibrates with respect to the direction of the flow velocity, there is only odd harmonics in the representation of the fluid force. From the analysis in the previous section, it can be known that only when a1 > 0, is the system likely to gallop. Empirical coefficient a3 represents the nonlinear dependence of the fluid force, which is negative. When a3 is positive, the fluid force will increase unrestricted as the cylinder moves faster, which is impossible in practice. It is worth noting that a1 > 0 and a3 < 0 are significant for subsequent studies.
3.3. Galloping Response and Conversion Factor
It can be known from Equation (18) that the system can be theoretically solved by asymptotic methods if the nonlinear term is small [31]. In the case that both aerodynamic and damping forces are small compared with inertia and stiffness forces, solutions to Equation (18) will tend to a limit cycle of quasi-harmonic oscillations.
In this thesis, the Krylov–Bogoliubov [31] method is used to solve Equation (18), and the first-order approximate analytical solution of the system (see Appendix A) can be obtained as Equation (20).
where
From Equation (21), one can find the magnitude of the system amplitude depending on the flow velocity U0 and the cross-sectional shape of the cylinder (a1 and a3), when the mechanical properties of the system and the surrounding fluid are constant.
The corresponding analytical amplitude curves of the cylinder with different flow velocity U values are plotted in Figure 3 which are basically in agreement with the numerical solution. It is shown that when the flow velocity exceeds the critical value, the limit cycle oscillations take place owing to the presence of nonlinearities. This local bifurcation is named Hopf bifurcation.
Figure 4, Figure 5 and Figure 6 show the amplitude of the cylinder under the cross-sectional shape of the cylinder (a1 and a3). They show that when the wind speed is constant, the amplitude of the cylinder increases with the increase of a1 and a3. From Figure 4, we can find that a1 also has a critical value.
The mechanical efficiency of the air:
where
Finally, consider Equations (15), (20)–(23), where one obtains:
4. Experiment and Identification of Empirical Coefficient of Fluid
This part is a wind tunnel experiment on the galloping motion of V-shaped square cylinder with a single degree of freedom in the “low turbulence reflux wind tunnel” finished at the Department of Mechanics, Tianjin University, and the experimental results are compared with the theoretical and static numerical results. The experimental results are used to verify the correctness of the theory and simulation. The physical figure of the main body of the wind tunnel tested is shown in Figure 7 and Figure 8. The MFC piezoelectric sheet is connected in series with the rheostat. The voltage signals at both ends of the rheostat are output to the data collector. The laser displacement sensor is used to monitor the displacement signal of the cylinder and input them to the data collector. The computer controls the operation and storage of the data acquisition system.
Piezoelectric material and its structure are the key points of the piezoelectric energy harvester. The selection of piezoelectric material should consider the working environment, material performance, and other factors. In the existing literature of wind-induced vibration wind energy harvester, the majority of lead zirconate titanate piezoelectric ceramics (PZT) materials are used, which is due to that piezoelectric ceramics have large piezoelectric constant, dielectric constant, and electromechanical coupling coefficient, and since their performance is excellent, a small deformation can obtain a large voltage. Due to the irregular vibration and high frequency of the structure in the wind, and friableness of the piezoelectric ceramic material, it is easy to fatigue fracture under long-term vibration, and since the stiffness is large, it is difficult to deform under the action of general wind. Therefore, another common piezoelectric material, piezoelectric composite material, is selected in this paper, which has small mass, large flexibility, and does not easily incur fracture fatigue. According to the characteristics of wind-induced vibration, the structure that can harvest wind energy is designed and an experimental platform is built, as shown in Figure 9.
In order to study the influence of cross-section shape on fluid force, seven groups of comparative experiments were carried out, with the cross-section shape of the cylindrical structure at the end of the cantilever beam changed, as shown in Table 2. Model 1 is a cylinder with a square cross-section, which mainly verifies the theoretical and numerical results, and can also be compared with another six models. The cross-section shape of models 2–7 is controlled by the angle . The seven groups of models are made by 3D printing technology.
In order to accurately analyze the force acting on the cylinder and calculate the flow force coefficient, it is necessary to simplify the experimental model and eliminate the unnecessary interference factors. Therefore, the wind tunnel experiment without sticking to the MFC piezoelectric sheet is carried out first.
When the wind speed is 5 m/s, the relationship between the time and the displacement of the cylinder of model 1 is shown in Figure 10. It can be seen from Figure 10 that there are some unavoidable errors in the acquisition of experimental data. In order to reduce the errors in the subsequent calculation, the singular value decomposition (SVD) method is used to reduce the noise of the data. Secondly, the SINDy method [37] is used to identify the fluid force coefficient ai in the formula. Assume that a1 and a3 are sufficient to represent the fluid forces. The identification result is a1 = 2.2961 and a3 = −18.7142, which is in line with Abdelkefi [34] and Paulo [40]. The coefficients of fluid force used by others is almost the same. Figure 11 shows the relationship between the fluid velocity and the amplitude of the cylinder, where the solid line is the result of theoretical calculation using the identified fluid force coefficient, and the circle represents the experimental results. By comparison, it is found that the theory is almost consistent with the experiment.
The experimental data do not confirm the theoretical or numerical solution when the flow velocity is between about 1.5 and 3 m/s in Figure 11. This is because when the velocity is near the critical velocity, Hopf bifurcation occurs. The amplitude may suddenly increase or decrease with a slight disturbance. The trend of experimental data is basically the same as that of theoretical and numerical results, when the velocity is far away from the critical velocity and it is more according to the numerical solution.
Depending on the above analysis method, the fluid coefficients of the remaining six models are identified in turn, and seven groups of energy harvesters are calculated numerically. Table 3 shows the detail characteristics of seven groups of energy harvesters. It is clear that the power of the numerical solutions are basically consistent with the experimental solutions; so are the total efficiency solutions. These demonstrate that the empirical coefficients of fluid obtained by the sparse recognition method is basically in line with the actual situation.
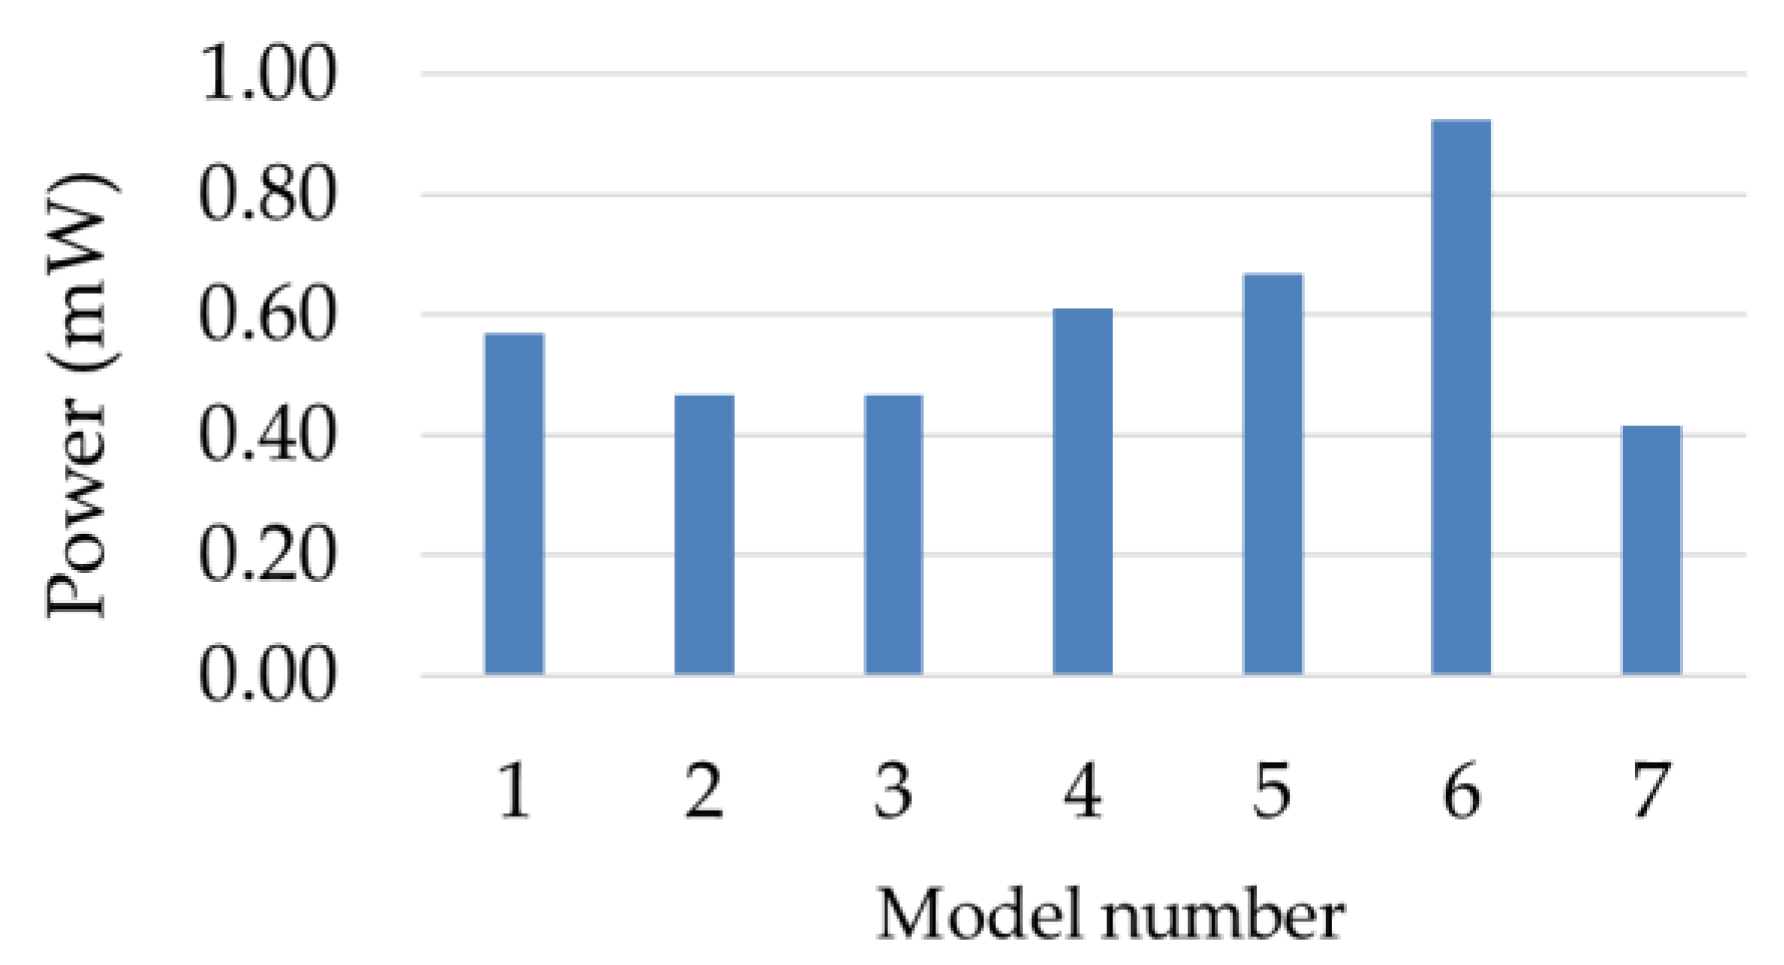
From Figure 12, we can conclude that model 7 has the minimum critical velocity, while its output power is the least at a flow velocity of 10 m/s from Figure 13. Whereas, model 6 does not have the minimum critical velocity. Nevertheless, its output power is the largest. It is extremely important to consider the characteristics of different models according to the actual situation.
5. Energy Harvesting Characteristics of Seven Experimental Models
To design an efficient and optimized GPEH-V, an accurate prediction of the levels of output voltage, output power, and total efficiency of the energy harvester is of the utmost importance. Through the analysis of Section 4, we can accurately obtain the fluid coefficients of the system. The output voltage of the energy harvester under different flow velocity can be calculated by substituting the fluid coefficients into Equations (12) and (13) of Section 2. In the previous section, we know that the numerical solution can analyze the energy harvester characteristics of each model more accurately. Therefore, we use the Runge–Kutta method and MATLAB software to solve Equations (12) and (13) numerically to get the voltage of the system under different flow velocity. According to Equations (14) and (15), the output power and the total energy conversion efficiency of the energy harvest can be calculated.
The flow velocity and output voltage of the energy harvesters are shown in Figure 14. The asterisk represents the experimental results and the solid line in the figure represents the numerical results. It can be seen from the figure that when the wind velocity of model 2 is 6–7 m/s, the experimental results are quite different from the numerical results. This is because the critical velocity of model 2 is 4.7 m/s. According to the previous analysis, Hopf bifurcation occurs near the critical velocity. The experimental results may suddenly increase or decrease with a slight disturbance. In the low wind speed environment, the output voltage of model 6 is the largest, which is because the appropriate sharp angle is conducive to the falling off of the fluid vortex, making the cylinder produce greater pressure difference in the direction of motion. The lift of the cylinder is increased, which leads to an increase in the oscillation amplitude and the output voltage of the energy harvest.
The flow velocity and output power of the energy harvesters are shown in Figure 15. It shows that when the wind speed is about 4 m/s, model 1 and model 7 are the first to output electric energy. With the increase of wind speed, the output energy of model 6 is gradually higher than the other six models. Model 2 starts to output electric energy when the wind speed is greater than 6 m/s, and its output power is the lowest among the seven models when the wind speed is between 6 m/s and 9 m/s. After the wind speed is greater than 9 m/s, the output power gradually exceeds model 7.
The flow velocity and the total efficiency of the energy harvesters are shown in Figure 16. When the wind speed is about between 4 m/s and 5 m/s, the total conversion efficiency of model 1 is the highest. When the wind speed is about between 5 m/s and 10 m/s, the conversion efficiency of model 6 is far higher than the other six models, while model 2 is the lowest.
Overall, model 6 can generate higher voltage and output higher electric energy in the low wind speed environment of 5–10 m/s, and more effectively convert wind energy into electric energy. Figure 17 and Figure 18 show the voltage and output power of model 6 under different resistance loads in different flow velocities. The solid line in the figure represents the numerical results and the asterisk represents the experimental results. It can be obviously seen from the Figure 17 and Figure 18 that when the resistance value changes, the output voltage and power under different resistance values can be accurately predicted by the identified fluid force coefficient. The two figures also show when the resistance of the load increases, the output voltage and power increases.
6. Conclusions
In this paper, a novel architecture of GPEH-V is proposed to harvest the vibration energy caused by air flow. The nonlinear distributed parameter model is established for the large deflection transverse vibration based on the Euler–Lagrange method. The one-order vibration equation is obtained via the Galerkin method. Based on the theoretical model, cross-section geometry, critical velocity, energy efficiency (or conversion factor), and mechanical efficiency of the air was established. The galloping response was solved by the Krylov–Bogoliubov method, and the first-order approximate analytical solution of the system was obtained. Hopf bifurcation was analyzed theoretically and observed in the experiment. Seven groups of comparative experiments were carried out in order to study the influence of V-shaped cross-section on fluid force. The SVD and SINDy methods were used to identify the fluid force coefficient. Finally, combined with the experimental results and theoretical analysis, the critical velocity and energy efficiency of GPEH-V with different V-shaped cross-sections were studied. The conclusions are as follows:
- The V-shaped groove on the windward of the square cylinder can affect not only the critical velocity of galloping but also the lateral force acting on it. The optimal geometry of the V-groove makes the GPEH-V produce the maximum output power in the low wind speed environment of 5–10 m/s.
- Based on the coefficient, the bifurcation mode of the GPEH-V system can be predicted accurately by the Krylov–Bogoliubov method.
- It may accurately identify the flow force coefficients using the SVD and SINDy methods. It also shows that the identified coefficients can accurately predict the energy acquisition characteristics under different wind speeds and different resistance loads.
- The deformation of the piezoelectric cantilever can be accurately predicted by the numerical calculation method to prevent the irreversible damage of MFC due to excessive deformation.
In the follow-up research, we will use the finite element method to analyze fluid–solid coupling vibration of the optimized GPEH-V, reveal the influence of the shape of the windward face on the vibration characteristics theoretically, and optimize the circuit part of the GPEH-V to comprehensively improve the energy harvester efficiency.
Author Contributions
Conceptualization, W.W.; data curation, K.Z.; formal analysis, K.Z. and Q.Z.; funding acquisition, W.W.; investigation, K.Z.; methodology, K.Z.; project administration, Q.Z. and W.W.; resources, K.Z. and W.W.; software, K.Z. and W.W.; supervision, Q.Z. and W.W.; validation, K.Z.; visualization, K.Z.; writing—original draft, K.Z. and W.W.; writing—review and editing, Q.Z. and W.W.
Funding
This research was funded by the National Natural Science Foundation of China, grant 11872044, 11772218 and 11702192; China–UK NSFC-RS Joint Project (Grant No. 11911530177 in China and IE181496 in UK); Tianjin Research Programme of Application Foundation and Advanced Technology grant 17JCYBJC18900; and the National Key Research and Development Program of China grant 2018YFB0106200.
Conflicts of Interest
The authors declare no conflicts of interest.
Appendix A
The Krylov–Bogoliubov method is particularly useful to obtain accurate approximate solutions for weakly nonlinear self-excited oscillators. Since Equation (18) is a weakly nonlinear system, it can be written as:
where
In order to turn Equation (A1) into a standard equation, the transformation can be written as:
Differentiating Equation (A3) with respect to t and comparing with Equation (A4), we obtain:
Differentiating Equation (A4) with respect to t gives:
Substituting this expression into Equation (A1) and using Equations (A3) and (A4), we obtain:
Solving Equations (A5) and (A7) for dy/dt and dθ/dt yields:
where y and θ vary slowly with t. Therefore, by using the integral method to solve Equation (A8), we can get:
References
- Dong, L.; Closso, A.B.; Jin, C.; Tras, I.; Chen, Z.; Zhang, J.X. Vibration-Energy-Harvesting System: Transduction Mechanisms, Frequency Tuning Techniques, and Biomechanical Applications. Adv. Mater. Technol. 2019, 4, 28. [Google Scholar] [CrossRef]
- Chong, Y.-W.; Ismail, W.; Ko, K.; Lee, C.-Y. Energy Harvesting For Wearable Devices: A Review. IEEE Sens. J. 2019, 19, 9047–9062. [Google Scholar] [CrossRef]
- Elahi, H.; Eugeni, M.; Gaudenzi, P. A Review on Mechanisms for Piezoelectric-Based Energy Harvesters. Energies 2018, 11, 1850. [Google Scholar] [CrossRef] [Green Version]
- Tran, N.; Ghayesh, M.H.; Arjomandi, M. Ambient vibration energy harvesters: A review on nonlinear techniques for performance enhancement. Int. J. Eng. Sci. 2018, 127, 162–185. [Google Scholar] [CrossRef]
- Wei, C.; Jing, X. A comprehensive review on vibration energy harvesting: Modelling and realization. Renew. Sustain. Energy Rev. 2017, 74, 1–18. [Google Scholar] [CrossRef]
- Wang, C.; Zhang, Q.; Wang, W.; Feng, J. A low-frequency, wideband quad-stable energy harvester using combined nonlinearity and frequency up-conversion by cantilever-surface contact. Mech. Syst. Signal Process. 2018, 112, 305–318. [Google Scholar] [CrossRef]
- Wang, G.Q.; Liao, W.H.; Zhao, Z.X.; Tan, J.P.; Cui, S.J.; Wu, H.Q.; Wang, W. Nonlinear magnetic force and dynamic characteristics of a tri-stable piezoelectric energy harvester. Nonlinear Dyn. 2019, 97, 2371–2397. [Google Scholar] [CrossRef]
- Abdelkefi, A. Aeroelastic energy harvesting: A review. Int. J. Eng. Sci. 2016, 100, 112–135. [Google Scholar] [CrossRef]
- Hamlehdar, M.; Kasaeian, A.; Safaei, M.R. Energy harvesting from fluid flow using piezoelectrics: A critical review. Renew. Energy 2019, 143, 1826–1838. [Google Scholar] [CrossRef]
- Bernitsas, R. Converter of current/tide/wave energy. Provisional Patent Appl. 2004, 60, 252–263. [Google Scholar]
- Hobbs, W.B.; Hu, D.L. Tree-inspired piezoelectric energy harvesting. J. Fluids Struct. 2012, 28, 103–114. [Google Scholar] [CrossRef]
- Xie, J.M.; Yang, J.S.; Hu, H.P.; Hu, Y.T.; Chen, X.D. A piezoelectric energy harvester based on flow-induced flexural vibration of a circular cylinder. J. Intell. Mater. Syst. Struct. 2012, 23, 135–139. [Google Scholar] [CrossRef]
- An, X.; Song, B.; Tian, W.; Ma, C. Design and CFD Simulations of a Vortex-Induced Piezoelectric Energy Converter (VIPEC) for Underwater Environment. Energies 2018, 11, 330. [Google Scholar] [CrossRef] [Green Version]
- Dai, H.L.; Abdelkefi, A.; Wang, L. Theoretical modeling and nonlinear analysis of piezoelectric energy harvesting from vortex-induced vibrations. J. Intell. Mater. Syst. Struct. 2014, 25, 1861–1874. [Google Scholar] [CrossRef]
- Abdelkefi, A.; Nuhait, A.O. Modeling and performance analysis of cambered wing-based piezoaeroelastic energy harvesters. Smart Mater. Struct. 2013, 22, 14. [Google Scholar] [CrossRef]
- Abdelkefi, A.; Nayfeh, A.H.; Hajj, M.R. Modeling and analysis of piezoaeroelastic energy harvesters. Nonlinear Dyn. 2011, 67, 925–939. [Google Scholar] [CrossRef]
- Abdelkefi, A.; Nayfeh, A.H.; Hajj, M.R. Design of piezoaeroelastic energy harvesters. Nonlinear Dyn. 2011, 68, 519–530. [Google Scholar] [CrossRef]
- Shan, X.B.; Tian, H.G.; Xie, T. Energy Harvesting Performance of a Wing Panel for Aeroelastic Vibration. Int. J. Struct. Stab. Dyn. 2019, 19, 16. [Google Scholar] [CrossRef]
- Menon, K.; Mittal, R. Flow physics and dynamics of flow-induced pitch oscillations of an airfoil. J. Fluid Mech. 2019, 877, 582–613. [Google Scholar] [CrossRef]
- Usman, M.; Hanif, A.; Kim, I.-H.; Jung, H.-J. Experimental validation of a novel piezoelectric energy harvesting system employing wake galloping phenomenon for a broad wind spectrum. Energy 2018, 153, 882–889. [Google Scholar] [CrossRef]
- Tan, T.; Yan, Z.; Lei, H.; Sun, W. Geometric nonlinear distributed parameter model for cantilever-beam piezoelectric energy harvesters and structural dimension analysis for galloping mode. J. Intell. Mater. Syst. Struct. 2017, 28, 3066–3078. [Google Scholar] [CrossRef]
- Sirohi, J.; Mahadik, R. Harvesting Wind Energy Using a Galloping Piezoelectric Beam. J. Vib. Acoust. Trans. ASME 2012, 134, 8. [Google Scholar] [CrossRef]
- Zhao, J.; Leontini, J.; Lo Jacono, D.; Sheridan, J. The effect of mass ratio on the structural response of a freely vibrating square cylinder oriented at different angles of attack. J. Fluids Struct. 2019, 86, 200–212. [Google Scholar] [CrossRef]
- Ding, L.; Zhang, L.; Wu, C.; Mao, X.; Jiang, D. Flow induced motion and energy harvesting of bluff bodies with different cross sections. Energy Convers. Manag. 2015, 91, 416–426. [Google Scholar] [CrossRef]
- Zhao, L.; Yang, Y. Enhanced aeroelastic energy harvesting with a beam stiffener. Smart Mater. Struct. 2015, 24, 032001. [Google Scholar] [CrossRef]
- Li, D.; Wu, Y.; Da Ronch, A.; Xiang, J. Energy harvesting by means of flow-induced vibrations on aerospace vehicles. Prog. Aerosp. Sci. 2016, 86, 28–62. [Google Scholar] [CrossRef] [Green Version]
- Wang, J.; Li, G.; Zhou, S.; Litak, G. Enhancing Wind Energy Harvesting Using Passive Turbulence Control Devices. Appl. Sci. 2019, 9, 998. [Google Scholar] [CrossRef] [Green Version]
- Sun, W.; Jo, S.; Seok, J. Development of the optimal bluff body for wind energy harvesting using the synergetic effect of coupled vortex induced vibration and galloping phenomena. Int. J. Mech. Sci. 2019, 156, 435–445. [Google Scholar] [CrossRef]
- Tucker Harvey, S.; Khovanov, I.A.; Denissenko, P. A galloping energy harvester with flow attachment. Appl. Phys. Lett. 2019, 114, 104103. [Google Scholar] [CrossRef] [Green Version]
- Wang, J.; Zhou, S.; Zhang, Z.; Yurchenko, D. High-performance piezoelectric wind energy harvester with Y-shaped attachments. Energy Convers. Manag. 2019, 181, 645–652. [Google Scholar] [CrossRef]
- Barrero-Gil, A.; Alonso, G.; Sanz-Andres, A. Energy harvesting from transverse galloping. J. Sound Vib. 2010, 329, 2873–2883. [Google Scholar] [CrossRef] [Green Version]
- Liu, F.-R.; Zou, H.-X.; Zhang, W.-M.; Peng, Z.-K.; Meng, G. Y-type three-blade bluff body for wind energy harvesting. Appl. Phys. Lett. 2018, 112, 233903. [Google Scholar] [CrossRef]
- Bibo, A.; Abdelkefi, A. Modeling and Characterization of a Piezoelectric Energy Harvester Under Combined Aerodynamic and Base Excitations. J. Vib. Acoust. 2015, 137, 11. [Google Scholar] [CrossRef]
- Javed, U.; Abdelkefi, A. Impacts of the aerodynamic force representation on the stability and performance of a galloping-based energy harvester. J. Sound Vib. 2017, 400, 213–226. [Google Scholar] [CrossRef]
- Javed, U.; Abdelkefi, A. Role of the galloping force and moment of inertia of inclined square cylinders on the performance of hybrid galloping energy harvesters. Appl. Energy 2018, 231, 259–276. [Google Scholar] [CrossRef]
- Abdelmoula, H.; Abdelkefi, A. The potential of electrical impedance on the performance of galloping systems for energy harvesting and control applications. J. Sound Vib. 2016, 370, 191–208. [Google Scholar] [CrossRef]
- Brunton, S.L.; Proctor, J.L.; Kutz, J.N. Discovering governing equations from data by sparse identification of nonlinear dynamical systems. Proc. Natl. Acad. Sci. USA 2015, 113, 3932–3937. [Google Scholar] [CrossRef] [Green Version]
- Dai, H.L.; Abdelkefi, A.; Wang, L. Piezoelectric energy harvesting from concurrent vortex-induced vibrations and base excitations. Nonlinear Dyn. 2014, 77, 967–981. [Google Scholar] [CrossRef]
- Abdelkefi, A.; Barsallo, N. Comparative modeling of low-frequency piezomagnetoelastic energy harvesters. J. Intell. Mater. Syst. Struct. 2014, 25, 1771–1785. [Google Scholar] [CrossRef]
- Varoto, P.S. Dynamic Behavior and Performance Analysis of Piezoelastic Energy Harvesters Under Model and Parameter Uncertainties. In Proceedings of the 36th IMAC Conference and Exposition on Structural Dynamics, Orlando, FL, USA, 12–15 February 2018; pp. 57–66. [Google Scholar]
Figure 1.
Schematic of the galloping piezoelectric energy harvester with a V-shaped groove (GPEH-V).
Figure 1.
Schematic of the galloping piezoelectric energy harvester with a V-shaped groove (GPEH-V).

Figure 2.
The relationship between a1 and Ug of different mass cylinders.

Figure 3.
The amplitude of the cylinder under different wind speeds.

Figure 4.
The amplitude of the cylinder under different a1.

Figure 5.
The amplitude of the cylinder under different a3.

Figure 6.
The amplitude of the cylinder under different a1 and a3 when the wind speed is 6 m/s.

Figure 7.
Wind tunnel experiment equipment. (1) Wind tunnel test section; (2) wind inlet; (3) energy harvester for testing; (4) data acquisition; (5) computer; (6) rheostat; (7) wind outlet; (8) hot wire anemometer.
Figure 7.
Wind tunnel experiment equipment. (1) Wind tunnel test section; (2) wind inlet; (3) energy harvester for testing; (4) data acquisition; (5) computer; (6) rheostat; (7) wind outlet; (8) hot wire anemometer.

Figure 8.
Schematic of experimental apparatus.

Figure 9.
Energy harvester for testing.

Figure 10.
The time-history of experimental model 1.

Figure 11.
The amplitude of model 1 at different flow velocities.

Figure 12.
Relationship between models and the critical velocity.

Figure 13.
Output power of the model at a flow velocity of 10 m/s.

Figure 14.
The voltage under different flow velocity of seven experimental models.

Figure 15.
The output power under different flow velocity of seven experimental models.

Figure 16.
The total efficiency under different flow velocity of seven experimental models.

Figure 17.
The voltage of model 6 under different resistance loads in different flow velocities.

Figure 18.
The output power of model 6 under different resistance loads in different flow velocities.
Figure 18.
The output power of model 6 under different resistance loads in different flow velocities.


Table 1.
Physical parameters of the GPEH-V.
| Parameters | Description | Values |
|---|---|---|
| (m) | Length of beryllium bronze substrate | 110 × 10−3 |
| (m) | Width of beryllium bronze substrate | 15 × 10−3 |
| (m) | Thickness of beryllium bronze substrate | 0.8 × 10⁻³ |
| (m) | Length of MFC M8507 P2 | 100 × 10−3 |
| (m) | Width of MFC M8507 P2 | 0.3 × 10⁻³ |
| (m) | Thickness of MFC M8507 P2 | 100 × 10−3 |
| (m) | Length of the tip mass | 20 × 10−3 |
| (m) | Width of the tip mass | 8.3 × 10⁻³ |
| (kg/m3) | Density of beryllium bronze | 8.3 × 10³ |
| (kg/m3) | Density of MFC M8507 P2 | 5.4 × 10³ |
| (kg/m3) | Density of the tip mass | 4.5 × 10² |
| (Pa) | Young’s modulus of beryllium bronze | 128 × 109 |
| (Pa) | Young’s modulus of MFC M8507 P2 | 30.336 × 10⁹ |
| Strain coefficient of MFC M8507 P2 | −320 × 10−12 | |
| Permittivity component at constant strain | 13.28 × 10⁻⁹ | |
| (kg/m3) | Air density | 1.24 |
| R (Ω) | Load resistance | 9000 |
Table 2.
The cross-section shape of a cylinder.
| Model Number | 1 | 2 | 3 | 4 | 5 | 6 | 7 |
|---|---|---|---|---|---|---|---|
| Section shape |  |  |  |  |  |  |  |
| 90 | 13 | 20 | 27 | 34 | 45 | 64 |
Table 3.
Summary of seven groups of energy harvester characteristics at wind velocity of 10 m/s.
| Section Shape |  |  |  |  |  |  |  |
|---|---|---|---|---|---|---|---|
| Model number | 1 | 2 | 3 | 4 | 5 | 6 | 7 |
| 90 | 13 | 20 | 27 | 34 | 45 | 65 | |
| 2.2961 | 1.2538 | 1.7823 | 1.6411 | 1.7067 | 1.9334 | 2.3276 | |
| −18.7142 | −6.2630 | −14.1578 | −9.1829 | −9.6315 | −8.2705 | −25.0288 | |
| 2.56 | 4.69 | 3.30 | 3.58 | 3.45 | 3.04 | 2.53 | |
| Power of numerical solution (W) | 5.68×10⁻⁴ | 4.66×10⁻⁴ | 4.67×10⁻⁴ | 6.12×10⁻⁴ | 6.70×10⁻⁴ | 9.26×10⁻⁴ | 4.16×10⁻⁴ |
| Power of experimental solution (W) | 5.94×10⁻⁴ | 4.84×10⁻⁴ | 5.57×10⁻⁴ | 5.84×10⁻⁴ | 6.90×10⁻⁴ | 9.30×10⁻⁴ | 3.82×10⁻⁴ |
| Total efficiency of numerical solution (%) | 0.044 | 0.036 | 0.036 | 0.048 | 0.051 | 0.071 | 0.033 |
| Total efficiency of experimental solution (%) | 0.044 | 0.036 | 0.036 | 0.047 | 0.052 | 0.072 | 0.032 |
© 2019 by the authors. Licensee MDPI, Basel, Switzerland. This article is an open access article distributed under the terms and conditions of the Creative Commons Attribution (CC BY) license (http://creativecommons.org/licenses/by/4.0/).
Share and Cite
MDPI and ACS Style
Zhao, K.; Zhang, Q.; Wang, W. Optimization of Galloping Piezoelectric Energy Harvester with V-Shaped Groove in Low Wind Speed. Energies 2019, 12, 4619. https://doi.org/10.3390/en12244619
AMA Style
Zhao K, Zhang Q, Wang W. Optimization of Galloping Piezoelectric Energy Harvester with V-Shaped Groove in Low Wind Speed. Energies. 2019; 12(24):4619. https://doi.org/10.3390/en12244619
Chicago/Turabian StyleZhao, Kaiyuan, Qichang Zhang, and Wei Wang. 2019. "Optimization of Galloping Piezoelectric Energy Harvester with V-Shaped Groove in Low Wind Speed" Energies 12, no. 24: 4619. https://doi.org/10.3390/en12244619
Note that from the first issue of 2016, this journal uses article numbers instead of page numbers. See further details here.