Article

Real-Time Minimization Power Losses by Driven Primary Regulation in Islanded Microgrids

by
Quynh T.T Tran
1,2,
Eleonora Riva Sanseverino
2,
Gaetano Zizzo
2,*,
Maria Luisa Di Silvestre
2,
Tung Lam Nguyen
3 and
Quoc-Tuan Tran
4
1
Institute of Energy Science, Vietnam Academy of Science and Technology, Hanoi 10000-04, Vietnam
2
Department of Energy, Information Engineering and Mathematical Models, University of Palermo, 90128 Palermo, Italy
3
Department of Electrical Engineering, The University of Da Nang—University of Science and Technology, Da Nang 550000, Vietnam
4
CEA-INES, 73370 Le Bourget-du-lac, France
*
Author to whom correspondence should be addressed.
Energies 2020, 13(2), 451; https://doi.org/10.3390/en13020451
Submission received: 6 December 2019 / Revised: 8 January 2020 / Accepted: 11 January 2020 / Published: 17 January 2020
(This article belongs to the Special Issue Energy Management System for Smart Grids)

Abstract

:
Islanded microgrids are small networks that work independently from the main grid. The frequency and voltage in islanded microgrids are affected directly by the output power of distributed generators and power demand variations. In this work, a real-time driven primary regulation, which relies on optimized P-f droop coefficients, is proposed. In all operating conditions, it minimizes the power losses for islanded microgrids. The proposed configuration will allow the optimization modules to interact with each other and adjust parameters producing a suitable power sharing among generators. The methodology is tested based on a hardware-in-the-loop experimental set-up where distributed generators are connected to a group of loads. A parametric analysis is implemented for verification of the effectiveness of the proposed configuration as well as the improvement of the system reliability.

Graphical Abstract

1. Introduction

Microgrids are small- or medium-scale electric distribution networks that include multiple loads, distributed generation units, and storage systems. These distributed generation units provide energy in response to the load demand at different levels along the day. The distributed generation units are in most cases renewable energy-based, and loads are connected through a physical network. Dispatchable generators are operated by an advanced control technology to distribute the power flows in the system and provide energy usage information [1].
In microgrids, the energy efficiency and reliability of supply are improved by reducing the transmission length and integrating distributed generators, and, as a result, the environmental impact is decreased. Microgrids (MGs) can be operated in either grid-connected or islanded mode [2]. When operating in grid-connected mode, microgrids purchase electricity from the main grid to balance the power mismatch between suppliers and consumers [3] or sell unused electricity to the main grid for maximizing the operational benefits [4]. Islanded microgrids are small power grids that suffer from a number of problems deriving from the fluctuating behavior of some renewable-based distributed generators (DGs). In these systems, the frequency and voltage are the main features to be controlled so as to support the optimal power sharing among the generators [5,6,7]. Such power sharing is carried out at different regulation levels, ranging from the tertiary regulation level, acting on the scale of tens of minutes or hours, to the secondary and primary regulation (also called droop regulation) acting at the scale of seconds and milliseconds respectively.
In MGs, a three-level control hierarchical architecture [2] allows providing good power quality. The three levels can be considered as separated since they act at different times.
  • The primary control is usually designed to use a droop-control method to stabilize voltage and frequency and regulate the power sharing between distributed generators in microgrids. This control level is also used to mitigate the circulating currents between paralleled three-phase generators’ converters that cause over-current phenomenon in the power electric devices and damage the capacitors in milliseconds.
  • The secondary control is designed to compensate for the voltage and frequency deviation caused by the primary control. This control level has a slower dynamics response than the primary control level and is explicated in the range of seconds. In this way, the secondary control level can also be implemented to satisfy the power quality requirements.
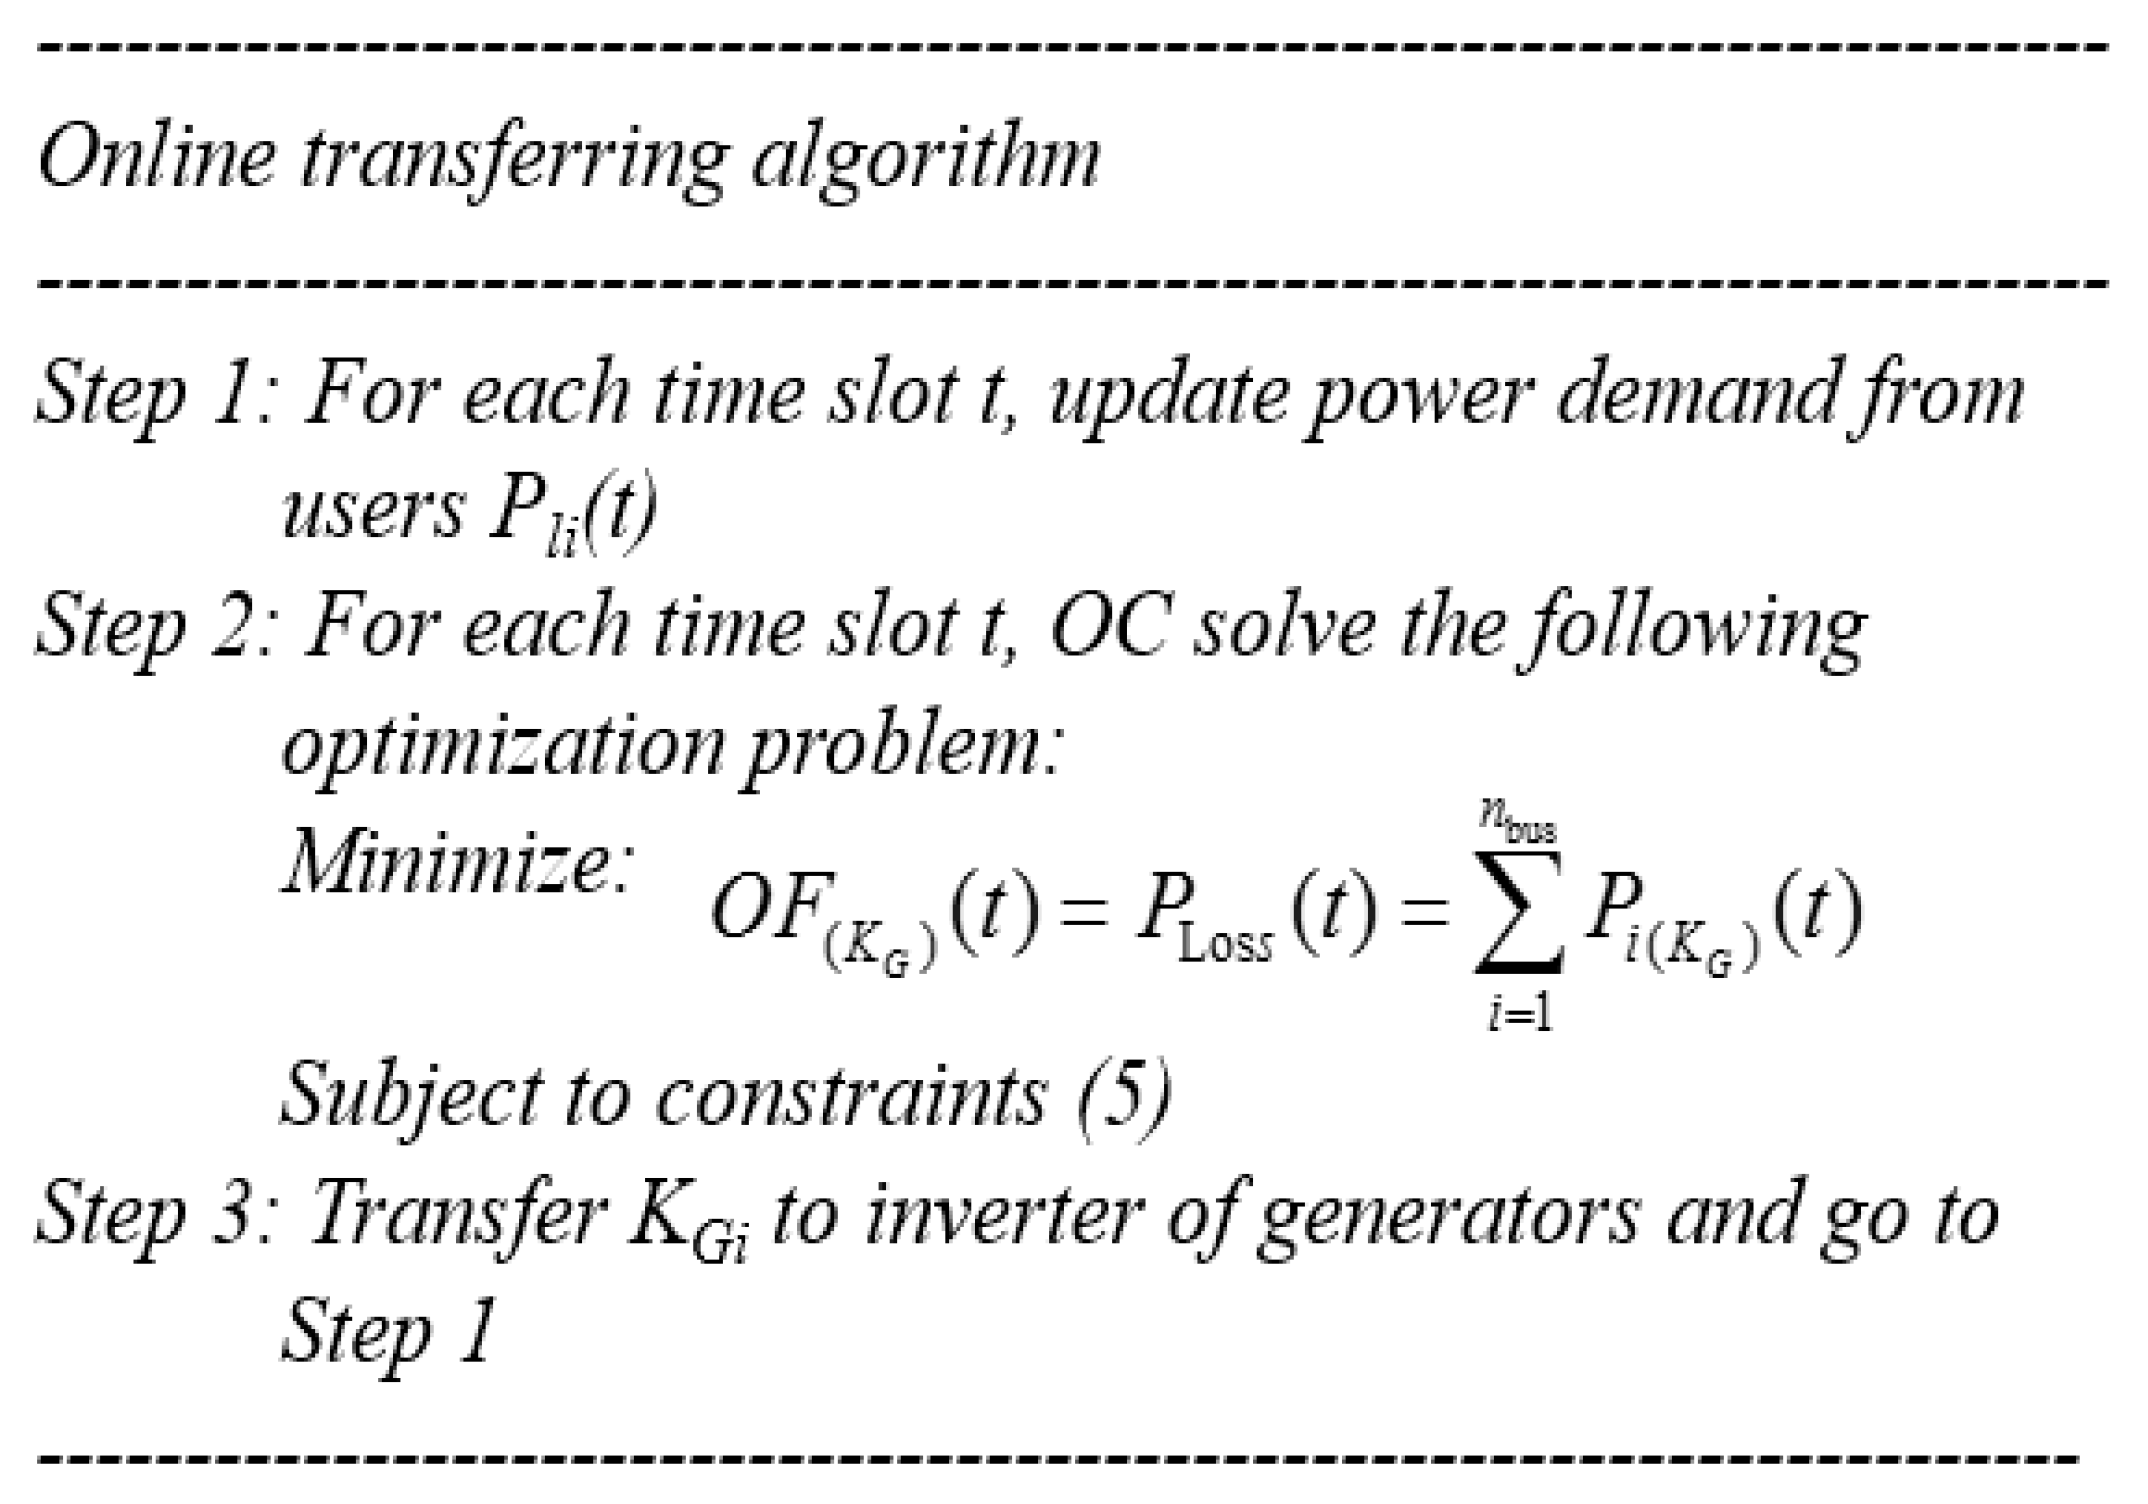
  • The tertiary control is the last and slower control level. It manages the power flows inside the MG and between the MG and the main grid providing the distributed energy resources the operating set-points. The tertiary control level also provides optimal operation setting by solving optimization problems for minimizing power losses and operating costs.
The energy management process as a whole ensures meeting the availability of the energy resources to customers’ power demands in an optimal way. The energy management system (EMS) receives the loads and energy resources forecasting data, customer information/preference, policy, and electricity market information to determine the best available controls on power flow, utility power purchases, load dispatch, and DG or distributed energy storage scheduling [8]. In [9], the operation problem of microgrids is modeled considering the economical, technical, and environmental issues, as well as uncertainties related to loads, wind speed, and solar radiation and was solved using mixed-integer non-linear programming (MINLP). In [10], a discrete-time mathematical formulation is demonstrated to cope with the underlying uncertainty through a rolling horizon approach to optimize the management of a microgrid.
A robust optimization algorithm for scheduling the dispatchable units is presented in [11,12]. In [13], an energy management system (EMS) acting in real time is designed to solve the economic management problem for microgrids in both grid-connected and islanded operation modes. The system is validated on a real-time platform for a simple system to show the improvement of the proposed approach. Typically, energy management is implemented at the tertiary control level and aims to optimize the operation cost of the system. However, all optimization approaches do require a three-levels architecture in which secondary and tertiary regulation will produce profound modifications in the operating condition.
In this paper, primary regulation also addresses the power losses minimization by an on-line droop coefficients optimization that also accounts for frequency control. In this way, the secondary regulation will have a less (maybe zero) impacting role and requires less energy for adjusting the setpoints of generation units.
In the literature, the primary regulation is explicated commonly through a linear droop control for adjusting frequency and voltage to modulate the power sharing of generators in the power system. The inverter acts as a voltage source. The frequency and voltage adjustment of generators, which are integrated into the microgrid, can be implemented by the droop control technique as follows [14]:
P G i P G i 0 = K G i · ( f f 0 )
Q G i Q G i 0 = K d i · ( | V i | V 0 )
where f0 and V0 are the rated frequency and voltage respectively corresponding at the operating points (chosen at the tertiary level) PGi0, QGi0; KGi, and Kdi are the frequency and voltage droop coefficients chosen based on the rated power of the DGs. Typically, KGi and Kdi are kept at constant values in the computational process.
In order to adapt the resistive nature of branches to the droop characteristics above, a virtual impedance is needed. However, the value of this impedance must be adjusted in order to compensate for the variable nature of loads. For this reason, either the adjustment of droop coefficients or the adjustment of the same virtual impedances are needed [15]. In [16], the droop method is applied together with a suitably designed virtual impedance that can adaptively vary to eliminate the reactive power deviation as well as to enhance the system stability in microgrids. The advantage of this latter control method is that there is no communication between parallel converters. Moreover, the implementation is simpler and easier. However, the drawbacks of the conventional droop control method even with adjustments are still poor accuracy in the load sharing among generators when supplying non-linear loads [15]. In [17], a droop control strategy is proposed to refine the sharing of reactive power while keeping frequency and voltage in their limitations. The stability assessment is implemented on two hybrid AC/DC cases in Matlab/Simulink to express the effectiveness of the proposed strategy.
The continuous adjustment of droop regulation coefficients has been mentioned in some papers. In [18], an online droop coefficient adjustment is illustrated for a direct current (DC) microgrid. The paper shows the negative impacts of too high or too low droop coefficients on the bus-voltage and proposed an online tuning of droop coefficients to eliminate the bus-voltage discontinuity. However, the paper is only applied to DC microgrid where the voltage is the global indicator for microgrid’s power balance while in alternating current (AC) microgrids, both frequency and voltage must be considered. In [19], an online uninterruptible power supply system was introduced to control the load sharing in a small test system based on the droop control method. In [20,21], the conventional Q-V droop control is suitably modified to adjust droop coefficients by sparse communication among DGs and considering the average level of reactive power injection from neighboring units. The results are compared with those obtained with other accurate methods for reactive power sharing between converters. In [22,23], an online droop tuning for distributed generators is proposed to coordinate the power management using artificial neural network algorithms in both grid-connected and islanded modes. In [24], an online generalized droop control is presented based on the demand response to regulate the frequency in the system. However, those proposed control systems are only validated in Matlab/Simulink simulation.
All the reviewed applications, such as the one proposed here, have some inherent latency due to the physical communication links, in that sense online is to be intended as real-time, namely as systems changing their state as a function of time and thus introducing some latency.
In this paper, an improved primary regulation method theoretically illustrated in [25] is expanded and a hardware-in-the-loop (HIL) application is proposed over an online communication system to correct the power sharing between generators and overcome the limitation of previous works.
Following this method, when the power output of renewable-based generators fluctuate significantly, the system will collect the operational parameters in real-time the droop curve will not be fixed anymore, it is changed on-line as the optimal power flow (OPF) is run in times that are compatible with the operation of the microgrid. In this way, the system operates more flexibly and optimally than traditional systems, even in the case of unpredictable or changing loads. In this work, an experimental study is carried out in HIL simulation to test the operating characteristics of the system when the P-f droop coefficients change to adapt to load changing conditions in 24 h. HIL simulation is a technique that includes a part of the hardware in the simulation loop of the power system and it provides near reality real-time testing conditions. This verification also helps to assess the reliability of the data exchange between the optimization controller and the real-time simulator of the microgrid. Instead of checking out the control algorithms on a mathematical model, the real hardware has been used in real-time simulation loop to check the validity as well as ensuring the control signal delivery within the desired sample period [26]. Therefore, real-time HIL simulations become essential for validating control algorithms in microgrids. The system has been modeled in real-time but the scheduling time was scaled down from hours to minutes, not affecting the validity of obtained results.
In this work, the online OPF produces minimum losses droop coefficients, thus the objective function of the OPF problem is to minimize the power losses in the test microgrid. Tertiary control determines the minimum cost operating set-points of the generators. To support this integration, the authors propose a two sub-levels architecture, already described in [27]. The first sub-level provides a feasible and minimum cost operating point. The second sub-level solves the optimal power flow, devising the set points of inverter-interfaced generation units and rotating machines with minimum power losses in a point that is nearby the minimum cost operating point. In this way, the solution provides a minimum cost and minimum power losses operating point, while satisfying the technical constraints.
The contributions of this paper are summarized as follows:
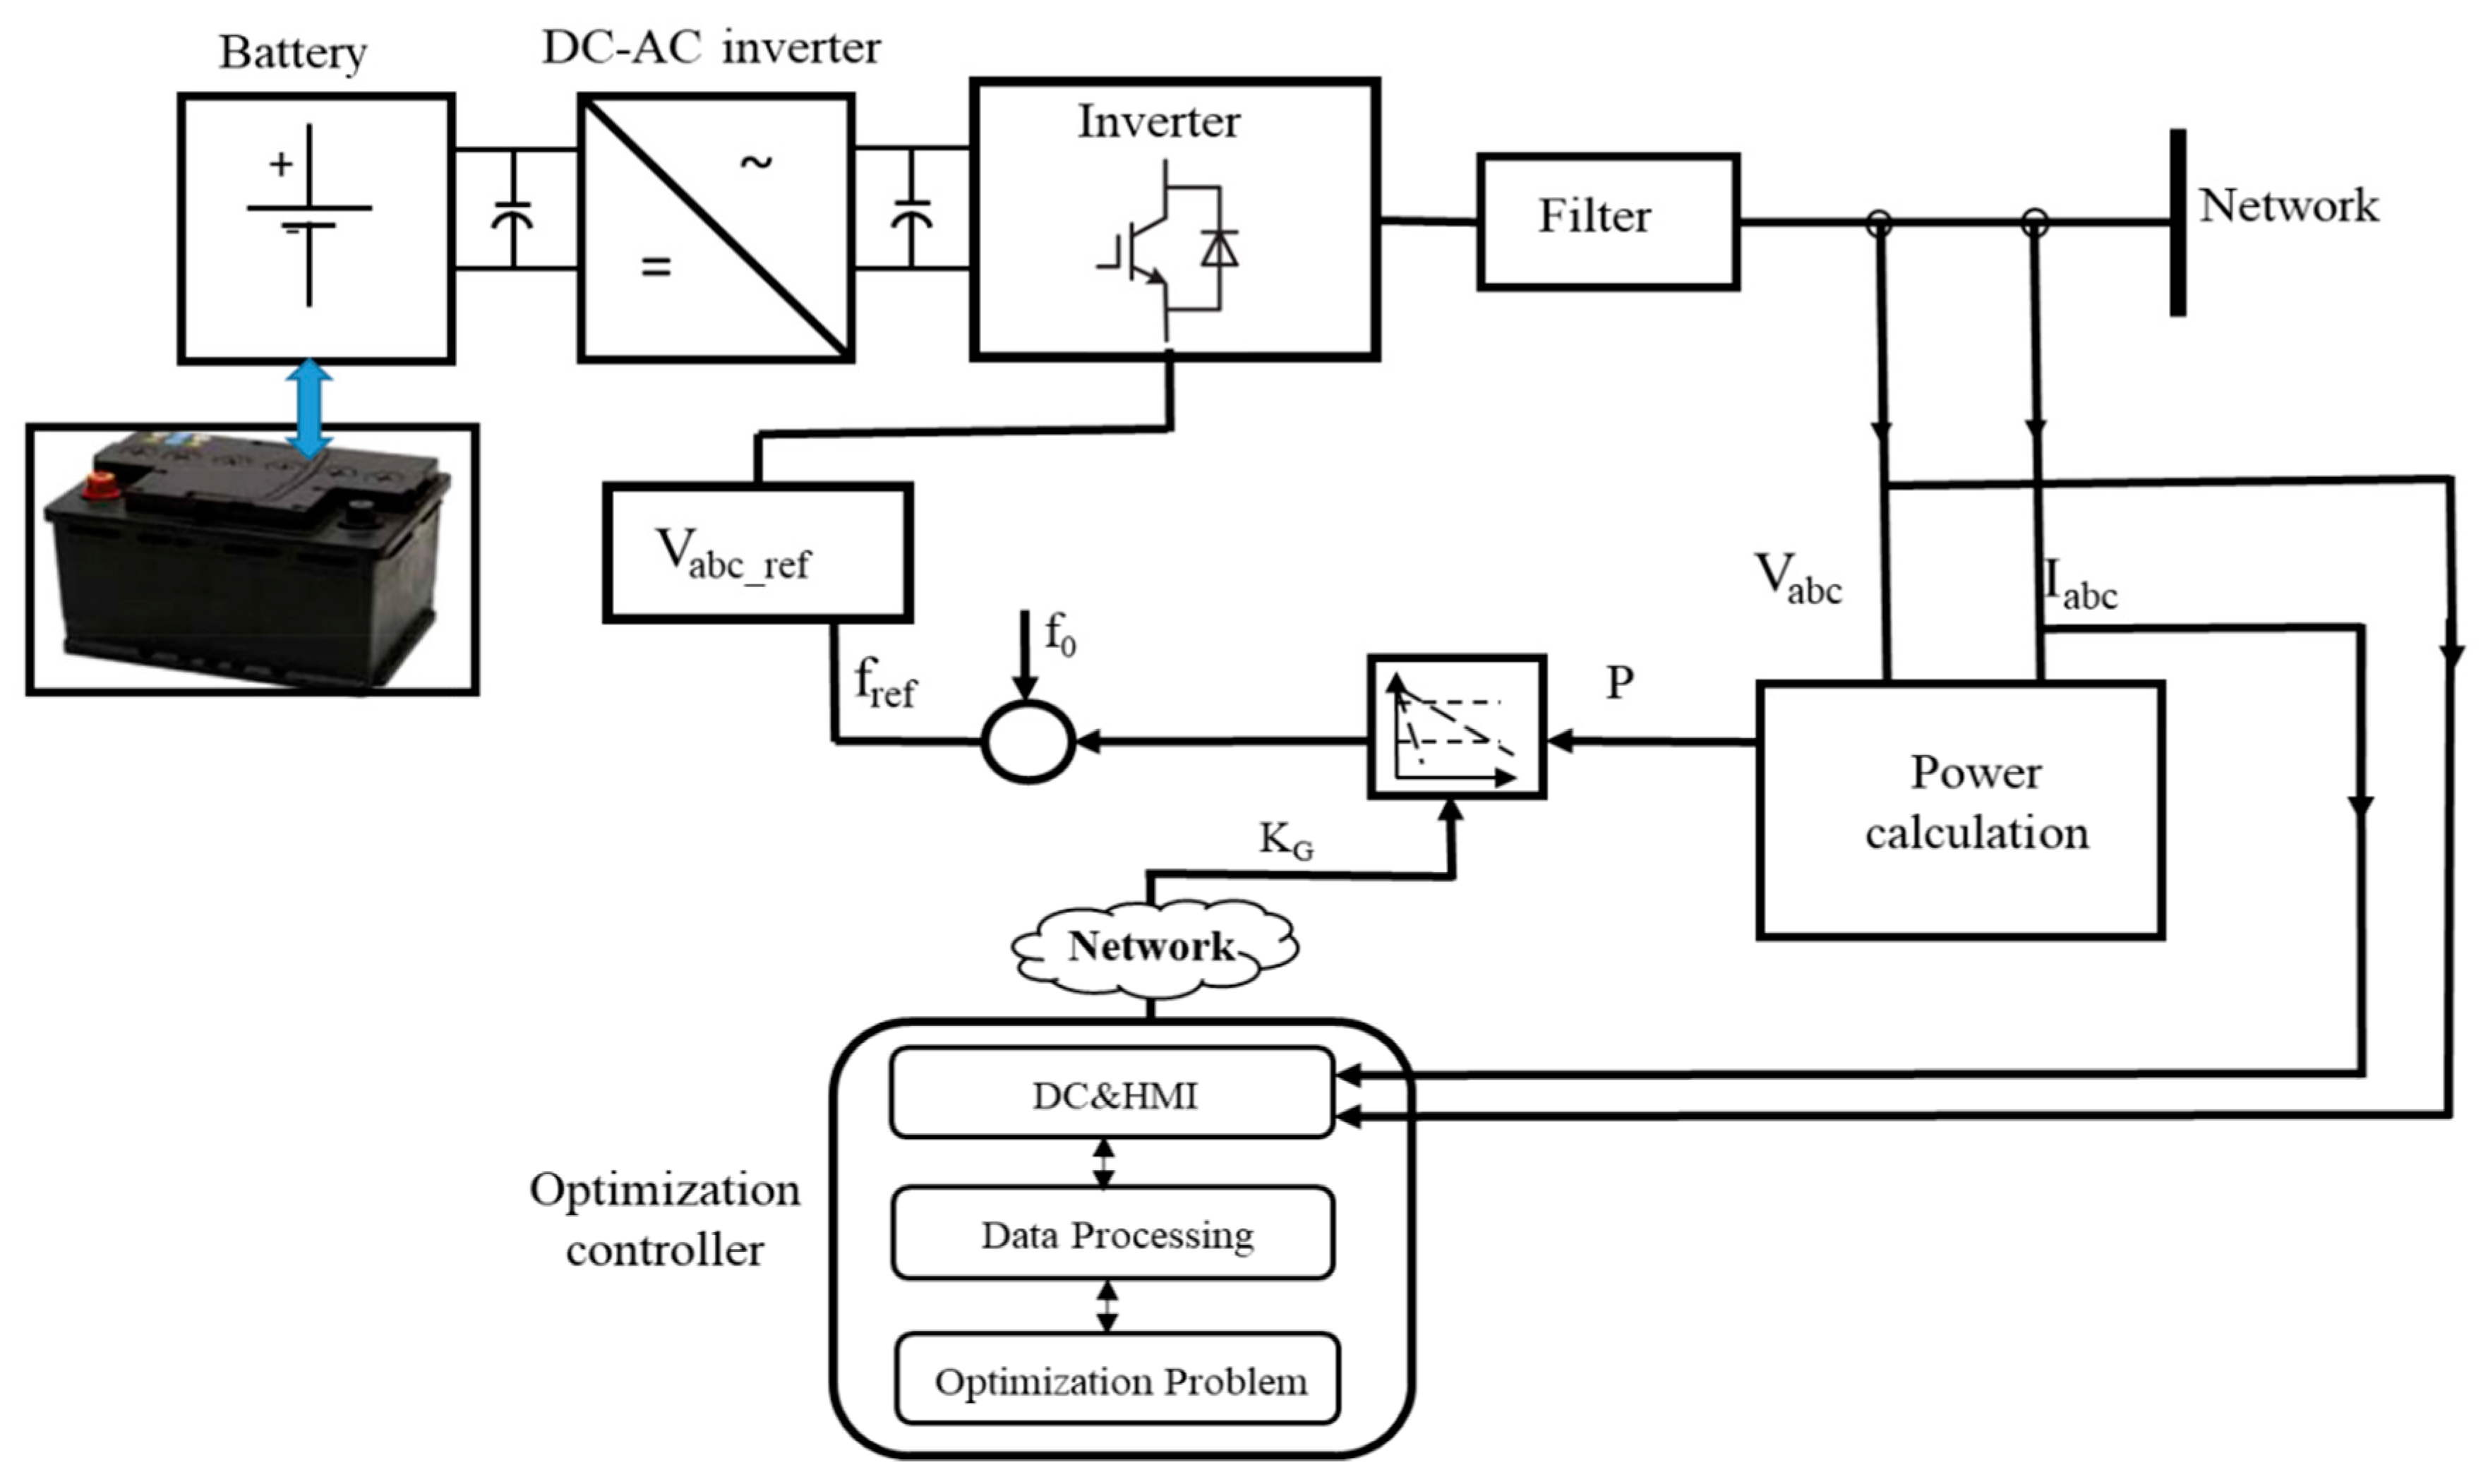
  • A structure of an online driven droop regulation system is presented to decrease operating energy losses. The designed controller relies on the real-time measurements and online power flow optimization within microgrids by adjusting the droop coefficients of inverter interfaced units.
  • Improving the real-time dynamic response of distributed energy resources and maintaining real-time stability for the microgrid. Indeed, the volumes of secondary and tertiary control taken over from primary control are relieved, thus getting a more reliable operation for microgrids.
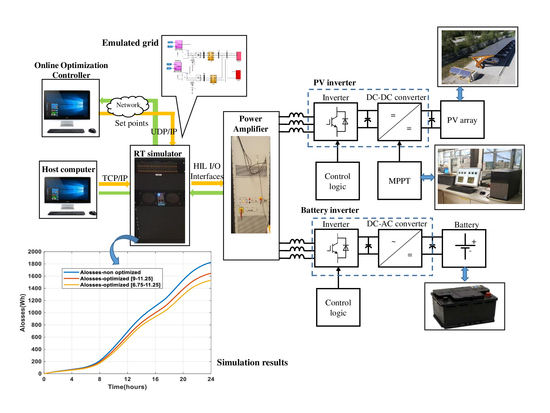
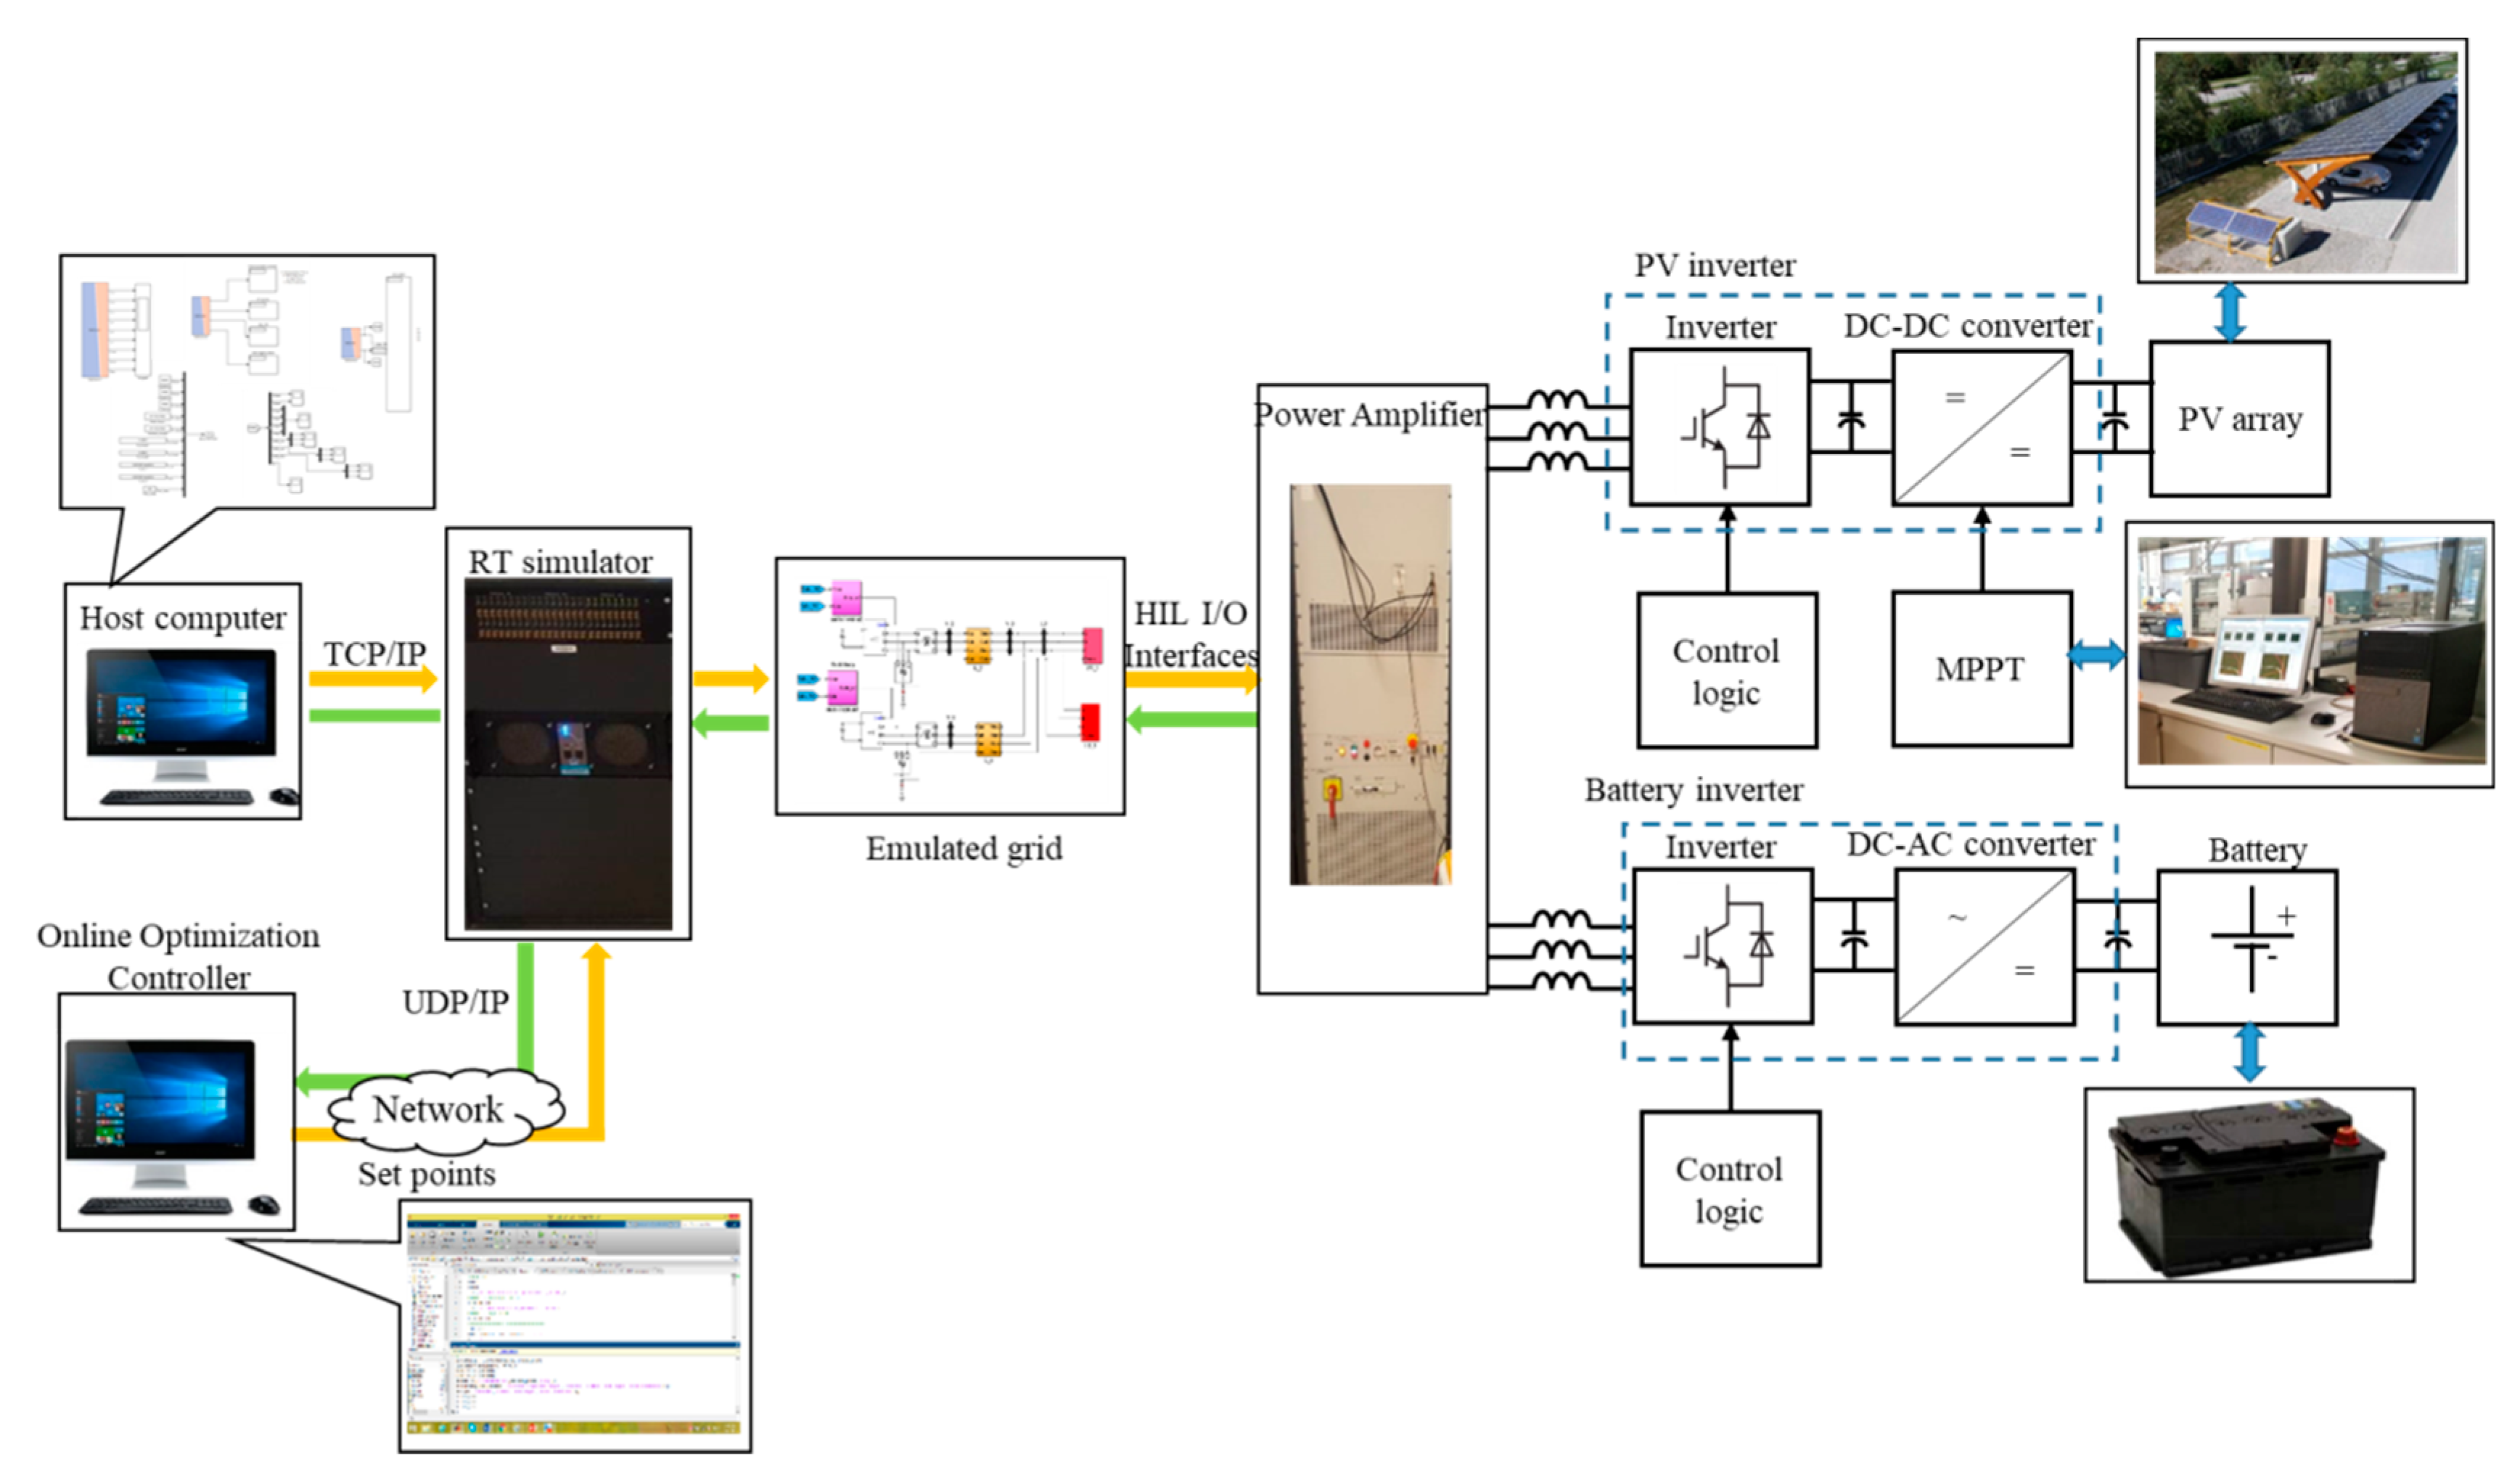
  • In the application part of the work, experimental validation scenarios for a laboratory platform with optimization controllers and power-hardware-in-the-loop setups have been implemented to test the online operating characteristics of the system. During the experiments, the P-f droop coefficients have changed to adapt to load changing conditions. It is proved that the proposed architecture under realistic conditions achieves improved operation.
The paper is organized as follows: Section 2 provides a detailed specification of the optimization problem of droop coefficients through optimal power flow. Section 3 details the communication structure of the online driven droop regulation for minimum power losses, presenting an overview of smart grid components including interface components, control of generation units, power flow, and data transmission and monitoring. Finally, the detail of the experimental part of this work such as system installation, test environment, and scenarios are considered in Section 4. Results are presented and analyzed in Section 5. Finally, the conclusions are presented in Section 6.

2. Optimization Program

The optimization controller (OC) is the core of the proposed architecture system which sets decision variables based on optimizing the objective function. Inside the OC, an OPF for islanded microgrids finds, at each loading condition and/or renewable generation units injection, a minimum-losses operating state for the generators. In islanded mode, microgrids operate independently, in this case, the system operation is more affected by frequency disturbance due to the fluctuations of DGs output and load demands. To cope with this problem, an optimized driven P-f primary regulation, using variable coefficients producing minimized power losses in islanded microgrids, is proposed. Namely, the OPF is solved keeping as variables the droop coefficients of the power converters. In what follows, the OPF problem formulation is presented briefly; for further details, please refer to paper [25].
Consider a microgrid including n generators connected to m loads. The power generated by generator i-th with droop regulation can be expressed as in (1) and (2), called droop buses, where one or both KGi are variable and will be chosen optimally in the range [KGmini; KGmaxi] to minimize an objective function. To improve the clarity of the presentation of the problem formulation, the Q-V droop coefficients will be considered as fixed quantities.
The generic power injection Pi(KG) at the i-th bus can be expressed as:
P i ( K G ) = j = 1 n b r a n c h | V i | · | V j | · | Y i j | · cos ( θ i j δ i + δ j ) .
In this case, the dependency with the droop coefficients KGi can be evidenced, as Pi(KG) can be written as the difference between generated (PGi) and consumed (PLi) power at the i-th bus, as reported by Equation (1). In (3), as expressed in [25], Vi and Vj are the i-th and j-th phasor bus voltages; δi and δj are the phase angles of the i-th and j-th bus voltages. Although not shown here, the values of Vi and Vj, δi and δj are the results of the optimized power flow process that is depending on the value of Kdi and KGi at droop buses; Yij is the admittance of branch ij; θij is the argument of Yij; nbranch is the number of branches connected to bus i.
The objective function of the OPF problem is thus to minimize the real power losses, Ploss of the system:
O F ( K G ) = P l o s s = i = 1 n b u s P i ( K G )
where nbus is the number of buses in the system.
The following constraints, also including (1) and (2), must hold:
i = 1 n G P G i = i = 1 n d P L i + P l o s s i = 1 n G Q G i = i = 1 n d Q L i + Q l o s s K G i m i n   K G i   K G i m a x P G i m i n   P G i   P G i m a x , i = 2 ÷ n G f m i n   f     f m a x V m i n   V     V m a x I b r a n c h j I m a x   b r a n c h j , j = 2 ÷ n b r a n c h
where nG is the number of generators in the microgrid, nd is the number of load buses, and nbranch is the number of transmission branches. Figure 1 shows the flowchart of the GSO algorithm.
Ant Colony Optimization (ACO), Particle Swarm Optimization (PSO), and Glow-worm Swarm Optimization (GSO) are the three most popular swarm algorithms. In [28], it is proved that the GSO has a high ability to look for globally optimal solutions and has a fast convergence rate, achieving more stable and accurate results compared to other methods [25]. Thus, GSO is selected to solve the optimization problem in this paper. This optimization method simulates the attraction exerted on the fireflies by the brightness of the others to find multiple optimal solutions in a multimodal search space [29].

3. Structure of the Online Driven Droop Regulation for Minimum Power Losses Operation

The online model is described by the mean of the Data acquisition, Communication and Human Machine Interface (DC&HMI). The system parameters are monitored by using the data acquisition system, then the HMI will transfer the digital values after processing through the internet. In this way, the user can control the input parameters and supervise the system. This process is operating continuously. The block diagram of the online operating system is shown in Figure 2.
The demand power of users and the maximum power capacity of generators is updated in every decision time step for real-time execution. As presented in Section 2, at every time step, the OC provides a new operating set point. At the beginning of each time slot, the measured power demand is sent to the power calculation (PC) block while the OC verifies the power capacity of the generator. The OC also aggregates other measurements gathered from the power system such as the actual loads, and lines parameters. Then it executes the online OPF algorithm using the updated information.
At every time slot, the PC block sends a power grid information request to the network that returns relevant real-time grid measures, such as loads condition. After gathering this necessary information, OC applies the optimization algorithm to find KGi for minimizing power losses of the system in the current time slot. Then the results are sent to the inverters controllers to adjust their power outputs. In this particular case, there is only one optimized generator, which is DGi. Figure 3 expresses the pseudocode of the online optimization process. The features of the computer used for simulation are shown in Figure 4 below.
Note that the system is modeled in a sample of 24 h, but the time of scheduling is scaled down from hours to minutes. It took between 15 and 30 s to complete the process of solving the optimization problem. This period of time will be set as a time slot of the process.

4. Simulations and Results

4.1. Simulation in an Optimization Program

The proposed optimization program is tested for the different microgrid control systems to check the effectiveness of the approach. Three test systems are considered in this application and the results are illustrated in the Figure 5, Figure 6 and Figure 7 below. The main regulating generator in all test systems is DG1.
These three case studies demonstrate the ability of the proposed methodology to solve the power losses minimization problem under different microgrid scales. It can be seen that the different microgrid configuration produces different power losses improvement curves. As shown in Figure 5b, Figure 6b and Figure 7b, the power losses of the corresponding test systems are improved about 14–18% while satisfying all the frequency and voltage constraints. The detail of the results for a specific test system will be presented in Section 5. These results are positive signals for authors to believe that the offline optimization program can work well on the online operating system.

4.2. Hardware in the Loop Simulation

To check how the control functions are sensitive to input data and parametric variations in reality, such as line thermal limits, load changing, etc., this study presents a laboratory hardware in the loop implementation of the test system described in Figure 8. To ensure results that best reflect the effectiveness of the proposed method, the authors decided to choose the test microgrid that is taken from Murty’s manuscripts [30]. The model of the test system includes one photovoltaic (PV) system and two real batteries connected to a common load bus.
The experiments described in this section have been implemented at the National Institute of Solar Energy (INES), Grenoble, France. This research infrastructure can provide a complete range of rapid control prototyping (RCP) solutions to develop and test microgrid’s control and operation quickly [31]. Along this section, the experimental installation, the operation of the test microgrid and simulation results are presented.
The test scenarios are designed to analyze stability issues that may arise for this type of operation and the real saving in the active power as compared to standard droop. At first, conventional droop control is applied to both generators. Then, with the improved regulation method, some experiments are implemented with the on-line changing values of KG2 obtained from the resolution of the OPF.
If the droop coefficients are too high, it can lead the system to instability. If the droop coefficients are too low, it results in a low response of inverters [32]. Therefore, for testing the proposed method in different conditions, KG1 is fixed while KG2 in this work is chosen optimally in the range (9–11.25) and then in a wider range (6.75–11.25).
Therefore, three scenarios are implemented:
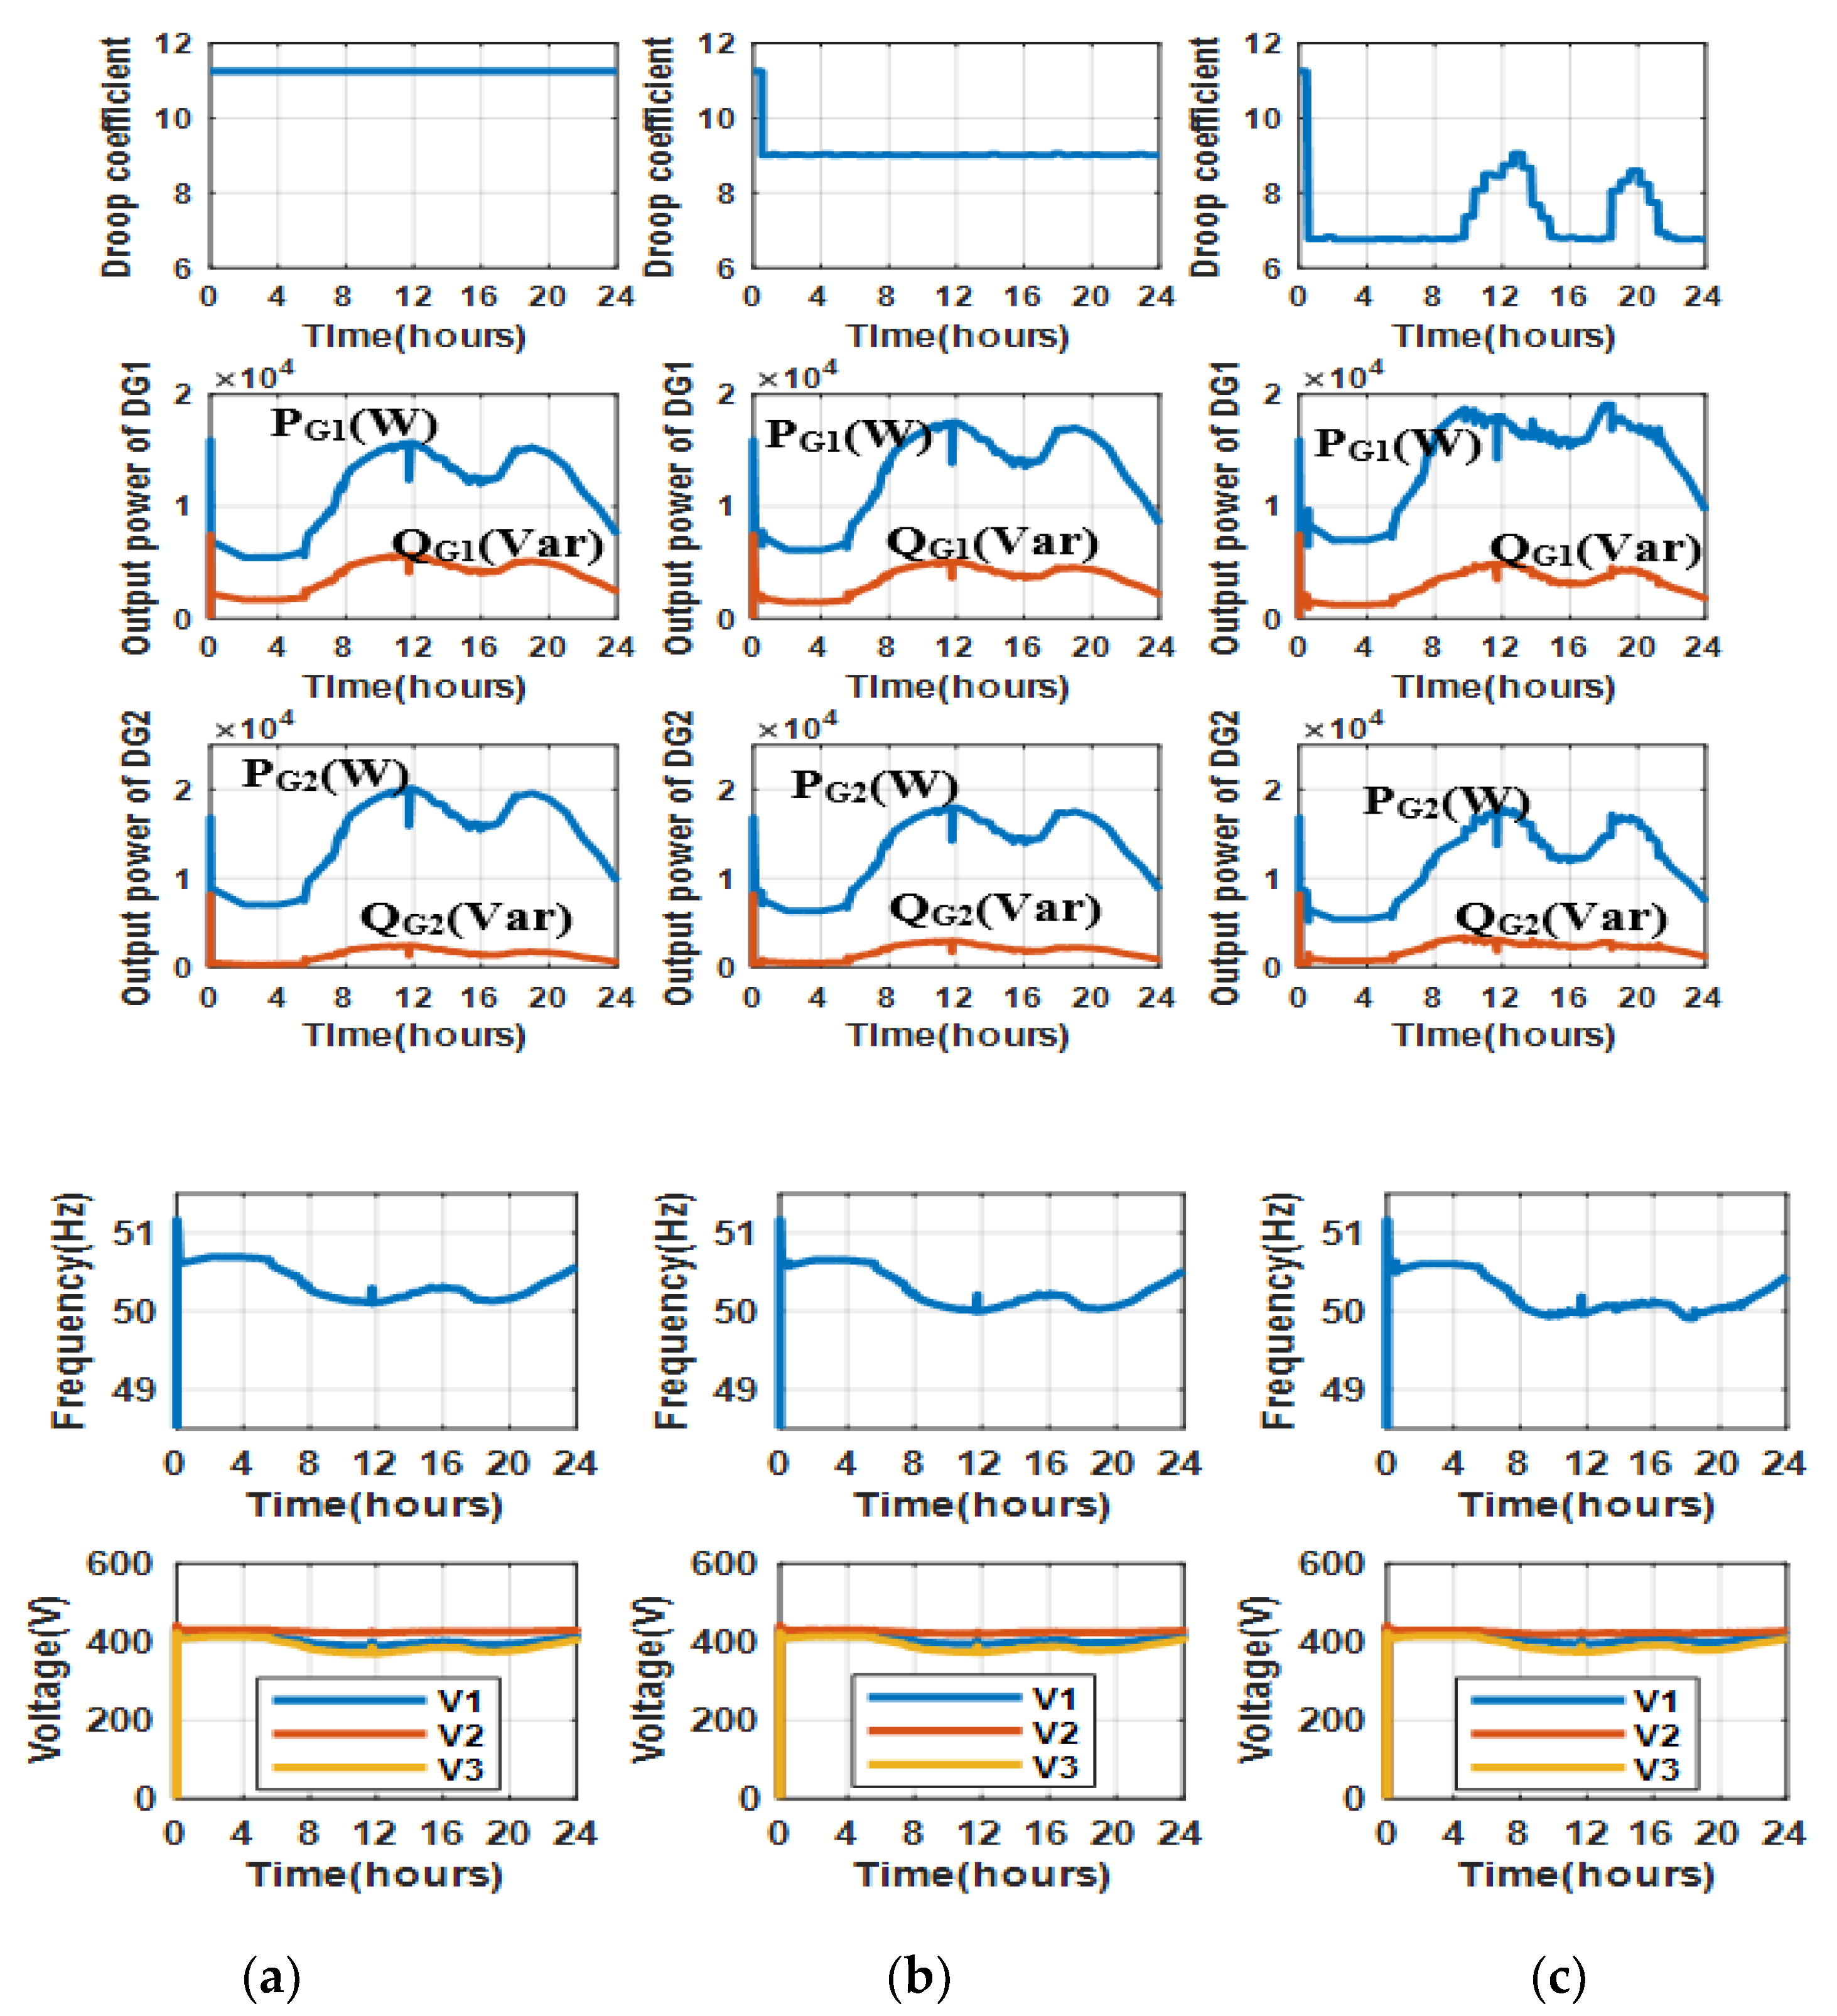
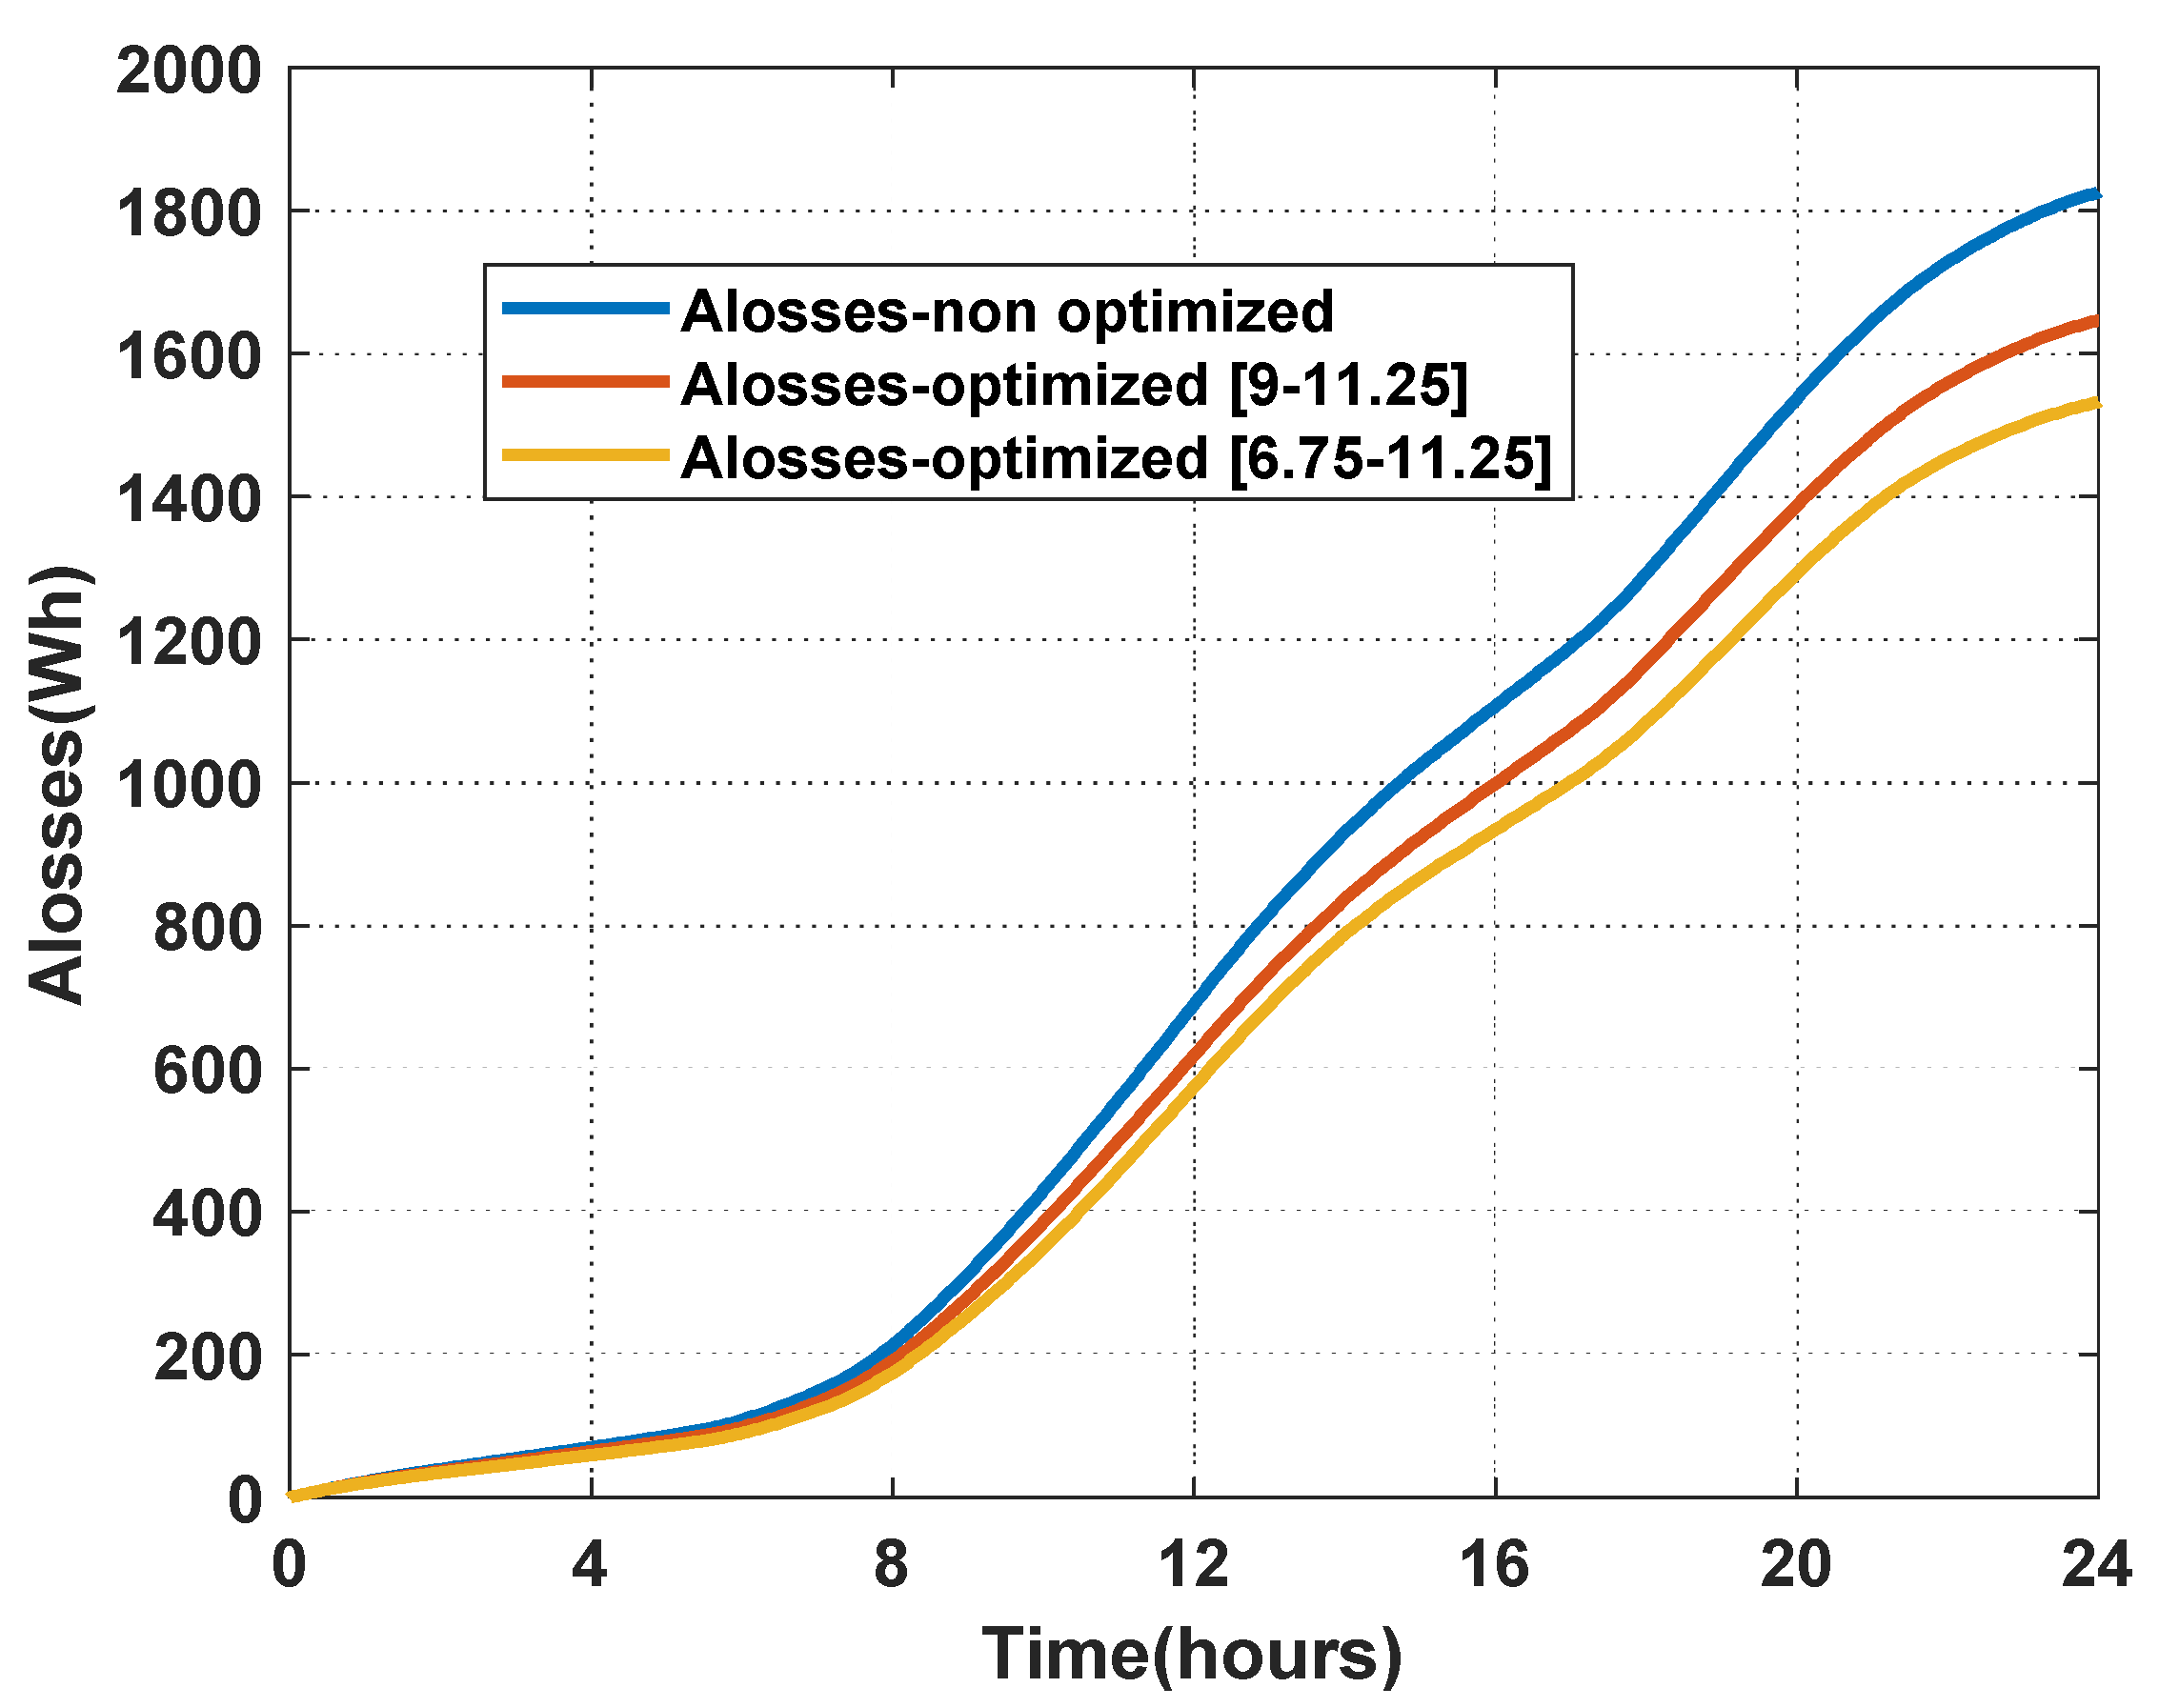
  • Scenario 1: Test system is operated with the conventional droop control method;
  • Scenario 2: Test system is operated with the proposed optimized droop control method to see how the system operates when KG2 is selected optimally in the range (9–11.25);
  • Scenario 3: Test system is operated with the proposed optimized control method to see how the system operates when KG2 is selected optimally in a wider range (6.75–11.25).
At first, a model of the system is implemented in the RT-lab simulator to check operating parameters, then it is tested in hardware-in-the-loop simulation with the participation of a PV system to check the stability of the system and the ability of the optimization program to respond to load variations.
At the software level, the online driven droop regulation has been implemented in OPAL-RT simulator. The configuration of HIL system is expressed in Figure 9. In this work, OPAL-RT 5142 simulator is used. There is one host computer with a real-time (RT) software installation connected to a RT simulator via a Transmission Control Protocol/Internet Protocol (TCP/IP). The optimization program (OP) was developed in Matlab (R2010a) environment with a GSO algorithm to solve problem running on another computer. This program is called by RT-lab supporting a Matlab development tool for Scripts. The OP and the real-time platform communicate by User Datagram Protocol (UDP) over Ethernet. The configuration of the HIL simulation is shown in Figure 9.
The technical specifications of OP5142 RT-Lab are reported in Table 1.
The test system includes the controllers and the model of the test MG. A PV system connected to bus 3 is modeled as a power source in accordance with the energy profile derived from real data. The power demand of customers at bus 3 is simulated as a set of 24-h peak loads in a day. The energy profile of the PV system is shown in Figure 10. The energy profile of consumers at bus 3 is shown in Figure 11.
The electrical features of the lines in the test system are shown in Table 2:
DG1 models a diesel generator and has a power supply capacity ranging from 0 to 35 kW, while DG2 (Battery) has power supply capacity ranging from 0 to 45 kW. In this case, the slope KG2 of DG2 is changed in a range to adjust the output power. The constraints for frequency are set to fmin = 49 Hz and fmax = 51 Hz. The voltage can vary in the range from 360 V to 440 V. The frequency f0 of DG1 and DG2 is set to the same value and equal to 50 Hz. In this case, generator DG1 was non-optimized while generator 2 was optimized. KG1 is kept constantly at 8.75 while the range of variation of KG2 was set as already said above.

5. Experimental Results and Analysis

To analyze and design a control system, it is important to assess the complete system response in a given range of loading conditions. In this section, the test system described in the previous section with the proposed droop regulation is set up and its behavior is assessed by comparing the results achieved in optimized operation with those achieved with conventional droop control. The results will show the system’s ability to respond immediately while parameters are changing so as to evaluate the operating stability of the system within 24 h.

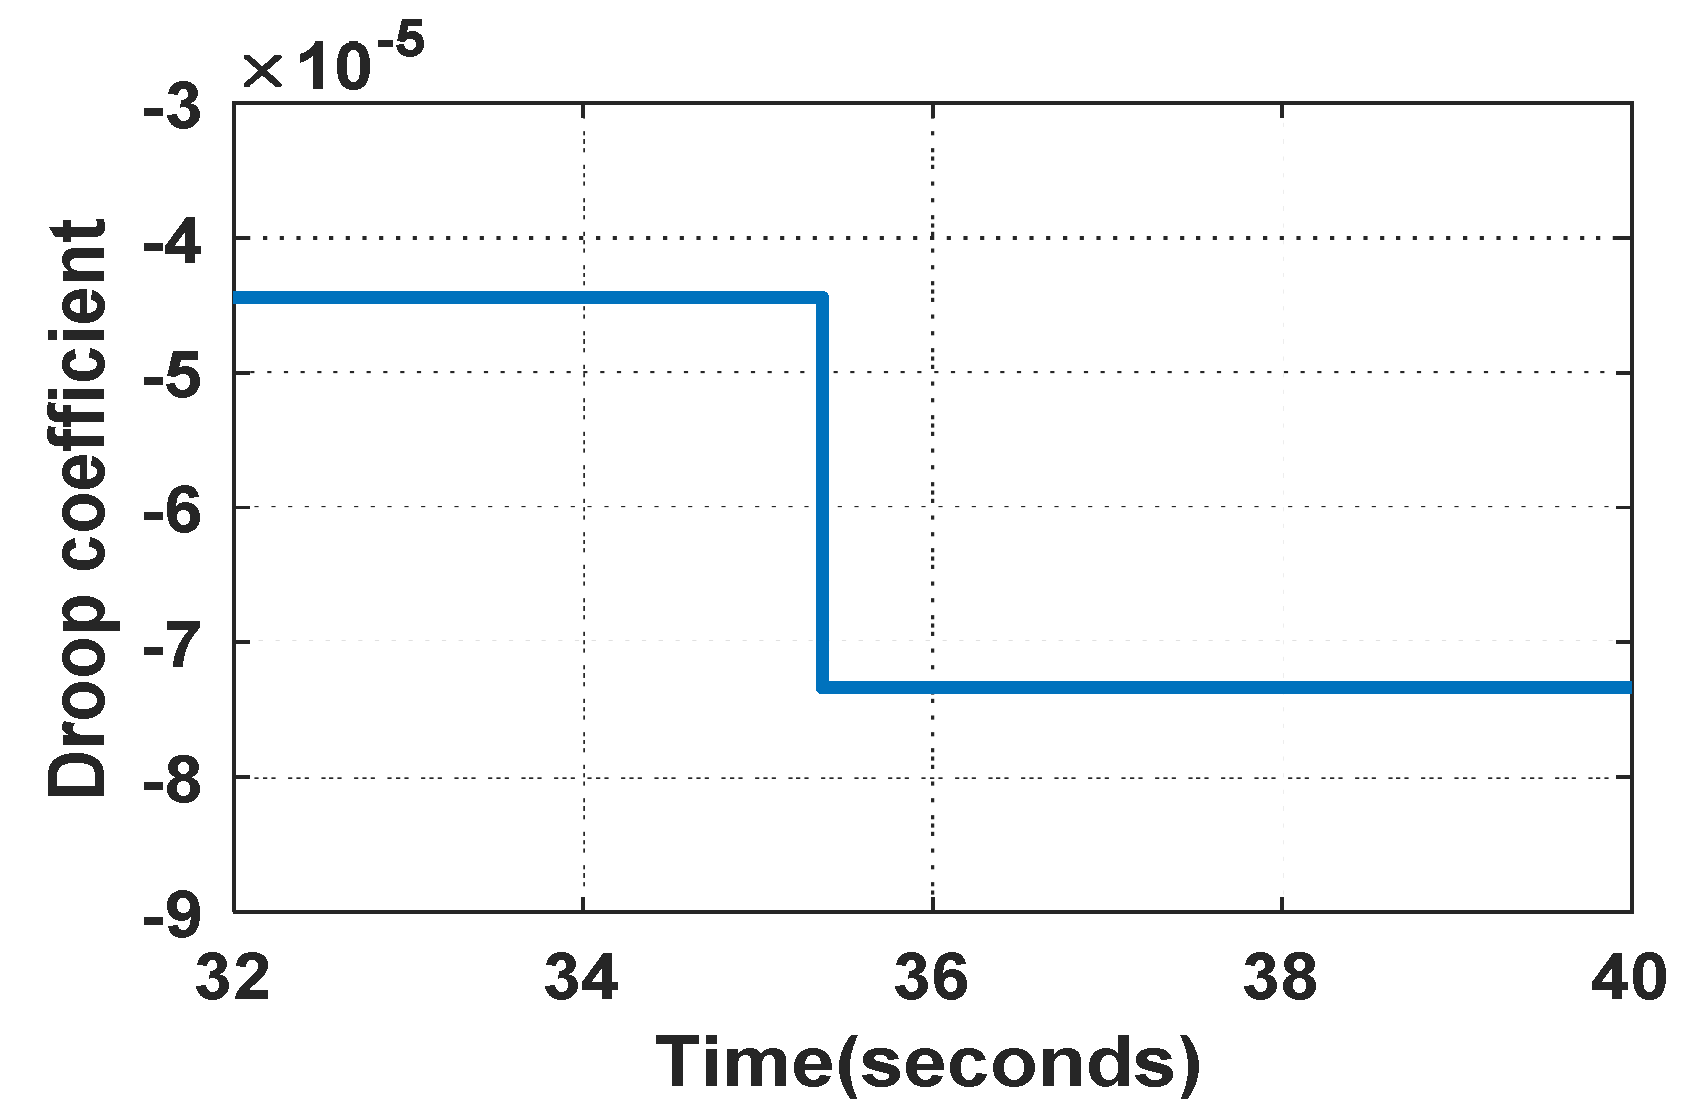
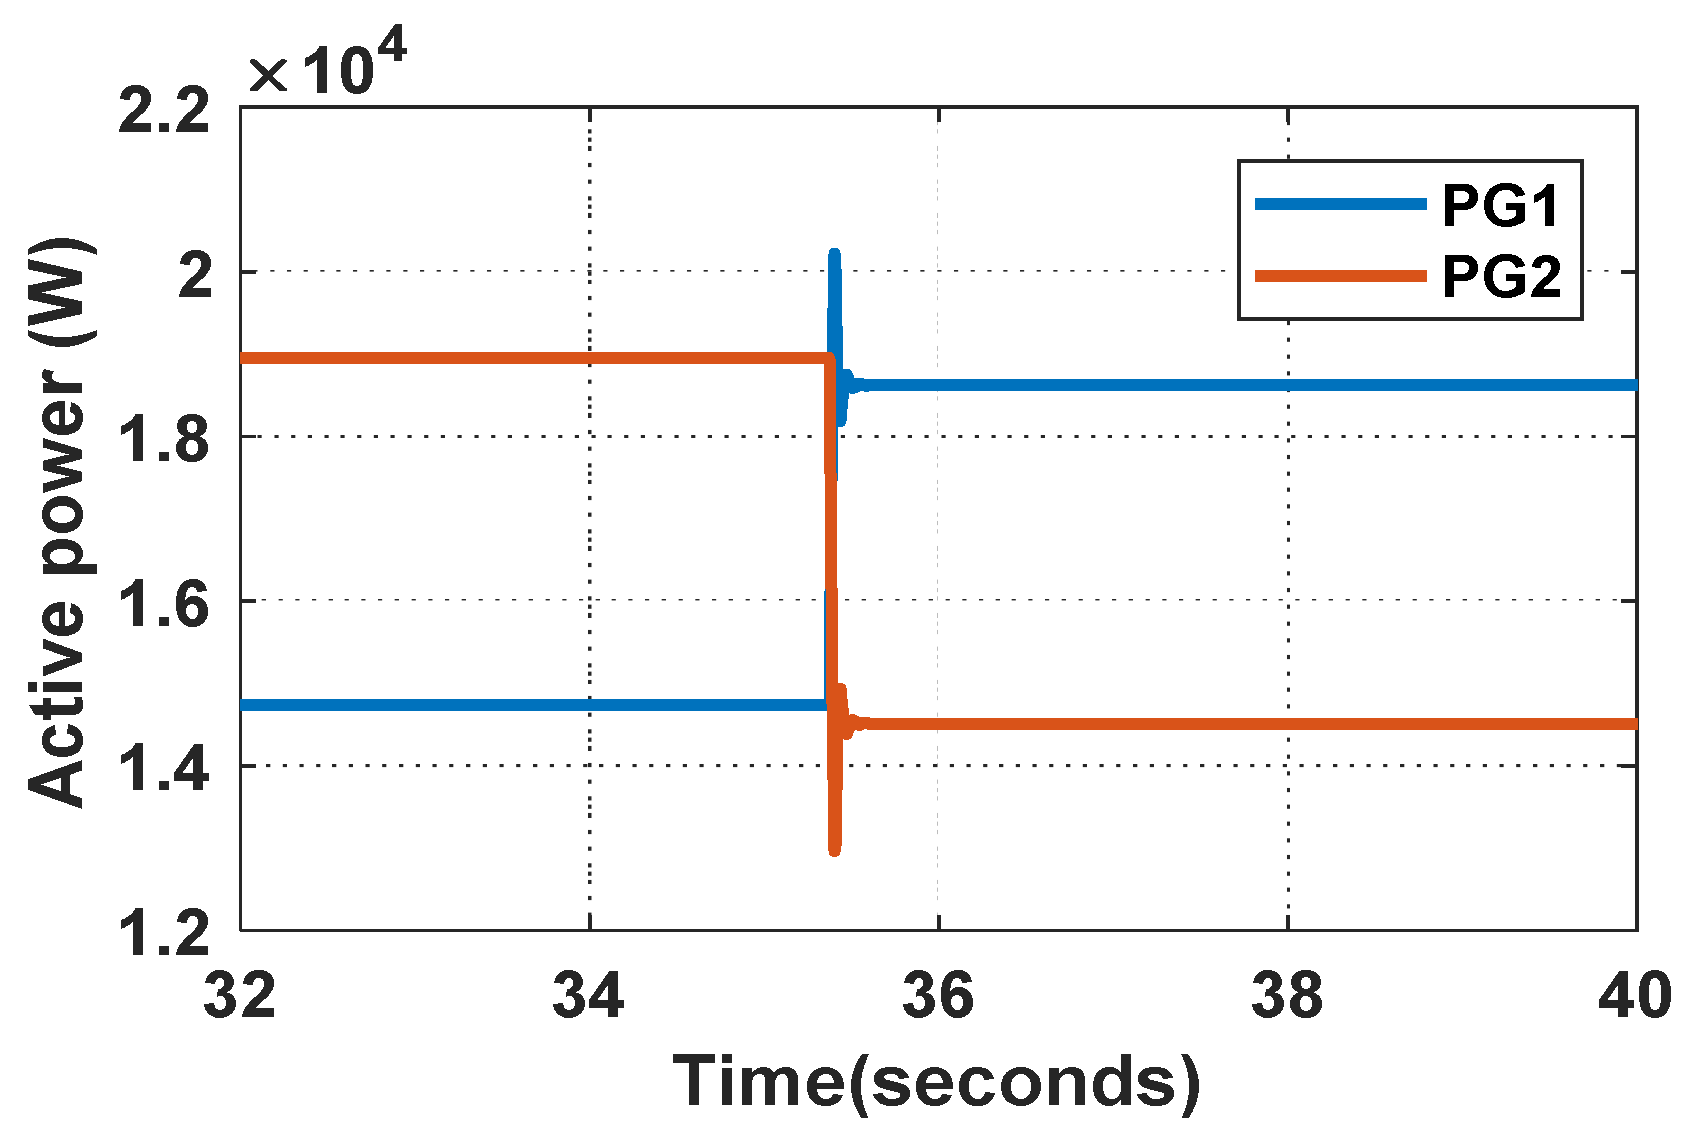
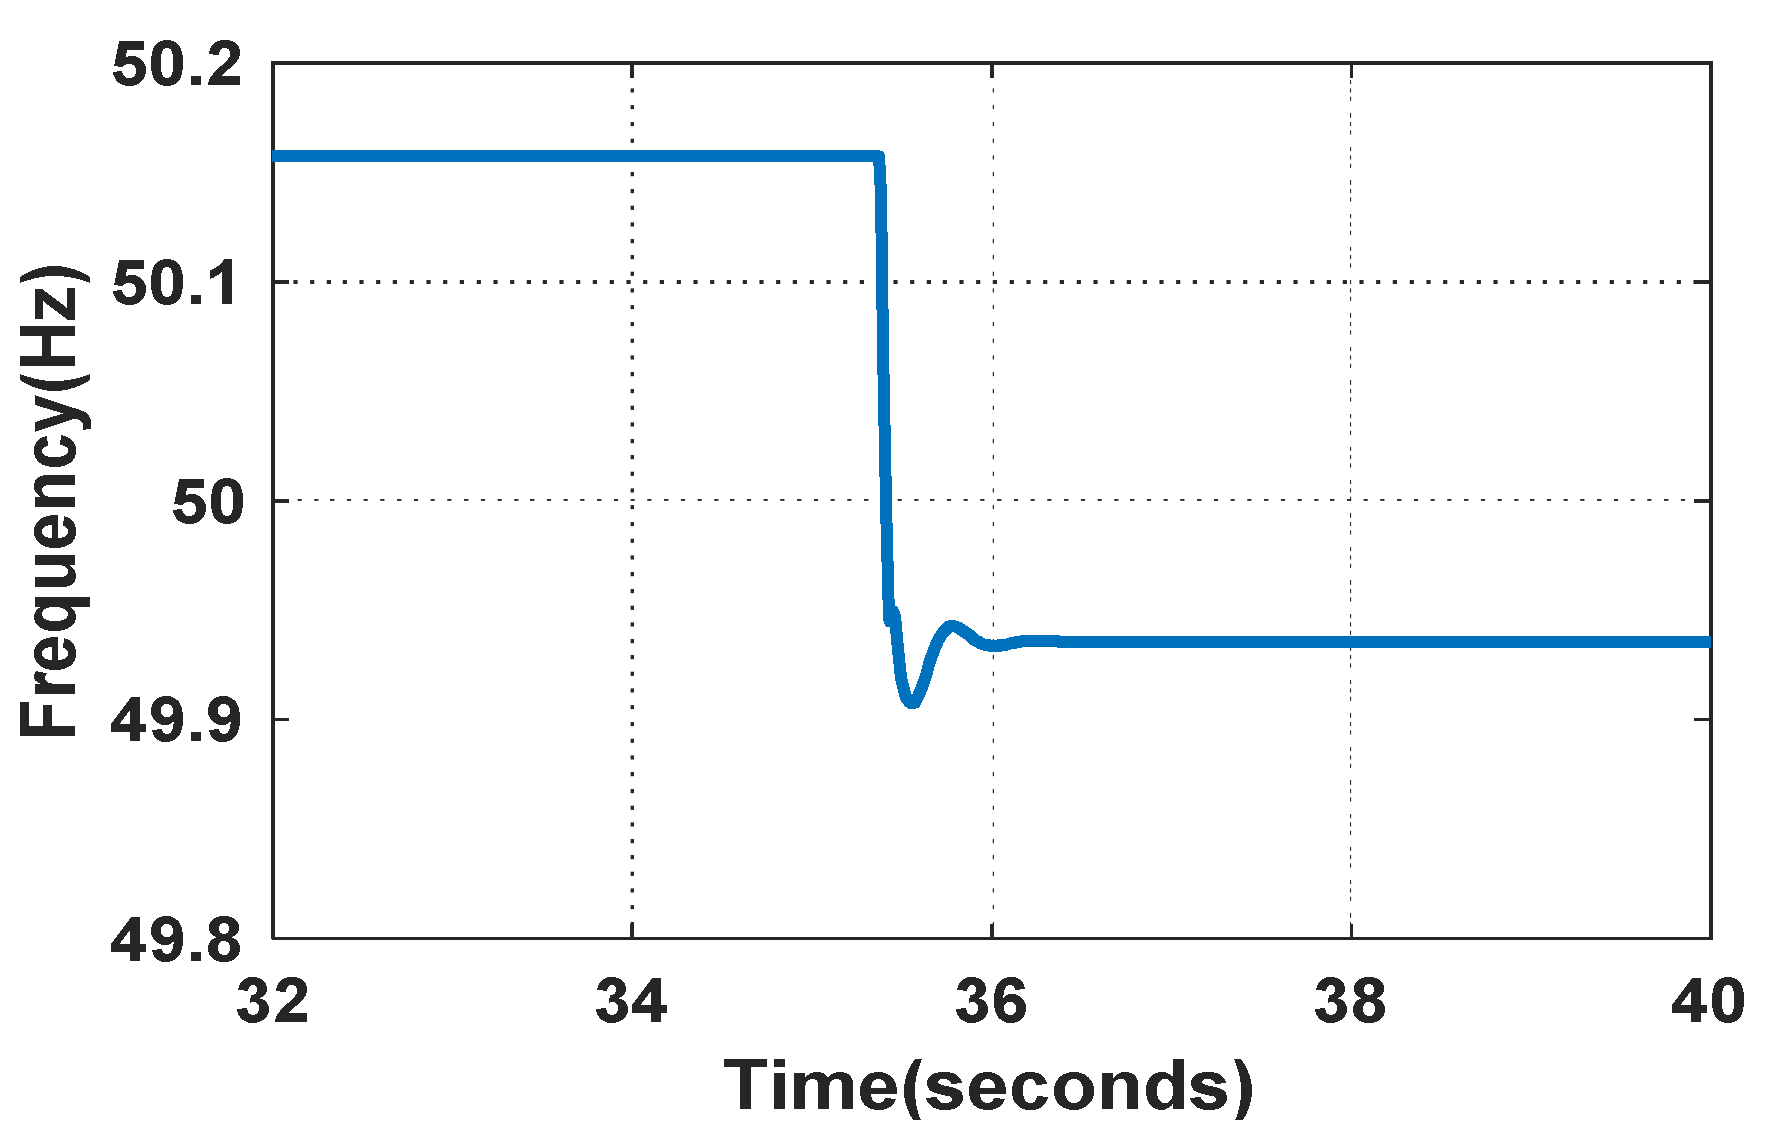
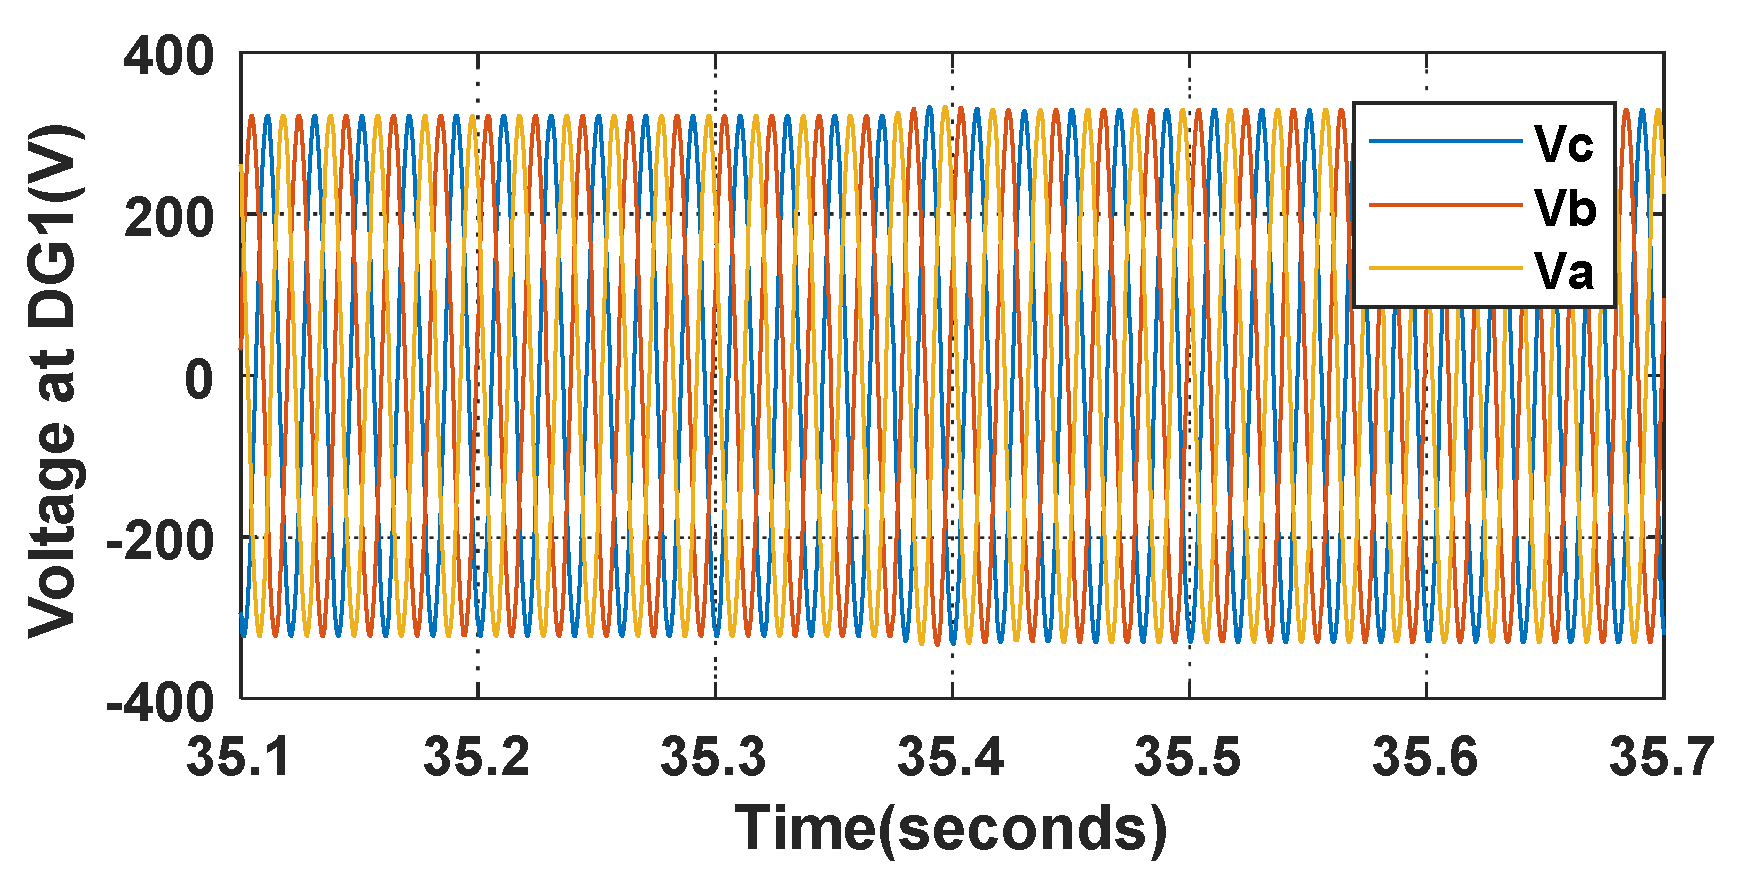
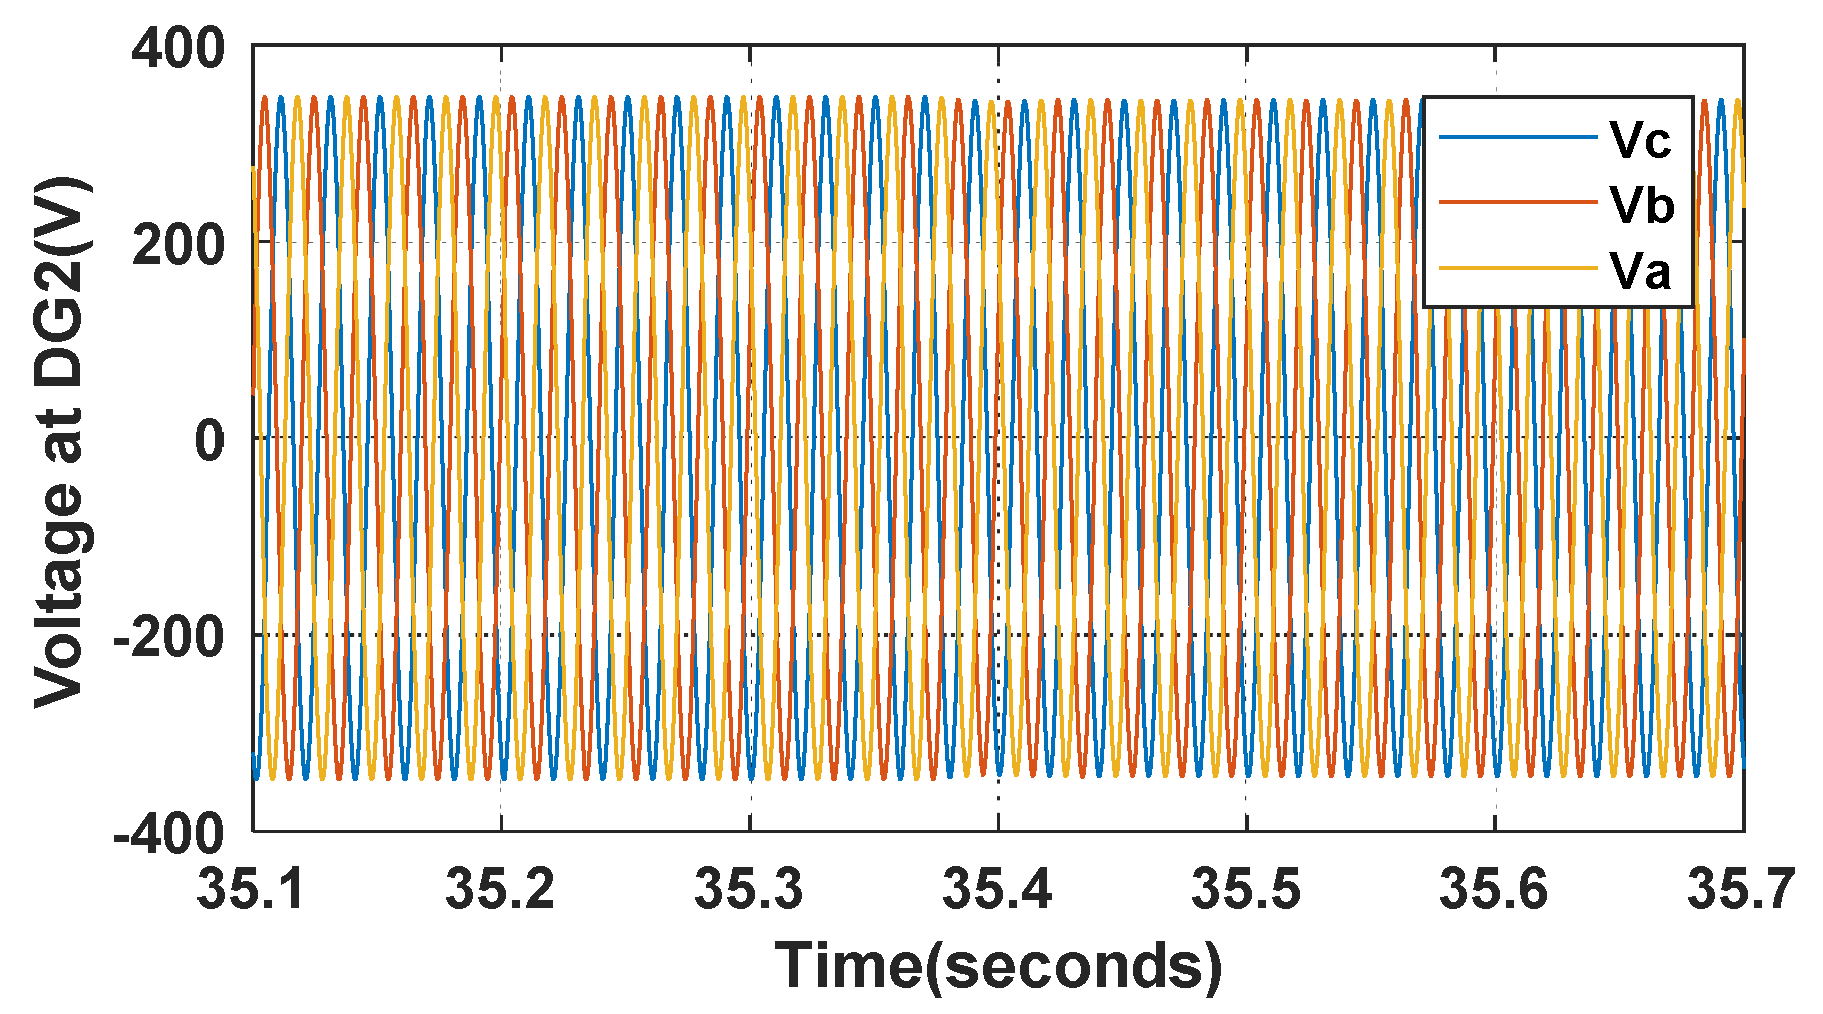
5.1. The Simulation Results of the Transient Responses

Transient response is the reaction of the power system in a short period of time to a change from a steady state. If the system is stable, the transient response will disappear smoothly. If the system is unstable, the transient response will increase quickly in time, and some unexpected phenomena may occur and harm the system. Therefore the transient responses need to be monitored carefully [33,34].
In every step load change, the droop coefficient KG2 is expected to change to produce a new operating point for minimizing power losses in the microgrid. The simulation results of transient response for a KG2 changing are expressed in Figure 12. Figure 13 shows the output power of generators while frequency and bus voltages of the system are described specifically in Figure 14, Figure 15 and Figure 16.
It can be observed that when the droop coefficient is adjusted from −4.5 × 10⁻⁵ to −7.3 × 10⁻⁵ to optimize the microgrid, the power sharing of generators is regulated. The output power from DG2 is re-established and reduced from 1.88 × 10⁴ to 1.46 × 10⁴ W and the generated power of DG1 is changed from 1.48 × 10⁴ to 1.86 × 10⁴ W. The frequency fluctuates in the range from 49.9 Hz to 50.16 Hz. This changing only occurs in 0.5 s and within the frequency range of interest. The voltage of three phases at DG1 and DG2 are also monitored and showed in Figure 13; Figure 14.
All the magnitudes of voltages are shifted slightly in the time interval from 35.3 s to 35.4 s. They satisfy their limitations and are stable after changing KG2 to a new optimized value corresponding to the new loading condition.

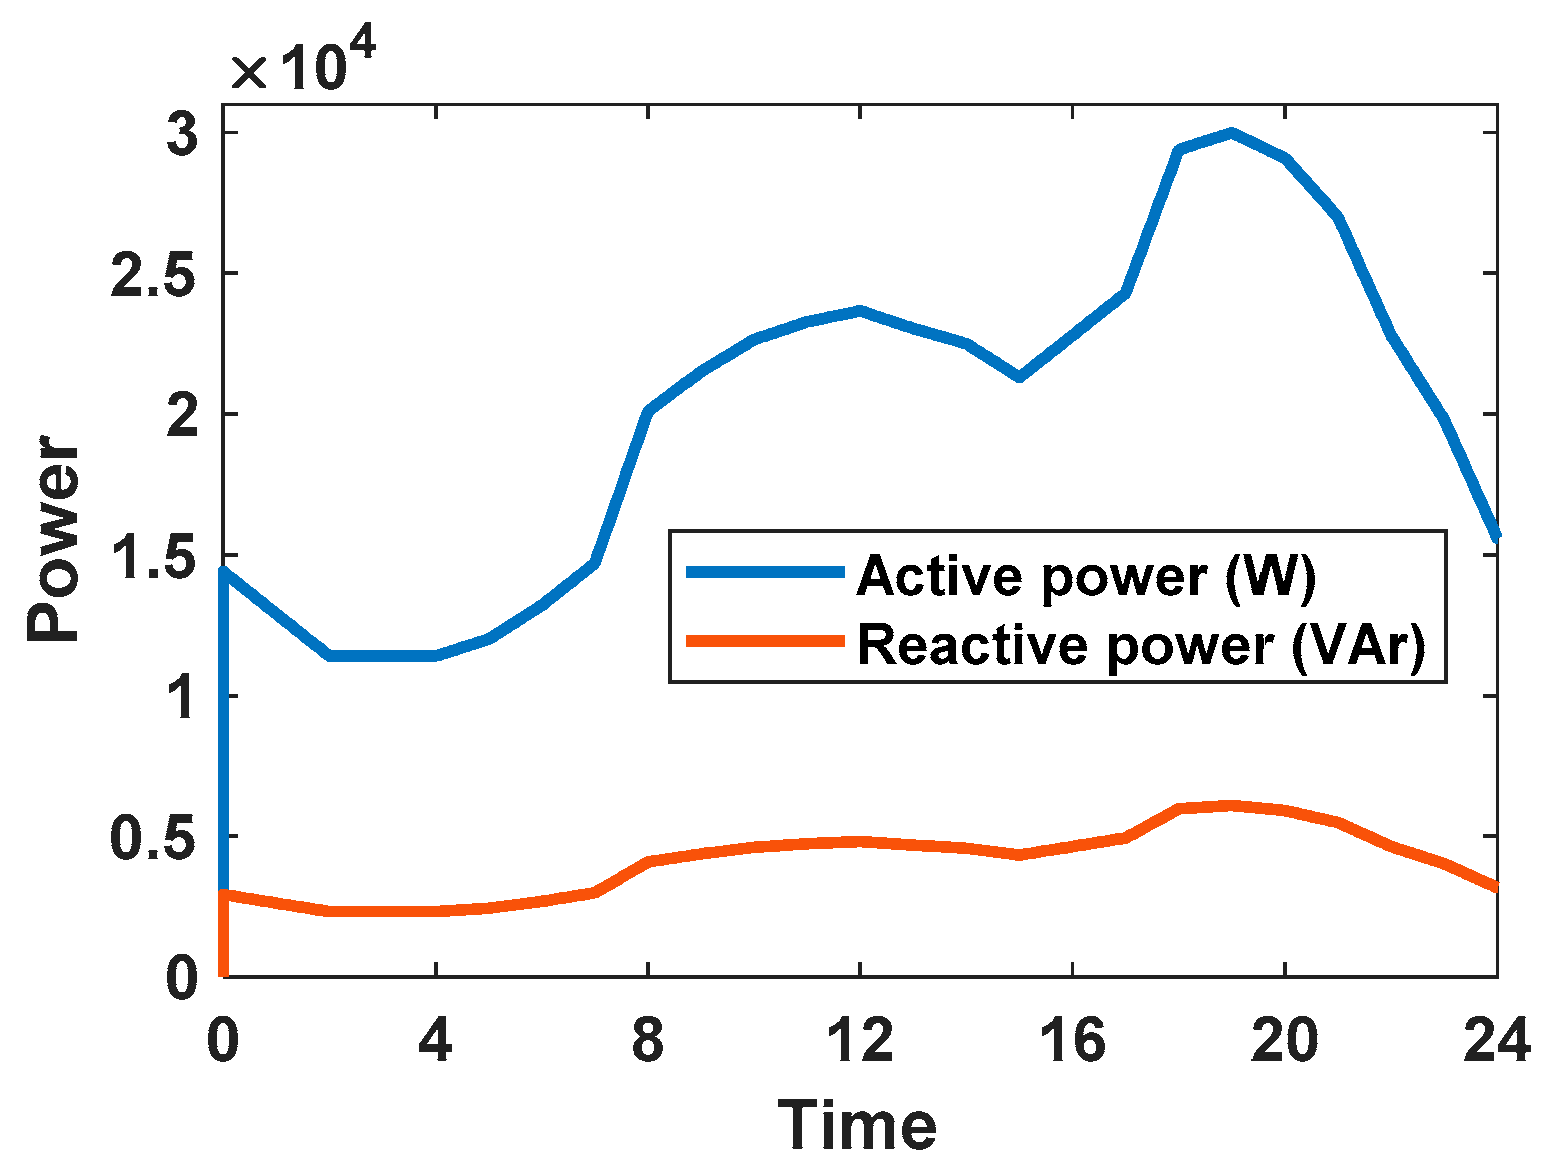
5.2. The Simulation Results in 24 H

The effectiveness of the proposed primary regulation is illustrated most distinctly in the 24-h simulation. As expressed in Section 4, three scenarios have been implemented in islanded mode and show the improvement by comparing the results with those attained in the conventional droop. The results for the HIL tests are illustrated in Figure 17.
In scenario 1, with the conventional droop control, the droop coefficient KG2 is fixed at 11.25. In scenario 2, KG2 is optimized in the range (9–11.25) and changed slightly around 9. In scenario 3, because KG2 is chosen in a wider range (6.75–11.25), the adjustment of KG2 in different load conditions is described clearly, especially in peak hours from 8 a.m. to 1 p.m. and from 6 p.m. to 9 p.m. In the off-peak hours from 0 a.m. to 6 a.m., the power demand is not too large, the energy flow through the transmission system is small. Thus the regulation and improvement are not obvious although KG2 is chosen optimally. From the results in Figure 17, the DG2 output is adjusted to inject enough power to the system in a way that minimizes power losses for the network. The power generated by DG1 is also regulated to manage the differences between generation and consumption. It shows that the wider adjustment range of KG2, the better improvement for power losses Ploss.
System frequencies and voltages in the three scenarios fluctuate within the limitation. The responses of frequency and voltages are smooth, as confirmed in Figure 17, from 49.9 Hz to 50.7 Hz for frequency, from 394 V to 435 V for voltage, respectively.
Figure 18 shows the comparison results for the overall improvement of energy losses (Alosses) of 3 scenarios in 24 h.
Figure 18 shows that the proposed regulation method gives smaller operating losses compared to the conventional regulation method of about 16.15%. It is expected that larger systems and LV systems may provide even larger absolute values of power loss reduction. From the proportion of power sharing and the obtained values of frequency, it can be observed that the new regulation demonstrates its powerful efficiency compared to the conventional droop method, the system operates in a more effective way at every changing load step. In this case, the conventional hierarchical three-levels architecture [35] could be largely simplified, since secondary and tertiary optimizations are carried out online and with limited uncertainty.
Besides, it should be noted that since the effectiveness of the optimization method is based on the redistribution of power flows in the system to achieve the best value of the objective functions. Therefore, though not shown here, the location of the main regulating generator and the microgrid topology play an important role in this problem. The structure of the microgrid is determined by not only the power supply capacities of generators but also by the power transmission capacity and length of the lines. These parameters have a great influence on the value of the objective function as well as the optimal value of the variables.
It should also be noted that the solution to this problem could be impacted by different parameters in Hardware in the loop system while applying regulation algorithms. However, this issue is beyond the scope of this paper. For further improving the calculation accuracy, the sensitivity analysis of these parameters should be considered in future works.

6. Conclusions

In this work, an adaptable online primary regulation is formulated and tested on an experimental islanded microgrid in order to optimize operation for microgrid, specifically minimizing power losses for the system. The proposed configuration is described in detail as well as the communication infrastructure.
The validation of the proposed method is carried out through experiments using HIL. The method has proved to bring benefits in terms of power losses reduction and to be suitable for laboratory application while computation times are compatible with load changing within realistic test conditions. Three scenarios are analyzed. The first scenario is implemented with the conventional droop control, a classic scenario. The remaining two scenarios are implemented with one of the two generators (DG2) optimizing its droop coefficient KG2 in different ranges. The operating characteristics are checked in both transient response and steady-state operation. The results of scenarios have been compared with each other to prove the effectiveness and show the advantages of the proposed configuration. The power losses improvement is verified in the HIL simulations, which provides near reality testing conditions and thus, ensures applicability and reproducibility of the results. 16.15% improvement of energy losses is a good result to illustrate the effectiveness of the proposed method while all constraints of problems are satisfied.
It is obvious that the improved driven primary control can be useful for reducing the power losses in islanded microgrids and even can decrease implementation costs due to more limited needs of power reserves for secondary and tertiary regulations. Further works will implement similar control configurations in large systems in order to be tested to real operating conditions, also optimizing other operating features such as fuel cost or other operating variable costs referred to power generation. Further works will also consider the sensitivity analysis of the parameters in the HIL, and will improve the operational features with the participation of storage units and the possible reconfiguration of the microgrid.

Author Contributions

Conceptualization, Q.T.T.T., E.R.S., G.Z. and M.L.D.S.; methodology, Q.T.T.T., E.R.S. and G.Z.; software, Q.T.T.T., E.R.S.; validation, Q.T.T.T., T.L.N. and Q.-T.T.; formal analysis, Q.T.T.T., E.R.S. and G.Z.; writing—original draft preparation, Q.T.T.T., E.R.S. and G.Z.; writing—review and editing, Q.T.T.T., E.R.S., G.Z. and M.L.D.S.; project administration, E.R.S. All authors have read and agreed to the published version of the manuscript.

Funding

The authors wish to thank the Italian Ministry of Foreign affairs and International Cooperation (MAECI), The Directorate General for the Promotion of the Italian Economic System (DGSP) for their support to the research activity within the frame of the Scientific cooperation Italy-Vietnam 2017–2019 (Project ‘Greening the power systems with solar power for Greenhouse gas emission reduction in Vietnam’). The experimental results were carried out at CEA-INES platform under the transnational access framework of the European H2020 project EriGrid (Grant Agreement No. 654113—www.erigrid.eu).

Conflicts of Interest

The authors declare no conflict of interest.

References

  1. Soshinskaya, M.; Crijns-Graus, W.H.J.; Guerrero, J.M.; Vasquez, J.C. Microgrids: Experiences, barriers and success factors. Renew. Sustain. Energy Rev. 2014, 40, 659–672. [Google Scholar] [CrossRef] [Green Version]
  2. Guerrero, J.M.; Vasquez, J.C.; Matas, J.; Vicuna, L.G.D.; Castilla, M. Hierarchical Control of Droop-Controlled AC and DC Microgrids—A General Approach Toward Standardization. IEEE Trans. Ind. Electron. 2011, 58, 158–172. [Google Scholar] [CrossRef]
  3. Karavas, C.-S.; Kyriakarakos, G.; Arvanitis, K.G.; Papadakis, G. A multi-agent decentralized energy management system based on distributed intelligence for the design and control of autonomous polygeneration microgrids. Energy Convers. Manag. 2015, 103, 166–179. [Google Scholar] [CrossRef]
  4. Atia, R.; Yamada, N. Sizing and Analysis of Renewable Energy and Battery Systems in Residential Microgrids. IEEE Trans. Smart Grid 2016, 7, 1204–1213. [Google Scholar] [CrossRef]
  5. Yunwei, L.; Vilathgamuwa, D.M.; Chiang, L.P. Design, analysis, and real-time testing of a controller for multibus microgrid system. IEEE Trans. Power Electron. 2004, 19, 1195–1204. [Google Scholar]
  6. Katiraei, F.; Iravani, M.R. Power Management Strategies for a Microgrid with Multiple Distributed Generation Units. IEEE Trans. Power Syst. 2006, 21, 1821–1831. [Google Scholar] [CrossRef]
  7. Hatziargyriou, N.; Asano, H.; Iravani, R.; Marnay, C. Microgrids. IEEE Power Energy Mag. 2007, 5, 78–94. [Google Scholar] [CrossRef]
  8. Su, W.; Wang, J. Energy Management Systems in Microgrid Operations. Electr. J. 2012, 25, 45–60. [Google Scholar] [CrossRef]
  9. Salahi, S.; Bahramara, S. Modeling Operation Problem of Micro-grids Considering Economical, Technical and Environmental issues as Mixed-Integer Non-Linear Programming. Int. J. Renew. Energy Dev. 2016, 5, 139–149. [Google Scholar] [CrossRef] [Green Version]
  10. Silvente, J.; Kopanos, G.M.; Pistikopoulos, E.N.; Espuña, A. A rolling horizon optimization framework for the simultaneous energy supply and demand planning in microgrids. Appl. Energy 2015, 155, 485–501. [Google Scholar] [CrossRef]
  11. Wouters, C.; Fraga, E.S.; James, A.M. An energy integrated, multi-microgrid, MILP (mixed-integer linear programming) approach for residential distributed energy system planning—A South Australian case-study. Energy 2015, 85, 30–44. [Google Scholar] [CrossRef] [Green Version]
  12. Pan, X.; Niu, X.; Yang, X.; Chamollet, N.; Zheng, D. Robust scheduling for microgrid energy management optimization. In Proceedings of the 2016 China International Conference on Electricity Distribution (CICED), Xi’an, China, 10–13 August 2016; pp. 1–5. [Google Scholar]
  13. Luna, A.C.; Meng, L.; Diaz, N.L.; Graells, M.; Vasquez, J.C.; Guerrero, J.M. Online Energy Management Systems for Microgrids: Experimental Validation and Assessment Framework. IEEE Trans. Power Electron. 2018, 33, 2201–2215. [Google Scholar] [CrossRef]
  14. Pota, H.R. Droop control for islanded microgrids. In Proceedings of the 2013 IEEE Power & Energy Society General Meeting, Vancouver, BC, Canada, 21–25 July 2013; pp. 1–4. [Google Scholar]
  15. Tayab, U.B.; Roslan, M.A.B.; Hwai, L.J.; Kashif, M. A review of droop control techniques for microgrid. Renew. Sustain. Energy Rev. 2017, 76, 717–727. [Google Scholar] [CrossRef]
  16. He, J.; Li, Y.W. Analysis, Design, and Implementation of Virtual Impedance for Power Electronics Interfaced Distributed Generation. IEEE Trans. Ind. Appl. 2011, 47, 2525–2538. [Google Scholar] [CrossRef]
  17. Zhang, S.; Chen, C.; Dong, L.; Li, Y.; Zhao, J.; Nian, H.; Kong, L. An Enhanced Droop Control Strategy for Accurate Reactive Power Sharing in Islanded Microgrids. In Proceedings of the 2019 IEEE Innovative Smart Grid Technologies—Asia (ISGT Asia), Chengdu, China, 21–24 May 2019; pp. 2352–2356. [Google Scholar]
  18. Xiao, J.; Setyawan, L.; Wang, P.; Jin, C. Power-Capacity-Based Bus-Voltage Region Partition and Online Droop Coefficient Tuning for Real-Time Operation of DC Microgrids. IEEE Trans. Energy Convers. 2015, 30, 1338–1347. [Google Scholar] [CrossRef]
  19. Guerrero, J.M.; Berbel, N.; Vicuna, L.G.D.; Matas, J.; Miret, J.; Castilla, M. Droop control method for the parallel operation of online uninterruptible power systems using resistive output impedance. In Proceedings of the Twenty-First Annual IEEE Applied Power Electronics Conference and Exposition, APEC’06., Dallas, TX, USA, 19–23 March 2006; p. 7. [Google Scholar]
  20. Zhou, J.; Tsai, M.; Cheng, P. Consensus-Based Cooperative Droop Control for Accurate Reactive Power Sharing in Islanded AC Microgrid. In Proceedings of the 2018 IEEE Energy Conversion Congress and Exposition (ECCE), Portland, OR, USA, 23–27 September 2018; pp. 5151–5157. [Google Scholar]
  21. Gai, B.; Pan, Z. Online transmission line impedance parameter identification for distributed generation. In Proceedings of the 2016 19th International Conference on Electrical Machines and Systems (ICEMS), Chiba, Japan, 13–16 November 2016; pp. 1–5. [Google Scholar]
  22. Raghami, A.; Ameli, M.T.; Hamzeh, M. Online Droop Tuning of a Multi-DG Microgrid Using Cuckoo Search Algorithm. Electr. Power Compon. Syst. 2015, 43, 1583–1595. [Google Scholar] [CrossRef]
  23. Shokoohi, S.; Sabori, F.; Bevrani, H. Secondary voltage and frequency control in islanded microgrids: Online ANN tuning approach. In Proceedings of the 2014 Smart Grid Conference (SGC), Tehran, Iran, 9–10 December 2014; pp. 1–6. [Google Scholar]
  24. Habibi, F.; Shafiee, Q.; Bevrani, H. Online generalized droop-based demand response for frequency control in islanded microgrids. Electr. Eng. 2019, 101, 409–420. [Google Scholar] [CrossRef]
  25. Tran, Q.T.T.; di Silvestre, M.L.; Sanseverino, E.R.; Zizzo, G.; Pham, T. Driven Primary Regulation for Minimum Power Losses Operation in Islanded Microgrids. Energies 2018, 11, 2890. [Google Scholar] [CrossRef] [Green Version]
  26. Bacic, M. On hardware-in-the-loop simulation. In Proceedings of the 44th IEEE Conference on Decision and Control, Seville, Spain, 15 December 2005; pp. 3194–3198. [Google Scholar]
  27. Riva Sanseverino, E.; Quynh, T.T.; Di Silvestre, M.L.; Zizzo, G.; Ninh, N.Q.; Luna, A.C.; Guerrero, J.M. Optimal power flow for technically feasible energy management systems in islanded microgrids. In Proceedings of the 2016 IEEE 16th International Conference on Environment and Electrical Engineering (EEEIC), Florence, Italy, 7–10 June 2016; pp. 1–6. [Google Scholar]
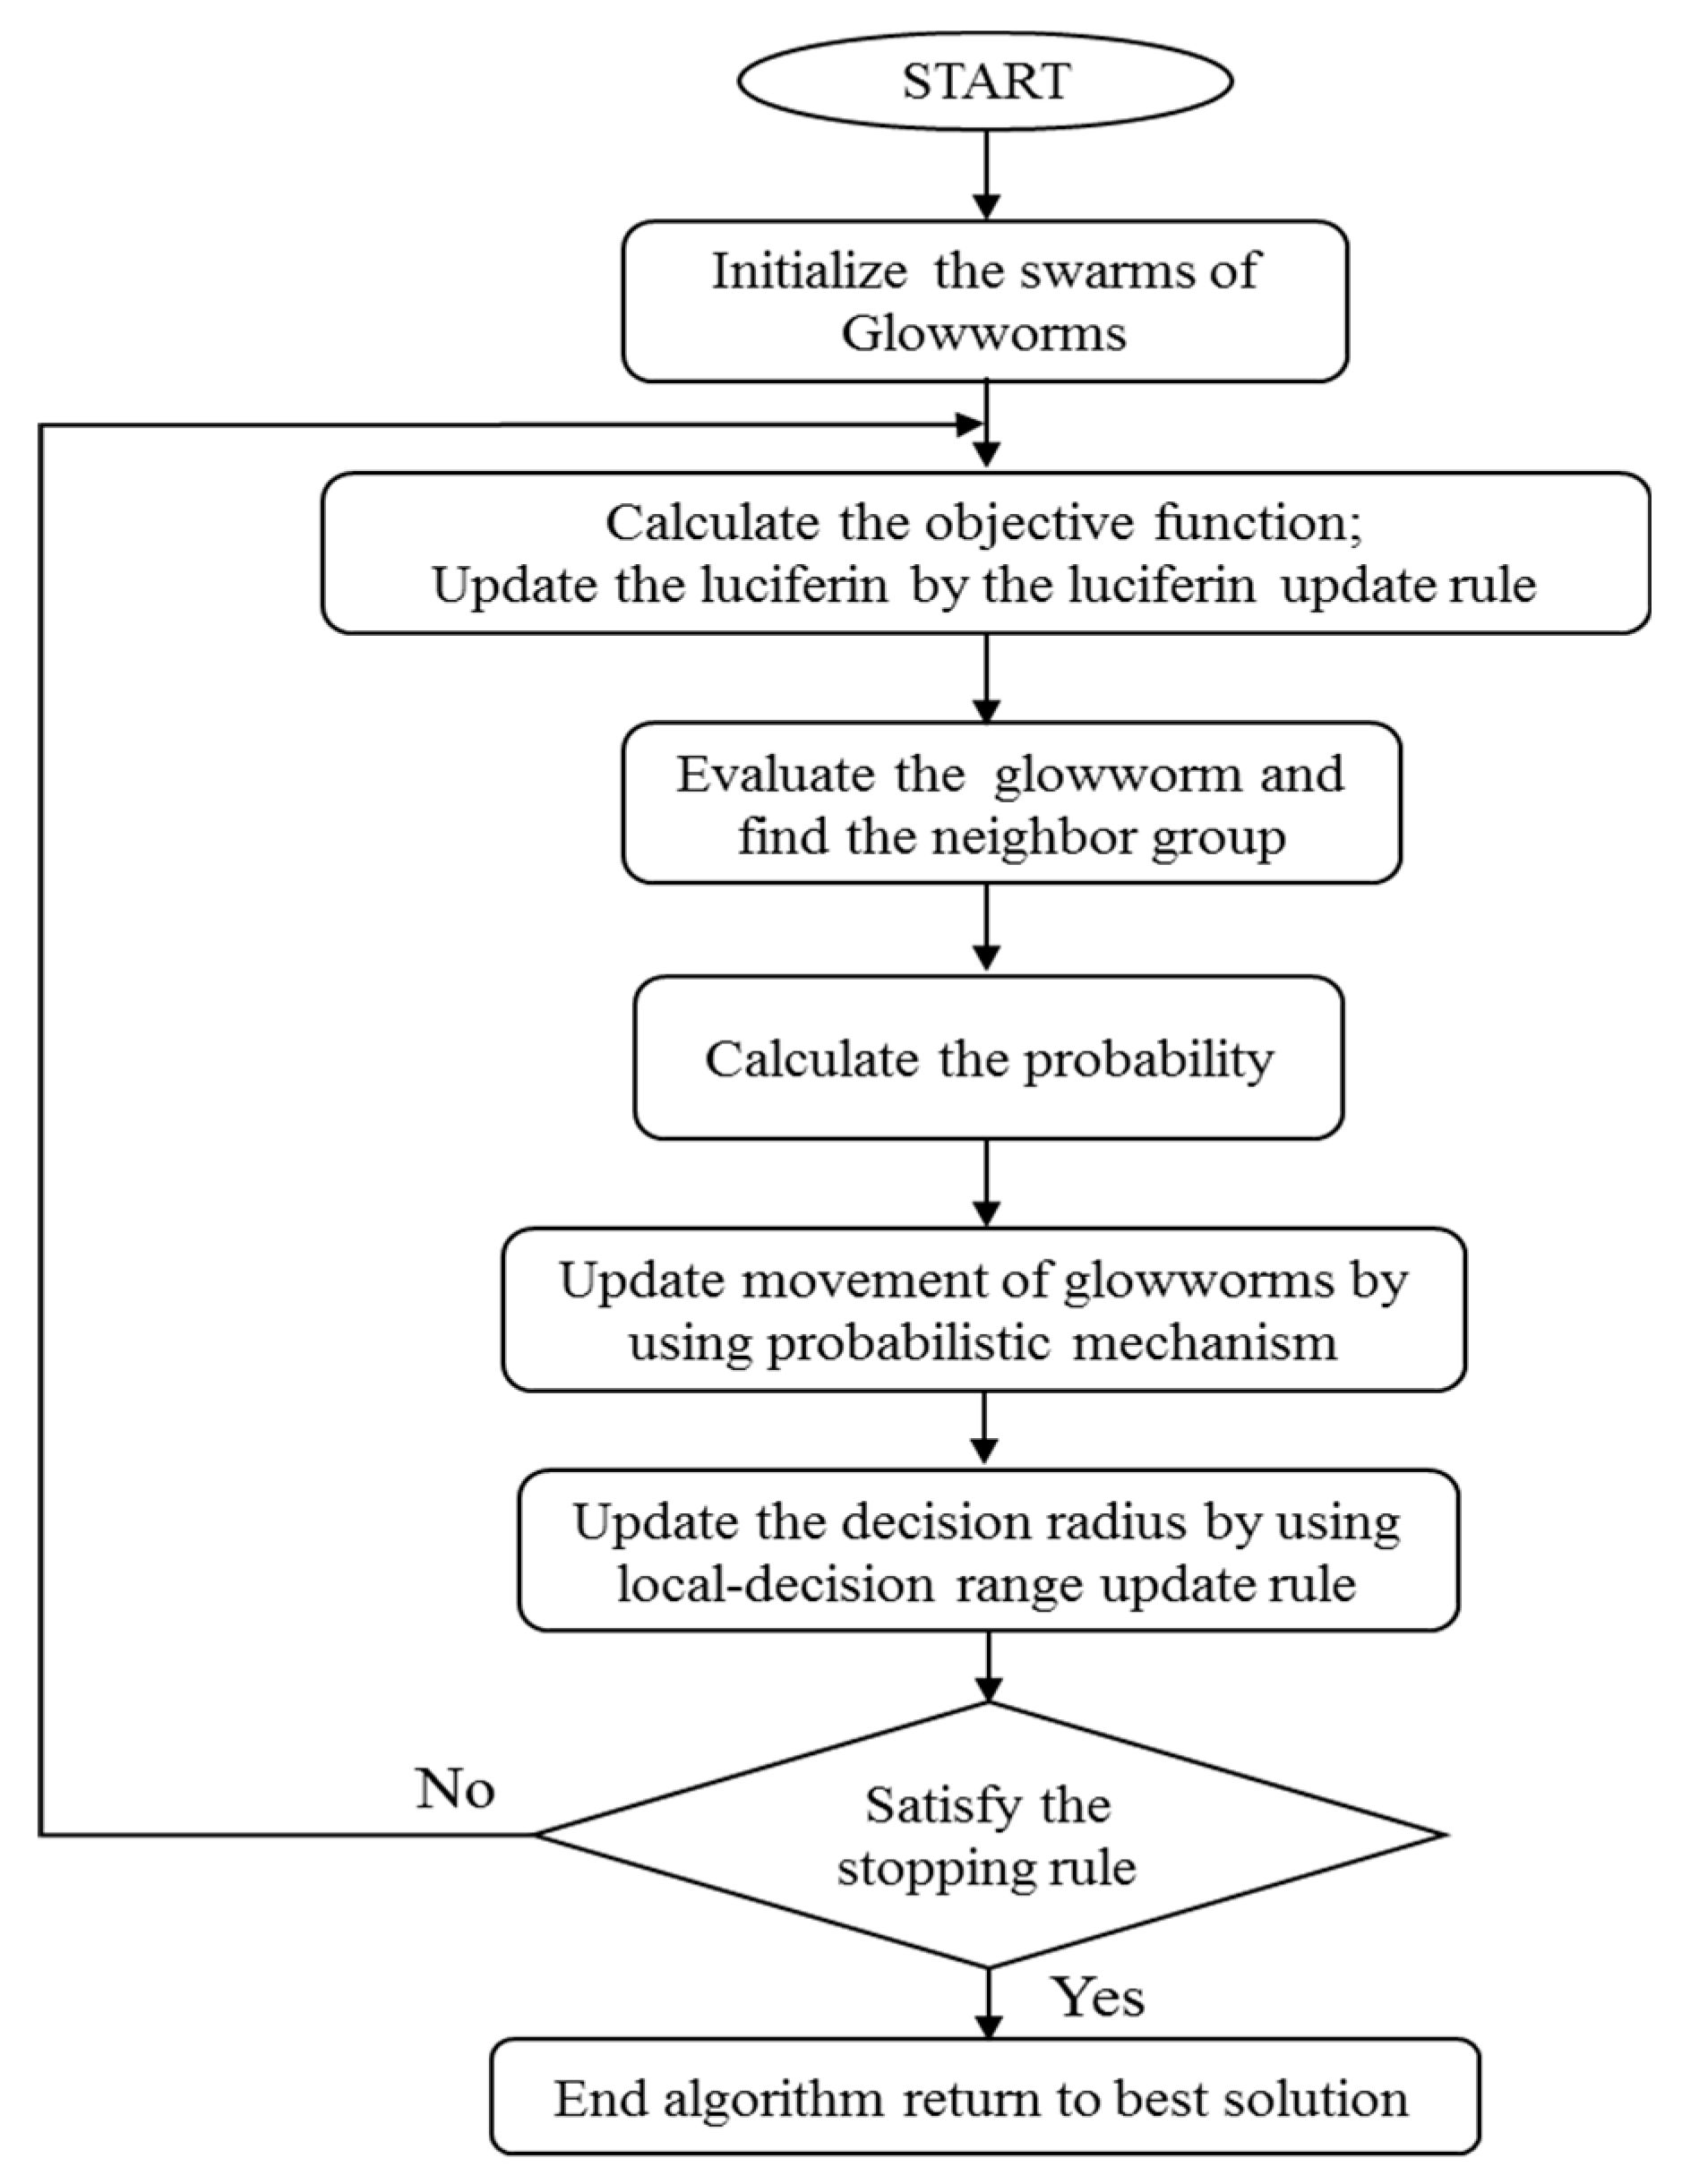
  28. Karegowda, A.G.; Prasad, M. A Survey of Applications of Glowworm Swarm Optimization Algorithm. In IJCA Proceedings on International Conference on Computing and information Technology 2013 IC2IT; Springer: Berlin/Heidelberg, Germany, 2013. [Google Scholar]
  29. Kaipa, K.N.; Ghose, D. Glowworm Swarm Optimization: Theory, Algorithms, and Applications; Springer: Cham, Switzerland, 2017; Volume 698. [Google Scholar]
  30. Murty, P.S.R. Chapter 10—Power Flow Studies. In Power Systems Analysis, 2nd ed.; Murty, P.S.R., Ed.; Butterworth-Heinemann: Boston, MA, USA, 2017; pp. 205–276. [Google Scholar]
  31. The Multi Microgrid Platform PRISMES. Available online: http://www.ines-solaire.org/ (accessed on 5 December 2019).
  32. Sun, Y.; Huang, W.; Wang, G.; Wenjun, W.; Wang, D.; Li, Z. Study of control strategy of DG based on nonlinear droop characteristic. In Proceedings of the 2012 China International Conference on Electricity Distribution, Shanghai, China, 10–14 September 2012; pp. 1–4. [Google Scholar]
  33. Arani, A.A.K.; Gharehpetian, G.B. A new control method for improving transient response of parallel VSIs in islanded microgrids. In Proceedings of the 2014 Smart Grid Conference (SGC), Tehran, Iran, 9–10 December 2014; pp. 1–5. [Google Scholar]
  34. Rahimpour, H.; Mitchell, S.; Rahimpour, S. Online monitoring of power transformers using impulse frequency response analysis. In Proceedings of the 2017 Iranian Conference on Electrical Engineering (ICEE), Tehran, Iran, 2–4 May 2017; pp. 1390–1394. [Google Scholar]
  35. Guerrero, J.M.; Chandorkar, M.; Lee, T.; Loh, P.C. Advanced Control Architectures for Intelligent Microgrids—Part I: Decentralized and Hierarchical Control. IEEE Trans. Ind. Electron. 2013, 60, 1254–1262. [Google Scholar] [CrossRef] [Green Version]
Figure 1. Flowchart of the Glow-worm Swarm Optimization (GSO) algorithm.
Energies 13 00451 g001
Figure 2. Block diagram of the online operating system.
Energies 13 00451 g002
Figure 3. Pseudocode of online optimization process.
Energies 13 00451 g003
Figure 4. Computer configuration for running the optimization controller (OC).
Energies 13 00451 g004
Figure 5. 3-bus system. (a) layout of the test system; (b) results of the optimization.
Energies 13 00451 g005
Figure 6. 9-bus system. (a) layout of the test system; (b) results of the optimization.
Energies 13 00451 g006
Figure 7. 38-bus system. (a) layout of the test system; (b) results of the optimization.
Energies 13 00451 g007
Figure 8. Model of the 3-bus test system in simulation.
Energies 13 00451 g008
Figure 9. Configuration of the hardware-in-the-loop (HIL) system.
Energies 13 00451 g009
Figure 10. The energy profile of the photovoltaic (PV) system in 24 h.
Energies 13 00451 g010
Figure 11. The load profile at node 3 in 24 h.
Energies 13 00451 g011
Figure 12. Droop coefficient at DG2.
Energies 13 00451 g012
Figure 13. Output active power at DG1 and DG2.
Energies 13 00451 g013
Figure 14. Transient frequency of the simulated test system.
Energies 13 00451 g014
Figure 15. Phase Voltages at DG1 bus.
Energies 13 00451 g015
Figure 16. Phase voltages at DG2 bus.
Energies 13 00451 g016
Figure 17. Experimental results for the MG in 24 h: (a) Scenario 1; (b) Scenario 2; (c) Scenario 3.
Energies 13 00451 g017
Figure 18. The energy losses (Alosses) of the system in 24 h (interpolation).
Energies 13 00451 g018
Table 1. OPAL-RT’s technical specifications.
Digital I/OFPGA
Number of channels: 256 input/output configurable in 1- to 32-bit groups
Compatibility: 3.3 V
Power-on state: High impedance
Device: Xilinx Spartan 3
I/O Package: fg676
Embedded RAM available: 216 Kbytes
Clock: 100 MHz
Platform options: XC3S5000
Logic slices: 33,280
Equivalent logic cells: 74,880
Available I/O lines: 489
Bus
Dimensions (not including connectors): PCI-Express x1
Data transfer: 2.5 Gbit/s
Table 2. Electrical features of the test system.
FromToR (Ohm/km)X (Ohm/km)L (km)
130.430.144441
230.430.144442.5

