Urban Warming and Cities’ Microclimates: Investigation Methods and Mitigation Strategies—A Review


Department of Civil Engineering, Aristotle University of Thessaloniki, PO BOX 429, 54124 Thessaloniki, Greece
*
Author to whom correspondence should be addressed.
Energies 2020, 13(6), 1414; https://doi.org/10.3390/en13061414
Submission received: 19 February 2020
/
Revised: 13 March 2020
/
Accepted: 13 March 2020
/
Published: 18 March 2020
(This article belongs to the Special Issue Sustainable Buildings for Citizens, Cities and Communities)
Abstract
:The increased rates of urbanization and industrialization of the 20th and 21st centuries have dramatically changed the land use and cover of modern cities, contributing to the degradation of the urban microclimate and the rise of the ambient urban air temperatures. Given the multiple negative energy, environmental and social consequences of urban warming, the present paper summarizes the findings of previous studies, assessing the main causes of the phenomenon along with the key investigation methods involving experimental and computational approaches. There follows a description of the most common mitigations, and adaption strategies towards the attenuation of urban warming are described. The analyzed elements include the addition of green spaces such as trees, grass and green roofs; changes on the albedo of the urban surfaces and water-based techniques, as well as a combination of them. The discussion of the reported findings in the existing literature clearly reflects the impact of urban morphology on the outdoor thermal environment, providing also useful information for professionals and urban planners involved at the phase of decision-making.
1. Introduction
The increased rates of urbanization and industrialization of the 20th and 21st centuries have dramatically changed the land use and cover of modern cities, affecting the citizens’ quality of life and lifestyle both in positive and negative ways. Despite the multiple facilities offered to the citizens of large cities concerning health, education, technical knowledge and comfort, major issues due to land modification and transformation have also arisen. One of the most important negative outcomes of urbanization involves urban warming and high ambient urban air temperatures, attributed to various uncontrollable and controllable parameters. On one hand, the uncontrollable factors refer to environmental and nature-related parameters, whereas the controllable ones involve urban planning and design parameters [1,2] (see Figure 1). To address the urban warming issue and the degraded urban microclimatic conditions, the term “urban heat island phenomenon” (UHI) is also used, describing the divergence of atmospheric conditions and the higher ambient air temperatures (Tair) values occurring in an urban district, compared to those of the surrounding rural areas [3,4,5].
As reported in the existing literature, the high urban density of modern cities and the reduced openings to the sky of the streets contribute to shading of the canyons’ surfaces and to lower solar radiation absorption. On the other hand, the compactness of cities and the increased building densities may lead to the entrapment of longwave radiation, emitted by the ground and buildings’ surfaces at night, inhibiting thus urban cooling [6,7]. In parallel, the high surface roughness due to the increased building densities considerably attenuate the wind flow inside the street canyons and the consequent convective heat transfer from the urban surfaces towards the atmosphere [8]. The street canyons’ geometry and their effects on the local microclimatic parameters have been widely investigated during the last decades [9,10,11,12]. The obtained results suggest that the orientation of the streets affects more the solar radiation received by the vertical building surfaces, whereas the height/width ratio mainly influences the solar energy reaching the ground surfaces [13,14].
Moreover, the progressive substitution of vegetation and green areas with artificial, impervious surfaces is one of the main humanly controlled factors that contributes to higher ambient urban air temperatures [15] due to the decrease of latent heat flux through evapotranspiration. As emphasized by Taha [16], the urban impervious surfaces present higher runoff water volume, compared to the natural, vegetated surfaces, and thus, the surface water that remains available for evapotranspiration is considerably reduced, modifying the urban surface energy balance [17]. Kondoh and Nishiyama have evaluated the changes on the evapotranspiration in Tokyo, from 1972 to 1995, and it was reported that the respective rates were reduced by 38% within a period of 23 years, as a result of the excessive urbanization and the significant changes in the land use/cover [18]. Furthermore, the ground and building surfaces in modern cities generally present low albedo values (correlated to the color of the surface), high infrared emittance and increased thermal conductivity and specific heat capacity. Considering their thermal and optical characteristics, the urban elements absorb and store an important part of the direct solar radiation reaching their surfaces, from the early morning until late afternoon. The stored heat is then dissipated through convective and radiative phenomena during the late evening and night, cooling down the urban surfaces but increasing the ambient air temperature of the adjacent air layers [19].
Finally, the heat flux from the urban anthropogenic activity, including the vehicle fuel combustion, and heat flux from the air conditioning (A/C) devices, industry and other human activities can strongly exacerbate urban warming; Fan and Sailor [20] have found that the anthropogenic heat had an important effect on the UHI phenomenon in the city of Philadelphia, USA during nighttime, increasing the urban nocturnal summer Tair even by 2.5 °C. Other studies have also assessed the effect of the heat released by the A/C devices. Given that, in modern cities, the A/C units are mainly hanging on the buildings’ facades, the amount of rejected heat is significantly important at the street level, enhancing thus the ambient air temperature inside the street canyons [21]. Ohashi et al. [22] have indicated that the heat flux released from air conditioners in a central area in Tokyo can provoke a considerable increase of the urban air temperatures, reaching even 2.0 °C on summer weekdays, while similar results were reported on a study carried out in several American cities, where the increase of air temperature due to anthropogenic heat was estimated around 1.7 °C [23].
The increased urban air temperatures affect multiple domains of the human life, and the corresponding major consequences involve:
- The severe degradation of the urban air quality: According to findings of previous studies, the rise of the urban Tair along with the reduced wind speed (WS) values and the low relative humidity in urban areas facilitate the formation of various pollutants, contributing to their increased concentrations in the air and affecting its quality [24]. As suggested by Sarrat et al. [25], the higher urban Tair values contribute to the increase of the levels of primary and secondary regional pollutants, including nitrogen oxides (NOx) and O3, whereas especially during extreme summer conditions, the stagnant atmospheric conditions and the low wind speeds can lead to the entrapment of pollutants inside the urban areas, enhancing the health risk of citizens [26].
- The poor indoor and outdoor thermal comfort conditions: Numerous studies have correlated the increase of the ambient urban Tair with the degradation of the summer outdoor thermal comfort of pedestrians [27,28]. In parallel, existing evidence suggests that, during summer, the indoor thermal conditions can be severely deteriorated, since the indoor air temperatures often outweigh the respective threshold values defined by thermal regulations etc. [29]. The latter effect is more prominent in old or low-income buildings, in which the building envelope is poorly or not at all insulated, and as a consequence, the well-being and health of the residents are considerably affected [30].
- The energy penalty on the building sector: The effect of urban warming on the buildings’ heating and cooling needs has been the subject of numerous scientific studies worldwide [29,31,32]; the existing results reveal a considerable increase of the cooling energy demand, considerably outweighing the marginal reduction of heating needs [33,34,35] with the gap being even higher in cooling-dominated climates [36]. In the same context, findings of a recent literature review suggest that the rise of the peak electricity load for air-conditioning purposes, per degree of air temperature increase, ranges between 0.45% and 4.6% [29], while the comparative analysis of existing scientific results revealed that the average increase of the cooling load due to urban warming is close to 13%, depending on the intensity of urban warming and the building characteristics [31].
Based on the above-mentioned remarks, researchers have paid great scientific attention, on one hand, on the investigation of the key parameters governing the energetic basis of the urban microclimate and the establishment of suitable mitigation and adaption strategies, on the other hand. Thus, the aim of this paper is (a) to present the basic methods that have been applied by the scientific community towards the investigation of cities’ microclimatic conditions and (b) to collect, analyze and present the outcome of studies aiming at the establishment of suitable mitigation and adaption strategies.
2. Investigation Methods of Urban Warming and the Urban Microclimate
While traditionally. the investigation of the urban microclimate has been performed by observational means [37], the significant advances in computational resources of the last decades have considerably enhanced the application of numerical simulation approaches [38]. In the following sections, the fundamental information on the investigation of the urban microclimate via experimental and computational means is provided.
2.1. Experimental Methods—Onsite Measurements
When experimental techniques are employed for the urban microclimate investigation, onsite climatic records inside the study area are performed, and they are then compared with the respective values measured in the surrounding rural areas [15]. This approach requires the installation of fixed or mobile weather stations or suitable sensors, the climatic records of which are compared to assess the magnitude of differences between the urban and the rural areas. An important number of the existing relevant studies mainly focused on the Tair measurements rather than on other major climatic parameters such as wind speed and direction, solar radiation, etc. Furthermore, the respective studies have employed the Tair urban-rural differences (ΔTU–R) to estimate the “urban heat island intensity” (UHI), typically defined as the difference between the daily maximum air temperature in the urban center and surrounding suburban area [39]. Yet, in other studies, it is the difference between the average monthly Tair values, observed in an urban and a rural site, which is estimated to assess the differentiation of the urban microclimate parameters [8,40].
In a previous relevant literature review, Santamouris [41] has summarized the results of experimental campaigns, evaluating the urban heat island effect and its intensity in European cities, while Peng et al. [42] have performed a similar meta-analysis using experimental results for 419 cities all over the world. Magli et al. [8] have analyzed the hourly Tair records, issued from an urban and a suburban weather station in Modena, Italy, for the calendar years 2011 and 2012. The results indicated that the urban Tair values are always higher than the respective values at the suburban area, with peak differences on the average monthly values close to 2.0°C during summer. In the same context, Street et al. [35] have evaluated the maximum urban heat island intensity in Boston, USA, using hourly climatic records from an urban and two rural weather stations with the obtained results suggesting maximum urban heat island intensity between 1.30 °C and 2.80 °C, depending on the selected reference station.
In Greece, various monitoring projects have evaluated the urban-rural Tair differences under different meteorological conditions, using suitable loggers or fixed weather stations. In the city of Thessaloniki, Giannaros and Melas [43] have measured near-surface Tair at seven urban and rural sites of the city for a one-year period; their analysis revealed that the maximum deviations between the hourly records of urban and rural areas, reaching 4.0 °C and 2.0 °C in summer and winter, correspondingly, were observed after sunset, whereas the minimum respective discrepancies have been noticed at noon. In the same vein, Papanastasiou and Kittas [44] have examined the temperature differences occurring between an urban and suburban site in Volos, Greece. The comparison of one-year Tair records indicated that the peak difference on the hourly Tair records reached 3.4 °C and 3.1 °C in winter and summer, respectively, whereas in both cases, the maximum deviations have been again observed after sunset rather than during the day, a finding that is also confirmed by other relevant studies, both in Greece [45,46,47] and other countries around the world [48,49,50].
Given the considerable advances of measurement devices, additional climatic parameters including wind speed values, radiation fluxes and turbulence variations can be also experimentally evaluated to acquire a global perspective of the effect of urban morphology on the local microclimatic conditions [51,52,53]. Guattari et al. [40] have compared climatic records from a reference weather station located in a low-density area in the suburbs of the city of Rome with the respective on-site climatic measurements at a densely built urban area. The analysis concerned measurements of dry bulb temperature, wind speed and relative humidity of a two-year period. Minor Tair differences between the two areas were found in winter, while in summer, the maximum deviations of the monthly average Tair occurred in July 2015 and August 2015 and reached 2.0 °C. Significantly lower wind velocities were also noticed in the central area, due to wind sheltering by the neighboring constructions, whereas the dense urban area was generally characterized by lower relative humidity (RH) values, compared to the reference meteo station, as the latter area was influenced by higher evapotranspiration rates due to the increased presence of vegetation and the sea breeze effect. Moreover, Christen and Vogt [54] have performed an extensive experimental analysis in Basel, Switzerland, in which air temperature, relative humidity and shortwave and longwave radiation fluxes, along with turbulent energy flux density (involving sensible heat flux and latent heat flux), were continuously measured for a year, in seven different stations in central and rural areas of Basel. The analysis of the daily Tair variations between urban and rural sites revealed a peak difference of 3.0 °C in summer, occurring right after sunset, whereas the lowest discrepancies have been found at noon. In addition, the thermal properties of the urban surfaces contributed to an increase of the sensible heat flux by a factor of two, compared to the respective rural values, and they have led to significantly higher amounts of nocturnal heat release in the city center, especially during summer. The above-mentioned findings are summarized in Table 1.
Even if the experimental procedures have been widely applied during the previous decades and they have been the basis for the numerical models’ creations, they still present important disadvantages, involving:
- time and cost limitations, since it is a long process requiring suitable, high accuracy equipment.
- increased risk of error if special attention on the measurement protocol is not paid. Reported errors have been associated with the calibration of the respective measuring equipment [57] or the potential boundary effects formed along the building elements, near which the microclimatic sensors are placed [11].
- limited spatial resolution; in situ measurements can be generally only performed at a small number of points inside a study area due to the limitation of resources [58]; yet, is important to stress that significant variations of air temperature, wind speed, solar radiation. etc. can occur among points of the same study area due to the varying spatial configurations and urban morphology features involving orientation, H/W ratio, presence of vegetation, etc.
The application of computational methods for microclimate analysis can significantly contribute to address the above-mentioned issues. The basis of the creation of numerical microscale models relies on the complex interactions between the urban fabric (i.e., buildings and ground surfaces) and local weather parameters; in principle, solar radiation, including direct, diffuse and reflected radiation, along with airflow patterns and heat transfer from the urban surfaces to the air, are accounted for in such models [59].
2.2. Computational Methods
Considering the advances in computational resources, along with the need of high spatial modeling accuracy in microclimate studies, several numerical methods have been developed over the past decades. In this section, only a brief overview of the main computational techniques is presented, whereas an extended analysis on the possibilities and limitations of the various computational methods is provided in previous review papers [58,60,61]. The computational methods towards the analysis of the urban microclimate involved initially the simplified approach of the surface energy balance model (SEBM), which was based on the law of conservation energy for a specific control volume and following the principles of the surface energy balance and proposed by Oke back in 1982 [6]. The SEBM, a detailed description of which is provided by [38,60], has been widely used in the past decades, whereas relevant modeling approaches have been compared by Grimond et al. [62], so as to identify the required level of the model complexity towards accurate simulation results. The SEBMs have provided the basis for numerical microclimate analysis; yet, an important limitation lies on the absence of information concerning wind velocity fields and the fact that flow patterns, affecting sensible heat flux, cannot be appropriately modeled in this kind of model [58]. In recent years, other microclimate models, such as SOLWEIG [63] and SOLENE [64], mainly focus on the shortwave and longwave 3D radiation exchanges occurring between the urban elements, whereas the thermal comfort of pedestrians is mainly assessed via the calculation of the mean radiant temperature (Tmrt) values. Still, wind flow and the corresponding complex turbulence characteristics inside an urban district cannot be accounted for.
On the other hand, Computational Fluid Dynamics (CFD) models offer significantly higher capabilities, enabling the explicit coupling of both velocity and temperature at considerably finer scales compared to the SEBM. All the governing fluid equations involving conservation of mass, momentum, etc. are simultaneously solved, while complex urban geometries can be accurately modeled and resolved [65]. Still, CFD simulations require the knowledge of more parameters, serving as input boundary conditions for all flow variables, whereas the multiple nodes and the fine scale analysis lead to significantly computationally expensive calculations [37]. Up to the present time, CFD simulations at the microscale, following best practice guidelines (see [66,67,68]), have been widely validated (see review of Toparlal et al. [58] and Blocken at al. [37]) and applied for the study of the pedestrians’ thermal comfort in outdoor spaces [69,70,71,72], investigation of the air flow around the building volumes [73,74] and also wind-driven rain analysis [75,76] and pollutant dispersion [77,78].
In parallel, several studies have proposed an external coupling of CFD with Building Energy Performance Simulation (BEPS) models so as to increase the accuracy of the microclimate simulation results in terms of radiative, thermal and convective heat fluxes [79,80,81,82,83]; from one hand, BEPS models provide a detailed calculation of radiative fluxes without however capturing the dynamic effects of air flow near the facades, whereas on the other hand, CFD simulations require the surface temperatures as a boundary condition to accurately calculate the flow pattern near building facades. The external coupling implies thus the exchange of data between the two codes while the number of the performed iterations depend on the desired level of accuracy [84]. The coupling of CFD and BEPS models has been mainly applied in studies assessing the impact of the urban microclimate on buildings’ energy performances, since it contributes to the more accurate estimation of the buildings’ surface temperatures and the respective convective heat transfer coefficient (CHTC) calculation. However, in spite of the high accuracy level, the extreme computational cost of the procedure remains a very important limitation.
Another CFD code, widely applied during the last two decades is the ENVI-met model [85], a prognostic, three-dimensional, grid-based model which is based on the fundamental laws of fluid dynamics and thermodynamics. Despite its more simplified approach compared to the coupled simulation technique, the model provides a holistic simulation method of the diurnal cycle of major climatic variables involving air and soil temperature and humidity, wind speed and direction, radiative fluxes. etc. at a lower computational cost [86,87,88]. The ENVI-met model’s first official release dates back in 1998, and until 2017, more than 1900 registered users worldwide have used it for microclimate research. As reported in a recent literature review of Tsoka et al. [89], in March 2018, almost 280 respective papers have been identified in the Scopus database. while 68% of them concern articles published in scientific journals and the rest (31% and 1%) correspond to conference papers and book chapters, respectively. The model has been applied for the investigation of current microclimatic conditions and the comparative assessment of the performance of various mitigation strategies [46,90,91,92] and for outdoor thermal comfort investigation [93,94,95] but also for the investigation of the air quality focusing on pollutant deposition and dispersion [96,97,98,99].
To conclude, it can be said that the occurrence of high ambient Tair in urban areas has gained great scientific attention, considering its severe negative environmental, social and energy impact. In the future, even higher urban air temperatures are to be expected due to the climate change, contributing to the already existing worrying microclimatic issues [100]. In light of the above, the establishment of methods that would improve the urban thermal environment and attenuate its multiple negative consequences seems a challenging issue. In the following section, the most common strategies for the improvement of the urban microclimate are presented and discussed.
3. Mitigation and Adaption Strategies to Attenuate Urban Warming
To date, a great number of scientific studies have evaluated the impact of different mitigation strategies towards the improvement of the urban thermal environment and its implicit effects. More precisely, the proposed intervention scenarios mainly involve the following clusters:
- the addition of urban greenery such as street trees, grass or green roofs;
- the application of cool materials on ground and building envelope surfaces;
- the combined application of cool materials and urban vegetation and
- water-based mitigation techniques such as sprinklers, ponds and fountains.
Towards a consistent comparison of the urban microclimate parameters before and after the proposed strategies (i.e., under similar boundary conditions), the existing scientific studies have mainly applied numerical simulation techniques and, more rarely, field measurements.
3.1. Addition of Urban Greenery
The positive impact of urban greenery on cities’ microclimates, either as a part of the urban landscape (i.e., street trees, grass and urban parks) or implemented on the buildings’ facades (i.e., green roofs and walls), has been widely evaluated in many previous scientific studies [29,101,102,103,104,105,106]. The reported findings reveal the major role of evapotranspiration and the additional shading of the adjacent ground and buildings’ surfaces by the trees’ foliage, contributing to lower amounts of solar energy absorbed and stored by the urban surfaces and, consequently, to lower convective and radiative heat fluxes. Apart from the evaporative cooling and the radiation management, urban greenery also highly enhances the aesthetics of the urban districts and contributes to pollutant, airflow and noise control [107,108]. Up to the present time, the majority of microclimate simulation studies, assessing the cooling potential of vegetation strategies, mainly focus on the performance of street trees and green roofs or their combined use, whereas the unique application of grass has been far rarely assessed [89,109]; the examined vegetation scenarios correspond to different green coverage ratios (GCR) (or urban green coverage (UGC)) or to green elements having different plants’ characteristics, such as height, foliage’s density, etc. Especially in the ENVI-met model, a very common scientific indicator for trees and plants is the leaf area index (LAI), representing the ratio of the one-sided area of the leaf to the total ground surface area. The latest ENVI-met version uses the leaf area density (LAD) for the characterization of plants derived from the leaf area index at 10 intervals along the height of the plant [110].
3.1.1. Adding Street Trees and Hedges
Wang and Akbari [111] have numerically assessed the cooling potential of various planting patterns of trees and hedges in a typical urban district of Montreal, Canada. The acquired results revealed a maximum summer Tair reduction, ranging between 2.1 °C and 5.0 °C, depending on the examined vegetation scenario, while a significant decrease of Tmrt, even up to 35.0 °C, has been also achieved, due to the radiation control by the trees’ foliage. In the same context, Wu and Chen [112] have investigated the effect of increasing the GCR by 10% in areas having different surface densities in Beijing, China on the local microclimatic conditions. A reduction on the peak Tair between 0.20 °C and 0.50 °C was found, under summer conditions, while the average diurnal Tair decrease did not exceed 0.10 °C in all cases. Similarly, Salata et al. [113] have suggested that an increase of the GCR by 10%, in a central urban area in Rome, Italy, may lower the maximum and the daily average Tair in July by 1.34 °C and 0.32 °C, correspondingly, whereas an important reduction on the peak Tmrt values can be also achieved. Shashua-Bar et al. [114] have applied the Green CTTC (cluster thermal time constant) model [115] to estimate potential changes on the ambient Tair value due to the addition of urban greenery, involving three different urban tree species, in Tel Aviv, Israel. Their analysis revealed a major cooling potential of the trees in summer, with peak values reaching 4.0 °C. However, the effect of trees on the urban microclimate is strongly influenced by the urban street geometry; the higher the aspect ratio of the streets, the more important the shading by the building volumes and, thus, the smaller the trees’ cooling effect. Other scientific studies have also indicated that the spatial arrangements of trees as a continuous shading canopy [92,111,116] rather than with intervals between them [111,117] will also lead to significantly high Tmrt reduction, even exceeding 30.0 °C. Finally, the results of the previous simulation studies of Piselli et al. [118] and Tsoka et al. [92] have highlighted the significant reduction of the ground surface temperatures (Tsurf) after adding extra trees, because of the respective solar radiation rays’ interception by the trees foliage but also by the higher presence of natural soils and the respective higher moisture content compared to conventional materials.
Still, a high increase of the GCR ratio and/or the leaf area density (LAD) values is not necessarily the most optimal solution towards the ambient Tair cooling. Evidence from some previous simulation studies suggest that, apart from the increased shadowing, extra trees will also act as additional barriers to the outgoing longwave radiation and wind flow. As a consequence, both longwave radiation loss and heat removal through convection phenomena can be significantly attenuated, leading eventually to a rise of the ambient Tair [119,120,121,122,123]. A summary of the results of the previously mentioned studies is presented in Table 2.
3.1.2. Adding Grass
The cooling potential of the unique application of grass on urban ground surfaces has been assessed by a rather small number of scientific studies, whereas most of the encountered simulation studies have been carried out with the ENVI-met model. Lobaccaro and Acero [121] have examined potential changes on summer surface, air and mean radiant temperature, after replacing 30% of a generic street canyon’s surface with grass of 50 cm in height; the canyon is considered to be located both in a mid-rise and high-rise area. Their results suggested a small reduction of the peak Tair at the mid-rise area, reaching 0.24 °C, while the Tsurf and Tmrt were also reduced in both areas by 5.30 °C–8.80 °C and 4.6–10.0 °C, respectively. Higher reductions of the peak summer Tair values due to grass applications were however reported by Gampostrini et al. [124] and Yang et al. [125], reaching values close to 1.0 °C.
3.1.3. Adding Green Roofs
Green roofs have been also widely examined as a strategy towards the improvement of the local thermal environment during hot summer conditions. Despite their undeniable contribution on the reduction of roofs’ surface temperatures and the respective decrease of sensible heat releases towards the atmosphere [127,128], their mitigation potential is more prominent at a close distance from the roof [129] rather than at the pedestrians’ level [89,109]. Moreover, evidence from existing research suggests that the vertical advection of the generated cool air decreases as the vertical distance between rooftop and ground increases. As a result, the respective cooling effect of green roofs is more prominent in low-rise areas, while in high-rise districts, only negligible changes on Tair have been reported at the human level [130,131,132,133].
More precisely, simulations with the CSCRC model (i.e., a numerical method of Coupled Simulations of Convection, Radiation and Conduction, presented in [81]) have been performed by Chen et al. [134] to assess the cooling potential of green roofs of extensive types in urban areas of Tokyo, Japan. The results indicated that their implementation on medium and high-rise buildings will only lead to a negligible reduction of the ambient temperature at the street level. Similar simulation results have been also reported by Ng et al. [135], who investigated the cooling potential of grass-planted roofs applied in high-rise buildings in Hong Kong, China. The analysis indicated a low decrease of the ambient Tair at the street level that does not exceed 0.12 °C. Finally, Jin et al. [136] have applied both measurement and simulation methods to investigate the effect of intensive and extensive roof types on the thermal environment of both mid-rise and high-rise areas in Chongqing, China. The obtained results suggested that the intensive and extensive roof types can lead to a reduction of the peak Tair close to 0.40°C and 0.30°C, respectively, in the mid-rise area, while negligible differences have been noticed in the high-rise area for both roof types. The above-mentioned simulation results are summarized in Table 3.
3.1.4. Combining Strategies of Urban Greenery
The combination of street trees with green roofs or with grass constitutes a mitigation strategy that can have the highest mitigation potential among the various urban greenery scenarios [109]. In a study of Pastore et al. [137], the benefits of combined vegetation strategies, in a case of a neighborhood renewal design in Palermo, Italy, have been numerically evaluated; the acquired results suggested that the application of dense grass along with trees of 15 m in height around all buildings and in the central open areas of the examined neighborhood may even lower the max Tair in summer by 2.5 °C. Contrary, the respective maximum Tair reduction due to additional dense grass and 2-m-high hedges around the buildings does not exceed 0.50 °C. In the same vein, Srivanit and Hokao [138] and Sodoudi et al. [123] have applied numerical microclimatic simulations for the assessment of the combined implementation of green roofs with additional trees in Saga, Japan and Tehran, Iran, correspondingly. The obtained simulation results indicated a max Tair reduction in a summer day close to 2.30 °C in both studies, while on the other hand, Chen and Ng [27] found a smaller effect of combining green roofs and trees in an urban area of Hong Kong, China, with a max Tair reduction not exceeding 0.45 °C.
3.2. Application of Cool Materials
Cool materials have been broadly examined as an adaption strategy towards the improvement of the microclimate of the urban areas. As suggested by Qin [139], the materials that are characterized as “cool” ones should absorb and store lower amounts of solar radiation, compared to conventional materials, so as to maintain reduced surface temperatures (Tsurf). The longwave radiation flux emitted towards the surrounding environment is thus considerably reduced, leading to lower ambient temperatures [140,141]; This could be achieved by different techniques, including:
- Changes on the solar reflectance (albedo) and infrared emittance: This category contains the so-called “highly reflective” and “thermochromic” pavements. Increasing the value of solar reflectance and/or emittance would initially lead to reduced surface temperatures due to lower solar radiation absorption and, at a second step, to lower ambient Tair, as a result of the reduced heat convection intensity [140]. Cool pavements of this category were initially designed to be light-colored and, thus, highly reflective, mainly in the visible wavelength. Yet, during the last decade, significant research has been carried out so as to produce cool nonwhite materials with embedded cool pigments, being also highly reflective in the near-infrared radiation spectrum [141].
- Changes on the evaporation rates: This cluster involves the porous, pervious and water- retaining pavements [142], presenting more internal holes (pores) which let rain or irrigation water drain into the pavement contributing to increased evaporative cooling. As a result, the pavement’s surface temperature remains lower, and the heat transfer to the air through convection and radiation is also decreased.
- Changes on heat storage of pavements: This category involves paving materials embedded with phase change materials (PCM) [143]. Embedding PCM in conventional pavements would provoke an increase of the pavement’s thermal inertia compared to conventional pavements; the absorbed heat during daytime will be used for the material’s phase change (i.e., melting process) instead of its temperature rise, while at night, when the ambient temperature is relatively low, the PCM solidifies, and the stored heat is released. The achieved daytime reduction of surface temperatures contributes to lower convective heat flows to the ambient air [144].
To date, the vast majority of the existing microclimate studies mainly concern the application of cool materials of the first cluster (i.e., materials having modified solar reflectance and a consequent reduction of absorption coefficient), while the assessment of pervious, water-retentive pavements or phase change materials is rather rarer. In parallel, the examined cool materials scenarios comprise of the following three subcategories: (a) cool roofs applications, (b) cool asphalts and pavements applications and (c) combined cool envelope facades and cool ground surfaces. A summary of previous relevant studies, evaluating the cooling potential of high albedo roofs or pavements, is provided in the following sections.
3.2.1. Cool Roofs Applications
Evidence from previous relevant studies suggests that the unique application of cool materials on building roofs may considerably reduce the Tair above the roof surfaces but has only a minor cooling potential at the pedestrians’ level (see Table 4). More precisely, the bigger the distance between the rooftop and the ground surfaces, the smaller the air temperature change at the human level [113,145]. Wang et al. [126] have numerically evaluated the cooling potential of increasing the building roofs albedo by 0.40 in a mid-rise, a high-rise and a detached area in Toronto, Canada. The simulation results indicated important reductions on the roofs’ Tsurf in all cases, close to 9.0 °C and 11.0°C in the high-rise and the detached area, correspondingly; yet, at the pedestrians’ level, the effect of changing the roof albedo on the max Tair was only prominent in the detached house area, reaching 0.50°C, whereas negligible changes were reported in the other two case studies. This is attributed to the distance between the rooftop and the human level in the detached urban district, which is lower compared to the other two areas. Similar results were also obtained by Salata et. al [113], who evaluated the effect of increasing the building roofs’ albedo by 0.31 on the outdoor thermal environment of an urban district in Rome, Italy. Simulations were conducted with the ENVI- met model, and the obtained results indicated a rather minor decrease of the maximum Tair value at the pedestrians’ level in summer, close to 0.10 °C.
Similar magnitudes of Tair reductions due to cool roofs applications have ben also reported by Maleki et al. [146] and Huynch and Eckert [145]. Yet, previous studies have found that city-scale applications of cool roofs present higher potential on reducing the peak ambient Tair values in summer. In this context, Synnefa et al. [147] have applied the mesoscale model MM5 [148] to assess the cooling effect of increasing the building roofs’ albedo at a city-scale in Athens, Greece. In this study, moderate and a high albedo increases were considered for all building roofs of the city, corresponding to a rise of 0.48 and 0.67, respectively, compared to the initial albedo values. The simulation results revealed a maximum Tair reduction, at 2.0 m from the ground, of 1.5 °C and 2.0 °C for the moderate and high albedo rise, respectively. Similarly, Georgescu et al. [149] have used the Weather Research and Forecasting (WRF) model [150] to evaluate the cool roofs applications at a city scale in different cities of the USA. The acquired simulation results suggested that an increasing of the roofs’ solar reflectance by 0.25 can contribute to an average summer Tair reduction at the pedestrians’ level, varying from 0.45 °C to 1.80 °C, depending on the investigated city.
3.2.2. Cool Pavements Applications
Cool pavements applications on ground surfaces comprise of the replacement of conventional asphalt and concrete pavements with the corresponding cool ones. So far, most of the existing microclimate simulation studies deal with the performance of cool pavements with high reflectivity, while the assessment of pervious and PCM-embedded pavements is generally assessed through experimental campaigns [144,151,152]. In terms of high albedo pavements, Taleghani et al. [116] have applied the ENVI-met model to evaluate the effect of increasing the asphalt and concrete pavements’ albedo by 0.30 in an urban area in Los Angeles. The results indicated an important peak Tair reduction at the human level under hot summer conditions, reaching 2.0 °C, while similar magnitudes of max Tair cooling were also reported by Battista et al. [153] for a case study in Rome, where the ground surface albedo was increased by 0.20. In the same context, Zoras et al. [154] have used the ANSYS CFD [155] model to evaluate the impact of highly reflective pavements on the outdoor thermal environment in an urban area of Florina, Greece. Simulation results, performed for a hot summer day, suggested that the increase of the asphalt and concrete pavements’ albedo by 0.27 and 0.45, respectively, can lower the maximum surface and air temperature of the study area by 3.5 °C and 1.39 °C, correspondingly (Tair results at 1.80m from the ground level), while no changes were reported at the wind speed values after the morphological modification. In parallel, the application of cool materials on both vertical and horizontal surfaces may lead to considerable peak Tair reductions with reported values ranging between 0.70 °C [123] and 3.70 °C [156]; hence, covering both building facades and ground surfaces with high albedo materials may sometimes have the opposite effect, resulting in the increase of ambient Tair due to the important rise of shortwave reflections inside the street canyons [156,157].
Furthermore, the effect of replacing all asphalt roads with concrete paving materials, having higher albedo by 0.20 and lower volumetric heat capacity by around 7%, was examined for different urban areas in Toronto, using the ENVI-met microclimate model [126]. The acquired results showed an important peak summer Tsurf reduction at noon, ranging from 7.9 °C in the detached area to 7.6 °C in the middle-rise area, while the respective maximum Tair changes at the human level being lower than 0.40 °C in all areas. A summary of previous studies, assessing the cooling potential of high albedo pavements or combined applications with high albedo roofs and walls is given in Table 4.
In the same vein, previous review studies performed by Coutts et al. [158] and Fletcher et al. [159] have discussed the potential of water-retaining, pervious materials towards the improvement of the urban thermal environment of modern cities. At this point, it is important to stress that different magnitudes of Tair cooling as a consequence of cool pavements applications should be also attributed to the varying spatial configurations of the investigated study areas (apart from general climatic conditions such as solar radiation intensity, etc.); urban morphology features involving orientation and H/W ratio will strongly influence the exposure of the canyon surfaces on direct solar radiation, altering thus the magnitude of the cool materials’ effect on ground surface temperature reduction and, as a result, on the reduced heat convection from the ground surfaces to the ambient air.
3.2.3. Some Issues Regarding the Application Of Cool Pavements
As previously mentioned, cool coatings have been widely evaluated as a strategy towards the attenuation of urban warming and the improvement of the cities’ outdoor thermal environement. Despite their undediable positive effect on the reduction of the surface temperatures, special attention should be paid on the following two phenomena:
- Cool coatings’ influence on the human energy balance: A worrying issue about the cool pavements’ applications involves their impact on the radiative balance of the ground surface and, consequently, on the radiative exchange of the pedestrians with the surrounding environment. In other words, the achieved peak Tair reduction due to a lower sensible heat transfer to the air is often counterbalanced by the increased reflection of solar radiation, affecting the Tmrt values and, thus, the human thermal balance [12,162,163,164]; the latter effect has been discussed in many previous studies, the obtained results of which reveal a potential compromise of the pedestrians’ thermal comfort when applying cool materials on ground surfaces or both on ground and building envelope surfaces. On the other hand, when cool materials are only used for roof applications, their effect on Tmrt values at the pedestrian level is negligible [116,126,165].
- Cool coatings’ aging: Another parameter that should be also considered when the application of cool pavements is suggested as a mitigation strategy involves their aging and the corresponding loss of their initial albedo values. In fact, since the albedo value is determined by the optical properties of the outer surface layer of the materials, significant changes may occur over time [166]. Apart from the degradation that occurs due to the environmental conditions, such as rain, wind and sunlight, experimental data from former scientific studies suggest that the solar reflectance of cool asphalts and pavements also occurs by the dust and the pollutants and also from the deposition of rubber from the tires of vehicles [167]. It is also interesting to mention that, according to previous observations, most of the albedo loss occurs during the first few months of exposure, and then, it almost stabilizes [168,169]. It can be thus said that the assumption of a constant albedo during the whole lifecycle of the materials may be misleading when it comes to the evaluation of their effects on the outdoor thermal environment. Alchapar et al. [170] have measured and analyzed the optical properties of various concrete pavements of different colors so as to identify potential changes after a year of exposure on the pedestrians’ circulation (vehicular pavements have not been evaluated). The results indicated an important degradation of the albedo of lightly colored pavements, with a reported albedo decrease even up to 25% at the end of the first year of exposure. In the same vein, Kyriakodis et al. [167] have assessed the ageing and the induced albedo decrease of a yellow reflective asphalt with infrared reflective pigments and aggregates in Athens; after six months of continuous use, the albedo of the cool asphalt was reduced by almost 50% as a consequence of atmospheric pollutants and particles issued by vehicles emissions and also due to dirt and rubber from the vehicles tires.
3.2.4. Combined Cool Materials and Urban Greenery Applications
To address the previously mentioned issue regarding the radiative balance of a pedestrian, the combined application of high albedo pavements with green elements such as street trees and hedges seems to be the most effective solution; apart from the release of latent heat through the evapotranspiration process, the trees’ foliage will also act as a solar radiation shield, controlling both direct and reflected shortwave radiation fluxes [92]. In a study of Wang et al. [126], the effect of combining cool roofs, cool pavements and additional trees in a dense urban area of Toronto, Canada was numerically examined. It was proven that an albedo increase by 0.4 and 0.2 for the roofs and pavements, respectively, along with a 10% rise of the GCR, could potentially lead to max Tair and Tmrt reduction of 1.0 °C and 5.0 °C, correspondingly, compared to the current conditions during the summer simulation day. Similarly, Salata et al. [113] suggested that increasing the asphalt’s albedo by 0.20 and rising the GCR by 9% can lead to a max Tair and Tmrt reduction of 2.50 °C and 38.41 °C, correspondingly, in an urban area in Rome, Italy. In the same vein, Gaitani et al. [171] have applied the PHOENICS CFD code to evaluate the effect of combining cool materials in pavements with green spaces and extensive shading by extra trees. Their analysis revealed a significant decrease on the ground surface temperatures, whereas the maximum summer Tair was reduced by 2.0 °C.
3.3. Water-Based Mitigation Techniques
The use of water-based applications for the reduction of the urban air temperatures relies, on one hand, on the latent heat released during the evaporation process and, on the other hand, on the lower water surface temperature compared to the conventional urban surfaces, leading to lower convective heat transfer towards the air [172]. Apart from the natural water bodies inside the urban areas (i.e., rivers, lakes, etc.) [173,174], urban evaporative methods comprise of various systems such as pools, ponds, sprinklers and fountains [175,176] while the level of their cooling potential depends on several parameters involving the shape of the water body and the characteristics of the surrounding area [177] and also the local climatic conditions, including relative humidity, wind speed, air temperature and solar radiation intensity [178].
To date, the mitigating potential of evaporative methods has been far less evaluated, compared to the urban greenery and cool materials’ applications, whereas the relevant studies are mainly performed via simulation methods and, more rarely, through experimental means [109]. Yet, based on the results of the existing studies, some preliminary conclusions can be drawn. In a recent literature review, Santamouris et al. [109] have summarized the results of existing experimental and numerical studies to assess the cooling potential of several evaporative techniques; their analysis suggested that the application of sprinklers can be considerably more effective on lowering the maximum summer Tair values, compared to ponds or fountains, while the combined use of various evaporative techniques can increase even more the mitigation potential. Moreover, in recent years, the ENVI-met model has been widely applied for the assessment of the water bodies’ effects on the local microclimate.
Indicatively, Martins et al. [175] have used the model to quantify the effect of replacing concrete pavement areas with water surfaces and tall fountains in a low-density urban site of Toulouse, France. The obtained results revealed a Tair reduction around 2.0 °C at the pedestrians’ level in areas around the water bodies both in daytime and nighttime, due to the increased evaporation rates and the lower sensible heat release, compared to the base case scenario. In the same vein, Taleghani et al. [179] have investigated the cooling potential of adding pools and ponds in the courtyards located between the buildings of the university campus in Portland, Oregon, USA. The acquired results revealed a peak Tair reduction at the human level of 1.10 °C near the pool’s area, while the effect was significantly attenuated as the distance from the pool increased. Similarly, O’Malley et al. [3] have simulated via the ENVI-met model the impact of adding pools and ponds in a low-density urban area of London, UK during summer. Their results indicated a reduction of 0.50 °C in summer at noon in areas around the ponds, while the Tair modification at night did not exceed 0.20 °C. Still, considering the small sample size of the available studies that examine the evaporative techniques, the above-mentioned results are only indicative, and further research would be necessary to acquire a holistic knowledge on the effect of water-based methods on the urban microclimate [109]. A summary of the results previously mentioned is shown in Table 5.
4. Discussion and Conclusions
Given the growing challenge for sustainable, resilient cities in the context of increased urbanization and urban warming, urban microclimate studies are continuously gaining great scientific attention; throughout the last 35 years, researchers have tried to shed light on the energetic basics of the urban heat island phenomenon, either by experimental monitoring campaigns or by numerical simulation means. Traditionally, observational approaches have been the dominant approach for the investigation of the urban microclimate, while the acquired experimental results constituted the basis for further development of the energy balance models. In most of the existing experimental studies, onsite monitoring of urban microclimate has been conducted for a long time period, covering different meteorological conditions and providing a global overview of the Tair difference between urban and rural sites within a year.
On the other hand, the computational advances of the last decades along with the acquired scientific knowledge on the field have led to the development and the extensive use of more complex urban microclimate models, allowing a detailed analysis and a holistic approach of the interactions between buildings, atmosphere and plants. Nevertheless, even if the use of computational approaches allows a more sophisticated approach, several issues regarding complexity and computational cost must be also considered. The latter limitation explains also the fact that, in most of the scientific studies assessing urban microclimate via numerical means, simulations are only conducted for individual days under hot summer conditions and, more rarely, for winter or autumn/spring conditions.
Based on the reported results of the studies described in Section 2, the major features of the fundamental investigation methods of the urban microclimate regarding their level of complexity, accuracy and their spatial and temporal resolutions are presented in Table 6. It could be thus said that the selection of the investigation approach is primarily related to the aim of the study and the required level of detail. Still, onsite monitoring campaigns are always crucial when the performance and the accuracy of urban microclimate models have to be evaluated.
As far as the mitigation and adaption strategies are concerned, it can be said that the urban greenery and the high albedo materials have been extensively evaluated and analyzed, which is not however the case for the water-based techniques; urban sprinklers, ponds and fountains have been far less assessed as a mitigation strategy with respect to the citizens’ thermal comfort and the outdoor thermal environment, indicating thus an important scientific field for further analytic studies. Regarding urban greenery applications, the addition of street trees and hedges has been proven considerably beneficial in terms of the outdoor Tair reduction and the radiation control, affecting both the pedestrians’ thermal balance and the buildings’ energy performances. Yet, in the respective studies, even if the effect of the spatial arrangement of trees and the percent increase of the green area ratio are often assessed, the role of different foliage densities strongly influencing the solar radiation transmission is far less evaluated, indicating thus an important perspective for future studies. On the other hand, the existing scientific evidence revealed a rather minor cooling potential both for grass and green roofs at the pedestrians’ heights; combining green roofs and grass with street trees would be thus a more favorable strategy that would result in the most pronounced Tair cooling effect.
Furthermore, the existing scientific evidence indicates that the use of cool coatings on the urban ground surfaces can significantly lower the surface temperatures and the convective heat release towards the surrounding air. Yet, given the unavoidable weathering and aging phenomena, further research and efforts are required by the scientific community and the industry to assure the durability and the long-term performance of the coatings. Moreover, an important perspective for future measurements and simulation studies would also involve the thermal performance of water-retaining or PCM pavements with regards to urban microclimate, as only a few relevant studies exist today. Regarding the high albedo roofs’ cooling potential at the pedestrians’ heights, it has been proven rather negligible, with their effect becoming even minor as the roofs’ distances from the ground increases. Cool roofs’ major contribution mainly concerns the roofs’ surface temperatures and the consequent heat transfer towards the buildings’ interior spaces.
Author Contributions
S.T., K.T. and T.T.: conceptualization of the study; S.T.: writing and K.T., T.T. and D.B.: review and editing of the manuscript. All authors have read and approved the manuscript.
Funding
This research received no external funding.
Acknowledgments
This study was conducted in the context of the PhD thesis of the corresponding author [181]. All authors would like to thank the Department of Meteorology and Climatology, School of Geology, of the Aristotle University of Thessaloniki, Greece for the support of this work.
Conflicts of Interest
The authors declare no conflicts of interest.
References
- Rizwan, A.M.; Dennis, L.Y.; Chunho, L. A review on the generation, determination and mitigation of Urban Heat Island. J. Environ. Sci. 2008, 20, 120–128. [Google Scholar] [CrossRef]
- Lin, P.; Gou, Z.; Lau, S.S.-Y.; Qin, H. The impact of urban design descriptors on outdoor thermal environment: A literature review. Energies 2017, 10, 2151. [Google Scholar] [CrossRef] [Green Version]
- O’Malley, C.; Piroozfar, P.; Farr, E.R.; Pomponi, F. Urban Heat Island (UHI) mitigating strategies: A case-based comparative analysis. Sustain. Cities Soc. 2015, 19, 222–235. [Google Scholar] [CrossRef] [Green Version]
- Grimmond, S. Urbanization and global environmental change: Local effects of urban warming. Geogr. J. 2007, 173, 83–88. [Google Scholar] [CrossRef]
- Akbari, H.; Rosenfeld, A.; Taha, H. Summer Heat Islands, Urban Trees, And White Surfaces; Energy Analysis Program, Center for Building Science, Applied Science Division, Lawrence Berkeley Laboratory, University of California: Barkeley, CA, USA, 1990. [Google Scholar]
- Oke, T.R. The energetic basis of the urban heat island. Q. J. R. Meteorol. Soc. 1982, 108, 1–24. [Google Scholar] [CrossRef]
- Oke, T.R. Street design and urban canopy layer climate. Energy Build. 1988, 11, 103–113. [Google Scholar] [CrossRef]
- Magli, S.; Lodi, C.; Lombroso, L.; Muscio, A.; Teggi, S. Analysis of the urban heat island effects on building energy consumption. Int. J. Energy Env.. Eng. 2015, 6, 91–99. [Google Scholar] [CrossRef] [Green Version]
- Nakamura, Y.; Oke, T.R. Wind, temperature and stability conditions in an east-west oriented urban canyon. Atmos. Environ. (1967) 1988, 22, 2691–2700. [Google Scholar] [CrossRef]
- Memon, R.A.; Leung, D.Y.; Liu, C.-H. Effects of building aspect ratio and wind speed on air temperatures in urban-like street canyons. Build. Environ. 2010, 45, 176–188. [Google Scholar] [CrossRef]
- Niachou, K.; Livada, I.; Santamouris, M. Experimental study of temperature and airflow distribution inside an urban street canyon during hot summer weather conditions—Part I: Air and surface temperatures. Build. Environ. 2008, 43, 1383–1392. [Google Scholar] [CrossRef]
- Chatzidimitriou, A.; Axarli, K. Street Canyon Geometry Effects on Microclimate and Comfort; A Case Study in Thessaloniki. Procedia Environ. Sci. 2017, 38, 643–650. [Google Scholar] [CrossRef]
- Arnfield, A.J. Street design and urban canyon solar access. Energy Build. 1990, 14, 117–131. [Google Scholar] [CrossRef]
- Ali-Toudert, F.; Mayer, H. Numerical study on the effects of aspect ratio and orientation of an urban street canyon on outdoor thermal comfort in hot and dry climate. Build. Environ. 2006, 41, 94–108. [Google Scholar] [CrossRef]
- Arnfield, A.J. Two decades of urban climate research: A review of turbulence, exchanges of energy and water, and the urban heat island. Int. J. Climatol. 2003, 23, 1–26. [Google Scholar] [CrossRef]
- Taha, H. Urban climates and heat islands: Albedo, evapotranspiration, and anthropogenic heat. Energy Build. 1997, 25, 99–103. [Google Scholar] [CrossRef] [Green Version]
- Berndtsson, J.C.; Bengtsson, L.; Jinno, K. Runoff water quality from intensive and extensive vegetated roofs. Ecol. Eng. 2009, 35, 369–380. [Google Scholar] [CrossRef]
- Kondoh, A.; Nishiyama, J. Changes in hydrological cycle due to urbanization in the suburb of Tokyo Metropolitan Area, Japan. Adv. Space Res. 2000, 26, 1173–1176. [Google Scholar] [CrossRef]
- Santamouris, M. Using cool pavements as a mitigation strategy to fight urban heat island—A review of the actual developments. Renew. Sustain. Energy Rev. 2013, 26, 224–240. [Google Scholar] [CrossRef]
- Fan, H.; Sailor, D.J. Modeling the impacts of anthropogenic heating on the urban climate of Philadelphia: A comparison of implementations in two PBL schemes. Atmos. Environ. 2005, 39, 73–84. [Google Scholar] [CrossRef]
- Papadopoulos, A.M. The influence of street canyons on the cooling loads of buildings and the performance of air conditioning systems. Energy Build. 2001, 33, 601–607. [Google Scholar] [CrossRef]
- Ohashi, Y.; Genchi, Y.; Kondo, H.; Kikegawa, Y.; Yoshikado, H.; Hirano, Y. Influence of air-conditioning waste heat on air temperature in Tokyo during summer: Numerical experiments using an urban canopy model coupled with a building energy model. J. Appl. Meteorol. Climatol. 2007, 46, 66–81. [Google Scholar] [CrossRef]
- Torrance, K.; Shun, J. Time-varying energy consumption as a factor in urban climate. Atmos. Environ. (1967) 1976, 10, 329–337. [Google Scholar] [CrossRef]
- Piver, W.T.; Ando, M.; Ye, F.; Portier, C. Temperature and air pollution as risk factors for heat stroke in Tokyo, July and August 1980-1995. Env.. Health Perspect. 1999, 107, 911–916. [Google Scholar] [CrossRef] [PubMed]
- Sarrat, C.; Lemonsu, A.; Masson, V.; Guedalia, D. Impact of urban heat island on regional atmospheric pollution. Atmos. Environ. 2006, 40, 1743–1758. [Google Scholar] [CrossRef]
- Johnson, H.; Kovats, R.; McGregor, G.; Stedman, J.; Gibbs, M.; Walton, H. The impact of the 2003 heat wave on daily mortality in England and Wales and the use of rapid weekly mortality estimates. Euro Surveill. 2005, 10, 168–171. [Google Scholar] [CrossRef]
- Chen, L.; Ng, E. Simulation of the effect of downtown greenery on thermal comfort in subtropical climate using PET index: A case study in Hong Kong. Archit. Sci. Rev. 2013, 56, 297–305. [Google Scholar] [CrossRef]
- Taleghani, M.; Berardi, U. The effect of pavement characteristics on pedestrians’ thermal comfort in Toronto. Urban Clim. 2018, 24, 449–459. [Google Scholar] [CrossRef]
- Santamouris, M. Regulating the damaged thermostat of the cities—Status, impacts and mitigation challenges. Energy Build. 2015, 91, 43–56. [Google Scholar] [CrossRef]
- Sakka, A.; Santamouris, M.; Livada, I.; Nicol, F.; Wilson, M. On the thermal performance of low income housing during heat waves. Energy Build 2012, 49, 69–77. [Google Scholar] [CrossRef]
- Santamouris, M. On the energy impact of urban heat island and global warming on buildings. Energy Build. 2014, 82, 100–113. [Google Scholar] [CrossRef]
- Santamouris, M.; Cartalis, C.; Synnefa, A.; Kolokotsa, D. On the impact of urban heat island and global warming on the power demand and electricity consumption of buildings—A review. Energy Build. 2015, 98, 119–124. [Google Scholar] [CrossRef]
- Fanchiotti, A.; Carnielo, E.; Zinzi, M. Impact of cool materials on urban heat islands and on buildings comfort and energy consumption. In Proceedings of the World Renewable Energy Forum, WREF 2012, Including World Renewable Energy Congress XII and Colorado Renewable Energy Society (CRES) Annual Conference, Denver, CO, USA, 13–17 May 2012. [Google Scholar]
- Kolokotroni, M.; Zhang, Y.; Watkins, R. The London heat island and building cooling design. Sol. Energy 2007, 81, 102–110. [Google Scholar] [CrossRef] [Green Version]
- Street, M.; Reinhart, C.; Norford, L.; Ochsendorf, J. Urban heat island in Boston–An evaluation of urban air-temperature models for predicting building energy use. In Proceedings of the BS2013: 13th Conference of International Building Performance Simulation Association, Chambéry, France, 26–28 August 2013; pp. 1022–1029. [Google Scholar]
- Tsikaloudaki, K.; Laskos, K.; Bikas, D. On the establishment of climatic zones in Europe with regard to the energy performance of buildings. Energies 2011, 5, 32–44. [Google Scholar] [CrossRef]
- Blocken, B. Computational Fluid Dynamics for urban physics: Importance, scales, possibilities, limitations and ten tips and tricks towards accurate and reliable simulations. Build. Environ. 2015, 91, 219–245. [Google Scholar] [CrossRef] [Green Version]
- Mirzaei, P.A.; Haghighat, F. Approaches to study urban heat island–abilities and limitations. Build. Environ. 2010, 45, 2192–2201. [Google Scholar] [CrossRef]
- Tan, J.; Zheng, Y.; Tang, X.; Guo, C.; Li, L.; Song, G.; Zhen, X.; Yuan, D.; Kalkstein, A.J.; Li, F. The urban heat island and its impact on heat waves and human health in Shanghai. Int. J. Biometeorol. 2010, 54, 75–84. [Google Scholar] [CrossRef]
- Guattari, C.; Evangelisti, L.; Balaras, C.A. On the assessment of urban heat island phenomenon and its effects on building energy performance: A case study of Rome (Italy). Energy Build. 2017, 158, 605–615. [Google Scholar] [CrossRef]
- Santamouris, M. Heat island research in Europe: The state of the art. In Advances in Building Energy Research; Routledge: London, UK, 2013; pp. 137–164. [Google Scholar]
- Peng, S.; Piao, S.; Ciais, P.; Friedlingstein, P.; Ottle, C.; Bréon, F.o.-M.; Nan, H.; Zhou, L.; Myneni, R.B. Surface urban heat island across 419 global big cities. Environ. Sci. Technol. 2011, 46, 696–703. [Google Scholar] [CrossRef]
- Giannaros, T.M.; Melas, D. Study of the urban heat island in a coastal Mediterranean City: The case study of Thessaloniki, Greece. Atmos. Res. 2012, 118, 103–120. [Google Scholar] [CrossRef]
- Papanastasiou, D.K.; Kittas, C. Maximum urban heat island intensity in a medium-sized coastal Mediterranean city. Theor. Appl. Climatol. 2012, 107, 407–416. [Google Scholar] [CrossRef]
- Giannopoulou, K.; Santamouris, M.; Livada, I.; Georgakis, C.; Caouris, Y. The impact of canyon geometry on intra urban and urban: Suburban night temperature differences under warm weather conditions. Pure Appl. Geophys. 2010, 167, 1433–1449. [Google Scholar] [CrossRef]
- Tsoka, S.; Theodosiou, T.; Tsikaloudaki, K.; Flourentzou, F. Modeling the performance of cool pavements and the effect of their aging on outdoor surface and air temperatures. Sustain. Cities Soc. 2018, 42, 276–288. [Google Scholar] [CrossRef]
- Vardoulakis, E.; Karamanis, D.; Fotiadi, A.; Mihalakakou, G. The urban heat island effect in a small Mediterranean city of high summer temperatures and cooling energy demands. Sol. Energy 2013, 94, 128–144. [Google Scholar] [CrossRef]
- Oke, T.R. Canyon geometry and the nocturnal urban heat island: Comparison of scale model and field observations. Int. J. Climatol. 1981, 1, 237–254. [Google Scholar] [CrossRef]
- Morris, C.; Simmonds, I.; Plummer, N. Quantification of the influences of wind and cloud on the nocturnal urban heat island of a large city. J. Appl. Meteorol. 2001, 40, 169–182. [Google Scholar] [CrossRef]
- Giridharan, R.; Lau, S.; Ganesan, S. Nocturnal heat island effect in urban residential developments of Hong Kong. Energy Build. 2005, 37, 964–971. [Google Scholar] [CrossRef]
- Gulyás, Á.; Unger, J.; Matzarakis, A. Assessment of the microclimatic and human comfort conditions in a complex urban environment: Modelling and measurements. Build. Environ. 2006, 41, 1713–1722. [Google Scholar] [CrossRef]
- Kantzioura, A.; Kosmopoulos, P.; Zoras, S. Urban surface temperature and microclimate measurements in Thessaloniki. Energy Build. 2012, 44, 63–72. [Google Scholar] [CrossRef]
- Weng, Q.; Lu, D.; Schubring, J. Estimation of land surface temperature–vegetation abundance relationship for urban heat island studies. Remote Sens. Environ. 2004, 89, 467–483. [Google Scholar] [CrossRef]
- Christen, A.; Vogt, R. Energy and radiation balance of a central European city. Int. J. Climatol. 2004, 24, 1395–1421. [Google Scholar] [CrossRef]
- Acero, J.A.; Arrizabalaga, J.; Kupski, S.; Katzschner, L. Urban heat island in a coastal urban area in northern Spain. Appl. Clim. 2013, 113, 137–154. [Google Scholar] [CrossRef]
- Borbora, J.; Das, A.K. Summertime urban heat island study for Guwahati city, India. Sustain. Cities Soc. 2014, 11, 61–66. [Google Scholar] [CrossRef]
- Young, A.; Mitchell, N. Microclimate and vegetation edge effects in a fragmented podocarp-broadleaf forest in New Zealand. Biol. Conserv. 1994, 67, 63–72. [Google Scholar] [CrossRef]
- Toparlar, Y.; Blocken, B.; Maiheu, B.; van Heijst, G. A review on the CFD analysis of urban microclimate. Renew. Sustain. Energy Rev. 2017, 80, 1613–1640. [Google Scholar] [CrossRef]
- Mirzaei, P.A. Recent challenges in modeling of urban heat island. Sustain. Cities Soc. 2015, 19, 200–206. [Google Scholar] [CrossRef] [Green Version]
- Bozonnet, E.; Musy, M.; Calmet, I.; Rodriguez, F. Modeling methods to assess urban fluxes and heat island mitigation measures from street to city scale. Int. J. Low Carbon Technol. 2013, 10, 62–77. [Google Scholar] [CrossRef] [Green Version]
- Frayssinet, L.; Merlier, L.; Kuznik, F.; Hubert, J.-L.; Milliez, M.; Roux, J.-J. Modeling the heating and cooling energy demand of urban buildings at city scale. Renew. Sustain. Energy Rev. 2017, 81, 2318–2327. [Google Scholar] [CrossRef] [Green Version]
- Grimmond, C.; Blackett, M.; Best, M.; Barlow, J.; Baik, J.; Belcher, S.; Bohnenstengel, S.; Calmet, I.; Chen, F.; Dandou, A. The international urban energy balance models comparison project: First results from phase 1. J. Appl. Meteorol. Climatol. 2010, 49, 1268–1292. [Google Scholar] [CrossRef]
- Lindberg, F.; Holmer, B.; Thorsson, S. SOLWEIG 1.0–Modelling spatial variations of 3D radiant fluxes and mean radiant temperature in complex urban settings. Int. J. Biometeorololy 2008, 52, 697–713. [Google Scholar] [CrossRef]
- Groleau, D.; Fragnaud, F.; Rosant, J.-M. Simulation of the radiative behaviour of an urban quarter of Marseille with the SOLENE model’. In Proceedings of the Fifth International Conference on Urban Climate, Lodz, Poland, 1–5 September 2003; pp. 1–5. [Google Scholar]
- Kanda, M. Progress in urban meteorology: A review. J. Meteorol. Soc. Jpn. 2007, 85, 363–383. [Google Scholar] [CrossRef]
- Mahaffy, J.; Chung, B.; Song, C.; Dubois, F.; Graffard, E.; Ducros, F.; Heitsch, M.; Scheuerer, M.; Henriksson, M.; Komen, E. Best Practice Guidelines for the Use of CFD in Nuclear Reactor Safety Applications-Revision; Organisation for Economic Co-Operation and Development: Paris, France, 2015. [Google Scholar]
- Franke, J.; Hellsten, A.; Schlunzen, K.H.; Carissimo, B. Pollution, the COST 732 best practice guideline for CFD simulation of flows in the urban environment: A summary. Int. J. Environ. Pollut. 2011, 44, 419–427. [Google Scholar] [CrossRef]
- Franke, J. Recommendations of the COST action C14 on the use of CFD in predicting pedestrian wind environment. In Proceedings of the fourth international symposium on computational wind engineering, Yokohama, Japan, 16–19 July 2006; pp. 529–532. [Google Scholar]
- Mochida, A.; Lun, I.Y.F. Prediction of wind environment and thermal comfort at pedestrian level in urban area. J. Wind Eng. Ind. Aerodyn. 2008, 96, 1498–1527. [Google Scholar] [CrossRef]
- Lin, B.; Li, X.; Zhu, Y.; Qin, Y. Numerical simulation studies of the different vegetation patterns’ effects on outdoor pedestrian thermal comfort. J. Wind Eng. Ind. Aerodyn. 2008, 96, 1707–1718. [Google Scholar] [CrossRef]
- Tablada, A.; Blocken, B.; Carmeliet, J.; De Troyer, F.; Verschure, H. The influence of courtyard geometry on air flow and thermal comfort: CFD and thermal comfort simulations. In Proceedings of the 22nd conference on passive and low energy architecture, Beirut, Lebanon, 13–16 November 2005; pp. 75–80. [Google Scholar]
- Stathopoulos, T. Pedestrian level winds and outdoor human comfort. J. Wind Eng. Ind. Aerodyn. 2006, 94, 769–780. [Google Scholar] [CrossRef]
- Tominaga, Y.; Akabayashi, S.-i.; Kitahara, T.; Arinami, Y. Air flow around isolated gable-roof buildings with different roof pitches: Wind tunnel experiments and CFD simulations. Build. Environ. 2015, 84, 204–213. [Google Scholar] [CrossRef]
- Baskaran, A.; Kashef, A. Investigation of air flow around buildings using computational fluid dynamics techniques. Eng. Struct. 1996, 18, 861–875. [Google Scholar] [CrossRef] [Green Version]
- Blocken, B.; Carmeliet, J. Validation of CFD simulations of wind-driven rain on a low-rise building facade. Build. Environ. 2007, 42, 2530–2548. [Google Scholar] [CrossRef]
- Van Hooff, T.; Blocken, B.; Van Harten, M. 3D CFD simulations of wind flow and wind-driven rain shelter in sports stadia: Influence of stadium geometry. Build. Environ. 2011, 46, 22–37. [Google Scholar] [CrossRef]
- Li, X.-X.; Liu, C.-H.; Leung, D.Y.; Lam, K.M. Recent progress in CFD modelling of wind field and pollutant transport in street canyons. Atmos. Environ. 2006, 40, 5640–5658. [Google Scholar] [CrossRef]
- Gousseau, P.; Blocken, B.; Stathopoulos, T.; Van Heijst, G. CFD simulation of near-field pollutant dispersion on a high-resolution grid: A case study by LES and RANS for a building group in downtown Montreal. Atmos. Environ. 2011, 45, 428–438. [Google Scholar] [CrossRef] [Green Version]
- Allegrini, J.; Dorer, V.; Carmeliet, J. Influence of the urban microclimate in street canyons on the energy demand for space cooling and heating of buildings. Energy Build. 2012, 55, 823–832. [Google Scholar] [CrossRef]
- Allegrini, J.; Dorer, V.; Carmeliet, J. Coupled CFD, radiation and building energy model for studying heat fluxes in an urban environment with generic building configurations. Sustain. Cities Soc. 2015, 19, 385–394. [Google Scholar] [CrossRef]
- Chen, H.; Ooka, R.; Harayama, K.; Kato, S.; Li, X. Study on outdoor thermal environment of apartment block in Shenzhen, China with coupled simulation of convection, radiation and conduction. Energy Build. 2004, 36, 1247–1258. [Google Scholar] [CrossRef]
- Bouyer, J.; Inard, C.; Musy, M. Microclimatic coupling as a solution to improve building energy simulation in an urban context. Energy Build. 2011, 43, 1549–1559. [Google Scholar] [CrossRef]
- Malys, L.; Musy, M.; Inard, C. A hydrothermal model to assess the impact of green walls on urban microclimate and building energy consumption. Build. Environ. 2014, 73, 187–197. [Google Scholar] [CrossRef]
- Malys, L.; Musy, M.; Inard, C. Microclimate and building energy consumption: Study of different coupling methods. Adv. Build. Energy Res. 2015, 9, 151–174. [Google Scholar] [CrossRef]
- Envi-Met ENVI-Met Model Description. Available online: http://www.envi-met.com/#section/intro (accessed on 15 January 2020).
- Bruse, M.; Fleer, H. Simulating surface–plant–air interactions inside urban environments with a three dimensional numerical model. Environ. Model. Softw. 1998, 13, 373–384. [Google Scholar] [CrossRef]
- Huttner, S. Further Development and Application of the 3D Microclimate Simulation ENVI-Met. Ph.D Thesis, Mainz University, Mainz, Germany, 2012. [Google Scholar]
- Envi-Met Basics of Envi-Met Model. Available online: http://www.envi-met.com/introduction/ (accessed on 15 January 2020).
- Tsoka, S.; Tsikaloudaki, A.; Theodosiou, T. Analyzing the ENVI-met microclimate model’s performance and assessing cool materials and urban vegetation applications-a review. Sustain. Cities Soc. 2018, 43, 55–76. [Google Scholar] [CrossRef]
- Ambrosini, D.; Galli, G.; Mancini, B.; Nardi, I.; Sfarra, S. Evaluating mitigation effects of urban heat islands in a historical small center with the ENVI-Met® climate model. Sustainability 2014, 6, 7013–7029. [Google Scholar] [CrossRef] [Green Version]
- Ebrahimnejad, R.; Noori, O.; Deihimfard, R. Mitigation potential of green structures on local urban microclimate using ENVI-met model. Int. J. Urban Sustain. Dev. 2017, 9, 274–285. [Google Scholar] [CrossRef]
- Tsoka, S.; Tsikaloudaki, K.; Theodosiou, T. Urban space’s morphology and microclimatic analysis: A study for a typical urban district in the Mediterranean city of Thessaloniki, Greece. Energy Build. 2017, 156, 96–108. [Google Scholar] [CrossRef]
- Lee, H.; Mayer, H. Thermal comfort of pedestrians in an urban street canyon is affected by increasing albedo of building walls. Int. J. Biometeorol. 2018, 62, 1–11. [Google Scholar] [CrossRef] [PubMed]
- Müller, N.; Kuttler, W.; Barlag, A.-B. Counteracting urban climate change: Adaptation measures and their effect on thermal comfort. Theor. Appl. Climatol. 2014, 115, 243–257. [Google Scholar] [CrossRef] [Green Version]
- Salata, F.; Golasi, I.; de Lieto Vollaro, R.; de Lieto Vollaro, A. Urban microclimate and outdoor thermal comfort. A proper procedure to fit ENVI-met simulation outputs to experimental data. Sustain. Cities Soc. 2016, 26, 318–343. [Google Scholar] [CrossRef]
- Wania, A.; Bruse, M.; Blond, N.; Weber, C. Analysing the influence of different street vegetation on traffic-induced particle dispersion using microscale simulations. J. Environ. Manag. 2012, 94, 91–101. [Google Scholar] [CrossRef]
- Vos, P.E.; Maiheu, B.; Vankerkom, J.; Janssen, S. Improving local air quality in cities: To tree or not to tree? Environ. Pollut. 2013, 183, 113–122. [Google Scholar] [CrossRef]
- Mahdavinejad, M.; Salehnejad, H.; Moradi, N. An ENVI-met Simulation Study on Influence of Urban Vegetation Congestion on Pollution Dispersion. Asian J. WaterEnviron. Pollut. 2018, 15, 187–194. [Google Scholar] [CrossRef]
- Paas, B.; Schneider, C. A comparison of model performance between ENVI-met and Austal2000 for particulate matter. Atmos. Environ. 2016, 145, 392–404. [Google Scholar] [CrossRef]
- Kapsomenakis, J.; Kolokotsa, D.; Nikolaou, T.; Santamouris, M.; Zerefos, S. Forty years increase of the air ambient temperature in Greece: The impact on buildings. Energy Convers. Manag. 2013, 74, 353–365. [Google Scholar] [CrossRef]
- Wang, Y.; Bakker, F.; De Groot, R.; Wörtche, H. Effect of ecosystem services provided by urban green infrastructure on indoor environment: A literature review. Build. Environ. 2014, 77, 88–100. [Google Scholar] [CrossRef]
- Bowler, D.E.; Buyung-Ali, L.; Knight, T.M.; Pullin, A.S. Urban greening to cool towns and cities: A systematic review of the empirical evidence. Landsc. Urban Plan. 2010, 97, 147–155. [Google Scholar] [CrossRef]
- Gago, E.; Roldan, J.; Pacheco-Torres, R.; Ordoñez, J. The city and urban heat islands: A review of strategies to mitigate adverse effects. Renew. Sustain. Energy Rev. 2013, 25, 749–758. [Google Scholar] [CrossRef]
- Tzoulas, K.; Korpela, K.; Venn, S.; Yli-Pelkonen, V.; Kaźmierczak, A.; Niemela, J.; James, P. Promoting ecosystem and human health in urban areas using Green Infrastructure: A literature review. Landsc. Urban Plan. 2007, 81, 167–178. [Google Scholar] [CrossRef] [Green Version]
- Aram, F.; Solgi, E.; Higueras García, E.; Mosavi, A.; R Várkonyi-Kóczy, A. The cooling effect of large-scale urban parks on surrounding area thermal comfort. Energies 2019, 12, 3904. [Google Scholar] [CrossRef] [Green Version]
- Malys, L.; Musy, M.; Inard, C. Direct and indirect impacts of vegetation on building comfort: A comparative study of lawns, green walls and green roofs. Energies 2016, 9, 32. [Google Scholar] [CrossRef]
- Abhijith, K.; Gokhale, S. Passive control potentials of trees and on-street parked cars in reduction of air pollution exposure in urban street canyons. Environ. Pollut. 2015, 204, 99–108. [Google Scholar] [CrossRef]
- Cohen, P.; Potchter, O.; Schnell, I. The impact of an urban park on air pollution and noise levels in the Mediterranean city of Tel-Aviv, Israel. Environ. Pollut. 2014, 195, 73–83. [Google Scholar] [CrossRef]
- Santamouris, M.; Ding, L.; Fiorito, F.; Oldfield, P.; Osmond, P.; Paolini, R.; Prasad, D.; Synnefa, A. Passive and active cooling for the outdoor built environment–Analysis and assessment of the cooling potential of mitigation technologies using performance data from 220 large scale projects. Sol. Energy 2017, 154, 14–33. [Google Scholar] [CrossRef]
- Skelhorn, C.; Lindley, S.; Levermore, G. The impact of vegetation types on air and surface temperatures in a temperate city: A fine scale assessment in Manchester, UK. Landsc. Urban Plan. 2014, 121, 129–140. [Google Scholar] [CrossRef]
- Wang, Y.; Akbari, H. The effects of street tree planting on Urban Heat Island mitigation in Montreal. Sustain. Cities Soc. 2016, 27, 122–128. [Google Scholar] [CrossRef]
- Wu, Z.; Chen, L. Optimizing the spatial arrangement of trees in residential neighborhoods for better cooling effects: Integrating modeling with in-situ measurements. Landsc. Urban Plan. 2017, 167, 463–472. [Google Scholar] [CrossRef]
- Salata, F.; Golasi, I.; Petitti, D.; de Lieto Vollaro, E.; Coppi, M.; de Lieto Vollaro, A. Relating microclimate, human thermal comfort and health during heat waves: An analysis of heat island mitigation strategies through a case study in an urban outdoor environment. Sustain. Cities Soc. 2017, 30, 79–96. [Google Scholar] [CrossRef]
- Shashua-Bar, L.; Potchter, O.; Bitan, A.; Boltansky, D.; Yaakov, Y. Microclimate modelling of street tree species effects within the varied urban morphology in the Mediterranean city of Tel Aviv, Israel. Int. J. Climatol. A J. R. Meteorol. Soc. 2010, 30, 44–57. [Google Scholar] [CrossRef]
- Shashua-Bar, L.; Hoffman, M.E. The Green CTTC model for predicting the air temperature in small urban wooded sites. Build. Environ. 2002, 37, 1279–1288. [Google Scholar] [CrossRef]
- Taleghani, M.; Sailor, D.; Ban-Weiss, G.A. Micrometeorological simulations to predict the impacts of heat mitigation strategies on pedestrian thermal comfort in a Los Angeles neighborhood. Environ. Res. Lett. 2016, 11, 024003. [Google Scholar] [CrossRef]
- Emmanuel, R.; Rosenlund, H.; Johansson, E. Urban shading—A design option for the tropics? A study in Colombo, Sri Lanka. Int. J. Climatol. 2007, 27, 1995–2004. [Google Scholar] [CrossRef] [Green Version]
- Piselli, C.; Castaldo, V.; Pigliautile, I.; Pisello, A.; Cotana, F. Outdoor comfort conditions in urban areas: On citizens’ perspective about microclimate mitigation of urban transit areas. Sustain. Cities Soc. 2018, 39, 16–36. [Google Scholar] [CrossRef]
- Yuan, J.; Emura, K.; Farnham, C. Is urban albedo or urban green covering more effective for urban microclimate improvement?: A simulation for Osaka. Sustain. Cities Soc. 2017, 32, 78–86. [Google Scholar] [CrossRef]
- Tsoka, S. Investigating the Relationship Between Urban Spaces Morphology and Local Microclimate: A Study for Thessaloniki. Procedia Environ. Sci. 2017, 38, 674–681. [Google Scholar] [CrossRef]
- Lobaccaro, G.; Acero, J.A. Comparative analysis of green actions to improve outdoor thermal comfort inside typical urban street canyons. Urban Clim. 2015, 14, 251–267. [Google Scholar] [CrossRef]
- Ghaffarianhoseini, A.; Berardi, U.; Ghaffarianhoseini, A. Thermal performance characteristics of unshaded courtyards in hot and humid climates. Build. Environ. 2015, 87, 154–168. [Google Scholar] [CrossRef]
- Sodoudi, S.; Shahmohamadi, P.; Vollack, K.; Cubasch, U.; Che-Ani, A. Mitigating the urban heat island effect in megacity Tehran. Adv. Meteorol. 2014. [CrossRef]
- Campostrini, P. UHI—Urban Heat Island and Its Mitigation in the Veneto Region. Available online: http://www.iprpraha.cz/uploads/assets/soubory/data/projekty/UHI/UHI_v_regionu_Veneto_a_jeho_zmirovani.pdf (accessed on 10 December 2019).
- Yang, F.; Lau, S.S.; Qian, F. Thermal comfort effects of urban design strategies in high-rise urban environments in a sub-tropical climate. Archit. Sci. Rev. 2011, 54, 285–304. [Google Scholar] [CrossRef]
- Wang, Y.; Berardi, U.; Akbari, H. Comparing the effects of urban heat island mitigation strategies for Toronto, Canada. Energy Build. 2016, 114, 2–19. [Google Scholar] [CrossRef]
- Alexandri, E.; Jones, P. Temperature decreases in an urban canyon due to green walls and green roofs in diverse climates. Build. Environ. 2008, 43, 480–493. [Google Scholar] [CrossRef]
- Theodosiou, T. Green roofs in buildings: Thermal and environmental behaviour. Adv. Build. Energy Res. 2009, 3, 271–288. [Google Scholar] [CrossRef]
- Wong, N.H.; Chen, Y.; Ong, C.L.; Sia, A. Investigation of thermal benefits of rooftop garden in the tropical environment. Build. Environ. 2003, 38, 261–270. [Google Scholar] [CrossRef]
- Berardi, U. The outdoor microclimate benefits and energy saving resulting from green roofs retrofits. Energy Build. 2016, 121, 217–229. [Google Scholar] [CrossRef]
- Peng, L.L.; Jim, C. Green-roof effects on neighborhood microclimate and human thermal sensation. Energies 2013, 6, 598–618. [Google Scholar] [CrossRef] [Green Version]
- Morakinyo, T.E.; Dahanayake, K.K.C.; Ng, E.; Chow, C.L. Temperature and cooling demand reduction by green-roof types in different climates and urban densities: A co-simulation parametric study. Energy Build. 2017, 145, 226–237. [Google Scholar] [CrossRef]
- Zölch, T.; Maderspacher, J.; Wamsler, C.; Pauleit, S. Using green infrastructure for urban climate-proofing: An evaluation of heat mitigation measures at the micro-scale. Urban For. Urban Green. 2016, 20, 305–316. [Google Scholar] [CrossRef]
- Chen, H.; Ooka, R.; Huang, H.; Tsuchiya, T. Study on mitigation measures for outdoor thermal environment on present urban blocks in Tokyo using coupled simulation. Build. Environ. 2009, 44, 2290–2299. [Google Scholar] [CrossRef]
- Ng, E.; Chen, L.; Wang, Y.; Yuan, C. A study on the cooling effects of greening in a high-density city: An experience from Hong Kong. Build. Environ. 2012, 47, 256–271. [Google Scholar] [CrossRef]
- Jin, C.; Bai, X.; Luo, T.; Zou, M. Effects of green roofs’ variations on the regional thermal environment using measurements and simulations in Chongqing, China. Urban For. Urban Green. 2017. [Google Scholar] [CrossRef]
- Pastore, L.; Corrao, R.; Heiselberg, P.K. The effects of vegetation on indoor thermal comfort: The application of a multi-scale simulation methodology on a residential neighborhood renovation case study. Energy Build. 2017, 146, 1–11. [Google Scholar] [CrossRef]
- Srivanit, M.; Hokao, K. Evaluating the cooling effects of greening for improving the outdoor thermal environment at an institutional campus in the summer. Build. Environ. 2013, 66, 158–172. [Google Scholar] [CrossRef]
- Qin, Y. A review on the development of cool pavements to mitigate urban heat island effect. Renew. Sustain. Energy Rev. 2015, 52, 445–459. [Google Scholar] [CrossRef]
- Doulos, L.; Santamouris, M.; Livada, I. Passive cooling of outdoor urban spaces. The role of materials. Sol. Energy 2004, 77, 231–249. [Google Scholar] [CrossRef]
- Synnefa, A.; Santamouris, M.; Apostolakis, K. On the development, optical properties and thermal performance of cool colored coatings for the urban environment. Sol. Energy 2007, 81, 488–497. [Google Scholar] [CrossRef]
- Mullaney, J.; Lucke, T. Practical review of pervious pavement designs. Clean–SoilAirWater 2014, 42, 111–124. [Google Scholar] [CrossRef]
- Sharifi, N.P.; Sakulich, A. Application of phase change materials in structures and pavements. In Proceedings of the 2nd International Workshop on Design in Civil and Environmental Engineering, Worcester, MA, USA, 28–29 June 2013; pp. 28–29. [Google Scholar]
- Karlessi, T.; Santamouris, M.; Synnefa, A.; Assimakopoulos, D.; Didaskalopoulos, P.; Apostolakis, K. Development and testing of PCM doped cool colored coatings to mitigate urban heat island and cool buildings. Build. Environ. 2011, 46, 570–576. [Google Scholar] [CrossRef]
- Huynh, C.; Eckert, R. Reducing heat and improving thermal comfort through urban design-A case study in Ho Chi Minh city. Int. J. Environ. Sci. Dev. 2012, 3, 480. [Google Scholar] [CrossRef]
- Maleki, A.; Mahdavi, A. Evaluation of urban heat islands mitigation strategies using 3dimentional urban micro-climate model ENVI-met. Asian J. Civ. Eng. (BHRC) 2016, 17, 357–371. [Google Scholar]
- Synnefa, A.; Dandou, A.; Santamouris, M.; Tombrou, M.; Soulakellis, N. On the use of cool materials as a heat island mitigation strategy. J. Appl. Meteorol. Climatol. 2008, 47, 2846–2856. [Google Scholar] [CrossRef]
- Grell, G.A.; Dudhia, J.; Stauffer, D.R. A Description of the Fifth-Generation Penn State/NCAR Mesoscale Model (MM5); University Corporation for Atmospheric Research: Boulder, CO, USA, 1994. [Google Scholar]
- Georgescu, M.; Morefield, P.E.; Bierwagen, B.G.; Weaver, C.P. Urban adaptation can roll back warming of emerging megapolitan regions. Proc. Natl. Acad. Sci. USA 2014, 111, 2909–2914. [Google Scholar] [CrossRef] [Green Version]
- Skamarock, W.C.; Klemp, J.B.; Dudhia, J. Prototypes for the WRF (Weather Research and Forecasting) model. In Ninth Conference Mesoscale Processes, J11–J15; American Meteorological Society: Fort Lauderdale, FL, USA, 2001. [Google Scholar]
- Li, H.; Harvey, J.T.; Holland, T.; Kayhanian, M. The use of reflective and permeable pavements as a potential practice for heat island mitigation and stormwater management. Environ. Res. Lett. 2013, 8, 015023. [Google Scholar] [CrossRef]
- Li, H.; Harvey, J.; Jones, D. Cooling effect of permeable asphalt pavement under dry and wet conditions. Transp. Res. Rec. 2013, 2372, 97–107. [Google Scholar] [CrossRef]
- Battista, G.; Carnielo, E.; Vollaro, R.D.L. Thermal impact of a redeveloped area on localized urban microclimate: A case study in Rome. Energy Build. 2016, 133, 446–454. [Google Scholar] [CrossRef]
- Zoras, S.; Tsermentselis, A.; Kosmopoulos, P.; Dimoudi, A. Evaluation of the application of cool materials in urban spaces: A case study in the center of Florina. Sustain. Cities Soc. 2014, 13, 223–229. [Google Scholar] [CrossRef] [Green Version]
- Manual, F. ANSYS/FLUENT Release Version 14.5; Ansys Inc.: Canonsburg, PA, USA, 2012. [Google Scholar]
- Alchapar, N.L.; Pezzuto, C.C.; Correa, E.N.; Labaki, L.C. The impact of different cooling strategies on urban air temperatures: The cases of Campinas, Brazil and Mendoza, Argentina. Theor. Appl. Climatol. 2016, 1–16. [Google Scholar] [CrossRef]
- Alchapar, N.L.; Correa, E.N. The use of reflective materials as a strategy for urban cooling in an arid “OASIS” city. Sustain. Cities Soc. 2016, 27, 1–14. [Google Scholar] [CrossRef]
- Coutts, A.M.; Tapper, N.J.; Beringer, J.; Loughnan, M.; Demuzere, M. Watering our cities: The capacity for Water Sensitive Urban Design to support urban cooling and improve human thermal comfort in the Australian context. Prog. Phys. Geogr. 2013, 37, 2–28. [Google Scholar] [CrossRef]
- Fletcher, T.D.; Deletic, A.; Mitchell, V.G.; Hatt, B.E. Reuse of urban runoff in Australia: A review of recent advances and remaining challenges. J. Environ. Qual. 2008, 37 (Suppl. 5), S116–S127. [Google Scholar] [CrossRef]
- Battista, G.; Pastore, E.M. Using cool pavements to mitigate urban temperatures in a case study of Rome (Italy). Energy Procedia 2017, 113, 98–103. [Google Scholar] [CrossRef]
- Emmanuel, R.; Fernando, H. Urban heat islands in humid and arid climates: Role of urban form and thermal properties in Colombo, Sri Lanka and Phoenix, USA. Clim. Res. 2007, 34, 241–251. [Google Scholar] [CrossRef] [Green Version]
- Lee, H.; Mayer, H.; Chen, L. Contribution of trees and grasslands to the mitigation of human heat stress in a residential district of Freiburg, Southwest Germany. Landsc. Urban Plan. 2016, 148, 37–50. [Google Scholar] [CrossRef]
- Herrmann, J.; Matzarakis, A. Mean radiant temperature in idealised urban canyons—Examples from Freiburg, Germany. Int. J. Biometeorol. 2012, 56, 199–203. [Google Scholar] [CrossRef]
- Salata, F.; Golasi, I.; Vollaro, E.d.L.; Bisegna, F.; Nardecchia, F.; Coppi, M.; Gugliermetti, F.; Vollaro, A.d.L. Evaluation of different urban microclimate mitigation strategies through a PMV analysis. Sustainability 2015, 7, 9012–9030. [Google Scholar] [CrossRef] [Green Version]
- Wang, Y.; Akbari, H. Development and application of ‘thermal radiative power’ for urban environmental evaluation. Sustain. Cities Soc. 2015, 14, 316–322. [Google Scholar] [CrossRef]
- Gaitani, N.; Burud, I.; Thiis, T.; Santamouris, M. High-resolution spectral mapping of urban thermal properties with Unmanned Aerial Vehicles. Build. Environ. 2017 121, 215–224. [CrossRef]
- Kyriakodis, G.; Santamouris, M. Using reflective pavements to mitigate urban heat island in warm climates-Results from a large scale urban mitigation project. Urban Clim. 2017, 24, 326–339. [Google Scholar] [CrossRef]
- Lontorfos, V.; Efthymiou, C.; Santamouris, M. On the time varying mitigation performance of reflective geoengineering technologies in cities. Renew. Energy 2018, 115, 926–930. [Google Scholar] [CrossRef]
- Bretz, S.; Akbari, H.; Rosenfeld, A. Practical issues for using solar-reflective materials to mitigate urban heat islands. Atmos. Environ. 1998, 32, 95–101. [Google Scholar] [CrossRef] [Green Version]
- Alchapar, N.L.; Correa Cantaloube, E.N.; Canton, M.A. Solar reflectance index of pedestrian pavements and their response to aging. J. Clean Energy Technol. 2013, 1, 281–285. [Google Scholar] [CrossRef] [Green Version]
- Gaitani, N.; Spanou, A.; Saliari, M.; Synnefa, A.; Vassilakopoulou, K.; Papadopoulou, K.; Pavlou, K.; Santamouris, M.; Papaioannou, M.; Lagoudaki, A. Improving the microclimate in urban areas: A case study in the centre of Athens. Build. Serv. Eng. Res. Technol. 2011, 32, 53–71. [Google Scholar] [CrossRef]
- Santamouris, M.; Kolokotsa, D.J. Passive cooling dissipation techniques for buildings and other structures: The state of the art. Energy Build. 2013, 57, 74–94. [Google Scholar] [CrossRef]
- Xu, J.; Wei, Q.; Huang, X.; Zhu, X.; Li, G.J. Evaluation of human thermal comfort near urban waterbody during summer. Build. Environ. 2010, 45, 1072–1080. [Google Scholar] [CrossRef]
- Sun, R.; Chen, A.; Chen, L.; Lü, Y. Cooling effects of wetlands in an urban region: The case of Beijing. Ecol. Indic. 2012, 20, 57–64. [Google Scholar] [CrossRef]
- Martins, T.A.; Adolphe, L.; Bonhomme, M.; Bonneaud, F.; Faraut, S.; Ginestet, S.; Michel, C.; Guyard, W. Impact of Urban Cool Island measures on outdoor climate and pedestrian comfort: Simulations for a new district of Toulouse, France. Sustain. Cities Soc. 2016, 26, 9–26. [Google Scholar] [CrossRef]
- Brans, K.I.; Engelen, J.M.; Souffreau, C.; De Meester, L. Urban hot-tubs: Local urbanization has profound effects on average and extreme temperatures in ponds. Landsc. Urban Plan. 2018, 176, 22–29. [Google Scholar] [CrossRef]
- Manteghi, G.; Remaz, D. Water bodies an urban microclimate: A review. Mod. Appl. Sci. 2015, 9, 1. [Google Scholar] [CrossRef] [Green Version]
- Rehan, R.M. Cool city as a sustainable example of heat island management case study of the coolest city in the world. Hous. Build. Natl. Res. Cent. J. 2016, 12, 191–204. [Google Scholar] [CrossRef] [Green Version]
- Taleghani, M.; Sailor, D.J.; Tenpierik, M.; van den Dobbelsteen, A. Thermal assessment of heat mitigation strategies: The case of Portland State University, Oregon, USA. Build. Env. 2014, 73, 138–150. [Google Scholar] [CrossRef] [Green Version]
- Taleghani, M.; Tenpierik, M.; van den Dobbelsteen, A.; Sailor, D. Heat in courtyards: A validated and calibrated parametric study of heat mitigation strategies for urban courtyards in the Netherlands. Sol. Energy 2014, 103, 108–124. [Google Scholar] [CrossRef]
- Tsoka, S. Urban Microclimate Analysis and Its Effect on the Buildings "Energy Performance". Ph.D. Thesis, Aristotle University of Thessaloniki, Department of Civil Engineering, Laboratory of Building Construction and Building Physics, Thessaloniki, Grecce, 2019. [Google Scholar]
Figure 1.
Parameters affecting the urban microclimate and contributing to the generation of the urban heat island (UHI) phenomenon.
Figure 1.
Parameters affecting the urban microclimate and contributing to the generation of the urban heat island (UHI) phenomenon.


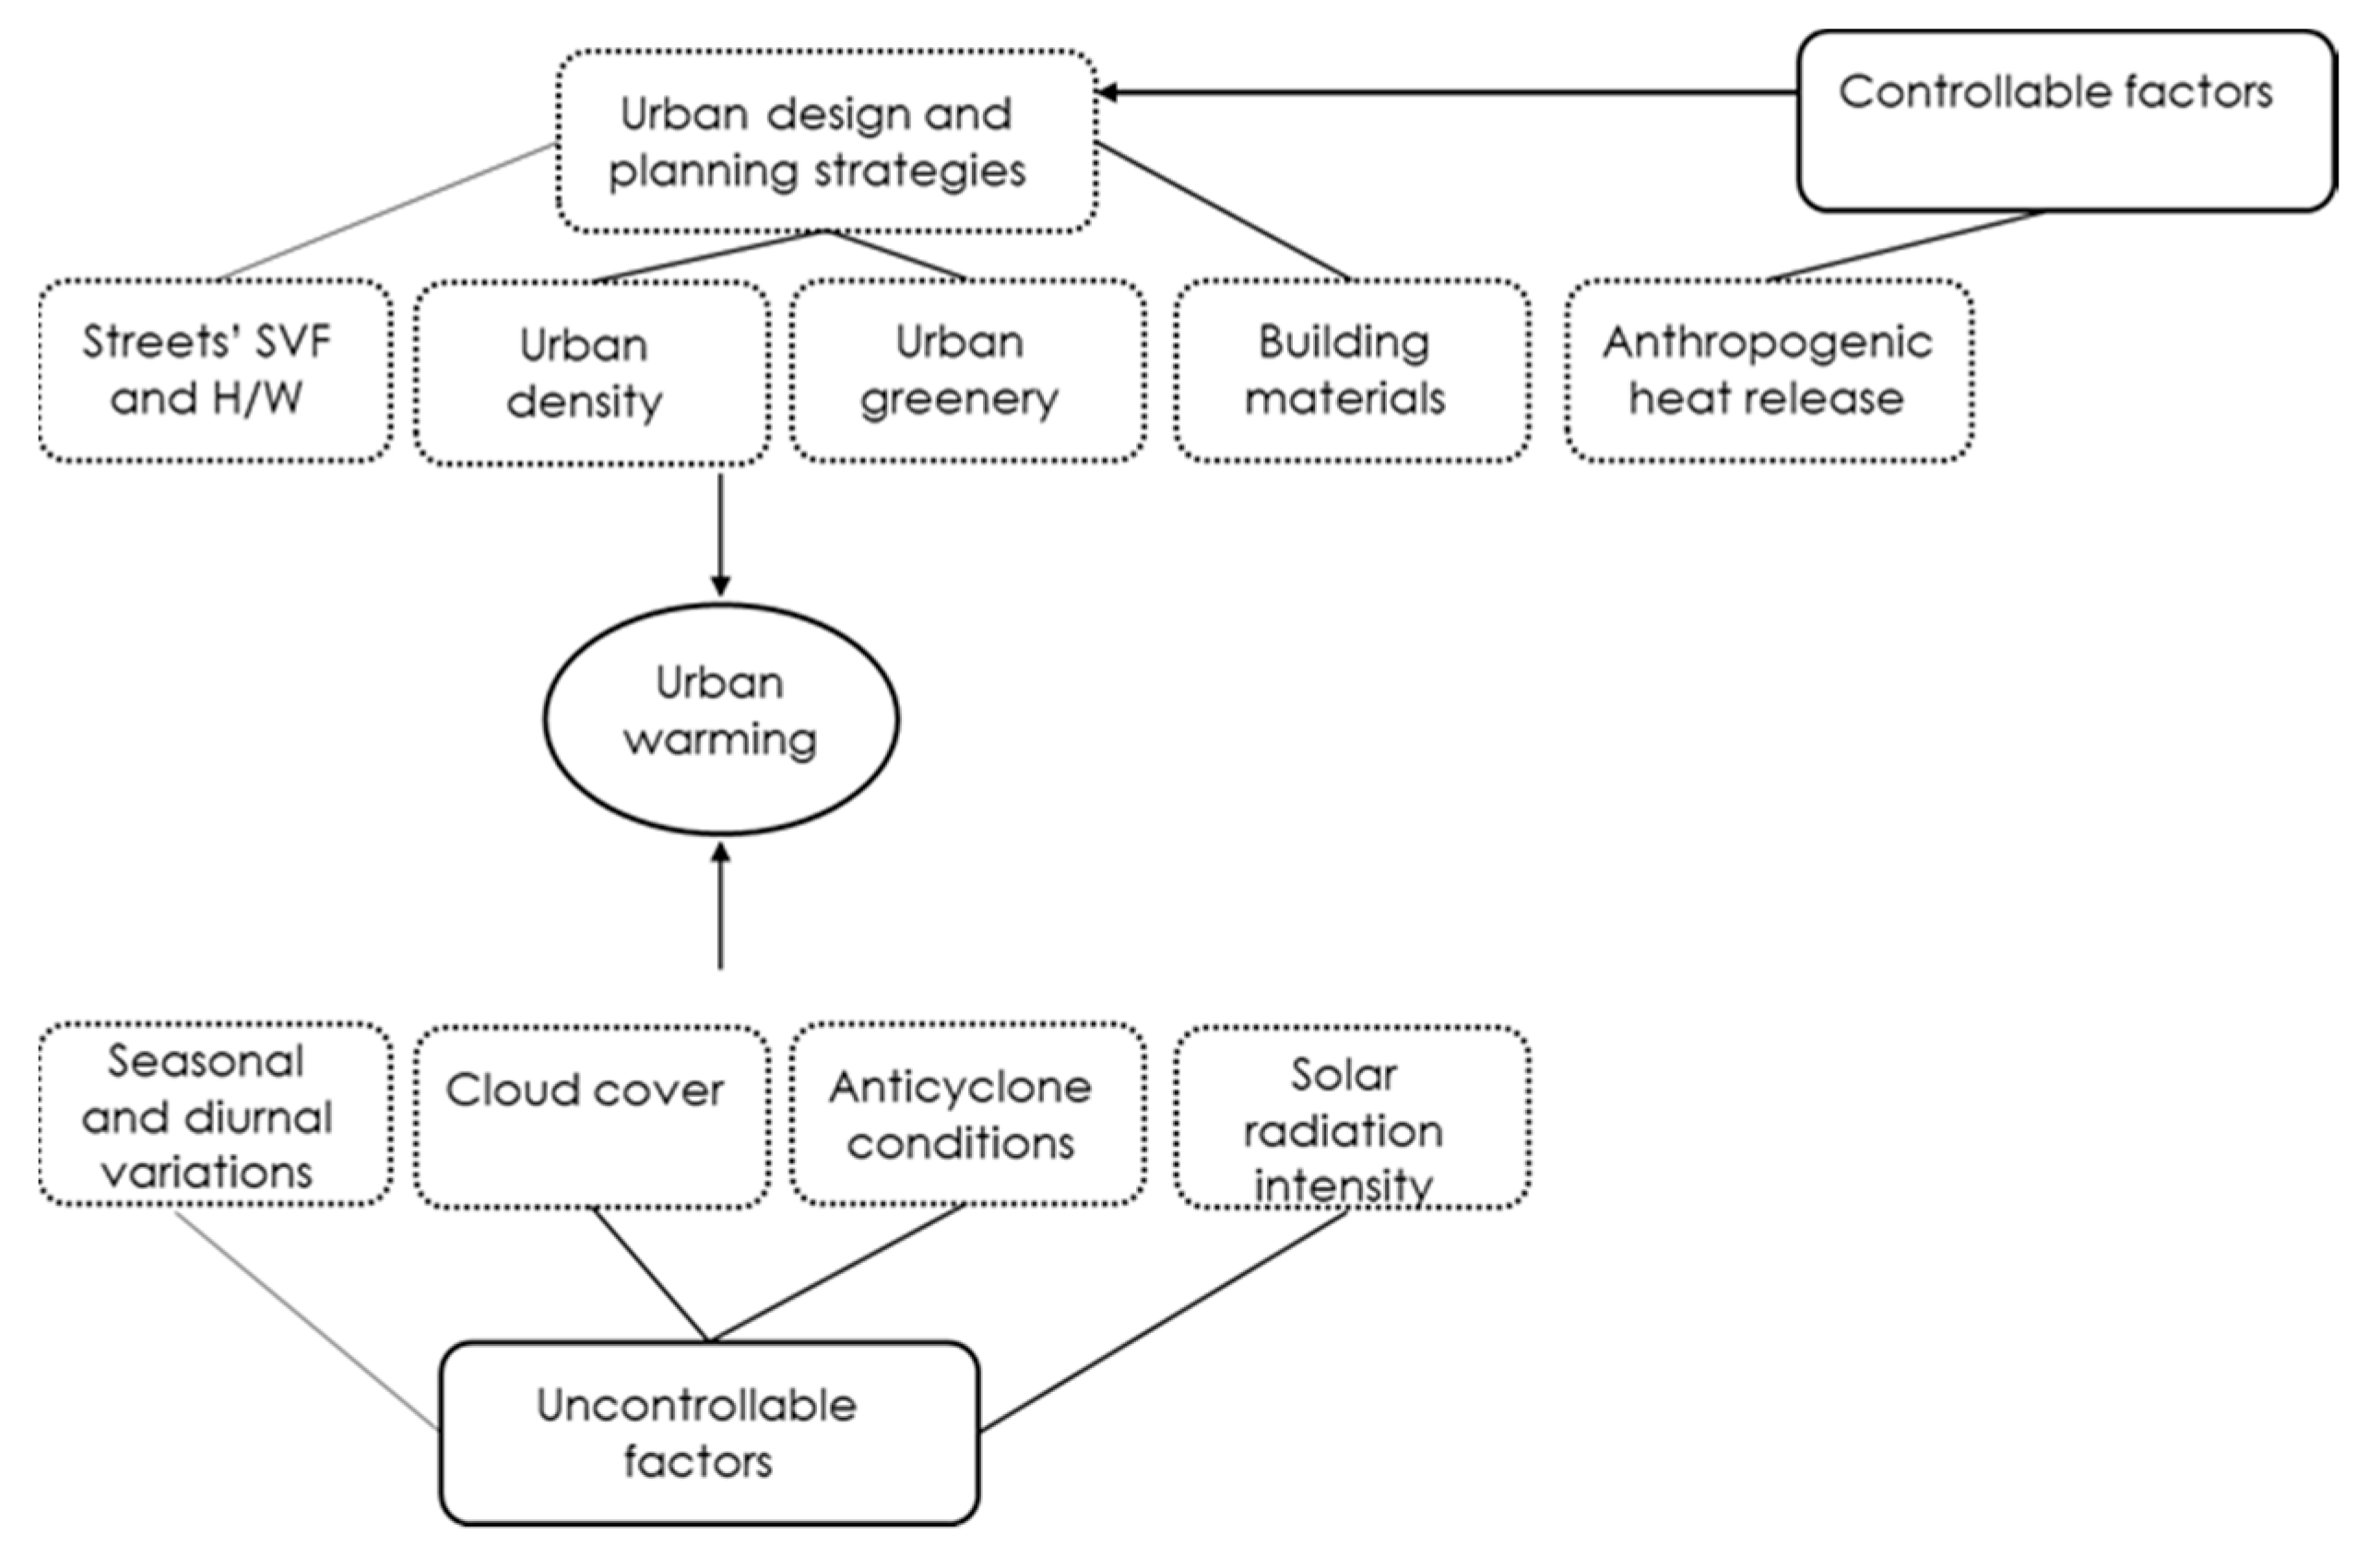
Table 1.
Summary of previous studies, using experimental methods to investigate the urban microclimate and the UHI effect. ΔTU–R: Tair urban-rural differences.
Table 1.
Summary of previous studies, using experimental methods to investigate the urban microclimate and the UHI effect. ΔTU–R: Tair urban-rural differences.
| Ref. | Method | Major Outcome |
|---|---|---|
| [40] | Hourly Tair and WS records at an urban and a suburban site, for the years 2014–2015, in Rome, Italy | - Negligible average monthly ΔTU–R in winter - Maximum average monthly ΔTU–R of 2.0 °C in summer. - Low wind velocities in urban area compared to the suburban one, due to the increased building obstacles |
| [8] | Hourly Tair records at an urban and a suburban area, for the years 2011-2012, in Modena, Italy | - Smallest values on the average monthly ΔTU–R, reported in autumn - Maximum average monthly ΔTU–R close to 2.0 °C in summer |
| [43] | Hourly Tair records in seven urban and rural sites during 2011, in Thessaloniki, Greece | - Maximum hourly ΔTU–R of 4.0°C and 2.0°C in summer and winter, correspondingly - Maximum ΔTU–R observed both in summer and winter after sunset |
| [44] | Hourly Tair records at an urban and a suburban site, for winter and summer 2010, in Volos, Greece | - Maximum hourly ΔTU–R of 3.4 °C and 3.1 °C in winter and summer, respectively - Maximum deviations always observed after sunset |
| [54] | Hourly Tair, WS, RH and radiation records at seven different stations in central and rural areas of Basel, in 2001-2002 | - Maximum hourly ΔTU–R of 3.0 °C in summer, after sunset - Lowest ΔTU–R in summer, reported at noon - Low wind velocities and high longwave radiation emission in urban areas |
| [55] | Hourly Tair, RH and WS measurements in 12 urban and rural sites of five years (2005 to 2009) in Bilbao, Spain | - Maximum hourly ΔTU–R of 3. 5°C in summer, after sunset - Minimum hourly ΔTU–R in summer, at midday - ΔTU-R decreases with increasing wind speed - Significant cooling potential of sea-breeze effect |
| [56] | Hourly Tair, RH measurements in four urban and rural sites during May–October 2009 in Guwahati City, India | - Maximum hourly daytime ΔTU–R of 2.12 °C - Maximum nighttime hourly ΔTU–R of 2.29 °C- High ΔRHU–R observed in the months of higher frequencies of larger urban heat island intensity |
Table 2.
Summary of previous studies, assessing the cooling potential of street trees. Tair and Tmrt simulation results refer to the pedestrians’ heights (i.e., 1.5–2.0 m from the ground level).
Table 2.
Summary of previous studies, assessing the cooling potential of street trees. Tair and Tmrt simulation results refer to the pedestrians’ heights (i.e., 1.5–2.0 m from the ground level).
| Addition of Street Trees and Hedges | ||
|---|---|---|
| Ref. | Examined Vegetation Scenarios | Major Outcome |
| [111] | Six vegetation scenarios: three tree types—crown diameter = 9–12 m, height = 10–20 m, leaf area density (LAD) = 0.473–0.935 m2/m3; two spatial arrangements (with and without space) in an urban area in Montreal, Canada | - Maximum daily Tair reduction ranging between 2.0 °C and 5.1 °C, depending on the examined scenario. - Maximum Tmrt reduction up to 40 °C |
| [112] | Increase of the green coverage ratio (GCR) by 10% in areas of low (L), medium (M) and high (H) SR exposure in a high-rise residential quarter in Beijing, China | - Minor effect of in areas with low exposition to solar radiation (L) due to building volumes - Maximum daily Tair reduction due to trees up to 0.5 °C, in areas with high solar radiation exposition |
| [113] | Increase the GCR of the University Campus in the center of Rome, Italy by 9% | - Reduction of the daily maximum Tair by 1.34 °C - Maximum Tmrt reduction of 37.3 °C |
| [126] | Increase GCR by 10% in detached (DA), middle (MA) and high-rise areas (HRA) in Toronto, Canada | - Maximum Tair reduction due to trees in the DA, MA and HRA areas by 0.80 °C, 0.60 °C and 0.80 °C, respectively, noticed in the afternoon. - Maximum Tmrt reduction in the DA, MA and HRA areas by 8.3 °C, 6.1 °C and 6.2 °C, respectively |
| [92] | Increase GCR by 40% in a dense urban area in Thessaloniki, Greece | - Maximum daily Tair reduction by 0.40 °C, reported in the afternoon - High Tmrt reduction by 20.0 °C - Major ground surface temperatures (Tsurf) reduction of 15.0 °C |
| [116] | Add street trees in a continuous canopy in areas adjacent to sidewalks in an urban district in Los Angeles, USA | - Maximum Tair reduction by 1.5 °C at 14:00. - Significant improvement of thermal comfort indices during the daytime, in sunlit areas |
| [118] | Increase of the number of trees inside all parts of an urban zone in Perugia, Italy | - Maximum daily Tair reduction by 0.9 °C - Major Tmrt reduction by 20 °C due to trees shading |
| [122] | Increase the number of trees inside urban courtyards by 75% in Kuala Lumpur, Malaysia | - Maximum daily Tair reduction by 2.0 °C- Considerable wind speed reduction due to additional obstacles, created by trees |
Table 3.
Summary of previous studies, assessing the cooling potential of green roofs. Tair and Tmrt simulation results refer to the pedestrians’ heights (i.e., 1.5–2.0m from the ground level).
Table 3.
Summary of previous studies, assessing the cooling potential of green roofs. Tair and Tmrt simulation results refer to the pedestrians’ heights (i.e., 1.5–2.0m from the ground level).
| Addition of Green Roofs | ||
|---|---|---|
| Ref. | Examined Vegetation Scenarios | Major Outcome |
| [129] | Field measurements on a rooftop of a low-rise commercial building in Singapore | - Maximum Tair temperature reduction of 4.2 °C, 30 cm above the green roof - The green roof’s cooling effect decreased with distance - Considerable reduction of the emitted longwave radiation |
| [130] | Evaluation of four green roof types with soil depths = 15–30 cm, lead area index (LAI) = 1 and LAI = 2 and plant height = 50 cm at buildings of the university campus in Toronto, Canada. | - For the green roof with soil depth = 15cm and LAI = 2, a peak cooling effect at the human level of 0.4 °C and 1.1°C, at noon and midnight, respectively - For the green roof with soil depth = 15cm and LAI = 1, peak cooling effect at the human level of 0.2 °C and 0.7 °C at noon and midnight, respectively - Negligible impact of green roofs on Tmrt at the human level |
| [131] | Apply intensive and extensive types of roofs in low and high (HR)-rise areas in Hong Kong, China | - In LR areas: maximum Tair reduction by 0.7 °C and 1.7 °C due to extensive and intensive green roof types, respectively - In HR areas: maximum Tair reduction by 0.4 °C and 0.8 °C due to extensive and intensive green roof types, respectively |
| [136] | Apply extensive and intensive types, LAI = 4.6 in several mid and high-rise urban areas in Chongqing, China | - In the mid-rise area: maximum Tair reduction of 0.3 °C and 0.4 °C due to the extensive and intensive roof types, respectively - In the high-rise area: negligible Tair reduction both for the intensive and the extensive case |
| [132] | Add extensive and intensive roof types in buildings of generic high, medium and low-density areas, under four different climatic conditions (Hong Kong, Cairo, Tokyo, Paris) | - Maximum Tair reduction between 0.05–0.6 °C, depending on the roof type, climate and urban density - Low cooling effect in high rise areas, for all the examined climatic conditions |
| [133] | Add extensive green roofs covered by grass with a LAD of 0.3 m2/m3 in all roofs of a dense urban block in Munich, Germany | Negligible Tair reduction and minor changes on thermal comfort indices |
Table 4.
Summary of previous studies, assessing the cooling potential of high albedo roofs, pavements and combined applications. Tair and Tmrt simulation results refer to the pedestrians’ heights (i.e., 1.5–2.0m from the ground level).
Table 4.
Summary of previous studies, assessing the cooling potential of high albedo roofs, pavements and combined applications. Tair and Tmrt simulation results refer to the pedestrians’ heights (i.e., 1.5–2.0m from the ground level).
| High Albedo Roofs | ||
| Ref. | Examined Scenarios | Major Outcome |
| [126] | Increase the building roofs’ albedo by 0.40 in a mid-rise, a high-rise and a detached area in Toronto, Canada | - Major roofs’ Tsurf reduction by 9.0 °C–11.0 °C - Max Tair reduction by 0.50 °C in the detached area - Negligible Tair reduction at the mid-rise and high-rise areas |
| [146] | Increase the building roofs’ albedo by 0.5 in a dense urban area in Vienna, Austria | - Maximum daily Tair reduction by 0.5 °C, at noon - Negligible Tair reduction during nighttime - Negligible Tmrt changes |
| [113] | Increase the building roofs’ albedo by 0.31 in a dense urban area in Rome, Italy | - Maximum Tair reduction by 0.10°C - Negligible Tmrt changes |
| [145] | Increase the building roofs’ albedo by 0.7 in a dense urban area in Ho Chi Minh, Vietnam | - Marginal Tair reduction by 0.10°C - High roof Tsurf reduction |
| [147] | Increase the roofs’ albedo at a city scale by 0.48 and 0.67 in Athens, Greece | - Maximum Tair reduction by 1.5°C and 2.0°C for the moderate and high albedo rise, respectively - More prominent impact of albedo increase for 12:00 to 15:00 p.m. - Negligible Tair changes during nighttime |
| Application of high albedo pavements | ||
| [116] | Increase the albedo of all asphalt pavements of an urban areas in Los Angeles by 0.3 | - Maximum daily Tair reduction by 2.0 °C in unshaded areas - Low Tair reduction in shaded areas - Maximum Tmrt rise by 7.8 °C |
| [154] | Increase the asphalt and concrete pavements’ albedo by 0.27 and 0.45, respectively, in an urban area in Florina, Greece | - Maximum Tair decrease by 1.39 °C at noon - Mean area Tsurf reduction by 3.52 °C at noon - No wind speed changes due to cool pavement applications |
| [126] | Replace asphalt with concrete pavements, with higher albedo by 0.20 and lower vol. heat capacity by 7%, in a detached and a middle-rise area in Toronto, Canada | - Maximum Tsurf reduction at noon, by 7.9 °C and 7.6 °C in the detached and the middle -rise area, respectively - Maximum daily Tair reduction lower than 0.40 °C in both areas |
| [92] | Increase the asphalt and concrete pavements’ albedo by 0.28 and 0.4, respectively, in an urban area in Thessaloniki, Greece | - Maximum Tsurf reduction by 8.5 °C and 10.5 °C for the asphalt and concrete pavements. respectively, at noon - Maximum Tair reduction by 0.7 °C at noon - Maximum Tmrt rise by 4.5 °C at noon |
| [160] | Increase the asphalt’s albedo by (A) 0.3 and (B) 0.55 in an urban area in Rome, Italy | - Scen. A: Maximum Tair reduction by 1.0 °Cat 14:00 p.m. - Scen. B: Maximum Tair reduction by 3.0 °Cat 14:00 p.m. |
| [118] | Increase the asphalt and concrete pavements albedo by 0.60 and 0.40 respectively, in an urban area in Rome | - Maximum Tair reduction by 0.2 °C and 0.4 °C at 8:00 a.m. and 14:00 p.m. respectively - Tmrt rise by 0.5 °C at midday |
| Combined application of high albedo materials on walls, roofs and/or ground surfaces | ||
| [156] | Increase surfaces’ albedo of a high-density area in Mendoza, Argentina by 0.50 (roof), 0.60 (wall) and 0.40 (vehicular pathways): Scen. 1 and 0.50 (roof) and 0.40 (vehicular pathways): Scen. 2 | - Maximum Tair reduction by 0.9 °C and 3.5 °C for Scen. 1 and Scen. 2, respectively. - Maximum Tmrt rise by 31 °C and 15 °C for Scen. 1 and Scen. 2, respectively. - Most optimal solution was the application of low albedo on vertical surfaces and high albedo on ground surfaces |
| [123] | Increase the albedo of roofs and asphalt by 0.40 and of pavement by 0.55 in a dense built-up area in Tehran, Iran | - Maximum Tair reduction by 0.5 °C in daytime (15:00 h) and by 0.16 °C in nighttime (03:00 h) |
| [161] | Increase the roofs’, walls’ and pavements’ albedo by 0.3 in a dense urban area in Colombo, Sri Lanka | - Maximum daytime and nighttime Tair reduction by 1.3 °C and 0.6 °C, respectively. - Maximum daytime Tmrt rise by 15 °C. |
Table 5.
Summary of previous studies, assessing the cooling effect of water-based techniques. Tair and Tmrt simulation results refer to the pedestrians’ heights (i.e., 1.5–2.0m from the ground level).
Table 5.
Summary of previous studies, assessing the cooling effect of water-based techniques. Tair and Tmrt simulation results refer to the pedestrians’ heights (i.e., 1.5–2.0m from the ground level).
| Water-Based Mitigation Techniques | ||
|---|---|---|
| Ref. | Examined Scenarios | Major Outcome |
| [3] | Add pools and ponds in a low-density urban area of London, UK during summer | - Maximum Tair reduction by 0.50 °C at noon - Maximum Tair reduction lower than 0.20 °C at night - Low cooling effect as the distance from the pond increases |
| [175] | Replace concrete pavements with water surfaces in a low-density urban site in Toulouse, France | - Maximum daily Tair reduction by 2.5 °C–3.0 °C - Significant improvement of thermal comfort indices |
| [180] | Fountains, canals, pools and ponds applied in generic courtyard types in the Netherlands | - Considerable Tmrt reduction, up to 21 °C |
| [179] | Add pools and ponds in the courtyards in Oregon, USA | Maximum Tair reduction by 1.10 °C near the pool’s area |
Table 6.
Comparison of the basic features of experimental and numerical methods for urban microclimate analysis.
Table 6.
Comparison of the basic features of experimental and numerical methods for urban microclimate analysis.
| Experimental Methods for Microclimate Analysis | Numerical Methods for Microclimate Analysis | |
|---|---|---|
| • Required time | Time-consuming, generally long-term duration of measurements | Simulations’ duration from some hours to some days, depending on the simulated area and the required level of accuracy |
| • Complexity/difficulty | Simple method and analysis of the obtained data | More complex method, requires knowledge and acquaintance of the user |
| • Spatial resolution | Limited spatial resolution, in situ records at specific spots of the study area (limited equipment) | Microclimate simulation results available for all points of examined study area |
| • Temporal analysis | Climatic records for single calendar months or calendar years | Simulations at a daily or week level due to the high computational cost |
| • Investigated parameters | Generally performed for limited microclimatic parameters | Generally available simulation results for multiple microclimatic parameters (depending on the model) |
| • Accuracy | Rather prone to errors if a suitable measurement protocol is not followed (radiation shields, calibration of equipment, etc.) | Increased simulation accuracy (onsite records for validation is strongly recommended) |
| • Parametric analysis of UHI mitigation strategies | Difficulty due to different boundary conditions (before and after the application of the proposed solution) | Possibility of parametric analysis of various mitigation strategies (climatic boundary conditions defined by the user) |
© 2020 by the authors. Licensee MDPI, Basel, Switzerland. This article is an open access article distributed under the terms and conditions of the Creative Commons Attribution (CC BY) license (http://creativecommons.org/licenses/by/4.0/).
Share and Cite
MDPI and ACS Style
Tsoka, S.; Tsikaloudaki, K.; Theodosiou, T.; Bikas, D. Urban Warming and Cities’ Microclimates: Investigation Methods and Mitigation Strategies—A Review. Energies 2020, 13, 1414. https://doi.org/10.3390/en13061414
AMA Style
Tsoka S, Tsikaloudaki K, Theodosiou T, Bikas D. Urban Warming and Cities’ Microclimates: Investigation Methods and Mitigation Strategies—A Review. Energies. 2020; 13(6):1414. https://doi.org/10.3390/en13061414
Chicago/Turabian StyleTsoka, Stella, Katerina Tsikaloudaki, Theodoros Theodosiou, and Dimitrios Bikas. 2020. "Urban Warming and Cities’ Microclimates: Investigation Methods and Mitigation Strategies—A Review" Energies 13, no. 6: 1414. https://doi.org/10.3390/en13061414
Note that from the first issue of 2016, this journal uses article numbers instead of page numbers. See further details here.