Investigation of the Effects of Plasma Discharges on Methane Decomposition for Combustion Enhancement of a Lean Flame

 , , , and
Abstract
:
1. Introduction
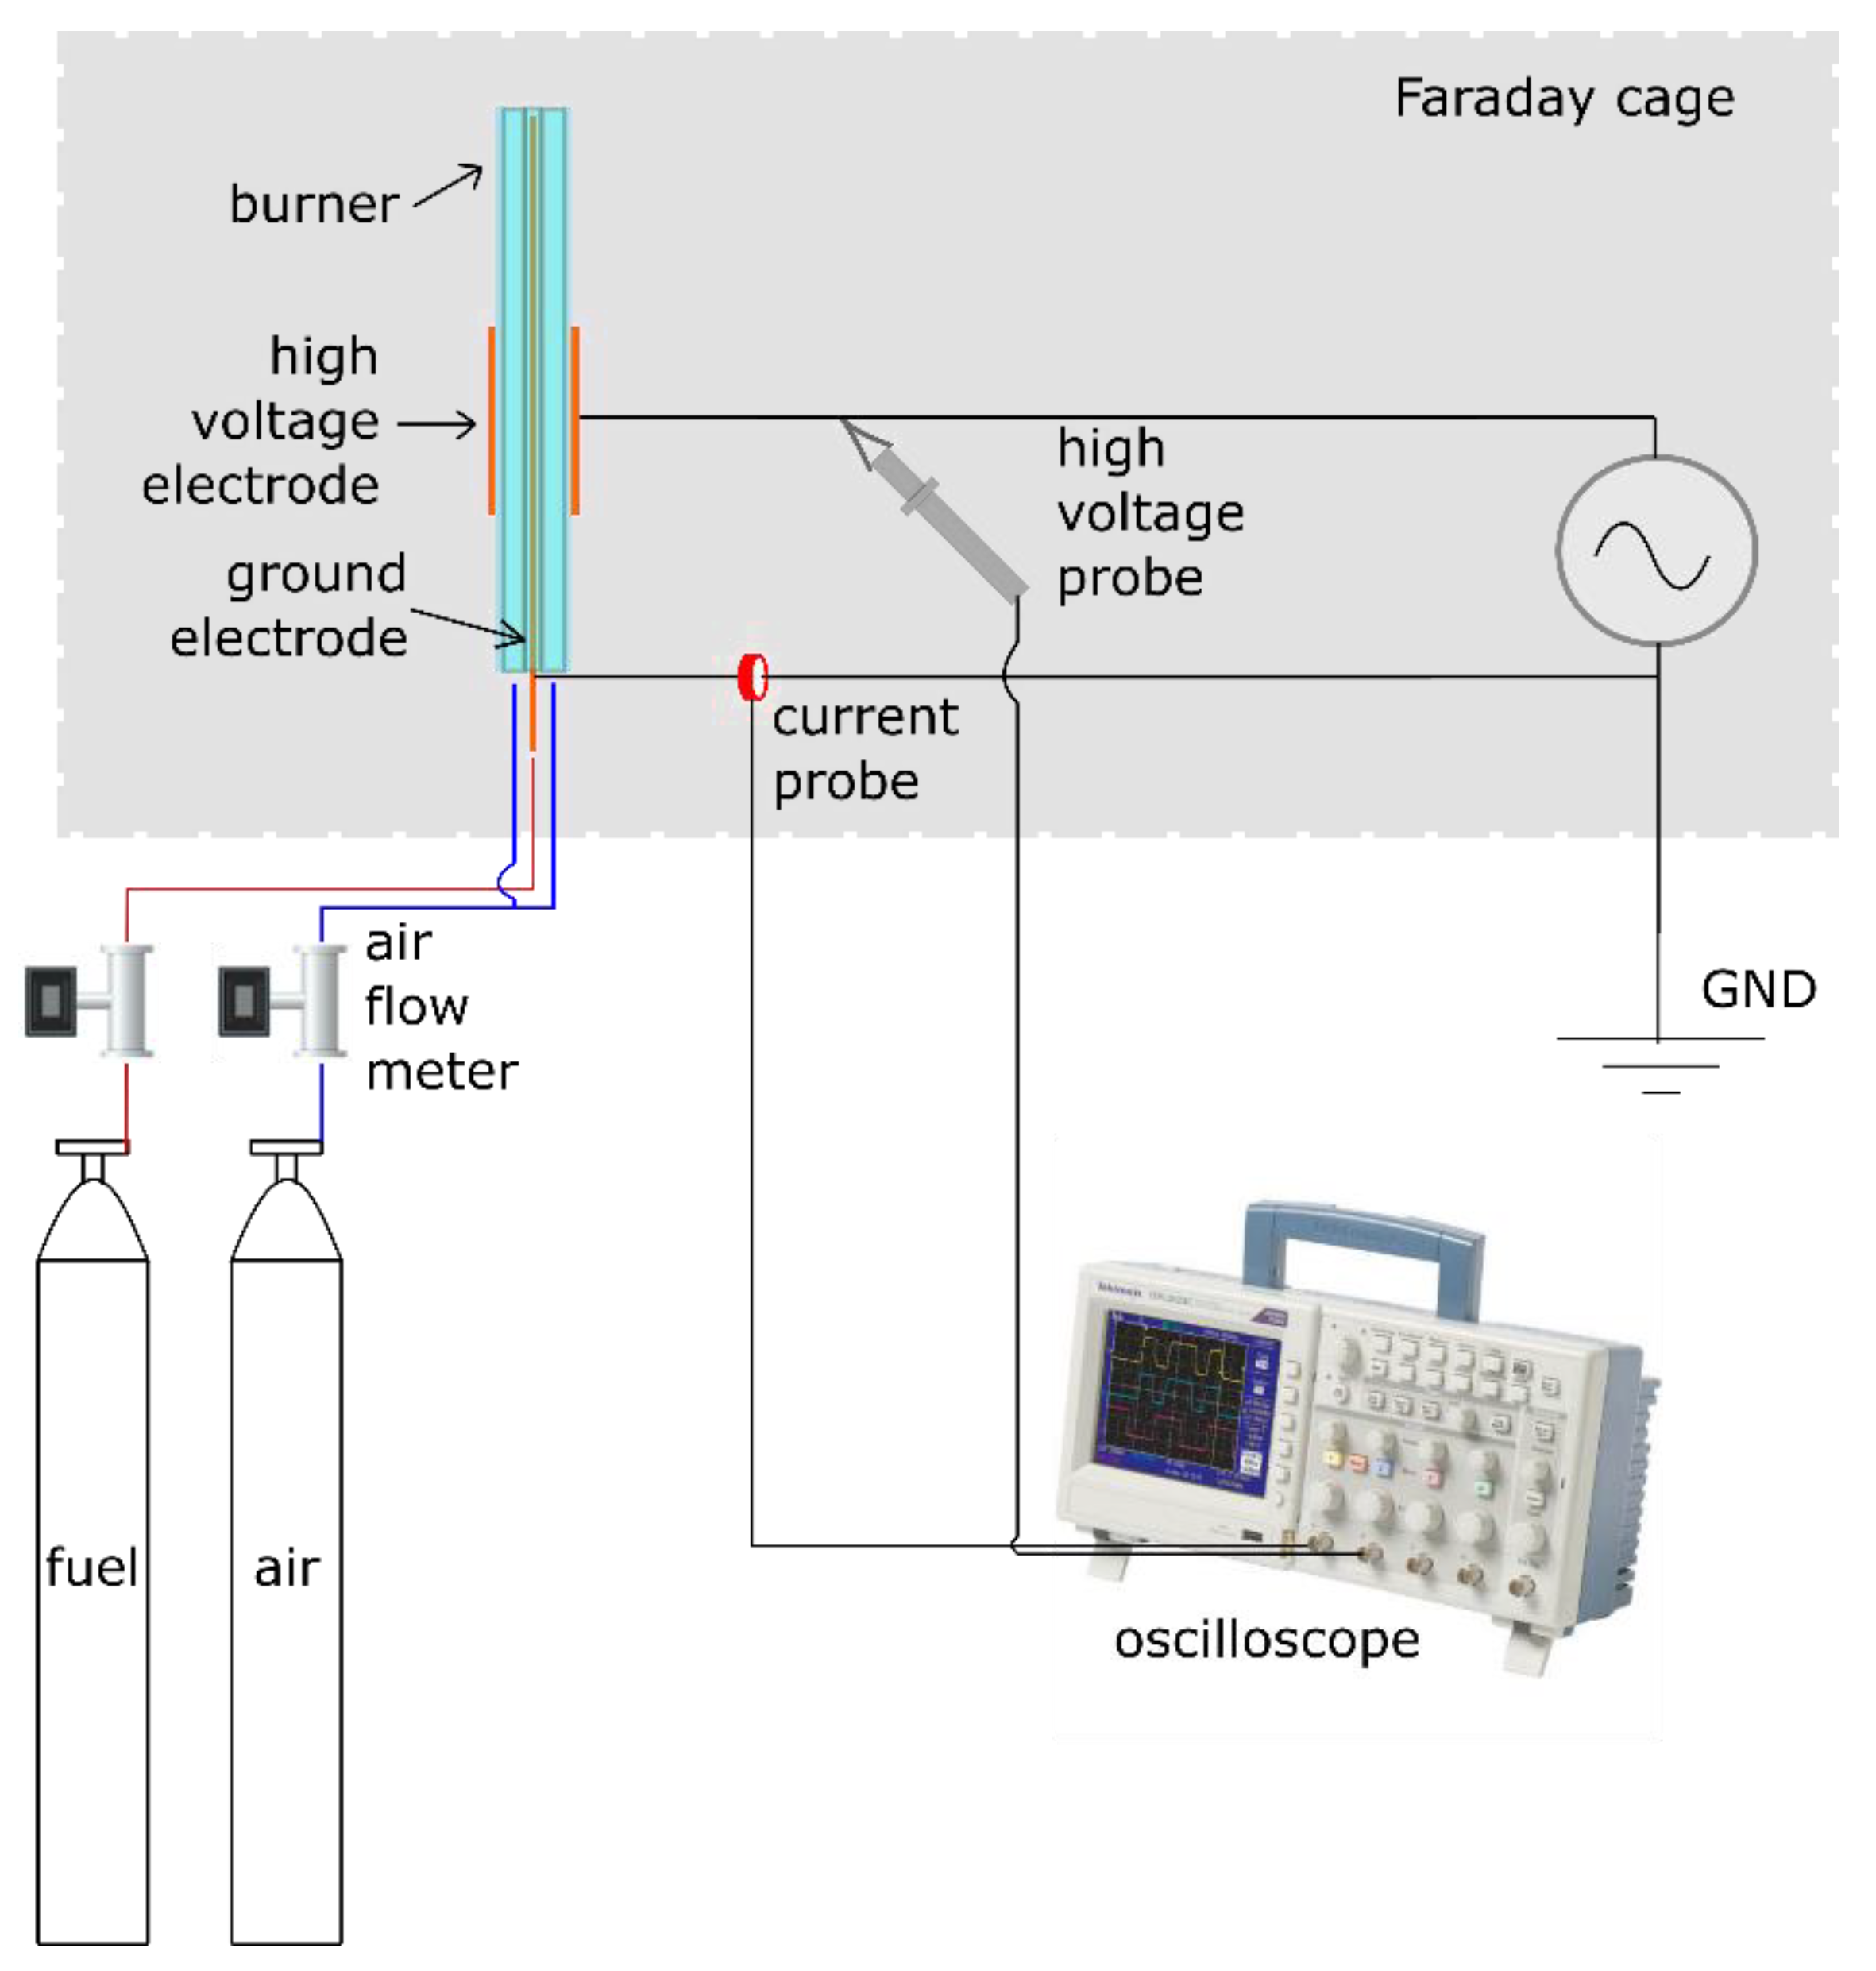
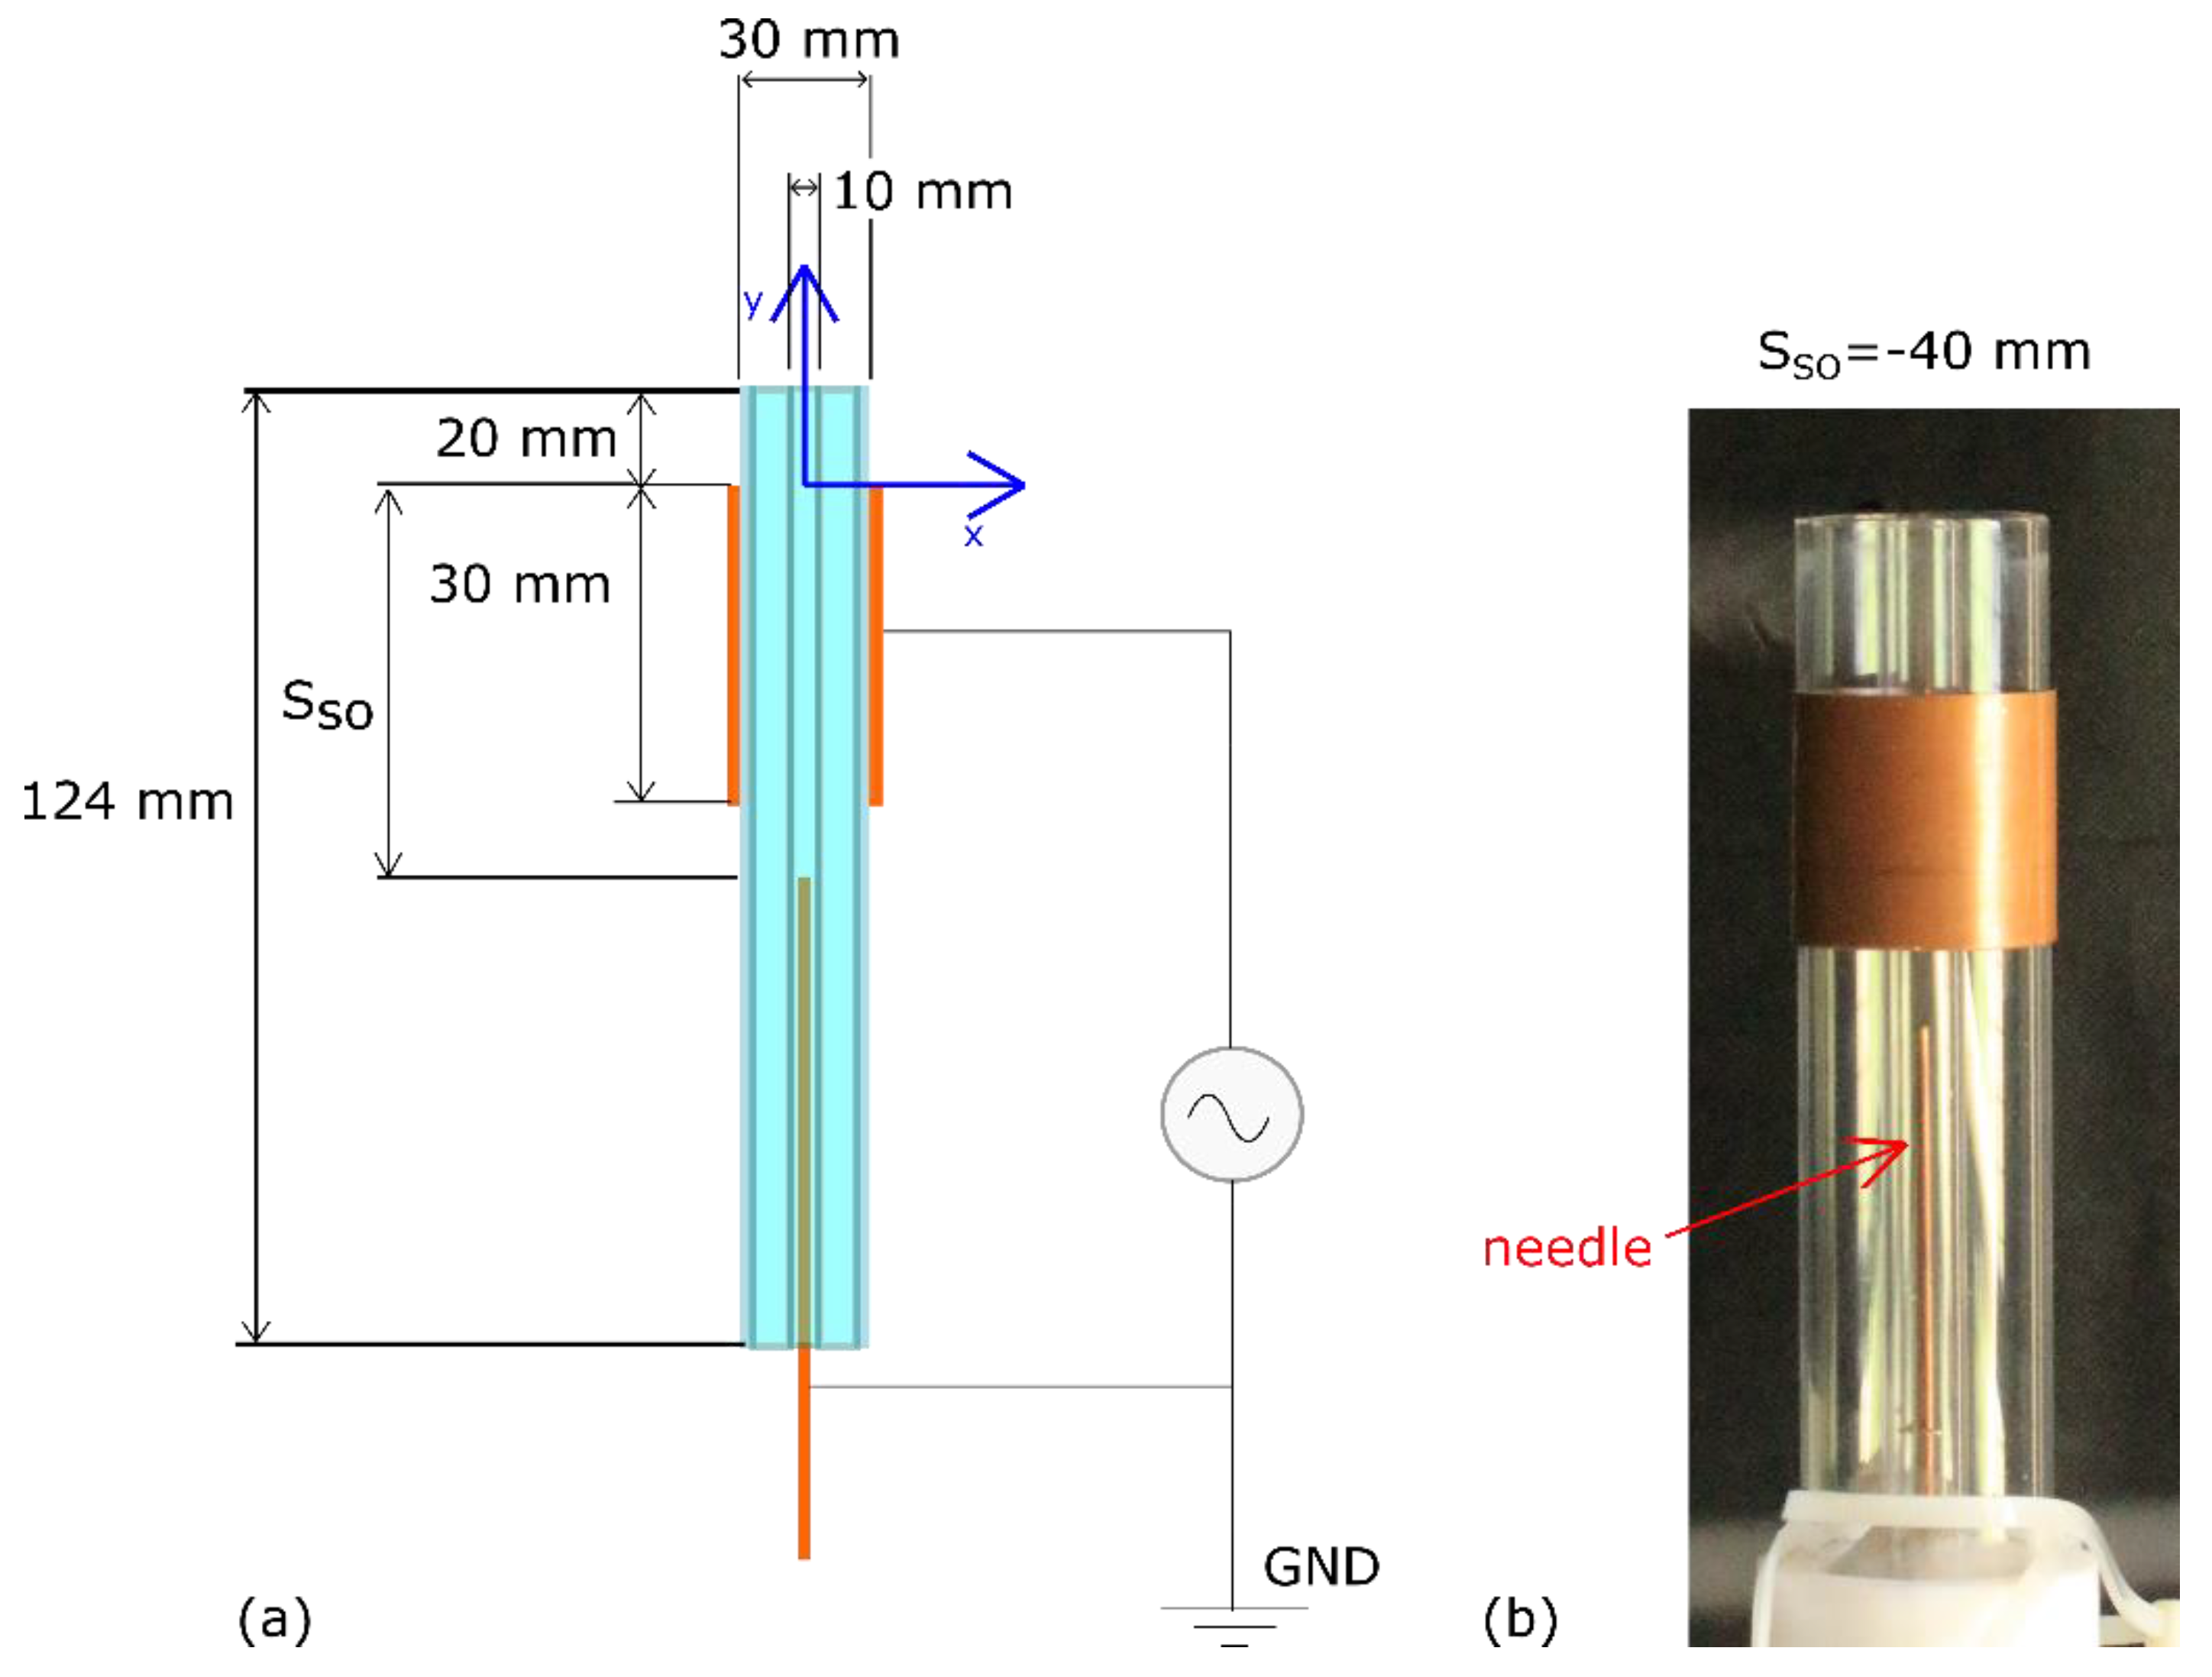
2. Experimental Set-Up and Methods
3. Numerical Modeling
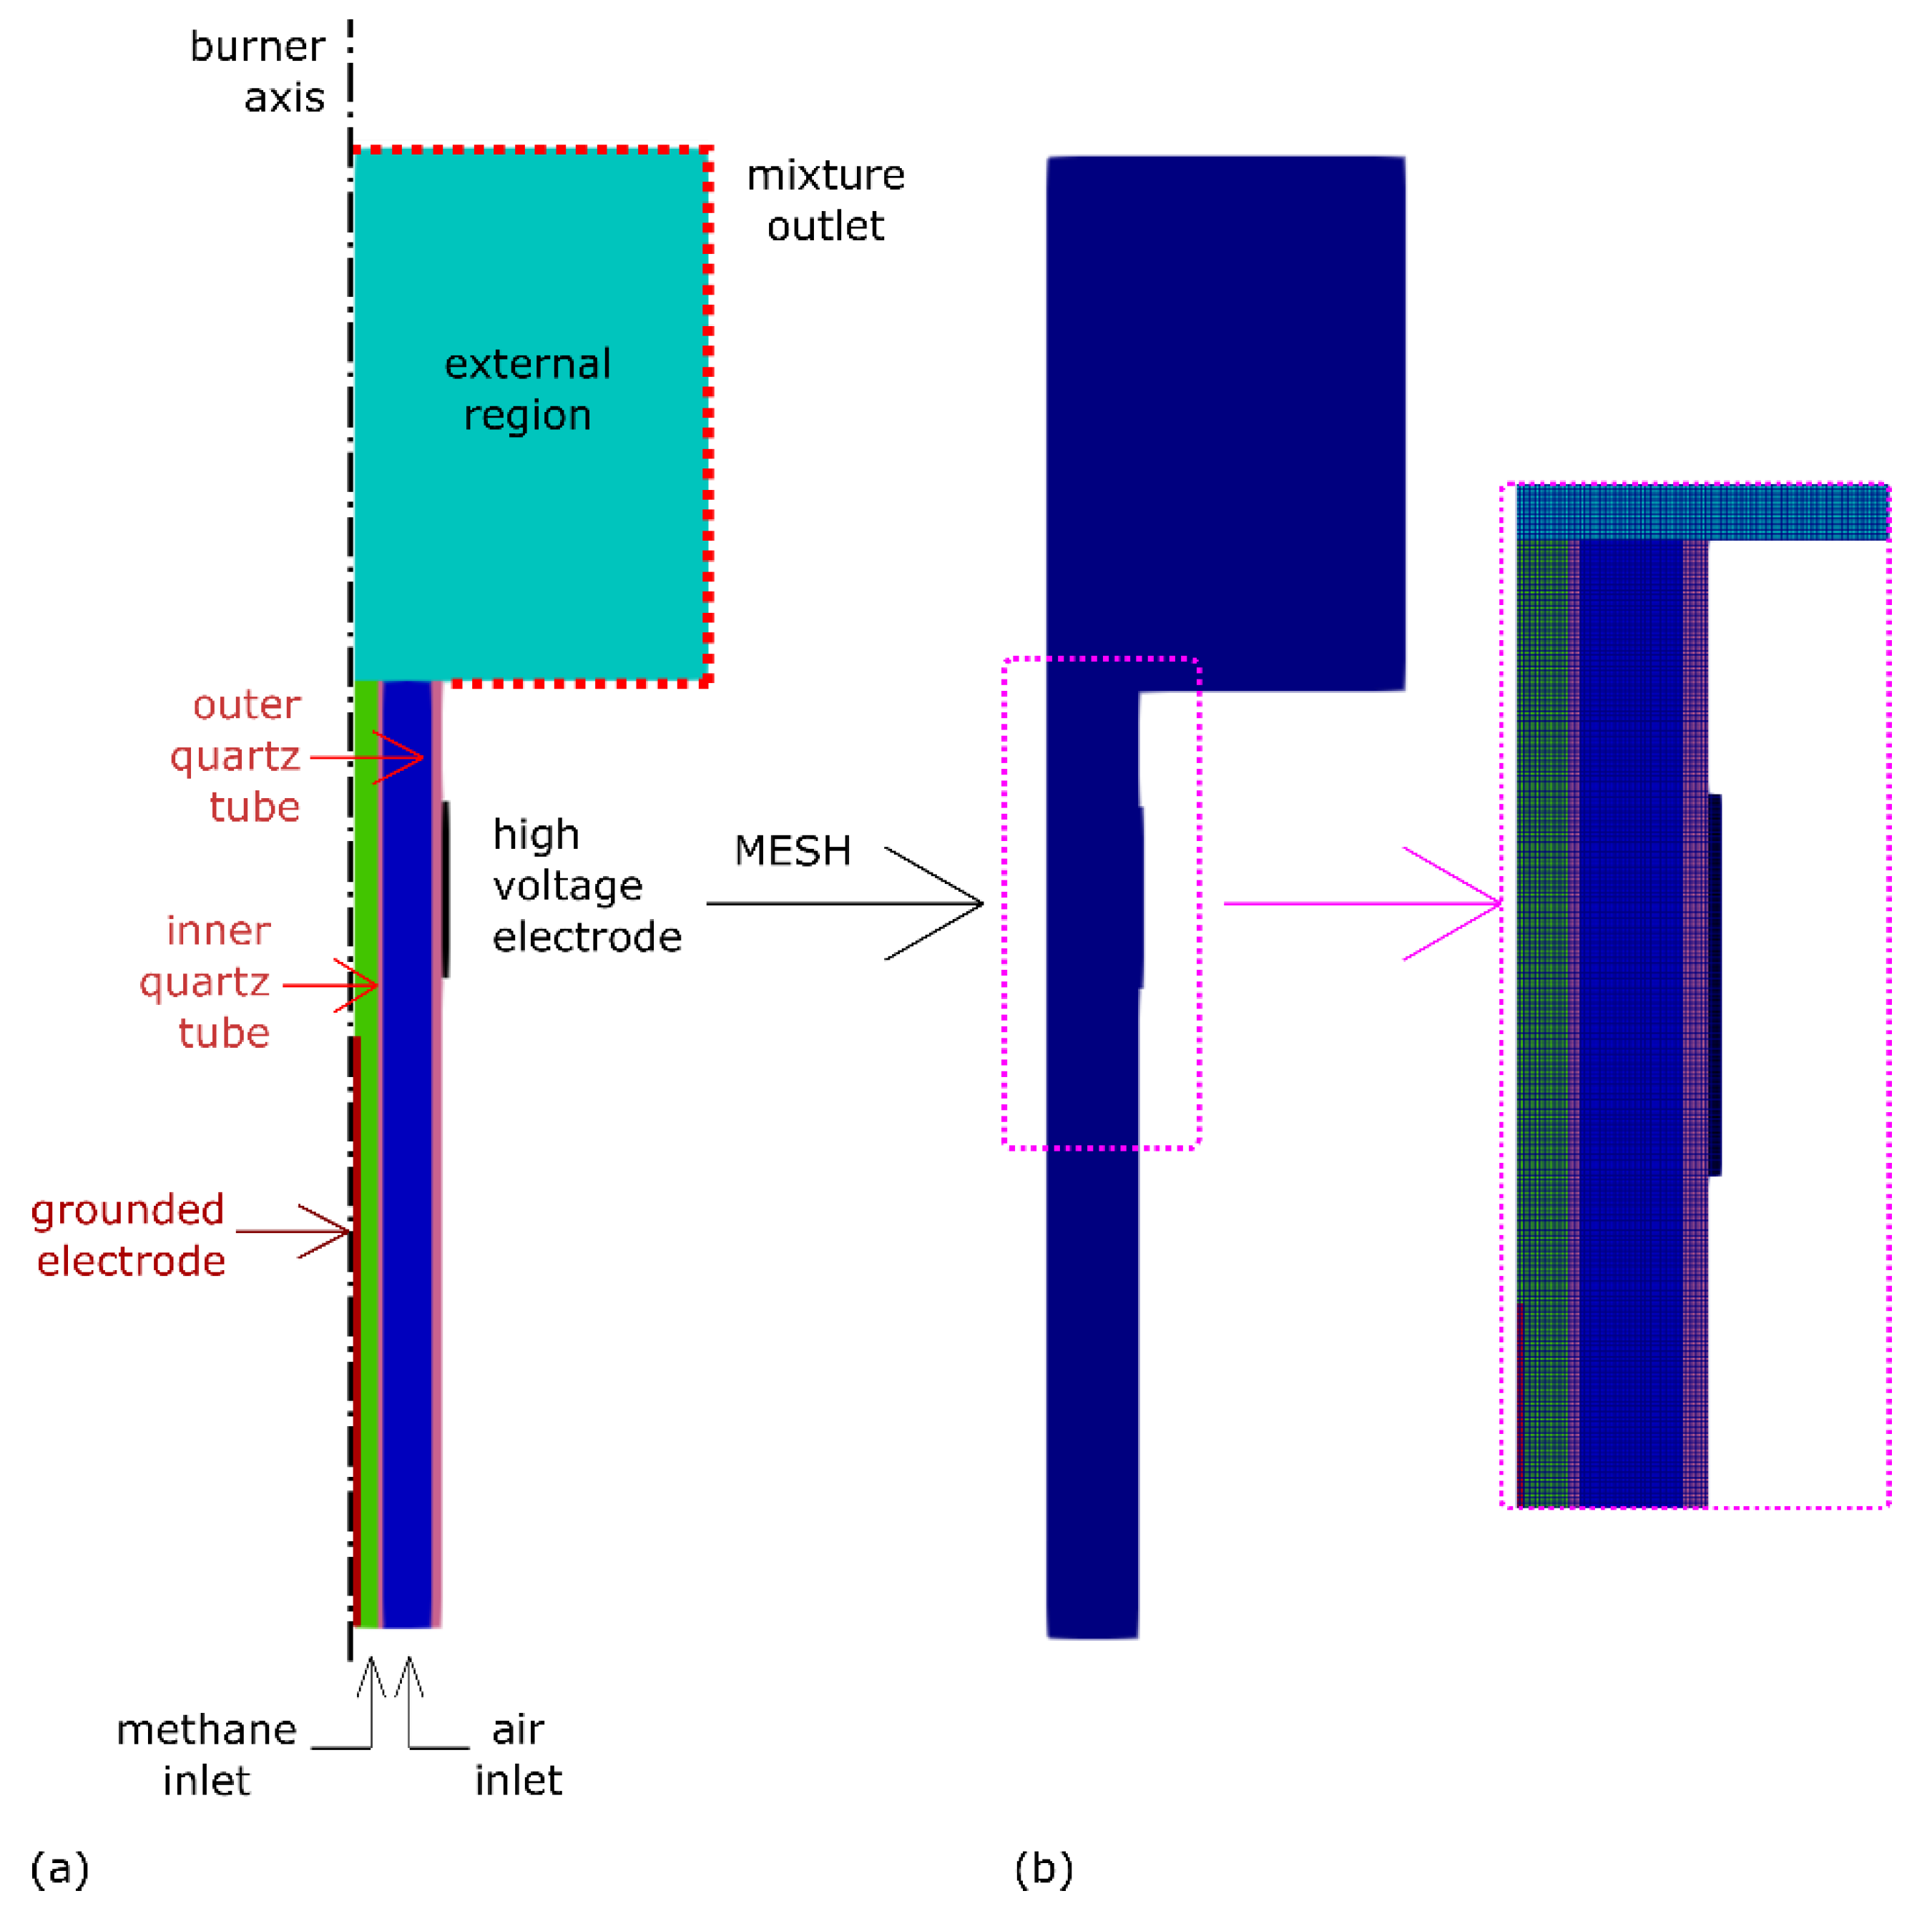
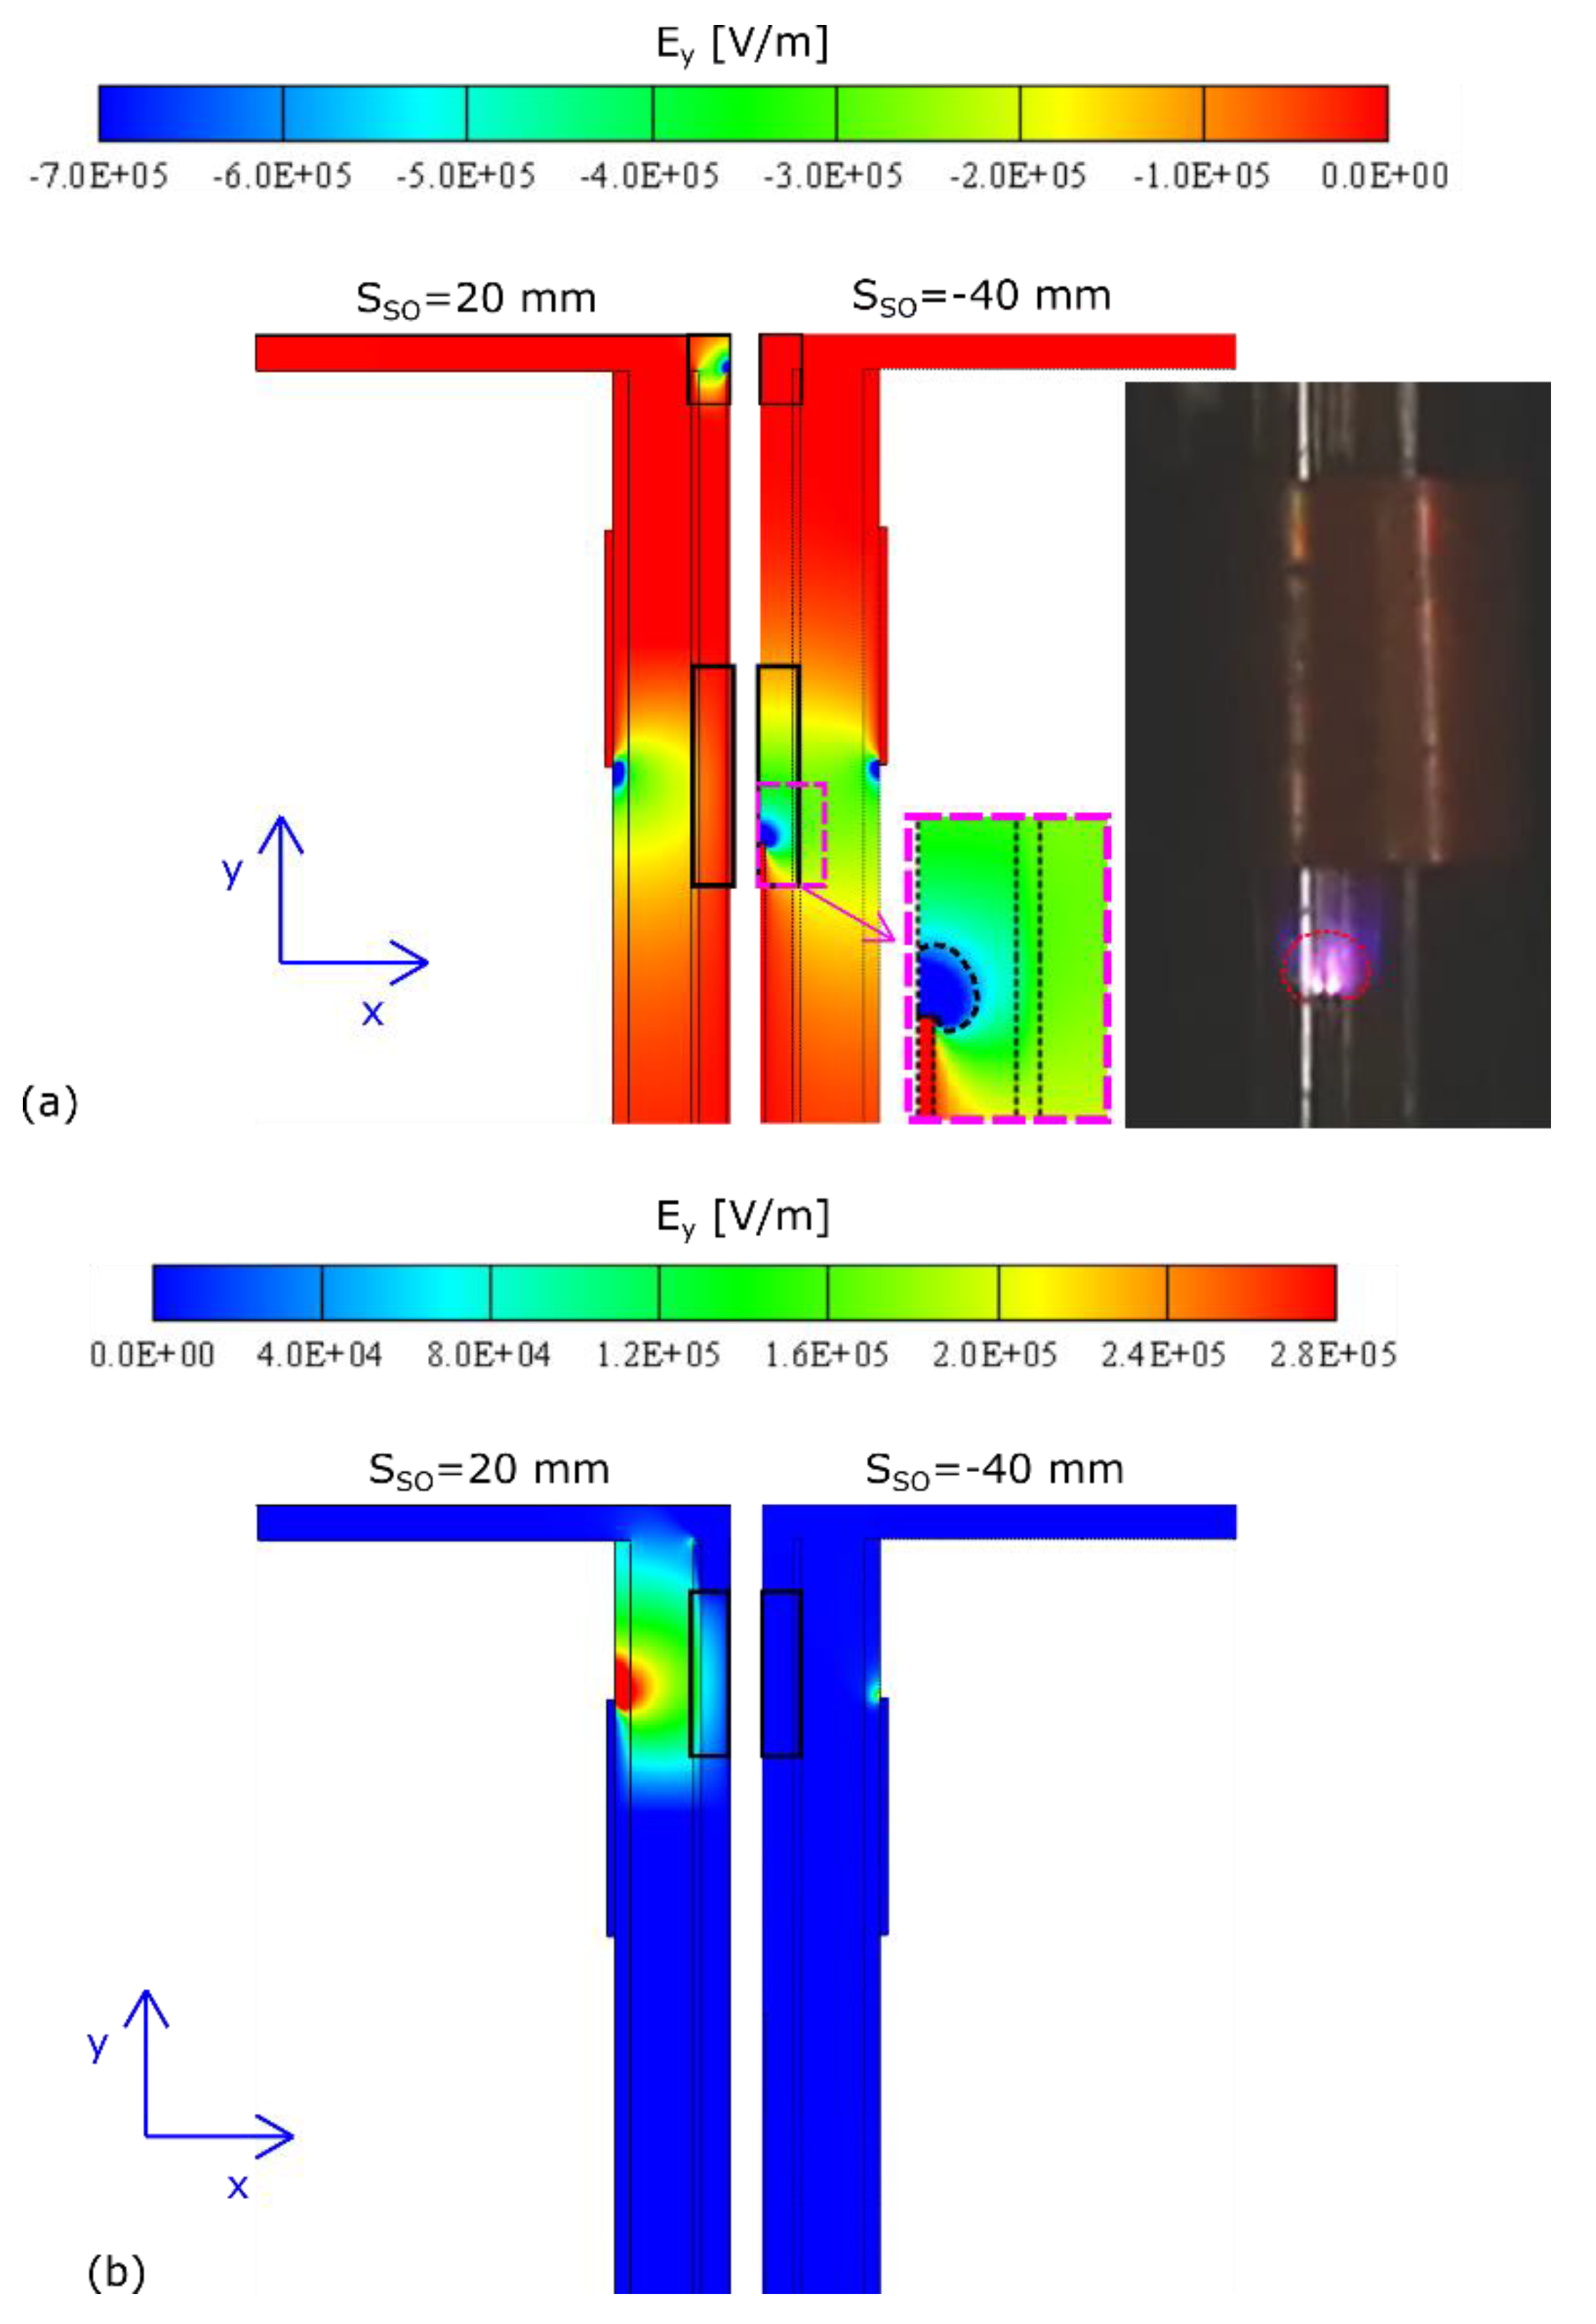
3.1. Electrostatic Field Simulation
3.2. Plasma Modeling of the Methane Kinetics and Reactor
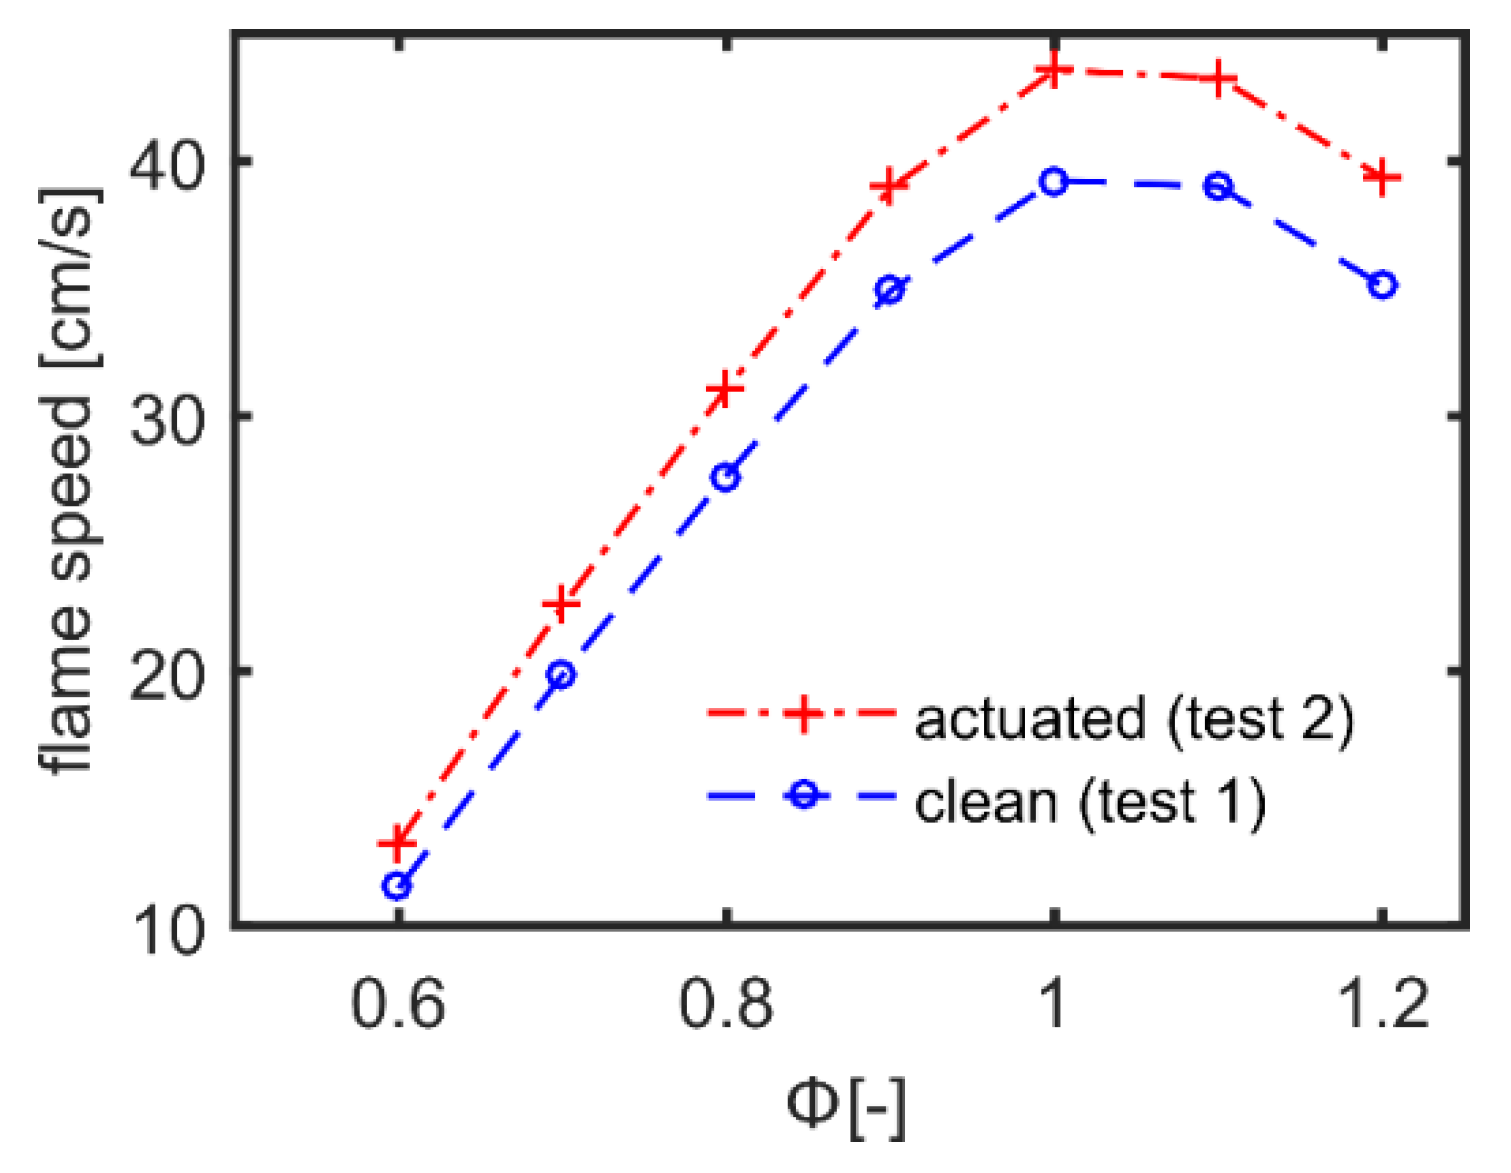
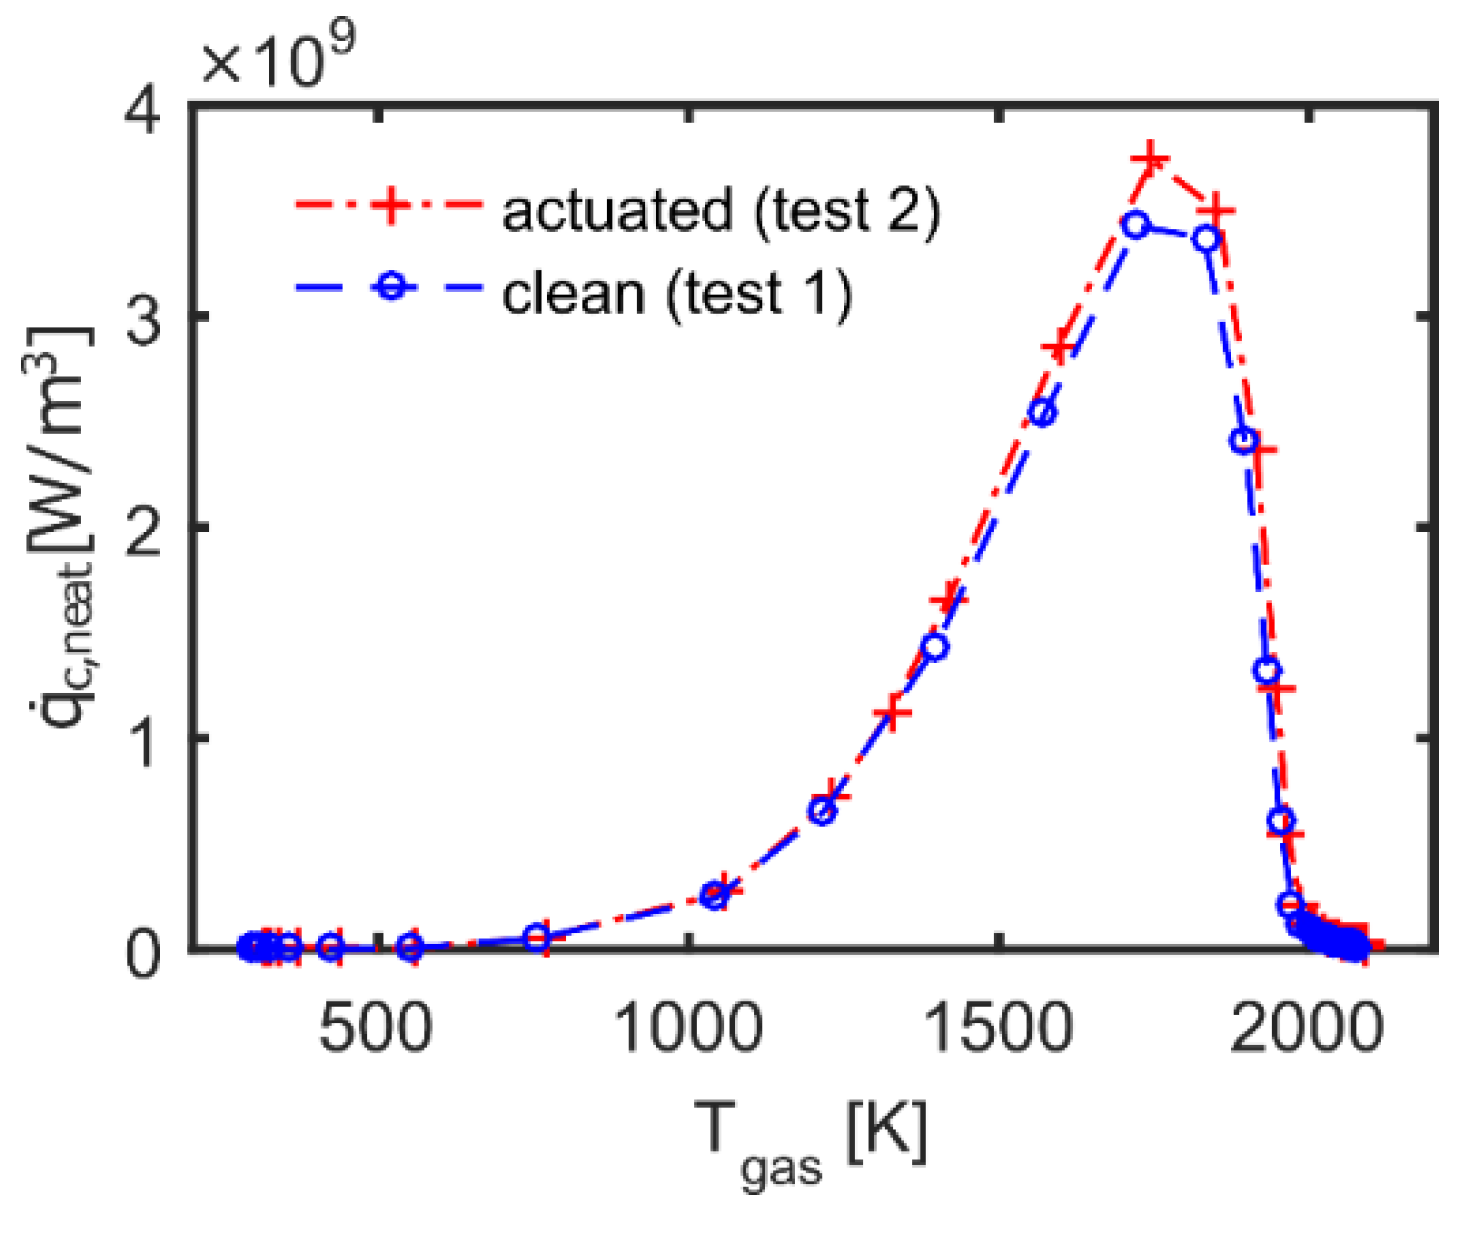
4. Results
- momentum effect which led to the slowing down of the flow into the quartz tube;
- plasma chemistry effect with fuel conversion;
- thermal effects with gas temperature rise.
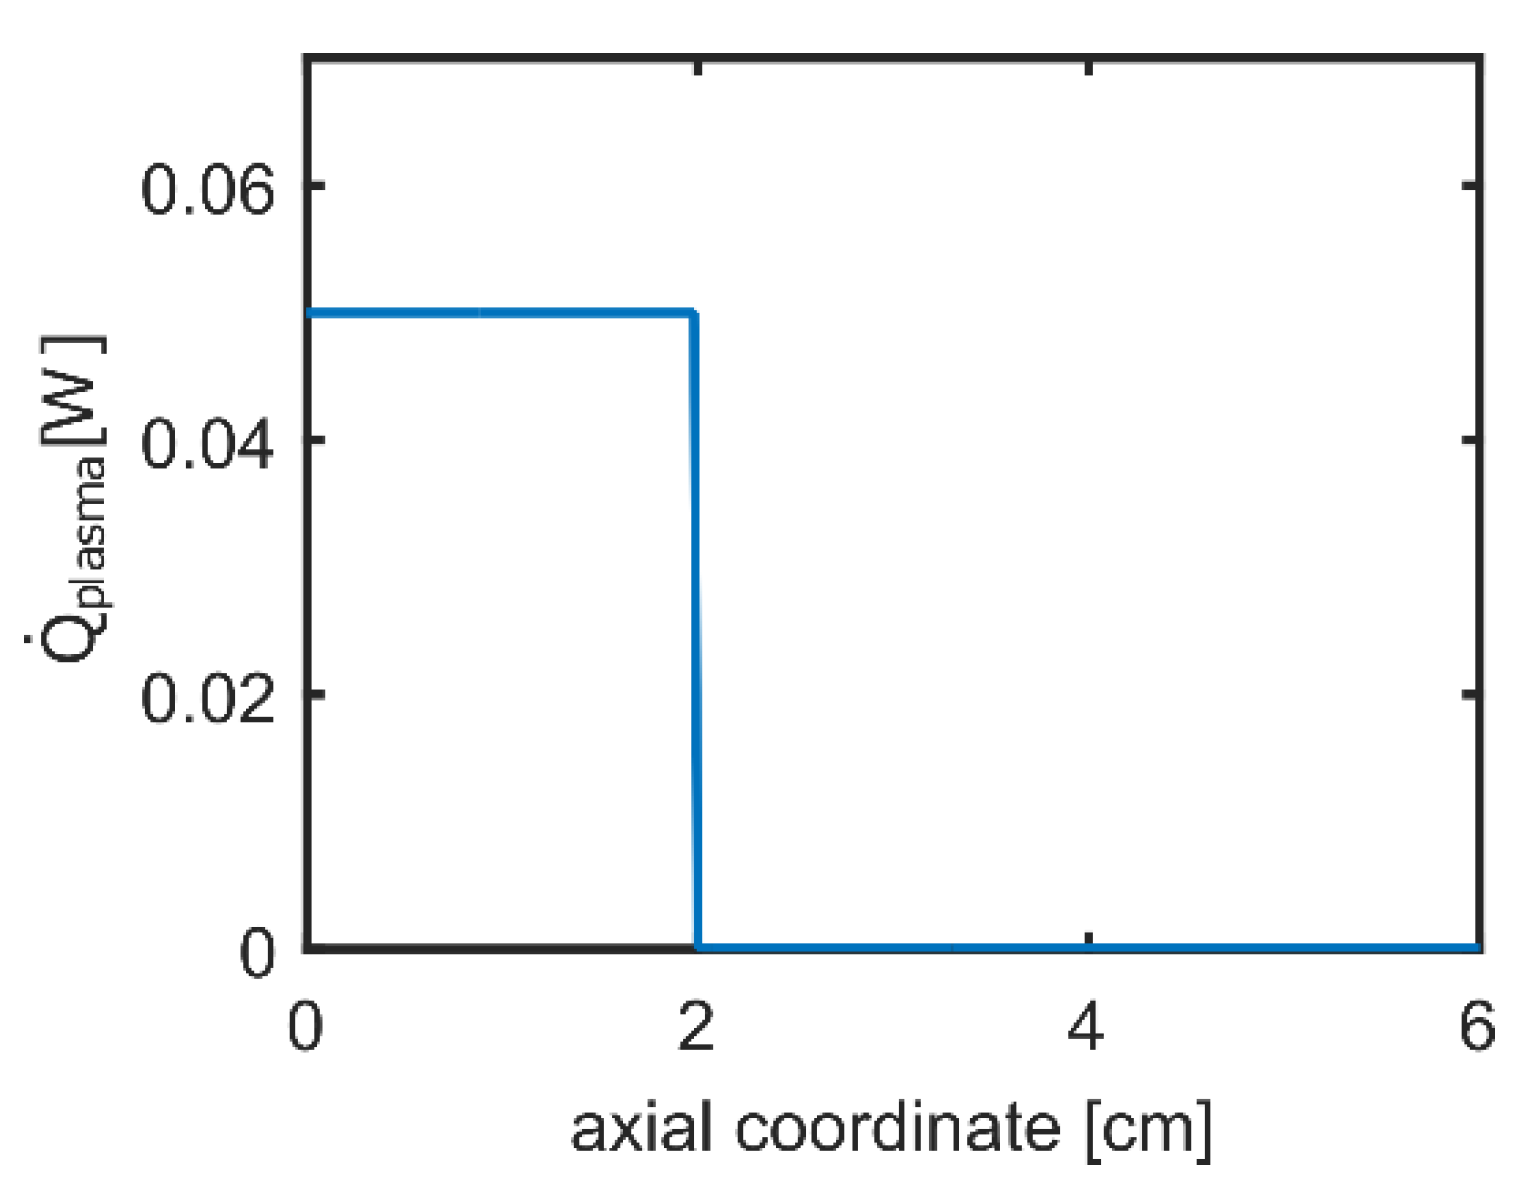
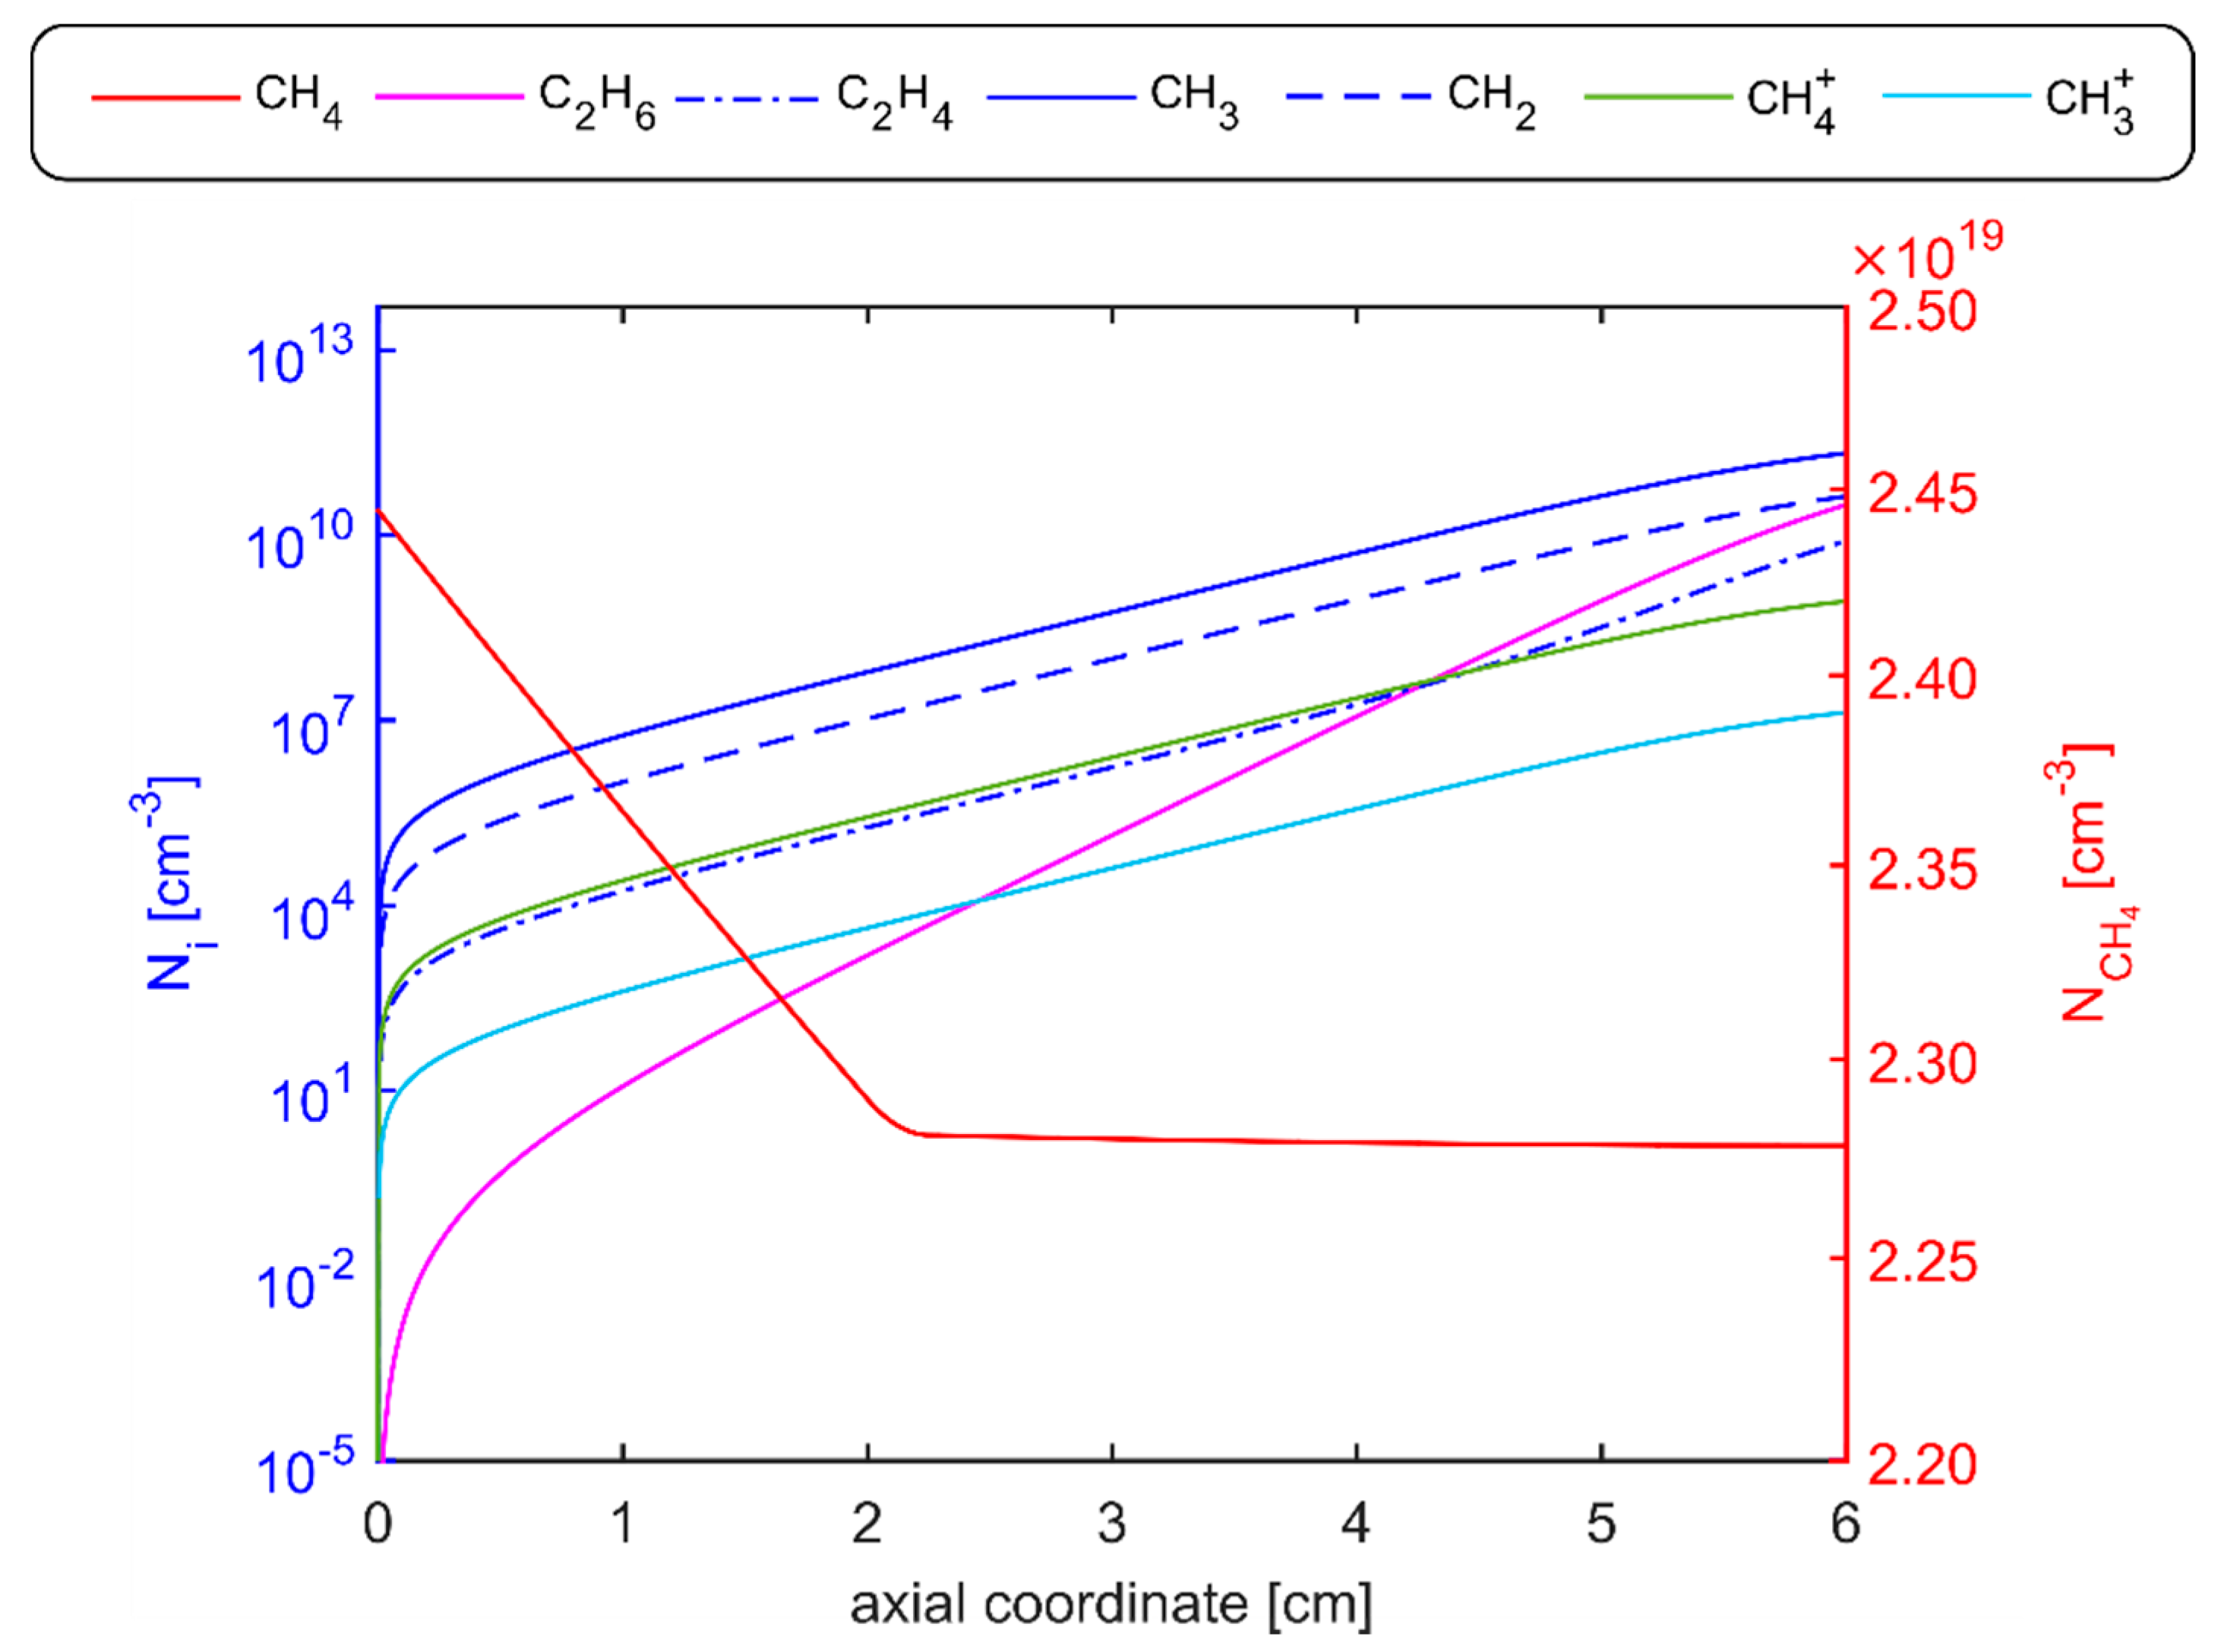
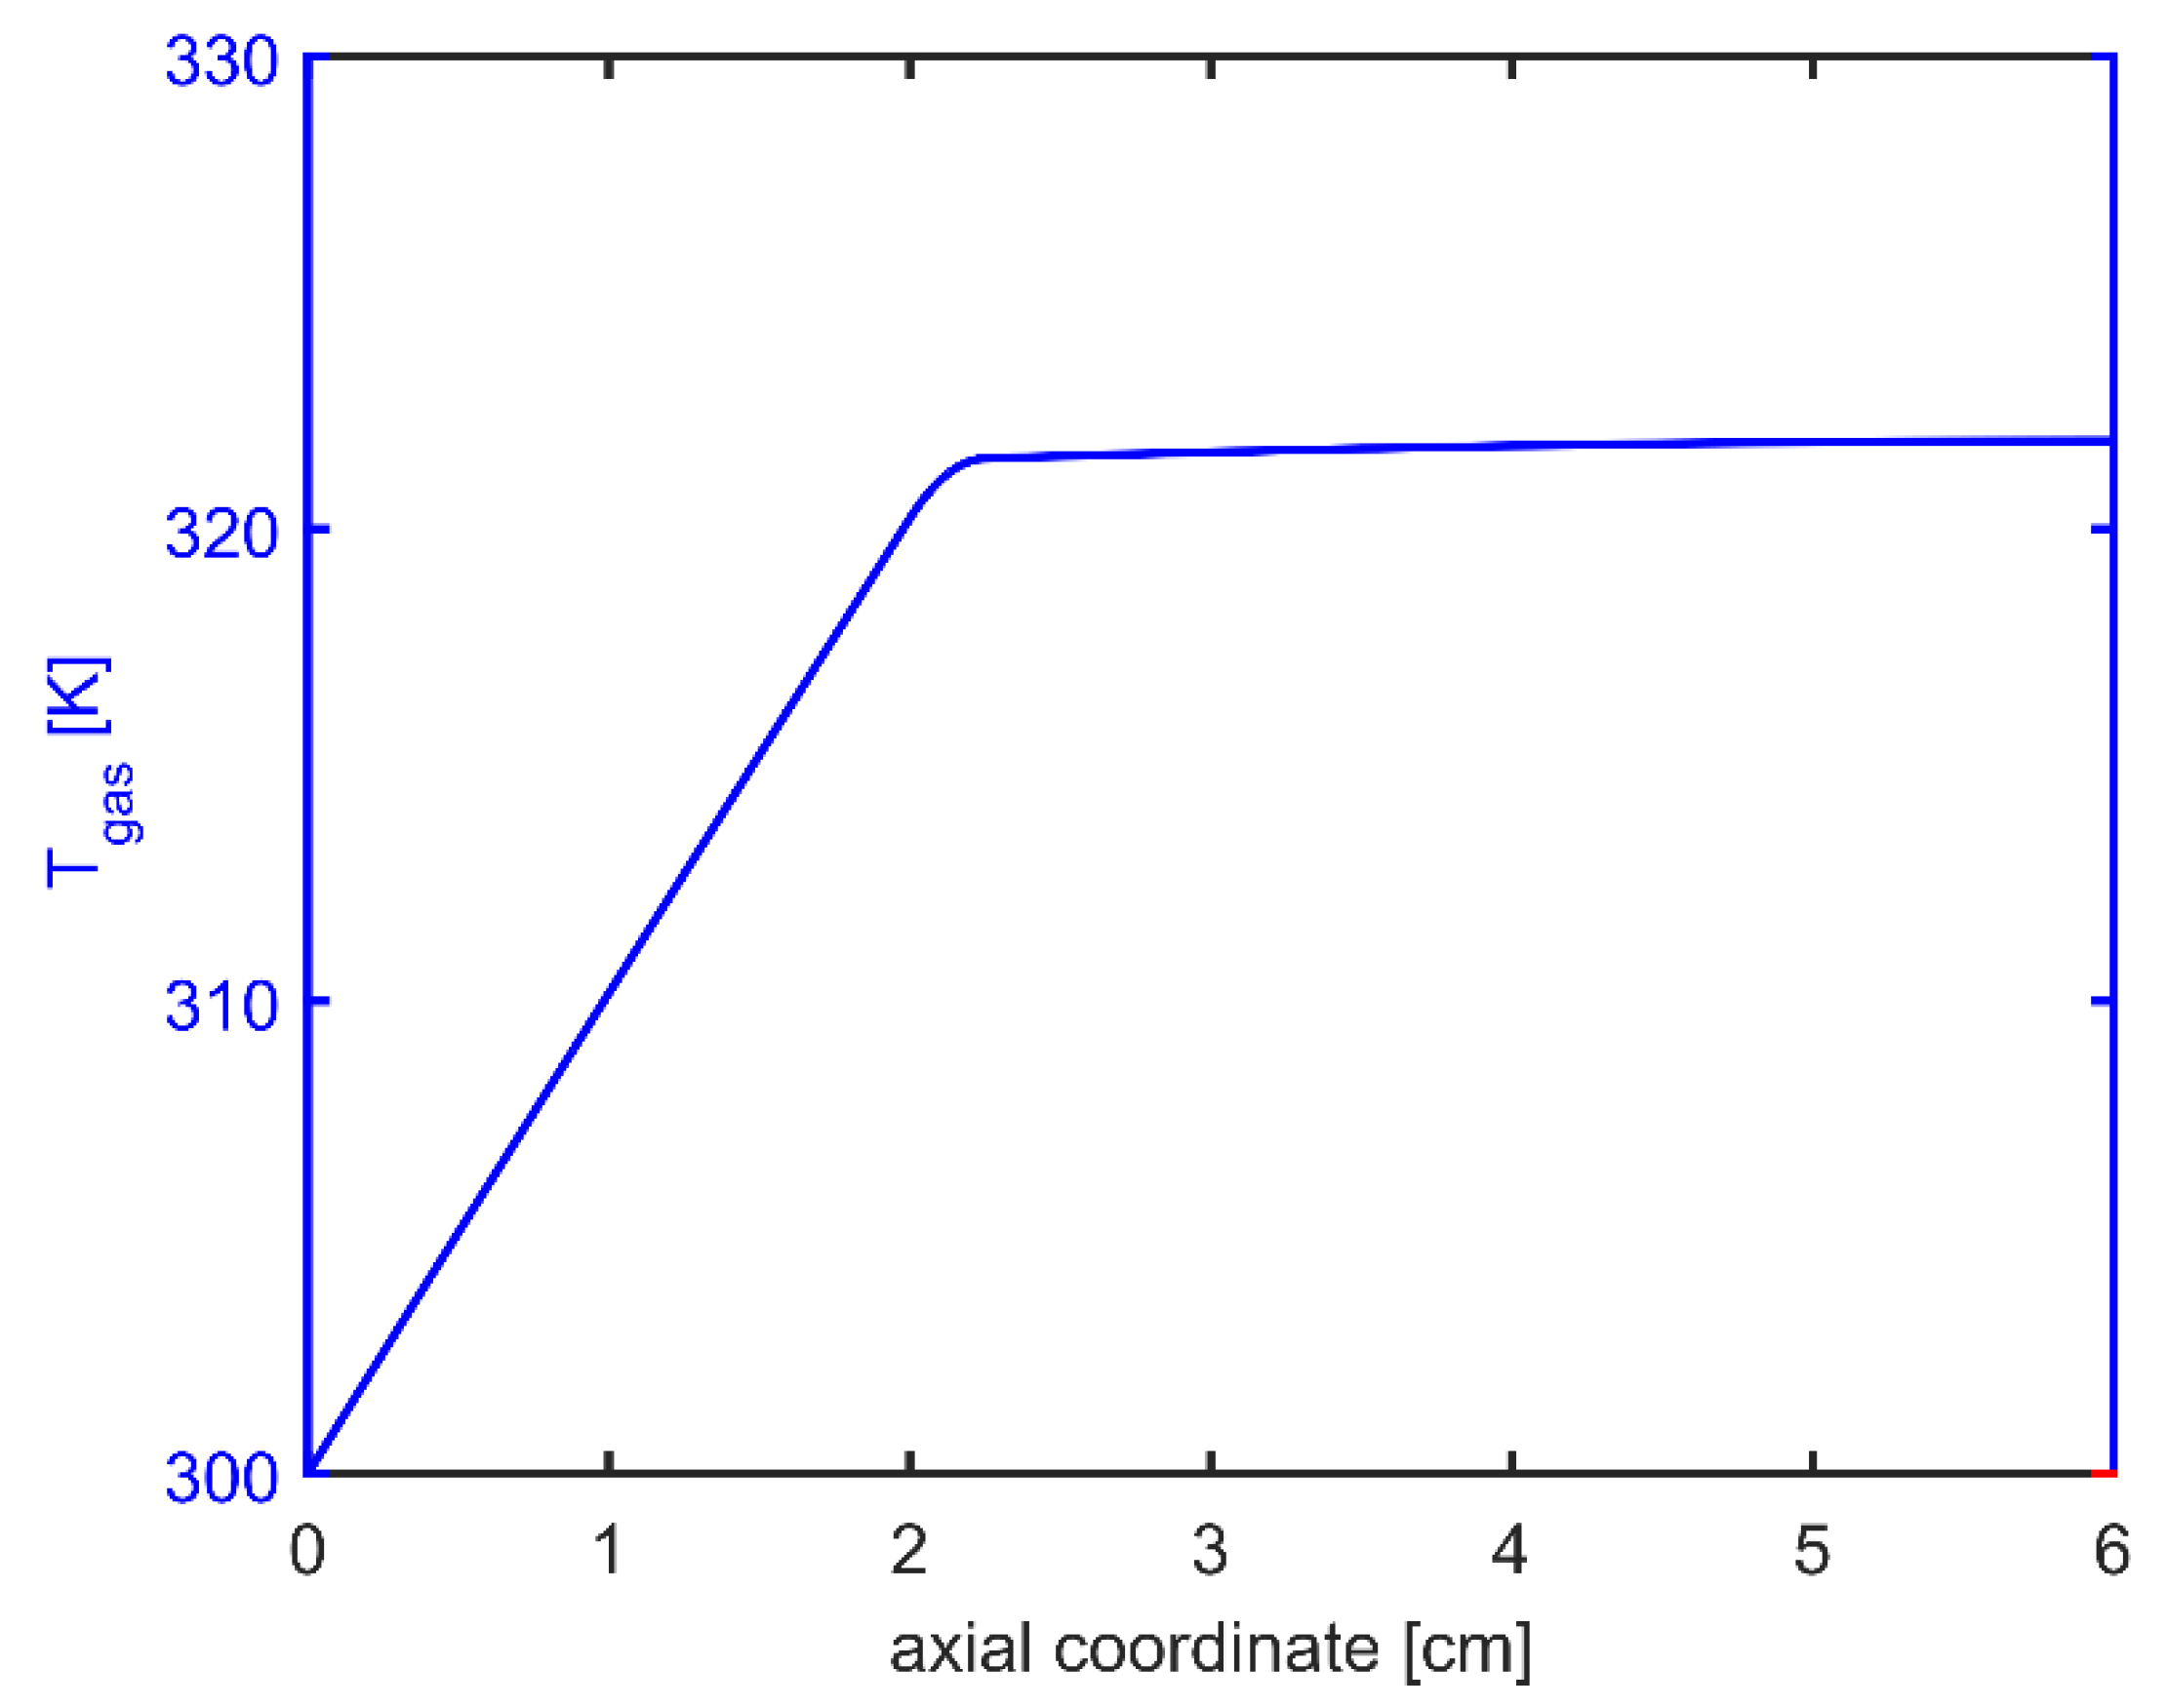
Methane Plasma-Reactor Model Results
5. Conclusions
Author Contributions
Funding
Conflicts of Interest
Nomenclature
| Symbols | ||
| A | cross-section area of the reactor | (m2) |
| inner surface area per unit length | (m) | |
| mean heat capacity per mass | (J/kgK) | |
| electric field | (V/m) | |
| E/N | reduced electric field | (Td=10−17 V cm2) |
| F | drag force | (N) |
| h | specific enthalpy | (J/kg) |
| I(t) | electrical current | (A) |
| electrical current density | (A/m2) | |
| mass flow rate | (g/s) | |
| number density of the species i | (1/m3) | |
| P | pressure force | (N/m2) |
| electrical power | (W) | |
| Qij | source rate of the species i and reaction j | (1/m3/s) |
| external heat flux | (W/m2) | |
| plasma power deposition per unit length | (W/m) | |
| R | electrical resistance | (Ω) |
| stand-off distance | (mm) | |
| temperature | (K) | |
| time | (s) | |
| period of the applied voltage | (s) | |
| u | axial velocity | (m/s) |
| V(t) | voltage | (V) |
| W | molecular weight | (kg/mol) |
| Y | molar fraction | (-) |
| Greek symbols | ||
| Φ | equivalence ratio | (-) |
| electric potential | (V) | |
| ρ | density | (kg/m3) |
| electric or ionic conductivity | (S/m) | |
| molar production rate | (mol/s) | |
| Chemical symbols | ||
| C2H2 | acetylene | |
| C2H3 | vinyl radical | |
| C2H4 | ethylene | |
| C2H5 | ethyl radical | |
| C2H6 | ethane | |
| CH4 | methane | |
| methane ion | ||
| CH3 | methyl radical | |
| methyl ion | ||
| CH2 | methylene radical | |
| CH | methylidyne radical | |
| methylidyne ion | ||
| e | electron | |
| H2 | hydrogen | |
| H | atomic hydrogen radical | |
| Subscripts | ||
| a | refers to the air | |
| app | refers to the applied voltage | |
| elec | refers to electrons | |
| f | refers to the fuel | |
| i | refers to the generic specie | |
| in | refers to the inlet condition | |
| j | refers to the generic reaction | |
| pp | refers to the peak-to-peak voltage | |
| st | refers to the stochiometric condition | |
| Acronyms | ||
| AC | alternate current | |
| DBD | dielectric barrier discharge | |
| HV | high voltage | |
| LFL | lean flammability limit | |
| LPFS | laminar premixed flame speed | |
| NDF | normal diffusive flame | |
| NTP | non-thermal plasma | |
| PAC | plasma assisted combustion | |
| PFR | plug flow reactor | |
References
- Oh, J.; Noh, D. Flame characteristics of a non-premixed oxy-fuel jet in a lab-scale furnace. Energy 2015, 81, 328–343. [Google Scholar] [CrossRef]
- Lee, S.; Padilla, R.; Dunn-Rankin, D.; Pham, T.; Kwon, O.C. Extinction limits and structure of counterflow nonpremixed H2O-laden CH4/air flames. Energy 2015, 93, 442–450. [Google Scholar] [CrossRef] [Green Version]
- Egolfopoulos, F.N.; Holley, A.T.; Law, C.K. An assessment of the lean flammability limits of CH4/air and C3H8/air mixtures at engin*10-like conditions. Proc. Combust. Inst. 2007, 31, 3015–3022. [Google Scholar] [CrossRef]
- Baigmohammadi, M.; Tabejamaat, S.; Zarvandi, J. Numerical study of the behavior of methan*10-hydrogen/air pr*10-mixed flame in a micro reactor equipped with catalytic segmented bluff body. Energy 2015, 85, 117–144. [Google Scholar] [CrossRef]
- Cha, M.S.; Chung, S.H. Characteristics of lifted flames in non-premixed turbulent confined jets. Symp. Int. Combust. 1996, 26, 121–128. [Google Scholar] [CrossRef]
- Fokaides, P.; Zarzalis, N. Lean blowout dynamics of a lifted stabilized, non-premixed swirl flame. Eur. Combust. Meet. 2007, 7, 2. [Google Scholar]
- Chung, S.H. Stabilization, propagation and instability of tribrachial triple flames. Proc. Combust. Inst. 2007, 31, 877–892. [Google Scholar] [CrossRef]
- Chen, Y.-C.; Chang, C.-C.; Pan, K.-L.; Yang, J.-T. Flame Lift-off and Stabilization Mechanisms of Nonpremixed Jet Flames on a Bluff-body Burner. Combust. Flame 1998, 115, 51–65. [Google Scholar] [CrossRef]
- Ju, Y.; Sun, W. Plasma assisted combustion: Dynamics and chemistry. Prog. Energy Combust. Sci. 2015, 48, 21–83. [Google Scholar] [CrossRef]
- Pescini, E.; Sciolti, A.; Francioso, L.; Ficarella, A.; De Giorgi, M.G. Effect of a micro dielectric barrier discharge plasma actuator on quiescent flow. IET Sci. Meas. Technol. 2014, 8, 135–142. [Google Scholar] [CrossRef]
- Pescini, E.; Martínez, D.; De Giorgi, M.G.; Ficarella, A. Characterization of the effects of a dielectric barrier discharge plasma actuator on a coaxial jet in a Bunsen burner. Exp. Therm. Fluid Sci. 2018, 91, 292–305. [Google Scholar] [CrossRef]
- Karnani, S.; Dunn-Rankin, D. Detailed characterization of DC electric field effects on small non-premixed flames. Combust. Flame 2015, 162, 2865–2872. [Google Scholar] [CrossRef]
- Tinajero, J.; Bernard, G.; Autef, L.; Dunn-Rankin, D. Characterizing I-V Curves for Non-Premixed Methane Flames Stabilized on Different Burner Configurations. Combust. Sci. Technol. 2017, 189, 1739–1750. [Google Scholar] [CrossRef]
- Chien, Y.-C.; Dunn-Rankin, D. Electric Field Induced Changes of a Diffusion Flame and Heat Transfer near an Impinging Surface. Energies 2018, 11, 1235. [Google Scholar] [CrossRef] [Green Version]
- Tinajero, J.; Dunn-Rankin, D. Non-premixed axisymmetric flames driven by ion currents. Combust. Flame 2019, 199, 365–376. [Google Scholar] [CrossRef]
- López-Cámara, C.F.; Éplénier, G.; Tinajero, J.; Dunn-Rankin, D. Numerical Simulation of Methane/Air Flames Including Ions and Excited Species; Combustion Institute: Provo, UT, USA, 2015. [Google Scholar]
- Belhi, M.; Domingo, P.; Vervisch, P. Modelling of the effect of DC and AC electric fields on the stability of a lifted diffusion methane/air flame. Combust. Theory Model. 2013, 17, 749–787. [Google Scholar] [CrossRef]
- Rosocha, L.A.; Kim, Y.; Stange, S. Application of a Non-Thermal Plasma to Combustion Enhancement; No. LA-UR-04-6890; Los Alamos National Laboratory: Tokyo, Japan, 2004. [Google Scholar]
- Kim, Y.; Stange, S.M.; Rosocha, L.A.; Ferreri, V.W. Enhancement of Propane Flame Stability by Dielectric Barrier Discharges. J. Adv. Oxid. Technol. 2005, 8, 188–192. [Google Scholar] [CrossRef]
- Rosocha, L.A.; Kim, Y.; Anderson, G.K.; Abbate, S. Combustion enhancement using silent electrical discharges. Int. J. Environ. Sci. Technol. 2007, 1, 8–13. [Google Scholar]
- Klimov, A.; Bityurin, V. External and Internal Plasma-Assisted Combustion. In Proceedings of the 41st Aerospace Sciences Meeting and Exhibit, Reno, NV, USA, 5–8 January 2003. [Google Scholar]
- Bao, A.; Utkin, Y.G.; Keshav, S.; Lou, G.; Adamovich, I.V. Ignition of Ethylene–Air and Methane–Air Flows by Low-Temperature Repetitively Pulsed Nanosecond Discharge Plasma. IEEE Trans. Plasma Sci. 2007, 35, 1628–1638. [Google Scholar] [CrossRef]
- Mao, X.; Rousso, A.; Chen, Q.; Ju, Y. Numerical modeling of ignition enhancement of CH4/O2/He mixtures using a hybrid repetitive nanosecond and DC discharge. Proc. Combust. Inst. 2019, 37, 5545–5552. [Google Scholar] [CrossRef]
- Ombrello, T.; Won, S.H.; Ju, Y.; Williams, S. Flame propagation enhancement by plasma excitation of oxygen. Part I: Effects of O3. Combust. Flame 2010, 157, 1906–1915. [Google Scholar] [CrossRef]
- Ombrello, T.; Won, S.H.; Ju, Y.; Williams, S. Flame propagation enhancement by plasma excitation of oxygen. Part II: Effects of O2(a1Δg). Combust. Flame 2010, 157, 1916–1928. [Google Scholar] [CrossRef]
- Starikovskii, A.Y.; Anikin, N.B.; Kosarev, I.; Mintoussov, E.I.; Starikovskaia, S.M.; Zhukov, V.P. Plasma-assisted combustion. Pure Appl. Chem. 2006, 78, 1265–1298. [Google Scholar] [CrossRef] [Green Version]
- Starikovskiy, A.; Anikin, N.B.; Kosarev, I.; Mintoussov, E.I.; Nudnova, M.M.; Rakitin, A.E.; Roupassov, D.V.; Starikovskaia, S.M.; Zhukov, V.P.; Anikin, N.B. Nanosecond-Pulsed Discharges for Plasma-Assisted Combustion and Aerodynamics. J. Propuls. Power 2008, 24, 1182–1197. [Google Scholar] [CrossRef]
- Kim, Y.; Ferreri, V.W.; Rosocha, L.A.; Anderson, G.K.; Abbate, S.; Kim, K.-T. Effect of Plasma Chemistry on Activated Propane/Air Flames. IEEE Trans. Plasma Sci. 2006, 34, 2532–2536. [Google Scholar] [CrossRef]
- Pilla, G.; Galley, D.; Lacoste, D.; Lacas, F.; Veynante, D.; Laux, C. Stabilization of a Turbulent Premixed Flame Using a Nanosecond Repetitively Pulsed Plasma. IEEE Trans. Plasma Sci. 2006, 34, 2471–2477. [Google Scholar] [CrossRef]
- Pilla, G.L.; Lacoste, D.; Veynante, D.; Laux, C. Stabilization of a Swirled Propane–Air Flame Using a Nanosecond Repetitively Pulsed Plasma. IEEE Trans. Plasma Sci. 2008, 36, 940–941. [Google Scholar] [CrossRef]
- Won, S.H.; Cha, M.S.; Park, C.S.; Chung, S.H. Effect of electric fields on reattachment and propagation speed of tribrachial flames in laminar co-flow jets. Proc. Combust. Inst. 2007, 31, 963e70. [Google Scholar] [CrossRef]
- Sheng, Z.; Kameshima, S.; Sakata, K.; Nozaki, T. Plasma-Enabled Dry Methane Reforming. In Plasma Chemistry and Gas Conversion; IntechOpen: London, UK, 2018. [Google Scholar]
- Kim, W.; Mungal, M.G.; Cappelli, M.A. The role of in situ reforming in plasma enhanced ultra lean premixed methane/air flames. Combust. Flame 2010, 157, 374–383. [Google Scholar] [CrossRef]
- Khoja, A.H.; Tahir, M.; Amin, N.A.S. Recent developments in non-thermal catalytic DBD plasma reactor for dry reforming of methane. Energy Convers. Manag. 2019, 183, 529–560. [Google Scholar] [CrossRef]
- Wang, Z.H.; Yang, L.; Li, B.; Li, Z.S.; Sun, Z.W.; Aldén, M.; Konnov, A.A. Investigation of combustion enhancement by ozone additive in CH4/air flames using direct laminar burning velocity measurements and kinetic simulations. Combust. Flame 2012, 159, 120–129. [Google Scholar] [CrossRef]
- Liang, X.; Wang, Z.; Weng, W.; Zhou, Z.; Huang, Z.; Zhou, J.; Cen, K. Study of ozon*10-enhanced combustion in H2/CO/N2/air premixed flames by laminar burning velocity measurements and kinetic modeling. Int. J. Hydrog. Energy 2013, 38, 1177–1188. [Google Scholar] [CrossRef]
- Poinsot, T.J.; Veynante, D.P. Combustion. Encyclopedia of Computational Mechanics, 2nd ed.; 2018; pp. 1–30. [Google Scholar]
- Lefkowitz, J.K.; Guo, P.; Rousso, A.; Ju, Y. Species and temperature measurements of methane oxidation in a nanosecond repetitively pulsed discharge. Philos. Trans. R. Soc. A Math. Phys. Eng. Sci. 2015, 373, 20140333. [Google Scholar] [CrossRef] [PubMed] [Green Version]
- ArrayExpress—A Database of Functional Genomics Experiments. Available online: http://www.ebi.ac.uk/arrayexpress/ (accessed on 12 November 2012).
- Lutz, A.E.; Kee, R.J.; Miller, J.A. Senkin: A Fortran Program for Predicting Homogeneous Gas Phase Chemical Kinetics with Sensitivity Analysis; Report SAND87-8248; Sandia National Laboratories: Albuquerque, NM, USA, 1988. [Google Scholar]
- Hagelaar, G.; Pitchford, L.C. Solving the Boltzmann equation to obtain electron transport coefficients and rate coefficients for fluid models. Plasma Sources Sci. Technol. 2005, 14, 722–733. [Google Scholar] [CrossRef]
- Pitchford, L.C.; Alves, L.L.; Bartschat, K.; Biagi, S.F.; Bordage, M.-C.; Bray, I.; Brion, C.E.; Brunger, M.J.; Campbell, L.; Chachereau, A.; et al. LXCat: An Open-Access, Web-Based Platform for Data Needed for Modeling Low Temperature Plasmas. Plasma Process. Polym. 2016, 14, 1600098. [Google Scholar] [CrossRef]
- Sun, J.; Chen, Q.; Yang, X.; E Koel, B. Effects of non-equilibrium excitation on methane oxidation in a low-temperature RF discharge. J. Phys. D Appl. Phys. 2019, 53, 064001. [Google Scholar] [CrossRef]
- Masi, M.; Cavallotti, C.; Carrà, S. Different approaches for methane plasmas modeling. Chem. Eng. Sci. 1998, 53, 3875–3886. [Google Scholar] [CrossRef]
- Kheirollahivash, M.; Rashidi, F.; Moshrefi, M.M. Hydrogen Production from Methane Decomposition Using a Mobile and Elongating Arc Plasma Reactor. Plasma Chem. Plasma Process. 2019, 39, 445–459. [Google Scholar] [CrossRef]
- Frenklach, M.; Wang, H.; Goldenberg, M.; Smith, G.P.; Golden, D.M. GRI-MECH: An Optimized Detailed Chemical Reaction Mechanism for Methane Combustion; SRI International: Menlo Park, CA, USA, 1995. [Google Scholar]
- Burcat, A.; Ruscic, B. Third Millennium Ideal Gas and Condensed Phase Thermochemical Database for Combustion with updates from Active Thermochemical Tables ANL-05/20 and TAE 960; Aerospace Engineering, and Argonne National Laboratory, Chemistry Division: Argonne, IL, USA, 2005. [Google Scholar]
- Nozaki, T.; Okazaki, K. Non-thermal plasma catalysis of methane: Principles, energy efficiency, and applications. Catal. Today 2013, 211, 29–38. [Google Scholar] [CrossRef]


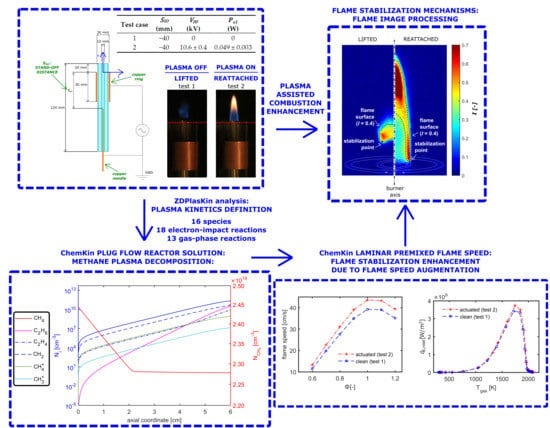
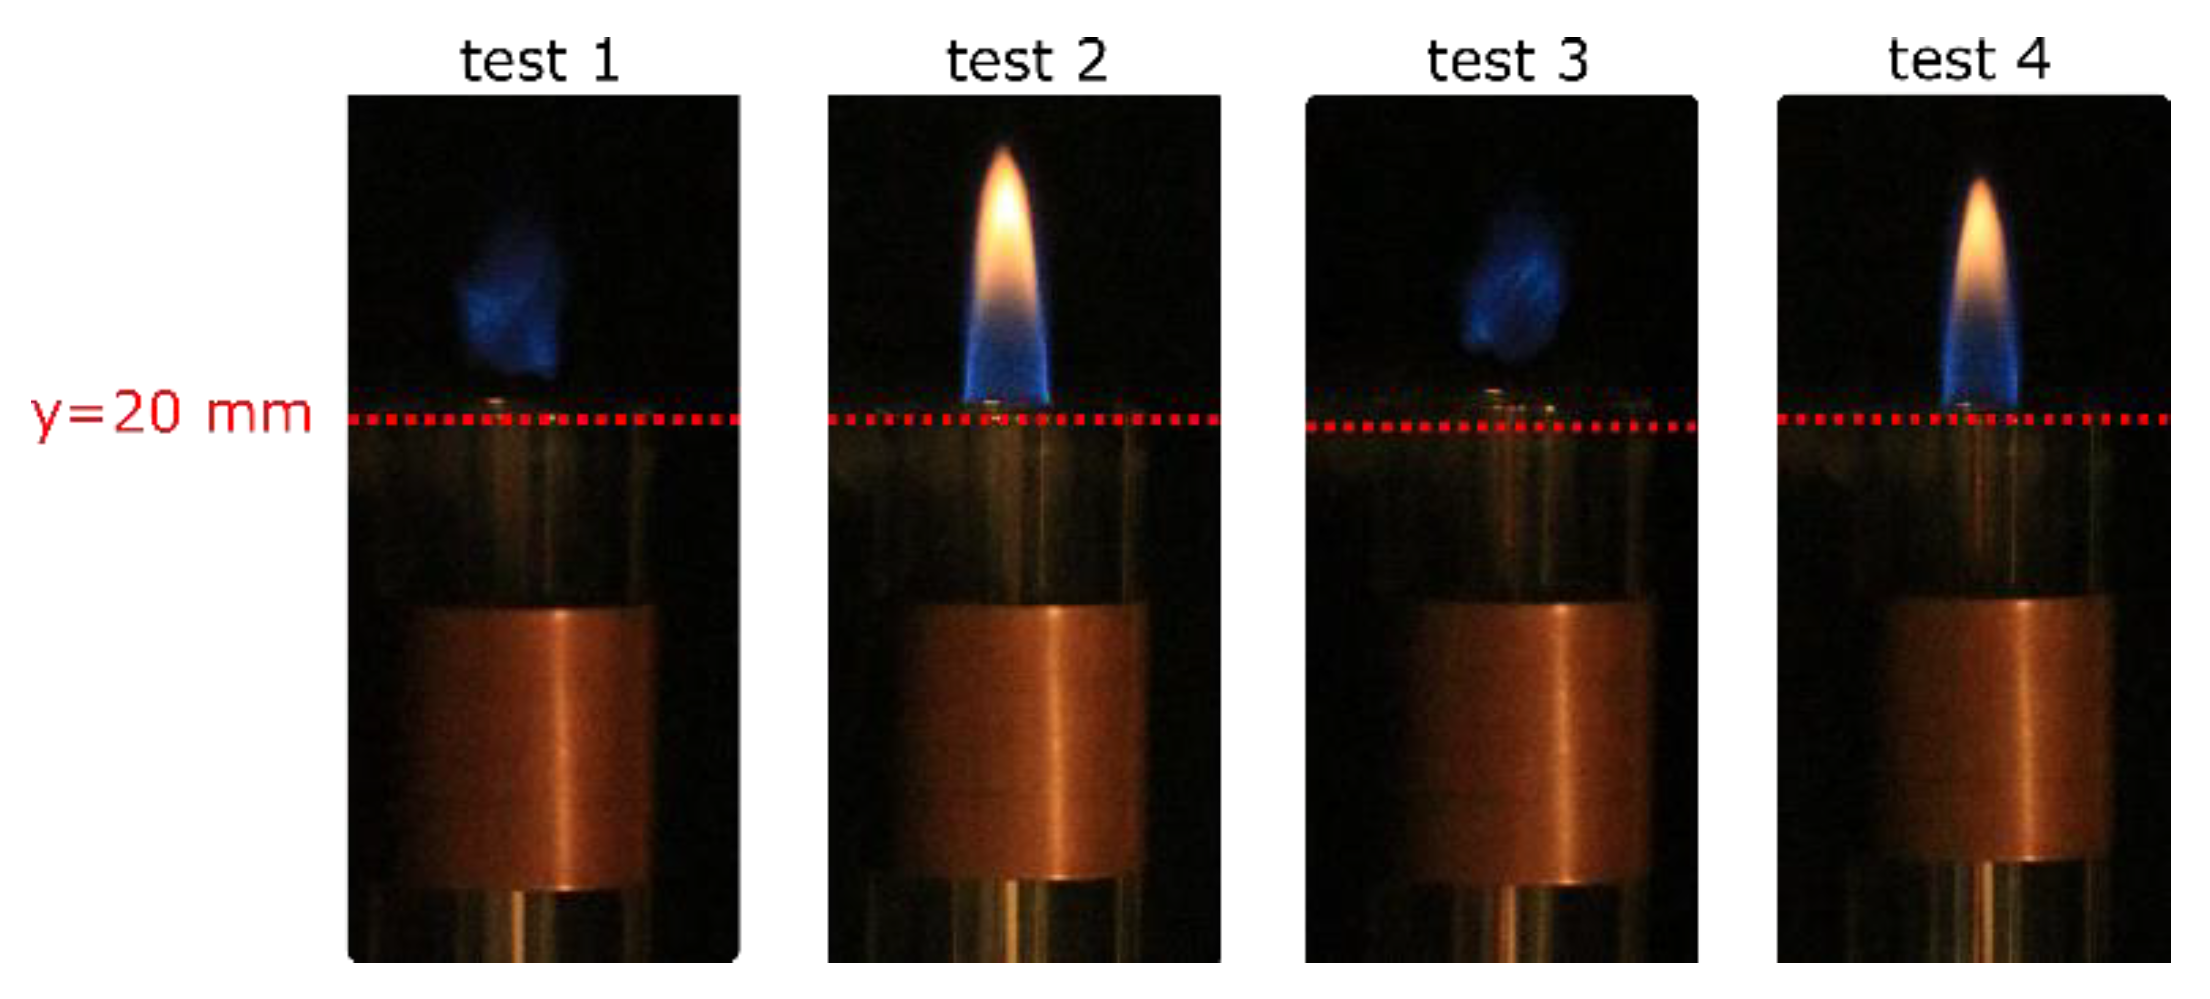
| Test Case | SSO (mm) | Vpp (kV) | (W) |
|---|---|---|---|
| 1 | −40 | 0 | 0 |
| 2 | −40 | 10.6 ± 0.4 | 0.049 ± 0.003 |
| 3 | 20 | 11.1 ± 0.5 | 0.27 ± 0.02 |
| 4 | 20 | 18.4 ± 0.8 | 1.13 ± 0.06 |
| Test Case | SSO (mm) | Vpp (kV) |
|---|---|---|
| SIM1 | −40 | 11 |
| SIM2 | 20 | 11 |
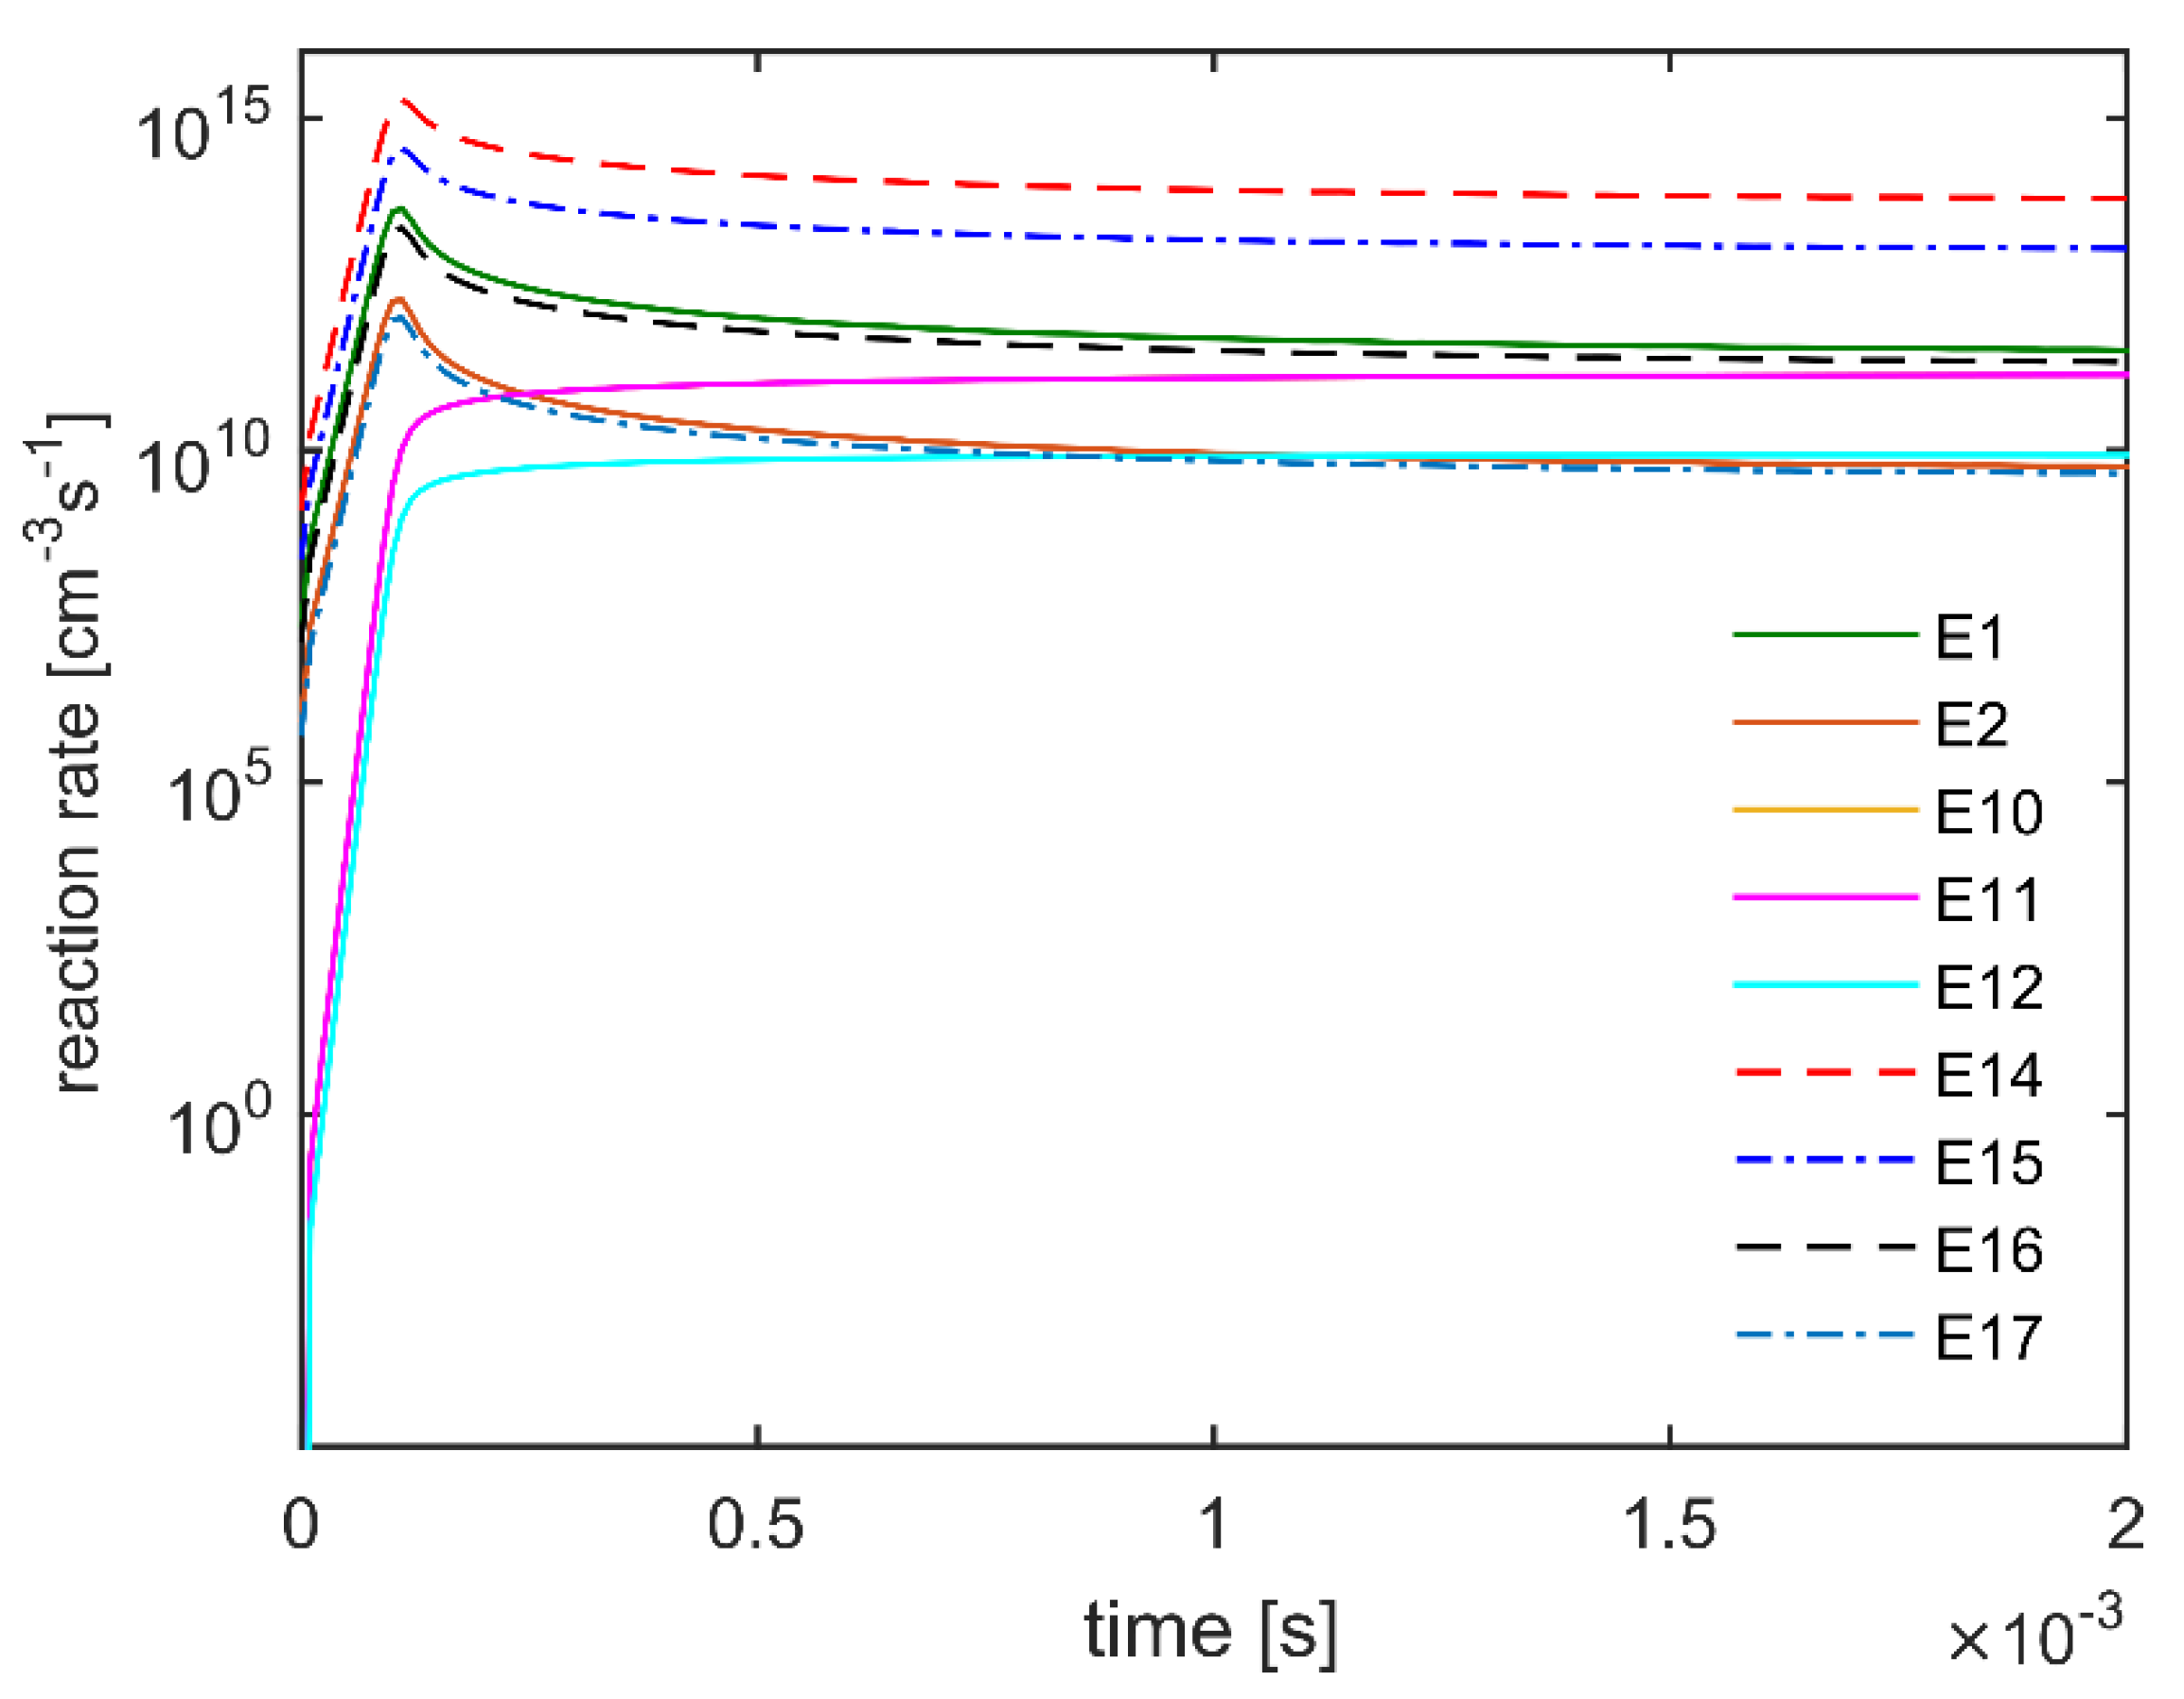
| Reactions | Ar | βr | Er | |
|---|---|---|---|---|
| Electron–Impact Ionization | ||||
| E1 | e + CH4 → 2e + | 2.75 × 10⁻¹⁸ | − | − |
| E2 | e + CH4 → 2e + + H | 4.39 × 10⁻²⁰ | − | − |
| E3 | e + CH4 → 2e + + H2 | 1.92 × 10⁻²² | − | − |
| E4 | e + CH3 → 2e + | 2.70 × 10⁻¹⁶ | − | − |
| E5 | e + CH3 → 2e + + H | 2.32 × 10⁻²¹ | − | − |
| E6 | e + CH2 → 2e + | 7.84 × 10⁻¹⁷ | − | − |
| E7 | e + CH2 → 2e + CH+ + H | 7.56 × 10⁻²³ | − | − |
| E8 | e + CH → 2e + CH+ | 3.82 × 10⁻¹⁷ | − | − |
| E9 | e + CH → 2e + C+ + H | 3.78 × 10⁻²³ | − | − |
| Electron–Impact Recombination | ||||
| E10 | e + → CH2 + 2H | 2.12 × 10⁻⁸ | − | − |
| E11 | e + → CH3 + H | 2.12 × 10⁻⁸ | − | − |
| E12 | e + → CH2 + H | 4.36 × 10⁻⁸ | − | − |
| E13 | e + → CH + H | 3.12 × 10⁻⁸ | − | − |
| Electron–Impact Dissociation | ||||
| E14 | e + CH4 → e + CH3 + H | 6.17 × 10⁻¹⁶ | − | − |
| E15 | e + CH4 → e + CH2 + H2 | 1.08 × 10⁻¹⁶ | − | − |
| E16 | e + CH4 → e + CH + H2 + H | 1.87 × 10⁻¹⁸ | − | − |
| E17 | e + CH4 → e + C + 2H2 | 3.62 × 10⁻²⁰ | − | − |
| E18 | e + H2 → 2H + e | 1.07 × 10⁻¹⁴ | − | − |
| Gas–Phase Reactions | ||||
| R1 | 2H + H2 ↔ 2H2 | 1.49 × 10⁻⁷ | −0.60 | − |
| R2 | H + CH4 ↔ CH3 + H2 | 1.10 × 10⁻¹⁵ | 1.62 | 21,542 |
| R3 | H + C2H3 ↔ H2 + C2H2 | 0.50 × 10⁻¹⁰ | − | − |
| R4 | H + C2H5 ↔ H2 + C2H4 | 0.33 × 10⁻¹¹ | − | − |
| R5 | H + C2H6 ↔ C2H5 + H2 | 1.91 × 10⁻¹⁶ | 1.90 | 14,964 |
| R6 | H + C2H4 ↔ C2H3 + H2 | 0.22 × 10⁻¹⁷ | 2.53 | 12,240 |
| R7 | CH + H2 ↔ H + CH2 | 6.64 × 10⁻¹¹ | − | − |
| R8 | CH2 + H2 ↔ H + CH3 | 9.96 × 10⁻¹¹ | − | − |
| R9 | 2CH2 ↔ H2 + C2H2 | 1.79 × 10⁻¹⁰ | − | 6180 |
| R10 | CH + CH4 ↔ H + C2H4 | 8.30 × 10⁻¹⁹ | 2.0 | 14,368 |
| R11 | CH2 + CH3 ↔ H + C2H4 | 2.66 × 10⁻⁹ | − | 23,735 |
| R12 | CH + CH2 ↔ H + C2H2 | 6.64 × 10⁻¹¹ | − | − |
| R13 | CH3 + CH3 ↔ C2H6 | 4.65 × 10⁻¹⁰ | −0.37 | − |
© 2020 by the authors. Licensee MDPI, Basel, Switzerland. This article is an open access article distributed under the terms and conditions of the Creative Commons Attribution (CC BY) license (http://creativecommons.org/licenses/by/4.0/).
Share and Cite
Giorgi, M.G.D.; Ficarella, A.; Fontanarosa, D.; Pescini, E.; Suma, A. Investigation of the Effects of Plasma Discharges on Methane Decomposition for Combustion Enhancement of a Lean Flame. Energies 2020, 13, 1452. https://doi.org/10.3390/en13061452
Giorgi MGD, Ficarella A, Fontanarosa D, Pescini E, Suma A. Investigation of the Effects of Plasma Discharges on Methane Decomposition for Combustion Enhancement of a Lean Flame. Energies. 2020; 13(6):1452. https://doi.org/10.3390/en13061452
Chicago/Turabian StyleGiorgi, Maria Grazia De, Antonio Ficarella, Donato Fontanarosa, Elisa Pescini, and Antonio Suma. 2020. "Investigation of the Effects of Plasma Discharges on Methane Decomposition for Combustion Enhancement of a Lean Flame" Energies 13, no. 6: 1452. https://doi.org/10.3390/en13061452