Development and Performance Assessment of Prefabricated Insulation Elements for Deep Energy Renovation of Apartment Buildings


Department of Civil Engineering and Architecture, Nearly Zero Energy Buildings Research Group, Tallinn University of Technology, 19086 Tallinn, Estonia
*
Author to whom correspondence should be addressed.
Energies 2020, 13(7), 1709; https://doi.org/10.3390/en13071709
Submission received: 12 March 2020
/
Revised: 31 March 2020
/
Accepted: 2 April 2020
/
Published: 3 April 2020
(This article belongs to the Special Issue Energy Performance of Buildings)
Abstract
:A need for the refurbishment and renewal of the existing building stock has been in focus for many decades, principally because of excessive global energy consumption and pollution. This paper presents a methodology and the results of analysis of choices of realizable sets of timber frame prefabricated insulation elements for major renovation of apartment buildings. Numerous combinations of elements with different characteristics were analyzed by applying measurements, interviews, and building performance simulation software, and thereupon their performance, installation eligibility, and concurrent cost levels were compared. Mineral wool board with a special wind barrier facing was found to be the best material as a wind barrier from the perspective of hygrothermal performance. An air and vapor barrier should have sufficient vapor permeability to allow dry-out of constructional moisture. It is possible to renovate apartment buildings to meet the nZEB energy performance requirements and their moisture safety can be guaranteed without paying high relative difference cost. Calculations showed that the global cost was lower for solutions with some mold growth risk. Great care is needed when decreasing costs without simultaneous hygrothermal analyses. The facade cladding was found to have the highest influence on the initial cost of the prefabricated insulation element.

1. Introduction
If the building materials and structural elements are nearing the end of their service life and the energy performance of the building needs to be improved, the owner of the building has to take measures required to ensure that the relevant criteria are met. As in Europe, more than 70% of the residential buildings are over 30 years old and about 35% are more than 50 years old, complete technical improvement of their condition has been receiving increasing attention [1,2]. Energy performance of building directive (EPBD) [3] requires all new buildings to be nearly Zero Energy Buildings (nZEB) as of the year 2020 and to renovate almost all buildings by the year 2050. Due to the reduction of energy use during the lifetime of buildings, renovation resulted in a reduction of global warming potential [4]. Case studies have shown the viability of the nZEB renovation measures to improve the condition of residential building stock in Croatia [5], Spain [6,7], Poland [8], and the Mediterranean climate [9]. The outcomes show huge potential energy and economic savings and support deep energy renovation needs [10,11].
In the cold climate, additional thermal insulation is always needed to radically improve the energy performance of buildings. To fulfill future nZEB requirements, the building envelope should be more highly insulated than buildings designed some years ago [12]. A highly insulated building envelope is an inevitable prerequisite for nZEB renovation in all climates. López-Ochoa [13] analyzed the energy, environmental, and economic impacts of the energy renovation of thermal envelopes and optimized the insulation thickness to be added to the walls, roofs, and first floor.
A highly insulated building envelope requires thoroughgoing hygrothermal analysis to avoid moisture damage [14,15]. Therefore, in the design of nZEB renovation, hygrothermal performance of the building envelope and sustainability should also be analyzed [16] and considered as an important selection criteria. On the other hand, too many selection criteria makes analysis difficult [17] for practitioners and consultants. Qi [18] showed that quality control during the renovation preparation stage is critical to ensure that quality failures are reduced in numbers and severity. In the changing climate conditions, it means that the market participants must find efficient ways to improve the quality of design and installation to meet increasing requirements of energy and hygrothermal performance of new and existing buildings.
La Fleur et al. [19] showed that the cost of the demolition and construction of a new building is higher compared to energy renovation to the same energy performance. This makes renovation the first choice, when there exists need for residences in that region. The cost of renovation is an important criteria for decision making and determining renovation solutions. Gustafsson [20] analyzed energy renovation measures in Sweden and showed that all renovation measures resulted in an increased life cycle cost (LCC), compared to the reference building. Firląg et al. [8] analyzed nZEB solutions for heating dominated climate and showed that nZEB renovation is not yet cost optimal in Poland. Patiño-Cambeiro et al. [7] analyzed nZEB renovation solutions for Spanish building stock and showed that more active financial support, together with the dissemination of the technical requirements and the benefits obtained from energy renovations are needed. Hu [21] indicated that in the optimum scenario, investing in energy-efficient retrofitting and renewable energy, when combined, produced close to a 90% reduction in the life cycle cost compared to the pre-renovation state. Kuusk [22] showed that for a concrete large panel apartment building in Estonia, additional insulation of 200–300 mm to the external wall leads to the greatest reduction in the global cost and primary energy use and that to reach the nZEB level, thermal transmittance of the external wall should be U ≤ 0.15 W/(m²·K) [23]. Hirvonen et al. [24] showed that improving the building envelope is an effective way to reduce emissions of detached houses in Finland.
Fotiou [25] showed that the achievement of ambitious energy-efficiency targets in the long-term heavily depends on pursuing a fast and extensive renovation of existing buildings. External thermal insulation composite systems (ETICS) have been used for decades on masonry, concrete, and other substrates. ETICS primarily fulfill the functions of thermal insulation and protect the building against the influences of weather. Many authors [26,27,28] have pointed out that as to ETICS, durability issues, including the degradation of the surface and aging of the materials, are the most urgent ones. Installation of timber (or other similar) frames, filled in between with insulation layers and covered by wind and weather protective facade layers, to the external envelope manually on the building site is another common method for energy refurbishment as well as for building extensions. Both methods are based on onsite field work, accompanied by long-lasting manual labor, low efficiency, and use of scaffolding on the external envelope. Because of unpredictable weather conditions and varying quality of installation the results obtained are not always in agreement with expectations [29]. Therefore, the building owners, construction companies, and other market participants are in search of alternatives to improve the quality of the existing building stock by means of prefabrication and by lesser disturbance to a building’s occupants.
An innovative method of renovation is the application of prefabricated renovation elements, which has the potential to reduce costs and renovation time, lower disturbance for inhabitants, and enhance quality and performance in terms of energy efficiency and indoor climate [30,31,32]. The recent research on technical, financial and social barriers and challenges in deep renovation of buildings points out that the main barriers are not related to specific technical problems but are due to insufficient deep renovation and nZEB knowledge, in the case of both building owners (i.e., awareness and commitment) and designers (i.e., managing properly the design and construction process in order to guarantee the expected performance and targets set) [33,34].
The literature review and described hereinbefore projects reveal that many development programs have focused primarily on energy and cost-effectiveness with a commitment to develop state-of-the-art implementation of prefabricated insulation elements for deep energy renovation. However, most of them have not analyzed (or reported the results of) the hygrothermal performance associated with the original building envelope and its condition. The current study combines hygrothermal and energy performance analysis with cost-efficiency calculations to find a suitable solution for nZEB renovation of apartment buildings with prefabricated wall insulation elements.
2. Methods
2.1. Analyzed Building Envelope Construction Types
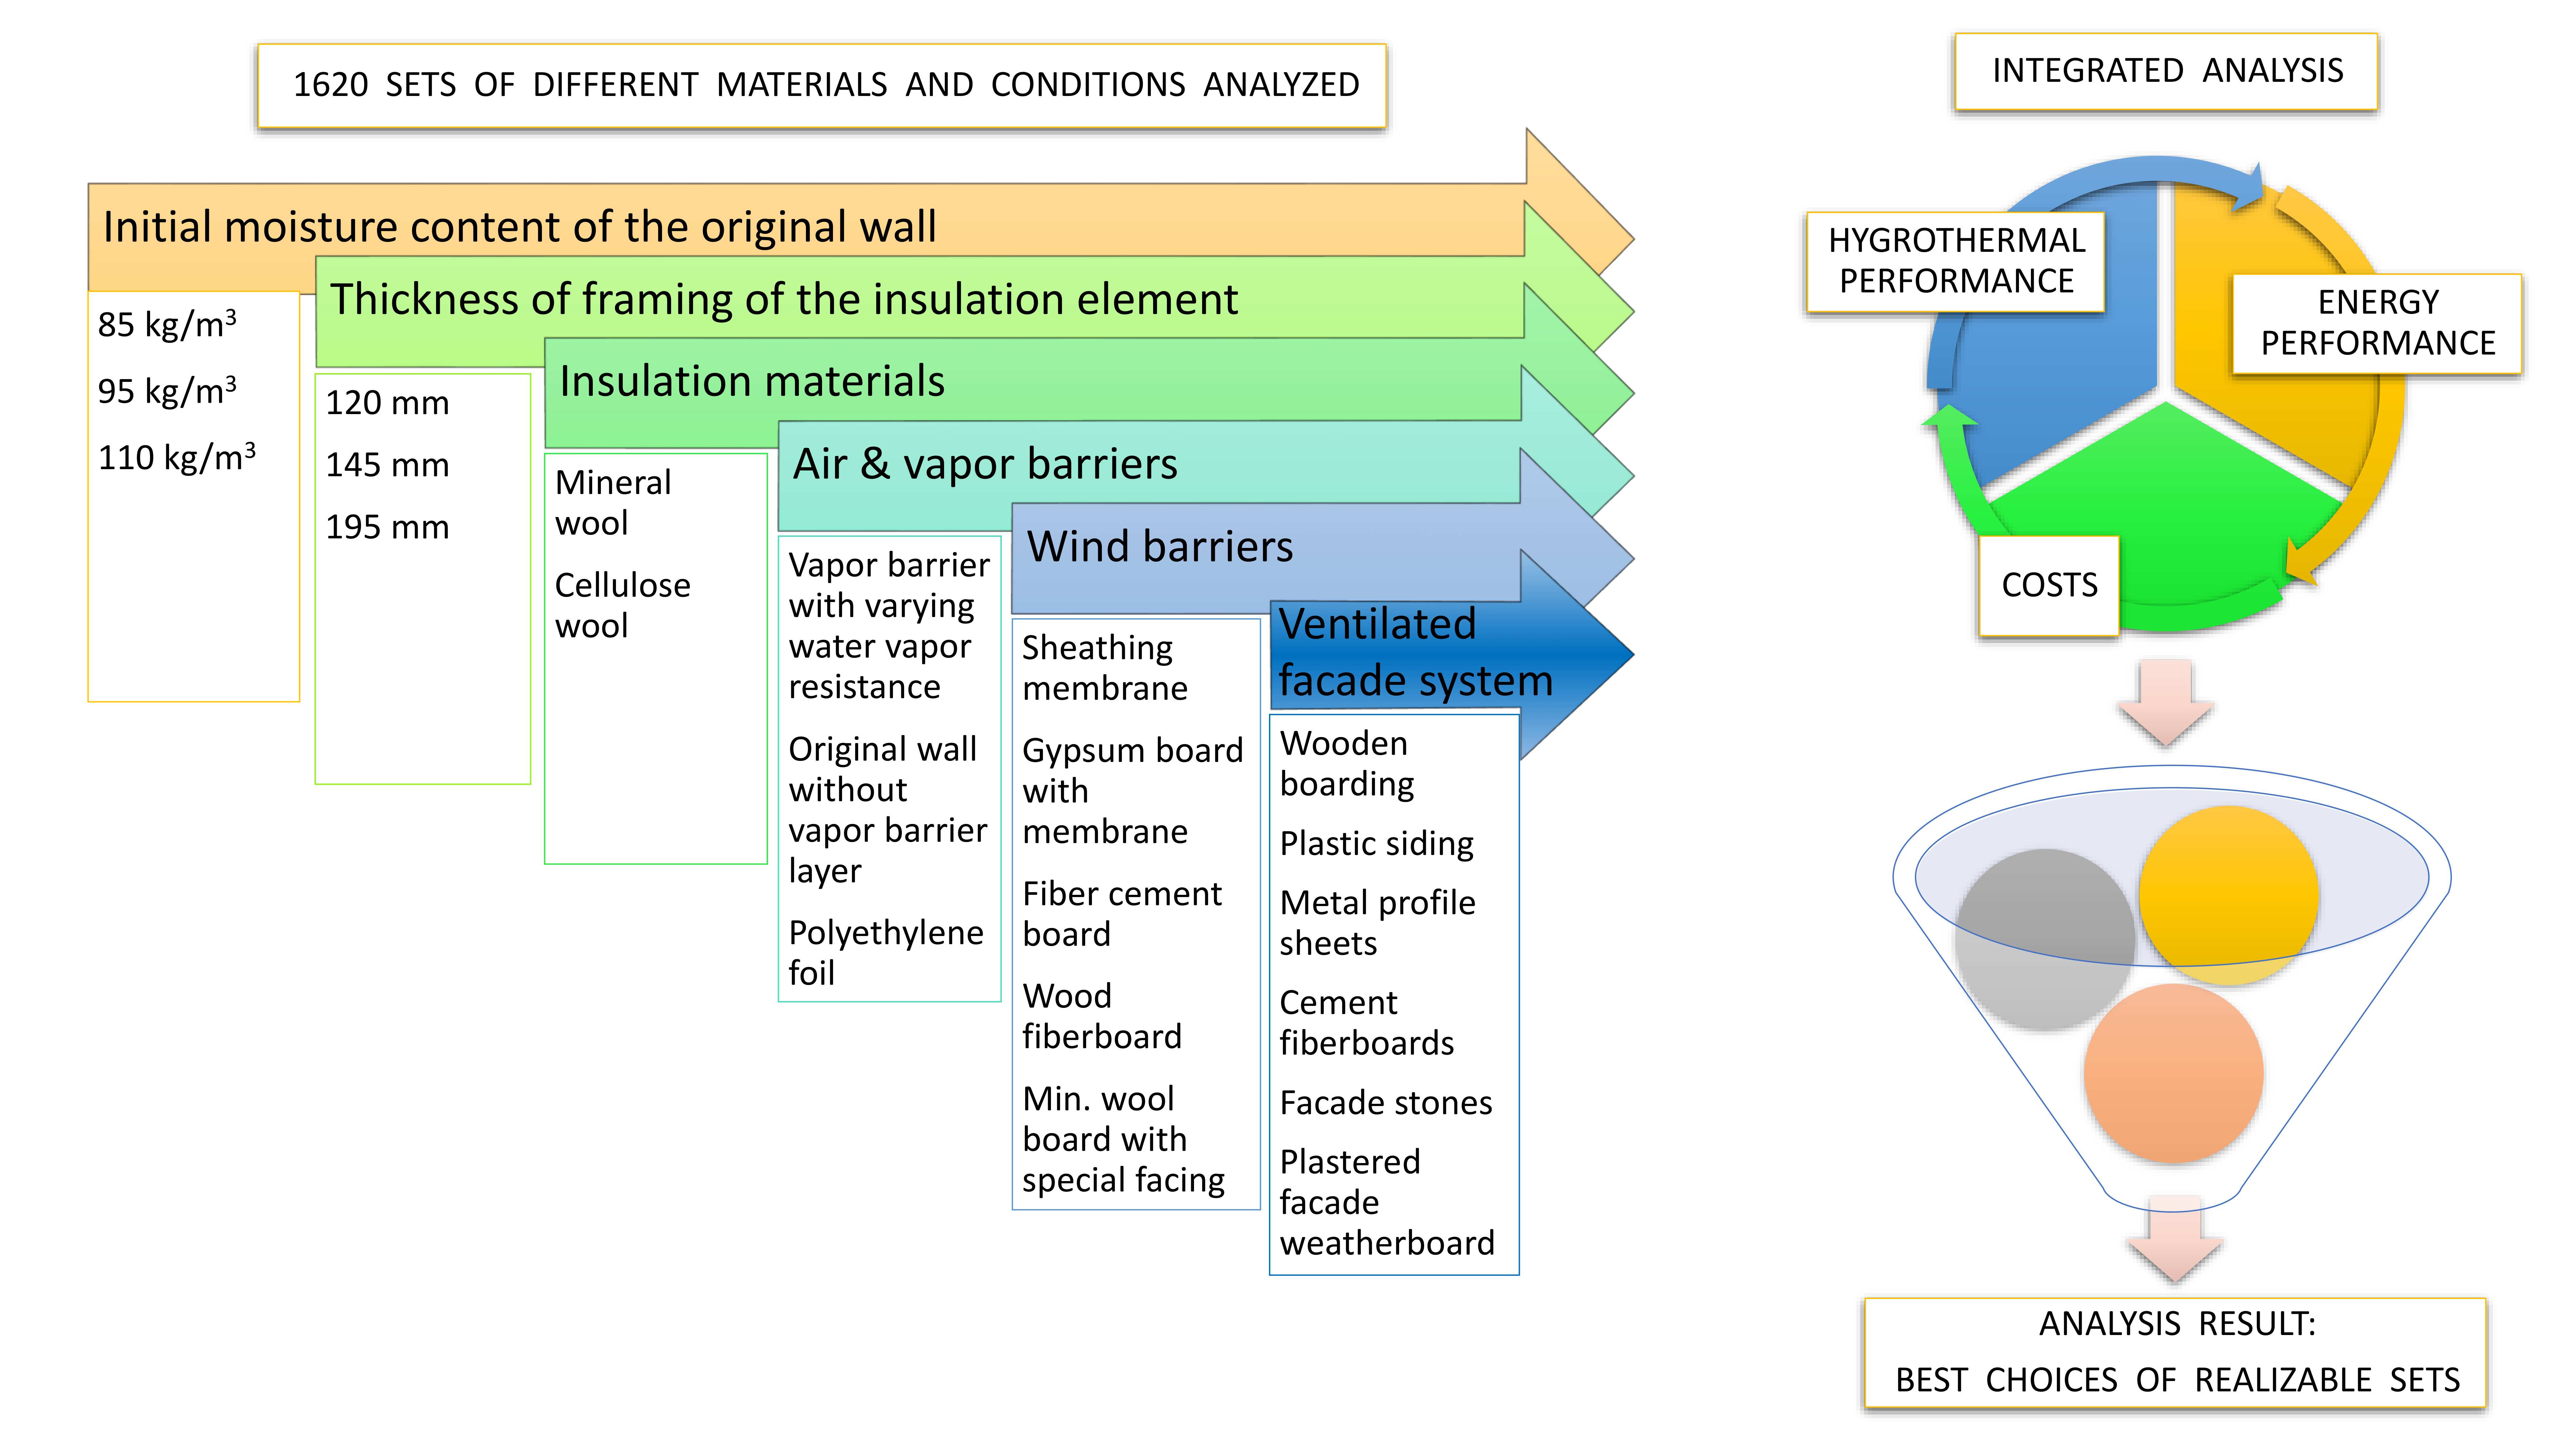
In total, 1620 dimensional, conditional, and material combinations of prefabricated timber frame insulation elements were analyzed (see Figure 1 and Table 1). The cost (including production, installation, maintenance, and energy use), hygrothermal performance, and handling on installation were evaluated by considering the interaction of various parameters:
- Initial moisture content (IMC) of original concrete facade by volume: w = 85 kg/m3, 95 kg/m3, 110 kg/m3 (i.e., IMC by mass (kg/kg): u = 3.7%, 4.1%, 4.7%);
- Air and vapor barriers (see Figure 1, layer B): vapor barrier with varying water vapor resistance, original wall without vapor barrier layer, polyethylene (PE) foil;
- Timber framing (see Figure 1, layer C): 45 mm × 120 mm, 45 mm × 145 mm, 45 mm × 195 mm;
- Wind barriers (see Figure 1, layer D): sheathing membrane, gypsum board + sheathing membrane, fiber cement board, wood fiberboard, MW board with special wind barrier facing;
- Ventilated air gap with vertical timber battens (see Figure 1, layer E) 28 mm × 70 mm;
- Facade systems (see Figure 1, layer F): wooden boarding, plastic boarding/siding, metal profile sheets, cement fiberboards, facade stones cladding, plastered facade weatherboard.
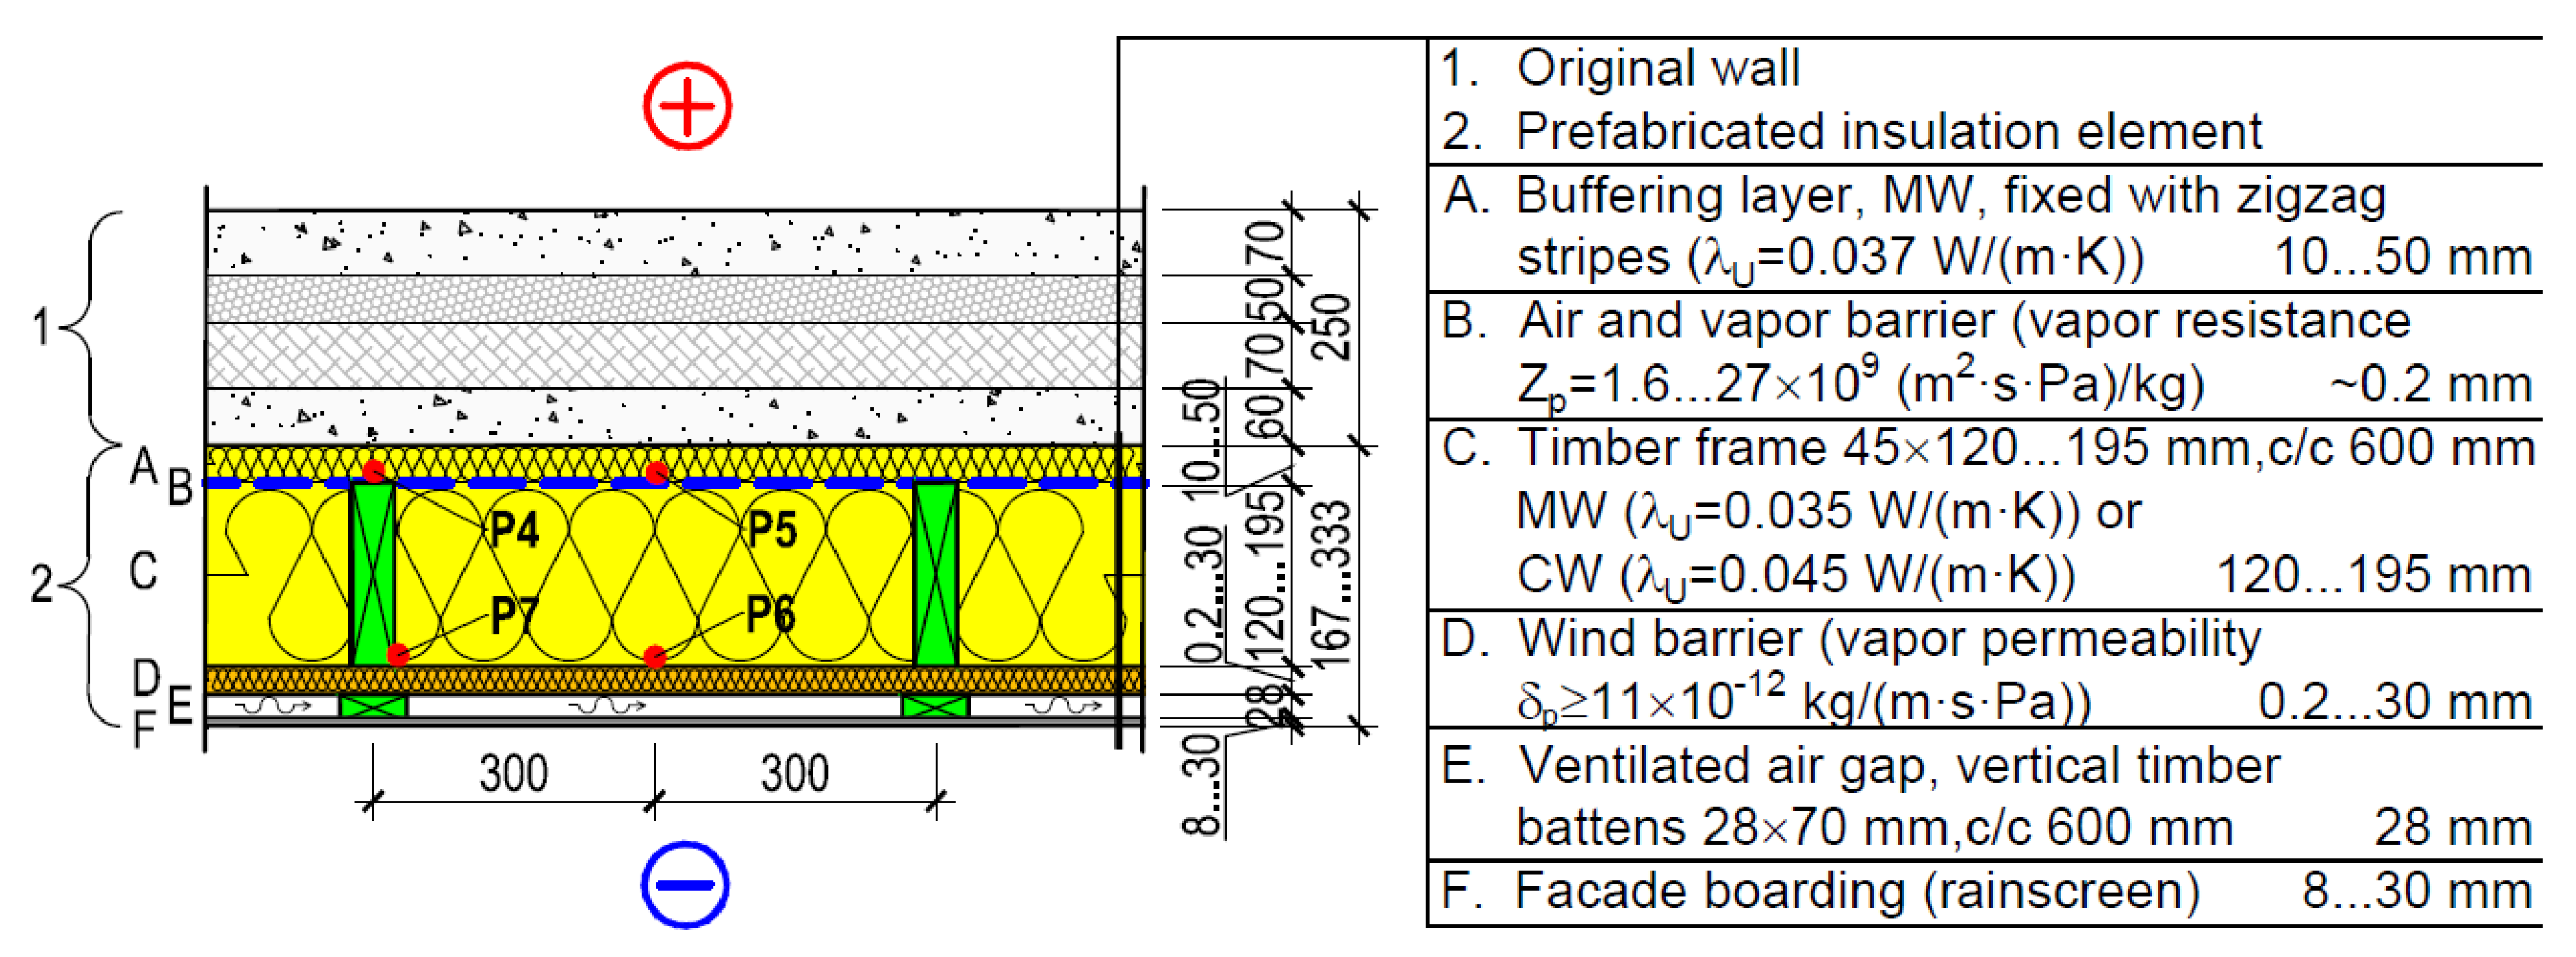
The materials of the designed and studied structures are described in Figure 1 and in Table 1. Thermal transmittances of the studied structures are shown in Table 2. Analyzed in prefabricated elements layers of materials are marked with letters A to F. Alternatives of the air and vapor barrier layer are marked with B1 to B3. Alternatives of the insulation layer are marked with C1 and C2. Alternatives of the wind barrier layer are marked with D1 to D5. Alternatives of the facade materials are marked with F1 to F6.
The structure of the prefabricated insulation element is based on timber frames (c/c 600 mm) with different thicknesses (see Figure 1, layer C, 120–195 mm), where air and vapor tightness from the inner side has to be guaranteed with an air and vapor barrier layer (see Figure 1, layer B) or by other means with original wall treatment and from the external side covered with a wind barrier layer (see Figure 1, layer D). The main insulation layer (see Figure 1, layer C) of the element consists of MW with density ρ = 22 kg/m3 or CW with density ρ = 70 kg/m3. To minimize convection in between the structures and to compensate the roughness of the original wall, 50 mm MW (ρ = 20 kg/m3) as the buffer layer was added onto the back side of the prefabricated element (see Figure 1, layer A). The buffering layer is fixed in zigzag with strings, which are released after the element is installed. The buffering layer and all other layers of insulation are installed in the factory and are protected with plastic foil against weather damage during transport and on the building site. In hygrothermal analysis all sets installed are considered to be airtight and the wall elements covered with weatherproof facade boarding, thus not affected by wind-driven rain.
2.2. Reference Building
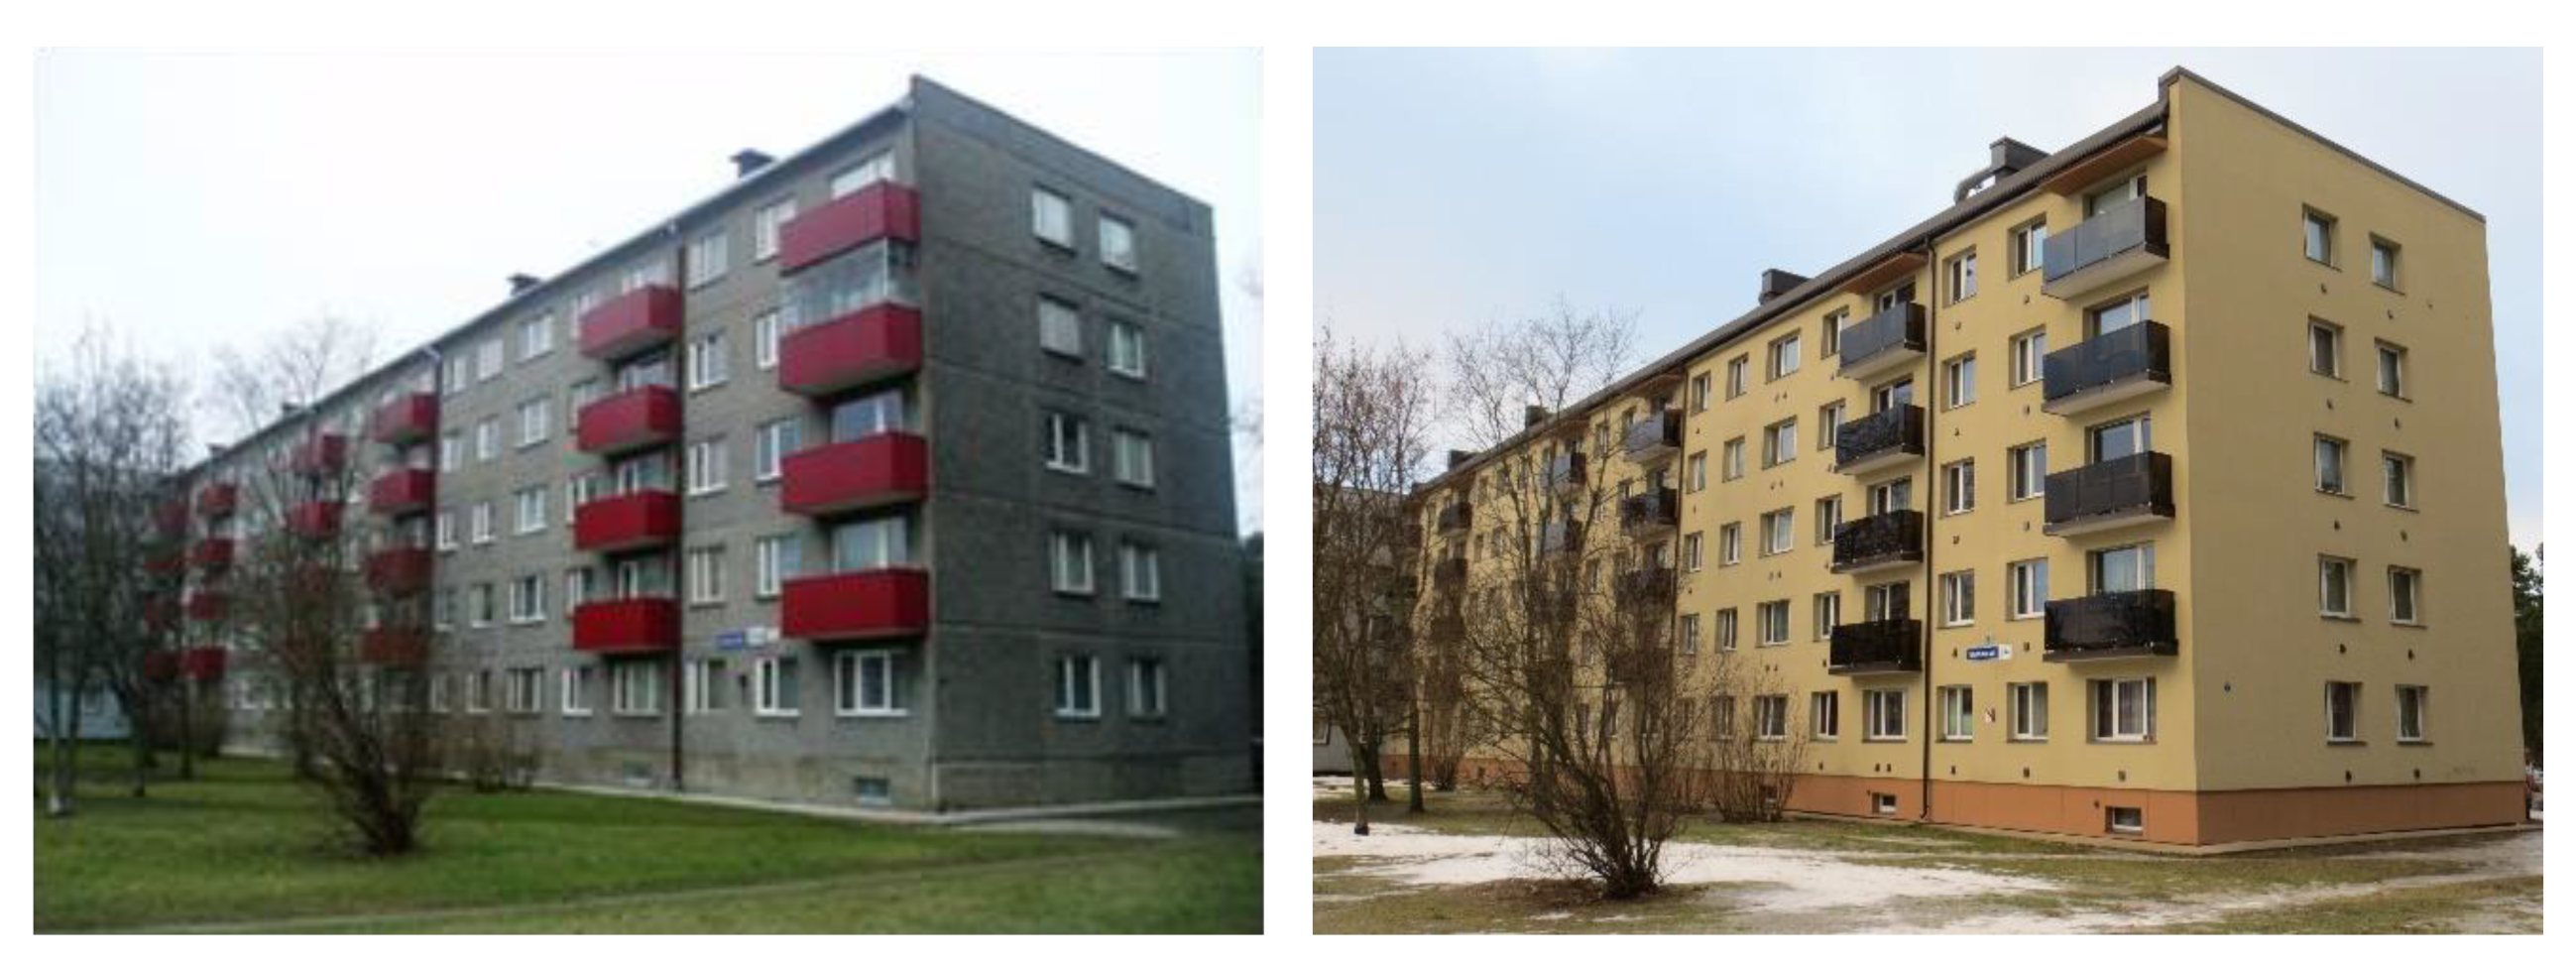
A typical five-story apartment building with a total heated area of 2968 m2, constructed of prefabricated concrete large panel elements in 1966 (serial project 1–464), was selected for the reference building (see Figure 2). Prefabricated concrete large panel apartment buildings were typical and built in Eastern Europe during the 1960–1990s. For example, 2 million m² of prefabricated concrete large panel apartment buildings was built during that period in Estonia and 4.7 million m² in Vilnius, Lithuania [37]. This building type needs deep energy renovation because of serious thermal bridges [38], high thermal transmittance of the external walls (Uwall = 0.8–1.5 W/(m2∙K)), insufficient performance of ventilation [39], high indoor humidity loads [40], and corrosion damages of concrete facades [41].
2.3. Hygrothermal Performance of Exterior Wall: Measurements and Simulations
Hygrothermal simulations with the software Delphin [35,36] were conducted to analyze the performance of the external walls on the basis of values of temperature and relative humidity in critical points (see Figure 1, points P4, P5, P6, P7). Delphin is a simulation program for coupled heat, moisture and matter transport in porous building materials and it is used for different applications, e.g., calculation of mold growth risks with consideration of climate impacts, structure conditions and materials modelling. The moisture mass balance is expressed according to Equation (1):
where is moisture density in reference volume (liquid water + vapor + ice) (kg/m3), is moisture sources/sinks in reference volume (kg/m3∙s), jconv is convective flux (kg/m2∙s), jdiff is diffusive flux (kg/m2∙s), m is mass, v is vapor, w is water, and i is ice. The energy balance is expressed according to Equation (2):
where is the internal energy density in reference volume (J/m3), is energy sources and sinks in reference volume (W/m3), is heat conduction (W/m2), jconv is convective flux (kg/m2∙s), jdiff is diffusive flux (kg/m2∙s), m is mass, g is gas, v is vapor, l is liquid, u is specific internal energy (J/kg), hv is the specific enthalpy of water vapor (J/kg), hvoc,g is the specific enthalpy of gaseous volatile organic compounds (J/kg).
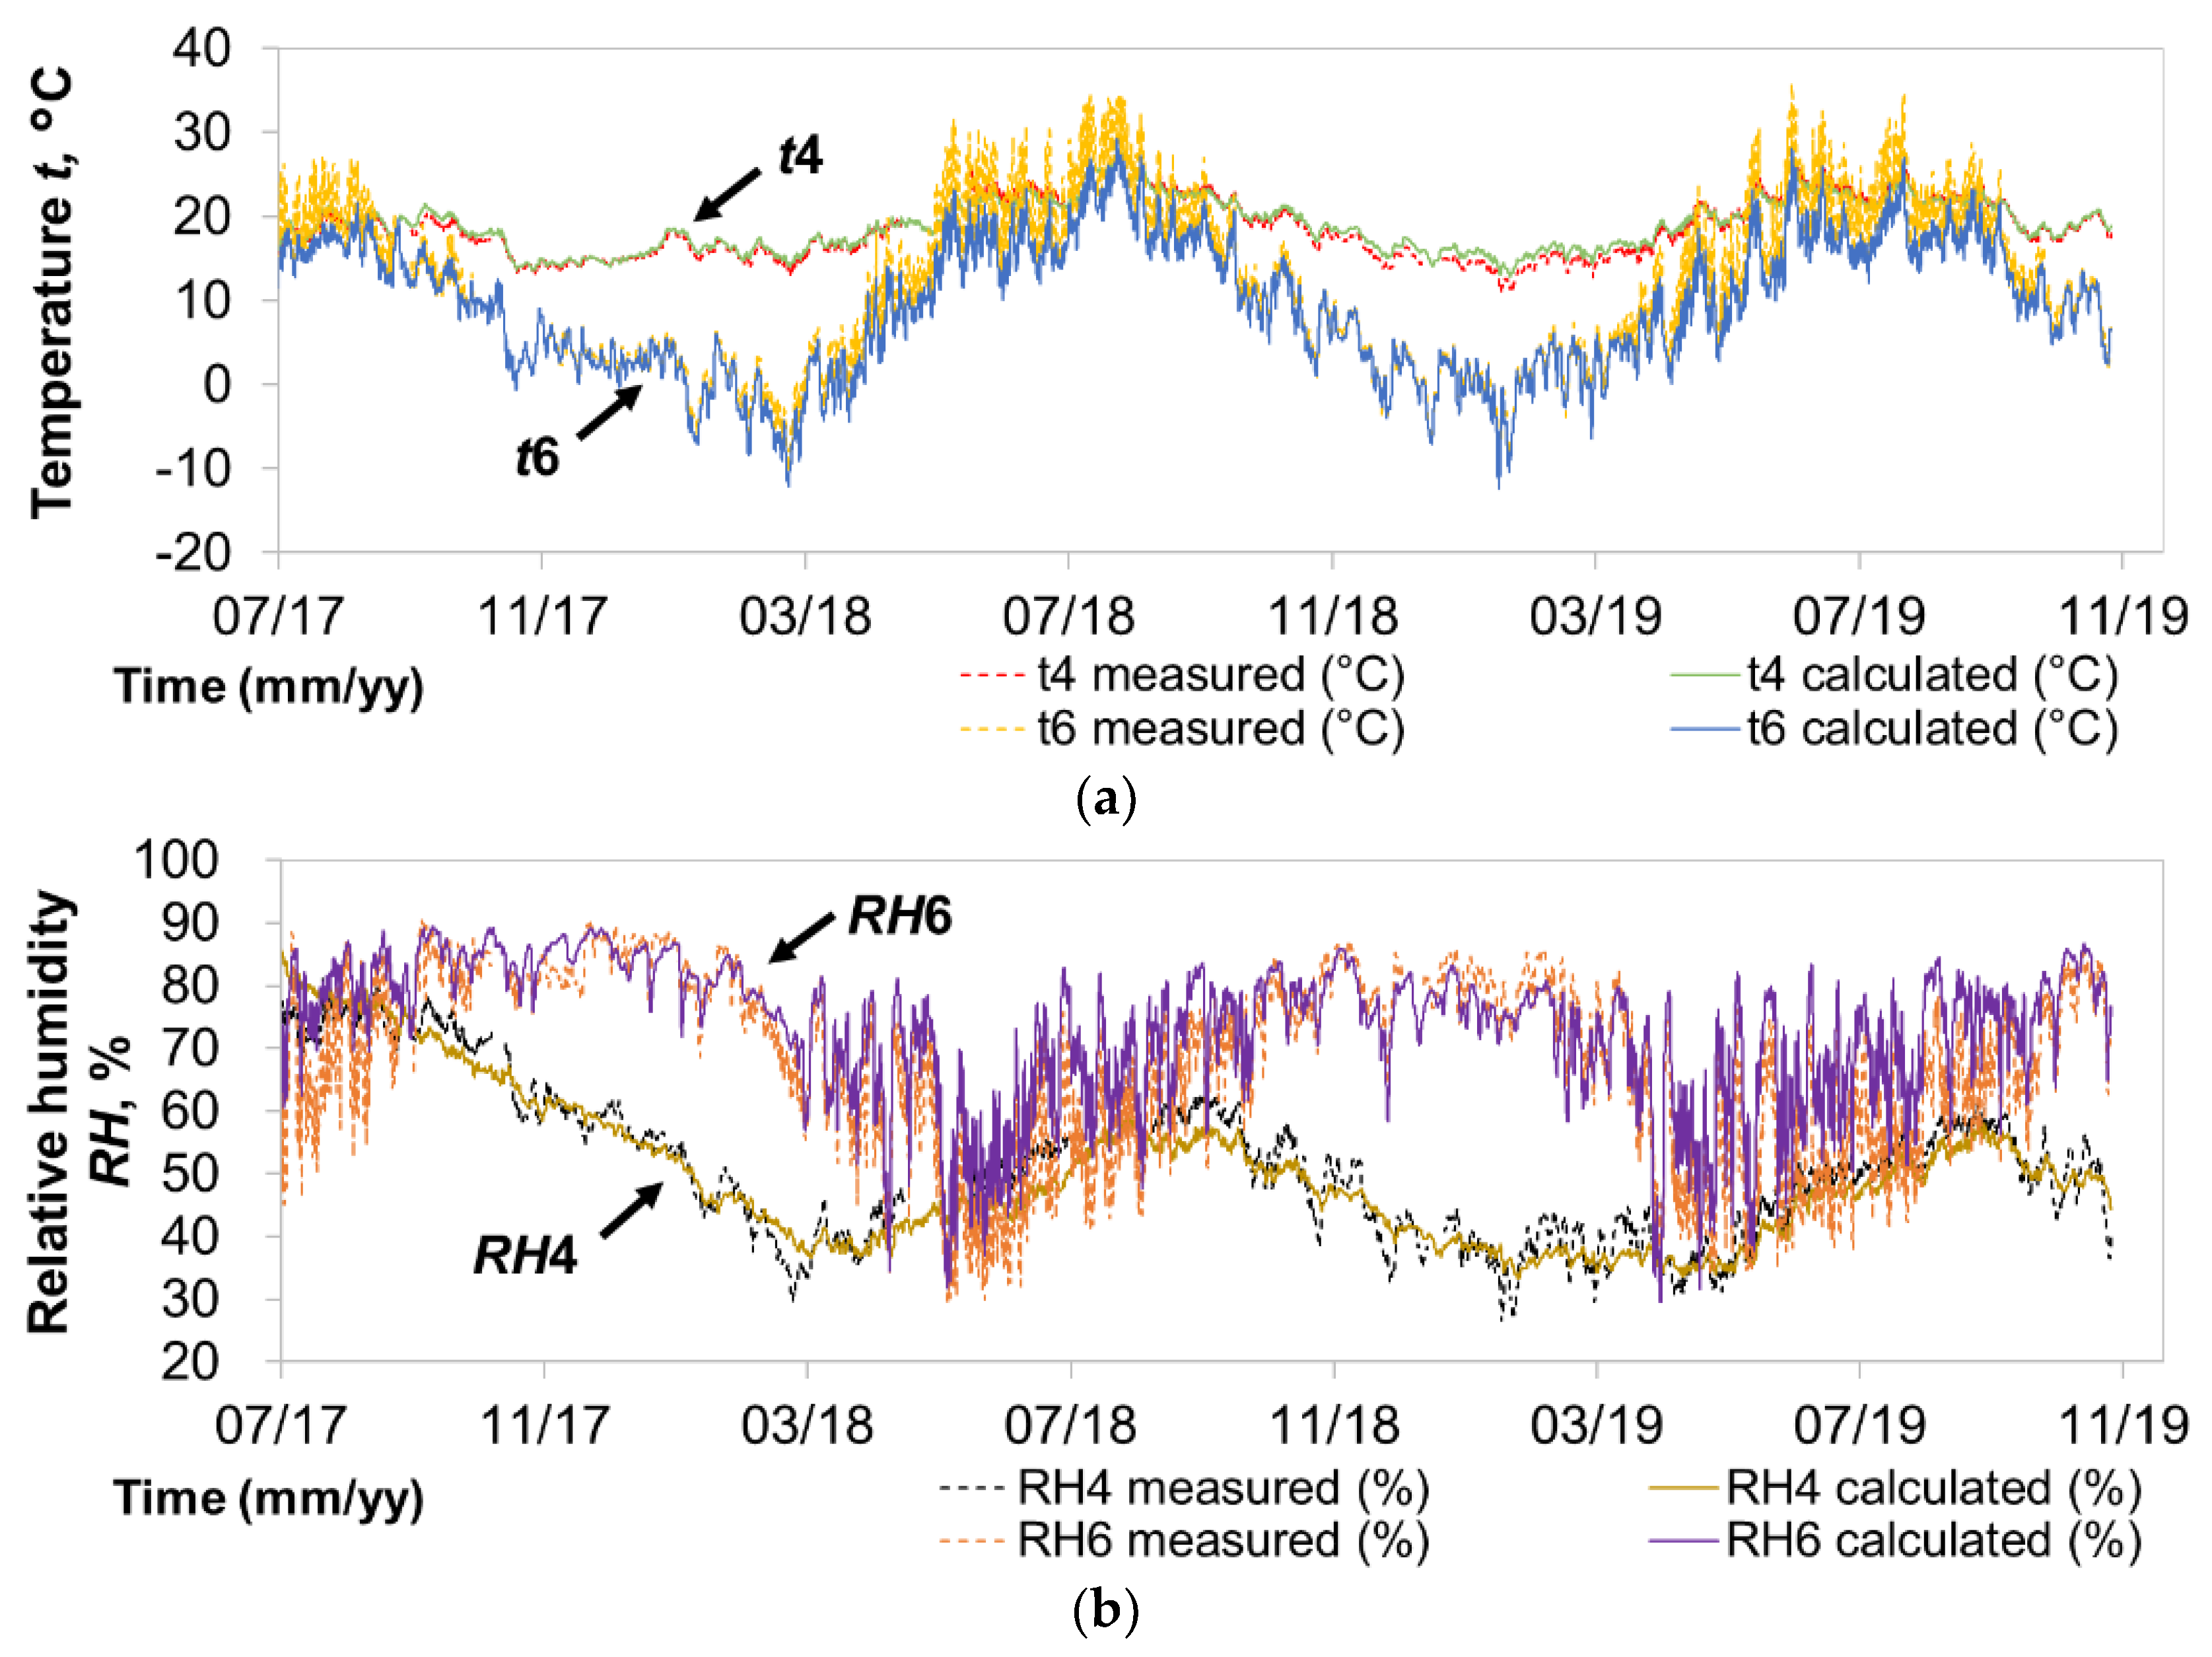
To calibrate the calculation model in Delphin software program, field measurements were conducted in a concrete large panel apartment building renovated in 2017 by using prefabricated timber frame insulation elements [42,43]. Temperature and relative humidity were measured at one-hour intervals before, during and after the renovation at different points of the external envelope with temperature and relative humidity sensors Rotronic HygroClip SC05: ∅ 5 × 51 mm, measurement range –40 to +100 °C and 0–100%, accuracy ±0.3 °C and ±2%. Air and surface temperatures were measured with HOBO TMC6-HD temperature/relative humidity/2 external channel data loggers U12-013: measurement range from –20 to +70 °C, accuracy ±0.35 °C. A good agreement between the measured data and the calculated values was achieved (see Figure 3).
2.4. Assessment of Hygrothermal Performance
To assess the hygrothermal performance of the building envelope, the risk of mold growth as criterion was used. A mathematical model for the calculation of mold growth and decline and the mold index in varying conditions [44,45] was used in this research.
According to this model, under fluctuating humidity conditions, the total exposure time for the response of growth of mold fungi is affected by the time periods of high and low humidity conditions, as well as the humidity and temperature levels. In the simulation of mold growth, it is crucial to know the lowest (threshold) levels at which fungal growth is possible on different materials. The importance of the duration of such conditions is also significant. There are certain minimum and maximum levels for the moisture content of material, water activity or temperature between which fungi can grow in wood. Under these favorable conditions, mold growth may start and continue at different rates. The time period needed for the onset of mold growth and growth intensity are mainly dependent on water activity, temperature, exposure time and surface quality of the substrate [44,45]. The boundary curve for the risk of mold growth in the range of temperature between 5 and 40 °C on a material can be described by a polynomial function, see Equation (3):
where t is temperature (°C) on the investigated material surface and RHmin represents the minimum level of relative humidity (%) at which mold growth is possible (varies according to the sensitivity of the material, see Table 3) [45].
The safe value of the mold index (M) was set in the current study at M < 1 (no mold growth) and the critical value at M = 2 (several local mold growth colonies on surface) according to the mold index model (see Table 4). Therefore, the mold index 1 ≤ M < 2 is considered as a low risk of mold growth (small amounts of mold on surface, initial stage of growth) [46]. The mold growth sensitivity class (see Table 4) ‘sensitive’ for the used timber, timber-based materials and gypsum board with paper in the installed prefabricated insulation elements and in the existing envelope was assigned for calculations. For the other materials, the class ‘medium resistant’ was set.
2.5. Climate Conditions
According to the Köppen-Geiger climate classification [47], Estonia belongs to cold (continental) humid climate with warm summers (DfB). In the assessment of hygrothermal risks, the hourly data of the moisture reference year (MRY), critical to mold growth and water vapor condensation in Estonia, was applied to outdoor climate [48]. Indoor climate measurements from Estonian dwellings [49,50] were used to determine critical indoor hygrothermal conditions. For simulations, the following conditions were used: average indoor temperature, which is dependent on the outdoor temperature and indoor humidity class 3 (moisture excess 2 ≤ ∆ν ≤ 6 g/m3 depending on outdoor temperature), representing dwellings with a high humidity load and high occupancy according to the national annex of standard [51], see Figure 4.
As the hygrothermal performance of constructions is highly dependent on their moisture content [14,52], calculations of mold index with different initial moisture content levels of the original wall (w = 85 kg/m3, w = 95 kg/m3, w = 110 kg/m3) were performed to represent the critical conditions of various periods of the start of installation works of the prefabricated timber frame insulation elements onto the existing envelope at the building site.
2.6. Energy Performance
As in many countries, including Estonia, the energy performance of buildings is defined as an indicator, expressed as energy performance value (EPV) (kWh/(m2∙a)), of the total energy delivered into the building (i.e., heating, ventilation and air conditioning (HVAC) auxiliary, cooling, ventilation, domestic hot water (DHW), lighting and appliances), multiplied with conversion factors (CF) taking into account the primary energy content and the environmental impact involved (e.g., CFelectricity = 2.0, CFdistrict heating = 0.9, and CFefficient district heating = 0.65). It is mandatory to fulfill the local decrees requirements of energy performance [53,54] for new and reconstructed by major renovation buildings. The energy performance criterion for a nZEB renovation (EPV ≤ 150 kWh/(m2∙a)) and for new buildings (EPV ≤ 125 kWh/(m2∙a) without local electricity production) was taken as the basis for evaluating energy efficiency of the studied solutions. In addition to general energy performance of buildings, the Estonian renovation grant scheme [55] sets the following criteria for renovation of apartment buildings:
- Thermal transmittance of building envelope:
- o
- Uexternal wall ≤ 0.20 W/(m²·K);
- o
- Uroof ≤ 0.12 W/(m²·K);
- o
- Uwindow ≤ 1.10 W/(m²·K);
- Installation of mechanical ventilation with heat recovery (MVHR). It means centralized plate heat exchanger or apartment based (plate or rotary thermal wheels heat exchanger) balanced ventilation (efficiency ≥80%) or exhaust ventilation with heat pump (efficiency ≥60%). In simulations, MVHR with an efficiency of 75% was used;
- Full renovation of heating system. It means new insulated pipework and hydronic radiators with thermostats, DHW system and heating unit.
Energy performance of potential renovation solutions was modeled using the energy and indoor climate simulation program IDA Indoor Climate and Energy [56]. This software allows the modeling of a multi-zone building, internal and solar loads, outdoor climate, heating and ventilation systems, and dynamic simulation of heat transfer and airflows. It is validated and the building model is calibrated against field measurements [57]. Input parameters to energy performance simulation were selected according to standard use condition from the Estonian regulations [54]:
- Indoor temperature heating set point 21 °C;
- Air flow rate for apartments with apartment-based air handling units (AHU) 0.42 l/(s·m2) and apartments with central AHU 0.5 l/(s·m2). Supply air temperature 18 °C;
- Standard use of DHW: 30 kWh/(m2∙a), i.e., 516 l/(m²·a) at ΔT 50 K;
- Standard use of electricity: for appliances and lighting 29.5 kWh/(m2∙a); for circulation pumps 0.5 kWh/(m2∙a);
- Internal heat gains: occupants 15.8 kWh/(m2·a) with a usage rate 0.6 (representing average occupancy 28.3 m2 per person); appliances and equipment: 15.8 kWh/(m2·a) with usage rate 0.6; lighting 7.0 kWh/(m2·a) with a usage rate 0.1.
2.7. Cost Efficiency
The global cost calculations were applied to assess the cost effectiveness of the renovation measures [58]. The renovation cost was calculated considering financing with loan in the amount of 85% and with self-financing of 15%, which is a common practice required by banks and the renovation grant organization in Estonia for renovation projects of apartment buildings. The typical interest rate of 3% for apartment owners’ associations was applied and the escalation of the delivered energy and maintenance prices was considered 1% in a year as an average [59]. The energy prices used in calculations were 0.12 €/kWh for electricity and 0.06 €/kWh for district heating, as an average market level in 2019 in Estonia. The discount period 20 years as the longest loan period for apartment owners’ associations in Estonia was applied. Global cost was calculated according to Equation (4):
where Cg(τ) is the global cost referred to the starting year (€/m²), Ci is the initial investment cost, self-financing of a renovation loan (€), Ca,i(j) is the annual cost of year i for the component j, energy and loan payback cost (€), Rd(i) is the discount rate for year i, is the global cost of the reference building (€), and Afloor is the net floor area (m²).
To obtain the realistic costs for construction, installation and maintenance, the comprehensive cost estimations were taken as basis from three companies producing and installing prefabricated timber frame elements. The average initial cost of their offers was used in cost efficiency calculations.
3. Results
3.1. Hygrothermal Performance of Prefabricated Insulation Elements
Mold index M was calculated in critical points (see Figure 1) for all sets studied. Results are shown in Table 5 and Table 6 where the mold index M is given at the most critical points at different initial moisture content (IMC) levels of the existing original wall with installed prefabricated insulation elements.
- Numbers 4 and 6 indicate the most critical points (see Figure 1):
- o
- Point 4 – between original wall and air and vapor barrier layer;
- o
- Point 6 – between wind barrier and insulation layer of prefabricated element;
- Mold index is categorized by colors:
- o
- Green – no mold growth risk, M < 1;
- o
- Yellow – minor mold growth risk, 1 ≤ M < 2, i.e., small amounts of mold on surface (microscope), initial stage of local growth;
- o
- Red – high mold growth risk, M ≥ 2, i.e., several local mold growth colonies on surface (microscope).
Results of calculations of mold indexes show that all analyzed combinations with vapor barrier with varying vapor resistance (see Table 1, position B1) or without air and vapor barrier layer (position B2) are below the critical limit (M = 2) of mold growth risk. Minor mold growth risk (1 ≤ M < 2) is in constructions insulated with MW when a sheathing membrane (position D1) or gypsum board with a sheathing membrane (position. D2) as the wind barrier layer was applied. Also, with fiber cement board (position D3) and wood fiberboard (position D4) as wind barrier layers on higher insulation thicknesses and with the initial moisture content of the original concrete wall w ≥ 95 kg/m3 minor mold growth risk was determined. With CW some mold growth risks are noticeable with wind barriers positions D1, D2, and D3 when the initial moisture content of the original concrete wall w ≥ 95 kg/m3 and in case of higher thicknesses of insulation without an air and vapor barrier layer (position B2). All analyzed combinations with PE-foil (position B3) are beyond the critical limit of mold growth risk (M ≥ 2) and therefore cannot be used in these structures. From the perspective of hygrothermal performance, MW board of ≥30 mm thickness with a special wind barrier facing is the best choice for wind barrier.
3.2. Energy Performance
The annual energy use of the reference apartment building with a total heated area of 2968 m2 was calculated with different sets of the external wall insulation elements following criteria for renovation measures of the grant scheme [55]. The calculations were based on the IDA Indoor Climate and Energy [56] simulation program results for the reference building. The variation of total delivered energy to the renovated building with well insulated external walls is up to ±2%, see Table 7. The variation is relatively small because the building envelope is already well insulated and thus, energy for space heating is one of the smallest components of energy use.
The primary energy use depends mostly on the efficiency of district heating (the most typical heat source for apartment buildings in Estonia). After the renovation and with efficient district heating (i.e., CFefficient district heating = 0.65) the apartment building fulfills the nZEB requirements for the new buildings [53] and with the common district heating (i.e., CFdistrict heating = 0.9) the nZEB requirements for major renovation. The results obtained contain a reasonable reserve for unforeseen energy use (e.g., user’s influence), see Table 8.
3.3. Cost Analysis
The unit prices of prefabricated insulation elements include production, transport, and installation costs are seen in Table 9. The unit prices of elements with different wind barrier layers (see Table 9, positions D1–D5) are given without the prices of facade system materials. The cost of facade systems (see Table 10, positions F1–F6) is given separately with maintenance cost and maintenance interval for each facade material type (per 1 m2 of facade).
The total initial cost (production, transport, installation) of insulation elements varies between 101 and 164 €/m2. The selection of the facade system has the highest influence on the total initial cost: ±13%–15%. The selection of the wind barrier influences the total initial cost by ±5%–6% and the insulation material by ±1%.
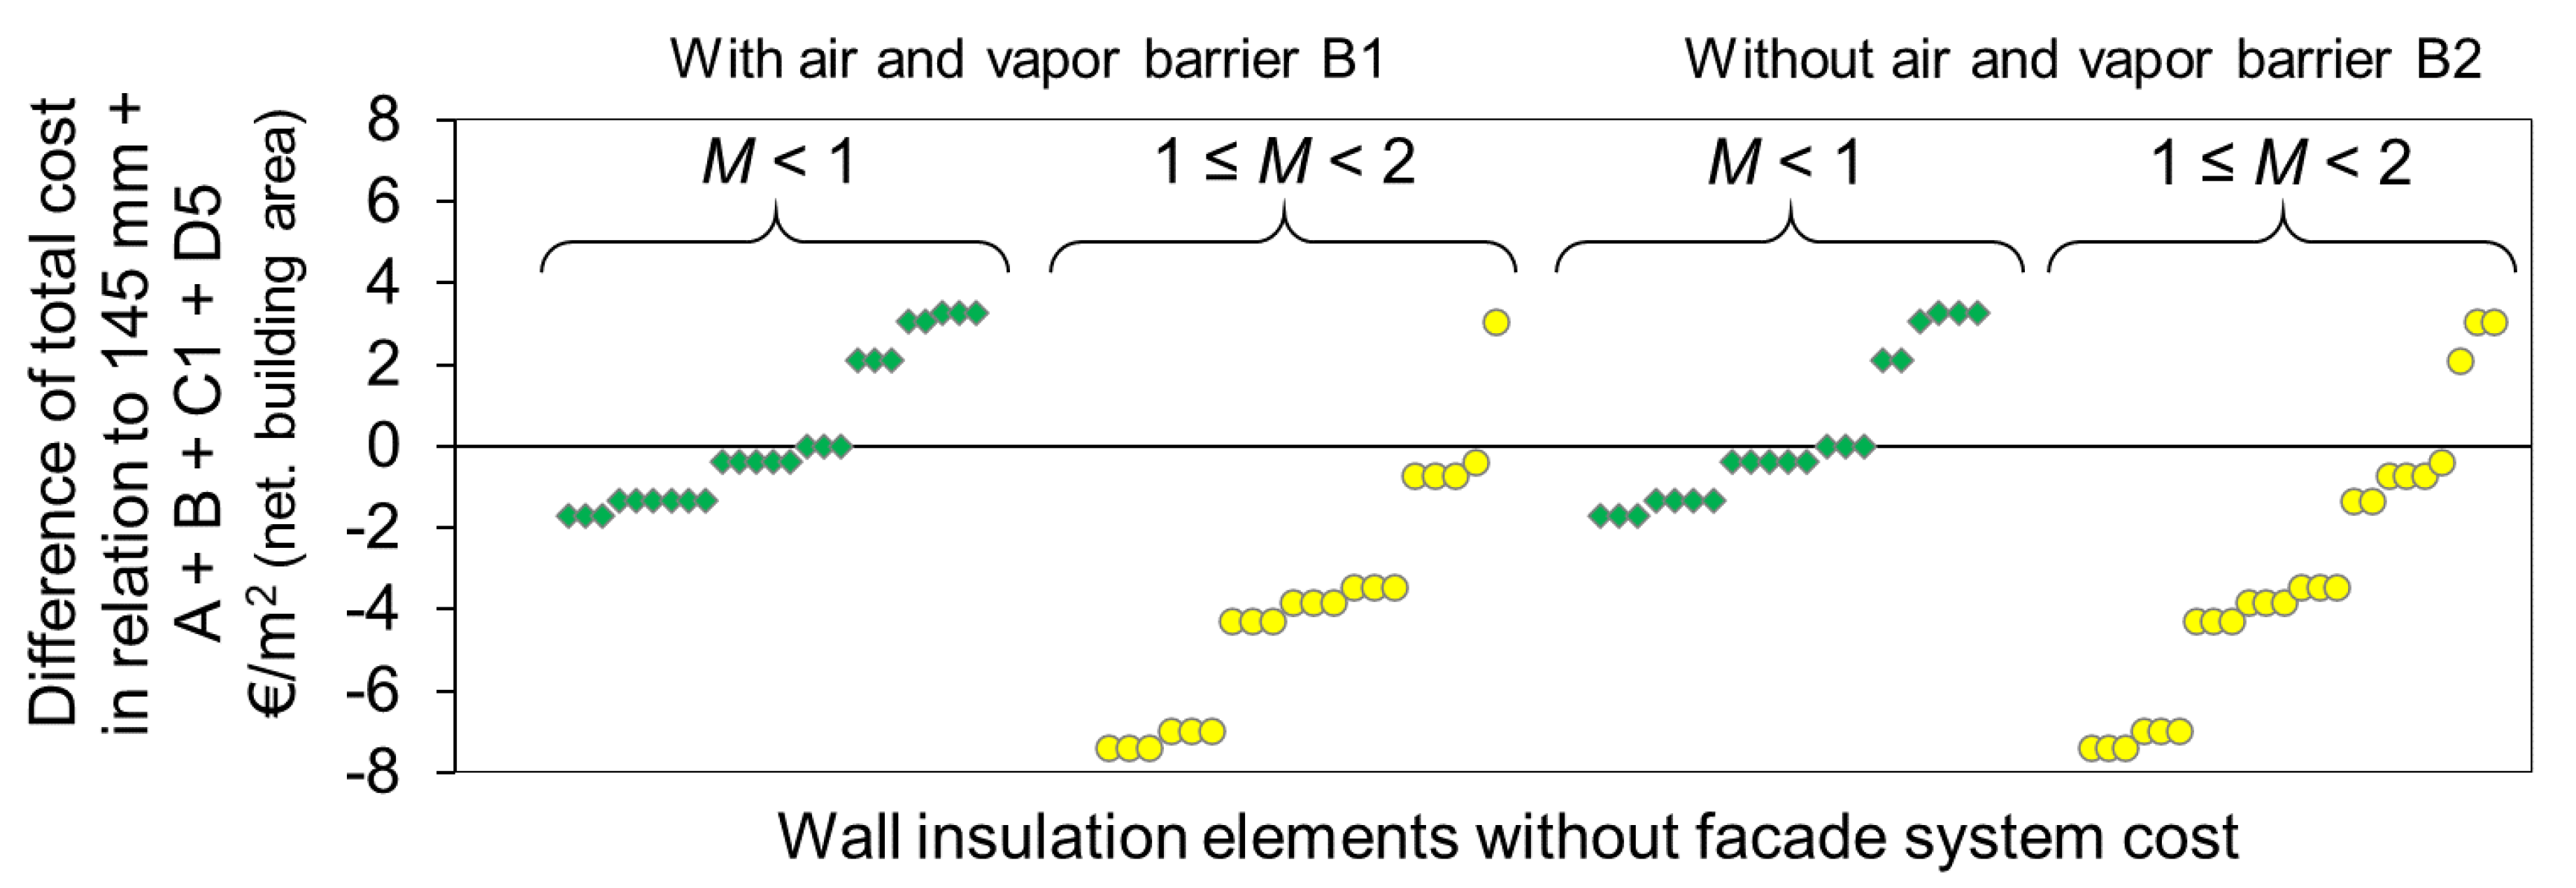
Table 11 presents the change of global cost (initial cost + energy saving + annual average maintenance during 20 years after renovation (i.e., during renovation loan payback period) divided by the building’s net heated area). As the influence of insulation materials cost was very small, Table 11 presents the results of sets with MW insulation only. Results are presented as the cost difference compared to the insulation element with 145 mm framing with 50 mm buffering insulation layer (see Table 1, position A) + air and vapor barrier (position B1) + MW insulation (position C1) + 30 mm MW wind barrier (position D5) + wooden boarding as facade system (positions E + F1). By combining moisture safety (Table 5) and total cost (Table 11) we can see that decreasing the total cost increases the risk of mold growth. Insulation elements with some mold growth risk (1 ≤ M < 2) were cheaper than solutions without mold growth (M < 1) (p < 0.0001 according to T-Test).
● Mold index is categorized by colors:
- o
- Green—no mold growth risk, M < 1;
- o
- Yellow—minor mold growth risk, 1 ≤ M < 2, i.e., small amounts of mold on surface (microscope), initial stage of local growth.
As the facade cladding does not essentially influence the mold growth risk in the critical points, at the same time having a noticeable contribution to the total cost, the cost difference was compared without the facade system in the same way as shown in Table 11. The results in Figure 5 indicate that combinations with lower cost pose relatively higher mold growth risk.
3.4. Installation and Handling Analysis
Ideas of energy renovation of old apartment buildings to the nZEB level [42,43] and answers to interviews with production companies, installation contractors, as well observations of analysis of renovation prospects with prefabricated elements, point out the most relevant problems and give guidelines for future research and development.
Accuracy of predesign and pre-installation measurements (e.g., geodesy, point-cloud, and 3D model) are crucial for a streamlined production and installation of elements because these reveal all possible deviations of openings and roughness of the original wall surface in all directions. The design of and construction works at the pilot building verified the importance of precise data about envelope roughness because the surface deviations both in vertical and horizontal directions were up to ±50 mm. Therefore, designed hanging brackets for elements should have an adjustable clearance allowing regulation of the elements in all directions during the installation to minimize the risk of time-consuming remounting of brackets in case of measurement inaccuracies.
The buffering layer has to be a light and compressible (flexible) material (e.g., MW, ρ < 20 kg/m3) allowing the element to be safely pressed towards the uneven original surface and to be fixed to the load-bearing brackets while it hangs on the crane hooks and workers are standing in the high forklift basket. On the pilot building it was clearly seen that in some places the installers had quite some difficulties with pressing the element tightly to the original surface because of the variations of the surface level. Lighter MW as the buffering layer and brackets with greater adjustment clearance could help out.
Water and air tightness of horizontal joists between the elements was difficult and time-consuming to achieve as the elements are supported on a wall by each intermediate floor. Fastening of elements in the vertical direction is safer and allows designing and finishing larger gaps between elements. However, in this case, the mistakes from construction tolerances are transmitted and large differences in sizes can occur because of the existing wall roughness and irregularity.
Use of a traverse for lifting long and heavy elements by crane helps to avoid bending out or breaking an element but it can be impeded if the building has roof eaves stepping out of the wall perimeter. In that case, a forklift with a special lifting and supporting frame could be a solution. Or else, the solution could be to remove part of the roof and eaves temporarily. However, this is again an additional risk of rainwater overflow and moisture damage during construction works and needs an extra investment to prepare and remount the roofing.
Use of continual protective tarpaulins or tents on the existing envelope is obstructed because the crane or forklift must have access to wall surfaces to lift and fix the elements. Prefabricated elements must be packed to a protective foil firmly already at the factory so as to ensure their safe transport and installation without moisture impairments. The protective foil has to be removed only after the element is installed.
These are the important aspects of moisture safety and building technology that have to be analyzed, explained, and agreed upon in the contracting phase and controlled by a moisture safety expert and the owner’s surveillance engineer during the installation works.
4. Discussion
The research task was to find among results obtained combinations that are most consistent with requirements of the nZEB renovation (new buildings and major renovation), considering possible hygrothermal risks and costs. Earlier studies [60,61,62] confirm that for deep renovation of existing external envelopes the most proper solutions are with insulation layers with low water vapor resistance (both for main insulation and wind barrier layers) and vapor barriers/retarders with varying vapor resistance capability. Solutions where the vapor resistance of the outer layer is higher and with a lower thermal resistance (e.g., sheathing membrane, strand board, or gypsum board) compared to MW or CW may cause excess humidity accumulation, which in turn might cause a higher mold growth risk with envelope degradation. It was concluded hereinbefore that in addition to energy performance it is necessary to pay special attention to moisture safety measures in the design and building processes of highly insulated buildings.
High thermal resistance and water vapor permeability of the wind barrier are key components of a well-functioning building envelope. This is validated by the results of calculations of mold index indicating a rise of mold growth risk with increasing vapor resistance of the outer layer of elements (e.g., sheathing membrane vs. MW board) and with greater insulation thickness (i.e., with the decrease of temperature and the corresponding increase of RH in external layers of the structure). Nevertheless, cement fiberboard gave better results in some cases compared to wood fiberboard wind barrier (although it has lower water vapor permeability and thermal resistance) because of its larger mold tolerant surface. Comparison of the use of MW and CW showed that owing to the relatively high moisture buffering capacity of CW, constructions insulated with it can withstand much higher moisture loads without substantial mold growth risk. It has been verified by other research as well [63]. Nevertheless, in case of greater thicknesses of insulation and lower water vapor permeability of surface layers, the risk of mold growth may rise with CW insulation as well.
In the renovation of the existing buildings with prefabricated insulation elements it is very important to take into consideration that the use of a vapor barrier layer with very high vapor resistance (e.g., PE-foil) may cause accumulation of built-in moisture between the original wall and the installed vapor-tight layer of the insulation element and lead to the condensate state there for a very long time (according to our studies, even up to 4–5 years) [52]. On the other hand, the decision to give up the use of a vapor control layer between the existing envelope and the installed element may result in moisture damage and mold growth related problems, particularly in the case of the moisture content of the original wall is close to saturation level (e.g., rainy periods in late summer or in autumn may cause the original wall’s external layer to become very wet, up to RH = 100% because of wind-driven rain) and/or when the water vapor resistance of the outer layer of an element (e.g., wind barrier) is too high to let the built-in moisture dry out as fast as necessary for satisfactory hygrothermal performance of the whole system [64]. This can be seen in Table 5 and Table 6, where combinations without a vapor barrier layer show a higher mold growth risk compared to solutions with a vapor barrier layer, particularly in the area behind the wind barrier layer. The reason here is the higher RH in critical points due to the moisture flux, which is more intensive in the structure without a vapor control layer between the original (and usually with a high content of built-in moisture) wall and the installed insulation elements.
It is very important to point out that the differences in calculated mold indexes presented are caused also by the different mold growth sensitivity classes applied for materials. Furthermore, the considered critical points were different when solutions with and without air and vapor barrier layers were compared. With air and vapor barriers (see Table 1, positions B1 and B3) the highest moisture load is in points P4 and P5 but with alternative without vapor barrier layer (see Table 1, position B2) the highest loads are in points P6 and P7 (see Figure 1 for analyzed points).
Therefore, if there are technological obstacles or other justified reasons for not to use a vapor barrier (control) layer between the original wall and the prefabricated timber frame insulation elements, it is crucial to reconsider the mold growth sensitivity class of wood or wood-/cellulose-based products with a high content of nutrients favorable for fungal growth. Because of the higher moisture flow in the absence of a vapor control layer in the direction from the original wall towards the prefabricated timber frame element, in the case of the use of untreated wood (e.g., not planed, pine or spruce sapwood) the mold growth sensitivity class ‘very sensitive’ should be assigned to the surfaces of timber details. In a cold and humid climate this will lead to a mold index M ≥ 2, i.e., mold formation risks are considerably high. A strict recommendation is that a vapor control layer with varying vapor permeability (e.g., 0.2 m at RH 85% ≤ Sd ≤ 5 m at RH 20%) should be used while the use of vapor barrier products with high vapor resistance (e.g., PE-foil, Sd ≥ 50 m) should be avoided to keep the moisture flow controlled when additional insulation elements are installed on top of the existing moist external envelope. It is in a good agreement with and was well studied and described in our past research as well [14,52,65].
Our results showed that mold growth is avoidable and MW wind barrier board, wood fiberboard, or cement fiberboard are the preferred materials. From the production perspective, a rigid wind barrier (wood fiberboard and cement fiberboard) is preferable due to easier and quicker installation procedures. Nevertheless, these wind barriers might not be suitable if the moisture content of the original facade is high. Construction practice has shown that it is impossible to wait for better weather and to dry out the facade. Therefore, the insulation element should include a safety factor, and MW wind barrier board is the best solution because of its high water vapor permeability and thermal resistance.
Blowing in loose-fill cellulose wool (CW) is a typical method of insulation. To prevent the settling of the insulation layer of CW, the density of loose-fill insulation in walls should be much higher than commonly assumed for attics. Rasmussen [66] argued that to prevent settling the density of loose-fill CW insulation in the wall should be ρ ≥ 65–75 kg/m³ to compensate for any humidity cycling and creep. However, he did not consider the vibration due to transportation (which is unavoidable for prefabricated insulation elements). Therefore, the density of loose-fill insulation for prefabricated insulation elements should be much higher than for attics. Higher density requires more material, resulting in higher cost and heavier elements.
Building contractors and producers of insulation elements have given critical feedback about the design and installation of insulation elements. The most objective and practical of them stress indispensable need for a pre-installation phase: well-prepared measurement of the existing situation and translation of the results into detailed and precise design documentation. Clients and moisture safety experts point out the importance of how materials are handled during transportation to the building site and especially during the ongoing works under changing and challenging weather conditions. The use of protective foils, pallets, and well-planned precautionary actions before precipitation is a must to avoid later problems with moisture damage, degradation of structures, and unsatisfactory indoor climate.
Facade cladding choices (e.g., wooden or plastic boarding/siding, metal profile sheets, cement fiberboards, facade stone cladding, etc.) are rather made by personal preferences of each customer. The preferred materials are dissimilar in unit price as well as mounting and maintenance costs. However, these costs may account for a large proportion of the total renovation budget. Therefore, circular use of materials could be one way of reducing the cost of facade cladding.
In comparison of the energy performance on the basis of variation of total delivered energy we can see that differences were relatively small because the energy for space heating was one of the smallest components of total energy use. However, it is important to see that in calculations indoor temperature set point was 21 °C. It was shown by preceding studies [67,68,69] that indoor temperature set point used is higher, typically 22 °C for post-renovation situation. That a 1 °C rise will affect the amount of delivered energy for space heating in average +33%, EPV for +1.2–+1.4% and the global cost for +1.0–+1.3%.
Compared to conventional solutions of energy refurbishment (e.g., ETICS or analogues), the cost level of the analyzed prefabricated elements for the end-user is still slightly higher (about 101–164 €/m2). The current market prices of the ETICS with expanded polystyrene (EPS) insulation are around 90–100 €/m2 and with rendered MW around 100–120 €/m2. This cost difference together with some shortage of expertise of participants is described also by other researchers as the main reason why prefabricated insulation elements are not yet in a competitive market position [70,71]. Renovation activity must be increased to a very large extent to fulfill EU decarbonization targets. Estonian practice has shown [72] that increased renovation volumes create new problems such as shortage of contactors, construction workers, and construction materials, which results in increased renovation costs. The ETICS and other rendering methods have been on the market already for many decades without moving forward towards industrialized production. The main way to increase the efficiency and reduce the cost is to raise the automation level and to find means of unification of products for faster design, mass production and installation. Other industries have shown that industrialization and mass production decrease the costs. Therefore, the prefabricated elements will obviously have cost advantages in the future.
5. Conclusions
A complex method of analysis and selection to find the most appropriate set of prefabricated insulation elements for major renovation of apartment buildings was introduced in this research. The most consistent sets, based on hygrothermal performance, handling and production characteristics and reasonable cost, were presented.
Mineral wool board with special wind barrier facing is the best material for wind barriers from the perspective of hygrothermal performance. In cold and humid climates PE-foil cannot be used as an air and vapor barrier layer in prefabricated insulation elements as it does not allow constructional moisture to dry out and causes condensation and mold growth. Compared to mineral wool, cellulose insulation has advantages concerning hygrothermal performance, but its installation density should be high (ρ ≥ 65 kg/m³) to avoid settling due to humidity cycling, creep, and vibration on transportation from the production facilities to the building site.
The variation of thermal transmittance of a well-insulated external wall has minor influence on the energy performance of the building. It is possible to renovate an apartment building to correspond to the new building nZEB level with efficient district heating and to fulfill the nZEB requirements for renovation in the case of common district heating being used.
Cost analyses showed that materials affecting moisture safety and energy performance do not influence the total cost too much. Therefore, it is possible to select the best materials from the perspective of hygrothermal and energy performance without increasing the renovation price noticeably. The facade cladding had the highest influence on the initial cost of the insulation element (±13%–15%). This means that the materials having the greatest effect on the hygrothermal performance of the building envelope have smaller influence on the initial cost. It is possible to guarantee moisture safety without paying a high relative difference cost. Decreasing the global cost of elements would increase the mold growth risk.
Author Contributions
Supervision, T.K.; conceptualization, P.P. and T.K.; methodology, P.P., K.K., and T.K.; investigation, P.P. and K.K.; formal analysis, P.P., K.K., and T.K.; visualization, P.P. and T.K.; writing—original draft preparation, P.P. and T.K.; writing—review and editing, P.P. and T.K. All authors have read and agreed to the published version of the manuscript.
Funding
This research was funded by the Estonian Centre of Excellence ZEBE, grant TK146, funded by the European Regional Development Fund, by the personal research funding grant PRG483, Moisture Safety of Interior Insulation, Constructional Moisture and Thermally Efficient Building Envelope, and Finest Twins (grant No. 856602).
Acknowledgments
The study utilized data from Horizon 2020 project ‘DRIVE 0 - Driving decarbonization of the EU building stock by enhancing a consumer centered and locally based circular renovation process’ (grant no. 841850).
Conflicts of Interest
The authors declare no conflict of interest.
References
- Balaras, C.A.; Droutsa, K.; Dascalaki, E.; Kontoyiannidis, S. Deterioration of European apartment buildings. Energy Build. 2005, 37, 515–527. [Google Scholar] [CrossRef]
- Fotopoulou, A.; Semprini, G.; Cattani, E.; Schihin, Y.; Weyer, J.; Gulli, R.; Ferrante, A. Deep renovation in existing residential buildings through facade additions: A case study in a typical residential building of the 70s. Energy Build. 2018, 166, 258–270. [Google Scholar] [CrossRef]
- 2018/844/EU. EU Directive 2018/844/EU of the European Parliament and of the Council of 30 May 2018 amending Directive 2010/31/EU on the Energy Performance of Buildings and Directive 2012/27/EU on Energy Efficiency; Publications Office of the European Union: Luxembourg, 2018. [Google Scholar]
- Ramírez-Villegas, R.; Eriksson, O.; Olofsson, T. Life cycle assessment of building renovation measures—Trade-off between building materials and energy. Energies 2019, 12, 344. [Google Scholar] [CrossRef] [Green Version]
- Teni, M.; Čulo, K.; Krstić, H. Renovation of public buildings towards nZEB: A case study of a nursing home. Buildings 2019, 9, 153. [Google Scholar] [CrossRef] [Green Version]
- Vavallo, M.; Arnesano, M.; Revel, G.M.; Mediavilla, A.; Sistiaga, A.F.; Pracucci, A.; Magnani, S.; Casadei, O. Accelerating Energy Renovation Solution for Zero Energy Buildings and Neighbourhoods—The Experience of the RenoZEB Project. Proceedings 2019, 20, 1. [Google Scholar] [CrossRef] [Green Version]
- Patiño-Cambeiro, F.; Armesto, J.; Patiño-Barbeito, F.; Bastos, G. Perspectives on Near ZEB Renovation Projects for Residential Buildings: The Spanish Case. Energies 2016, 9, 628. [Google Scholar] [CrossRef] [Green Version]
- Firląg, S.; Piasecki, M. NZEB Renovation Definition in a Heating Dominated Climate: Case Study of Poland. Appl. Sci. 2018, 8, 1605. [Google Scholar] [CrossRef] [Green Version]
- Ferrante, A. Energy retrofit to nearly zero and socio-oriented urban environments in the Mediterranean climate. Sustain. Cities Soc. 2014, 13, 237–253. [Google Scholar] [CrossRef]
- Ascione, F.; Bianco, N.; Stasio, C.; Mauro, G.; Vanoli, G. Addressing Large-Scale Energy Retrofit of a Building Stock via Representative Building Samples: Public and Private Perspectives. Sustainability 2017, 9, 940. [Google Scholar] [CrossRef] [Green Version]
- Streimikiene, D.; Balezentis, T. Innovative Policy Schemes to Promote Renovation of Multi-Flat Residential Buildings and Address the Problems of Energy Poverty of Aging Societies in Former Socialist Countries. Sustainability 2019, 11, 2015. [Google Scholar] [CrossRef] [Green Version]
- Kalamees, T.; Lupišek, A.; Mørck, O.C.; Borodinecs, A.; Almeida, M.; Rovers, R.; Veld, P.O.; Kuusk, K.; Silva, S. What kind of heat loss requirements nZEB and deep renovation sets for building envelope? In Central Europe Towards Sustainable Building 2016: Innovations for Sustainable Future; CESB: Prague, Czech Republic, 2016; pp. 137–144. [Google Scholar]
- López-Ochoa, L.M.; Las-Heras-Casas, J.; López-González, L.M.; García-Lozano, C. Energy Renovation of Residential Buildings in Cold Mediterranean Zones Using Optimized Thermal Envelope Insulation Thicknesses: The Case of Spain. Sustainability 2020, 12, 2287. [Google Scholar] [CrossRef] [Green Version]
- Pihelo, P.; Lelumees, M.; Kalamees, T. Potential of moisture dry-out from concrete wall in Estonian climate. In Proceedings of the International RILEM Conference on Materials, Systems and Structures in Civil Engineering, MSSCE 2016, Lyngby, Denmark, 22–24 August 2016; Hansen, K.K., Rode, C., Nilsson, L.-O., Eds.; pp. 289–298. [Google Scholar]
- Wang, L.; Ge, H. Effect of air leakage on the hygrothermal performance of highly insulated wood frame walls: Comparison of air leakage modelling methods. Build. Environ. 2017, 123, 363–377. [Google Scholar] [CrossRef]
- Mjörnell, K.; Boss, A.; Lindahl, M.; Molnar, S. A tool to evaluate different renovation alternatives with regard to sustainability. Sustainability 2014, 6, 4227–4245. [Google Scholar] [CrossRef] [Green Version]
- Luna-Tintos, J.F.; Cobreros, C.; Herrera-Limones, R.; López-Escamilla, Á. “Methodology Comparative Analysis” in the Solar Decathlon Competition: A Proposed Housing Model based on a Prefabricated Structural System. Sustainability 2020, 12, 1882. [Google Scholar] [CrossRef] [Green Version]
- Qi, Y.; Qian, Q.K.; Meijer, F.M.; Visscher, H.J. Identification of Quality Failures in Building Energy Renovation Projects in Northern China. Sustainability 2019, 11, 4203. [Google Scholar] [CrossRef] [Green Version]
- La Fleur, L.; Rohdin, P.; Moshfegh, B. Energy Renovation versus Demolition and Construction of a New Building—A Comparative Analysis of a Swedish Multi-Family Building. Energies 2019, 12, 2218. [Google Scholar] [CrossRef] [Green Version]
- Gustafsson, M.S.; Myhren, J.A.; Dotzauer, E.; Gustafsson, M. Life Cycle Cost of Building Energy Renovation Measures, Considering Future Energy Production Scenarios. Energies 2019, 12, 2719. [Google Scholar] [CrossRef] [Green Version]
- Hu, M. Cost-Effective Options for the Renovation of an Existing Education Building toward the Nearly Net-Zero Energy Goal—Life-Cycle Cost Analysis. Sustainability 2019, 11, 2444. [Google Scholar] [CrossRef] [Green Version]
- Kuusk, K.; Kalamees, T. Retrofit cost-effectiveness: Estonian apartment buildings. Build. Res. Inf. 2016, 44, 920–934. [Google Scholar] [CrossRef]
- Kuusk, K.; Kalamees, T. nZEB retrofit of a concrete large panel apartment building. In Proceedings of the 6th International Building Physics Conference, Torino, Italy, 14–17 June 2015; Energy Procedia. Volume 78, pp. 985–990. [Google Scholar]
- Hirvonen, J.; Jokisalo, J.; Heljo, J.; Kosonen, R. Towards the EU emission targets of 2050: Cost-effective emission reduction in Finnish detached houses. Energies 2019, 12, 4395. [Google Scholar] [CrossRef] [Green Version]
- Fotiou, T.; de Vita, A.; Capros, P. Economic-Engineering Modelling of the Buildings Sector to Study the Transition towards Deep Decarbonisation in the EU. Energies 2019, 12, 2745. [Google Scholar] [CrossRef] [Green Version]
- Ximenes, S.; Brito, J.; Gaspar, P.; Silva, A. Modelling the degradation and service life of ETICS in external walls. Mater. Struct. 2015, 48, 2235–2249. [Google Scholar] [CrossRef]
- Sulakatko, V.; Liisma, E.; Soekov, E. Increasing construction quality of external thermal insulation composite system (ETICS) by revealing on-site degradation factors. Procedia Environ. Sci. 2017, 38, 765–772. [Google Scholar] [CrossRef]
- Künzel, H.; Künzel, H.M.; Sedlbauer, K. Long-term performance of external thermal insulation systems (ETICS). ACTA Archit. 2006, 5, 11–24. [Google Scholar]
- Hamburg, A.; Kalamees, T. How well are energy performance objectives being achieved in renovated apartment buildings in Estonia? Energy Build. 2019, 199, 332–341. [Google Scholar] [CrossRef]
- Sandberg, K.; Orskaug, T.; Andersson, A. Prefabricated wood elements for sustainable renovation of residential building facades. In Proceedings of the SBE16 Tallinn and Helsinki Conference Build Green and Renovate Deep, Helsinki, Finland, 5–7 October 2016; Volume 96, pp. 756–767. [Google Scholar]
- Mjörnell, K. Experience from using prefabricated elements for adding insulation and upgrading of external facades. In Case Studies of Building Pathology in Cultural Heritage; Delgado, J.M.P.Q., Ed.; Springer: Singapore, 2016; Volume 7, pp. 95–113. [Google Scholar]
- Veld, P.O. MORE-CONNECT: Development and advanced prefabrication of innovative, multifunctional building envelope elements for modular retrofitting and smart connections. In Proceedings of the 6th International Building Physics Conference, Torino, Italy, 14–17 June 2015; Volume 78, pp. 1057–1062. [Google Scholar]
- D’Oca, S.; Ferrante, A.; Ferrer, C.; Pernetti, R.; Gralka, A.; Sebastian, R.; Veld, P.O. Technical, financial, and social barriers and challenges in deep building renovation: Integration of lessons learned from the H2020 custer projects. Buildings 2018, 8, 174. [Google Scholar] [CrossRef] [Green Version]
- Liu, Y.; Dong, J.; Shen, L. A Conceptual Development Framework for Prefabricated Construction Supply Chain Management: An Integrated Overview. Sustainability 2020, 12, 1878. [Google Scholar] [CrossRef] [Green Version]
- Grunewald, J. Diffusiver und Konvektiver Stoff-und Energietransport in Kapillarporösen Baustoffen; Dresden Univeristy of Technology: Dresden, Germany, 1997. [Google Scholar]
- Nicolai, A. Modeling and Numerical Simulation of Salt Transport and Phase Transitions in Unsaturated Porous Building Materials; Syracuse University: Syracuse, NY, USA, 2008. [Google Scholar]
- Ignatavicius, Č.; Zavadskas, E.K.; Ustinovicius, L. Modernization of large-panel houses in Vilnius. In Proceedings of the 9th International Conference of Modern Building Materials, Structures and Techniques, Vilnius, Lithuania, 16–18 May 2007. [Google Scholar]
- Ilomets, S.; Kuusk, K.; Paap, L.; Arumägi, E.; Kalamees, T. Impact of linear thermal bridges on thermal transmittance of renovated apartment buildings. J. Civ. Eng. Manag. 2017, 23, 96–104. [Google Scholar] [CrossRef]
- Mikola, A.; Kalamees, T.; Kõiv, T.-A. Performance of ventilation in Estonian apartment buildings. In Proceedings of the 11th Nordic Symposium on Building Physics, Trondheim, Norway, 11–14 June 2017; Volume 132, pp. 963–968. [Google Scholar]
- Ilomets, S.; Kalamees, T.; Vinha, J. Indoor hygrothermal loads for the deterministic and stochastic design of the building envelope for dwellings in cold climates. J. Build. Phys. 2017, 41, 547–577. [Google Scholar] [CrossRef]
- Ilomets, S.; Kalamees, T.; Lahdensivu, J.; Klõšeiko, P. Impact of ETICS on corrosion propagation of concrete facade. In Proceedings of the SBE16 Tallinn and Helsinki Conference Build Green and Renovate Deep, Helsinki, Finland, 5–7 October 2016; Volume 96, pp. 67–76. [Google Scholar]
- Pihelo, P.; Kalamees, T. Commissioning of moisture safety of nZEB renovation with prefabricated timber frame insulation wall elements. Wood Mater. Sci. Eng. 2019. [Google Scholar] [CrossRef]
- Pihelo, P.; Kalamees, T.; Kuusk, K. nZEB renovation with prefabricated modular panels. In Proceedings of the 11th Nordic Symposium on Building Physics, Trondheim, Norway, 11–14 June 2017; Geving, S., Time, B., Eds.; Volume 132, pp. 1006–1011. [Google Scholar]
- Hukka, A.; Viitanen, H. A mathematical model of mould growth on wooden material. Wood Sci. Technol. 1999, 33, 475–485. [Google Scholar] [CrossRef]
- Ojanen, T.; Viitanen, H.; Peuhkuri, R.; Lähdesmäki, K.; Vinha, J.; Salminen, K. Mold growth modeling of building structures using sensitivity classes of materials. In Thermal Performance of the Exterior Envelopes of Buildings XI Conference Proceedings CD; ASHRAE: Clearwater, FL, USA, 2010. [Google Scholar]
- Viitanen, H.; Krus, M.; Ojanen, T.; Eitner, V.; Zirkelbach, D. Mold risk classification based on comparative evaluation of two established growth models. In Proceedings of the 6th International Building Physics Conference, Torino, Italy, 14–17 June 2015; Volume 78, pp. 1425–1430. [Google Scholar]
- Kottek, M.; Grieser, J.; Beck, C.; Rudolf, B.; Rubel, F. World Map of the Köppen-Geiger climate classification updated. Meteorologische Zeitschrift. 2006, 15, 259–263. [Google Scholar] [CrossRef]
- Kalamees, T.; Vinha, J. Estonian climate analysis for selecting moisture reference years for hygrothermal calculations. J. Build. Phys. 2004, 27, 199–220. [Google Scholar] [CrossRef]
- Arumägi, E.; Kalamees, T.; Kallavus, U. Indoor climate conditions and hygrothermal loads in historic wooden apartment buildings in cold climates. Proc. Est. Acad. Sci. 2015, 64, 146–156. [Google Scholar] [CrossRef]
- Kalamees, T.; Ilomets, S.; Arumägi, E.; Alev, Ü.; Kõiv, T.-A.; Mikola, A.; Kuusk, K.; Maivel, M. Indoor hygrothermal conditions in Estonian old multi-storey brick apartment buildings. In Proceedings of the 12th International Conference on Indoor Air Quality and Climate, Austin, TX, USA, 5–10 June 2011; p. 6. [Google Scholar]
- EN 15026. Hygrothermal Performance of Building Components and Building Elements—Assessment of Moisture Transfer by Numerical Simulation; Comite Europeen de Normalisation: Dublin, Ireland, 2007. [Google Scholar]
- Pihelo, P.; Lelumees, M.; Kalamees, T. Influence of moisture dry-out on hygrothermal performance of prefabricated modular renovation elements. In Proceedings of the SBE16 Tallinn and Helsinki Conference Build Green and Renovate Deep, Helsinki, Finland, 5–7 October 2016; Kurnitski, J., Ed.; Volume 96, pp. 745–755. [Google Scholar]
- RT I, 13.12.2018, 14. EITM Määrus nr 63 (11.12.2018). Hoone Energiatõhususe Miinimumnõuded; Riigi Teataja: Tallinn, Estonia, 2018. [Google Scholar]
- RT I, 22.08.2019, 5. MTM Määrus nr 58 (redaktsioon 25.08.2019). Hoone Energiatõhususe Arvutamise Metoodika; Riigi Teataja: Tallinn, Estonia, 2019. [Google Scholar]
- RT I, 09.04.2019, 6. EITM Määrus nr 24 (04.04.2019). Korterelamute Rekonstrueerimise Toetuse Andmise Tingimused ja Kord; Riigi Teataja: Tallinn, Estonia, 2019. [Google Scholar]
- IDA ICE 4.8. Building Performance Simulation Tool—IDA Indoor Climate and Energy; EQUA Simulation AB: Solna, Sweden, 2018. [Google Scholar]
- Kuusk, K.; Kalamees, T.; Link, S.; Ilomets, S.; Mikola, A. Case-study analysis of concrete large-panel apartment building at pre- and post low-budget energy-renovation. J. Civ. Eng. Manag. 2016, 23, 67–75. [Google Scholar] [CrossRef]
- EN 15459. Energy Performance of Buildings—Economic Evaluation Procedure for Energy Systems in Buildings; British Standards Institution: London, UK, 2007. [Google Scholar]
- Statistics Estonia. Available online: www.stat.ee/en (accessed on 19 December 2019).
- Vinha, J. Hygrothermal Performance of Timber-framed External Walls in Finnish Cimatic Conditions: A Method of Determing a Sufficient Water Vapour Resistance of the Internal Lining of a Wall Assembly; Tampere University of Technology: Tampere, Finland, 2007. [Google Scholar]
- Colinart, T.; Bendouma, M.; Glouannec, P. Building renovation with prefabricated ventilated facade element: A case study. Energy Build. 2019, 186, 221–229. [Google Scholar] [CrossRef]
- Geving, S. Moisture and Building Physics in Research and Practice—Some Norwegian Experiences from the Last 10 Years; Vinha, J., Kivioja, H., Eds.; Tampere University of Technology: Tampere, Finland, 2017. [Google Scholar]
- Kreiger, B.K.; Srubar, W.V. Moisture buffering in buildings: A review of experimental and numerical methods. Energy Build. 2019, 202, 109394. [Google Scholar] [CrossRef]
- Mundt-Petersen, S.O. Moisture Safety in Wood Frame Buildings—Blind Evaluation of the Hygrothermal Calculation Tool WUFI Using Field Measurements and Determination of Factors Affecting the Moisture Safety; Lund University: Lund, Sweden, 2015. [Google Scholar]
- Pihelo, P.; Kalamees, T. The effect of thermal transmittance of building envelope and material selection of wind barrier on moisture safety of timber frame exterior wall. J. Build. Eng. 2016, 6, 29–38. [Google Scholar] [CrossRef]
- Rasmussen, T.V. Prediction of density for prevention of settling of hygroscopic insulation in walls. J. Therm. Envel. Build. Sci. 2005, 28, 245–267. [Google Scholar] [CrossRef]
- Hamburg, A.; Kalamees, T. The Influence of Energy Renovation on the Change of Indoor Temperature and Energy Use. Energies 2018, 11, 3179. [Google Scholar] [CrossRef] [Green Version]
- Branco, G.; Lachal, B.; Gallinelli, P.; Weber, W. Predicted versus observed heat consumption of a low energy multifamily complex in Switzerland based on long-term experimental data. Energy Build. 2004, 36, 543–555. [Google Scholar] [CrossRef]
- Hamburg, A.; Kuusk, K.; Mikola, A.; Kalamees, T. Realisation of energy performance targets of an old apartment building renovated to nZEB. Energy 2020, 194, 116874. [Google Scholar] [CrossRef]
- Lattke, F.; Larsen, K.; Ott, S.; Cronhjort, Y. Technical Report: TES Energy Facade—Prefabricated Timber Based Building System for Improving the Energy Efficiency of the Building Envelope; Woodwisdom Net: Brussels, Belgium, 2009. [Google Scholar]
- van Oorschot, J.A.W.H.; Hofman, E.; Halman, J.I.M. Upscaling Large Scale Deep Renovation in the Dutch Residential Sector: A Case Study. In Proceedings of the SBE16 Tallinn and Helsinki Conference Build Green and Renovate Deep, Helsinki, Finland, 5–7 October 2016; pp. 386–403. [Google Scholar]
- Kuusk, K.; Pihelo, P.; Kalamees, T. Renovation of apartment buildings with prefabricated modular panels. In Proceedings of the REHVA 13th HVAC World Congress, Bucharest, Romania, 26–29 May 2019; Tanabe, S., Zhang, H., Kurnitski, J., Gameiro da Silva, M.C., Nastase, I., Wargocki, P., Cao, G., Mazzarela, L., Inard, C., Eds.; Volume 111, p. 03023. [Google Scholar]
Figure 1.
Horizontal cross-section of the original wall with installed prefabricated timber frame insulation element and analyzed critical points.
Figure 1.
Horizontal cross-section of the original wall with installed prefabricated timber frame insulation element and analyzed critical points.

Figure 2.
Overview of the reference building in 2014 before (left) and in 2015 after (right) the renovation.
Figure 2.
Overview of the reference building in 2014 before (left) and in 2015 after (right) the renovation.

Figure 3.
Measured and calculated temperature t (a) and relative humidity RH (b) in the timber frame insulation element, in points 4 and 6. See Figure 1 for the measurement points P4 and P6.
Figure 3.
Measured and calculated temperature t (a) and relative humidity RH (b) in the timber frame insulation element, in points 4 and 6. See Figure 1 for the measurement points P4 and P6.

Figure 4.
Dependence of indoor temperature (left) and design value of moisture excess (right) on the outdoor temperature.
Figure 4.
Dependence of indoor temperature (left) and design value of moisture excess (right) on the outdoor temperature.

Figure 5.
Influence of changing the total cost on the risk of mold growth without the contribution of facade systems to the cost of prefabricated element.
Figure 5.
Influence of changing the total cost on the risk of mold growth without the contribution of facade systems to the cost of prefabricated element.


Table 1.
Description of materials (see Figure 1) in sets of analyzed structures. *.
Table 1.
Description of materials (see Figure 1) in sets of analyzed structures. *.
| Material Layer | Frame Thickness, See Figure 1, Layer C | |||
|---|---|---|---|---|
| 120 mm | 145 mm | 195 mm | ||
| A | Buffering layer | Mineral wool (MW) 50 mm (thermal conductivity λU = 0.037 W(m·K)) | ||
| B1 | Air and vapor barrier | Product ~0.2 mm (with varying water vapor resistance, depending on RH, 0.2 m at RH 85% ≤ Sd ≤ 5 m at RH 20%) | ||
| B2 | Without vapor barrier layer, air tightness is guaranteed by other means | |||
| B3 | PE-foil ~0.2 mm (Sd ≥ 50 m) | |||
| C1 | Timber frame, insulation type, thickness, thermal conductivity | 45 mm × 120 mm MW 120 mm λU = 0.035 W/(m·K) | 45 mm × 145 mm MW 145 mm λU = 0.035 W/(m·K) | 45 mm × 195 mm MW 195 mm λU = 0.035 W/(m·K) |
| C2 | CW 120 mm λU = 0.045 W/(m·K) | CW 145 mm λU = 0.045 W/(m·K) | CW 195 mm λU = 0.045 W/(m·K) | |
| D1 | Wind barrier | Sheathing membrane ~0.2 mm (Sd ≤ 0.015 m at RH 85%) | ||
| D2 | Gypsum board 9 mm (vapor permeability δp ≥ 25 × 10−12 kg/(m·s·Pa), λD = 0.19 W/(m·K)) + sheathing membrane (see position D1) | |||
| D3 | Fiber cement board 9 mm (δp ≥ 11 × 10−12 kg/(m·s·Pa), λD = 0.26 W/(m·K)) | |||
| D4 | Wood fiberboard 22 mm (δp ≥ 40 × 10−12 kg/(m·s·Pa), λD = 0.050 W/(m·K)) | |||
| D5 | MW board 30 mm with special wind barrier facing (δp ≥ 110 × 10−12 kg/(m·s·Pa), λD = 0.031 W/(m·K)) | |||
| E | Ventilated air gap | Vertical timber battens 28 mm × 70 mm, c/c 600 mm | ||
| F1 | Facade system | Wooden boarding | ||
| F2 | Plastic boarding/siding | |||
| F3 | Metal profile sheets | |||
| F4 | Cement fiberboard | |||
| F5 | Facade stones (cladding system) | |||
| F6 | Facade weatherboard with plaster | |||
Table 2.
Thermal transmittance Uc (W/(m2·K)) * of analyzed sets with different insulation materials (mineral wool (MW) and cellulose wool (CW)) and wind barrier layers. See Table 1 for description of layers D1–D5.
Table 2.
Thermal transmittance Uc (W/(m2·K)) * of analyzed sets with different insulation materials (mineral wool (MW) and cellulose wool (CW)) and wind barrier layers. See Table 1 for description of layers D1–D5.
| Wind Barrier Layer | Thermal Transmittance Uc, W/(m2·K) * (Frame Thickness, Layer C1 or C2) | |||||
|---|---|---|---|---|---|---|
| 120 mm | 145 mm | 195 mm | ||||
| MW | CW | MW | CW | MW | CW | |
| D1 | 0.20 | 0.22 | 0.18 | 0.20 | 0.15 | 0.17 |
| D2 | 0.20 | 0.22 | 0.18 | 0.20 | 0.15 | 0.17 |
| D3 | 0.20 | 0.22 | 0.18 | 0.20 | 0.15 | 0.17 |
| D4 | 0.18 | 0.20 | 0.17 | 0.18 | 0.14 | 0.16 |
| D5 | 0.17 | 0.18 | 0.15 | 0.17 | 0.13 | 0.15 |
* Thermal transmittance is calculated with the existing original wall construction (Rexist.wall = 1 m2·K/W).
Table 3.
Mold growth sensitivity classes, some corresponding materials and RHmin values [45].
Table 3.
Mold growth sensitivity classes, some corresponding materials and RHmin values [45].
| Sensitivity Class | Materials | RHmin |
|---|---|---|
| Very sensitive | Untreated wood, sapwood | 80% |
| Sensitive | Glued wooden boards, polyurethane (PUR) with paper surface, planed pine and planed spruce | 80% |
| Medium resistant | Concrete, aerated and cellular concrete, glass wool, polyester wool | 85% |
| Resistant | PUR polished surface | 85% |
Table 4.
Description of mold indexes [45].
Table 4.
Description of mold indexes [45].
| Mold Index (M) | Description of Mold Growth |
|---|---|
| 0 | No growth |
| 1 | Small amounts of mold on surface (microscope), initial stage of local growth |
| 2 | Several local mold growth colonies on surface (microscope) |
| 3 | <10% coverage, or <50% coverage of mold (microscope) |
| 4 | 10–50% coverage, or >50% coverage of mold (microscope) |
| 5 | Plenty of growth on surface, >50% coverage (visual) |
| 6 | Heavy and tight growth, coverage about 100% |
Table 5.
Results of calculation of mold index M of wall constructions with MW. IMC of existing concrete wall w = 85 kg/m3 (u = 3.7%), w = 95 kg/m3 (u = 4.1%), w = 110 kg/m3 (u = 4.7%). See Table 1 for description of layers D1–D5.
Table 5.
Results of calculation of mold index M of wall constructions with MW. IMC of existing concrete wall w = 85 kg/m3 (u = 3.7%), w = 95 kg/m3 (u = 4.1%), w = 110 kg/m3 (u = 4.7%). See Table 1 for description of layers D1–D5.
| Wind Barrier Layer | Mold Index M (Green, Yellow, Red) at the Most Critical Points (4 or 6) | |||||||||
|---|---|---|---|---|---|---|---|---|---|---|
| Frame Thickness (Layer C1) | C1 = 120 mm | C1 = 145 mm | C1 = 195 mm | |||||||
| IMC (kg/m3) | 85 | 95 | 110 | 85 | 95 | 110 | 85 | 95 | 110 | |
| D1 | With air and vapor barrier B1 (0.2 m at RH 85% ≤Sd ≤ 5 m at RH 20%) | 4 | 4 | 4 | 4 | 4 | 4 | 4 | 4 | 4 |
| D2 | 4 | 4 | 4 | 4 | 4 | 4 | 4 | 4 | 4 | |
| D3 | 4 | 4 | 4 | 4 | 4 | 4 | 4 | 4 | 4 | |
| D4 | 4 | 4 | 4 | 4 | 4 | 4 | 4 | 4 | 4 | |
| D5 | 4 | 4 | 4 | 4 | 4 | 4 | 4 | 4 | 4 | |
| D1 | Without vapor barrier B2 | 6 | 6 | 6 | 6 | 6 | 6 | 6 | 6 | 6 |
| D2 | 6 | 6 | 6 | 6 | 6 | 6 | 6 | 6 | 6 | |
| D3 | 4 | 4 | 4 | 4 | 4 | 4 | 4 | 4 | 4 | |
| D4 | 6 | 6 | 6 | 6 | 6 | 6 | 6 | 6 | 6 | |
| D5 | 4 | 4 | 4 | 4 | 4 | 4 | 4 | 4 | 4 | |
| D1 | With air and vapor barrier B3 (Sd ≥ 50 m) | 4 | 4 | 4 | 4 | 4 | 4 | 4 | 4 | 4 |
| D2 | 4 | 4 | 4 | 4 | 4 | 4 | 4 | 4 | 4 | |
| D3 | 4 | 4 | 4 | 4 | 4 | 4 | 4 | 4 | 4 | |
| D4 | 4 | 4 | 4 | 4 | 4 | 4 | 4 | 4 | 4 | |
| D5 | 4 | 4 | 4 | 4 | 4 | 4 | 4 | 4 | 4 | |
Table 6.
Results of calculation of mold index M of wall constructions with CW. IMC of existing concrete wall w = 85 kg/m3 (u = 3.7%), w = 95 kg/m3 (u = 4.1%), w = 110 kg/m3 (u = 4.7%). See Table 1 for description of layers D1…D5.
Table 6.
Results of calculation of mold index M of wall constructions with CW. IMC of existing concrete wall w = 85 kg/m3 (u = 3.7%), w = 95 kg/m3 (u = 4.1%), w = 110 kg/m3 (u = 4.7%). See Table 1 for description of layers D1…D5.
| Wind Barrier Layer | Mold Index M (Green, Yellow, and Red) at the Most Critical Points (4 or 6) | |||||||||
|---|---|---|---|---|---|---|---|---|---|---|
| Frame Thickness (Layer C2) | C2 = 120 mm | C2 = 145 mm | C2 = 195 mm | |||||||
| IMC (kg/m3) | 85 | 95 | 110 | 85 | 95 | 110 | 85 | 95 | 110 | |
| D1 | With air and vapor barrier B1 (0.2 m at RH 85% ≤ Sd ≤ 5 m at RH 20%) | 4 | 4 | 4 | 4 | 4 | 4 | 4 | 4 | 4 |
| D2 | 4 | 4 | 4 | 4 | 4 | 4 | 4 | 4 | 4 | |
| D3 | 4 | 4 | 4 | 4 | 4 | 4 | 4 | 4 | 4 | |
| D4 | 4 | 4 | 4 | 4 | 4 | 4 | 4 | 4 | 4 | |
| D5 | 4 | 4 | 4 | 4 | 4 | 4 | 4 | 4 | 4 | |
| D1 | Without vapor barrier B2 | 6 | 6 | 6 | 6 | 6 | 6 | 6 | 6 | 6 |
| D2 | 6 | 6 | 6 | 6 | 6 | 6 | 6 | 6 | 6 | |
| D3 | 4 | 4 | 4 | 4 | 4 | 4 | 4 | 4 | 4 | |
| D4 | 6 | 6 | 6 | 6 | 6 | 6 | 6 | 6 | 6 | |
| D5 | 4 | 4 | 4 | 4 | 4 | 4 | 4 | 4 | 4 | |
| D1 | With air and vapor barrier B3 (Sd ≥ 50 m) | 4 | 4 | 4 | 4 | 4 | 4 | 4 | 4 | 4 |
| D2 | 4 | 4 | 4 | 4 | 4 | 4 | 4 | 4 | 4 | |
| D3 | 4 | 4 | 4 | 4 | 4 | 4 | 4 | 4 | 4 | |
| D4 | 4 | 4 | 4 | 4 | 4 | 4 | 4 | 4 | 4 | |
| D5 | 4 | 4 | 4 | 4 | 4 | 4 | 4 | 4 | 4 | |
Table 7.
Influence of thermal transmittance of external walls on the use of delivered energy by the apartment building.
Table 7.
Influence of thermal transmittance of external walls on the use of delivered energy by the apartment building.
| Thermal Transmittance of the External Walls Uc, W/(m²·K) | Delivered Energy, kWh/(m²·a) | ||||||
|---|---|---|---|---|---|---|---|
| Heat | Electricity | Total | |||||
| Space Heating | MVHR | DHW | Equipment | Fans, Pumps | Lighting | ||
| 0.22 | 14.0 | 16.9 | 33.3 | 22.5 | 10.5 | 7.0 | 104 |
| 0.21 | 13.7 | 16.9 | 33.3 | 22.5 | 10.5 | 7.0 | 104 |
| 0.20 | 13.4 | 16.8 | 33.3 | 22.5 | 10.5 | 7.0 | 104 |
| 0.19 | 13.1 | 16.8 | 33.3 | 22.5 | 10.5 | 7.0 | 103 |
| 0.18 | 12.8 | 16.7 | 33.3 | 22.5 | 10.5 | 7.0 | 103 |
| 0.17 | 12.5 | 16.6 | 33.3 | 22.5 | 10.5 | 7.0 | 103 |
| 0.16 | 12.2 | 16.6 | 33.3 | 22.5 | 10.5 | 7.0 | 102 |
| 0.15 | 11.9 | 16.5 | 33.3 | 22.5 | 10.5 | 7.0 | 102 |
| 0.14 | 11.7 | 16.5 | 33.3 | 22.5 | 10.5 | 7.0 | 101 |
| 0.13 | 11.4 | 16.4 | 33.3 | 22.5 | 10.5 | 7.0 | 101 |
Table 8.
Influence of the heat source on the use of primary energy by the apartment building.
| Thermal Transmittance of the External Wall Uc, W/(m²·K) | Primary Energy Use, kWh/(m²·a) | |||||
|---|---|---|---|---|---|---|
| Efficient District Heating | Common District Heating | |||||
| Heat (CF = 0.65) | Electricity (CF = 2.0) | Total | Heat (CF = 0.9) | Electricity (CF = 2.0) | Total | |
| 0.22 | 41.8 | 80.1 | 122 | 57.8 | 80.1 | 138 |
| 0.21 | 41.5 | 80.1 | 122 | 57.5 | 80.1 | 138 |
| 0.20 | 41.3 | 80.1 | 121 | 57.2 | 80.1 | 137 |
| 0.19 | 41.1 | 80.1 | 121 | 56.9 | 80.1 | 137 |
| 0.18 | 40.8 | 80.1 | 121 | 56.5 | 80.1 | 137 |
| 0.17 | 40.6 | 80.1 | 121 | 56.2 | 80.1 | 136 |
| 0.16 | 40.4 | 80.1 | 120 | 55.9 | 80.1 | 136 |
| 0.15 | 40.2 | 80.1 | 120 | 55.6 | 80.1 | 136 |
| 0.14 | 39.9 | 80.1 | 120 | 55.3 | 80.1 | 135 |
| 0.13 | 39.7 | 80.1 | 120 | 55.0 | 80.1 | 135 |
Table 9.
Unit prices of prefabricated timber frame insulation elements with different insulation (MW, CW) and wind barrier materials (D1–D5) without facade materials. See Table 1 for description of layers D1…D5.
Table 9.
Unit prices of prefabricated timber frame insulation elements with different insulation (MW, CW) and wind barrier materials (D1–D5) without facade materials. See Table 1 for description of layers D1…D5.
| Wind Barrier Layer | Unit Price of Element, €/m2 (Frame Thickness, Layer C1 or C2) | |||||
|---|---|---|---|---|---|---|
| 120 mm | 145 mm | 195 mm | ||||
| MW | CW | MW | CW | MW | CW | |
| D1 | 88 | 85 | 90 | 87 | 96 | 93 |
| D2 | 93 | 90 | 95 | 92 | 101 | 98 |
| D3 | 96 | 93 | 98 | 95 | 105 | 102 |
| D4 | 98 | 95 | 100 | 97 | 107 | 104 |
| D5 | 100 | 97 | 102 | 99 | 108 | 105 |
Table 10.
Unit prices, maintenance cost and intervals of maintenance of facade systems of the prefabricated elements. See Table 1 for description of layers F1–6.
Table 10.
Unit prices, maintenance cost and intervals of maintenance of facade systems of the prefabricated elements. See Table 1 for description of layers F1–6.
| Facade System | Unit Price of Facade, €/m2 | Maintenance Cost, €/m2 | Maintenance Interval, Years |
|---|---|---|---|
| F1 | 18 | 15 | 15 |
| F2 | 22 | 5 | 15 |
| F3 | 35 | 15 | 15 |
| F4 | 54 | 5 | 25 |
| F5 | 55 | 5 | 25 |
| F6 | 56 | 15 | 20 |
Table 11.
Difference between the cost of insulation elements in relation to the set: framing 145 mm + A + B1 + C1 + D5 + E + F1. See Table 1 for description of layers A–F.
Table 11.
Difference between the cost of insulation elements in relation to the set: framing 145 mm + A + B1 + C1 + D5 + E + F1. See Table 1 for description of layers A–F.
| Wind Barrier Layer | Difference of Total Cost, €/m2 (Net Building Area) | |||||||||||||||||
|---|---|---|---|---|---|---|---|---|---|---|---|---|---|---|---|---|---|---|
| Frame Thickness 120 mm | Frame Thickness 145 mm | Frame Thickness 195 mm | ||||||||||||||||
| F1 | F2 | F3 | F4 | F5 | F6 | F1 | F2 | F3 | F4 | F5 | F6 | F1 | F2 | F3 | F4 | F5 | F6 | |
| D1 | −7 | −11 | 5 | 10 | 11 | 17 | −7 | −11 | 5 | 10 | 11 | 17 | −4 | −8 | 8 | 13 | 14 | 20 |
| D2 | −4 | −8 | 8 | 13 | 14 | 21 | −3 | −7 | 9 | 14 | 15 | 21 | −1 | −5 | 11 | 17 | 17 | 24 |
| D3 | −2 | −6 | 10 | 16 | 16 | 23 | −1 | −5 | 11 | 16 | 17 | 23 | 2 | −2 | 14 | 19 | 20 | 27 |
| D4 | −1 | −5 | 11 | 16 | 17 | 23 | 0 | −4 | 12 | 17 | 18 | 24 | 3 | −1 | 15 | 20 | 21 | 27 |
| D5 | 0 | −4 | 12 | 17 | 18 | 24 | 0 | −4 | 12 | 17 | 18 | 24 | 3 | −1 | 15 | 21 | 21 | 28 |
© 2020 by the authors. Licensee MDPI, Basel, Switzerland. This article is an open access article distributed under the terms and conditions of the Creative Commons Attribution (CC BY) license (http://creativecommons.org/licenses/by/4.0/).
Share and Cite
MDPI and ACS Style
Pihelo, P.; Kuusk, K.; Kalamees, T. Development and Performance Assessment of Prefabricated Insulation Elements for Deep Energy Renovation of Apartment Buildings. Energies 2020, 13, 1709. https://doi.org/10.3390/en13071709
AMA Style
Pihelo P, Kuusk K, Kalamees T. Development and Performance Assessment of Prefabricated Insulation Elements for Deep Energy Renovation of Apartment Buildings. Energies. 2020; 13(7):1709. https://doi.org/10.3390/en13071709
Chicago/Turabian StylePihelo, Peep, Kalle Kuusk, and Targo Kalamees. 2020. "Development and Performance Assessment of Prefabricated Insulation Elements for Deep Energy Renovation of Apartment Buildings" Energies 13, no. 7: 1709. https://doi.org/10.3390/en13071709
Note that from the first issue of 2016, this journal uses article numbers instead of page numbers. See further details here.