The Impacts of Air Pollution on Health and Economy in Southeast Asia


1
Tokai University, Hiratsuka 259-1292, Japan
2
Shahid Beheshti University of Medical Sciences, Tehran 19857-17443, Iran
*
Author to whom correspondence should be addressed.
Energies 2020, 13(7), 1812; https://doi.org/10.3390/en13071812
Submission received: 18 February 2020
/
Revised: 25 March 2020
/
Accepted: 3 April 2020
/
Published: 9 April 2020
(This article belongs to the Special Issue Economic Analysis on Energy and Environmental Issues and Policy)
Abstract
:The accessibility of cheap fossil fuels, due to large government subsidies, promotes the accelerated gross domestic product (GDP) per capita growth in Southeast Asia. However, the ambient air pollution from fossil fuel combustion has a latent cost, which is the public health issues such as respiratory diseases, lung cancer, labor loss, and economic burden in the long-run. In Southeast Asia, lung cancer is the leading and second leading cause of cancer-related death in men, and women, respectively. This nexus study employs the panel vector error correction model (VECM) and panel generalized method of moments (GMM) using data from ten Southeast Asian countries from the period (2000–2016) to explore the possible association between emissions, lung cancer, and the economy. The results confirm that CO2 and PM2.5 are major risk factors for lung cancer in the region. Additionally, the increasing use of renewable energy and higher healthcare expenditure per capita tend to reduce the lung cancer prevalence. Governments specially in low oil price era, have to transfer subsidies from fossil fuels to renewable energy to create a healthy environment. Furthermore, cost creation for fossil fuel consumption through carbon taxation, especially in the power generation sector, is important to induce private sector investment in green energy projects.
1. Introduction
In 2015, both consumers and producers of fossil fuels, globally, received approximately USD 425 billion worth of subsidies via direct payments, tax breaks, loan guarantees, cheap rental of public land, or research and development (R&D) grants [1]. According to the Organisation for Economic Co-operation and Development (OECD), the production or consumption of fossil fuels is supported by almost 800 individual policies [2]. In addition, many fossil fuel companies benefit from an advantageous tax system, which can be understood, in a way, as a form of indirect subsidy. As a result of these direct and indirect subsidies, the price that consumers pay for fossil fuels does not include the damages caused by climate change and air pollution. However, eventually, the cost of these negative externalities to the environment and human health are borne by taxpayers in the form of medical costs and government expenditures for environmental cleanup.
Providing subsidies for fossil fuel companies represents a loss of opportunity for governments, which are also attempting to achieve the Sustainable Development Goals. Additionally, the support provided to fossil fuel companies by the governments is estimated to be half the amount needed to plug the sustainable energy access finance gap, more than ten times the amount needed to bridge the basic education finance gap, more than 13 times the amount needed to close the basic health care gap; more than three times the subsidies to renewable energy, and more than 22 times the current finance of combating and mitigating climate change. Moreover, since the price at which fossil fuels are sold does not include environmental and health externalities and is thus reduced, it encourages further consumption of fossil fuels, which, in turn, increases greenhouse gas (GHGs) emissions. According to NCM [1], the removal of all fossil fuel subsidies will lead to a global reduction in carbon emissions of 6.4%–8.2% by 2050.
Globally, outdoor air pollution is a substantial environmental and health risk factor, with the World Health Organization (WHO) calling air pollution the silent killer. New estimates in 2018 revealed that nine out of ten people breathe air containing high levels of pollutants. Moreover, ambient (outdoor) and household (indoor) air pollution are responsible for about seven million deaths globally per year [3]. The regional estimates of WHO for the annual death caused by air pollution are, over 2 million in South-East Asia region, over 2 million in Western Pacific region, nearly 1 million in Africa region, about 500,000 in Eastern Mediterranean region, about 500,000 in European region and more than 300,000 in the region of the Americas.
Considering that an adult averagely inhales 10–15 m3 of air per day, exposure to various airborne pollutants is inevitable. Subsequently, these harmful elements can cause distinct local (i.e., respiratory system) and systemic disorders by access to the blood stream. The WHO’s International Agency for Research on Cancer (IARC) named outdoor air pollution as “the most widespread carcinogen” that can affect human health and classified it as a cause of lung cancer [4]. The components of ambient air pollution can be divided into three main groups: (1) gases (e.g., NOx, CO, and O3); (2) volatile organic compounds (VOCs); and (3) suspended solid and liquid particles that are called particulate matters (PMs) [5]. PMs contain polycyclic aromatic hydrocarbons (PAHs) and heavy metals that produce the main carcinogenetic effect of outdoor air pollution [6]. This crucial issue is highlighted in the following sections. In addition to their direct health effect, some of the emitted elements (e.g., NOx and CO2) can aggravate the greenhouse effect, climate change and its consequences (e.g., tropical storms and the rise in sea levels).
As mentioned earlier, compared to other regions worldwide, Southeast Asia has one of the highest death ratios due to the exposure to outdoor and household air pollution. In Southeast Asia (The Association of Southeast Asian Nations (ASEAN) region), lung cancer is the leading and the second leading cause of cancer-related death in men and women (after breast cancer), respectively. Based on the latest GLOBOCAN reporting, about 93,535 ASEAN residents died from lung cancer in 2012, and this rate will increase substantially to 122,179 in 2020. This increasing mortality rate mortality has a significant negative impact on the supply side of the economy by negatively affecting the productivity, labor supply, and, consequently, the economy as a whole. The large negative impact of mortality and reduction in labor productivity caused by air pollution on Southeast Asia economies motivated us to do a nexus study on energy, health, and the economy. A literature review shows that numerous previous studies have assessed the impact of pollution on health [7,8,9,10] and economy [11,12,13] separately. To the best of our knowledge, we could not find a nexus study that provides a multifaceted impact analysis of all major pollutants of fossil fuels (i.e., CO2, NOx, and PM2.5) on health and the economy simultaneously, except for the authors of [14], who showed that PM2.5 and ozone pollution may cause a 2.0% and 0.09% GDP loss in China in 2030, respectively. Nevertheless, this study does not consider the impact of Co2 and Nox on health and the economy.
In addition, a review of the literature shows that the majority of past studies on the impact of lung cancer and severe respiratory diseases tend to adopt an accounting approach by only calculating the hospital and healthcare costs [15,16,17]. However, a complete overview of the impact of these diseases on the economy cannot be achieved by only considering the accounting costs without taking account for the economic costs. A significant portion of the economic burden of severe diseases (e.g., cancer) is the labor loss due to disease, premature death, and the opportunity cost of the unpaid labor for family and relatives who are taking care of the patients. In other words, if we want to have a comprehensive analysis of the real cost and burden of disease on the economy, we need to consider both the direct costs of managing the disease at all stages and the opportunity cost associated with the loss of productivity due to premature mortality and the indirect costs of informal care. Hence, this paper adopts a macroeconomic approach rather than an accounting approach to assess the impact of cancer prevalence on the economy.
The objective of this study is to provide an analysis of the multifaceted impact of fossil fuel emissions on health and the economy in ASEAN member countries. In particular, this nexus study aims at answering the following three questions: By considering different levels of gross domestic product (GDP) per capita and health care expenditures in ASEAN member countries, what is the impact of air pollution on lung cancer in this region? Is there any significant association between renewable energy consumption and cancer prevalence in this region? What is the economic impact of renewable energy development on ASEAN economies?
2. Air Pollution, Health, and the Economy
To answer the research questions, this section highlights the impact of air pollution on health and the economy. In particular, it shows the magnitude of this issue in the ASEAN region and explores the negative impacts of ambient air pollution on health and the economy in this region.
Ambient air pollution is a major risk factor for human health and accounts for numerous disorders. Air pollution is associated with a broad spectrum of acute and chronic illnesses, such as lung cancer, chronic obstructive pulmonary disease (COPD), and cardiovascular diseases. An increase in CO2 concentration can result in many health impacts through hypercapnia (defined as an increase in bloodstream CO2). Prolonged exposure to low CO2 concentrations may result in cardiopulmonary failure, intracranial hemorrhage, immune defects, miscarriages, and behavioral disorders [18,19]. Moreover, the increase of intrapulmonary CO2 is a documented risk factor for the development of lung cancer in smokers and nonsmokers [20]. Several mechanisms are proposed for this effect. In 2019, Akbari et al. provided a hypothesis that links cancer evolution with a decrease in cellular adenosine triphosphate (ATP) [21]. Considering their findings, an increase in intrapulmonary CO2 can induce lung cancer through interfering with cellular respiration and a decrease in cellular ATP.
In 2016, 4.2 million deaths were caused by ambient air pollution, which is estimated to account for about 16%, 25%, 17%, and 26% of the deaths associated with lung cancer, COPD, ischemic heart disease and stroke, and respiratory infection, respectively. Additionally, particulate matter pollution is an issue affecting health and the environment worldwide. However, it has been proved that the burden is even larger in low- and middle-income countries [22].
Moreover, it is associated with adverse birth outcomes (e.g., small for gestational age, low birth weight, and preterm birth). Thus, this issue highlights that governments have to change the existing trend immediately. Apart from the long-term effects, ambient air pollution can also harm human health through short-term exposure. For example, it can aggravate the symptoms of a child with asthma and threaten his/her life. Moreover, there is limited but increasing evidence that air pollution can affect children’s lives by inducing diabetes and neurological development impairments [23]. Therefore, the range of ambient air pollution-related adverse effects is expanding, which can potentially shift its position upward among the human health risk factors. In the following, we highlight one of the most devastating human disorders that is related to ambient air pollution, lung cancer.
Lung cancer has become the leading cancer type in recent years, with 2.1 million diagnoses in 2018, accounting for about 11.6% of the cancer incidence burden. Unsurprisingly, it is also responsible for the largest number of deaths caused by cancers (i.e., 1.8 million deaths, or 18.4% of the total deaths associated with cancer) because of the poor prognosis for this cancer worldwide [24].
The main risk factor for lung cancer is smoking, accounting for more than 90% of all cases [25]. Nonetheless, we should not underestimate the role of other risk factors. For instance, there is limited but growing evidence that Asian females, as a unique population with a low prevalence rate of smoking, are more vulnerable to smoking-unrelated lung cancer subtypes (i.e., adenocarcinoma in comparison with squamous/small cell carcinoma). In addition, the percentage of these subtypes of lung cancer is growing [26], verifying the role of other risk factors (e.g., ambient air pollution.)
However, the pathophysiology explaining the relationship between air pollution and lung cancer is not clearly elucidated, although some studies have been attempting to justify it. For instance, some scholars suggest that cancerous cells arise from existing pulmonary stem cells in response to air pollution-induced epithelium damage [27], while others assume that PMs are the main carcinogenic factors through damage to mitochondria (the cellular organelles that are responsible for energy production), resulting in impairment of apoptosis (i.e., programmed cell death) [28].
Here, we present some of the studies that are related to air pollution-induced lung cancer. Through the examination of 352,053 new cases of lung cancer, the authors of [29] found that the overall survival (OS) decreased with the elevation of NOx and PMs levels. The authors of [30] recognized that non- and ex-smokers who live in areas near heavy traffic roads show 46% higher rates of lung cancer prevalence. The authors of [4] showed that ambient air pollution is a factor that increases the risk of contracting lung cancer. The aforementioned studies and the IAR identified ambient air pollution as a risk factor for lung cancer. In the following section, we explore the current lung cancer status in the ASEAN region, and then examine the economic burden of lung cancer.
2.1. Lung Cancer Status in the ASEAN Region
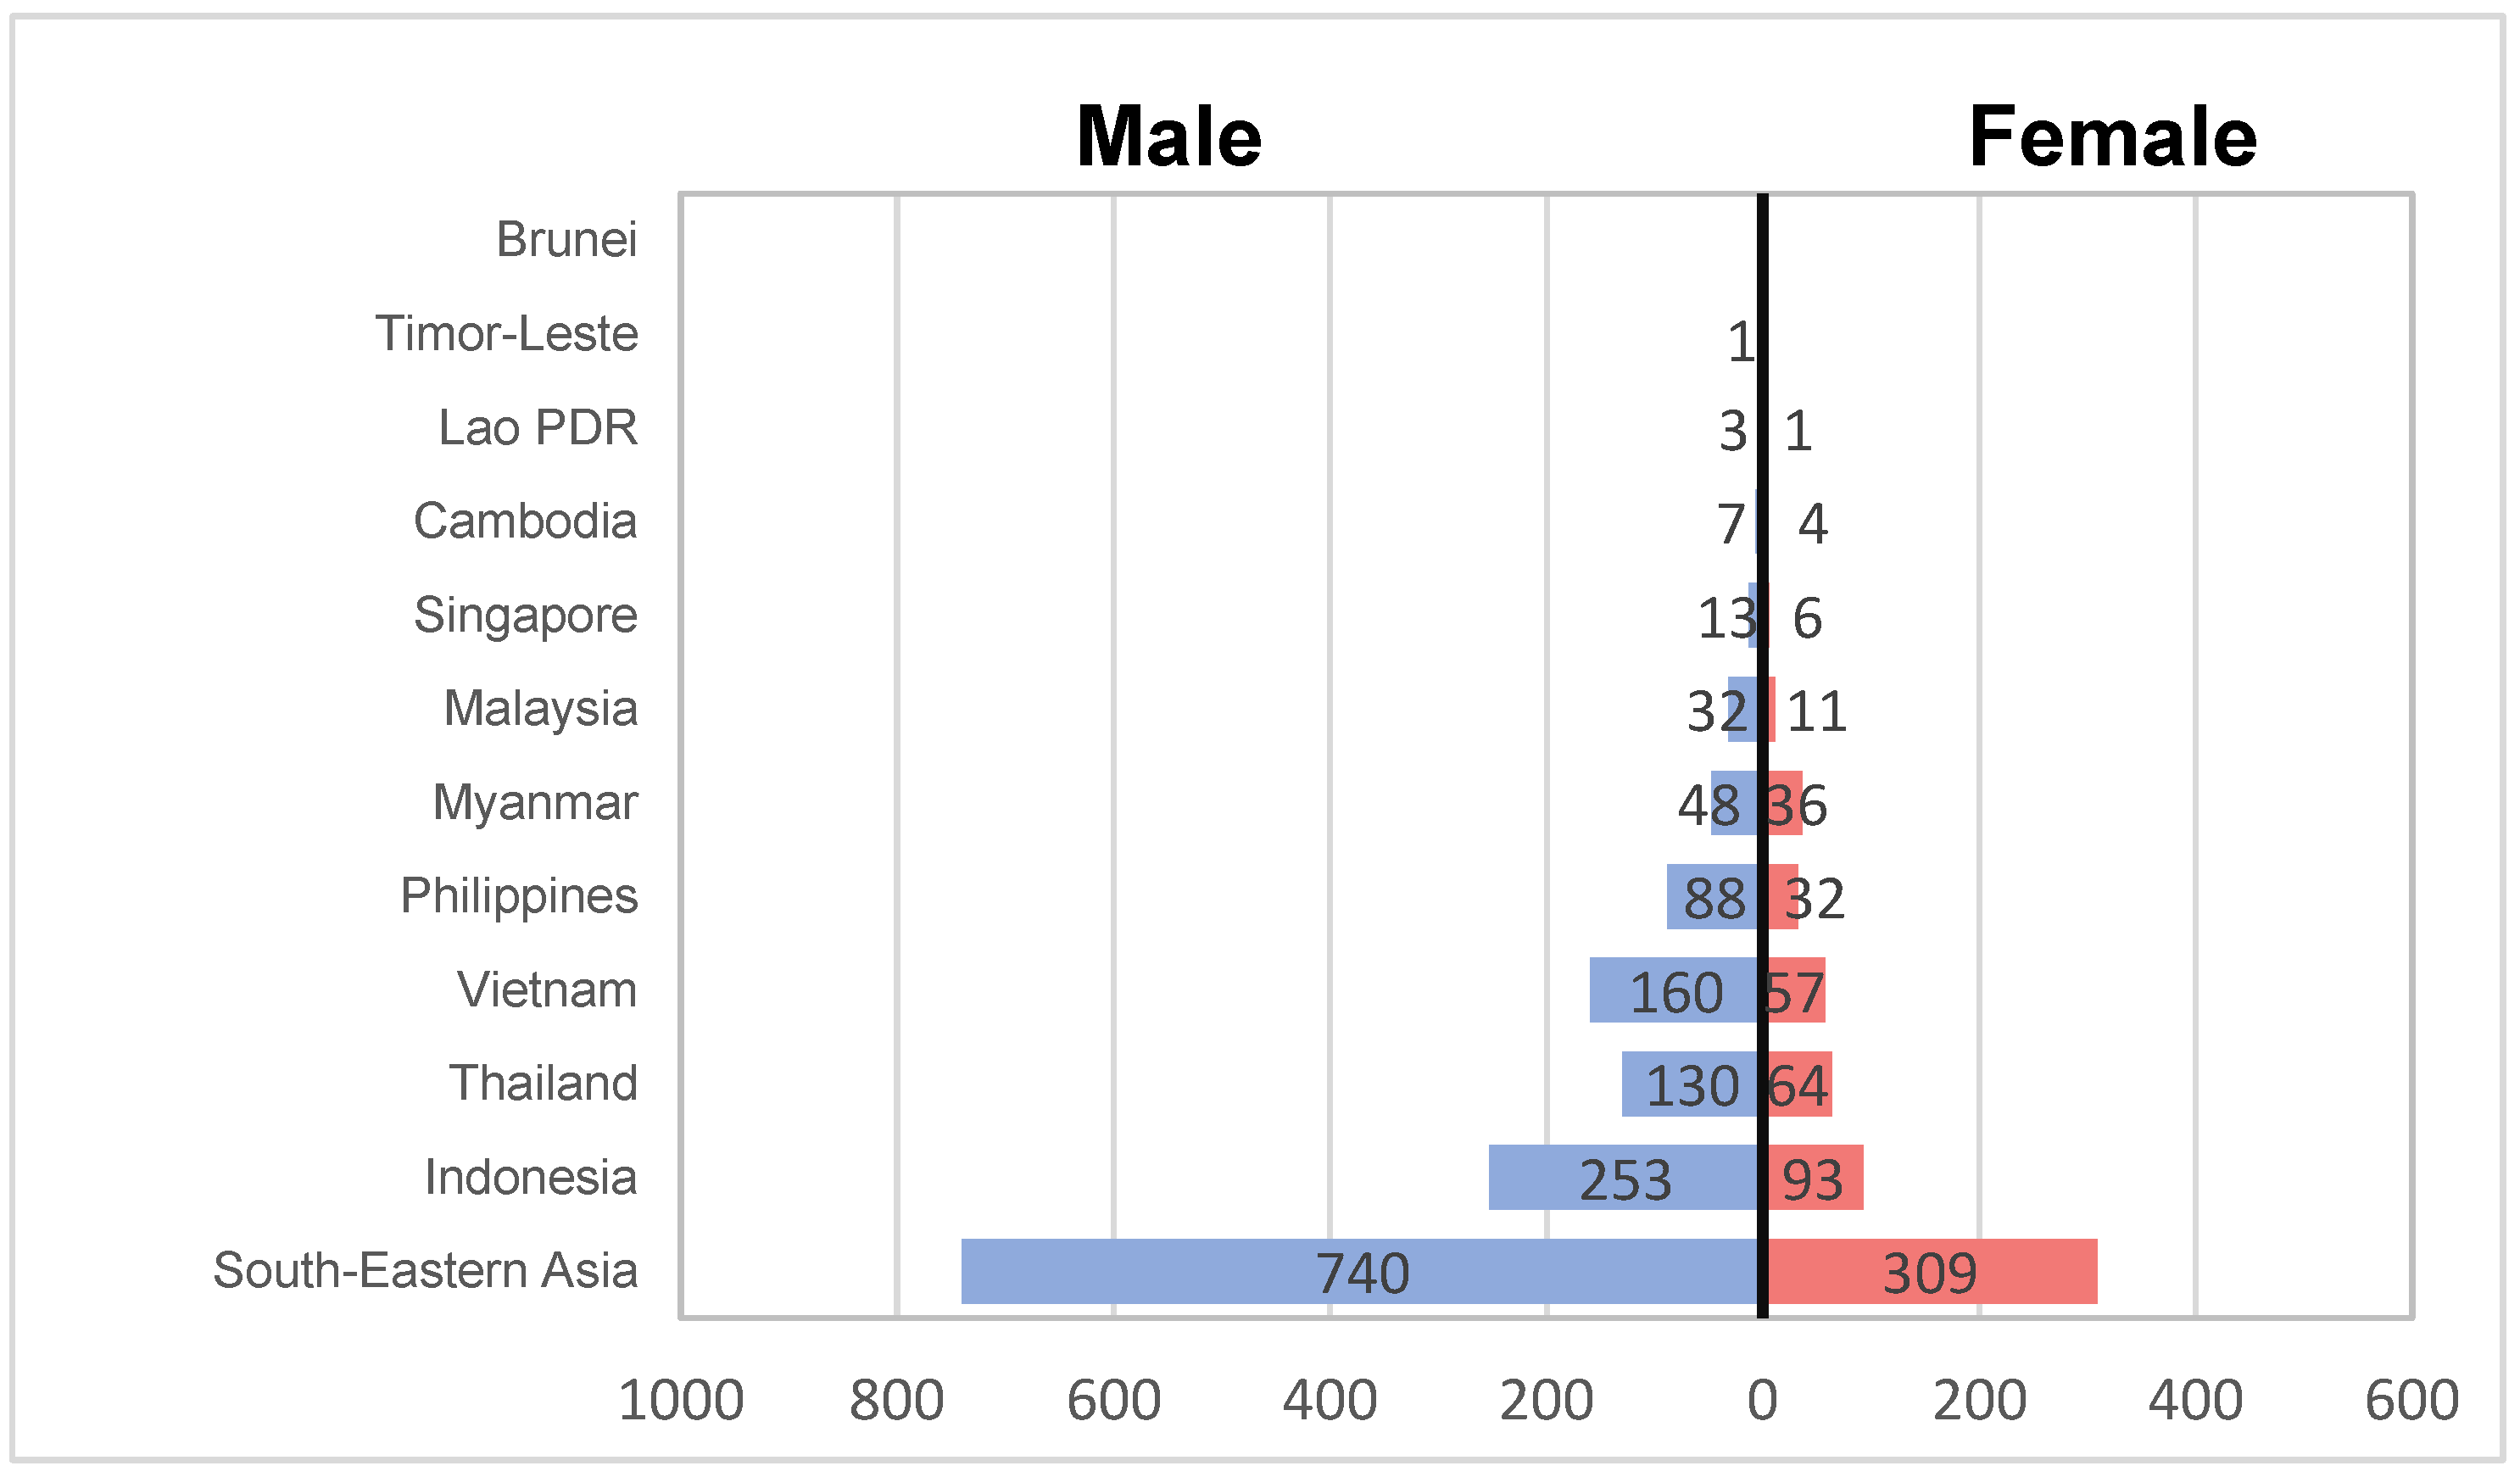
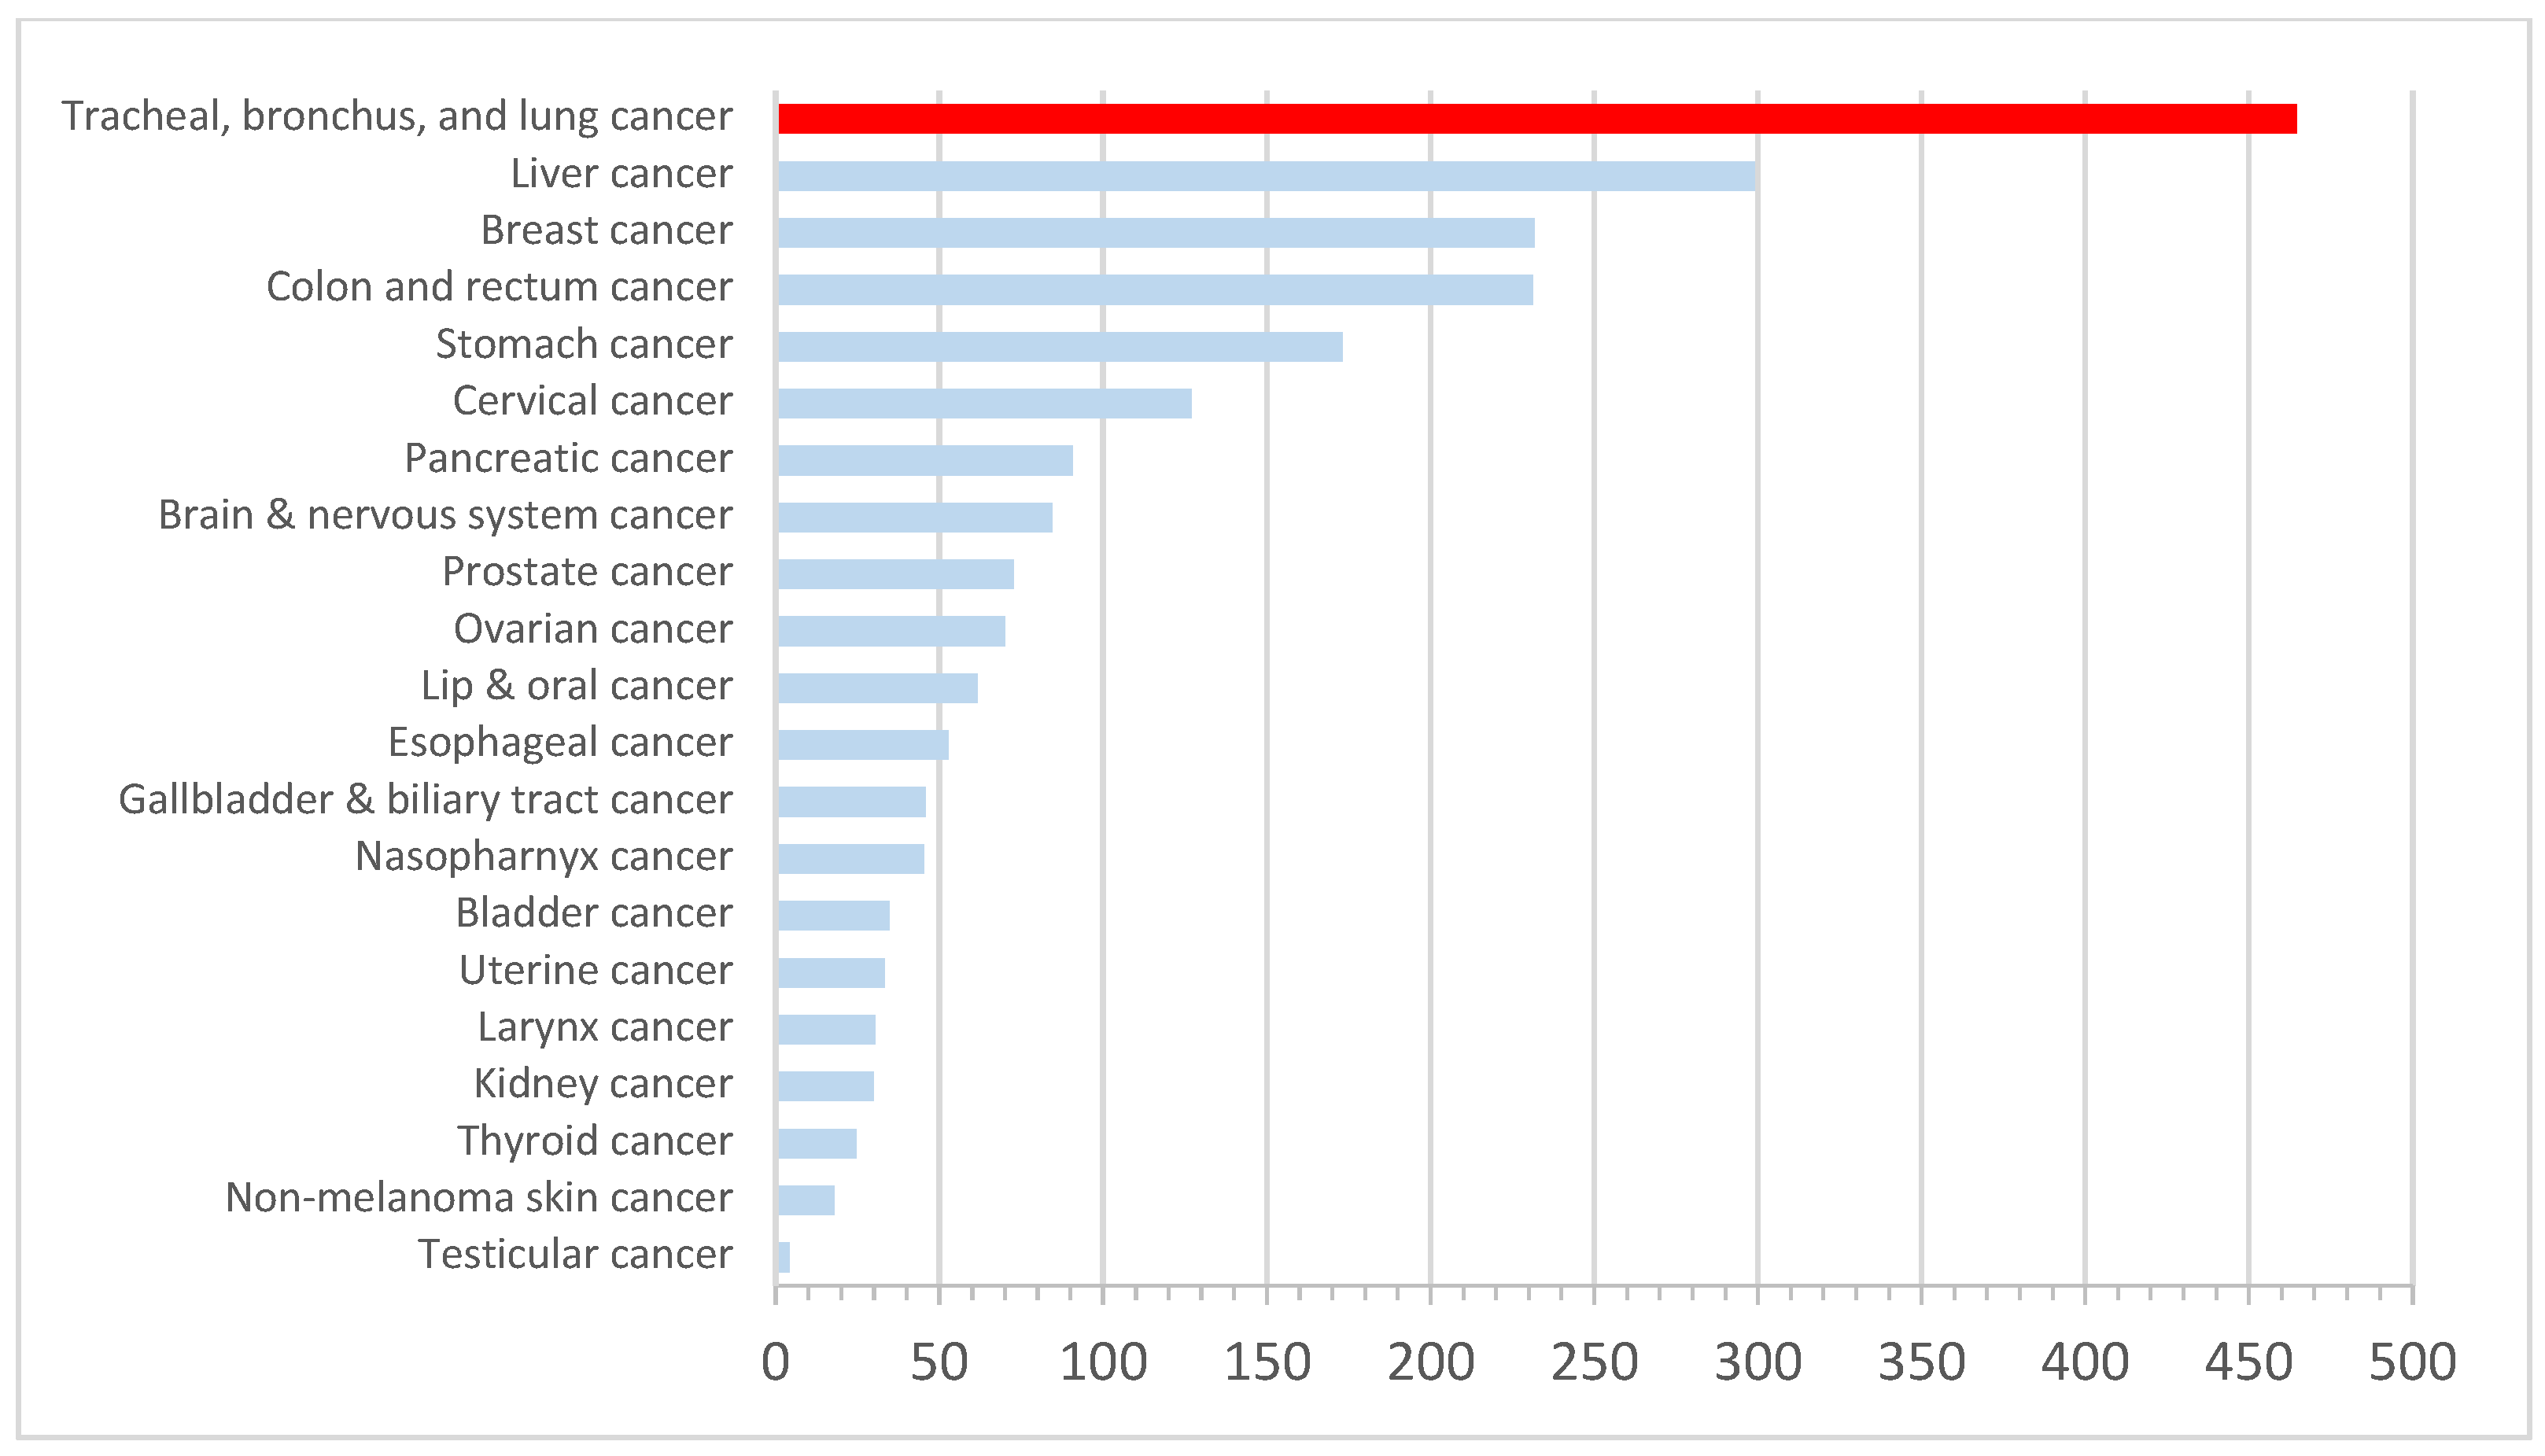
In the ASEAN region, lung cancer is the leading and second leading cause of cancer-related deaths for men and women (after breast cancer), respectively. The age-adjusted death rate for lung cancer mortality is also higher for males compared to females (26.6 vs. 9.4 in 100,000 persons) [31]. The status of gender-adjusted 2012 lung cancer incidence in the ASEAN region by country is presented in Figure 1. During 2016, an estimated age-standardized disability-adjusted life year (DALY) in Southeast Asia showed that 464.59 out of 100,000 individuals are affected by tracheal, bronchus and lung cancer, being more than those who are affected by breast and colorectal cancer combined (Figure 2).
2.2. Lung Cancer and the Economy
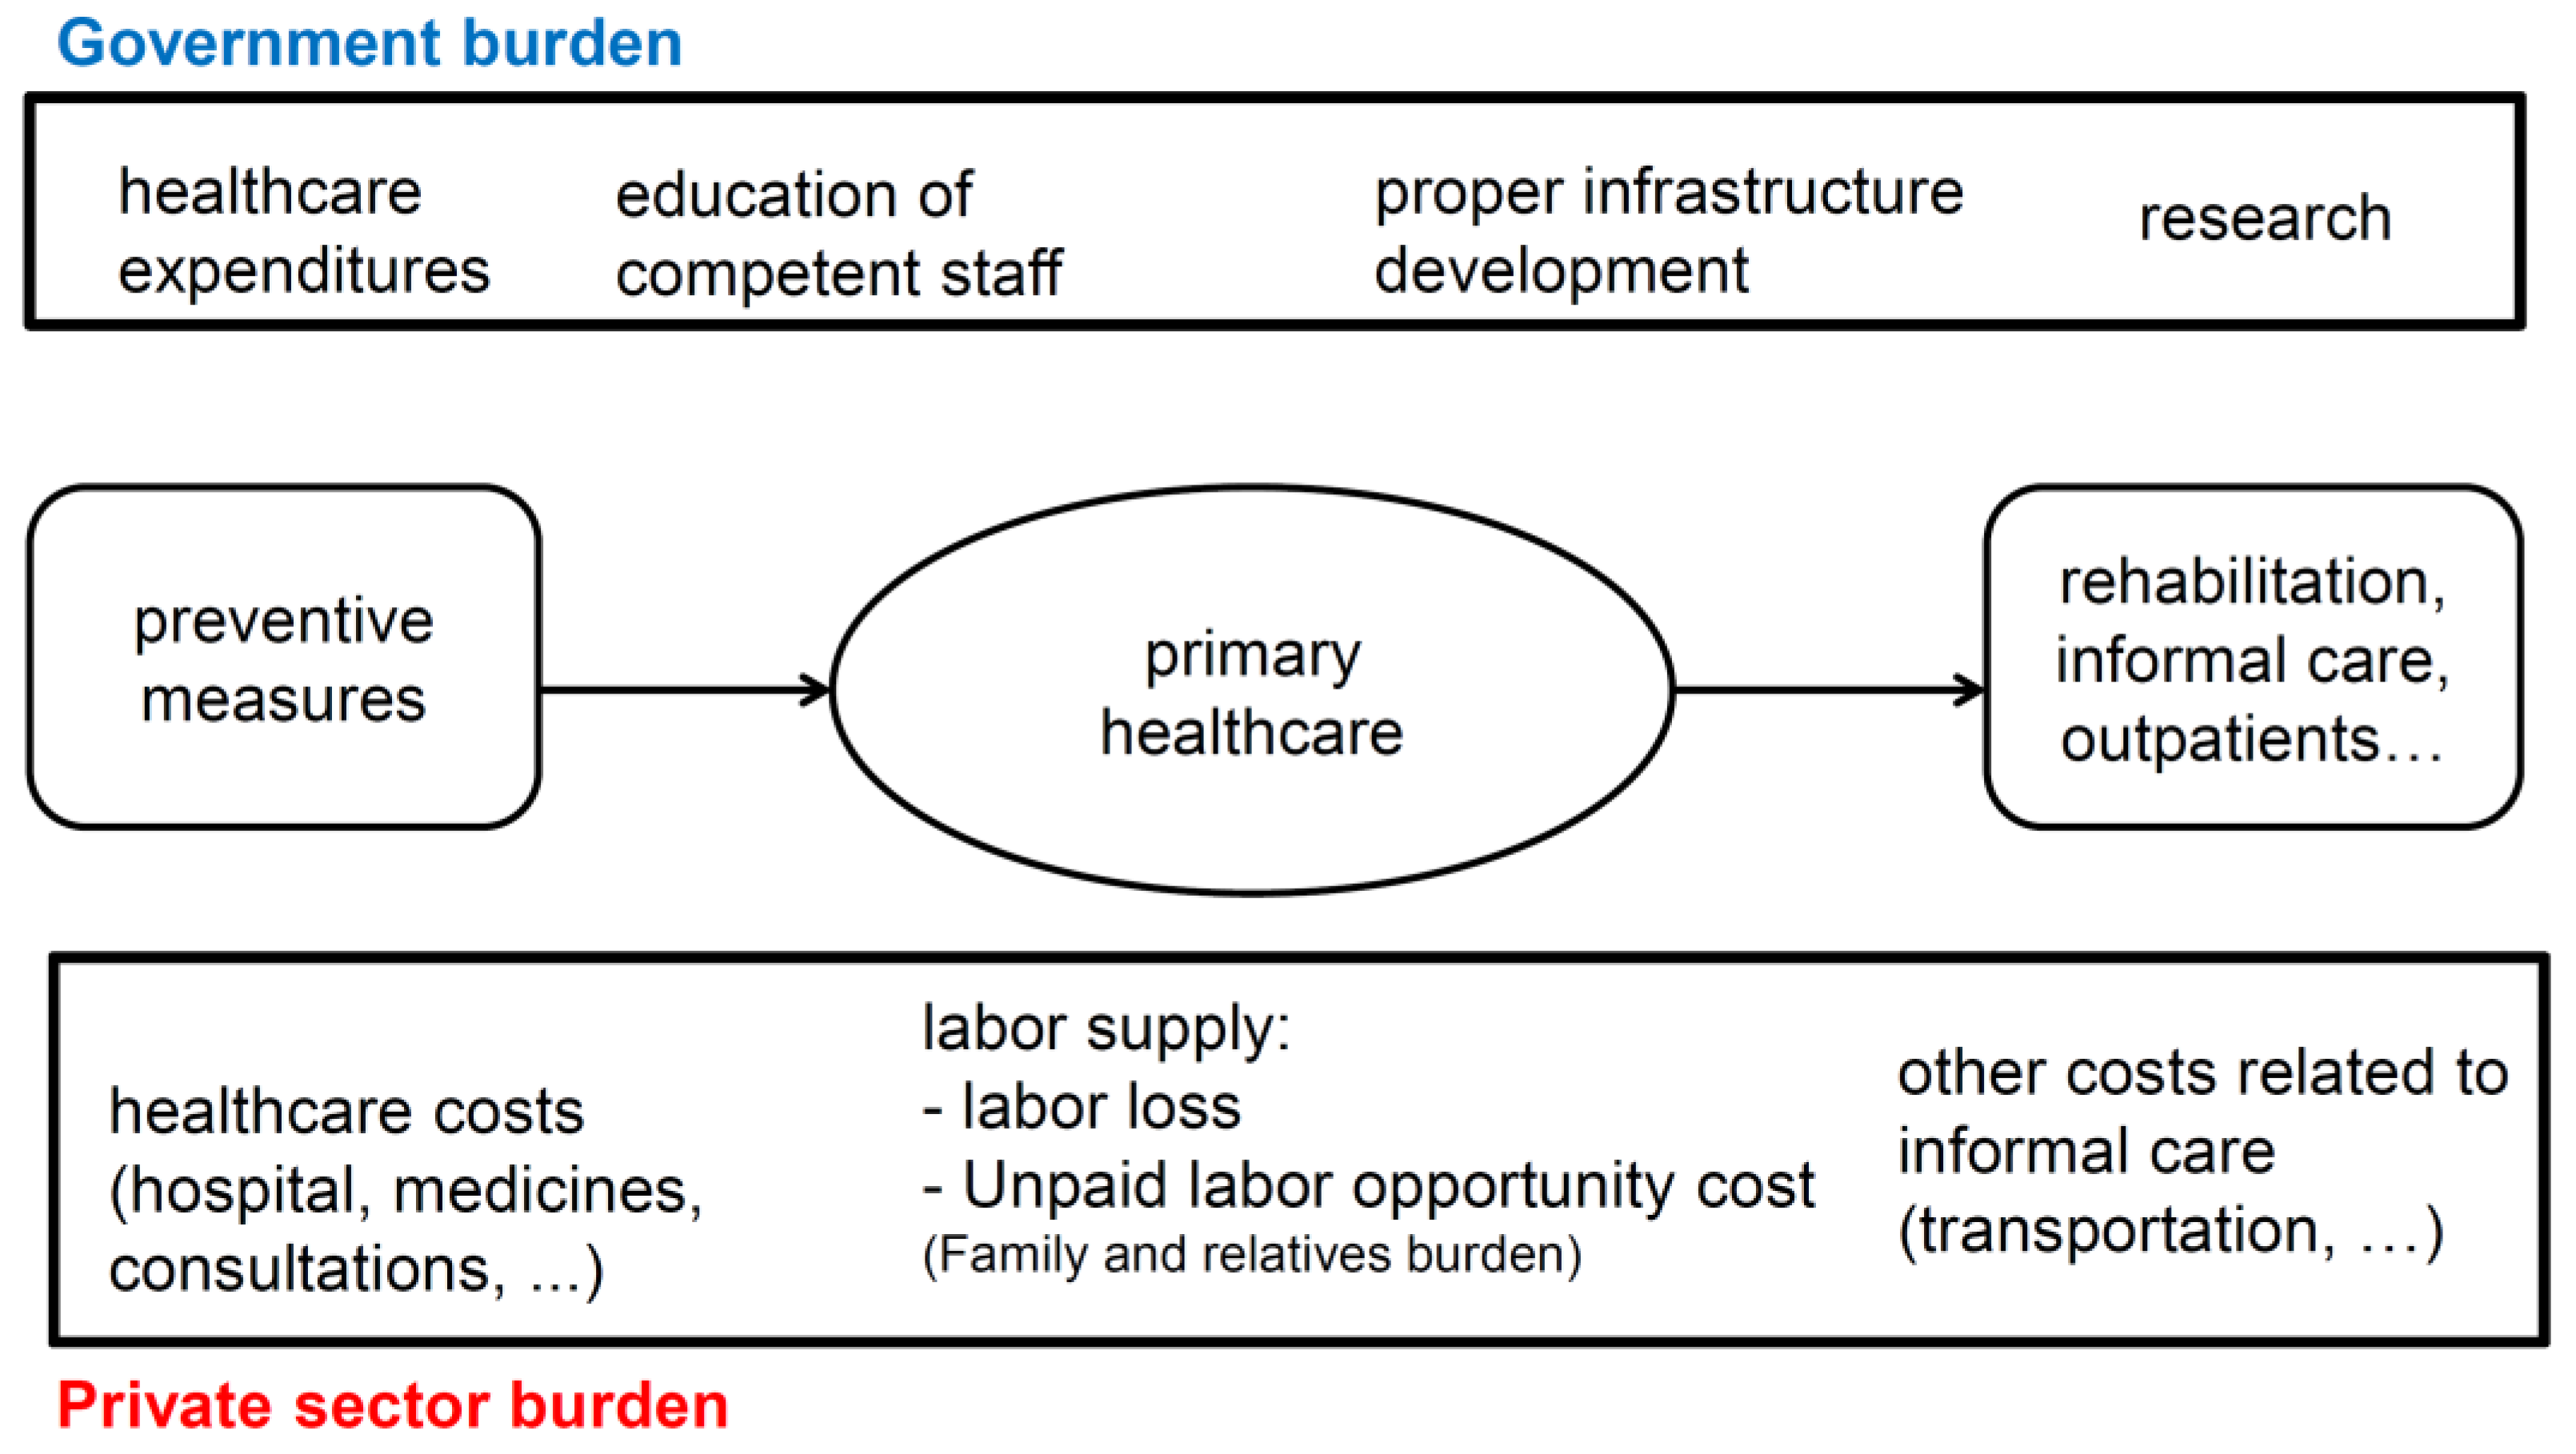
The accessibility of cheap fossil fuels is one of the reasons behind the accelerated GDP per capita growth in Southeast Asia. However, this has a latent cost, which is air pollution and the resulting public health issues, namely, respiratory diseases. There are several costs associated with these diseases, including labor loss resulting from informal care. Figure 3 shows the structure of the costs associated with lung cancer and respiratory diseases, and clarify that both the government and private sector bear these costs. The governmental burden includes the following: spending on healthcare expenditures, education of competent staff, establishment of proper healthcare infrastructure, and R&D using the taxpayers’ money. Meanwhile, the costs that are borne by the private sector are the healthcare costs (i.e., hospital, medicine, consultations, etc.), the labor loss, hidden costs that are often neglected, and other informal costs such as transportation. Labor loss is divided into two parts: the first part is for the patients, who cannot work properly due to a severe disease, and the second part is the opportunity cost of the family and relatives who need to take care of the patients, sacrificing working hours.
3. Empirical Analysis
This research is a nexus study of air pollution, health, and the economy in Southeast Asia. It aims at exploring the relationship between different types of emissions from fossil combustion and lung cancer, the leading and second leading cause of cancer-related death in men and women, respectively, in the region.
To explore these issues, we developed a panel data analysis consisting of ten ASEAN member countries for the period (2000–2016). Temporally and spatially, the applied data were in the order of year- and country-based, respectively.
Table 1 shows the data that are used in this research as well as the definition of each variable. The dependent variable of the health study is the age-standardized lung cancer prevalence rate in the ASEAN region. In addition to smoking, ambient air pollution is one of the major risk factors of lung cancer. However, in this study, since we focused on ambient air pollution and used three major components of the ambient air pollution [4,5,6]: CO2 emissions (metric tons) per capita, NOX emissions (thousand metric tons of CO2 equivalent) per capita, and ambient PM2.5 air pollution, which indicates the annual exposure micrograms per cubic meter. To find out the impact of renewable energy deployment and the resulting decrease in emissions, as well as the reduction in lung cancer prevalence, we included the renewable energy variable (RE), which denotes renewable energy consumption as a share of total final energy consumption (excluding traditional biomass). We excluded the traditional biomass, which has negative health impacts, which means that our definition of renewable energy is ‘modern’ renewable energy. Finally, it is expected that there is a negative association between health care expenditure per capita and the status of most diseases, such as cancers. Cancer that is diagnosed at an early stage is more likely to be cured successfully, as it remains relatively small and localized. However, if cancer spreads, effective treatment becomes more difficult, and generally, a person’s chances of surviving are lowered. Higher health care expenditures per capita entail a more developed health care infrastructure and more skilled medical human resources to increase the diagnoses of cancers in their earlier stages, thus reducing the cancer prevalence. Finally, since this is a nexus study, we included an economic variable that can explain the economic status of the country: GDP per capita in real terms (constant 2010 US$).
In the second part of our analysis, we used GDP per capita as a dependent variable. The objective is to assess the association between cancer prevalence, ambient air pollution, renewable energy deployment, and external health expenditures with the GDP per capita of ASEAN member countries.
3.1. Data Analysis
Before conducting the empirical analysis, it is necessary to check the consistency of data. First, we checked whether there exists cross-sectional dependence (CD) in our panel data framework. Depending on the result, we selected appropriate tests for panel unit roots and panel cointegration analyses. The null hypothesis of the CD test is that there is no cross-section dependence (correlation) in residuals. The CD test results demonstrate the rejection of the null hypothesis; that is, our panel data do not present cross-section dependence.
Next, we proceeded to test the stationarity of each variable. For this purpose, we ran a common panel unit root test (Fisher-Augmented-Dickey–Fuller (Fisher-ADF)) on all series at different levels and on the first differences. The results are presented in Table 2.
In addition, we conducted several robustness checks of the unit root test to confirm the stationarity of data. To this end, we selected the Philips–Perron–Fischer Chi-square and Levin, Lin, and Chu panel unit root tests, with the results of these two robustness checks being listed in Table 3. The panel unit root results in Table 2 and Table 3 confirm that all series are non-stationary in level, whereas the variables are stationary, as indicated by the Fisher-ADF test and the two robustness checks (PP Fisher and Levin, Lin, and Chu). Hence, we can verify that the series are integrated of order 1 or I(1).
Owing to the non-stationary series, we tested for the presence of cointegration using the Kao residual cointegration test with Augmented Dickey–Fuller (ADF) statistic. The lag length selection for the cointegration test is based on the Schwarz Info Criterion and the Newey-West automatic bandwidth selection and Bartlett kernel. The result of the Kao test (ADF Test) is in Table 4. The t-statistic of the ADF for the Kao residual cointegration test shows a value of −2.54, thus rejecting the null hypothesis of no-cointegration, and indicating cointegration among the series and long-run association.
To ensure the robustness of our results, an additional cointegration test is conducted, namely, the Pedroni Panel test, the results of which are presented in Table 5. Considering all the panels, groups, and weighted statistics, the majority of the tests show probabilities lower than 0.05, indicating that we should reject the null hypothesis of no cointegration. We can, thus, say with 95% confidence that our variables are cointegrated and in line with the findings of the Kao test (ADF test).
3.2. Empirical Analysis
The first part of the nexus study evaluates the impact of different factors on cancer prevalence, and the second part is an economic analysis of renewable energy and fossil fuel deployments.
3.2.1. Health Analysis
In the health analysis, the dependent variable is CANCER, and we provide the short-run dynamics based on a panel vector error correction model (VECM), impulse response function (IRF), and variance decomposition.
Table 6 shows the short-run dynamics based on a panel VECM. Based on Johansen’s cointegration results, the number of cointegration equations is set to one with an intercept and without a trend. Owing to the cointegration among variables, it is required for at least one of the coefficients of the error correction terms (ECT) to be statistically significant. This condition is observed in ECT, as shown in Table 5. For ECT; CANCER, CO2, PM, RE are shown to be statistically significant.
There appears to be a positive short-run relationship between CANCER, CO2, NOx and PM. These results that we derived for the ASEAN countries are in line with the results from other regions [15,16,17]. They confirm that CO2 and PM are major risk factors of lung cancer in the ASEAN region. The coefficient of RE is also significant and negative, meaning that an increasing share of renewable energy in the total energy consumption of the ASEAN region will result in lower harmful emissions, and cause a reduction in the lung cancer prevalence as a result.
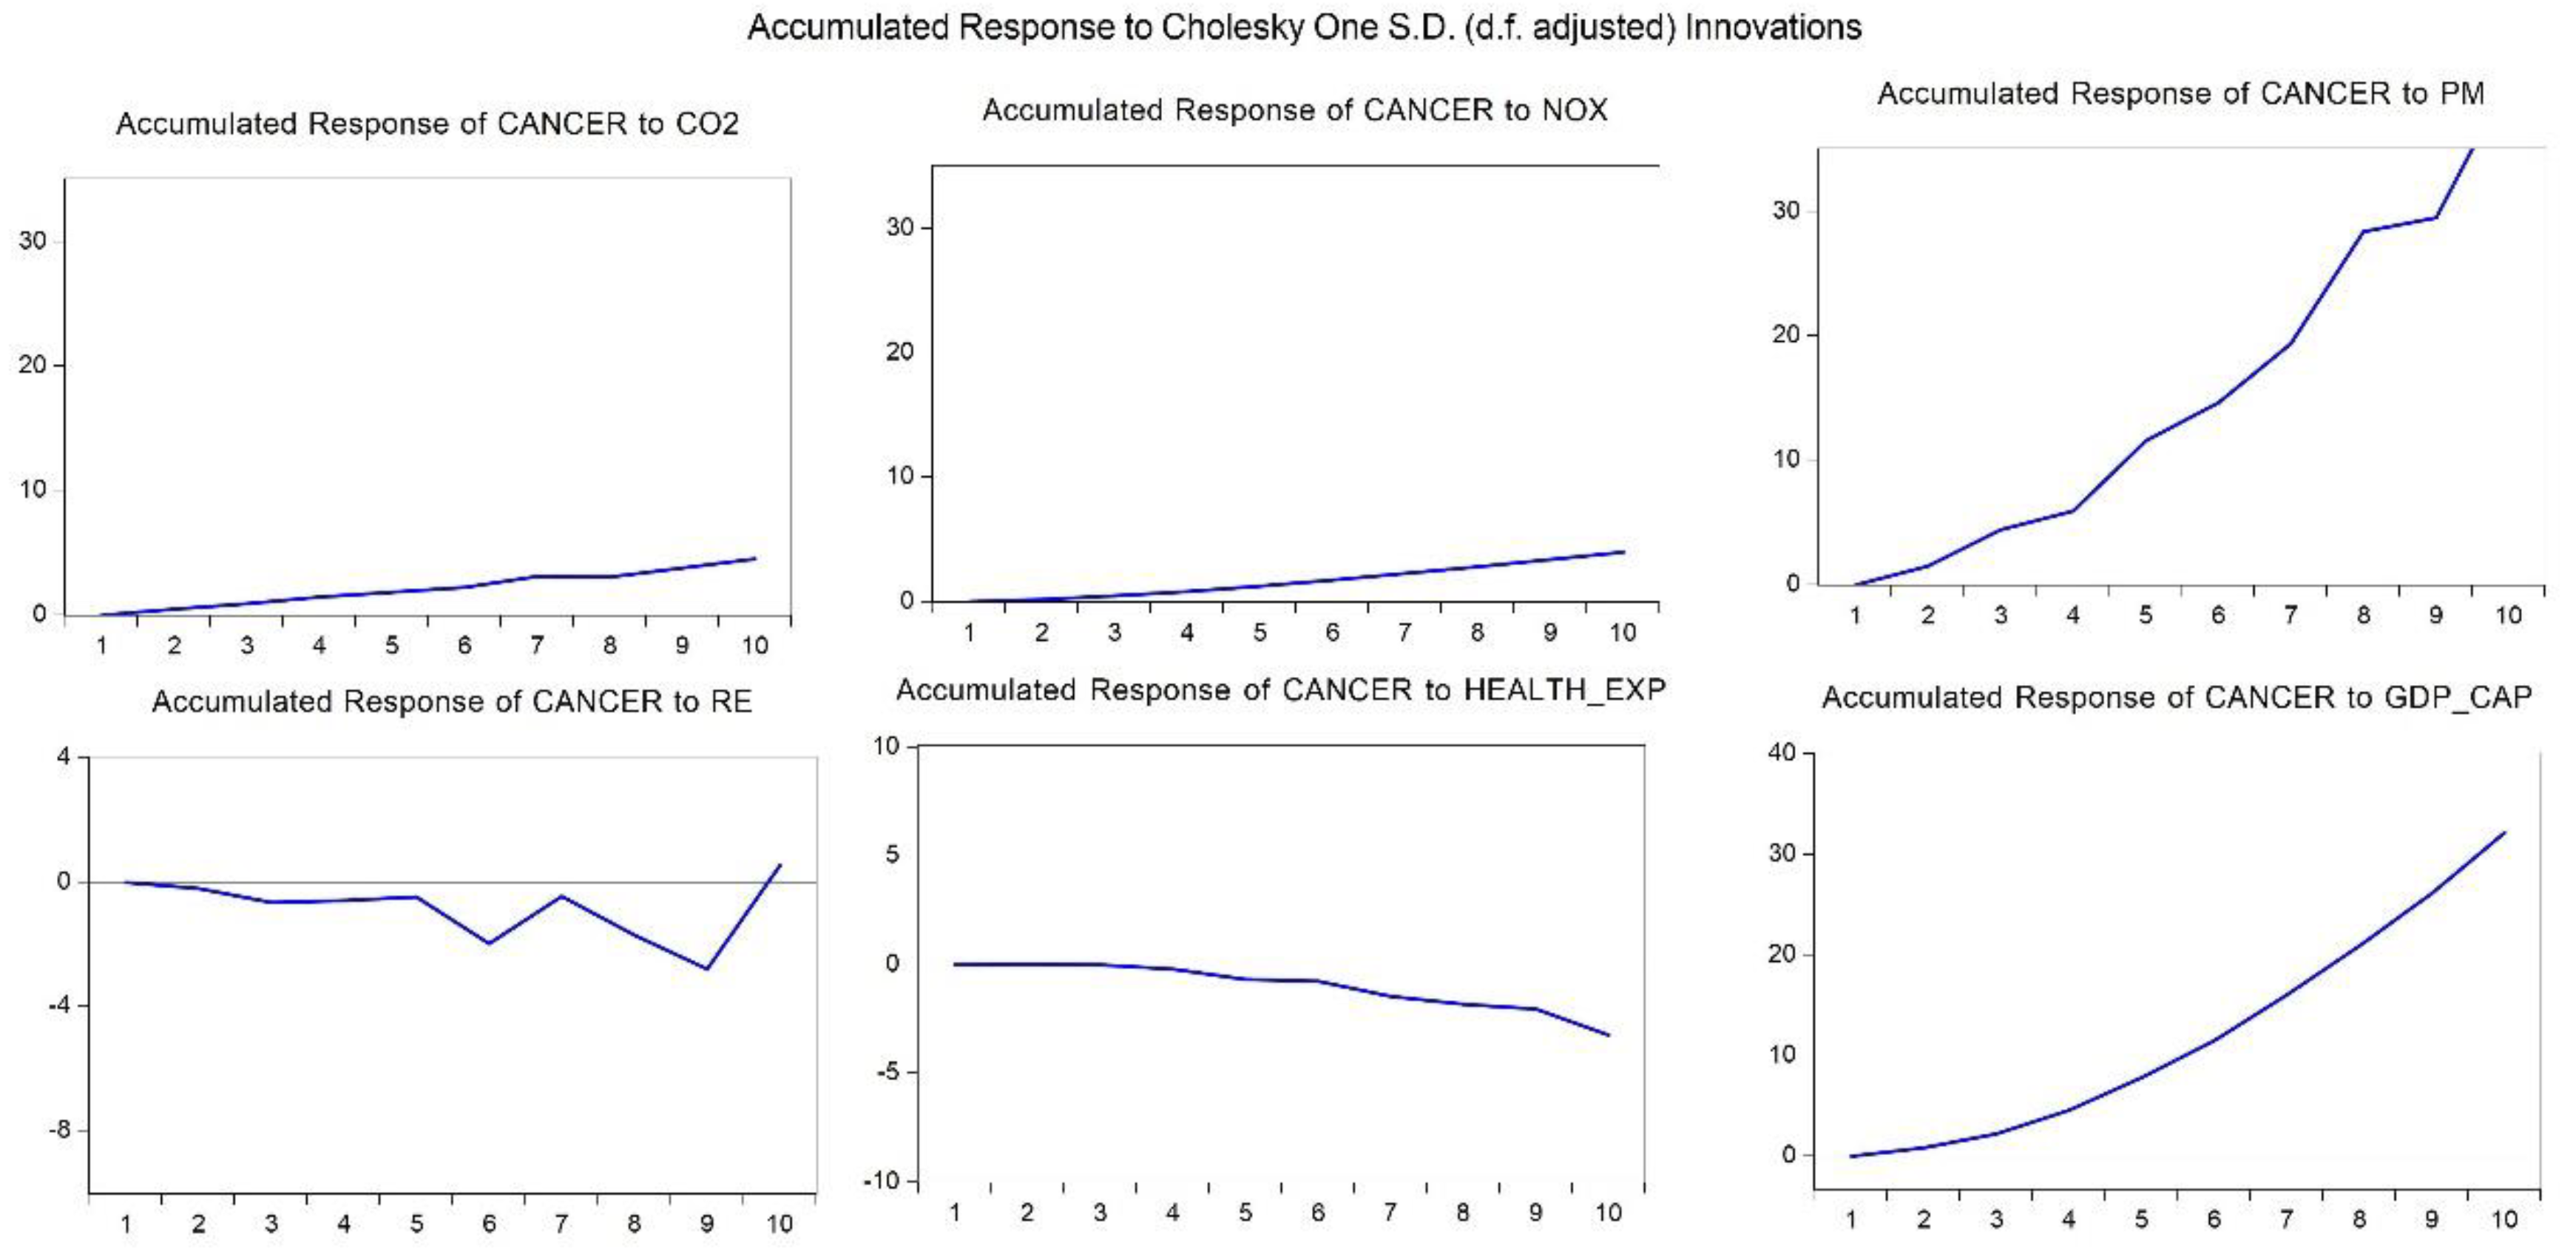
Figure 4 and Table 7 provide the detailed results of the VECM of health analysis, including dynamics between the variables and the variance decomposition. The following ordering of variables is kept throughout the empirical analysis: CANCER, CO2, NOX, PM, RE, HEALTH_EXP, and GDP_CAP. Based on the Johansen’s cointegration results, the number of cointegrating equations is set to one, with an intercept and without a trend. The results of the IRF are shown in Figure 4.
The IRF results are considered, utilizing the Cholesky degree of freedom and adjusted for ten periods. As the variable of interest is CANCER, only the accumulated response of CANCER to impulse of explanatory variables is shown. IRFs are used to estimate the reaction of variables to exogenous shocks, with the results being summarized in Figure 4. CANCER’s response is statistically significant, and the response is positive to CO2, NOX, PM, and GDP_CAP and significantly negative to RE and HEALTH_EXP. This means that an increase in fossil fuel consumption, higher emissions (i.e., CO2, NOX, and PM2.5), and higher levels of GDP per capita in ASEAN countries, associated with higher consumption of fossil fuels, will result in higher lung cancer prevalence. Nevertheless, deployment of renewable energy and increasing healthcare expenditures are two factors that reduce lung cancer prevalence.
The final step of the health analysis is the variance decomposition analysis. In the VAR or VEC framework, variance decomposition is a useful tool that forecasts which factors explain the changes in a given variable after structural shocks. Results of the variance decomposition show the share of total variance of the variable of interest (CANCER) that is changing because of explanatory variables. The Monte Carlo Error (MCE) method is chosen using 100 repetitions. The variance decomposition is particularly useful when attempting to explain the magnitude of each variable in creating fluctuations in other variables. The Cholesky order is shown as: CANCER; CO2, NOX, PM, RE, HEALTH_EXP, and GDP_CAP. The analysis is restricted to ten periods. Results of the variance decomposition analysis for the age-standardized lung cancer prevalence (CANCER) using the Cholesky DOF methodology are shown in Table 7.
The impacts of the PM and RE are maximized in the long run or after ten periods. This means that PM2.5 has a longer-term impact on lung-cancer, while deployment of renewable energy projects that result in a reduction of emissions (i.e., CO2, NOX, and PM) will lead to a reduction in lung cancer prevalence in the long run. The share of other variables in explaining the forecast variance does not change significantly over the period of investigation. After ten periods, exogenous shocks to PM and RE explain 53.78% and 44.21% of the forecast error variance of CANCER, respectively. In comparison, the remaining variables’ magnitudes are limited.
3.2.2. Economic Analysis
In the economic analysis, the dependent variable is GDP_CAP, and we provide detailed results of the VECM of economic analysis, including the dynamics between the variables and the variance decomposition:
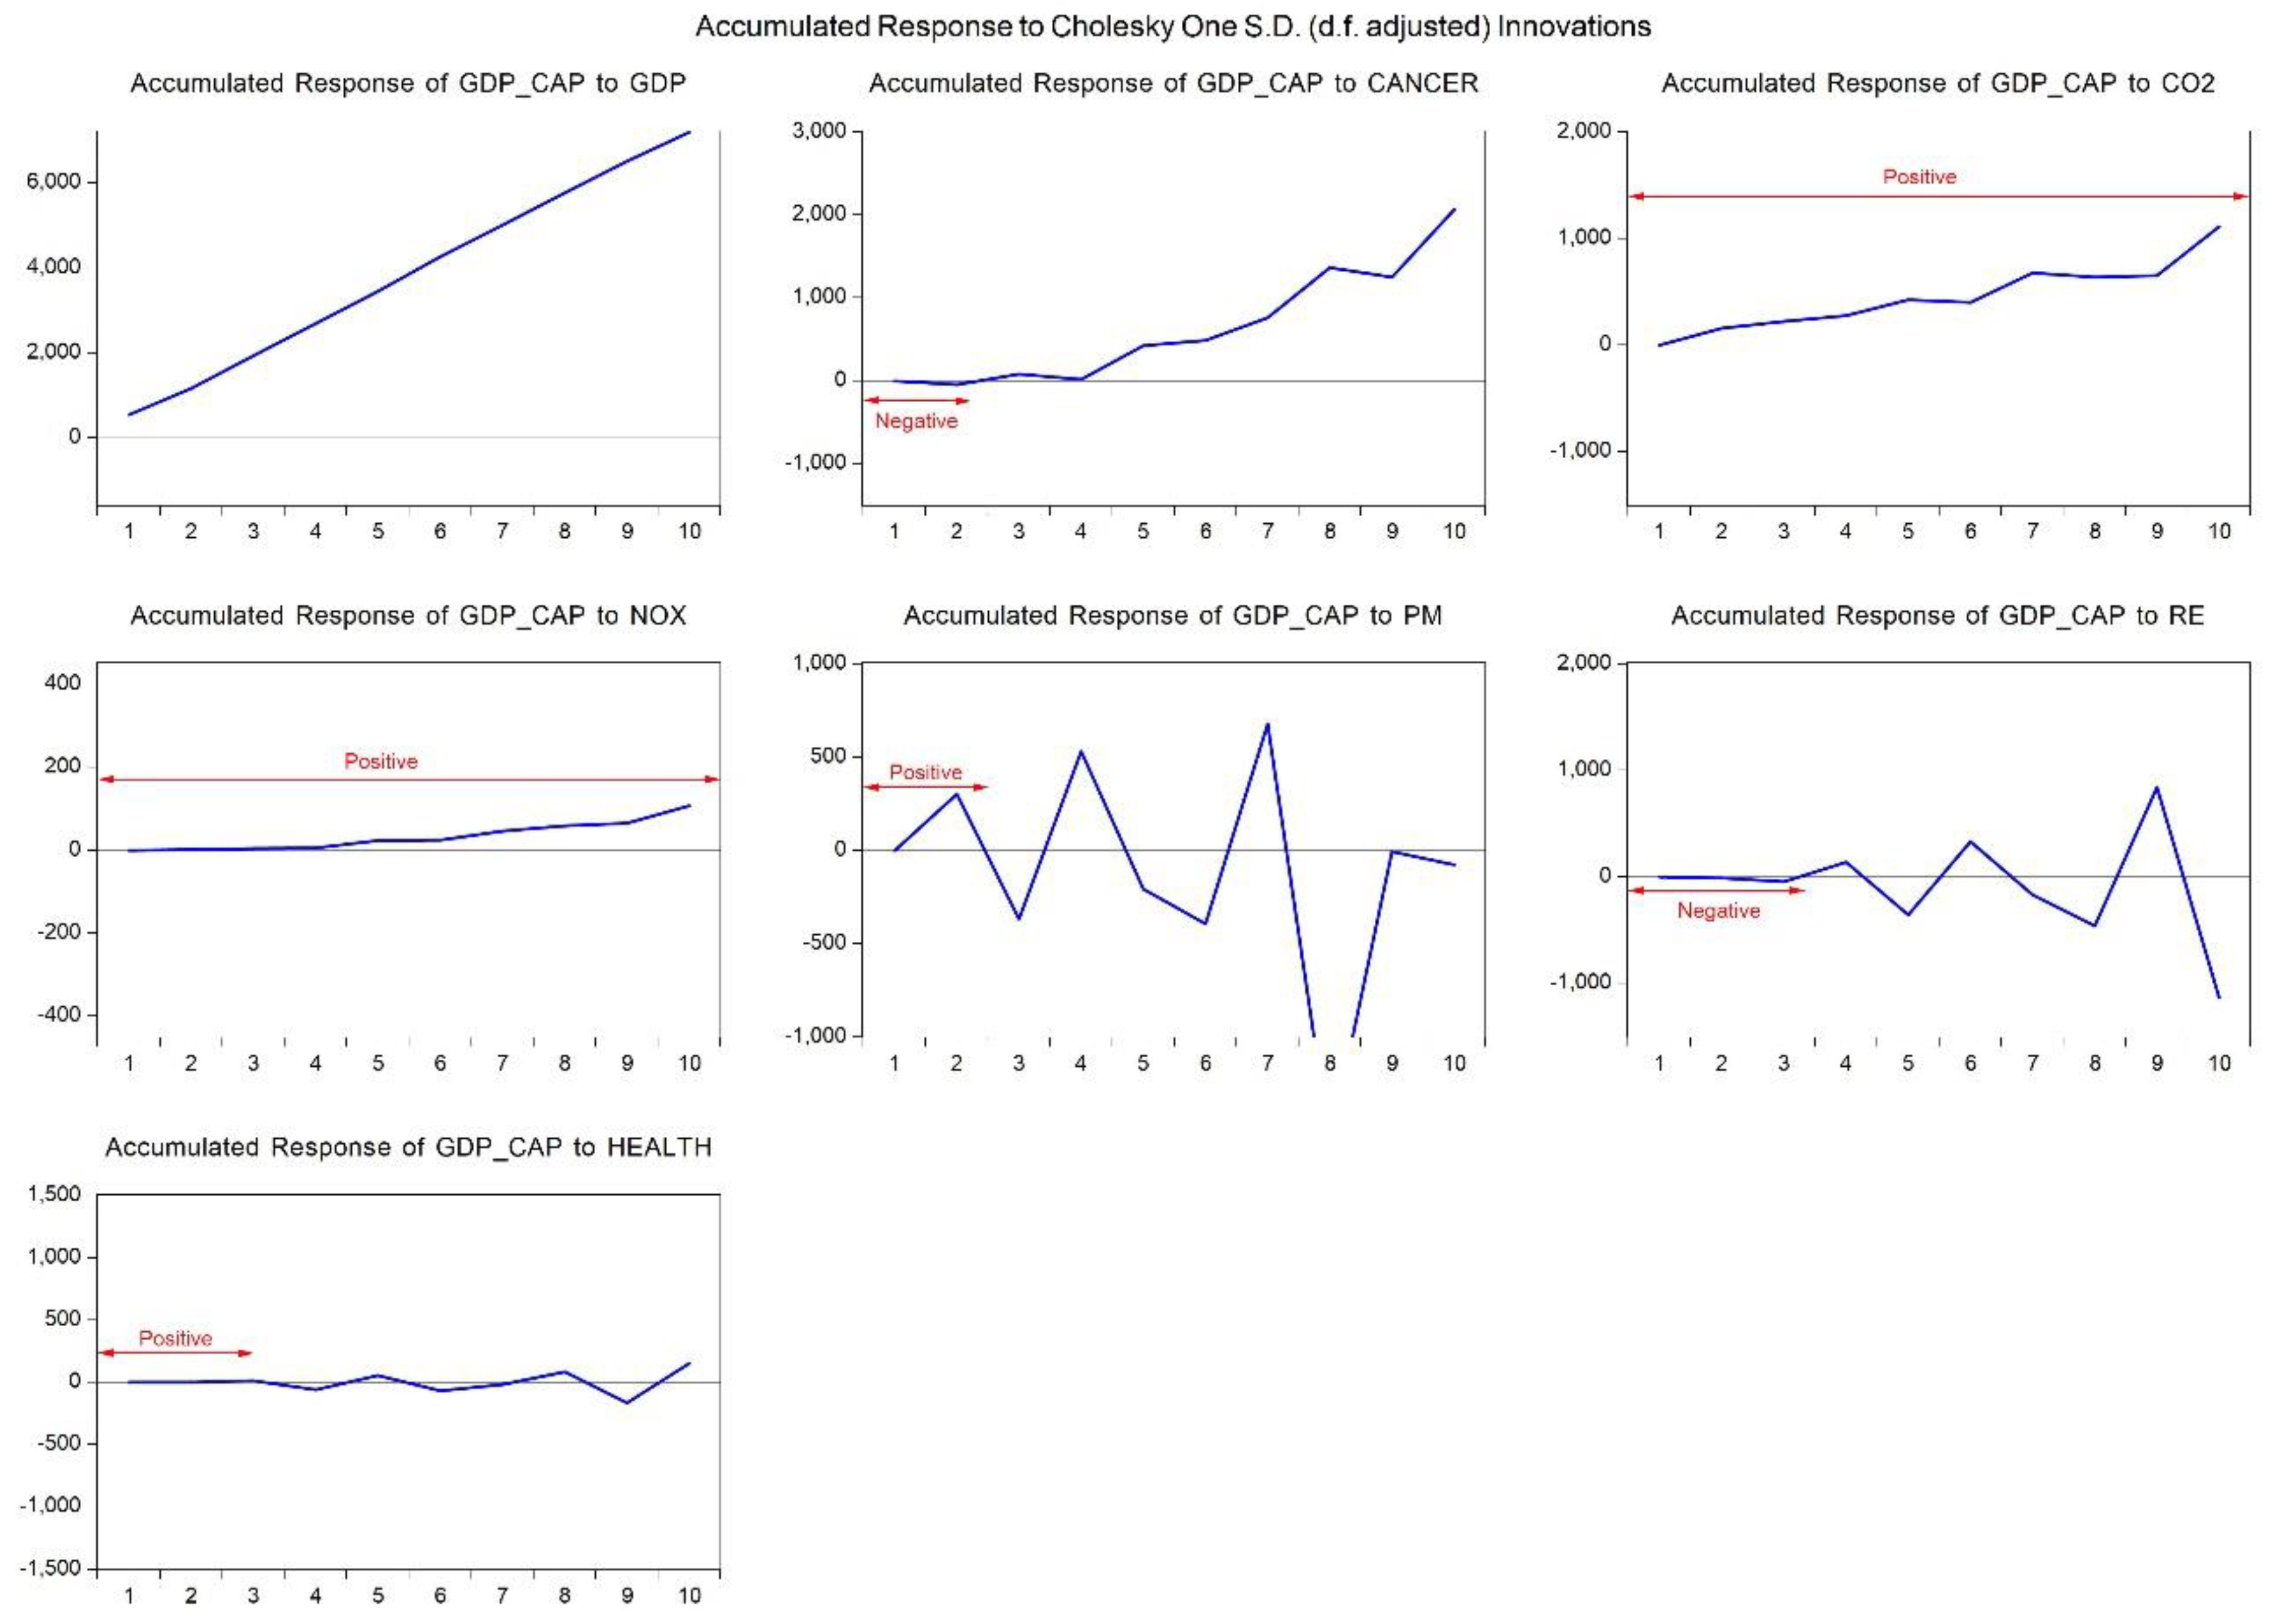
As the variable of interest in this section is GDP_CAP, only the accumulated responses of GDP_CAP to the impulse of explanatory variables are shown. The results of IRF are summarized in Figure 5. GDP_CAP’s response to CO2, NOX, PM, and HEALTH_EXP is statistically significant and positive. Conversely, it is significant and negative to RE and CANCER. This means that an increase in fossil fuel consumption and higher emissions (i.e., CO2, NOX, and PM2.5) due to cheap access to fossil fuels (mainly because of the enormous government subsidies) promote economic growth. However, higher fossil fuel consumption and harmful emissions cause severe diseases, such the lung cancer. Figure 5 shows that lung cancer prevalence negatively affects the GDP_CAP of the region. Owing to the increasing trend in fossil fuel consumption and the higher ratio of lung cancer prevalence, it is expected that this negative impact will further intensify. The association between RE and GDP_CAP is clearly negative; as currently, renewable energy projects are more expensive compared to fossil fuel projects. The expensiveness of the renewable energy sector is mainly due to the discriminative distribution of subsidies, as most of them are allocated to fossil fuels. If governments switch their subsidies from fossil fuels to renewable energy projects, and ease the channels of green financing, it will result in investment risk reduction and rate of return increase for these projects, thus making them more attractive for the private sector [32].
The last step of the economic analysis is the variance decomposition analysis. The MCE method is chosen using 100 repetitions. The Cholesky order is shown as: GDP_CAP, CANCER, CO2, NOX, PM, RE, and HEALTH_EXP. The analysis is restricted to ten periods. The result of the variance decomposition for GDP per capita in real terms (GDP_CAP) using the Cholesky DOF methodology is shown in Table 8.
The impacts of the PM and RE are maximized in the long run. After ten periods, exogenous shocks to PM and RE explain 43.50% and 27.35% of the forecast error variance of GDP_CAP, respectively. Additionally, 21.52% of the forecast error of GDP_CAP is explained by its own lagged values. Finally, 5.32% of the forecast error of GDP_CAP is explained by CANCER. In comparison, the remaining variables’ magnitudes are limited.
3.3. Robustness Check
Many panel data analysis techniques exist, and this section aims at providing a rationale for the selection of one of them as a robustness check. In the case of a dynamic panel model, certain estimation methods might decrease the robustness of the results. For instance, endogeneity can affect the consistency of the results of the ordinary least square (OLS) estimates. Since the period of our analysis is short and close to the number of cross sections, and to avoid endogeneity issues, we used the panel generalized method of moments (GMM) with fixed effects [33,34].
The lagged values of explanatory variables are used as instruments in the study. Owing to the short period of study, we only use one lag for the dependent variable as the regressor. A transformation is applied to the specification of the dynamic panel model to remove the cross-section fixed effect, and we use orthogonal deviations in the regression for this purpose. We use a two-step iteration, and as for the GMM weighting matrix, White (diagonal) is used, as innovations present a time series correlation that varies by cross-section. The results are presented in Table 9.
One of the assumptions of the GMM model is the absence of serial correlation in the error terms, and that regressors are uncorrelated with the error term, hence ensuring weakly exogenous regressors. As with other instrumental variable estimators, we test for the validity of the instrument. For this purpose, the Hansen test for overidentified restrictions is considered with the null hypotheses supporting the validity of instruments during the estimation. With a p-value of 0.85, we fail to reject our null hypothesis, and hence, we can say that the results of GMM are reliable. In addition, they are consistent with the VECM results, except for the HEALTH_EXP coefficient, which shows a negative sign in GMM, despite being non-statistically significant. Hence, we can retain the VECM results for other variables.
4. Conclusions and Policy Recommendations
Fossil fuels receive large energy subsidies in Southeast Asian economies, reducing the price of fossil fuels, and consequently, encouraging greater production and consumption resulting in higher emissions. As a result of the large consumption of fossil fuels and the high levels of ambient emissions in Southeast Asia, the incidence of respiratory system diseases (e.g., lung cancer) in this region is high. Hence, governments need to spend a larger share of their budget for subsidizing the health care system. Additionally, economies are suffering from productivity loss and labor force loss due to severe diseases, such as lung cancer, which are caused by pollution.
The empirical results of this study show that ambient PM2.5 air pollution of fossil fuels is one of the major risk factors of lung cancer in the ASEAN region. Therefore, the deployment of renewable energy can reduce emissions of CO2, NOX, and PM2.5, and consequently, reduce the lung cancer prevalence.
The nexus empirical results show that the accessibility of cheap fossil fuel is one of the reasons behind the accelerated GDP per capita growth in Southeast Asia. However, this has a latent cost, which has negative impacts on health (respiratory diseases such as lung cancer) and the economy, such as labor loss and economic burden in the future.
Governments need to switch subsidies from fossil fuels to renewable energy and green energy resources, specially in the low oil price era, to create a cleaner and healthy environment. In particular, cost creation for fossil fuel consumption through carbon taxation, especially in the power generation sector, is important to encourage the private sector to shift its operations to greener sources of energy.
Moreover, it is important to diversify the channels of financing for renewable projects, for example, through the allocation of carbon taxes or establishment of a green credit guarantee scheme [32], to increase the rate of return and reduce the risk of investment in renewable energy projects [35]. These policies will not only positively affect the quality of life in the region but might also help governments balance their budgets by reducing their healthcare expenditures. Furthermore, it will positively affect the soundness and quality of the labor force.
In addition to targeting the subsidies, if Southeast Asian economies plan to achieve the clean energy and climate change targets of the Sustainable Development Goals, as well as the targets set by the Paris Agreement, it is necessary to increase investments in projects that provide environmental benefits through creating new financial instruments and adopting new policies. To this end, governments have to adopt green finance instruments, such as green bonds, green banks, carbon market instruments, fiscal policy, green central banking, fintech, community-based green funds, and so on [36,37].
This study has potential limitations. Temporally, we applied data based-on yearly sequence. In this regard, we may miss the effects of swings in air pollution. Spatially, we used country-based data. However, there may be heterogeneity in air pollution among different cities of a country. Furthermore, our analysis does not include other risk factors of lung cancer (e.g., smoking, second-hand smoke, radon gas exposure, asbestos exposure, personal family history). Therefore, their confounding effects are not considered in our analysis. This limitation was also due to a shortage of data for several countries regarding each item. Further studies with more precise data can resolve these limitations.
Author Contributions
Conceptualization, F.T.-H. (Farhad Taghizadeh-Hesary), and F.T.-H. (Farzad Taghizadeh-Hesary); methodology, F.T.-H. (Farhad Taghizadeh-Hesary); software, F.T.-H. (Farhad Taghizadeh-Hesary); validation, F.T.-H. (Farhad Taghizadeh-Hesary), and F.T.-H. (Farzad Taghizadeh-Hesary); formal analysis, F.T.-H. (Farhad Taghizadeh-Hesary), and F.T.-H. (Farzad Taghizadeh-Hesary); investigation, F.T.-H. (Farzad Taghizadeh-Hesary); resources, F.T.-H. (Farhad Taghizadeh-Hesary); writing—original draft preparation, F.T.-H. (Farhad Taghizadeh-Hesary), and F.T.-H. (Farzad Taghizadeh-Hesary); writing—review and editing, F.T.-H. (Farhad Taghizadeh-Hesary), and F.T.-H. (Farzad Taghizadeh-Hesary); funding acquisition, F.T.-H. (Farhad Taghizadeh-Hesary). All authors have read and agreed to the published version of the manuscript.
Funding
This research was supported by JSPS Kakenhi (2019–2020), Grant-in-Aid for Young Scientists No. 19K13742, and Grant-in-Aid for Excellent Young Researcher of the Ministry of Education of Japan (MEXT).
Acknowledgments
This research paper is an output of the research project of the Economic Research Institute for ASEAN and East Asia (ERIA) titled: “A new Approach in Support of Sustainable Energy and Development”, carried out by the authors. The authors are grateful to Prof. Fukunari Kimura, Dr. Phoumin Han and all members of the working group of the aforementioned project, as the paper benefited from their precious comments.
Conflicts of Interest
The authors declare no conflict of interest.
References
- NCM. Making the Switch from Fossil Fuel Subsidies to Sustainable Energy; Nordic Council of Ministers: Copenhagen, Denmark, 2017. [Google Scholar]
- OECD. OECD Companion to the Inventory of Support Measures for Fossil Fuels 2015; Organisation for Economic Co-operation and Development: Paris, France, 2015. [Google Scholar] [CrossRef]
- WHO. 2019. Available online: https://www.who.int/westernpacific/health-topics/air-pollution (accessed on 30 July 2019).
- Loomis, D.; Grosse, Y.; Lauby-Secretan, B.; El Ghissassi, F.; Bouvard, V.; Benbrahim-Tallaa, L.; Guha, N.; Baan, R.; Mattock, H.; Straif, K. IARC evaluation of the carcinogenicity of outdoor air pollution. Environ. Risques St. 2014, 13, 347–352. [Google Scholar]
- Zehnder, C.; Manoylov, K.; Mutiti, S.; Mutiti, C.; VandeVoort, A.; Bennett, D. Introduction to Environmental Science, 2nd ed.; Biological Sciences Open Textbooks; University System of Georgia: Atlanta, GA, USA, 2018; Available online: https://oer.galileo.usg.edu/biology-textbooks/4 (accessed on 20 July 2019).
- Andreau, K.; Leroux, M.; Bouharrour, A. Health and Cellular Impacts of Air Pollutants: From Cytoprotection to Cytotoxicity. Biochem. Res. Int. 2012, 2012, 1–18. [Google Scholar] [CrossRef] [PubMed] [Green Version]
- Apergis, N.; Gupta, R.; Lau, C.K.M.; Jee, Z.M.U.S. state-level carbon dioxide emissions: Does it affect health care expenditure? Renew. Sustain. Energy Rev. 2018, 91, 521–530. [Google Scholar] [CrossRef] [Green Version]
- Bayat, R.; Ashrafi, K.; Motlagh, M.S.; Hassanvand, M.S.; Daroudi, R.; Fink, G.; Künzli, N. Health impact and related cost of ambient air pollution in Tehran. Environ. Res. 2019, 176, 108547. [Google Scholar] [CrossRef]
- Cao, C.; Cui, X.Q.; Cai, W.; Wang, C.; Xing, L.; Zhang, N.; Shen, S.; Bai, Y.; Deng, Z. Incorporating health co-benefits into regional carbon emission reduction policy making: A case study of China’s power sector. Appl. Energy 2019, 253, 113498. [Google Scholar] [CrossRef]
- Kwan, S.C.; Tainio, M.; Woodcock, J.; Sutan, R.; Hashim, J.H. The carbon savings and health co-benefits from the introduction of mass rapid transit system in Greater Kuala Lumpur, Malaysia. J. Transp. Health 2017, 6, 187–200. [Google Scholar] [CrossRef]
- Gao, Y.; Liu, G.; Casazza, M.; Hao, Y.; Zhang, Y.; Giannetti, B.F. Economy-pollution nexus model of cities at river basin scale based on multi-agent simulation: A conceptual framework. Ecol. Model. 2018, 379, 22–38. [Google Scholar] [CrossRef]
- Ji, X.; Yao, Y.; Long, X. What causes PM2.5 pollution? Cross-economy empirical analysis from socioeconomic perspective. Energy Policy 2018, 119, 458–472. [Google Scholar] [CrossRef]
- Lean, H.H.; Smyth, R. CO2 emissions, electricity consumption and output in ASEAN. Appl. Energy 2010, 87, 1858–1864. [Google Scholar] [CrossRef]
- Xie, Y.; Dai, H.; Zhang, Y.; Wu, Y.; Hanaoka, T.; Masui, T. Comparison of health and economic impacts of PM2.5 and ozone pollution in China. Environ. Int. 2019, 130, 104881. [Google Scholar] [CrossRef]
- Kutikova, L.; Bowman, L.; Chang, S.; Long, S.R.; Obasaju, C.; Crown, W.H. The economic burden of lung cancer and the associated costs of treatment failure in the United States. Lung Cancer 2005, 50, 143–154. [Google Scholar] [CrossRef] [PubMed]
- Park, Y.S.; Kim, S.H.; Park, S.K.; Park, B.-J.; Kim, Y.T.; Lee, S.-M.; Yim, J.-J.; Yoo, C.-G.; Kim, Y.W.; Han, S.K.; et al. Costs for 5-year lung cancer survivors in a tertiary care hospital in South Korea. Lung Cancer 2010, 68, 299–304. [Google Scholar] [CrossRef] [PubMed]
- Schulenburg, J.M.G.; Pauer, F. Rare cancers—Rarity as a cost and value argument. J. Cancer Policy 2017, 11, 54–59. [Google Scholar] [CrossRef]
- Rice, S.A. Human health risk assessment of CO2: Survivors of acute high-level exposure and populations sensitive to prolonged low-level exposure. In Proceedings of the Third Annual Conference on Carbon Sequestration, Alexandria, VA, USA, 3–6 May 2004; Available online: http://www.netl.doe.gov/publications/proceedings/04/carbon-seq/169.pdf (accessed on 24 March 2020).
- Shigemura, M.; Lecuona, E.; Sznajder, J.I. Effects of hypercapnia on the lung. J. Physiol. 2017, 595, 2431–2437. [Google Scholar] [CrossRef] [Green Version]
- Merryman, J.I.; Park, P.G.; Schuller, H.M. Carbon dioxide, an important messenger molecule for small cell lung cancer. Chest 1997, 112, 779–784. [Google Scholar] [CrossRef]
- Akbari, H.; Taghizadeh-Hesary, F.; Heike, Y.; Bahadori, M. Cell Energy: A New Hypothesis in Decoding Cancer Evolution. Arch. Iran. Med. 2019, 22, 733–735. [Google Scholar]
- WHO. 2018. Available online: https://www.who.int/gho/phe/outdoor_air_pollution/en/ (accessed on 30 July 2019).
- Schraufnagel, D.E.; Balmes, J.R.; Cowl, C.T.; Matteis, S.D.; Jung, S.-H.; Mortimer, K.; Perez-Padilla, R.; Rice, M.B.; Riojas-Rodriguez, H.; Sood, A.; et al. Air Pollution and Noncommunicable Diseases: A Review by the Forum of International Respiratory Societies’ Environmental Committee, Part 2: Air Pollution and Organ Systems. Chest 2019, 155, 417–426. [Google Scholar] [CrossRef]
- WHO. 2018. Available online: https://www.who.int/cancer/PRGlobocanFinal.pdf (accessed on 29 July 2019).
- De Groot, P.M.; Wu, C.C.; Carter, B.W.; Munden, R.F. The epidemiology of lung cancer. Transl. Lung Cancer Res. 2018, 7, 220–233. [Google Scholar] [CrossRef]
- Badar, F.; Meerza, F.; Khokhar, R.A.; Ali, F.A.; Irfan, N.; Kamran, S.; Shahid, N.; Mahmood, S. Characteristics of lung cancer patients-the Shaukat Khanum Memorial experience. Asian Pac. J. Cancer Prev. 2006, 7, 245–248. [Google Scholar]
- Krinsky, N.I.; Johnson, E.J. Carotenoid actions and their relation to health and disease. Mol. Asp. Med. 2005, 26, 459–516. [Google Scholar] [CrossRef]
- Upadhyay, D.; Panduri, V.; Ghio, A.; Kamp, D.W. Particulate matter induces alveolar epithelial cell DNA damage and apoptosis: Role of free radicals and the mitochondria. Am. J. Respir. Cell Mol. Biol. 2003, 29, 180–187. [Google Scholar] [CrossRef] [PubMed] [Green Version]
- Eckel, S.P.; Cockburn, M.; Shu, Y.H.; Deng, H.; Lurmann, F.W.; Liu, L.; Gilliland, F.D. Air pollution affects lung cancer survival. Thorax 2016, 71, 891–898. [Google Scholar] [CrossRef] [PubMed] [Green Version]
- Vineis, P.; Hoek, G.; Krzyzanowski, M.; Vigna-Taglianti, F.; Veglia, F.; Airoldi, L.; Autrup, H.; Dunning, A.; Garte, S.; Hainaut, P.; et al. Air pollution and risk of lung cancer in a prospective study in Europe. Int. J. Cancer 2006, 119, 169–174. [Google Scholar] [CrossRef] [PubMed]
- Ferlay, J.; Soerjomataram, I.; Dikshit, R.; Eser, S.; Mathers, C.; Rebelo, M.; Parkin, D.M.; Forman, D.; Bray, F. Cancer incidence and mortality worldwide: Sources, methods and major patterns in GLOBOCAN 2012. Int. J. Cancer 2015, 136, E359–E386. [Google Scholar] [CrossRef] [PubMed]
- Taghizadeh-Hesary, F.; Yoshino, N. The way to induce private participation in green finance and investment. Financ. Res. Lett. 2019, 31, 98–103. [Google Scholar] [CrossRef]
- Arellano, M.; Bond, S. Some Tests of Specification for Panel Data: Monte Carlo Evidence and an Application to Employment Equations. Rev. Econ. Stud. 1991, 58, 277–297. [Google Scholar] [CrossRef] [Green Version]
- Holtz-Eakin, D.; Newey, W.; Rosen, H.D. Estimating Vector Autoregressions with Panel Data. Econometrica 1988, 56, 1371–1395. [Google Scholar] [CrossRef]
- Yoshino, N.; Taghizadeh-Hesary, F.; Nakahigashi, M. Modelling the social funding and spill-over tax for Addressing the green energy financing gap. Econ. Model. 2019, 77, 34–41. [Google Scholar] [CrossRef]
- Sachs, J.D.; Woo, W.T.; Yoshino, N.; Taghizadeh-Hesary, F. Importance of green finance for achieving sustainable development goals and energy security. In Handbook of Green Finance: Energy Security and Sustainable Development; Sachs, J.D., Woo, W.T., Yoshino, N., Taghizadeh-Hesary, F., Eds.; Springer: Singapore, 2019. [Google Scholar]
- Taghizadeh-Hesary, F.; Yoshino, N. Sustainable Solutions for Green Financing and Investment in Renewable Energy Projects. Energies 2020, 13, 788. [Google Scholar] [CrossRef] [Green Version]
Figure 1.
Lung cancer incidence in Southeast Asia (Estimated numbers x 100). Source: GLOBOCAN (IARC).
Figure 1.
Lung cancer incidence in Southeast Asia (Estimated numbers x 100). Source: GLOBOCAN (IARC).

Figure 2.
Disease burden rates by cancer type, Southeast Asia, 2016, age-standardized disability-adjusted life year (DALY) rates per 100,000 individuals by cancer types. Note: DALYs are used to measure the total burden of disease: both from the years of life lost and years lived with a disability. One DALY equals one lost year of healthy life. Source: prepared by the authors based on data from IHME, Global Burden of Disease.

Figure 3.
Costs structure of lung cancer and severe respiratory diseases. Source: Depicted by the authors.
Figure 3.
Costs structure of lung cancer and severe respiratory diseases. Source: Depicted by the authors.

Figure 4.
Accumulated response of CANCER to Cholesky one S.D. innovations. Note: Vertical axis is accumulated response of CANCER to Cholesky one standard deviation innovations, Horizontal axis is period of time. Source: Authors’ compilation from Eviews 10.00.
Figure 4.
Accumulated response of CANCER to Cholesky one S.D. innovations. Note: Vertical axis is accumulated response of CANCER to Cholesky one standard deviation innovations, Horizontal axis is period of time. Source: Authors’ compilation from Eviews 10.00.

Figure 5.
Response of GDP_CAP. Note: Vertical axis is the accumulated response of GDP_CAP to Cholesky one standard deviation innovations, horizontal axis is period of time. Source: Authors’ compilation from Eviews 10.00.
Figure 5.
Response of GDP_CAP. Note: Vertical axis is the accumulated response of GDP_CAP to Cholesky one standard deviation innovations, horizontal axis is period of time. Source: Authors’ compilation from Eviews 10.00.


Table 1.
Definition of data.
| Variable | Description |
|---|---|
| CANCER | Age-standardized lung cancer prevalence |
| CO2 | CO2 emissions (metric tons) per capita |
| NOX | Nitrous oxide emissions (thousand metric tons of CO2 equivalent) per capita |
| PM | Ambient PM2.5 air pollution mean annual exposure micrograms per cubic meter |
| RE | Renewable energy consumption % of total final energy consumption (excluding traditional biomass) |
| HEALTH_EXP | External health expenditure per capita in US$ |
| GDP_CAP | GDP per capita (constant 2010 US$) |
Source: Authors compilation.
Table 2.
Unit root test (Fisher- Augmented-Dickey–Fuller (ADF)).
| Variable | Fisher-ADF | H0 | Stationary |
|---|---|---|---|
| CANCER | 18.83 | Accept | No |
| D(CANCER) | 48.81 | Reject | Yes |
| CO2 | 12.08 | Accept | No |
| D(CO2) | 74.02 | Reject | Yes |
| NOX | 17.31 | Accept | No |
| D(NOX) | 77.68 | Reject | Yes |
| PM | 13.45 | Accept | No |
| D(PM) | 36.57 | Reject | Yes |
| HEALTH_EXP | 16.35 | Accept | No |
| D(HEALTH_EXP) | 55.56 | Reject | Yes |
| GDP_CAP | 0.62 | Accept | No |
| D(GDP_CAP) | 39.95 | Reject | Yes |
| RE | 4.9 | Accept | No |
| D(RE) | 75.12 | Reject | Yes |
Source: Authors’ compilation from Eviews 10.00. Note: D(X) denotes the first differences, Fisher-ADF = Fisher-Augmented-Dickey—Fuller.
Table 3.
Robustness check for panel unit root test result.
| Variable | Levin, Lin & Chu | Fisher PP Chi-Square | Stationary |
|---|---|---|---|
| CANCER | −1.49 | 25.97 | No |
| D(CANCER) | −2.36 | 123 | Yes |
| CO2 | 1.27 | 13.46 | No |
| D(CO2) | −5.23 | 132.94 | Yes |
| NOX | 1.19 | 2.11 | No |
| D(NOX) | −38.11 | 166.16 | Yes |
| PM | 2.39 | 2.09 | No |
| D(PM) | −12.11 | 180.76 | Yes |
| HEALTH_EXP | −0.81 | 8.67 | No |
| D(HEALTH_EXP) | −13.22 | 114.52 | Yes |
| GDP_CAP | 1.19 | 0.43 | No |
| D(GDP_CAP) | −13.67 | 93.78 | Yes |
| RE | 3.95 | 6.99 | No |
| D(RE) | −15.41 | 177.14 | Yes |
Source: Authors’ compilation from Eviews 10.00.
Table 4.
Kao residual cointegration test (ADF test).
| t-Statistic | p-Value | |
|---|---|---|
| Augmented Dickey-Fuller | −2.54 ** | 0.00 |
Note: (**) shows rejection of the null hypothesis of no-cointegration with statistical significance at the 1% level. Source: Authors’ compilation from Eviews 10.00.
Table 5.
Robustness check for the cointegration test (Pedroni Panel test).
| PEDRONI PANEL TEST | STATISTIC | PROB. | WEIGHTED STATISTIC | PROB. |
|---|---|---|---|---|
| PANEL V-STATISTIC | −137.19 | 1.00 | −3.36 | 0.99 |
| PANEL RHO-STATISTIC | 2.12 | 0.98 | 2.08 | 0.98 |
| PANEL PP-STATISTIC | −12.68 | 0.00 ** | −19.58 | 0.00 ** |
| PANEL ADF-STATISTIC | −6.47 | 0.00 ** | −6.55 | 0.00 ** |
| GROUP RHO-STATISTIC | 3.42 | 0.99 | - | - |
| GROUP PP-STATISTIC | −21.26 | 0.00 ** | - | - |
| GROUP ADF-STATISTIC | −6.82 | 0.00 ** | - | - |
Note: (**) shows statistical significance at the 1% level. Source: Authors’ compilation from Eviews 10.00.
Table 6.
Short-run dynamics based on a panel vector error correction model (VECM).
| Error Correction: | CANCER | CO2 | NOX | PM | RE | HEALTH_ EXP | GDP_CAP |
|---|---|---|---|---|---|---|---|
| ECT | −0.112 * (0.016) | −4.7×10−5 * (3.4×10−6) | −0.019 (0.672) | 1.15×10−6 * (7.1×10−8) | −5.6×10−5 * (3.9×10−6) | −5.9×10⁻⁵ (4.0×10⁻⁵) | −0.004 (0.02) |
| CANCER(-1) | 1.90 * (0.08) | 0.11 * (0.02) | 0.22 (0.15) | 0.80 (0.5) | −0.08 (0.1) | −0.006 (0.004) | 2.24 (1.31) |
| CANCER(-2) | 1.40 * (0.24) | 0.13 * (0.03) | 0.28 * (0.07) | 0.74 * (0.021) | −0.11 * (0.00) | −0.007 (0.90) | −24.79 (13.97) |
| R-squared | 0.87 | 0.83 | 0.32 | 0.94 | 0.65 | 0.43 | 0.69 |
Note: ECT = Error Correction Term, Standard errors in parenthesis, (*) shows statistical significance at the 5% level. Source: Authors’ compilation from Eviews 10.00.
Table 7.
Variance decomposition of CANCER.
| Period | CANCER | CO2 | NOX | PM | RE | HEALTH_EXP | GDP_CAP |
|---|---|---|---|---|---|---|---|
| 1 | 100 | 0 | 0 | 0 | 0 | 0 | 0 |
| 2 | 95.75 | 0.71 | 0.44 | 1.52 | 0.03 | 0 | 1.53 |
| 3 | 84.67 | 0.68 | 0.25 | 13.13 | 0.02 | 0.04 | 1.19 |
| 4 | 74.14 | 0.64 | 0.21 | 24.35 | 0.2 | 0.01 | 0.44 |
| 5 | 64.10 | 0.61 | 0.11 | 29.96 | 4.77 | 0.02 | 0.41 |
| 6 | 49.01 | 0.55 | 0.07 | 26.27 | 23.67 | 0.02 | 0.38 |
| 7 | 37.11 | 0.48 | 0.05 | 32.92 | 29.18 | 0.04 | 0.22 |
| 8 | 22.05 | 0.37 | 0.04 | 44.53 | 32.83 | 0.03 | 0.13 |
| 9 | 10.21 | 0.31 | 0.02 | 49.26 | 39.24 | 0.04 | 0.85 |
| 10 | 1.64 | 0.22 | 0.01 | 53.78 | 44.21 | 0.05 | 0.07 |
Source: Authors’ compilation from Eviews 10.00. Ordering of the variables: CANCER; CO2, NOX, PM, RE, HEALTH_EXP, GDP_CAP.
Table 8.
Variance decomposition of GDP_CAP.
| Period | GDP_CAP | CANCER | CO2 | NOX | PM | RE | HEALTH_EXP |
|---|---|---|---|---|---|---|---|
| 1 | 100.00 | 0.00 | 0.00 | 0.00 | 0.00 | 0.00 | 0.00 |
| 2 | 85.33 | 0.24 | 3.04 | 0.00 | 11.35 | 0.02 | 0.00 |
| 3 | 68.34 | 0.89 | 1.54 | 0.00 | 29.14 | 0.06 | 0.01 |
| 4 | 56.19 | 0.62 | 0.97 | 0.00 | 40.99 | 1.04 | 0.17 |
| 5 | 50.00 | 3.87 | 1.09 | 0.00 | 38.91 | 5.71 | 0.39 |
| 6 | 51.15 | 3.18 | 0.89 | 0.00 | 31.82 | 12.36 | 0.56 |
| 7 | 44.74 | 3.28 | 1.61 | 0.00 | 37.66 | 12.21 | 0.45 |
| 8 | 29.61 | 4.39 | 0.93 | 0.00 | 57.12 | 7.59 | 0.33 |
| 9 | 25.07 | 3.35 | 0.69 | 0.00 | 55.68 | 14.58 | 0.58 |
| 10 | 21.52 | 5.32 | 1.41 | 0.01 | 43.50 | 27.35 | 0.87 |
Note: Cholesky Ordering: GDP_CAP, CANCER, CO2, NOX, PM, RE, HEALTH_EXP. Source: Authors’ compilation from Eviews 10.00.
Table 9.
Results using the Panel Generalized Method of Moments (GMM).
| Variable | Expected Sign based on VECM | Coefficient | t-Statistic | p-Value |
|---|---|---|---|---|
| D(GDP_CAP) | (+) | 0.94 | 1663.37 ** | 0.00 |
| CANCER | (−) | −5.35 | −140.29 ** | 0.00 |
| CO2 | (+) | 4.40 | 7.51 ** | 0.00 |
| PM | (+) | 83.78 | 32.31 ** | 0.00 |
| RE | (−) | −49.79 | −20.78 ** | 0.00 |
| HEALTH_EXP | (+) | −9.03 | −1.04 | 0.30 |
| Hansen Test for overidentified Restrictions | 0.85 | |||
Note: ** denotes significant results at the 1% level. Dependent variable: GDP_CAP, Method: Panel Generalized Method of Moments (GMM), Source: Authors’ compilation from Eviews 10.00.
© 2020 by the authors. Licensee MDPI, Basel, Switzerland. This article is an open access article distributed under the terms and conditions of the Creative Commons Attribution (CC BY) license (http://creativecommons.org/licenses/by/4.0/).
Share and Cite
MDPI and ACS Style
Taghizadeh-Hesary, F.; Taghizadeh-Hesary, F. The Impacts of Air Pollution on Health and Economy in Southeast Asia. Energies 2020, 13, 1812. https://doi.org/10.3390/en13071812
AMA Style
Taghizadeh-Hesary F, Taghizadeh-Hesary F. The Impacts of Air Pollution on Health and Economy in Southeast Asia. Energies. 2020; 13(7):1812. https://doi.org/10.3390/en13071812
Chicago/Turabian StyleTaghizadeh-Hesary, Farhad, and Farzad Taghizadeh-Hesary. 2020. "The Impacts of Air Pollution on Health and Economy in Southeast Asia" Energies 13, no. 7: 1812. https://doi.org/10.3390/en13071812
Note that from the first issue of 2016, this journal uses article numbers instead of page numbers. See further details here.