Electrical Loads and Power Systems for the DEMO Nuclear Fusion Project
by
 , and
, and
Simone Minucci
1, 
Stefano Panella
2,
Sergio Ciattaglia
3,
Maria Carmen Falvo
2 and
Alessandro Lampasi
4,* 1
Department of Economics, Engineering, Society and Business Organization, University of Tuscia, 01100 Viterbo, Italy
2
Department of Astronautics, Energy and Electrical Engineering, University of Rome Sapienza, 00184 Rome, Italy
3
EUROfusion Consortium, 85748 Garching bei München, Germany
4
National Agency for New Technologies, Energy and Sustainable Economic Development (ENEA), 00044 Frascati, Italy
*
Author to whom correspondence should be addressed.
Energies 2020, 13(9), 2269; https://doi.org/10.3390/en13092269
Submission received: 16 March 2020
/
Revised: 17 April 2020
/
Accepted: 22 April 2020
/
Published: 4 May 2020
(This article belongs to the Special Issue Smart Energy, Plasma and Nuclear Systems)
Abstract
:EU-DEMO is a European project, having the ambitious goal to be the first demonstrative power plant based on nuclear fusion. The electrical power that is expected to be produced is in the order of 700–800 MW, to be delivered via a connection to the European High Voltage electrical grid. The initiation and control of fusion processes, besides the problems related to the nuclear physics, need very complex electrical systems. Moreover, also the conversion of the output power is not trivial, especially because of the inherent discontinuity in the EU-DEMO operations. The present article concerns preliminary studies for the feasibility and realization of the nuclear fusion power plant EU-DEMO, with a special focus on the power electrical systems. In particular, the first stage of the study deals with the survey and analysis of the electrical loads, starting from the steady-state loads. Their impact is so relevant that could jeopardy the efficiency and the convenience of the plant itself. Afterwards, the loads are inserted into a preliminary internal distribution grid, sizing the main electrical components to carry out the power flow analysis, which is based on simulation models implemented in the DIgSILENT PowerFactory software.
Keywords:
balance of plant; DEMO; electric loads; nuclear fusion; plasma; power flow; power supply; power systems1. Introduction
EU-DEMO (the DEMOnstration fusion power reactor proposed by the European Union), or simply DEMO, is a unique European project, as it will be the first demonstrative nuclear fusion power plant able to produce and distribute electrical power throughout Europe, thanks to a connection with the European High Voltage (HV) electrical grid (typically at 400 kV) [1,2,3].
To accomplish this challenging purpose, the European Union set up the EUROfusion Consortium, whose main goals and tasks are summarized in the “European Research Roadmap to the Realisation of Fusion Energy” [4]. The schedule and the milestones of the Roadmap are sketched in Figure 1.
Even though other alternative approaches are being investigated in EUROfusion [4] and in another research facility [5], the EUROfusion Roadmap is based on two tokamak projects: DEMO and ITER [6]. The latter is currently under construction in Cadarache (France) with a worldwide contribution and aims at:
- Producing 500 MW of fusion power for pulses of at least 400 s.
- Demonstrating the integrated operation of technologies for a fusion power plant.
- Achieving a deuterium-tritium plasma where reactions are sustained through internal heating.
- Testing tritium breeding.
- Demonstrating the safety characteristics of a fusion device, both for human and environment.
These goals are important and partially common with the DEMO project, so that it can use ITER-like solutions for possible future issues. However, DEMO will be bigger than ITER in terms of size and of required services, also because it will be connected to the grid to deliver the produced electrical energy, unlike ITER. Also the time required for the realization of these two projects is different: while it is foreseen to start ITER first experiments by 2025 and to operate with deuterium and tritium by 2035, DEMO is expected to be in operation around by 2050.
In the past, fusion devices were generally not regarded as nuclear facilities and did not need a nuclear license. However, ITER and DEMO are much more critical in terms of tritium inventory, neutron flux, pulse duration, stored magnetic energy, cooling system enthalpy and amount of helium at 4 K. ITER demonstrated its safety and obtained the nuclear license to start the construction. Nevertheless, specific nuclear regulations are likely to be introduced for next-generation devices, also depending on the host country. As DEMO is expected to have more neutronic flux and more inventory of tritium than ITER, a license from authorities will be necessary before starting the construction of safety-classified systems.
As a nuclear facility, a specific design is necessary for the DEMO Balance of Plant (BoP), that is the nuclear engineering term referred to all the supporting and auxiliary systems needed for energy conversion and delivering, excluding all the nuclear components. Therefore, EUROfusion is promoting a multidisciplinary research and engineering activity that is approaching the design of the DEMO BoP [7,8], even moving from the experience of the other experimental tokamaks and nuclear-fission power plants. One of the most critical part of the BoP is the electrical power system, also because this system is not trivial both in terms of size and of complexity.
The present paper introduces the preliminary studies for the feasibility and realization of the electrical system of the nuclear fusion power plant DEMO. In particular, the results of the following activities are described:
- Preliminary design of part of the internal distribution network and preliminary sizing of the main electrical components of part of the internal distribution grid (conception and development of simulation models for the power flow analysis) then implemented in the DIgSILENT PowerFactory software environment.
The loads characterization and classification is the starting point for first electrical designs and is expected to provide more realistic data than those in previous analyses based on theoretical considerations [11].
This paper is organized in seven sections. Section 2 introduces the relevant DEMO figures and explains possible configurations and operation phases. Section 3 presents the preliminary layout of the DEMO site as used for the electrical analysis. Section 4 introduces the main options of the BoP and the basic principles for the design of the electrical systems. Section 5 is focused on the survey of the main DEMO subsystems and electrical loads and on the results obtained by the load analysis and characterization. Section 6 presents the results on the preliminary design and sizing of a part of the internal distribution grid. Section 7 reports the paper’s conclusions.
2. DEMO Characteristics and Operation Phases
The tokamak operations are based on the heating of a plasma up to temperatures at which it is self-sustained by the fusion processes induced by the ion thermal motion. In DEMO, the plasma heats up the surrounding structure, the tokamak Breeding Blanket (BB), and the fluid used to cool down the BB can drive a Turbine Generator (TG) through proper heat exchangers. The energy produced by such process is expected to be higher than the energy employed to initiate the fusion reactions. In order to reach high temperatures (about 150 M°C), DEMO could use three different kinds of additional Heating and Current Drive (H&CD) systems [10,12]:
- Radiofrequency heating at ion cyclotron resonance frequency (ICRH), based on high-intensity beams of electromagnetic radiation able to excite the ions in the plasma at their own resonance frequency (in the order of tens of megahertz).
- Microwave heating at electron cyclotron resonance frequency (ECRH), based on electromagnetic radiations able to heat the electrons (and then the ions) up in the plasma at their own resonance frequency (in the order of hundreds of gigahertz).
- Negative neutral beam injectors (N-NBIs or simply NBIs), shooting neutral high-energy particles into the plasma where they transfer their energy by collisions.
The heat produced by the plasma fusion must be transferred to Power Conversion System (PCS) able to transform it into electrical energy with maximum possible efficiency and reliability: this is the main scope of the BoP. In the present status of the DEMO project, two alternative solutions are considered as basic fluid to cool down the BB: water and helium [8,13,14]. Consequently, two options are considered for the Primary Heat Transfer System (PHTS):
- Water Cooled Lithium Lead (WCLL).
- Helium Cooled Pebble Bed (HCPB).
The DEMO operations are strictly related to the physics of the plasma. This also implies a difficulty to achieve very long or steady-state operations that would be preferable for the energy budget. A lot of fusion research is devoted to the possibility of steady-state operations, but presently without relevant practical results. On the other hand, pulsed operations simplify tokamak physics and may be more flexible in an energy market ruled by renewable sources. Presently, the DEMO operations are supposed to be pulsed in basic option but could be steady-state in future advanced ones. Therefore, unlike nuclear-fission power plants, the DEMO BoP and electrical systems must be designed for pulsed operations for both the two cooling system options in the PHTS-PCS.
In fact, even though a relevant output power is produced only during the plasma flat-top phase, other operation phases are necessary to achieve the correct execution of the pulse. In particular, the DEMO operations consist of seven phases:
- (1)
- Central solenoid (CS) pre-magnetization. Some superconductive magnets, in particular those located in the toroid hole (CS), must be energized to attain a suitable value of magnetic flux into the Vacuum Vessel (VV). The energization current in the DEMO CS modules is expected to be up to 45 kA and to span the range ±45 kA [15]. The duration of the pre-magnetization phase mainly depends on the maximum possible charge rate of the superconductors. The pre-magnetization is typically executed by supplying the superconductors at rather constant voltage, producing an increasing current and resulting in an increasing power demand from the grid. The start of the pre-magnetization phase is conventionally set to a negative value of time and ends at zero.
- (2)
- Plasma breakdown. It is the shortest (about 1 s) but also the most critical phase from the power supply point of view. The plasma initiation requires high-power pulses in several superconducting coils (at least in the CS). The effective presence of the plasma in the tokamak vessel starts in this phase.
- (3)
- Plasma ramp-up. In this phase, the plasma current is progressively increased by the coils and H&CD sources. The ramp-up must be slow in order to keep the plasma under control. On the other hand, the available CS magnetic flux is consumed by the ramp-up duration, reducing the useful time for the production of electrical energy.
- (4)
- Heating flat-top. All the H&CD sources are used to heat up the plasma until fusion temperature and conditions are reached.
- (5)
- Burn flat-top. DEMO produces energy thanks to the nuclear fusion reactions. Ideally, during this phase, the fusion reactions taking place at a sustainable rate guarantee the self-sustainment of the plasma. This phase is very long, about 7200 s (2 h).
- (6)
- Plasma ramp-down. The plasma is gradually switched off, maintaining its control by coil and H&CD power.
- (7)
- Dwell time. It is the time required after the pulse to bring DEMO to a condition stable enough to start a new pulse and to create an adequate vacuum inside the plasma chamber. Of course, it is desirable that the DEMO design will progress towards negligible dwell times. Actually, dwell time conventionally includes also the CS pre-magnetization phase since the CS charging action belongs to those operations necessary to complete a pulse and start the following one. However, since this operation does not last the whole dwell time, in this work they are managed as two different and consecutive phases.
This pulsed behavior may introduce specific problems for the BoP. First, discontinuous operations would be damaging to the turbine, then the variable flow of the expected huge powers may let some instabilities arise into the external grid that could even refuse or limit the connection. This problem is even more critical because of the relevant reactive components in power. The durations of the main plasma phases according to last DEMO design are summarized in Table 1.
In order to reduce the output power fluctuations, an intermediate buffer system could be inserted between the PHTS and the PCS. Therefore, two different approaches are under evaluation about the PHTS-PCS coupling [13,14] for both the two cooling options:
- PHTS-PCS direct cycle, characterized by direct coupling between the PHTS and the PCS.
- PHTS-PCS indirect cycle, having an Intermediate Heat Transfer System (IHTS) and thermal Energy Storage System (ESS) between the PHTS and the PCS.
The thermal efficiency in the direct cycle option is higher but the TG’s life cycle is compromised because it is turned on only during the burn flat-top phase. The thermal energy is extracted from the BB by water or helium, then it is transferred to steam supplying the steam turbine.
In the indirect cycle, the PHTS is coupled with the PCS through the IHTS based on a molten-salt ESS. Its task is to store thermal power during the burn flat-top phase (removed by the molten salt) and its delivery to the PCS. In this way, the TG can operate almost in steady-state at 80% of the PHTS-rated power without interruption nor fluctuations during the plasma phases when fusion heat is not available for energy conversion. Therefore, it can produce almost constant electrical power and rotate at a rather constant speed, thus avoiding thermo-mechanical cycling issues.
Considering the two coupling configurations and the two coolant options, the DEMO BoP could be based on one out of the following four different possible configurations, as summarized in Figure 2:
It is worth noticing the presence of two steam generators in Figure 2b. Unlike the HCPB configuration in Figure 2d, the IHTS in the WCLL BoP takes and stores not all the power coming from the BB PHTS but only the fraction coming from the first wall that is delivered to the PCS during the dwell time using a suitable steam generator [13].
The selection of the optimal configuration is expected to be completed in the next years basing also on the outcomes of the research on the DEMO electrical loads and the design of its distribution network.
3. Preliminary DEMO Layout
Figure 3 summarizes the preliminary layout that is presently expected for the DEMO site [7,16], mostly based on ITER’s one. The actual location of the DEMO site is not yet identified and will be defined also following the outcomes of DEMO electrical analysis and requirements. Nevertheless, it is important in order to assess the electrical distribution layout, the electrical loads and cables characteristics.
4. Basic Principles for the Design of the DEMO Electrical Power System
DEMO power systems can be divided in three electrical distribution groups:
- Steady-State Electrical Network (SSEN), supplying all the auxiliaries, including the components relevant for nuclear safety and the protection of the investments. The steady-state loads require a rather constant power.
- Pulsed-Power Electrical Network (PPEN), supplying the pulsed loads, i.e. the superconducting coils and the H&CD systems. The pulsed loads require a time-changing power only during plasma operations.
- Turbine Generator (TG), connecting the DEMO power plant to the external grid to deliver the net electrical power produced by the PCS.
Figure 4 shows a preliminary sketch of a possible configuration of the DEMO electrical power system with its three sub-distribution groups.
The scheme in Figure 4 should be integrated by emphasizing the buses for the safety loads and by inserting the systems for the reactive power compensation and harmonic filtering. Such systems are relevant in ITER (occupying an area approximately corresponding to the DEMO Area 35 in Figure 3), but their ratings and placements can be defined in DEMO only after an adequate survey of the electrical loads.
Because of the deeply different nature of the electrical loads connected at SSEN and PPEN distributions, the former can be exhaustively characterized into an electrical load list, as described in the rest of the paper, but the latter need further specifications in terms of time evolution of the power profiles. Such difference heavily affects also the power profiles at the Point of Delivery, requiring further design and optimization stages to meet the requirements imposed by the grid regulator.
The amount of electrical power delivered by DEMO to the external grid depends on the selected option for the PHTS-PCS and on its control strategy. Figure 5 shows the input and output of the DEMO electric power depending of the PHTS coupling. The figure is essentially qualitative as PPEN contribution is still under analysis, but some data available for a non-optimized coil system show that it could require input powers at breakdown even higher than 1 GW with relevant reactive power components [15]. More in general, the input power requested could exceed the produced power in some time intervals.
With the direct PHTS-PCS coupling, the power for the DEMO electrical loads should be supplied only by the external grid during the dwell time between the pulses and during the ramp-up and ramp-down phases too.
In order to avoid excessive mechanical and thermal stresses on the turbine, it is supplied with a proper mass flow rate of steam which has to guarantee the turbine operation at 10% of its nominal capacity during the dwell time. In order to cover the steam production during the dwell time, the most suitable and efficient solution consists in the introduction of a small thermal ESS loop, managed in one of the following three main configurations:
- The “Steam only” configuration uses a portion of the steam in the PHTS for the molten-salt loop.
- The hybrid configuration provides for the coordinated use of the steam from the PHTS and an electric heater.
- The “Electric only” configuration foresees only the use of an electric heater.
The most efficient solution seems to be the third one due to temperature concerns [17]. Indeed, using the steam in the PHTS to heat the molten-salt hot tank does not allow reaching a temperature high enough to guarantee proper conditions for the steam turbine during the dwell time. This could result in water damage to the steam turbine.
Besides the operation during the dwell time, thermodynamic analysis show that the maximum power output of the turbine is evaluated to be around 790 MW [18]. Considering a conservative efficiency of 0.95 for the turbine-synchronous generator coupling, the nominal active power to consider for the generator is 750 MW. In literature, a common minimum power factor to operate synchronous generators results to be 0.8. This value is also adopted in some grid legislations [17] to identify the value of the reactive power that a generator should be able to supply to the grid when required, and so to build a reference capability curve. Considering this value for the power factor, the rating of the synchronous generator in terms of apparent power is around 940 MVA.
This has to be considered an approximation since the variations in the prime mover power would actually cause transient phenomena at the synchronous machine level. From the reactive power point of view instead, the nominal value that the generator could supply to the grid is around 565 MVAR, coming from the minimum power factor assumed. However, no assumptions can be made on the reactive power profile since, in general, it is dependent on the conditions of the external grid and so it is managed by the transmission system operator.
In order to find a coherent value for the output power and to assume an efficiency for the new thermodynamic cycle, it is necessary to know the thermal energy balance. Of course, this efficiency might be different from the direct coupling case because of the presence of the IHTS. Using the IHTS, the turbine operates constantly at its nominal power, increasing the overall efficiency during the whole operation (no transients, no off-design conditions). On the other hand, the presence of a more complex heat exchange system may lead to less thermal power transferred to the PCS. For these reasons, a first approximation about the power output in case of indirect coupling has been evaluated as the total energy output during one pulse, divided by the total duration of the pulse. In this way, the nominal power of the turbine has been calculated to be around 85% of the previous case. This leads to a rated active power of around 640 MW. Taking as a reference for the power factor the value adopted in the previous case, for the indirect coupling configuration, the rated apparent power of the synchronous generator ranges around 800 MVA.
5. Summary of Electrical Loads Connected to the SSEN
The DEMO subsystems are organized according to a Plant Breakdown Structure (PBS), used also for the classifications of the electrical loads. Table 2 provides for each PBS a short description, the expected power and the electrical distribution system where the PBS and its loads is connected. Since some PBSs contain both loads connected to the SSEN and to the PPEN distribution networks, they are reported twice.
Passive systems are those not absorbing any significant electrical power. However, it is worth mentioning that systems which are labelled as passive may require a small amount of power for the instrumentation and control systems. In such cases, this power is accounted in PBS 40 or 85.
Some of listed PBSs of the project are still at very preliminary stage or under design. To provide a first estimation of the electrical power absorbed by these subsystem, and to carry out a comprehensive (although preliminary) power flow analysis of the DEMO plant, a first guess based on reasonable extrapolation from the ITER loads and power profiles was used.
For each of the PBSs listed in Table 2 the information necessary to run power flow analyses were investigated, as the load type (if belonging to SSEN or PPEN distribution), the voltage level and the power absorption in terms of active power and power factor. Whenever no information coming from the design layout regarding the power factor were available, a local reactive power compensation system is supposed for each subsystem, regulating it at a value equal to 0.95.
Note that the total input power requested by DEMO cannot be estimated only by summing the entries in Table 2 because: (i) HCPB and WCLL cooling options are alternative and (ii) the power absorbed by loads belonging to PBSs 30, 31, 32, 50 and 82 are not constant for all the phases, being them pulsed. In these cases, the only peak values of the power are reported. In particular, the PPEN loads require high powers only to initiate (phases 1 and 2 in Table 1), ramp (phases 3 and 6) and heat (phase 4) the plasma, while their contribution is lower than the output power for most of the operational time (phase 5). The details for the PPEN power profiles will be developed in next years.
The following subsections provide a brief description of the electrical loads for each “non-passive” DEMO PBS supplied by the SSEN distribution.
5.1. PBS 22: Tritium, Fueling and Vacuum
The DEMO PBS 22 collects all the components belonging to the subsystems devoted to the fuel cycle (e.g., isotope separation columns, water detritiation, molecular sieve beds), to the plasma fueling (e.g., pellet injection systems) and to the vacuum generation inside the plasma chamber (e.g., motor pumps and compressors). For all these subsystems, preliminary assumptions and designs are under evaluation based on the lesson learnt from ITER layout and projects. A first guess of the total electrical power absorbed by the three subsystems is provided as 12.2 MW, from the information collected from the design progresses and from extrapolations from ITER, taking into account also the differences between the two projects and how they reflect on the operation of each subsystem.
5.2. PBS 25/27: Tritium Extraction and Removal for HCPB/WCLL
Tritium Extraction and Removal is a subsystem devoted to the unburned and unexhausted tritium extraction from the VV and its transportation to the fuel cycle system (PBS 22-1). Afterwards, it is treated, separated from its isotopes and re-injected inside the chamber to participate to the occurring fusion reactions. This system is at embryonic state and no information regarding its structure and its power absorption have been evaluated at present, both for the two cases of cooling system based on helium or water coolant. As a first guess of the power absorption, an extrapolation from ITER layout was carried out, obtaining an estimation of 3 MW.
5.3. PBS 30, 31 and 32: Heating and Current Drive (H&CD) Systems
The H&CD systems foreseen in DEMO are ECRH, ICRH and NBI. The optimal heating source mix, as well as the power to be delivered to the plasma, is still a key issue under investigation. The definition of the final parameters is scheduled by the end of the conceptual phase, foreseen by the end of 2024. Up to now, the requests in terms of plasma heating and stabilization require to deliver 150 MW of heating power to the plasma (that needs a much higher electrical power to be supplied). Three possible options are under investigation to achieve the total amount:
- The reference solution consists in evenly distributing the total power among the three sources.
- The alternative (and rather probable) solution consists in excluding ICRH and moving its power to ECRH (100 MW) without changing the NBI.
- An open option consists in producing all the necessary power by ECRH.
It is important to stress that the functions of the H&CD systems need to be supplied by two different kinds of power supplies:
- Main Power Supplies, connected to the PPEN.
- Auxiliary Power Supplies, connected to the SSEN.
In ITER the auxiliary powers of the H&CD systems are included in the respective PBSs and are accounted to be all equal to about 3 MW. As the DEMO power supplies are expected to manage higher powers, an auxiliary power of 6 MW is estimated from the SSEN for each of the three H&CD PBSs.
The issue of the time evolution and efficiencies [10,12] of the H&CD Main Power Supplies is more complex and will be addressed in a future paper by the authors. The average efficiencies for the expected technologies are foreseen to be about 40% of the power delivered to the plasma [12], resulting in a power of 125 MW for the main power of each H&CD system.
5.4. PBS 40: Plasma Diagnostics and Control Systems
Since the Plasma Diagnostic & Control System is still to be defined, the electrical power absorbed has been estimated by the ITER data. However, since the DEMO facility is expected to be developed under a more mature knowledge of fusion physics and technology with respect to ITER, its diagnostic system is supposed to be much simpler, leading to an estimation of 6.1 MW, supposing a global power factor equal to 0.9. The electrical power includes the local air conditioning of the cubicles serving the diagnostics.
5.5. PBS 50: BB Primary Heat Transfer System (HCPB)
The Primary Heat Transfer System based on the HCPB collects all the components and systems devoted to the fusion heat recovery and delivery to the PCS. The main heat extraction zone is the BB, supplying about 85% of the total fusion heat. Other fusion heat sources such as the VV, limiter and divertor are addressed in PBS 49 and PBS 58. As mentioned in Section 2, two possible layouts are under investigation to couple PHTS to the PCS, in order to mitigate the intrinsically pulsed behavior of the plasma for TG, that are the indirect (Figure 2d) and direct coupling (Figure 2c).
In the first configuration, the electrical loads are related both to the PHTS and to the IHTS. Its aim is to recover heat to be supplied to the turbine during dwell time and all phases when fusion heat is not available for energy conversion, in order to keep it constant in its operation.
In the direct cycle configuration, instead, the electrical loads are only those belonging to the PHTS system and those belonging to the small ESS.
Considering the segmentation option with 18 sectors (each of them including three outer blanket and two inner blanket segments), the HCPB BB is divided into nine independent circuits (for safety reasons, in order to limit common-mode failures), serving two sectors each. The sectors are fed by nine loops (each with two compressors), six designed for the Outboard Blanket (OB) sectors and three designed for the Inboard Blanket (IB) sectors. The main electrical load for each loop is the electrical motor connected to the compressors, for which a first power estimation is provided based on the thermo-hydraulic design of the loops themselves (9.2 MW of mechanical power per compressor with efficiency equal to 0.95).
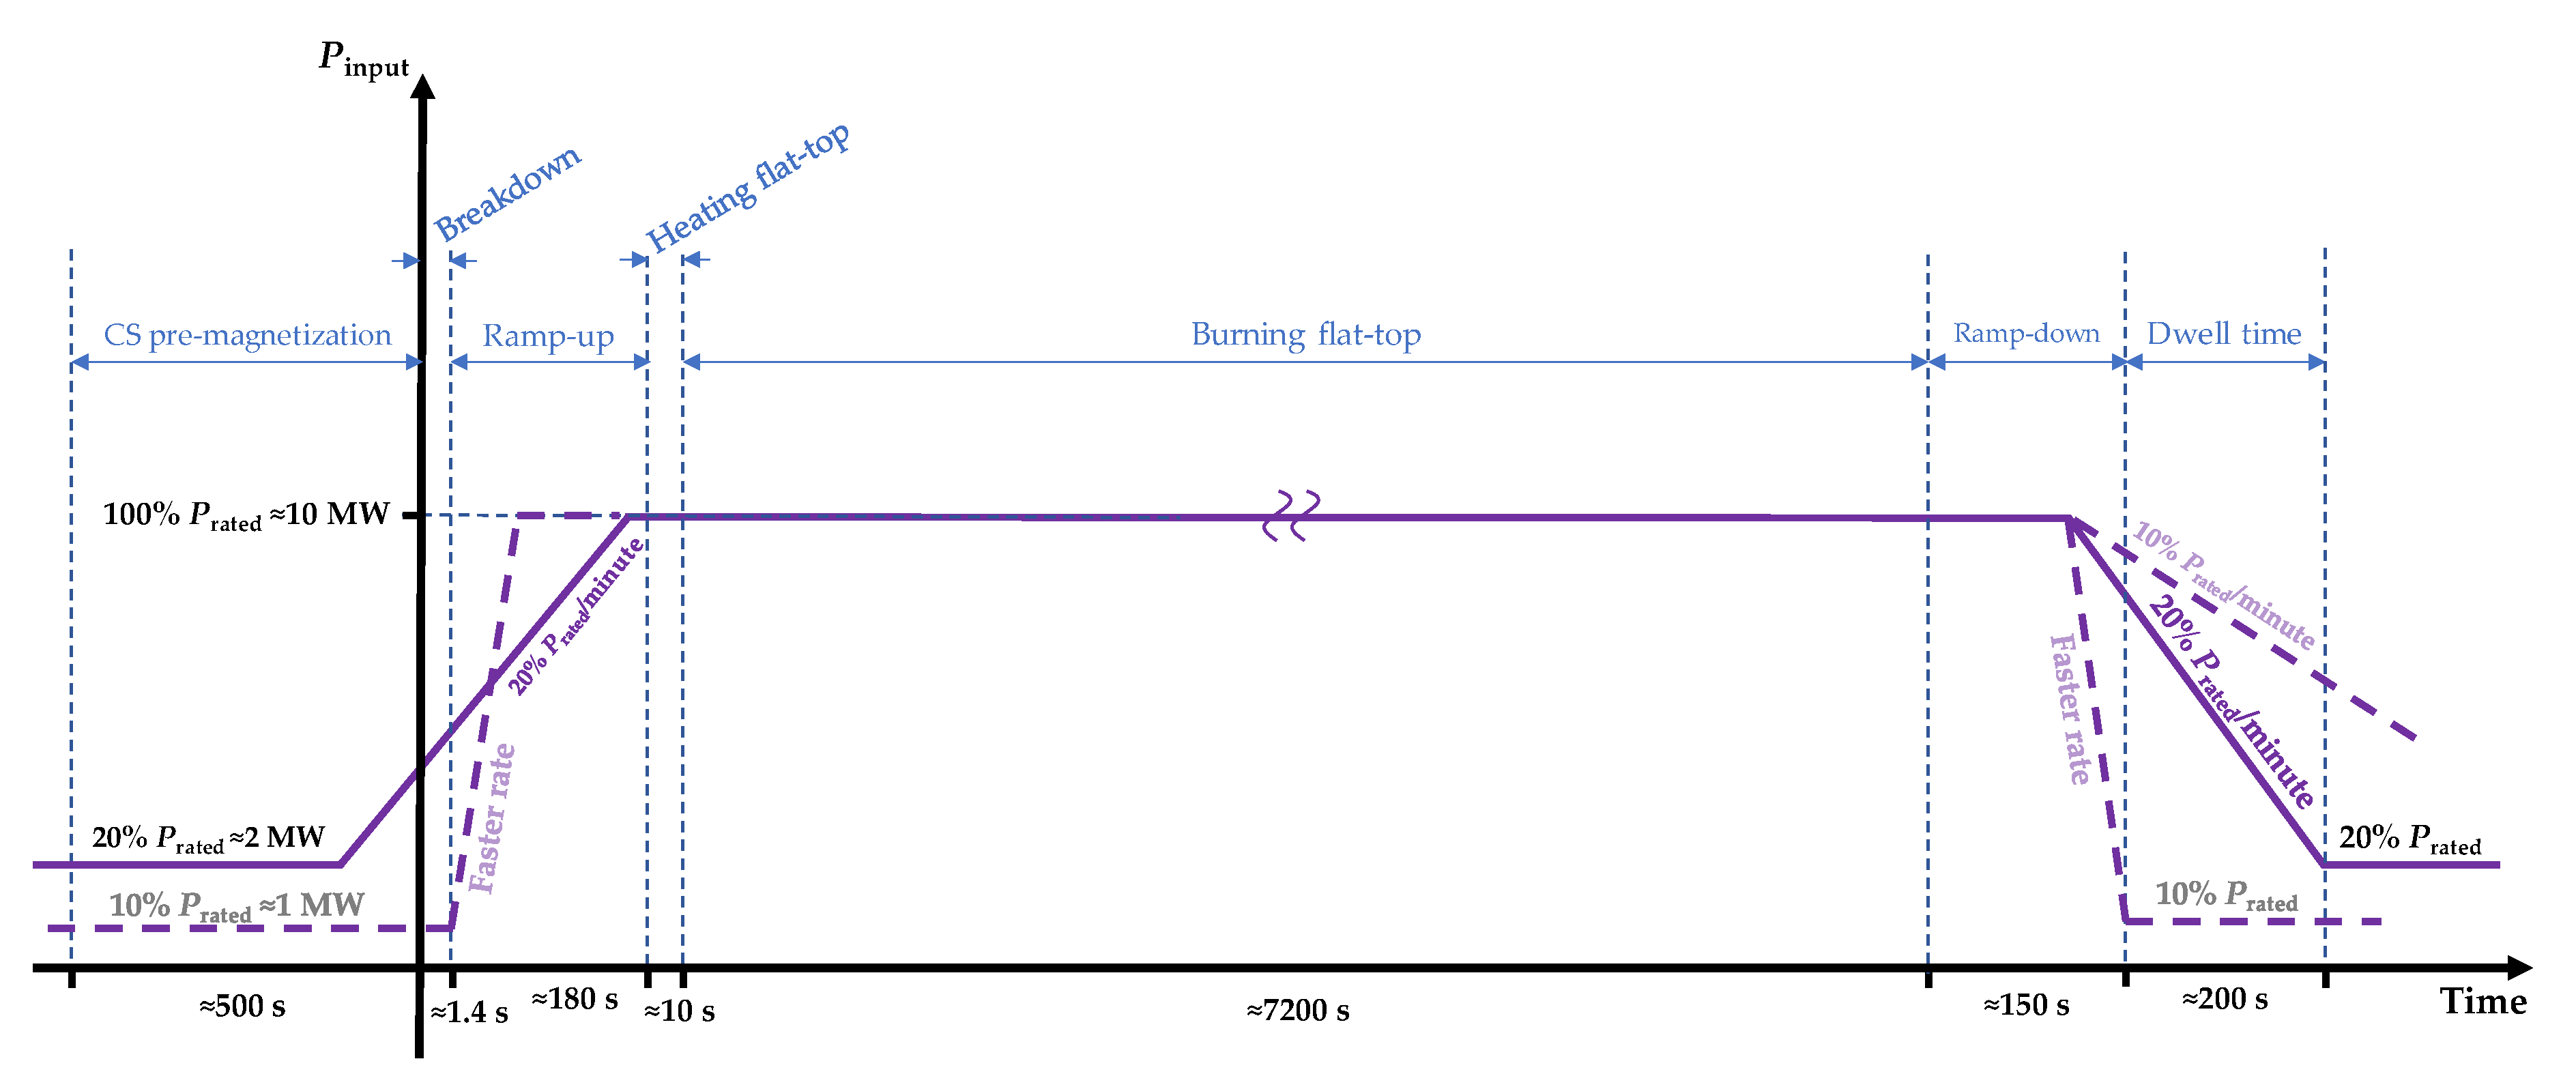
Because of the very high electrical power absorbed by the motor compressors, resulting in a total power in the order of hundreds of megawatts, it was decided to regulate them in order to reduce the power consumption during the scenario phases when no thermal power comes from the fusion reactions. Unfortunately, the power transitions from regulated to full power and vice versa cannot be performed at any time rate because the current technology for helium compressors allows a ramp-up and ramp-down at a maximum rate of about 10–20%/minute. Also with controlled ramps, the frequent power variations induce stresses on the compressors that are justified by the relevant energy saving that can be achieved (more than 100 MW for more than 500 s). Some possible modulations of the compressor power are sketched in Figure 6. The selected modulation rate will be a trade-off between energy saving and components stress. Presently, the assumed tradeoff is 20%/min but faster rates will be investigated also considering technology progresses.
In the IHTS there is an intermediate heat exchanger based on “tubes and shell” technology: helium flows into the tubes and molten salt crosses the shell side [13]. In order to mitigate the dynamic behavior of the thermal fusion power between burn flat-top and dwell time on PCS components (particularly on TG and then on the electrical grid), the IHTS is equipped with an ESS. Its task is to store thermal power during burn flat-top phase (removed by the molten salt) and its delivery to the PCS in order to let the TG work almost in steady-state at 80% of the PHTS-rated power, thus avoiding thermo-mechanical cycling issues. Its main electrical loads are the electrical motors moving the circulators present in the loops, whose electrical power was estimated from the thermo-hydraulic design of the IHTS system in terms of mass flow rate and pressure drops. Besides, many other electrical loads regarding all auxiliary systems are still to be evaluated both belonging to the PHTS and the IHTS system. Therefore, they are not included in the present estimations since currently under design.
5.6. HCPB PBS 52: Primary Heat Transfer System (WCLL)
The PHTS based on the WCLL collects all the components and systems devoted to the fusion heat recovery and delivery to the PCS. The main difference with respect to the HCPB architecture is that the heat exchanger is not between PHTS and PCS in the indirect coupling configuration but it receives and stores only the portion of thermal power coming from the first wall of the vessel. This solution aims to reduce the size of the IHTS and its ESS but needs the presence of a second steam generators between the PHTS and the IHTS. However, the same considerations already mentioned for the HCPB hold for the WCLL cooling system about the coupling between the PHTS and PCS as well as the electrical loads to be included in the power flow analysis.
The PHTS consists of two different cooling systems, removing heat from two different parts of the blanket, namely the breeding zone and the tokamak first wall (addressed in PBS 59) and the VV (addressed in PBS 49). Both PHTSs consist of two loops, in order to limit the size of piping and components. The breeding-zone PHTS loops include a steam generator, two pumps, one pressurizer and one hot/cold leg. The first-wall PHTS loops include one heat exchanger, one pump, one pressurizer and one hot/cold leg. Cold/hot ring headers supply/return water to the breeding-zone/first-wall loops. Summing all up, six main coolant pumps are foreseen in the present PHTS WCLL design: four main coolant pumps, two per loop, are present in the cold legs of the breeding-zone PHTS and two main coolant pumps in the first-wall PHTS.
The electrical loads are the electrical motors moving the pumps as well as the pressurizers. Conversely from the motor pumps, which absorb constant electrical power during the whole scenario, the pressurizers are “time-random” electrical loads. They are resistors benches which heat the water up in order to increase the water pressure in pipes whenever the control system sense a pressure reduction. Therefore, they may or may not be switched on during the scenario and not at the same electrical power. In practice, the total power of the pressurizer is 2 MW in standard conditions but when the pressure drops below the minimum threshold the pressurizer is switched on, demanding 10 MW. The very conservative worst-case assumed in these analyses consists in assuming the pressurizers working continuously.
As shown in Figure 6, in the HCPB option, the helium pumps are modulated to operate at reduced power around the dwell time. This could be theoretically useful also for the PHTS-WCLL, but the limited energy saving that could be achieved does not justify the cycling stress produced on the pumps by the frequent power variations.
The WCLL IHTS is conceptually similar to that of the HCPB BB in terms of thermo-hydraulic architecture. First estimations regarding the electrical power absorbed by the electrical motors moving the circulators present on the loops are based on the estimations of mass flow rate and pressure drop in the pipes.
5.7. PBS 60: Remote Maintenance (RM) System
In new-generation tokamaks, Remote Maintenance (RM) is becoming more and more demanding and important with respect to existing facilities in terms of electrical power demand and nuclear safety issues. In fact, in ITER and DEMO the Occupational Radiation Exposure is expected to be twice or three times that of modern nuclear fission plants.
The DEMO RM is mainly divided into two groups:
- In-vessel RM includes all the activities regarding the movement of parts of the vessel or any operation inside it.
- Ex-vessel RM, instead, includes maintenance in and around the tokamak port cells and those in the Maintenance Facility.
The concepts of the safe transportation of extracted parts of the VV are similar to those adopted in ITER. In fact, once extracted from the vessel, both the divertor and the blanket sectors are moved by transport casks through gallery corridors.
Besides, many crane-based systems and lifting systems need to be foreseen in designing the handling of the extracted BB (through the upper port) and divertor (through the lower port) sectors, to move them to the Active Maintenance Facility. Some megawatts of electrical power are expected to be absorbed by this system based on the first estimations on the weight of the parts to be moved.
The total DEMO maintenance and safety needs can be sustained by a RM of about 5 MW. Even though the RM electrical loads belong to the SSEN, parts of them are “decoupled by the plasma operation”, as for the remote handling inside the VV. This is a key point in the design of the electrical distribution: the coincidence factor of many electrical loads is zero. However, it is worth mentioning that some RM activities such as the processing/detritiation of some components could be carried out both during and off operations in the Active Maintenance Facility (Building 21 in Figure 3).
5.8. PBS 70: Balance of Plant (HCPB)
Components belonging to PBS 70 are those of the PCS with HCPB-PHTS. This system consists of a classical Hirn Cycle with superheated steam, with steam generator, re-heater, deaerator, condenser, feed water and turbine (connected to the electrical generator for the thermal-electrical energy transformation).
First studies about absorbed electrical power by PCS in case of helium cooled blanket only regard the water pump, based on the requested mass flow rate inside the circuit and the estimated pressure drops. Further investigations will regard ancillary systems serving the PCS, not available at this stage.
It is worth noticing that the net efficiency of the thermal cycle is about 31%, when taking into account the electrical power absorbed by PHTS (in particular, the very high power absorbed by the circulators), IHTS and PCS components. The previous considerations lead to a power estimation of 12 MW for PBS 70.
5.9. PBS 72: Balance of Plant (WCLL)
As for PBS 70, the components belonging to PBS 72 are those of the PCS in the cooling system layout based on the WCLL concept. The same considerations already reported for PBS 70 were proposed, except for slight differences in terms of the steam generator coupling the PCS and the IHTS in case of indirect coupling. It results in a total power absorbed equal to 12 MW. It is worth noticing that first simulations pointed that the system would be able to operate with about 700 MW of gross electrical power and an efficiency equal about to 34%, considering all electrical power needed to be recirculated for PHTS, IHTS and PCS components needs.
5.10. PBS 81: Cryoplant and Cryodistribution
A preliminary design of cryoplant and cryodistribution is under development both in terms of layout of the plant and of estimation of the power and energy absorbed by the mechanical cryopumps. Among the numerous systems to be kept at cryogenic temperatures, it is worth mentioning: the superconducting coils (at 4 K), the coil casings and supporting structures and the thermal shields of VV, cryostat, ports and cryodistribution. Besides, differently from ITER cryoplant, some systems are foreseen to be refrigerated by independent systems, such as cryopumps for the VV and the divertor, NBI cryopumps, pellet launching system and ECRH superconducting magnets. However, the project is currently at a very preliminary stage. A first guess of the total electrical power absorbed by the DEMO cryoplant and cryodistribution (101.8 MW) has been obtained by scaling that designed for ITER project taking into account the volumes of the superconducting magnets and of the other structures and components to be kept at cryogenic temperatures.
5.11. PBS 83: Buildings
The electrical loads included in such estimation regard the lighting systems, the elevator systems and the Heating, Ventilation and Air Conditioning (HVAC) system. Since the design of the DEMO buildings is at a very preliminary stage, a first guess of 54.8 MW is provided by extrapolating the data available from ITER and considering the DEMO preliminary site layout shown in Figure 3.
5.12. PBS 85: Plant Control System
A first guess of 3.6 MW for the power absorbed by the COntrol, Data Access and Communication (CODAC), Central Interlock System (CIS) and Central Safety System (CSS) systems was obtained by estimating the number of cubicles for each subsystem, from those present in ITER.
5.13. PBS 87: Auxiliaries
First preliminary information about the power absorbed by auxiliaries is an extrapolation from ITER’s electrical demand for the Component Cooling Water System (CCWS), CHiller Water System (CHWS), sulfur hexafluoride (SF6) distribution system and compressed air distribution system. This extrapolation results in 90.9 MW.
5.14. Summary of the Total Electrical Power Absorbed by the DEMO SSEN
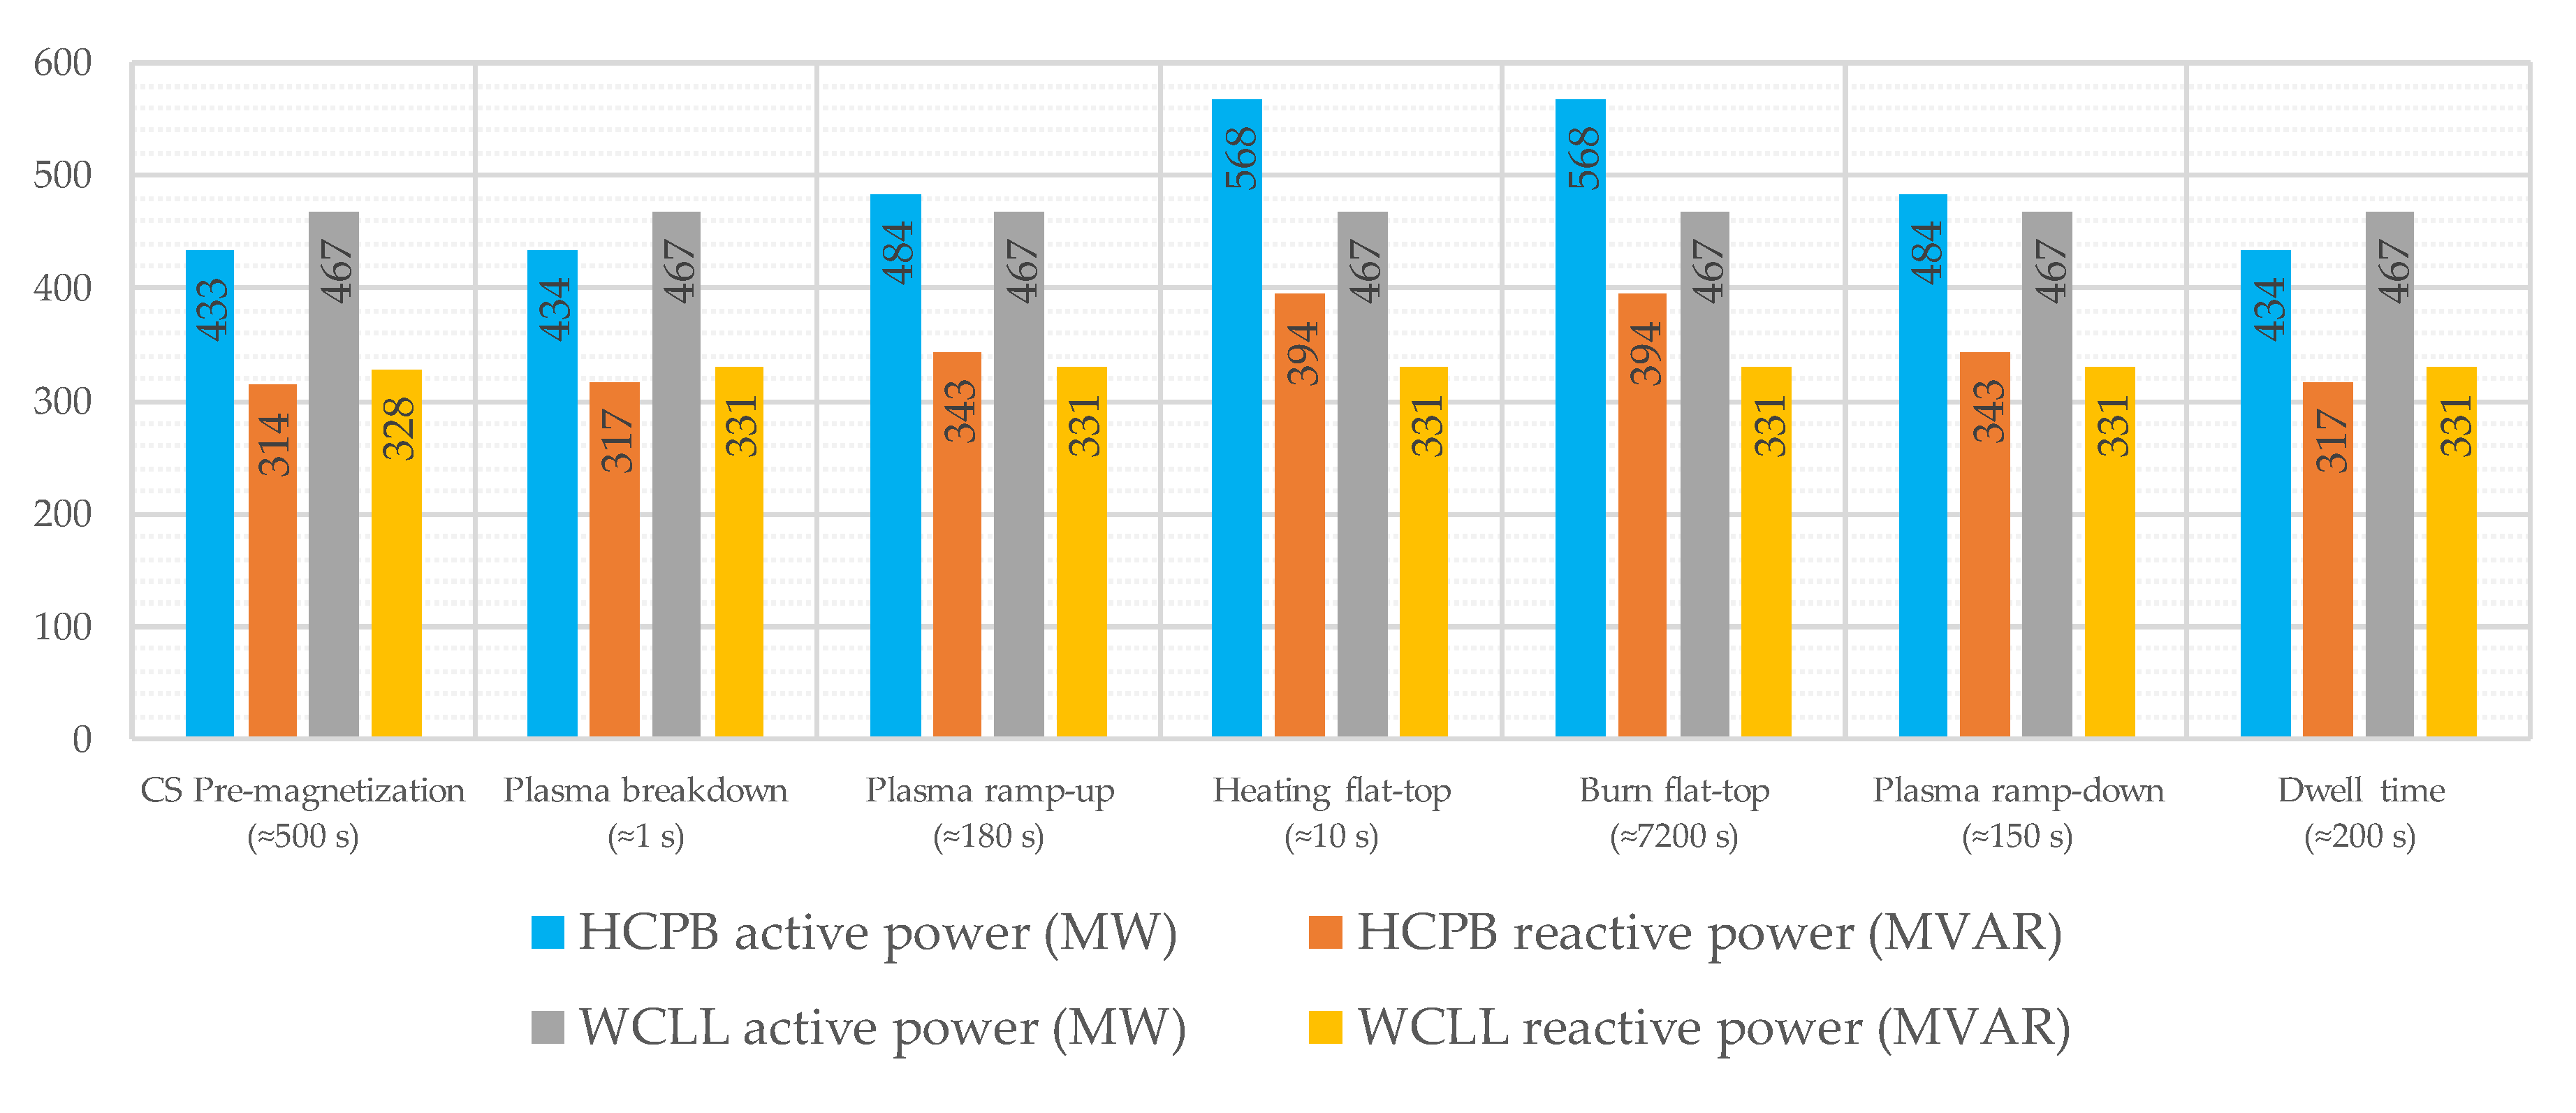
Since the BoP is still under design also in terms of choice between the two helium-based and water-based cooling system, two parallel and independent designs are under evaluation also in terms of the power electrical system. Figure 7 summarizes the SSEN active and reactive rated powers in each plasma phase for both the two cooling system options. It is important to note the power variations in the HCPB option (Figure 7a) due to the ramp modulation of the compressors motor in the PHTS circuits.
6. Preliminary Design and Sizing of the DEMO Electrical Distribution
In compliance with the preliminary scheme in Figure 4 and the lesson learnt from ITER electrical design, four voltage levels are firstly assumed to be used for the DEMO electrical distribution system:
- 22 kV, 6.6 kV and 0.4 kV, in SSEN.
- 22 kV and 66 kV, in PPEN.
According to this assumption and to the aforementioned loads characterization, the HV/MV and MV/LV transformers and the cables for SSEN are sized, by using simulation models for the power flow analysis [19]. The electrical scheme has been designed and implemented in the DIgSILENT PowerFactory software environment. The criteria used for the simulations are:
- Utilization and contemporaneity factors equal to 1 (no redundancy is considered for electrical loads which are supposed to work at their rated power).
- Load power factors assumed to be equal to those identified in the electrical load list.
- Constraint on the nodal voltage variation during operation accepted: <4%.
- Transformers size check in reference of the nominal values.
- Cables size check in reference of the nominal values and to the layout assumptions.
The flow diagram in Figure 8 summarizes the algorithm adopted for the design of the electrical distribution system and for the sizing of the electrical components.
Simulations were carried out independently for both the two different cooling system configurations (PHTS-HCPB and PHTS-WCLL) and referring only to SSEN loads in each plasma operational phase. As first output of the power flow analysis, the number and the size of the HV/MV transformers are identified according to available data of installed transformed and reliability issues both during normal and off-normal conditions: six three-phases 2-windings transformers with rating power of 150 MVA and voltage ratio equal to 400/22 kV.
As regards the internal distribution for SSEN, the loads have been dispersed following design criteria based on the voltage levels, loads type and distance between the distribution node and the actual location of the loads in the facility estimated on the site layout. The ordinary and the safety loads are distinguished at the 0.4 kV voltage level and the following MV/LV transformers are selected following the same aforementioned criteria:
- Six three-phases 2-windings transformers with rated power of 2.5 MVA and voltage ratio equal to 22/0.4 kV, for the ordinary loads.
- Four three-phases 2-windings transformers with rated power of 1.6 MVA and voltage ratio equal to 22/0.4 kV, for the safety loads.
- Six three-phases 2-windings transformers with rated power of 3.15 MVA and voltage ratio equal to 22/0.4 kV for the supply of some special loads (as those in PBS 22), which are installed separately because of the greater distance from the distribution node with respect to the other loads.
The choice to divide the MV/LV transformers in several groups connected by a bus-tie aims at limiting the short-circuit currents, thus allowing the selection of commercial low voltage circuit breakers. Regarding the loads connected at the 6.6 kV busbars, they are supplied through:
- Five three-phases 2-windings transformers with rated power of 40 MVA and voltage ratio equal to 22/6.6 kV in case of HCPB.
- Five three-phases 2-windings transformers with rated power of 20 MVA and voltage ratio equal to 22/6.6 kV in case of WCLL.
In the 6.6 kV section, the ordinary loads are supplied by 10 three-phases 2-windings transformers with rated power of 40 MVA and voltage ratio equal to 22/6.6 kV. Finally, the cryogenic system is supplied by five three-phases 2-windings transformers with rated power of 40 MVA and voltage ratio equal to 22/6.6 kV. The main data of the selected transformers are reported in Table 3 and Table 4, where:
- Sn is the rated power in MVA;
- P0 is the no-load power in kW;
- Pk is the short circuit power in kW;
- Vk is the short circuit voltage in percentage.
Results obtained by the methodology based on the power flow analysis and the aforementioned sizing criteria allowed also to carry out the cables sizing. It is important to stress that this sizing was possible only by adopting a preliminary but consistent layout as shown in Figure 3. The type of the selected cables and their electrical data are summarized in Table 5, reporting the value of the resistance R’ (for the reference and maximum operating temperatures) and reactance X’ per unit length. The assumed cable materials and technical characteristics are summarized in Table 6.
From the power flow analysis carried out including the SSEN loads and distribution, the total electrical active and reactive powers requested to the HV point of connection of DEMO to the external electrical grid can be assessed in reference to the different plasma phases. The results are shown in Figure 9 for the HCBP and WCLL cases. This information is the starting point for the sizing and design of the HV switchyard that is object of study and research of the same authors.
7. Conclusions
This paper presented the preliminary studies for the feasibility and realization of the demonstrative nuclear fusion power plant DEMO. The study moved from the analysis of the expected DEMO operations and of the electrical loads to sketch a preliminary electric scheme for a part of the internal distribution grid, including the sizing of the main electrical components. This preliminary design was supported by simulation models for the power flow analysis implemented in the DIgSILENT PowerFactory environment.
The first results are focused on the electrical loads analysis and characterization showing a significant variability with respect to the plant configuration, especially because of to the cooling choices and the operational phases. This aspect affects the preliminary design of the electric distribution grid for the SSEN in DEMO. The results show a huge amount of power that would be shared with the HV European grid, pointing out the complexity of the sizing and design of the HV switchyard.
The results shall be continuously refined in the next years following the development of the project and the new experiences in the plasma physics and engineering achieved by ITER or satellite experiments. For instance, the design optimization of the toroidal and blanket segmentation led to a number of sectors being reduced from 18 to 16. The following design choices could lead to a piping redistribution with a limited impact on the total pumping power but there is still room for general design optimizations. Moreover, a relevant breakthrough could consist in the possibility to achieve longer burn phases.
Nevertheless, the electrical design must be continuously updated because its impact is so relevant that could jeopardy the efficiency and the convenience of the plant. In fact, some physics and engineering choices as the cooling configuration and the coil current scenarios could be driven also by electrical constraints or optimizations.
In particular, the following aspects are object of study and research in progress by the same authors:
- Impact of the PPEN power profiles, at least in the reference scenarios.
- Operations and connection of the TG in the direct and indirect coupling.
- Sizing and design of the HV switchyard.
- Technical and legal rules for the connection of DEMO to the HV grid.
- Detailed survey of the critical loads in order to improve the plant safety and reliability and to size the UPSs and the diesel generators with the proper redundancy.
- Location and sizing of the reactive power compensation and filtering systems.
Author Contributions
S.M. collected the data from DEMO PBS experts and from other tokamaks. S.M. and S.P. modeled the distribution network and performed the power flow simulations. S.C. followed the conceptualization of the BoP, of the layout and of the safety classifications. S.P. conceptualized and developed the electrical network. A.L. arranged the electrical load list and the operational phase classification. The methodology was agreed by all the authors. S.M., S.C., M.C.F. and A.L. organized and supervised the project for the involved institutions. The manuscript was edited by all the authors. All authors have read and agreed to the published version of the manuscript.
Funding
This work has been carried out within the framework of the EUROfusion Consortium and has received funding from the Euratom research and training programme 2014-2018 and 2019-2020 under grant agreement No 633053. The views and opinions expressed herein do not necessarily reflect those of the European Commission.
Conflicts of Interest
The authors declare no conflict of interest.
Abbreviations and Acronyms
| BB | (Tokamak) Breeding Blanket |
| BoP | Balance of Plant |
| CCWS | Component Cooling Water System |
| CD(R) | Conceptual Design (Review) |
| CHWS | Chiller Water System |
| CIS | Central Interlock System |
| CS | Central Solenoid |
| CODAC | COntrol, Data Access and Communication |
| CSS | Central Safety System |
| DMS | Disruption Mitigation System |
| ECRH | Electron Cyclotron Resonance Heating |
| ELM | Edge Localized Mode |
| ESS | Energy Storage System |
| EU | European Union |
| HCPB | Helium Cooled Pebble Bed |
| H&CD | Heating and Current Drive |
| HV | High Voltage |
| HVAC | Heating, Ventilation and Air Conditioning |
| IB | Inboard Blanket |
| ICRH | Ion Cyclotron Resonance Heating |
| IHTS | Intermediate Heat Transfer System |
| LV | Low Voltage |
| NBI | Neutral Beam Injector |
| OB | Outboard Blanket |
| PBS | Plant Breakdown Structure |
| PCS | Power Conversion System |
| PHTS | Primary Heating Transfer System |
| PPEN | Pulsed Power Electrical Network (classification used in ITER) |
| RM | Remote Maintenance |
| SC | Super-Conductor |
| SSEN | Steady State Electrical Network (classification used in ITER) |
| TBM | Test Blanket Module |
| TG | Turbine Generator |
| VV | Vacuum Vessel |
| WCLL | Water Cooled Lithium Lead |
References
- Bachmann, C.; Ciattaglia, S.; Cismondi, F.; Federici, G.; Keech, G.; Maviglia, F.; Siccinio, M. Critical design issues in DEMO and solution strategies. Fusion Eng. Des. 2019, 146, 178–181. [Google Scholar] [CrossRef]
- Federici, G.; Bachmann, C.; Barucca, L.; Biel, W.; Boccaccini, L.; Brown, R.; Bustreo, C.; Ciattaglia, S.; Cismondi, F.; Coleman, M.; et al. DEMO design activity in Europe: Progress and updates. Fusion Eng. Des. 2018, 136, 729–741. [Google Scholar] [CrossRef]
- Federici, G.; Bachmann, C.; Barucca, L.; Baylard, C.; Biel, W.; Boccaccini, L.V.; Bustreo, C.; Ciattaglia, S.; Cismondi, F.; Corato, V.; et al. Overview of the DEMO staged design approach in Europe. Nucl. Fusion 2019, 59, 066013. [Google Scholar] [CrossRef] [Green Version]
- EUROfusion. European Research Roadmap to the Realisation of Fusion Energy. 2018. Available online: https://www.euro-fusion.org/eurofusion/roadmap/ (accessed on 15 March 2020).
- Lampasi, A.; Maffia, G.; Alladio, F.; Boncagni, L.; Causa, F.; Giovannozzi, E.; Grosso, L.A.; Mancuso, A.; Micozzi, P.; Piergotti, V.; et al. Progress of the Plasma Centerpost for the PROTO-SPHERA Spherical Tokamak. Energies 2016, 9, 508. [Google Scholar] [CrossRef] [Green Version]
- ITER Website. Available online: http://www.iter.org/ (accessed on 16 March 2020).
- Ciattaglia, S.; Federici, G.; Barucca, L.; Stieglitz, R.; Taylor, N. EU DEMO safety and balance of plant design and operating requirements. Issues and possible solutions. Fusion Eng. Des. 2019, 146, 2184–2188. [Google Scholar] [CrossRef]
- Ciattaglia, S.; Federici, G.; Barucca, L.; Lampasi, A.; Minucci, S.; Moscato, I. The European DEMO Fusion Reactor: Design Status and Challenges from Balance of Plant Point of View. In Proceedings of the 17 IEEE International Conference on Environment and Electrical Engineering (EEEIC 2017), Milan, Italy, 6–9 June 2017. [Google Scholar]
- Novello, L.; Coletti, A.; Baulaigue, O.; Dumas, N.; Ferro, A.; Gaio, E.; Maistrello, A.; Lampasi, A.; Zito, P.; Matsukawa, P.; et al. Advancement on the Procurement of Power Supply Systems for JT-60SA. In Proceedings of the IEEE 25th Symposium on Fusion Engineering (SOFE), Austin, TX, USA, 31 May–4 June 2015. [Google Scholar]
- Lampasi, A.; Zito, P.; Starace, F.; Costa, P.; Maffia, G.; Minucci, S.; Gaio, E.; Toigo, V.; Zanotto, L.; Ciattaglia, S. The DTT device: Power supplies and electrical distribution system. Fusion Eng. Des. 2017, 122, 356–364. [Google Scholar] [CrossRef]
- Morris, J.; Kovari, M. Time-dependent power requirements for pulsed fusion reactors in systems codes. Fusion Eng. Des. 2017, 124, 1203–1206. [Google Scholar] [CrossRef]
- Lampasi, A.; Minucci, S. Survey of Electric Power Supplies Used in Nuclear Fusion Experiments. In Proceedings of the 17 IEEE International Conference on Environment and Electrical Engineering (EEEIC 2017), Milan, Italy, 6–9 June 2017. [Google Scholar]
- Barucca, L.; Ciattaglia, S.; Chantant, M.; Del Nevo, A.; Hering, W.; Martelli, E.; Moscato, I. Status of EU DEMO heat transport and power conversion systems. Fusion Eng. Des. 2018, 136, 1557–1566. [Google Scholar] [CrossRef]
- Moscato, I.; Barucca, L.; Ciattaglia, S.; Di Maio, P.; Federici, G. Preliminary design of EU DEMO helium-cooled breeding blanket primary heat transfer system. Fusion Eng. Des. 2018, 136, 1567–1571. [Google Scholar] [CrossRef]
- Ferro, A.; Lunardon, F.; Ciattaglia, S.; Gaio, E. The reactive power demand in DEMO: Estimations and study of mitigation via a novel design approach for base converters. Fusion Eng. Des. 2019, 146, 2687–2691. [Google Scholar] [CrossRef]
- Gliss, C.; Ciattaglia, S.; Korn, W.; Moscato, I. Initial layout of DEMO buildings and configuration of the main plant systems. Fusion Eng. Des. 2018, 136, 534–539. [Google Scholar] [CrossRef]
- Falvo, M.C. Studies on the generator operation assuming power profiles corresponding to the PHTS-PCS indirect and direct cycle, v1.0, 20 December 2019, EUROfusion Report IDM: EFDA_D_2NUUME. Available online: https://idm.euro-fusion.org/ (accessed on 15 March 2020).
- Del Nevo, A. Direct Coupling of WCLL BB PHTS to PCS feasibility study, v1.0, 14 February 2019, EUROfusion Report IDM: EFDA_D_2MN55V. Available online: https://idm.euro-fusion.org/ (accessed on 15 March 2020).
- Duncan Glover, J.; Sarma, M.S.; Overbye, T.J. Power System Analysis and Design, 5th ed.; Cl-Engineering: Pacific Cove, CA, USA, 2011. [Google Scholar]
Figure 1.
Overview of the European Roadmap to the realization of Fusion Energy [4]. The reported dates are still indicative.
Figure 1.
Overview of the European Roadmap to the realization of Fusion Energy [4]. The reported dates are still indicative.

Figure 2.
The four possible PHTS-PCS configurations that are under evaluation for the DEMO design: (a) WCLL direct cycle, (b) WCLL indirect cycle, (c) HCPB direct cycle, (d) HCPB indirect cycle.
Figure 2.
The four possible PHTS-PCS configurations that are under evaluation for the DEMO design: (a) WCLL direct cycle, (b) WCLL indirect cycle, (c) HCPB direct cycle, (d) HCPB indirect cycle.

Figure 3.
Preliminary layout of the EU-DEMO site.

Figure 4.
Preliminary sketch of a possible DEMO electrical power system configuration, emphasizing the division of the electrical distribution into three groups: SSEN, PPEN and TG.
Figure 4.
Preliminary sketch of a possible DEMO electrical power system configuration, emphasizing the division of the electrical distribution into three groups: SSEN, PPEN and TG.

Figure 5.
Qualitative (not in scale) curves of input (red line) and output powers. The thermal power produced by the plasma and fusion processes (purple line) can be transformed in an electrical power whose characteristics are different for the direct (green line) and indirect coupling (blue line).
Figure 5.
Qualitative (not in scale) curves of input (red line) and output powers. The thermal power produced by the plasma and fusion processes (purple line) can be transformed in an electrical power whose characteristics are different for the direct (green line) and indirect coupling (blue line).

Figure 6.
Possible qualitative time evolutions of the power modulation of each of the 18 HCPB OB and IB BB compressors in order to reduce the total power demand. The assumed tradeoff is 20%/minute, a slower rate makes no sense, a faster rate could be detrimental for the components.
Figure 6.
Possible qualitative time evolutions of the power modulation of each of the 18 HCPB OB and IB BB compressors in order to reduce the total power demand. The assumed tradeoff is 20%/minute, a slower rate makes no sense, a faster rate could be detrimental for the components.

Figure 7.
Nominal SSEN active and reactive powers in each plasma phase, considering the two different PHTS-PCS options: (a) HCPB and (b) WCLL.
Figure 7.
Nominal SSEN active and reactive powers in each plasma phase, considering the two different PHTS-PCS options: (a) HCPB and (b) WCLL.

Figure 8.
Simplified flow diagram of the algorithm adopted for the preliminary design of the DEMO SSEN.
Figure 8.
Simplified flow diagram of the algorithm adopted for the preliminary design of the DEMO SSEN.

Figure 9.
Total steady state electrical powers requested from the grid at the DEMO HV connection point in the two PHTS-PCS cases (HCPB and WCLL).
Figure 9.
Total steady state electrical powers requested from the grid at the DEMO HV connection point in the two PHTS-PCS cases (HCPB and WCLL).


Table 1.
Summary of the DEMO operation phases with typical durations.
| Phase | Phase Name | Typical Time Duration |
|---|---|---|
| 1 | CS pre-magnetization | 500 s |
| 2 | Plasma Breakdown | 1.4 s 180 s |
| 3 | Plasma ramp-up | |
| 4 | Heating flat-top | 10 s |
| 5 | Burn flat-top | 7200 s |
| 6 | Plasma ramp-down | 150 s |
| 7 | Dwell time | 200 s |
| Total time duration of the DEMO operations | ≈8240 s | |
Table 2.
EU-DEMO Project Plant Breakdown Structure (PBS) with expected powers and connection to the distribution grid.
Table 2.
EU-DEMO Project Plant Breakdown Structure (PBS) with expected powers and connection to the distribution grid.
| PBS | PBS Description | Power | Distribution | |
|---|---|---|---|---|
| Active (MW) | Reactive (MVAR) | |||
| 11 | Magnet System | 0 | 0 | Passive |
| 12 | Vacuum Vessel (VV) | 0 | 0 | Passive |
| 13 | Divertor System | 0 | 0 | Passive |
| 14 | Blanket (HCPB) 1 | 0 | 0 | Passive |
| 16 | Blanket (WCLL) 1 | 0 | 0 | Passive |
| 18 | Limiter | 0 | 0 | Passive |
| 20 | Cryostat | 0 | 0 | Passive |
| 21 | Thermal Shields | 0 | 0 | Passive |
| 22 | Tritium, Fueling, Vacuum | 12.2 | 7.7 | SSEN |
| 25 | Tritium Extraction and Removal (HCPB) 1 | 3.0 | 1.9 | SSEN |
| 27 | Tritium Extraction and Removal (WCLL) 1 | 3.0 | 1.9 | SSEN |
| 30 | ECRH System (main power) 2,3 | 125.0 | 60.5 | PPEN |
| 30 | ECRH System (auxiliary power) 2 | 6.0 | 2.9 | SSEN |
| 31 | NBI System (main power) 2,3 | 125.0 | 60.5 | PPEN |
| 31 | NBI System (auxiliary power) 2 | 6.0 | 2.9 | SSEN |
| 32 | ICRH System (main power) 2,3 | 125.0 | 60.5 | PPEN |
| 32 | ICRH System (auxiliary power) 2 | 6.0 | 2.9 | SSEN |
| 40 | Plasma Diagnostic & Control System | 6.1 | 3.0 | SSEN |
| 49 | VV PHTS | 9.7 | 4.7 | SSEN |
| 50 | Breeding Blanket PHTS (HCPB) 1,3 | 165.6 | 54.4 | SSEN |
| 52 | Breeding Blanket PHTS (WCLL) 1 | 59.4 | 19.5 | SSEN |
| 54 | VV Pressure Suppression System (HCPB) 1 | 2.3 | 0.0 | SSEN |
| 56 | VV Pressure Suppression System (WCLL) 1 | 4.6 | 2.9 | SSEN |
| 58 | Divertor & Limiter PHTS (HCPB) 1 | 19.5 | 12.1 | SSEN |
| 59 | Divertor & Limiter PHTS (WCLL) 1 | 10.0 | 6.2 | SSEN |
| 60 | Remote Maintenance (RM) System 4 | 5.0 | 3.1 | SSEN |
| 61 | Assembly | 4.6 | 2.2 | SSEN |
| 63 | Radwaste Treatment and Storage | 3.0 | 1.5 | SSEN |
| 70 | Balance of Plant (HCPB) 1 | 12.0 | 5.8 | SSEN |
| 72 | Balance of Plant (WCLL) 1 | 12.0 | 5.8 | SSEN |
| 80 | Site Utilities | 3.1 | 1.9 | SSEN |
| 81 | Cryoplant & Cryodistribution | 101.8 | 63.1 | SSEN |
| 82 | Electrical Power Supply (main power) 3 | 300.0 | 300.0 | PPEN |
| 82 | Electrical Power Supply (auxiliary power) | 21.0 | 10.2 | SSEN |
| 83 | Buildings | 54.8 | 26.6 | SSEN |
| 85 | Plant Control System | 3.6 | 1.7 | SSEN |
| 87 | Auxiliaries | 90.9 | 56.4 | SSEN |
1 The PBSs referred to the HCPB and WCLL options are alternative: once the final configuration will be selected, only one of the two reported powers will be requested in DEMO. 2 The powers reported for the H&CD systems (PBSs 30, 31 and 32) were estimated for the reference solution with related efficiencies (see Section 5.3). 3 Since the powers absorbed by these PBSs are not constant, their peak powers are reported. While the PPEN loads (PBSs 30, 31, 32 and 82) may be very variable, the load of PBS 50 is reduced to 20% in some phases as described in Section 5.5. 4 Even if RM System is connected to the SSEN, it mainly operates during specific maintenance phases and not during plasma phases in Table 1.
Table 3.
Electrical data of the MV/MV and MV/LV transformers.
| Transformation Ratio 22/0.4 kV | Transformation Ratio 22/6.6 kV | ||||||||
|---|---|---|---|---|---|---|---|---|---|
| Sn [MVA] | P0 [kW] | Pk [kW] | Vk [%] | I0 [%] | Sn [MVA] | P0 [kW] | Pk [kW] | Vk [%] | I0 [%] |
| 1.6 | 2.2 | 13 | 6 | 0.9 | 20 | 7.7 | 110 | 7 | 0.3 |
| 2.5 | 3.1 | 19 | 6 | 0.6 | 40 | 15.1 | 220 | 7 | 0.3 |
| 3.15 | 3.8 | 22 | 6 | 0.5 | Winding not present | ||||
Table 4.
Electrical data of the HV/MV transformers.
| Transformation Ratio 400/22 kV | ||||
|---|---|---|---|---|
| Sn [MVA] | P0 [kW] | Pk [kW] | Vk [%] | I0 [%] |
| 150 | 17.1 | 77.5 | 13 | 2 |
Table 5.
Electrical data of the SSEN cables.
| Rated Voltage [kV] | Section [mm2] | Rated Current [A] | R’ (20 °C) [mΩ/km] | Max R’ (90 °C) [mΩ/km] | X’ [mΩ/km] |
|---|---|---|---|---|---|
| 0.4 | 1 × 240 | 550 | 20.1 | 104 | 81 |
| 0.4 | 1 × 300 | 620 | 64.1 | 85 | 79 |
| 6.6 | 1 × 500 | 760 | 36.6 | 51 | 93 |
| 6.6 | 1 × 630 | 850 | 28.3 | 42 | 90 |
| 6.6 | 1 × 800 | 930 | 22.1 | 35 | 86 |
| 22 | 1 × 150 | 453 | 124.0 | 159 | 128 |
| 22 | 1 × 240 | 612 | 75.4 | 97.8 | 128 |
| 22 | 3 × 400 | 813 | 47.0 | 62.7 | 128 |
Table 6.
Materials and technical characteristics assumed for the SSEN cables.
| Rated Voltage [kV] | Section [mm2] | Cores | Conductor | Insulation |
|---|---|---|---|---|
| 0.4 | 240 300 | Single | Stranded flexible annealed bare copper | High-module HEPR rubber, with filler/sheath non-hydroscopic material and special PVC outer sheath |
| 6.6 | 500 630 800 | Single | Copper | Unarmored XLPE, with semi-conductive screens on conductor and insulation |
| 22 | 150 240 | Single | Stranded circular compacted copper | XLPE insulation, with conductor screen and insulation screen |
| 400 | Triple |
© 2020 by the authors. Licensee MDPI, Basel, Switzerland. This article is an open access article distributed under the terms and conditions of the Creative Commons Attribution (CC BY) license (http://creativecommons.org/licenses/by/4.0/).
Share and Cite
MDPI and ACS Style
Minucci, S.; Panella, S.; Ciattaglia, S.; Falvo, M.C.; Lampasi, A. Electrical Loads and Power Systems for the DEMO Nuclear Fusion Project. Energies 2020, 13, 2269. https://doi.org/10.3390/en13092269
AMA Style
Minucci S, Panella S, Ciattaglia S, Falvo MC, Lampasi A. Electrical Loads and Power Systems for the DEMO Nuclear Fusion Project. Energies. 2020; 13(9):2269. https://doi.org/10.3390/en13092269
Chicago/Turabian StyleMinucci, Simone, Stefano Panella, Sergio Ciattaglia, Maria Carmen Falvo, and Alessandro Lampasi. 2020. "Electrical Loads and Power Systems for the DEMO Nuclear Fusion Project" Energies 13, no. 9: 2269. https://doi.org/10.3390/en13092269
Note that from the first issue of 2016, this journal uses article numbers instead of page numbers. See further details here.