Article

Analysis of the Impact of Building Integrated Photovoltaics (BIPV) on Reducing the Demand for Electricity and Heat in Buildings Located in Poland

Institute of Electrical Engineering and Electronics, Poznań University of Technology, st. Piotrowo 3a, 60-965 Poznań, Poland
*
Author to whom correspondence should be addressed.
Energies 2020, 13(10), 2549; https://doi.org/10.3390/en13102549
Submission received: 20 April 2020 / Revised: 10 May 2020 / Accepted: 11 May 2020 / Published: 18 May 2020
(This article belongs to the Special Issue Buildings Integration of Renewable and Smart Energy Systems)

Abstract

:
Based on a method to reduce energy consumption suggested in a real energy audit carried out in an industrial plant located in Poznań (city in Poland), the potential of using photovoltaic (PV) panels as wall cladding was analyzed, in order to reduce energy (electric and thermal) consumption and financial expenditure. The authors’ concept of using building integrated photovoltaic installation (BIPV) was presented and tested. This study checked whether the presence of PV modules would also affect heat transfer through the external wall of the building on which the installation is located. The analysis consisted of determining, for two variants, the heat transfer coefficients across the partition, in order to estimate the potential thermal energy savings. The first variant concerned the existing state, i.e., heat transfer through the external wall of the building, while the second included an additional partition layer in the form of photovoltaic panels. As a result, the use of panels as wall cladding allowed the improvement of the thermal parameters of the building wall (by increasing the thermal resistance of the wall), and the reduction of gas consumption for heating. The panels also generate electricity for the factory’s own needs. Payback time, compared to calculations which do not include changes in thermal parameters, was shortened from 14 to 11 years. The main reason for this is that gas consumption is reduced due to the improved heat transfer coefficient of the wall and the reduction of the heat loss of the facility. This aspect is usually overlooked when considering photovoltaic installations and, as argued by this paper, can be important.

1. Introduction

In the modern world, there is a gradual increase in demand for energy, in particular for electricity, both in households and in the industry. Along with technological and cultural developments, a continuous increase in the number of owned and used electrical and electronic devices powered by electricity is observed [1].
Due to the limited deposits of fossil fuels (used to a large extent for the production of electricity and heat) [2], ample evidence of the degrading impact of economic development on the natural environment, an increase in energy production costs, as well as growing public awareness of collective responsibility for environmental protection and prevention of climate change, have recently increased interest on methods to reduce energy consumption [3]. Individual countries establish relevant legal regulations concerning energy efficiency, the amount of extraction of fossil energy resources, renewable energy sources, and the introduction of energy efficiency solutions. Requirements imposed by the European Union also dictate the implementation of energy efficiency measures aimed at reducing annual energy consumption by 20% [4]. In addition, the European Union in its European Green Deal Strategy indicates the threats to Europe and the world of environmental degradation and climate change. According to it, by 2050 there are no net emissions of greenhouse gases in the EU, and economic growth is decoupled from the consumption of natural resources [5].
Standards related to the labeling and ecological design of all types of products [6], buildings, equipment, and infrastructure, as well as services rendered, have been imposed [7]. The application of proper wall insulation, pipe heating, or cooling systems and the use of cutting-edge technologies [8] and energy-saving devices [9] are examples of actions that result in obtaining energy savings that translate into financial and environmental benefits [9,10]. In recent years, photovoltaic installations that generate electricity directly in the place of its consumption are gaining popularity. Special solutions include photovoltaic cells integrated with building elements (BIPV) such as photovoltaic window glasses, PV tiles, or wall cladding. These elements, in addition to generating electricity, also affect other aspects of the building (architectural, visual, and functional) and change the heat transfer coefficients through building partitions, thus improving the energy efficiency of the building [11]. In addition, Zhang et al. [12] discussed the progress of research in assessing the life cycle of BIPV components and their electrical, thermal, and optical performance. Curtuis [13] indicated that the use of buildings’ integrated photovoltaics allows the use of a larger area of the building for solar installation in densely populated countries. It also evoked barriers and facilitates the adoption of BIPV elements based on many interviews. Higher initial costs and lower efficiency compared to traditional PV systems and architects’ reluctance were indicated as the main limitation of BIPV systems.
Atoye et al. [14] pointed out the deficiencies in research of the various benefits of using BIPV technology. They presented the concept of an educational and communication approach to BIPV systems, encouraging investors to use this technology due to its environmental and economic benefits. Conversely, Lee et al. [15] paid attention to the optimal location of the PV generator integrated within the building’s wall, in terms of energy efficiency, which will lower the value of generated energy. Various factors causing loss of BIPV system efficiency were analyzed, e.g., PV cell temperature, contamination, and DC–AC inverter, which should be considered at the design stage of the BIPV installation. Castillo et al. [16] presented the possibilities of directly using energy from photovoltaic installations, to power a DC installation of an autonomous building. Thanks to this, the installation consists of a smaller number of elements and eliminates the loss of energy conversion from DC to AC. It has been calculated that the losses resulting from the use of low voltage are three times lower than the transmission losses over the AC power grid. In turn, Castillo et al., in [17], presented simulation calculations of energy production and consumption, in order to ensure the continuity of autonomous power supply of a building with a low voltage installation and economic analysis of the proposed model. Trzmiel et al. [18] took into account very important aspects of the working conditions of the solar system. When designing a photovoltaic installation, it is very important to analyze its operating conditions, in particular counteracting the shading of PV cells. The causes, effects, and methods of eliminating the shading of PV cells (mainly reducing electricity production) are presented.
An interesting issue was also raised by Chen et al. [19], where the authors examined the thermal and electrical performance of the BIPV/T (building integrated photovoltaic/thermal) system as a PV panel integrated with a solar collector, installed above a window, in order to improve thermal conditions in the building in the summer, by limiting the penetration of sunlight in its interior. Similar experimental studies can be found in [20], concerning the PV-Trombe wall system in Iraqi weather conditions. This system reduces the energy demand of the building’s heating and air-conditioning system by generating electricity and limiting the amount of sunlight inside the building. Similar results of the study are presented by Luan et al. [21], who studied a photovoltaic wall system in Vietnam.
Yoshioka et al. [22] carried out measurements and simulations of energy yields from PV panels installed on the north side of the roof and wall of a building in a country with a lot of snow. For the roof installation, the values of the generated energy were obtained irrespective of the presence or absence of snow on the ground, while the panels installed on the wall of the building generated three times more energy if the snow was on the ground than without it. Similar conclusions were obtained in studies by Yoshioka et al. [23], using panels on the walls of a building in snow-covered Japan, where due to the reflection of solar radiation on snow lying on the ground, higher values of generated energy were obtained than in its absence.
Conversely, Yang et al. [24] developed a simulation model for solar wall structures, in order to determine changes in their electrical and thermal parameters. It has been proven that the ventilated space between the PV panels and the building wall is trimmed to increase to 8% of the value of generated energy compared to a non-ventilated channel. Similar multiparameter tests of a wall-mounted photovoltaic device were carried out by Dehra [25], who proposed a resistance-capacitive model. Thanks to this, it is possible to estimate the impact of inductive and capacitive heat losses on the electrical parameters of the photovoltaic wall panel. In another work, Dehra [26] presented a numerical model of a photovoltaic wall that allows for the determination of the effect of temperature on its electrical efficiency, heat capacity, and heat transfer coefficient through the building facade.
Based on the analysis of the parameters of PV panels installed on the wall of a residential building presented by Irshad et al. [27], the possibilities of improving the efficiency of these systems and reducing their costs (heat demand) were indicated. It was also noted that the installation of PV panels on the wall of a house could have an impact on reducing its calf load, but without specific evidence on how to determine this.
Peng et al. [28] conducted experimental studies of thermal parameters of a double-layer solar facade. It has been shown that the best effects of preventing heat loss can be obtained when the wall gap is not ventilated. In [29], it was found that the heat loss of the solar wall system in winter was 32% lower than in the case of traditional walls, and the heat increase through this southern facade in summer was 51% lower than in the case of a conventional wall.
Yang et al. [30] showed, in simulation studies, that by replacing a traditional wall with a BIPV wall, the cooling load can be reduced by 33–50% in various regions of China. Ji et al. [31] investigated how the wall-mounted photovoltaic system installed in Hong Kong reduced the total heat build-up in the building by around 53–60% over the summer, compared to normal external walls.
Wang et al. [32] compared the thermal efficiency of four roof solar systems. The ventilated photovoltaic roof obtained higher energy efficiency and lower cooling load; therefore, it was more suitable for summer applications. In turn, the unventilated PV roof was more suitable for winter use, because it helped reduce the heating load by generating heat during its operation.
Fung et al. [33] and Wong et al. [34] examined the thermal properties of translucent photovoltaic modules in windows. Their test results showed that the coverage area of solar cells significantly influenced the total increase in solar heat. In turn, double-glazed PV structures with an internal air gap improve their thermal efficiency by receiving heat by moving air [35]. Due to this, the working temperature of the PV cell and the efficiency of electricity production are reduced.
The cited research on BIPV technology indicates great energy-saving opportunities after conducting an energy audit and the introduction of modernizations or new technologies, which include building-integrated photovoltaics. Due to some deficiencies in the literature, the authors decided to analyze the possibilities of using photovoltaic wall elements to improve the energy efficiency of an enterprise, based on the energy audit of a company existing in Poland. The authors proposed a method for determining the thermal resistance of building elements and made calculations of the amount of gas saved for heating the building. Photovoltaic wall cladding, in addition to generating electricity, also improves the heat transfer coefficient of building partitions, contributing to less heat loss and lower expenditure on space heating.
This paper is structured as follows: Section 2 contains the legal basis for conducting an energy audit and its types, a literature review of energy audit, and the results of an audit of a selected company. Section 3 provides an analysis of the energy productivity of the solar installation proposed for the plant. Section 4 presents the concept of using photovoltaic panels as wall cladding, in order to improve the heat transfer coefficient of the wall, along with a comparative analysis of gas consumption for heating purposes for the current variant and using PV panels. Section 5 contains the discussion and economic analysis of the proposed modifications, while Section 6 contains the final conclusions.

2. Energy Audit

2.1. Forms and Applications of Energy Auditing

In order to obtain adequate information on the current energy consumption of a building or enterprise, its energy audit should be performed as the first step, to decrease energy consumption [10,36]. The result of the audit is a report with the proposed amendments, which could serve as a basis for implementations to improve the rational use of energy in the building [8]. The collection of relevant data determines the feasibility of projects and energy-saving, provided that they are also economically viable. This is also associated with a reduction of harmful effects on the environment [37].
Due to the scope of activity, three main types/phases of audits can be distinguished [38,39,40]:
(a)
Initial (review)—consists of observing the operation of installations and devices in the short term; it determines the easiest way to implement amendments to rationalize energy management, or justifies the need for a full audit.
(b)
Full (general, detailed, and diagnostic)—includes a comprehensive analysis of energy management by analyzing in detail the energy balance in the audited unit.
(c)
Investment—consists in presenting all solutions rationalizing energy consumption and loss reduction, while presenting the technical and economic resources necessary for the implementation of various possible options.
In addition, a detailed limited audit can be highlighted, concerning the examination of a specific device or installation.
In order to force the need to improve energy efficiency, Poland introduced legal conditions, which will require the implementation of certain projects, such as the following [41,42,43]:
(a)
Regulation of the Ministry of Infrastructure, related to the detailed scope and form of the energy audit, as well as a detailed way of verifying the energy audit;
(b)
Standards applicable in Poland;
(c)
Acts supporting thermo-modernization and renovation.
Polish law forces energy audits to be carried out by every large enterprise employing at least 250 people or having an annual net turnover of over EUR 50 million every four years. Their results and potential savings must be communicated to the President of the Energy Regulatory Office (URE) no longer than 30 days from the implementation of the energy audits. Audit under the act is not required when the company has implemented the European Environmental Management System (EMAS) or any energy management system which prescribes an audit [44,45].
The authors of this paper have decided to analyze the energy audit of a local enterprise, based on the cited legal requirements regarding the need to perform periodic energy audits of specific enterprises, their various types, and scope of reducing energy consumption, as indicated in the literature by auditors.

2.2. Examples of Using the Energy Audit to Reduce the Energy Consumption of Buildings

The identification of energy-saving opportunities can be performed by an energy audit. There are some basic areas to consider in the course of carrying out an energy audit. These include lighting systems and the source of electricity, heat, or cold. The most common area in which large electricity savings can be achieved is the audit of the lighting installation, ensuring the right levels of illumination by using modern and energy-saving light sources (e.g., LED lamps), as well as automation and control systems [36,46]. Sun et al. [47] pointed to four areas in which the modernizations carried out contributed to the best results of improving the energy efficiency of the building. These include the use of LED lighting, window films, and green roofs and the modernization and optimization of chilled-water systems. The simulated energy saving was 30%, while the real one did not exceed 16%. Discrepancies in the results are due to errors in the building performance simulation and the inappropriate living conditions of the analyzed objects. Aranda et al. [48] pointed to such discrepancies in the simulation and results from their energy audit of communal buildings in Southern Europe. A common cause of errors in simulations is bad assumptions, resulting from the fact that poor inhabitants often live at a temperature below the accepted level of thermal comfort. As a result, the actual consumption of thermal energy may be 40–140% lower than that simulated for standard assumptions. Cited studies point to the high significance of the assumptions on the results of simulation analyses and energy audits aimed at energy savings.
In the literature, one can find many works related to industrial energy audits, such as mechanical and heavy engineering [49], as well as training and educational facilities [50,51,52]. In Kumar et al. [51], the electricity consumption of devices that consume more energy compared to others in the same area of application throughout the Technical Institute campus was analyzed. The audit presented by Nissanga et al. [50], conducted at the campus, recommended a reduction of approximately 15–20% of energy and a reduction of costs by approximately 25–30%, in order to balance supply and demand for electricity. In Chakraborty et al. [52], an audit was carried out at the NIT Agartala educational center in India regarding energy consumption. The main areas of energy losses, as well as the possibilities of reduction and increase of energy efficiency, were indicated. This shows the extent of modernization work, along with the necessary financial expenditure to be incurred in order to achieve profits.
An energy audit can also be carried out in a residential building, to reduce energy consumption. Rohit et al. [53] presented the advantages of using energy-saving lighting, along with the costs and payback time of investment, as well as the possibility of obtaining LEED certification. Moreover, Rohit et al. [53] presented an audit of the lighting installation and room-cooling fans at the National Institute of Technology hotel in Kurukshetra. The authors pointed out the possibility of reducing energy consumption by 21% and carbon dioxide emissions by 579 tons. The process of obtaining the LEED certificate and the related procedures were also indicated. A significant problem is the modernization of installations in monuments and historic buildings, as indicated by Mazzola et al. [54]. An audit of the seventeenth-century palace in Valencia, which currently houses a museum, was carried out in order to increase the energy efficiency of the facility by reducing the costs of operating and maintaining the facility, while maintaining the procedures applicable to historic buildings. Similar studies were carried out for historic public buildings in Pisa, Italy, by modernizing the lighting system [55]. In turn, one of the objectives of the European Union’s energy policy is to achieve the status of almost zero energy for hotel buildings (nZEB) by 2050. Nocera et al. [56] presented the possibilities for energy modernization of a historic hotel located in Southern Italy (Syracuse), in order to obtain nZEB status. Baskar et al. [57] conducted an energy audit in February 2014, at the National Institute of Technical Teacher Training and Research hostels in Chandigarh, in order to identify major areas of energy waste. The energy consumption of individual lighting systems and HVAC (heating, ventilation, air-conditioning) were analyzed. The study estimated achievable savings of 12.12% in electricity and calculated the payback time.
Simelane et al. [58] described the method of conducting energy audits, audit results, and initiatives for effective demand-management measures. This is in order to achieve energy reduction and transition to energy autonomy in the Energy and Autonomous Campus (EAC). They used for this the energy from three basic energy sources: the sun, wind, and biogas from biogenic waste.
Mrówczyńska et al. [59] made an attempt to establish a framework for the costs of changing energy policy by using neural networks, in order to identify the conditions of social infrastructure. A model for analyzing socio-infrastructural conditions for reducing energy costs and improving the efficiency of buildings was presented. A model was also developed to estimate the cost to residents if energy was obtained from Renewable Energy Systems (RES). The study addressed a number of topics, namely control emissions, reducing energy consumption, renovation of buildings, the supply of renewable energy, and energy poverty, in order to develop methods corresponding to social conditions.
Haraldsson et al. [60] examined the significance of various barriers and factors influencing the improvement of energy efficiency in the Swedish aluminum industry and foundries, and additionally, the perceived usefulness of different sources of information on energy-efficiency measures. Among the most important factors determining investments to increase a company’s energy efficiency were economic and ecological, as well as possibilities of trading in CO2 emission allowances. Significant factors have also proven to promote environmental practices and the perception of environmental activities by other companies, thereby increasing their competitiveness in the market.
Coimbra et al. [61] analyzed audits of various social-housing buildings, in accordance with the regulations of the Portuguese energy agency. The savings of electricity and natural gas in various locations were presented. Emphasis was placed on the precise determination of heat transfer coefficients for individual building elements (walls, ceilings, roofs, etc.). Calculations were made for energy-sustainable buildings and buildings of traditional construction, intended for lower-income groups, where materials with lower energy efficiency were used. The analyses demonstrated the expected decrease in operating costs (natural gas and electricity), which was obtained by using materials with better thermal conduction coefficients, which also resulted in a faster return on investments. A similar analysis was made by Solgi et al. [62] for a decades-old residential building located in the cold climate of Iran that does not currently meet the applicable national regulations of the permissible heat transfer coefficients of building partitions. The linear regression method was used to compare simulation calculations with the actual building operating costs. Three variants of the facility modernization were proposed (from the least expensive, through to medium, to the most expensive). The results of the analysis showed the best results for the modernization of wall coatings (reduction of wall heat transfer coefficients), in order to reduce energy consumption. The scenarios for each of the investment payback periods, however, which ranged from 10 to 50 years, are economically unjustified on a national level.

2.3. Analysis of the Results of the Energy Audit of a Large Food-Processing Plant

The authors of this work conducted an analysis of the results of the energy audit of a large food-processing plant located in the vicinity of Poznań in Poland. Due to the plant’s crew of several hundred, it had a statutory obligation to carry out an audit, in which methods for reducing the energy consumption of the plant were described. The characteristics of all major technologies and resources used in the plant, such as electricity, natural gas, process steam, water, chilled water, compressed air, ventilation and air-conditioning, sewage treatment plant, biogas, and BMS building management system, are presented. The consumption of energy from various carriers (electricity, natural gas, and biogas) was also analyzed. A detailed technical and economic analysis of solutions affecting energy reduction was made. Solutions included modernization of the lighting installation, application of a heat recovery system from exhaust gases in a biogas boiler, recovery of heat energy from secondary steam resulting from condensate expansion, replacement of air compressors, and execution of a photovoltaic installation electricity. Financial savings resulting from the solutions used were estimated, as well as the amount of capital expenditures necessary and the payback time.
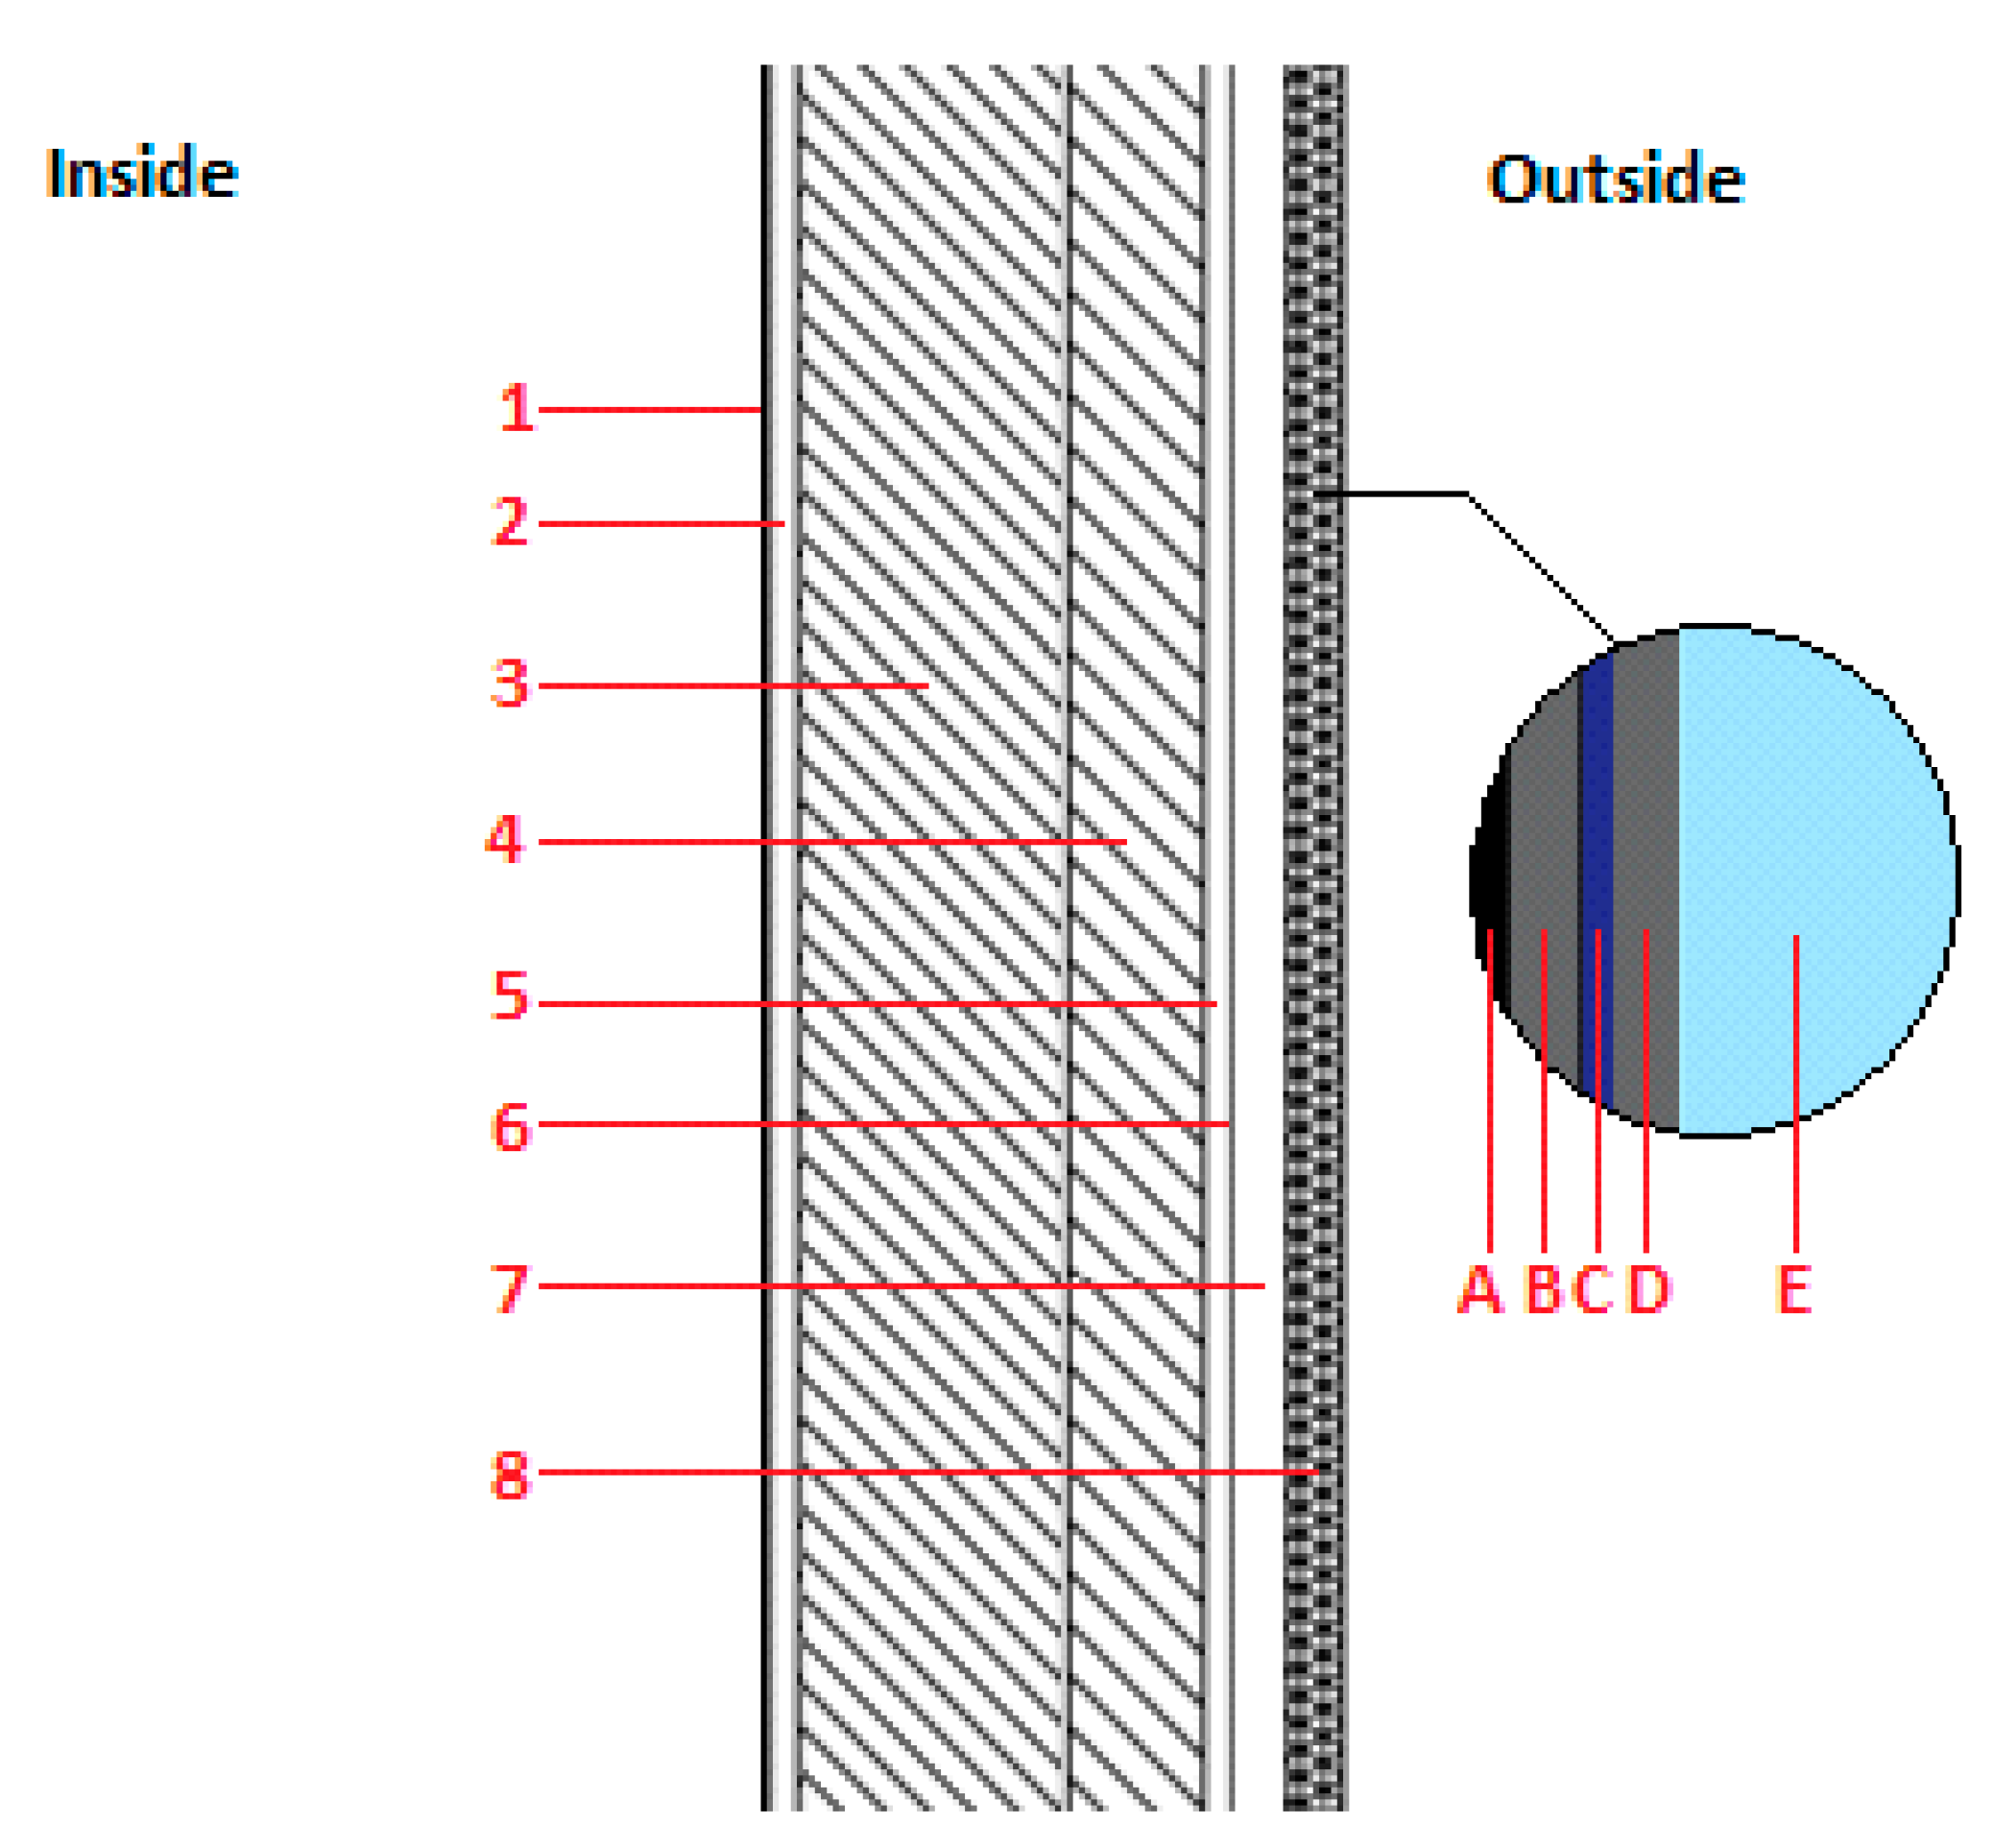
One of the auditors’ suggestions was to use a photovoltaic installation to generate electricity at the place of use. Due to the specifics of the roof structure of the production hall, however, which was delicate and heterogeneous, and the distributed elements of the ventilation system located on it, it was technically impossible for it to accommodate the PV installation. Therefore, the authors of the publication proposed their own solution, involving the use of a photovoltaic installation as wall cladding of the building’s production hall, creating a photovoltaic element integrated with the building (BIPV), to reduce the heat transfer coefficient of the wall and additional heat energy savings (in addition to generating electricity from PV panels). Thanks to this procedure, the profits from this project were more accurately estimated, the payback time was shortened, and ecological savings were achieved, i.e., lower emissions of pollutants. In this work, the main focus is on PV as wall cladding, which has not yet been considered. This novel concept, together with a thorough analysis, can affect the results of the company’s energy audits, giving a more complete view of potential savings.

3. Use of Photovoltaic Panels as a Source of Electricity

The project involves the installation of photovoltaics (PV) on the external wall of the building facing south. The installation would be inclined at an angle of 90 degrees to the ground, and the total field of PV panels would reach the dimensions of 6 × 85 m. A 300 W monocrystalline photovoltaic panel was selected, with dimensions of 0.99 × 1.65 m [63]. The panels will be mounted horizontally on the building wall. In total, 312 panels will be installed, which will translate into total solar power of 93.6 kW. The electricity produced would be used at one hundred percent for the plant’s own needs, without the possibility of selling it outside. After passing through the inverter and energy meter, energy will go to the internal electrical switchboard supplying the receivers in the company. The switchgear will also be supplied from the external power grid [64].
The energy yield of the solar installation mainly depends on the environmental conditions prevailing in the place. In Poland, about 80% of annual sunshine falls during the spring and summer period (from April to September). The annual average amount of sunshine in Poland is about 1600 h, and luminance values range between 970 and 1070 kWh/m2 [65]. Based on the averaged meteorological data for the city of Poznań, a specific solar installation model was chosen by the audit contractor, to estimate its annual generation of electricity [64]. On the basis of the average insolation value of the analyzed wall in a given calendar month, as well as the total number of hours in a day it was running, the monthly energy production by the analyzed cells was calculated [66]. The results of the calculations are presented in Table 1.
The production of electricity was calculated on the basis of the knowledge of the intensity of insolation, the area, and efficiency of the panels, taking into account the losses in the transmission of power and the internal efficiency of the module. After adding up the monthly results, an annual electricity production of 74,200 kWh was obtained. It was estimated that, in each subsequent year of operation, the amount of electricity generated would decrease by 0.6% compared to the previous year (annual loss of power by the installation). As a result, the total amount of energy produced for 25 years would be 1,728,317 MWh.
In order to determine the annual savings in the form of using the electricity produced from the PV installation, one should multiply the amount of energy generated by the variable payment component equal to 0.0682 EUR/kWh.
K TOT = 74,200 · 0.0682 = 5060.44   [ EUR ]
It should be remembered, however, that having such an installation also involves the need to conduct inspection and maintenance work, as well as the insurance of such an installation. Based on these factors, the audit team estimated the annual operating costs for this installation in the amount of EUR 875. Therefore, the actual annual profit would be reduced by this amount [64].
Δ K TOT = 5060.44 875 = 4185.44   [ EUR ]
The cost of photovoltaic panels in the proposed installation, with a rated power of 93.6 kW, is EUR 40,950. The cost of inverters is EUR 9600, while the cost of assembly, rack, wiring, and protection is EUR 9360. The total investment outlays amount to EUR 59,910. Knowledge of these parameters determined the SPBT [64] indicator.
SPBT = N INV Δ K TOT = 59,910 4185.44 = 14.30   [ years ]
The obtained value of the simple payback period of SPBT investment expenditures presents the implementation of this proposal as profitable both in technical and economic terms. The payback time of this investment is over 14 years, while the durability of the selected photovoltaic panels is approximately 25 years. The amount of electricity generated is of negligible value compared to the plant’s total energy use (only approximately 0.23%). Therefore, considering the very high energy demand in the company, as well as the purchase price and subsequent operation costs of such a system, it was found that this is an inefficient undertaking.

4. The Use of Photovoltaic Panels as an Additional Wall Insulation Layer for Improving the Thermal and Electrical Parameters of a Building

4.1. Analysis of the Existing State

The existing building wall of an industrial plant consists of six layers made of various building materials of various thicknesses. Figure 1 shows a fragment of the cross-section of the analyzed external building wall.
The numbers 1–6 appearing in Figure 1 indicate the successive layers of partitions. Their designations, together with technical data, such as thickness of fragments, thermal conduction coefficients, and thermal resistance, are included in Table 2.
The thicknesses of all wall layers, as well as the values of thermal conduction coefficients for sandwich panels, were read from the technical and construction documentation of the industrial plant under study. The remaining λ values were read from the PN-EN 12524:2003 standard, based on the knowledge of the material of the given layer [67]. The thermal resistance of each partition was determined on the basis of the following equation (with an example calculation made for one of the wall layers—Partition No. 3) [68,69].
R = d λ = 0.202 0.22 = 0.9182   [ m 2 K / W ]
In order to determine the total thermal resistance of the entire wall, the following equation was used [68,70]:
R T = R si + R k + R se
For these calculations, it is necessary to know the resistance for heat transfer after the external (Rse) and internal wall (Rsi) surfaces. Their values are determined by the standard, depending on the direction of the heat flow (Table 3) [67].
In this case, the partition being analyzed is a wall perpendicular to the ground, and, therefore, it was necessary to read the values for the horizontal direction of the heat flux. Knowledge of these parameters allowed the determination of the total thermal resistance of the wall, as well as the height of its heat transfer coefficient, which is the inverse of resistance RT, calculated in accordance with the relationship [68,70].
R T = R si + R 1 + R 2 + R 3 + R 4 + R 5 + R 6 + R se = 1.3255   [ m 2 K / W ]
U = 1 R T = 1 1.3255 = 0.7544   [ W / m 2 K ]
In connection with the presented methodology above, for determining the heat transfer coefficient (or thermal resistance) of a building partition, it is possible to analyze the impact of additional wall insulation made of PV panels on these parameters.

4.2. Analysis of the Variant after Modernization

In this solution, apart from existing partitions, it is also necessary to take into account the installed photovoltaic panels and the air gap between them and the wall. This is the installation proposed in the audit to generate electricity. Figure 2 shows what the cross-section of this wall would look like with installed PV panels.
Numbers 1–6 refer to the same partitions with the same parameters as described in Table 2; therefore, they are not described again here. It is necessary, however, to take them into account when determining the total thermal resistance of the partition. The symbols A–E represent the next layers of the PV panel, which have been presented in this way due to their small size. Table 4 presents a description of all newly added insulation layers.
In the case of an air gap, it was necessary to read its value from the standard [70] from the table with the values of thermal resistance for non-ventilated air layers. For this gap thickness, as well as the horizontal direction of heat flux flow, an R value of 0.18 m2K/W was read. After transforming the formula for calculating the thermal resistance of a single partition, the value of the λ coefficient for this layer [71] was calculated.
λ = d R = 0.07 0.18 = 0.389   [ W / mK ]
The thermal resistances of the other layers in the photovoltaic panel were calculated analogous to the options in the existing state. Some elements in a given part of the heat transfer surface, such as photovoltaic module frames, parts of electrical installations, nails, etc., were omitted from the considerations. The influence of these components on the final calculations is negligible due to their small area [71].
In the considerations, the U coefficient for the wall with the PV installation was treated as one partition in the calculations. The value of total thermal resistance was determined as the sum of resistances of all layers occurring in the new partition, also taking into account the resistance of the air gap, as well as the Rsi and Rse parameters. The following height of this total resistance was obtained [69].
R T = R si + R 1 + R 2 + R 3 + R 4 + R 5 + R 6 + R 7 + R A + R B + R C + R D + R E + R se = 1.512   [ m 2 K / W ]
The heat transfer coefficient, however, reached the following value:
  U = 1 R T = 1 1.512 = 0.661   [ W / m 2 K ]
Installation of the photovoltaic system on the tested plant wall would cause a decrease of the heat transfer coefficient through the partition [72], which would result in changing the value of the heat flow stream through it.

4.3. Comparison of Variants

The external wall of the industrial building is a partition separating two centers of different temperatures. Knowledge of both of these temperatures and the heat transfer coefficient allows the determination of the thermal flux that passes through such a partition. Inside the plant, due to production requirements, the temperature in rooms located behind the wall constituting the test object is 18 °C. The temperature on the other side, located outside the building, is different for each month because of the seasons. The average monthly air temperatures in Poznań were read, based on data from the Central Statistical Office (GUS) [68]. In Table 5, the heights of these temperatures are presented, together with the value of the unit heat flux calculated on this basis (i.e., permeating through 1 m2 of the partition) and the total thermal flux [68].
In order to calculate the temperature difference, it was necessary to subtract the lower temperature from the higher temperature of the medium. In most cases, the higher temperature was definitely inside the plant. Only in the summer months (June, July, and August) was the air warmer outside, so the direction of the thermal energy flow was opposite (the center with the higher temperature transfers heat to the colder medium). In practical terms, this means that, in the summer, the factory premises are partially heated by outside air, and, therefore, the plant must produce more energy to cool the rooms, whereas in the remaining months, there is loss of heat produced in the plant for heating purposes as a result of its extraction outside the building.
Knowledge of the temperature difference made it possible to determine the density of thermal energy penetrating through 1 m2 of the partition. Based on the appropriate dependence, an example calculation made for Variant No. 1 in the month of January [68] is presented.
q = U · Δ T = 0.7544   ·   19.6 = 14.79   [ W / m 2 ]
Figure 3 presents the comparative characteristics of total thermal flows that would penetrate the building partition in given months. Regardless of the temperature of the external center, the installation of the photovoltaic system would reduce the heat flux, which would result in a reduced heat demand for the rooms.
The total annual heat flux for Variant No. 1 was almost 40 kW, while in the case of modernization, it reached a value of less than 35 kW. After subtraction of these two values, the value of thermal energy that would not have been emitted outside the building as a result of the PV installation was obtained.
Δ Q PV = 39,784.34 34,876.72 = 4907.62   [ W ]
As can be seen, the presence of solar modules on the wall actually reduces the heat transfer through this partition. It also results in a reduction of heat losses by almost 5 kW of power.
Reducing the amount of heat penetrating the wall means a decrease in the demand for this type of medium in the plant. For the purpose of heating, technological steam produced in boilers powered by natural gas is used, and, therefore, the assembly of such panels will partially result in lower consumption of natural gas. While analyzing current annual consumption levels of this fuel (over 46 GWh), as well as the amount of bills for its use (almost EUR 1.25 million), we noticed that the share of potential energy savings as a result of this project in the context of the total heat-energy use by the plant is marginal.
Assuming a positive scenario in which there is a need for heat throughout the year for the rooms located behind the considered wall, and taking into account the efficiency of steam production through gas boilers, the following savings in thermal power contained in natural gas were calculated.
Δ Q gas = 4.9 0.87 = 5.63   [ kW ]
Therefore, the calculated annual value of thermal energy saved in natural gas is as follows:
Δ E gas = 5.63 · 8760 = 49.319   [ MWh ]
The product of the saved amount of energy and the unit cost of variable gas for the consumption of natural gas in the amount of 24.63 EUR/MWh presents the annual financial savings resulting from this activity.
Δ K PV = 49.319   ·   24.63 = 1214.72   [ EUR ]
Finally, given the panel’s lifetime of 25 years, this would result in about 50 MWh of saved energy in natural gas, while producing 1.7 GWh of electricity during that time.

5. Discussion

It should be remembered that, in addition to calculated savings in heat, there would also be profit associated with the production of electricity by PV panels. Based on the calculations made in Section 3, assuming that capital expenditures remain unchanged and taking into account additional cash gains as a result of improving the thermal insulation of the building wall, the updated SPBT value was calculated.
SPBT = N INV Δ K TOT = 59,910 4185.44 + 1214.72 = 11.09   [ years ]
An analysis of additional insulating properties of photovoltaic panels significantly improved the payback time of the investment by over three years. The obtained SPBT value is almost equal to the module’s lifespan declared by the manufacturer (25 years).
Taking into account the recent upward trend in charges for electricity and natural gas consumption, however, this factor had to be taken into account in the analysis. The following forecast assumes that, in each subsequent year of operation, these costs would increase by 1% compared to the previous year, both in the case of electricity and gas. This means that the plant will incur increasingly higher fees for the consumption of these utilities each year. It will also cause a gradual increase in the savings resulting from this modernization in subsequent years.
Table 6 presents the results of the calculation for this case. The modules’ lifetime declared by the manufacturer is estimated at 25 years, and the analysis was based on such a period of time. The values of all costs are presented as a growing total amount of fees in the subsequent years of the panels’ operation.
The total amount of fees related to the operation of electricity (about EUR 2.5 MLN) and natural gas (about EUR 1.25 MLN) is over EUR 3.75 MLN per year. Assuming an increase in these costs by 1% each year, the total expenditure after 25 years will amount to over EUR 108 MLN. The total financial savings are the sum of profits related to the reduced demand for both considered utilities, reduced by the annual fee, as estimated in Section 3, resulting from the operation of photovoltaic panels, and amount to EUR 875. The operating costs after the modernization took into account the required initial capital expenditures of over EUR 59,910, which would be incurred in year zero of operation. The last column in Table 6 shows the total difference in expenses related to the consumption of electricity and natural gas by the plant, as a result of the assembly of PV panels. Such an optimistic variant makes the considered project profitable both in technical and economic terms. It shows that the investment would begin to return in the thirteenth year of operation, and after 25 years, it would bring a total financial profit of about EUR 58,000. On this basis, the assembly of additional insulation layers, which consist of PV panels and the air space between the modules and the wall, can significantly change the energy balance of the building.

6. Conclusions

The above analysis has contributed to a critical look at the performed energy audits and the search for complete solutions. The use of BIPV technology was considered in this case.
The proposed concept of using a photovoltaic installation as wall cladding of a building brings measurable economic and ecological benefits. In addition to the generation of electric energy by the PV system, the photovoltaic panels are an extra layer which improves the coefficient of heat exchange between walls of the building by about 12% (from 0.754 to 0.661 W/m2K). Thus, it has reduced gas consumption, which is used to heat the interior of the building. The total profits of the proposed solution (produced from the energy saving of electricity and gas) shortened payback time from more than 14 years to 11.
As can be observed, the cited data confirm the validity of the adopted concept. All the potential profits associated with building modernization bring measurable benefits. It should also be remembered that, in recent years, a particularly large systematic increase in energy prices has taken place. This is an additional argument for using supplementary local energy sources.
Finally, it can be concluded that the task of auditors is to choose a complete approach in formulating the proposed solutions. In addition to the obvious ecological value of reducing the demand for energy from outside, real economic benefits can also be reaped.
In future work, the authors intend to search for technically and economically effective BIPV solutions and explore their application in heterogeneous building constructions.

Author Contributions

Conceptualization and methodology, A.D. and G.W.; validation, D.K.; formal analysis, G.W.; writing—original draft preparation, G.W. and A.D.; writing—review and editing, D.K. and S.M. All authors have read and agreed to the published version of the manuscript.

Funding

This research received no external funding.

Conflicts of Interest

The authors declare no conflict of interest.

List of Symbols Used

SymbolUnitDescription
Am2area of building partition
KTOTEURtotal annual costs
NINVEURtotal investment expenditure
Q ˙ kWtotal heat flux
Rm2K/Wthermal resistance of a single layer of the partition
Rkm2K/Wsum of thermal resistances of successive layers of the partition
Rsim2K/Wthermal resistance on the inner surface of the partition
Rsem2K/Wthermal resistance on the outer surface of the partition
RTm2K/Wtotal resistance to heat transfer
SPBTyearssimple payback time for investment outlays
TKair temperature
UW/m2Kheat transfer coefficient
dmthickness of a single material layer
qW/m2Kheat flux density
λW/mKheat transfer coefficient of the material in a given layer
ΔEgaskWhthermal energy saving contained in natural gas
ΔKTOTEURannual cost savings
ΔKPVEURannual savings due to the use of photovoltaic installation
ΔQgaskWthermal power savings contained in natural gas
ΔQPVkWh/yearsaved amount of thermal energy as a result of using a photovoltaic installation
ΔTKtemperature difference at the center

References

  1. Waqas, K.; Tallal, A.; Imran, A.S.; Aziz, M.M. Smart designing: Reducing the solarization cost by energy efficient retrofits. In Proceedings of the International Conference on Energy Conservation and Efficiency, Lahore, Pakistan, 22–23 November 2017. [Google Scholar] [CrossRef]
  2. Mondal, P.; Yadav, A. An overview on different methods of Domestic Waste Management and Energy generation in India. In Proceedings of the International Conference on Smart City and Emerging Technology, Mumbai, India, 5 January 2018. [Google Scholar] [CrossRef]
  3. Johansen, I.; Stoa, P. Ethical challenges in reducing global greenhouse gas emission. In Proceedings of the IEEE International Symposium on Ethics in Science, Technology and Engineering, Chicago, IL, USA, 23–24 May 2014. [Google Scholar] [CrossRef]
  4. Directive 2012/27 / EU of the European Parlament and of the Council of October 25, 2012 on energy efficiency, amending Directives 2009/125/EC and 2010/30/EU and repeals of Directives 2004/8/EC and 2006/32/EC. Available online: https://eur-lex.europa.eu/LexUriServ/LexUriServ.do?uri=OJ:L:2012:315:0001:0056:pl:PDF (accessed on 20 June 2019).
  5. A European Green Deal Strategy. Available online: https://ec.europa.eu/info/strategy/priorities-2019-2024/european-green-deal_en (accessed on 20 March 2020).
  6. Błaszczyński, T.; Ksit, B.; Dyzman, B. Sustainable Construction with Elements of Energy Certification; Dolnośląskie Wydawnictwo Edukacyjne: Wrocław, Poland, 2012. (In Polish) [Google Scholar]
  7. Oung, K. Energy Management in Enterprise; Wydawnictwo Naukowe PWN: Warszawa, Poland, 2015. (In Polish) [Google Scholar]
  8. Tilwani, R. Energy saving Potentials in building through energy audit—A case study in an Indian building. In Proceedings of the IEEE International Conference on Technological Advancement in Power & Energy, Kollam, India, 24–26 June 2015; pp. 289–293. [Google Scholar]
  9. Kryk, B. Economic, Ecological and Social Problems of Energy use in Households; Wydawnictwo Naukowe Uniwersytetu Szczecińskiego: Szczecin, Poland, 2016. (In Polish) [Google Scholar]
  10. Bhawan, S.; Puram, R.K. Chapter 03: Energy management and audit. In General Aspects of Energy Management & Energy Audit; Bureau of Energy Efficiency, Government of India, Ministry of Power: New Delhi, India; pp. 54–78.
  11. Chivelet, N.M.; Gutiérrez, J.C.; Abella, M.A.; Chenlo, F.; Cuenca, J. Building Retrofit with Photovoltaics: Construction and Performance of a BIPV Ventilated Façade. Energies 2018, 11, 1719. [Google Scholar] [CrossRef] [Green Version]
  12. Zhang, T.; Wang, M.; Yang, H. A Review of the Energy Performance and Life-Cycle Assessment of Building-Integrated Photovoltaic (BIPV) Systems. Energies 2018, 11, 3157. [Google Scholar] [CrossRef] [Green Version]
  13. Curtius, H.C. The adoption of building-integrated photovoltaics: Barriers and facilitators. Renew. Energy 2018, 126, 783–790. [Google Scholar] [CrossRef]
  14. Attoye, D.E.; Adekunle, T.O.; Tabet Aoul, K.A.; Hassan, A.; Attoye, S.O. A conceptual framework for a building integrated photovoltaics (BIPV) educative-communication approach. Sustainability 2018, 10, 3781. [Google Scholar] [CrossRef] [Green Version]
  15. Lee, H.-M.; Kim, S.-C.; Lee, C.-S.; Yoon, J.-H. Power performance loss factor analysis of the a-si BIPV window system based on the measured data of the BIPV test facility. Appl. Sci. 2018, 8, 1645. [Google Scholar] [CrossRef] [Green Version]
  16. Castillo-Calzadilla, T.; Macarulla, A.M.; Kamara-Esteban, O.; Borges, C.E. Analysis and assessment of an off-grid services building through the usage of a DC photovoltaic microgrid. Sustain. Cities Soc. 2018, 38, 405–419. [Google Scholar] [CrossRef]
  17. Castillo-Calzadilla, T.; Macarulla-Arenaza, A.; Borges-Hernandez, C.; Alonso-Vicario, A. Feasibility and simulation of a solar photovoltaic installation in DC for standalone services buildings. Dyna 2018, 93, 24–30. [Google Scholar] [CrossRef] [Green Version]
  18. Trzmiel, G.; Głuchy, D.; Kurz, D. The impact of shading on the exploitation of photovoltaic installations. Renew. Energy 2020, 153, 480–498. [Google Scholar] [CrossRef]
  19. Chen, X.; Wang, W.; Luo, D.; Zhu, C. Performance evaluation and optimization of a building-integrated photovoltaic/thermal solar water heating system for exterior shading: A case study in South China. Appl. Sci. 2019, 9, 5395. [Google Scholar] [CrossRef] [Green Version]
  20. Ahmed, O.K.; Hamada, K.; Salih, A. Thermal and Electrical Performance Analysis of PV/Trombe Wall System. In Proceedings of the International Engineering Conference, Erbil, Iraq, 23–25 June 2019. [Google Scholar] [CrossRef]
  21. Le Nguyen, L.D.; Ngoc, S.D.; Cong, D.T.; le Thuong, D.; Van, S.N.; Minh, V.N.H.; Le, N.T. Facade Integrated Photovoltaic Systems: Potential Applications for Commercial Building in Vietnam. In Proceedings of the International Conference on System Science and Engineering, Dong Hoi, Vietnam, 20–21 July 2019. [Google Scholar] [CrossRef]
  22. Yoshioka, K.; Takayama, T.; Saitoh, T.; Yatabe, S.; Ishikawa, N. Performance of light-weighted PV arrays installed on building walls in a snowy country in Japan. In Proceedings of the IEEE Photovoltaic Specialists Conference, Anchorage, AK, USA, 15–22 September 2000. [Google Scholar] [CrossRef]
  23. Yoshioka, K.; Hasegawa, J.; Saitoh, T.; Yatabe, S. Performance analysis of a PV array installed on building walls in a snowy country. In Proceedings of the IEEE Photovoltaic Specialists Conference, New Orleans, LA, USA, 19–24 May 2002. [Google Scholar] [CrossRef]
  24. Yang, H.X.; Marshall, R.H.; Brinkworth, B.J. Validated simulation for thermal regulation of photovoltaic wall structures. In Proceedings of the IEEE Photovoltaic Specialists Conference, Washington, DC, USA, 13–17 May 1996. [Google Scholar] [CrossRef]
  25. Dehra, H. A multi-parametric PV solar wall device. In Proceedings of the IEEE International Conference on Power, Control, Signals and Instrumentation Engineering, Chennai, India, 21–22 September 2017. [Google Scholar] [CrossRef]
  26. Dehra, H. Photovoltaic solar wall: 2-D numerical modeling and experimental testing under fan induced hybrid ventilation. In Proceedings of the International Conference on Energy Efficient Technologies for Sustainability, Nagercoil, India, 7–8 April 2016. [Google Scholar] [CrossRef]
  27. Irshad, K.; Habib, K. Nagarajan Thirumalaiswamy, Implementation of Photo Voltaic Trombe Wall system for developing non-air conditioned buildings. In Proceedings of the IEEE Conference on Sustainable Utilization and Development in Engineering and Technology, Selangor, Malaysia, 30 May–1 June 2013. [Google Scholar] [CrossRef]
  28. Peng, J.; Lin, L.; Yang, H. An experimental study of the thermal performance of a novel photovoltaic double-skin facade in Hong Kong. Sol. Energy 2013, 97, 293–304. [Google Scholar] [CrossRef]
  29. Peng, J.; Lu, L.; Yang, H.; Han, J. Investigation on the annual thermal performance of a photovoltaic wall mounted on a multi-layer façade. Appl. Energy 2013, 112, 646–656. [Google Scholar] [CrossRef]
  30. Yang, H.; Burnett, J.; Ji, J. Simple approach to cooling load component calculation through PV walls. Energy Build. 2000, 31, 285–290. [Google Scholar] [CrossRef]
  31. Ji, J.; Chow, T.; He, W. Dynamic performance of hybrid photovoltaic/thermal collector wall in Hong Kong. Build. Environ. 2003, 38, 1327–1334. [Google Scholar] [CrossRef]
  32. Wang, Y.; Tian, W.; Ren, J.; Ren, J.; Zhu, L.; Wang, Q. Influence of a building’s integrated-photovoltaics on heating and cooling loads. Appl. Energy 2006, 83, 989–1003. [Google Scholar] [CrossRef]
  33. Fung, T.Y.Y.; Yang, H. Study on thermal performance of semi-transparent building-integrated photovoltaic glazings. Energy Build. 2008, 40, 341–350. [Google Scholar] [CrossRef]
  34. Wong, P.W.; Shimoda, Y.; Nonaka, M.; Inoue, M.; Mizuno, M. Semi-transparent PV: Thermal performance, power generation, daylight modelling and energy saving potential in a residential application. Renew. Energy 2008, 33, 1024–1036. [Google Scholar] [CrossRef]
  35. Han, J.; Lu, L.; Yang, H. Numerical evaluation of the mixed convective heat transfer in a double-pane window integrated with see-through a-Si PV cells with low-e coatings. Appl. Energy 2010, 87, 3431–3437. [Google Scholar] [CrossRef]
  36. National Fund for Environmental Protection and Water Management, Guidelines for Developing the Scope and Principles of Performing an Energy Audit for the Priority Program “Improving Energy Efficiency Part 4, Energy-Saving Investments in Small and Medium-Sized Enterprises”. (In Polish). Available online: http://www.nfosigw.gov.pl/gfx/nfosigw/userfiles/files/srodki_krajowe/programy_2014/inwestycje-energooszczedne/nabor_kandydatow/wytyczne_dla_opracowania_zakresu_i_zasad_wykonania_audytu_energetycznego_dla_programu_nf.pdf (accessed on 15 March 2019).
  37. Desai, S. Chapter 1: Global and Indian energy scenario, Chapter 2: Types of energy audits and energy-audit methodology. In Handbook of Energy Audit; McGraw Hill (India) Private Limited: New Delhi, India, 2015. [Google Scholar]
  38. Górzyński, J. Energy Efficiency in Business Operations; Wydawnictwo Naukowe PWN: Warszawa, Poland, 2017. (In Polish) [Google Scholar]
  39. Kołodziej, R. The implications of the act on energy efficiency for power plants and industry. Elektroenergetyka 2012, 11–12, 119–127. (In Polish) [Google Scholar]
  40. Sandip, B. Energy Performance Important and Energy Cost Reductions at Baltic Place Commercial Office Complex. Int. J. Sci. Res. Publ. 2018, 8, 69–76. [Google Scholar] [CrossRef]
  41. Wnukowska, B. Energy Management in Industry; Wydawnictwo Naukowo-Techniczne: Warszawa, Poland, 2016. (In Polish) [Google Scholar]
  42. Osicki, A. Energy Audit-the Basis of an Effective Project. Practical Experience; Fundacja na rzecz Efektywnego Wykorzystania Energii: Katowice, Poland, 2009. (In Polish) [Google Scholar]
  43. Szczotka, K. Energy Audit-the Key to Optimal Thermo-Modernization of Buildings. Sources of Financing for Thermo-Modernization and Eco-Energy Projects; Akademia Górnicz-Hutnicza: Kraków, Poland, 2019. (In Polish) [Google Scholar]
  44. Center for Energy Market Information. (In Polish). Available online: https://www.cire.pl/item,154635,13,0,0,0,0,0,audyt-energetyczny-a-audyt-efektywnosci-energetycznej---doswiadczenia-udt.html (accessed on 13 March 2019).
  45. Legal Source, Act of 20 May 2016 on Energy Efficiency. (In Polish). Available online: http://prawo.sejm.gov.pl/isap.nsf/download.xsp/WDU20160000831/T/D20160831L.pdf (accessed on 13 March 2019).
  46. Vivek, J.; Rushikesh, J.; Pramod, M.; Sandip, K.; Bagwan, S.U. Energy conservation through energy audit. In Proceedings of the International Conference on Trends in Electronics and Informatics ICEI, Tirunelveli, India, 11–12 May 2017; pp. 481–485. [Google Scholar]
  47. Sun, X.; Gou, Z.; Lu, Y.; Tao, Y. Strengths and weaknesses of existing building green retrofits: Case study of a LEED EBOM gold project. Energies 2018, 11, 1936. [Google Scholar] [CrossRef] [Green Version]
  48. Aranda, J.; Zabalza, I.; Llera-Sastresa, E.; Scarpellini, S.; Alcalde, A. Building energy assessment and computer simulation applied to social housing in Spain. Buildings 2018, 8, 11. [Google Scholar] [CrossRef] [Green Version]
  49. Lee, W.; Kenarangui, R. Energy management for motors, systems, and electrical equipment. IEEE Trans. Ind. Appl. 2002, 38, 602–607. [Google Scholar]
  50. Nissanga, N.; Rasanajan, M.; Nisal, P. Energy audit: A case study. In Proceedings of the International Conference on Information and Automation, Shandong, China, 15–17 December 2006; pp. 45–50. [Google Scholar] [CrossRef]
  51. Kumar, A.; Murugesan, K.; Sharma, M.P.; Maheshwari, R.P.; Singh, S.N. Energy Audit of IIT-Roorkee Campus; Indian University of Technology: Roorkee, Uttarakhand, January 2010. [Google Scholar]
  52. Chakraborty, A.; Dey, D.; Das, P. Investigation of energy consumption and reservation scheme using energy auditing techniques. In Proceedings of the International Conference on Smart Systems and Inventive Technology, Tirunelveli, India, 13–14 December 2018; IEEE Xplore Part Number: CFP18P17-ART. ISBN 978-1-5386-5873-4. [Google Scholar]
  53. Rohit, S.; Jain, R.K. Energy audit of residential buildings to gain energy efficiency credits for LEED certification. In Proceedings of the International Conference on Energy Systems and Applications, Institute of Engineering and Technology, Pune, India, 30 October–1 November 2015. [Google Scholar]
  54. Mazzola, E.; Dalla Mora, T.; Peron, F.; Romagnoni, P. An integrated energy and environmental audit process for historic buildings. Energies 2019, 12, 3940. [Google Scholar] [CrossRef] [Green Version]
  55. Salvadori, G.; Fantozzi, F.; Rocca, M.; Leccese, F. The Energy Audit Activity Focused on the Lighting Systems in Historical Buildings. Energies 2016, 9, 998. [Google Scholar] [CrossRef] [Green Version]
  56. Nocera, F.; Giuffrida, S.; Trovato, M.R.; Gagliano, A. Energy and new economic approach for nearly zero energy hotels. Entropy 2019, 21, 639. [Google Scholar] [CrossRef] [Green Version]
  57. Baskar, R.H.; Mittal, H.; Narkhede, M.S.; Chatterji, S. Energy audit—A case study. Int. J. Emerg. Technol. Adv. Eng. 2014, 73–78. Available online: https://ijetae.com/files/ICADET14/IJETAE_ICADET_14_12.pdf (accessed on 21 March 2020).
  58. Simelane, S.N.; Isaac, N.; Duma, T.C.; Chowdhury, S.P.D. Energy efficiency audits—A strive for energy autonomy. In Proceedings of the IEEE Conference on Power Engineering Society Conference and Exposition in Africa—PowerAfrica, Cape Town, South Africa, 28–29 June 2018; pp. 509–514. [Google Scholar]
  59. Mrówczyńska, M.; Skiba, M.; Bazan-Krzywoszańnska, A.; Bazuń, D.; Kwiatkowski, M. Social and infrastructural conditioning of lowering energy costs and improving the energy efficiency of buildings in the context of the local energy policy. Energies 2018, 11, 2302. [Google Scholar] [CrossRef] [Green Version]
  60. Haraldsson, J.; Johansson, M.T. Barriers to and drivers for improved energy efficiency in the Swedish aluminium industry and aluminium casting foundries. Sustainability 2019, 11, 2043. [Google Scholar] [CrossRef] [Green Version]
  61. Coimbra, J.; Almeida, M. Achieving cost benefits in sustainable cooperative housing. Buildings 2013, 3, 1–17. [Google Scholar] [CrossRef] [Green Version]
  62. Solgi, E.; Hamedani, Z.; Sherafat, S.; Fernando, R.; Aram, F. The viability of energy auditing in countries with low energy cost: A case study of a residential building in cold climates. Designs 2019, 3, 42. [Google Scholar] [CrossRef] [Green Version]
  63. Datasheet of PV Panel. Available online: http://www.emiter.net.pl/sites/default/files/jam60_s01_285-305_5bb_pr_1000v-pl.pdf (accessed on 21 October 2019).
  64. Confidential Work, Energy Audit Carried Out for the Analyzed Food Industry Plant. 20 October 2019.
  65. Głuchy, D.; Kurz, D.; Trzmiel, G. Studying the impast of orientation and roof pitch on the operation of photovoltaic roof tiles. Przegląd Elektrotechniczny 2013, 6, 281–283. [Google Scholar]
  66. Photovoltaic Geographical Information System. Available online: https://re.jrc.ec.europa.eu/pvg_tools/en/tools.html (accessed on 11 October 2019).
  67. PN-EN 12524: 2008 Standard, Calculated Value of Thermal Conductivity Coefficient; Polish Committee for Standardization: Warsaw, Poland, 2003. (In Polish)
  68. Kurtz, K.; Gawin, D. Energy Certification of Residential Buildings with Examples; Wrocławskie Wydawnictwo Naukowe Atla 2: Wrocław, Poland, 2009. (In Polish) [Google Scholar]
  69. Kurz, D.; Nawrowski, R. Thermal time constant of PV roof tiles working under different conditions. Appl. Sci. 2019, 9, 1626. [Google Scholar] [CrossRef] [Green Version]
  70. PN-EN ISO 6946 Standard, Building Components and Building Elements. Thermal Resistance and Heat Transfer Coefficient. Calculation Method; Polish Committee for Standardization: Warsaw, Poland, 2008.
  71. Kurz, D.; Nawrowski, R. The Analysis of the Impact of the Thermal Resistance of the Roof on the Performance of Photovoltaic Roof Tiles. Available online: https://www.e3s-conferences.org/articles/e3sconf/pdf/2017/07/e3sconf_eems2017_01039.pdf (accessed on 30 June 2019).
  72. Legal Source, Notice of the Minister of Infrastructure and Development of 17 July 2015 on the Publication of a Uniform Text of the Regulation of the Minister of Infrastructure on the Technical Conditions to Be Met by Buildings and Their Location. (In Polish). Available online: http://prawo.sejm.gov.pl/isap.nsf/download.xsp/WDU20150001422/O/D20151422.pdf (accessed on 30 June 2019).
  73. Central Statistical Office in Poznan, Geographical Information about the City. (In Polish). Available online: https://poznan.stat.gov.pl/files/gfx/poznan/pl/defaultstronaopisowa/1082/3/1/poznan_2017_dzial01.pdf (accessed on 30 June 2019).
Figure 1. A cross-section of the external wall of the building in the plant in the present state (layers 1–6 described in text).
Energies 13 02549 g001
Figure 2. A fragment of the cross-section of the external wall of a building with a PV installation (layers 1–8 described in text).
Energies 13 02549 g002
Figure 3. Flux of heat penetrating the building wall in both variants (Variant No. 1 is without BIPV; Variant No. 2 is with BIPV).
Energies 13 02549 g003
Table 1. Production of electricity from the planned PV installation located on the wall of the production hall.
MonthElectricity Production
(kWh)
January3470
February5740
March8380
April8360
May7100
June6210
July6510
August7510
September7640
October6530
November3660
December3130
TOTAL74,200
Table 2. Parameter values for subsequent partitions in the external wall of the building [67].
No.The Name of the Partitiond (m)λ (W/mK)R (m2K/W)
1High density polyethylene coating0.00020.500.000400
2Steel plate0.000650.000.000012
3Sandwich panel PAROC 50F2000.20200.220.918200
4Sandwich panel PAROC 50F1000.09900.420.235700
5Steel plate0.000650.000.000012
6Polyvinyl chloride coating (PVC)0.00020.170.001200
Table 3. Thermal resistance values for heat transfer on external and internal walls [67].
Direction of Heat FlowRsi (m2K/W)Rse (m2K/W)
Vertical up0.100.04
Horizontal0.130.04
Vertical down0.170.04
Table 4. Parameter values for new material layers after modernization [69,71].
Symbol of the PartitionName of Partitiond (m)λ (W/mK)R (m2K/W)
7Air gap0.070.3890.18
8ABottom of KPE panel0.000270.20.00135
BEVA film0.00050.340.00147
CCell layer0.0002251480.0000015
DEVA film0.00050.340.00147
EGlass layer0.0041.80.0022
Table 5. Comparison of temperatures and thermal fluxes penetrating the partition [73].
MonthAir Temperature T (°C)Temperature Difference ΔT (°C)Thermal Flux Density q (W/m2)Total Heat Flux Q ˙ (W)
Variant No. 1Variant No. 2Variant No. 1Variant No. 2
January−1.619.614.7912.967542.906611.06
February3.714.310.799.465502.094823.38
March4.014.010.569.265386.664722.19
April9.09.06.795.953462.853035.69
May15.92.11.581.39808.00708.33
June18.90.90.680.60346.29303.57
July19.51.51.130.99577.14505.95
August18.20.20.150.1376.9567.46
September17.10.90.680.60346.29303.57
October8.39.77.326.423732.193271.80
November3.114.911.249.855732.955025.76
December1.716.312.3010.786271.615497.97
Total39,784.3434,876.72
Table 6. Comparison of total costs resulting from the exploitation of electricity and natural gas in the existing state and after the assembly of PV panels.
Year of OperationRunning Costs in the Current State (EUR Million)Financial Savings as a Result of Electricity Generation (EUR)Financial Savings Due to Reduced Consumption of Natural Gas (EUR)Total Financial Savings (EUR)Operating Costs after Modernization (EUR Thousand)Difference in Costs (EUR)
00.00000059,910
13.8443650121729863900−59,910
27.7267314244678797778−56,924
311.64810,956368712,76211,694−52,031
415.60814,576494117,63615,650−47,148
519.60818,174620722,50119,645−42,274
623.64821,751748627,35623,680−37,409
727.72925,306877832,20327,756−32,554
831.85028,84010,08237,04231,872−27,707
936.01232,35311,40041,87236,030−22,868
1040.21635,84512,73146,69540,229−18,038
1144.46239,31614,07551,51044,470−13,215
1248.75142,76615,43356,31748,754−8400
1353.08346,19516,80461,11853,081−3593
1457.45749,60318,18965,91157,4511208
1561.87652,99219,58770,69861,8656001
1666.33956,36021,00075,47966,32210,788
1770.84659,70722,42780,25470,82515,569
1875.39863,03523,86885,02275,37320,344
1979.99666,34325,32389,78579,96625,112
2084.64069,63026,79494,54384,60529,875
2189.33172,77928,27899,17689,29134,633
2294.06875,93229,778103,82994,02339,266
2398.85378,80531,293108,21798,80443,919
24103.68581,74832,822112,689103,63248,307
25108.56684,81134,367117,298108,50852,779

