Article

Comparative Analysis of Ground-Mounted vs. Rooftop Photovoltaic Systems Optimized for Interrow Distance between Parallel Arrays

1
Department of Electrical Engineering, College of Engineering, Majmaah University, Majmaah 11952, Saudi Arabia
2
Department of Electrical and Computer Engineering, Shaqra University, Riyadh 11911, Saudi Arabia
3
Department of Electrical Engineering, Government College University Faisalabad (GCUF), Faisalabad 38000, Pakistan
4
Department of Electrical Engineering, Islamic University of Madinah, Madinah 41411, Saudi Arabia
5
Department of Electrical Engineering, The University of Lahore, Lahore 54000, Pakistan
*
Authors to whom correspondence should be addressed.
Energies 2020, 13(14), 3639; https://doi.org/10.3390/en13143639
Submission received: 20 May 2020 / Revised: 3 July 2020 / Accepted: 9 July 2020 / Published: 15 July 2020

Abstract

:
The aim of this research is to perform an in-depth performance comparison of ground-mounted and rooftop photovoltaic (PV) systems. The PV modules are tilted to receive maximum solar irradiance. The efficiency of the PV system decreases due to the mutual shading impact of parallel tilted PV modules. The mutual shading decreases with the increasing interrow distance of parallel PV modules, but a distance that is too large causes an increase in land cost in the case of ground-mounted configuration and a decrease in roof surface shading in the case of rooftop configuration, because larger sections of roof are exposed to sun radiation. Therefore, an optimized interrow distance for the two PV configurations is determined with the aim being to minimize the levelized cost of energy (LCoE) and maximize the energy yield. The model of the building is simulated in EnergyPlus software to determine the cooling load requirement and roof surface temperatures under different shading scenarios. The layout of the rooftop PV system is designed in Helioscope software. A detailed comparison of the two systems is carried out based on energy output, performance ratio, capacity utilization factor (CUF), energy yield, and LCoE. Compared to ground-mounted configuration, the rooftop PV configuration results in a 2.9% increase in CUF, and up to a 23.7% decrease in LCoE. The results of this research show that installing a PV system on a roof has many distinct advantages over ground-mounted PV systems such as the shading of the roof, which leads to the curtailment of the cooling energy requirements of the buildings in hot regions and land cost savings, especially for urban environments.

1. Introduction

The photovoltaic (PV) technology directly converts sunlight into electrical energy [1]. As fossil fuels are not consumed and no greenhouse gas (GHG) is emitted during the operation of PV, this solar power technology is environmentally friendly [2,3,4,5]. The cost of PV modules has dropped at a significant rate in recent decades [6]. An 80% drop in cost has been observed in the past decade [7]. The cost of PV modules was 100 USD/W in the 1970s, which has since dropped to around 0.3 USD/W [8]. This remarkable drop in cost, along with the environmental issues linked to fossil fuels, are the major driving factors towards the steady growth of this technology. The cumulative global installed capacity of PV has increased from almost zero GW in 1990 to 505 GW in 2018 [9] and a 102.4 GW growth in PV installation has been observed worldwide in 2018 alone [10]. Compared to the concentrated solar power technologies, PV technology can produce electricity even in areas with moderate solar radiation levels. Therefore, this technology can be adopted on a small scale at a residential or commercial level and the concept of solar cities have gained the attention of many researchers [11,12,13].
The amount of energy consumed by buildings, both in cold and hot areas, is increasing day by day [14]. Buildings are contributing one third of the total energy consumption of the word and 20% of the global GHG emissions are contributed by the high energy consumption of buildings [15]. Office buildings have an even bigger share in this high energy consumption and they consume 17% of all global energy [
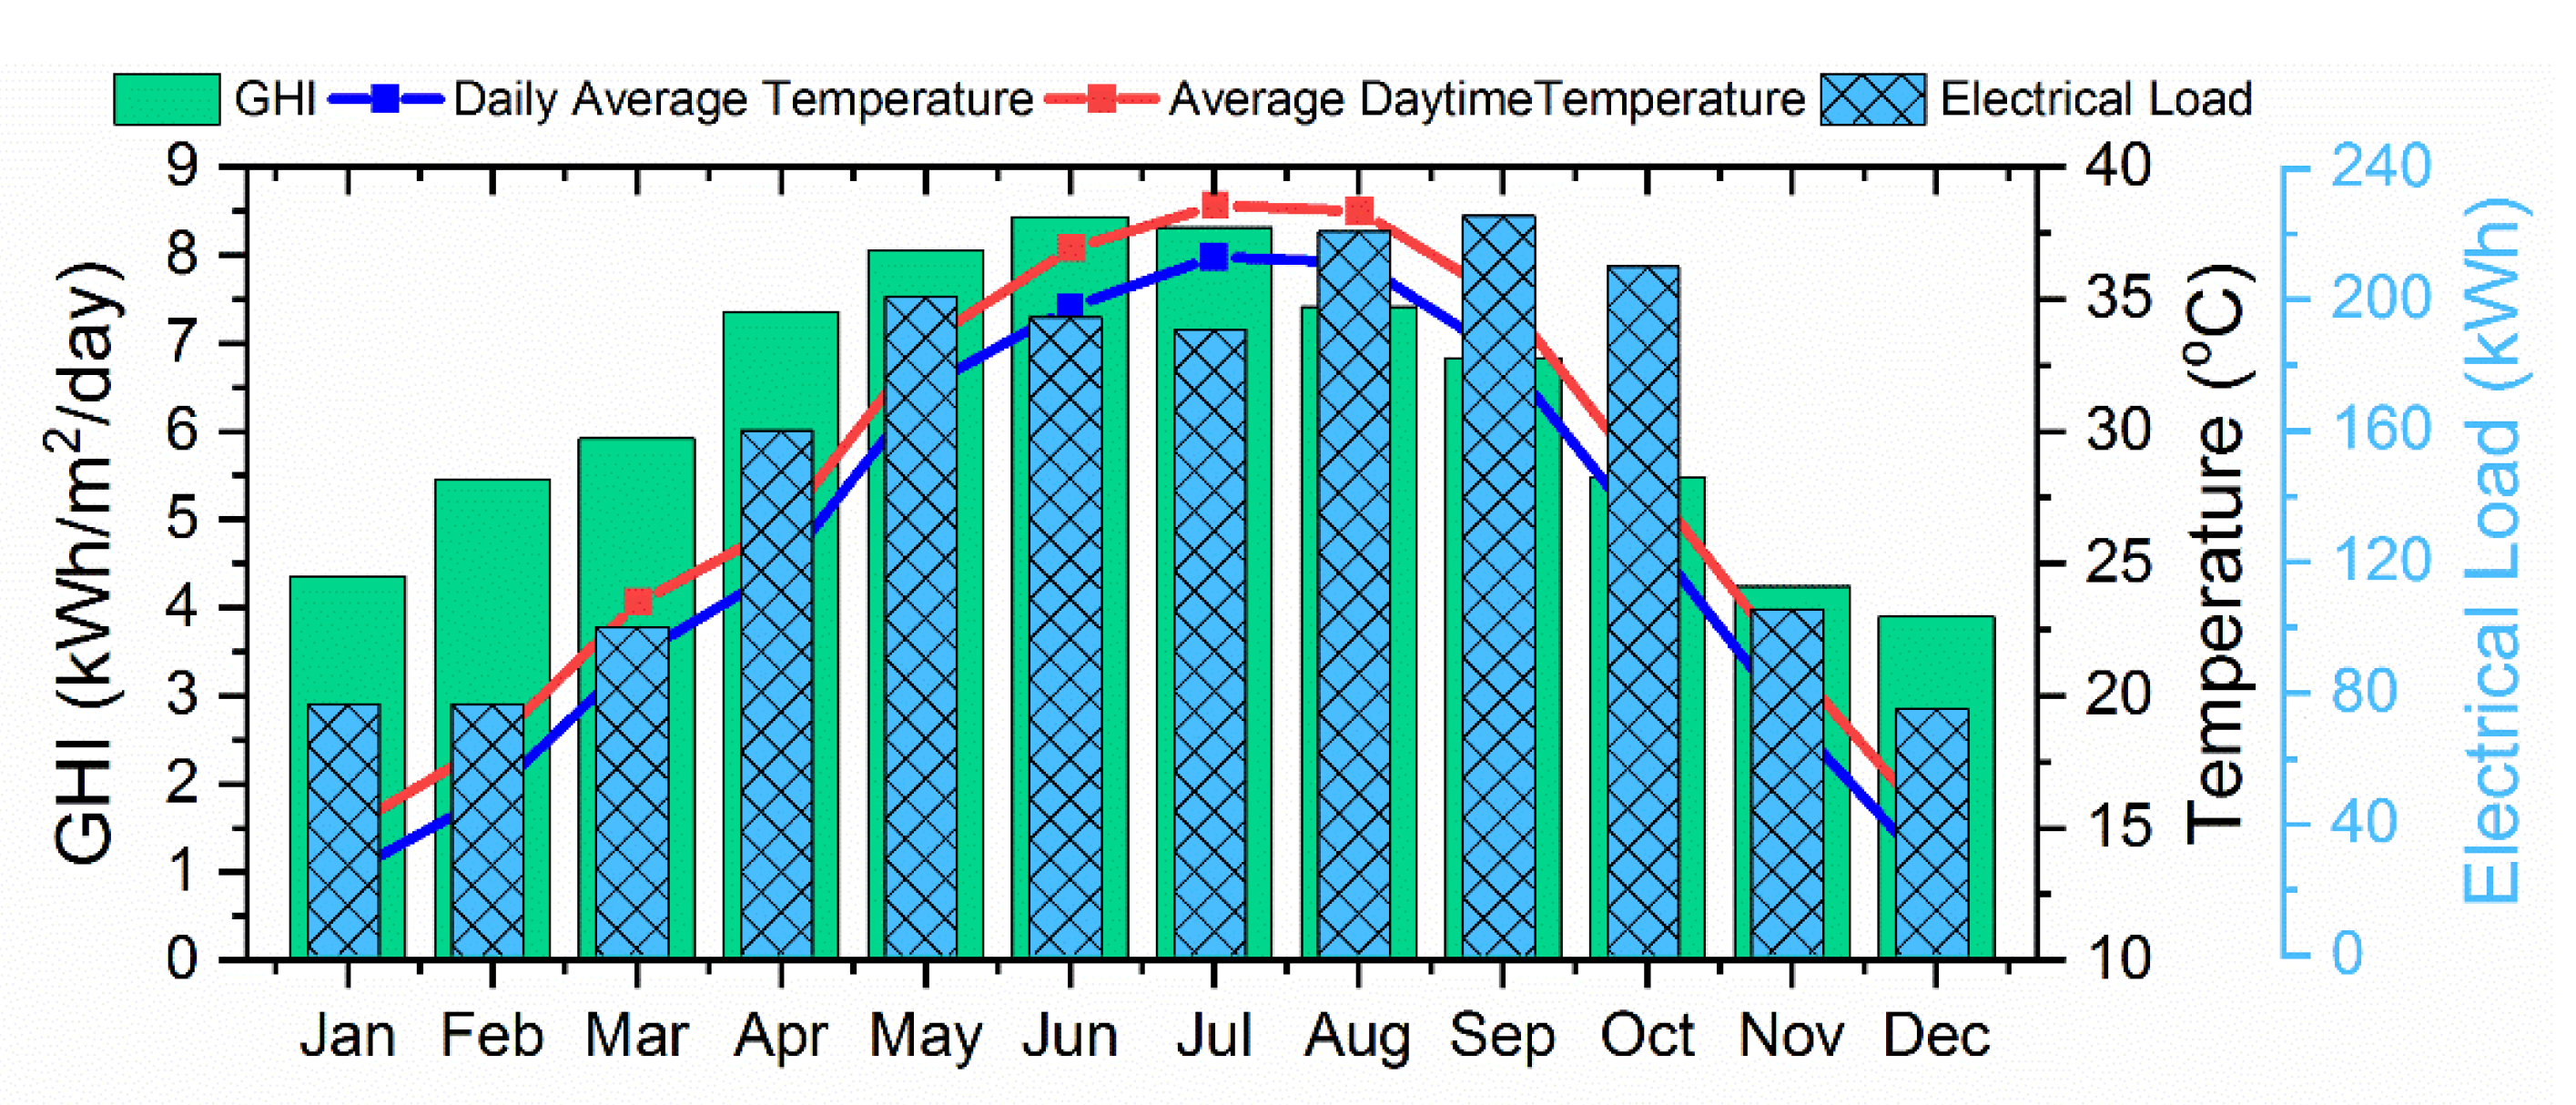
16]. The consumption of electrical energy in Gulf countries, especially in Saudi Arabia, is very high during the summer solstice [17]. The peak load demand of Saudi Arabia during the summer solstice reaches twice the peak demand during the winter solstice [18]. This high load in summer season is due to the cooling energy required for residential and commercial buildings. Global warming will further augment the load in coming years [19]. Buildings are responsible for 80% of the share of the total electricity consumption in Saudi Arabia [20,21], while this share is only 40% in European countries [22]. PV installations could be a very useful option to supply this high energy demand in Gulf countries in the summer season, especially for office buildings, because the energy production pattern of PV systems in this region matches the load profile of office buildings, due to the fact that the main load of office buildings is high during the daytime.
The PV modules can be installed on the ground, on the rooftop or integrated in the windows and facades of the buildings. The availability of land is an important factor to be considered for the installation of a ground-mounted PV system [23], and this is a major constraint in urban areas. A lot of research is available on ground-mounted PV configuration. The authors in [24] carried out a techno-economic performance analysis of a 1-MW ground-mounted PV plant located in Oman. The proposed plant has an energy yield of 1875 and a capacity utilization factor (CUF) of 21.7%. A size analysis of a PV-battery system for residential applications was performed in [25]. The authors considered different sizes of battery storage and PV systems in the sensitivity analysis to find the best system configuration. In [26], the authors assessed the techno-economic performance of a 1-kW PV system for a residential building in Indonesia.
The authors in [27] analyzed the environmental and technical economic feasibility of 10-MW PV systems at 44 sites in Saudi Arabia. They concluded that Bisha is the best site at which to install a PV system in Saudi Arabia. Another study [28] analyzed the performance of a 85-MW PV system in the western part of Saudi Arabia. The authors in [29] performed a detailed techno-economic performance evaluation of a 1-MW grid-connected PV system in the Qassim region of Saudi Arabia. The researchers in [30] investigated the environmental and economic feasibility of a ground-mounted PV system at 29 locations in Egypt. Wahat Kharga was the best site based on economic profit and GHG emissions. The existing studies on ground-mounted PV systems in solar-rich countries of the Middle East region do not focus on the impact of the mutual shading of the PV panels, which depends on the interrow distance of parallel PV panel rows.
The heat gain of the buildings from facades and windows can be curtailed by integrating PV into shading devices, which have the dual benefit of energy production and shading. However, one of the major problems is PV efficiency in such shading devices because they are normally vertical and therefore suitable orientation and tilt angles are mostly not available [31]. Thus, they do not face the sun for a long enough period of time and, as a result, PV does not work at full efficiency. Roofs are another main source of heat capturing, because they directly face the sun. Therefore, installing the PV system on rooftops could help to curtail the heat energy transfer inside the building due to their partial shading benefit, as solar radiation does not directly hit the roof. Therefore, the roofs of buildings are the most appropriate place for PV installation in urban environments [32]. In hot countries like Saudi Arabia, PV can be a very attractive rooftop shading device, especially for office buildings because these buildings normally consume energy during the daytime, which is the operating time of a PV system as well [33]. The authors in [34] tested the performance of thirteen different PV-integrated shading devices for small offices at two locations in Greece and categorized them by the amount of energy generated. Assouline et al. [35] estimated the electricity production capacity of a large-scale rooftop PV installation in Switzerland by using Random Forests. The authors proposed a method to calculate the available area of roofs for placing PV modules and also estimated the shading losses caused by nearby trees and buildings, without estimating the losses caused by the mutual shading of tilted PV modules. Shukla et al. [36] designed a standalone 110-kW PV system installed on the roof of a hostel building in India. They performed a detailed techno-economic analysis of the proposed PV system, but they did not consider the roof surface shading benefit of the PVs and the mutual shading of tilted PV parallel arrays was also not considered in their analysis. Kumar et al. [37] analyzed a roof-integrated 200-kW PV system by PVsyst software to determine the losses and amount of energy generated. They analyzed the system efficiency, performance ratio and CUF. Yadav and Bajpai [38] evaluated the performance of a 5-kW rooftop PV system in Northern India. The authors analyzed the PV system for its daily average energy output, energy yield, CUF, and array efficiency, but the authors did not consider the roof surface shading advantage of the rooftop PVs. The authors in [39] designed a PV- and wind-based net zero-energy building in which PV panels were placed on the rooftop as shading devices. They concluded that the cooling load demand of a building decreases by installing PV panels on the rooftop. The research study in [40] evaluated shading effect of rooftop PV on an office building in hot and dry climate. Another study [41] evaluated the performance of a rooftop PV system for a faculty building at Marmara University, Turkey. The proposed rooftop PV system had an average performance ratio of 72.9%. Another simulation study in [42] tested the performance of a 6.4-kW rooftop PV system in India. The authors in this study did not consider the impact of the mutual shading of PV panels on the PV system’s performance and the rooftop shading benefit in relation to the cooling load was not considered either. The authors in [43] evaluated the techno-economic performance of a 12.25-kW rooftop PV system for a residential building located in Jeddah, Saudi Arabia. The proposed PV system had a capacity factor of 22%, a yield factor of 1927 kWh/kW, a performance ratio of 78% and a levelized cost of energy (LCoE) of 3.82 ¢/kWh. Although the authors evaluated the rooftop PV system based on many performance parameters, they did not take into account the rooftop shading due to PV panels in their analysis.
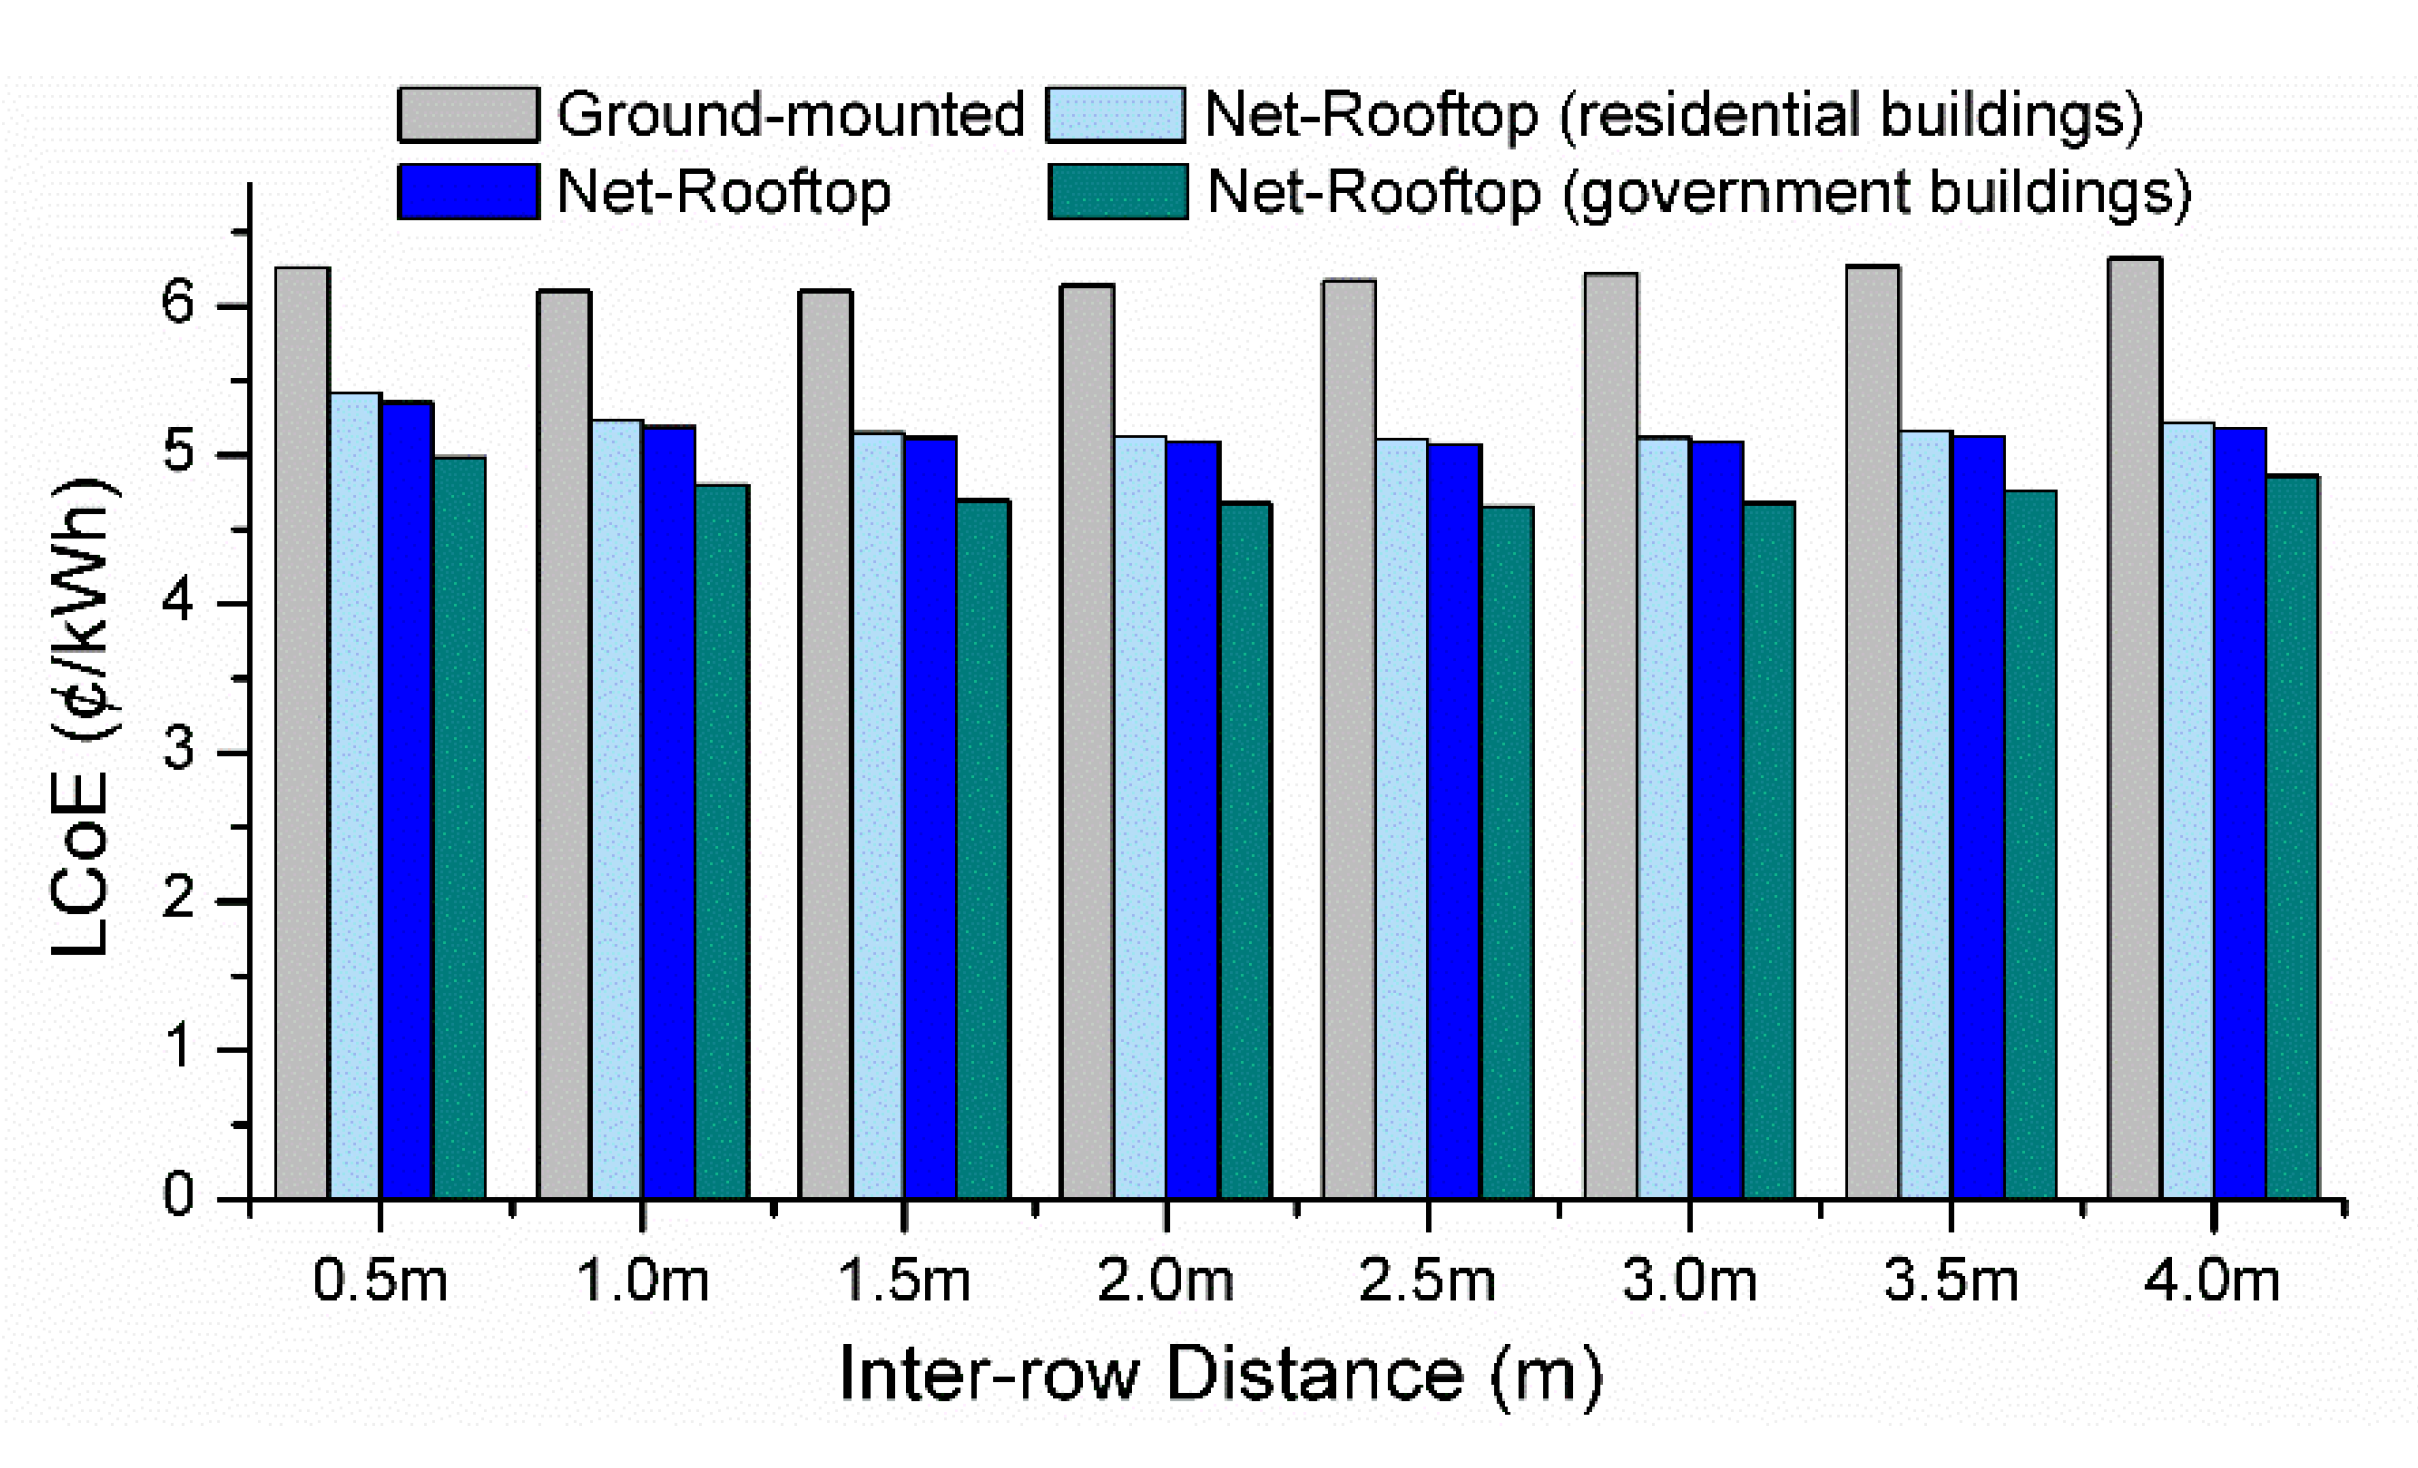
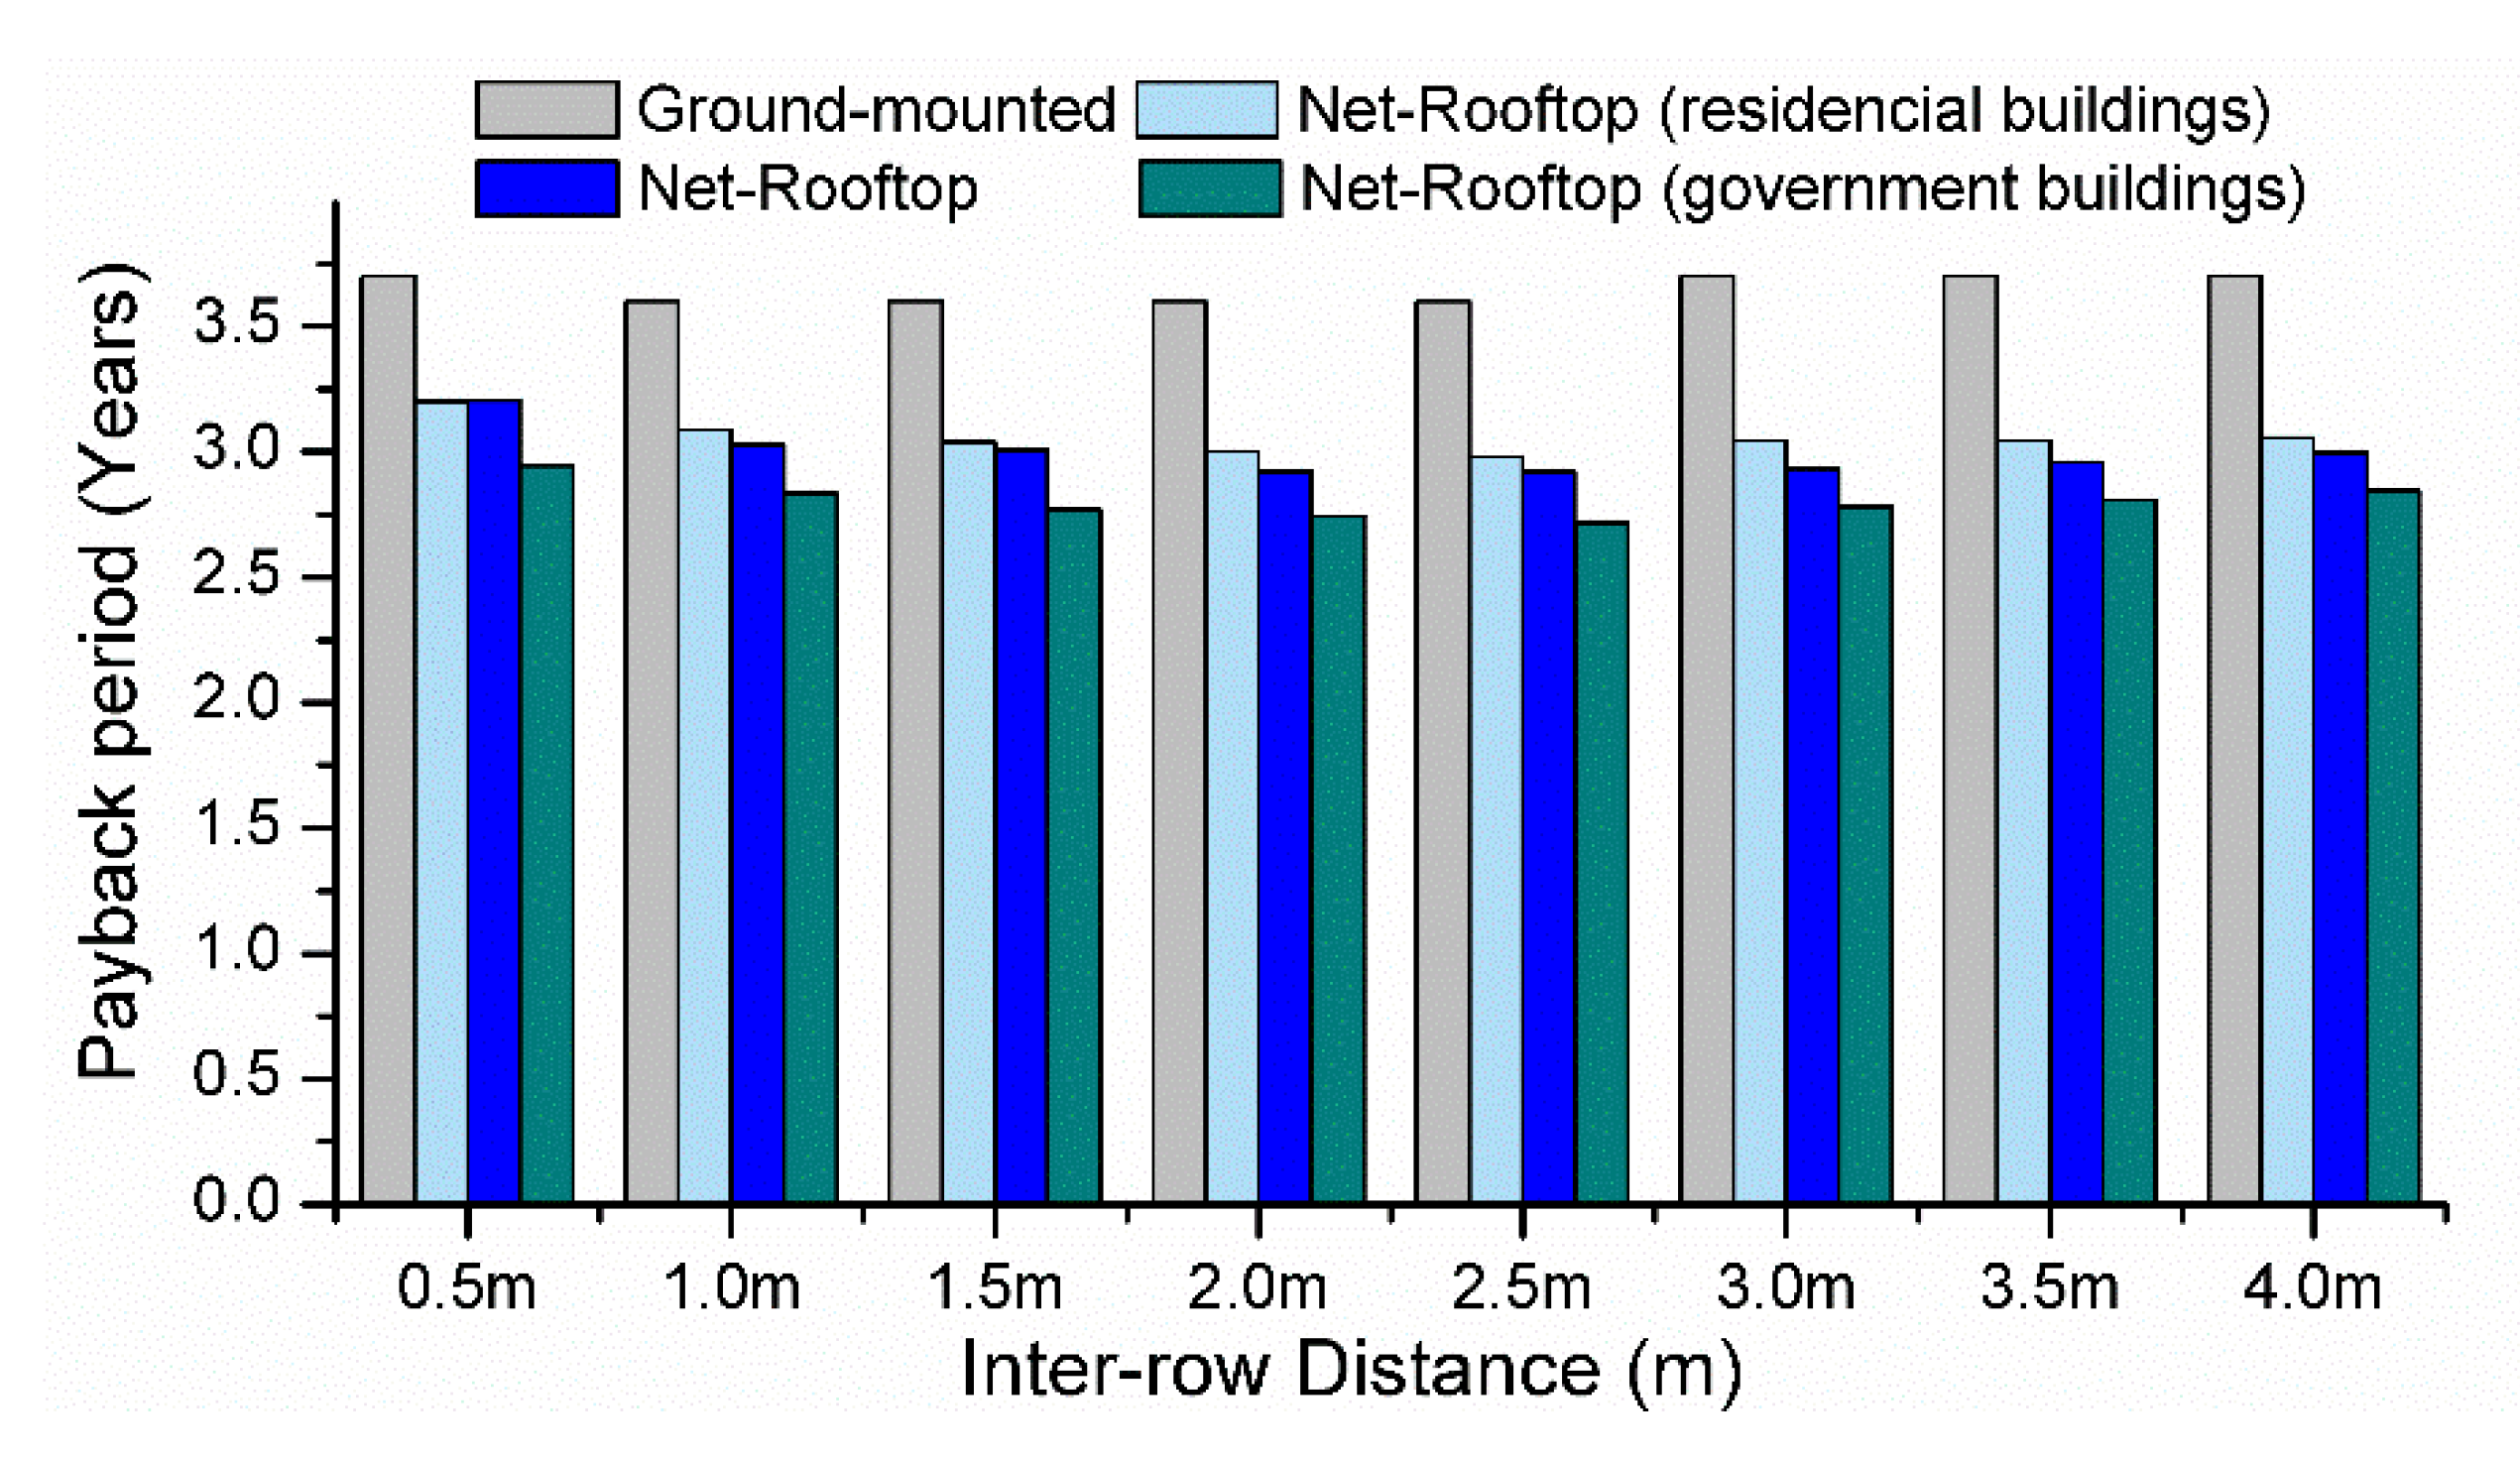
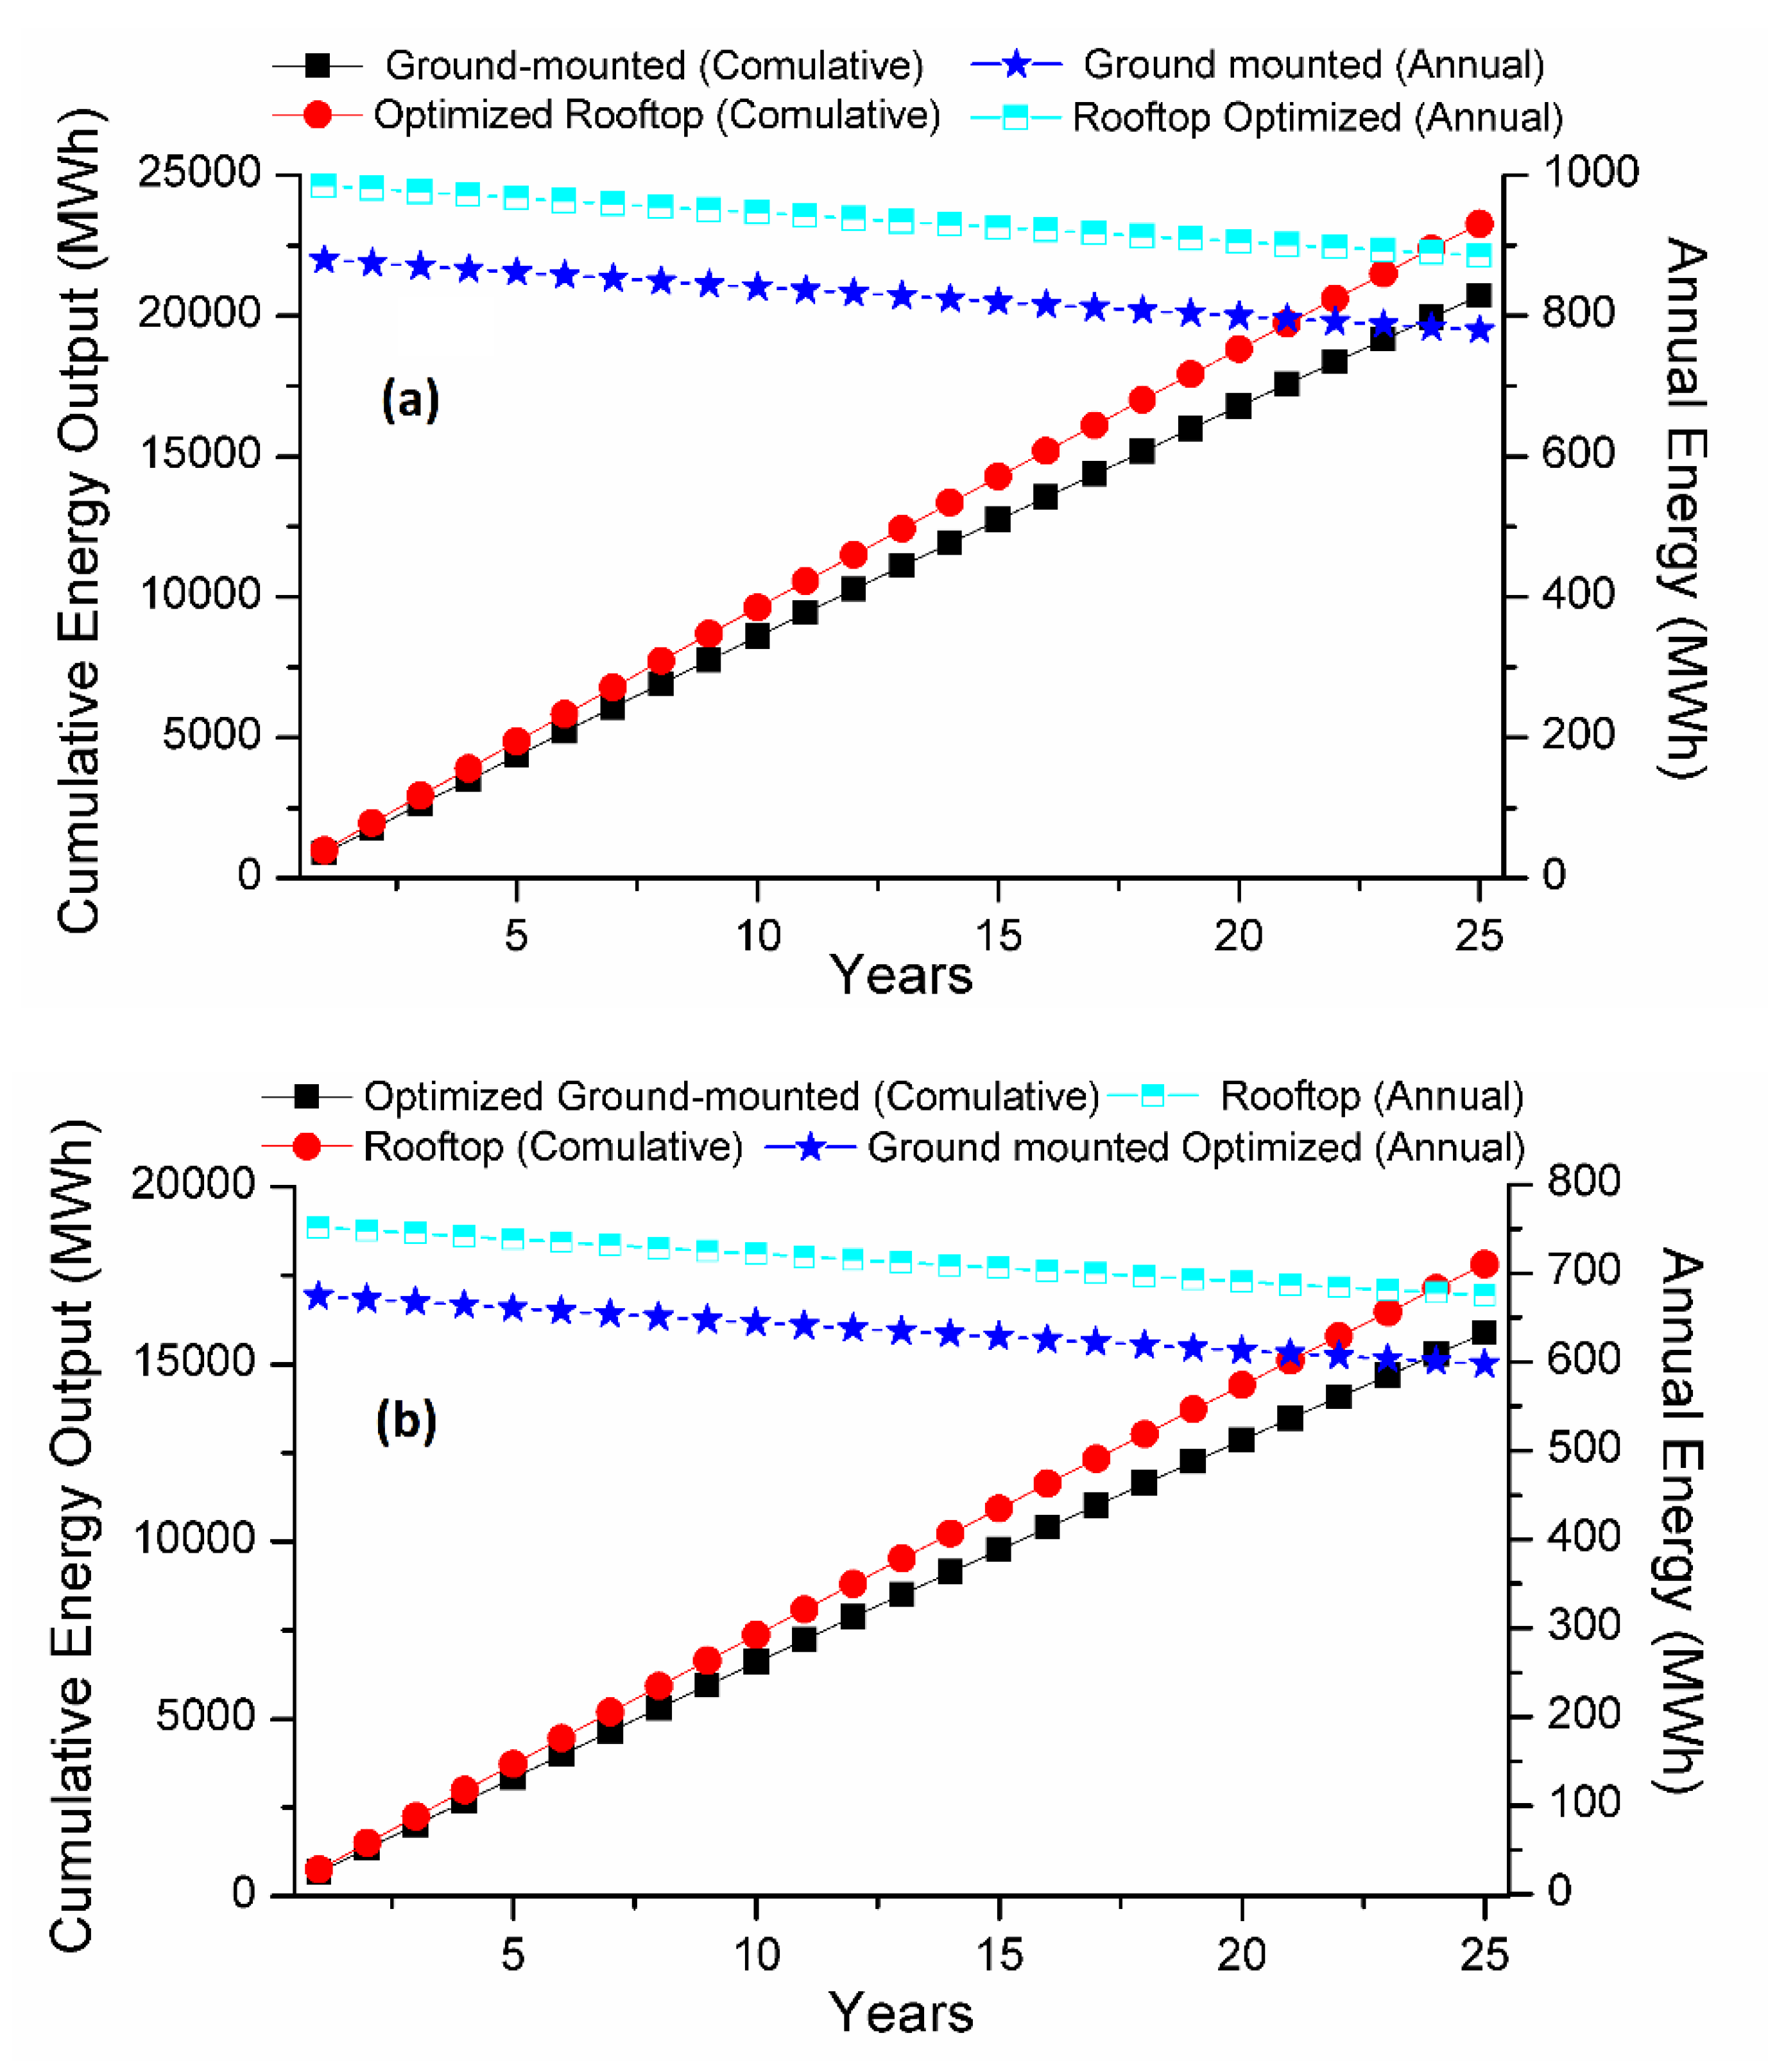
The ground-mounted PV system is easy to access and has lower maintenance costs, but in urban areas the availability and cost of land is a major issue for ground-mounted PV systems. Contrarily, the rooftop PV system does not involve land cost and it also blocks the direct contact of solar radiation with the outer surface of the roof. The high temperatures in hot climate areas (such as the Middle East and North Africa) cause the heating of buildings’ roofs due to sun rays directly hitting the roof surface. If the PV panels are installed on the roofs of buildings in such hot areas, then their roof shading advantage will help to lessen the cooling energy requirement of such buildings. Therefore, it would be very interesting to evaluate and compare the performance of rooftop and ground-mounted PV systems in such regions with hot climates. The existing literature on the PV system’s performance analysis is mainly focused on determining the feasibility of a PV system at a particular place. The researchers have focused on techno-economic feasibility of either ground-mounted or rooftop PV systems individually. Most of the existing techno-economic feasibility studies analyze rooftop PV systems in the same way as ground-mounted PV systems, without simultaneously considering the mutual shading of parallel arrays and the shading benefits of the rooftop PV. It is very important to consider the mutual shading of parallel PV arrays and rooftop shading simultaneously while optimizing the interrow distance of parallel arrays. The existing literature does not provide a detailed comparison of the rooftop and ground-mounted PV systems while considering these two factors at the same time. The aim of this paper is to find an optimized configuration of rooftop and ground-mounted PV systems for interrow distances between the parallel PV arrays and to compare the two systems based on their techno-economic performance. This paper compares the two optimized configurations based on LCoE, Net LCoE, energy output, energy yield, performance ratio and CUF. This research provides a very good insight into these two configurations for policymakers to promote the growth of PV technology on commercial and residential buildings.

2. Solar Resource and Electrical Load

The building of the College of Engineering at Majmaah University (CEMU) is taken as a case study to install the rooftop and ground-mounted PV systems. This building is situated at 25.89° N and 45.35° E in Majmaah, Saudi Arabia. The solar resource data were collected from a solar resource monitoring station in the King Abdullah City of Atomic and Renewable Energy (KACARE), located in Majmaah University. It is a tier two station with a ±50% baseline uncertainty [18]. The climate of Saudi Arabia is very hot and therefore heavy air conditioning is required in the summer season, which results in a very high electrical load during this season. The peak load of Saudi Arabia happens during the summer solstice in the daytime, because of the high cooling load. Therefore, PV installation could be very effective in meeting the high electrical load in the hot summer season. The PV system’s peak energy output matches the peak load demand of this region. The global horizontal irradiance (GHI), average air temperature and daytime temperature at the proposed location [18], as well as the load profile of the CEMU building, are shown in Figure 1. The maximum GHI (8.44 kWh/m2/day) is observed in June and the minimum (3.9 kWh/m2/day) is recorded in December, while the daily average of the whole year is 6.04 kWh/m2/day. The electrical load is high during the summer months because of the high air conditioning load for maintaining a comfortable temperature in the building. It is shown in Figure 1 that the load profile of the CEMU building matches the GHI profile.

3. Design of PV System

The PV modules are connected in a series to form strings, which are arranged in parallel rows. In order to conduct an impartial comparison between ground-mounted and rooftop PV systems, both the systems are designed for the same nameplate capacity. For this purpose, first the capacity of rooftop PV is calculated for the available rooftop surface area and for a particular interrow distance and then the same sized system is analyzed for the ground-mounted configuration. The solar irradiance intensity on the PV panels can be augmented if the panels are facing the sun. The sun changes its path around the horizon. The path is low during winter and high during the summer season. A monthly adjustment approach to the tilt angles of the PV arrays is used to overcome these seasonal variations in the sun path. The monthly tilt angles for the optimal performance of the PV panels at the proposed location are listed in Table 1. The Canadian Solar CS6X-350M-FG PV module is used in this analysis and its characteristics are shown in Table 2.
The power output of the PV module is dictated by the ambient temperature and the solar radiation striking the PV modules. The following relation expresses the PV power output [46,47]
P p v = A p v G T η p v
where A P V is the area of the PV modules, G T is the solar irradiance on the plane of PV arrays (POA), and η P V 
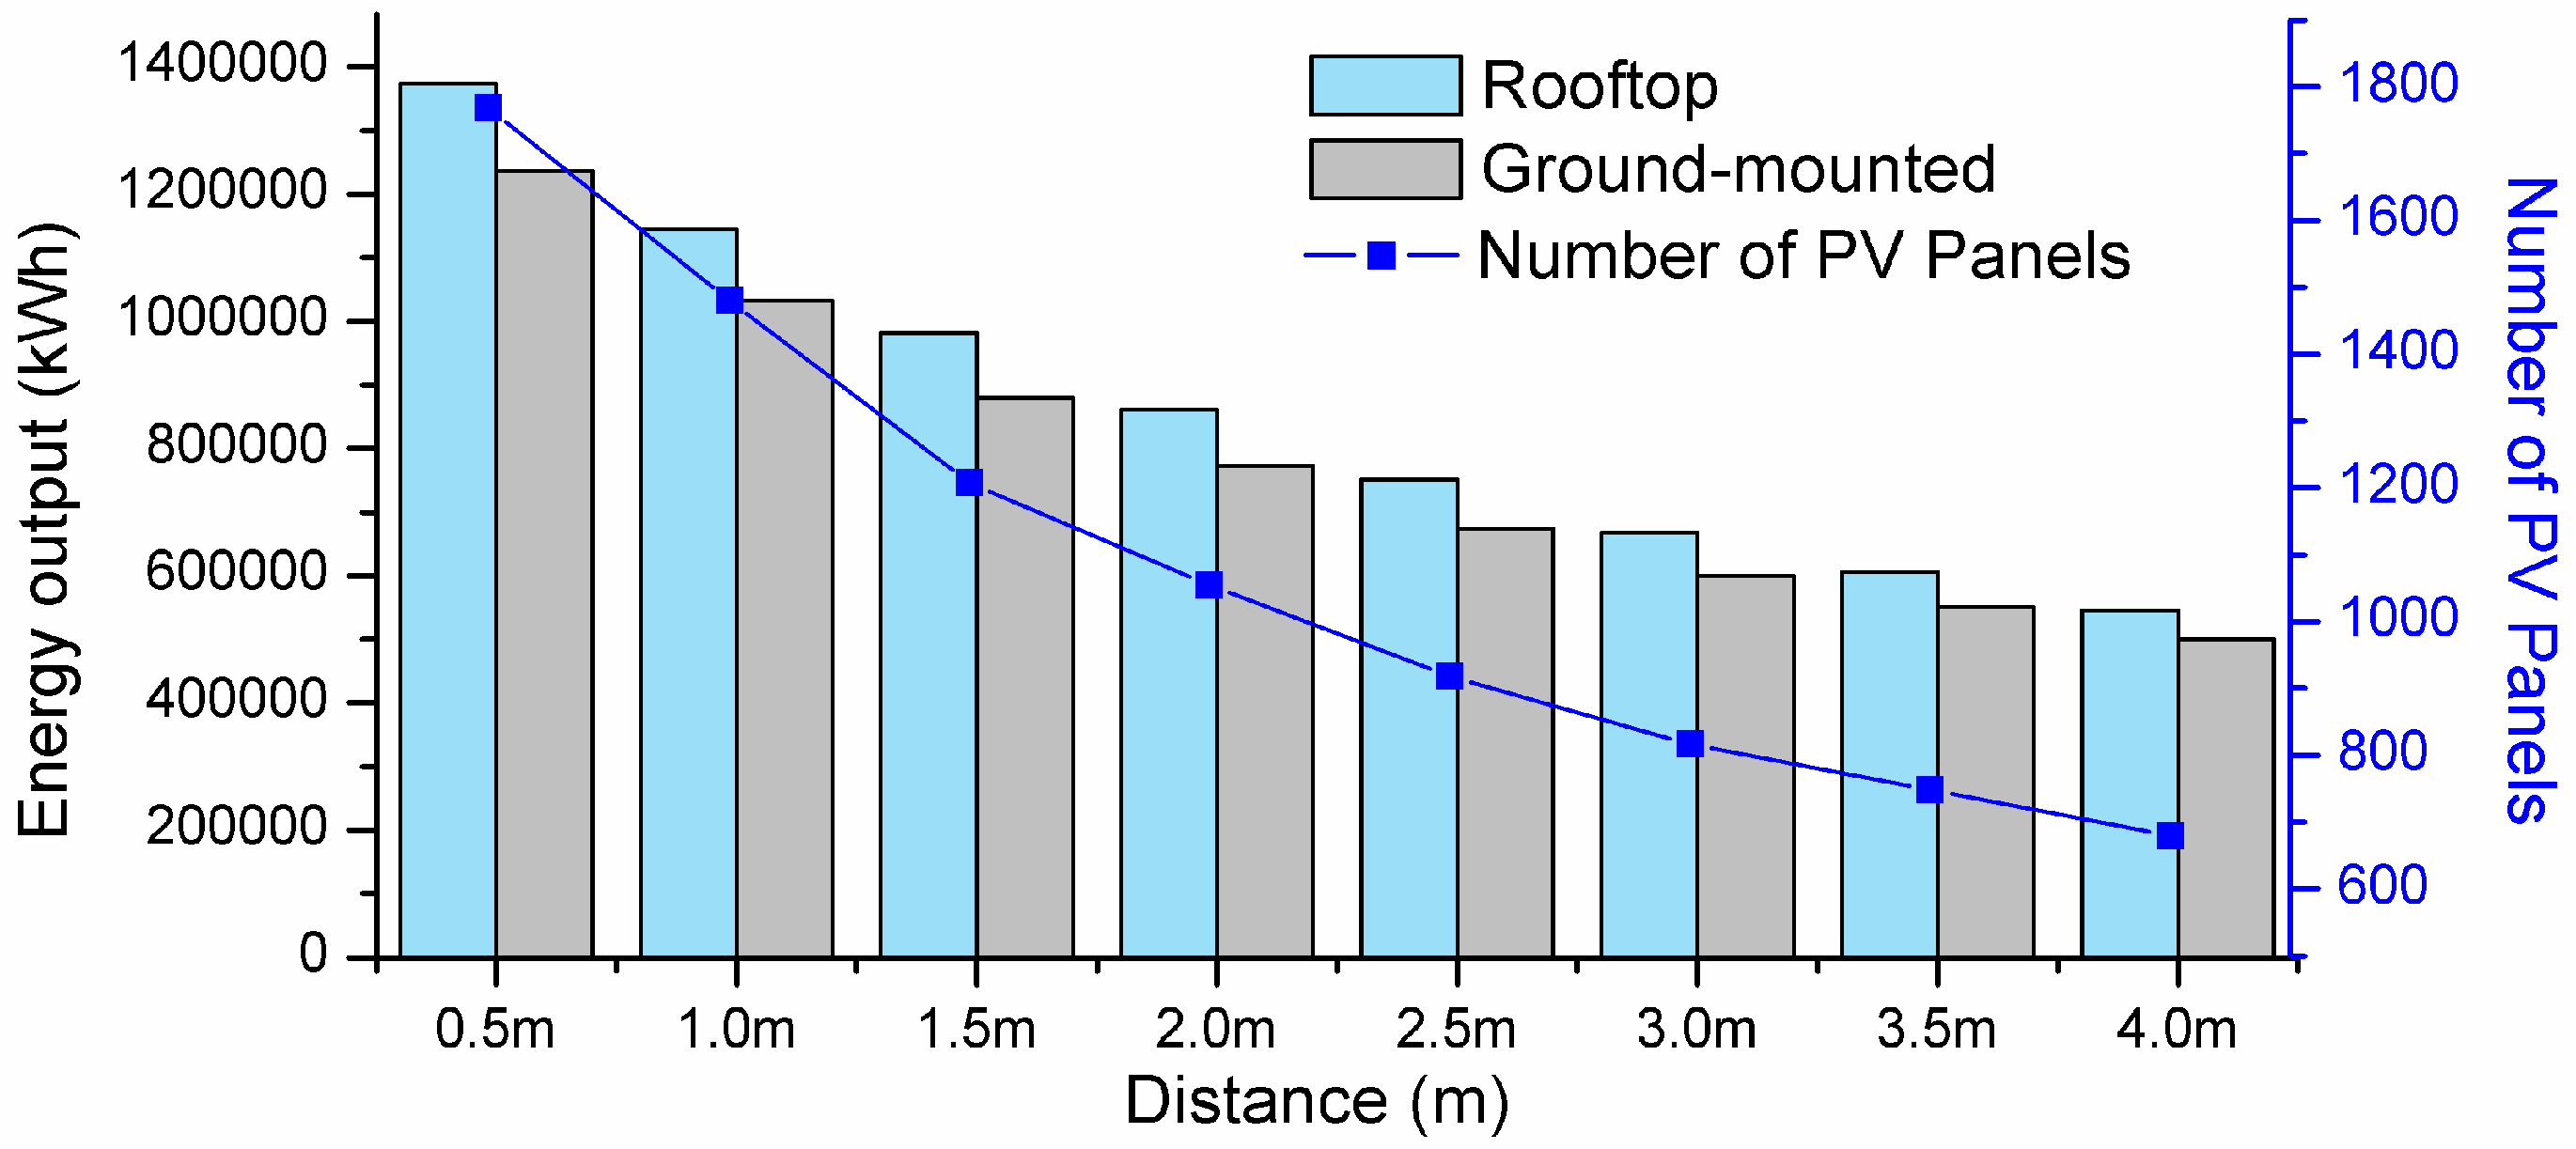
is the generation efficiency of PV. Equation (1) shows that the output of the PV system mainly depends on solar irradiance on POA and the area of PV modules, which depend on the available area for the installation of a PV system. One of the constraints of rooftop PV systems is the limited area of the roof.
The PV generation efficiency ( η P V ) is given by the following relation [46,47]
η P V = η r η p c [ 1 + α p ( T c T c , S T C ) ]
where η p c and η r are the power conditioning and reference module efficiencies, respectively, T c , S T C is the PV cell temperature at standard test conditions (STC), T c is the PV cell temperature, and α p is the temperature coefficient of power. The temperature coefficient of power shows the performance degradation of PV modules with respect to temperature. The temperature coefficient of power of the selected module is −0.39%/°C, which indicates that the PV efficiency decreases by 0.39% per degree rise in temperature. The modules are dark in color; therefore, they absorb more heat and their operating temperature is way above the ambient temperature [48].
The PV cell temperature is given by the following relation [49].
T c = T a + ( T c n T a n ) ( G T G T n ) ( 1 η m p _ S T C ( 1 α p T c , S T C ) τ α ) 1 + ( T c n T a n ) ( G T G T n ) ( α p η m p _ S T C τ α a )
where T a is the ambient air temperature, T c n is the nominal operating cell temperature, G T n is the solar irradiance, for which T c n is defined, T a n is the ambient temperature at which T c n is defined, η m p _ S T C is the maximum power point efficiency at STC, α a is the PV array solar absorptance, and τ is PV the array solar transmittance.
The annual energy output of the PV system is computed as
E p = x = 1 8769 P p v ( x )
where x is the number of hours.
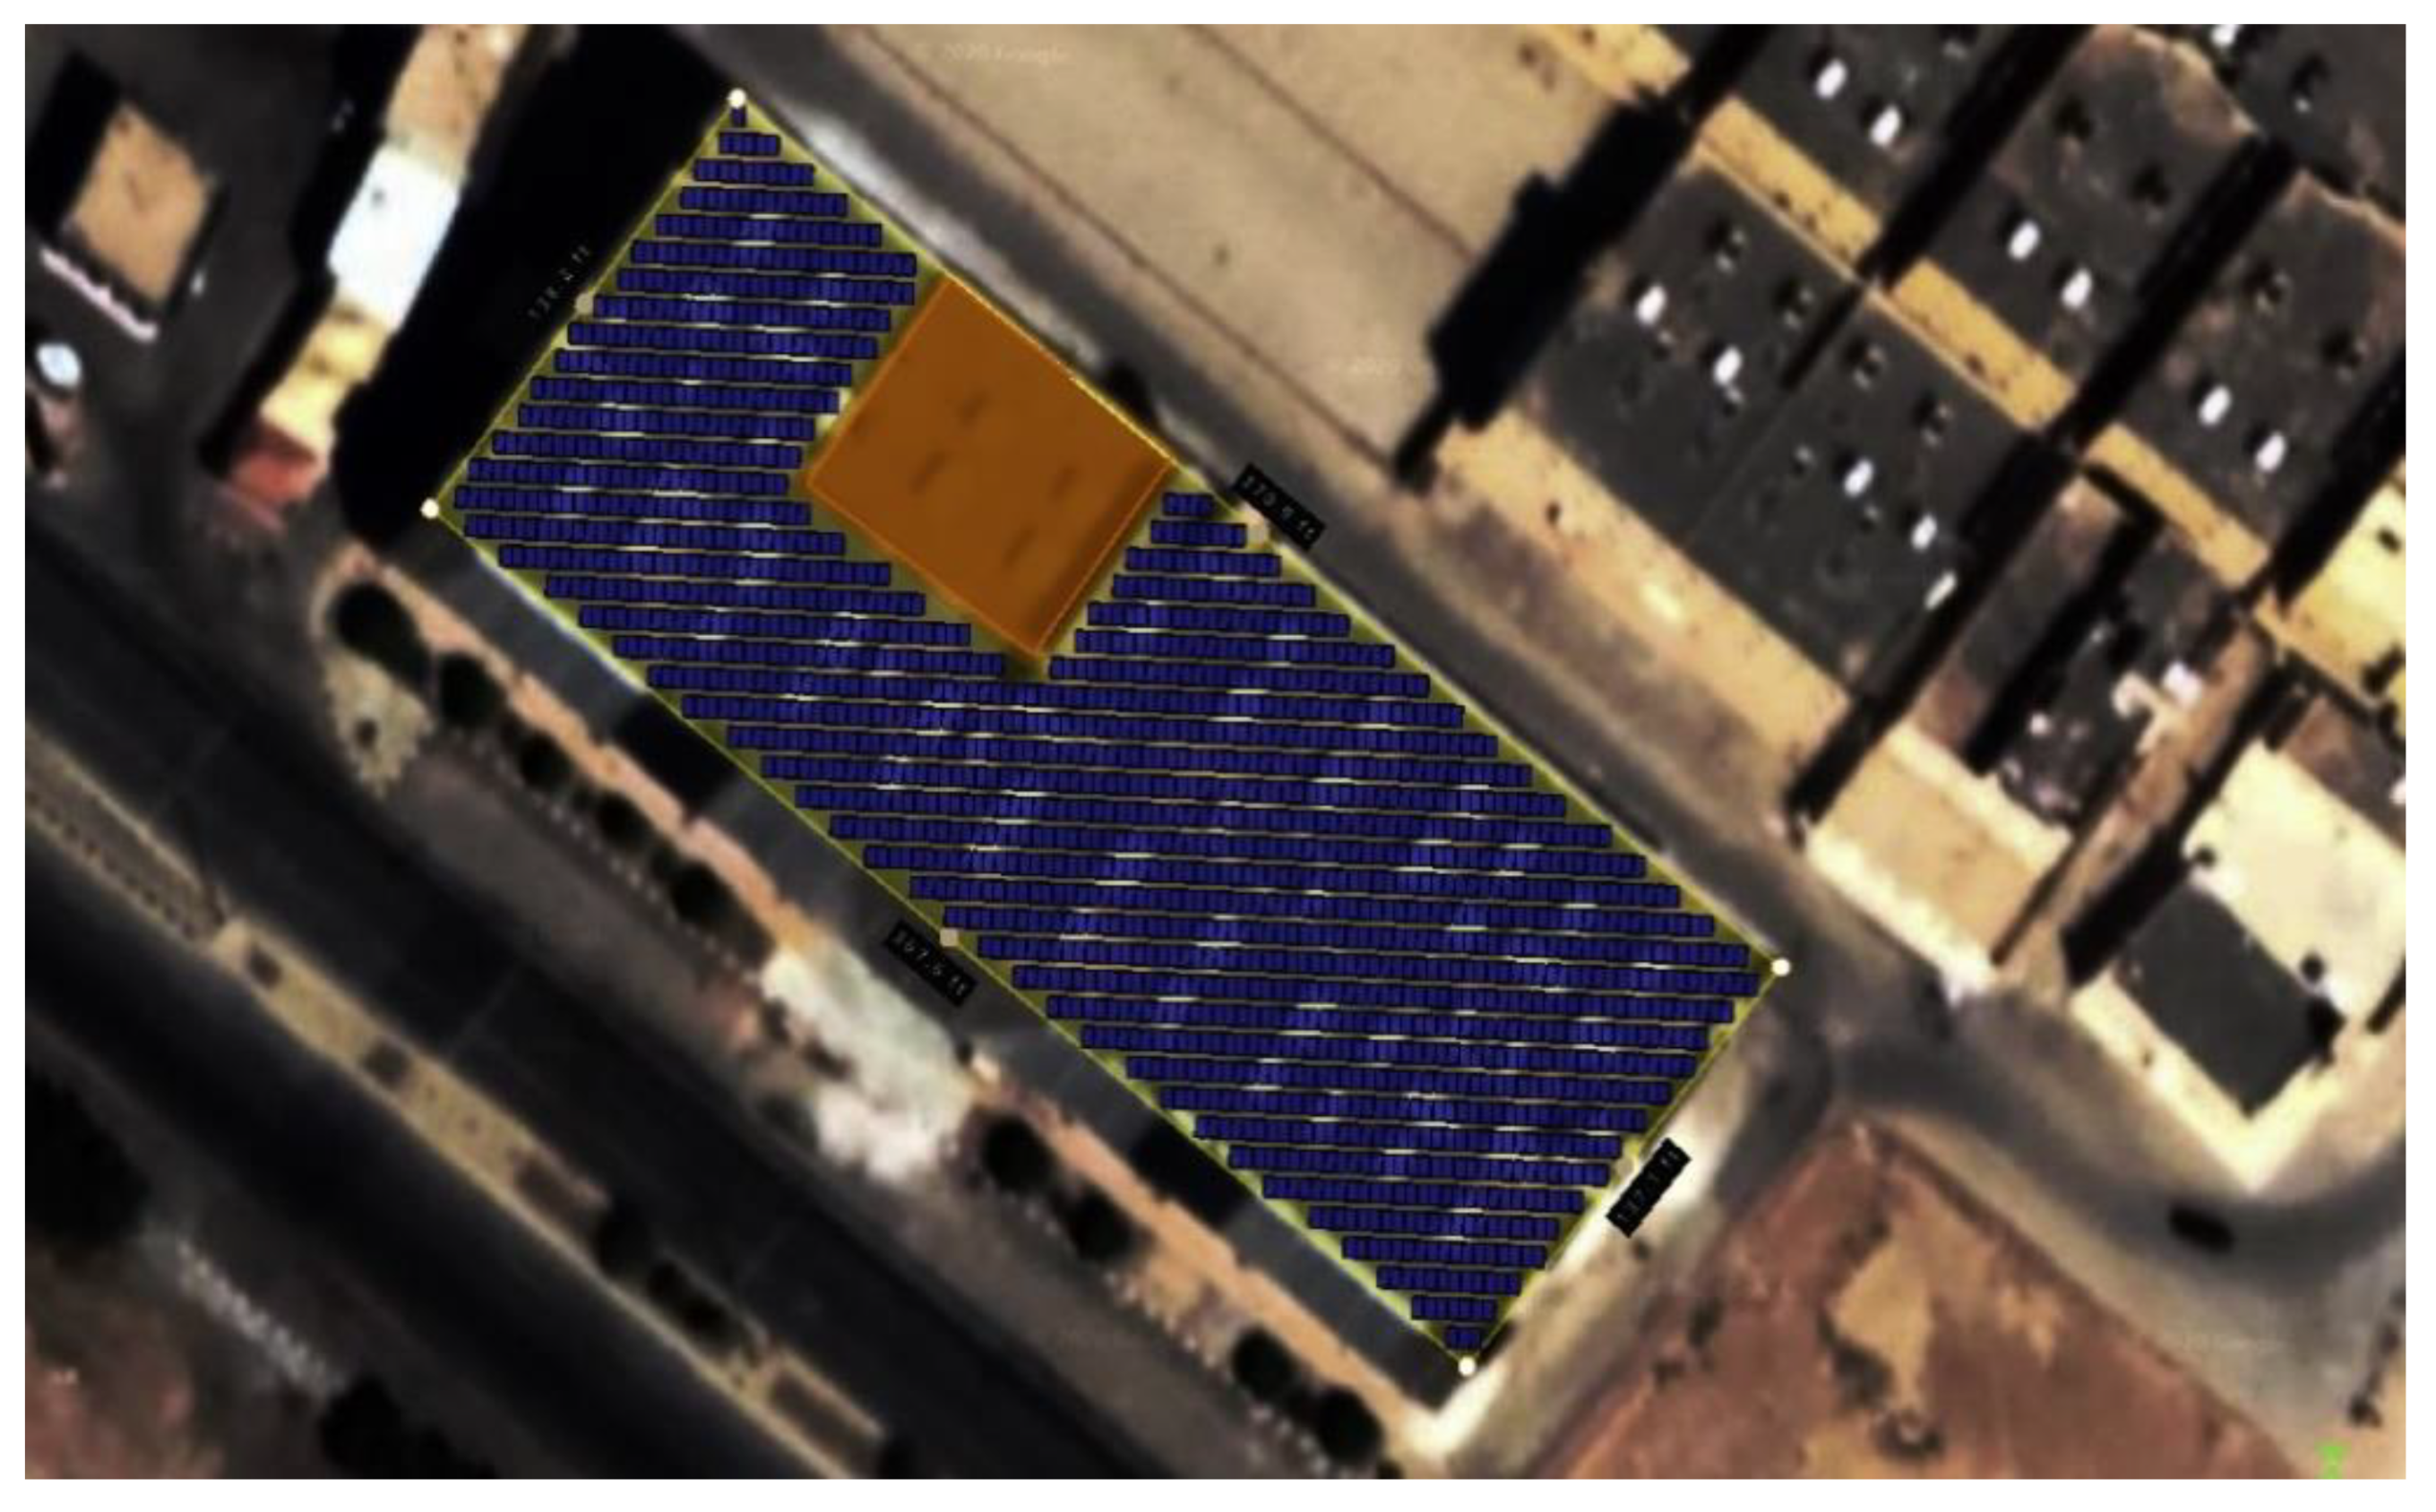
The total covered area of the CEMU building is 4720 m2 and the total available area of the roof for PV installation is 4430 m2. The layout of the rooftop PV system is designed in Helioscope software. This software helps towards the advanced modeling of rooftop PV systems by modeling the PV arrays based on their physical design due to its design-integrated approach. 
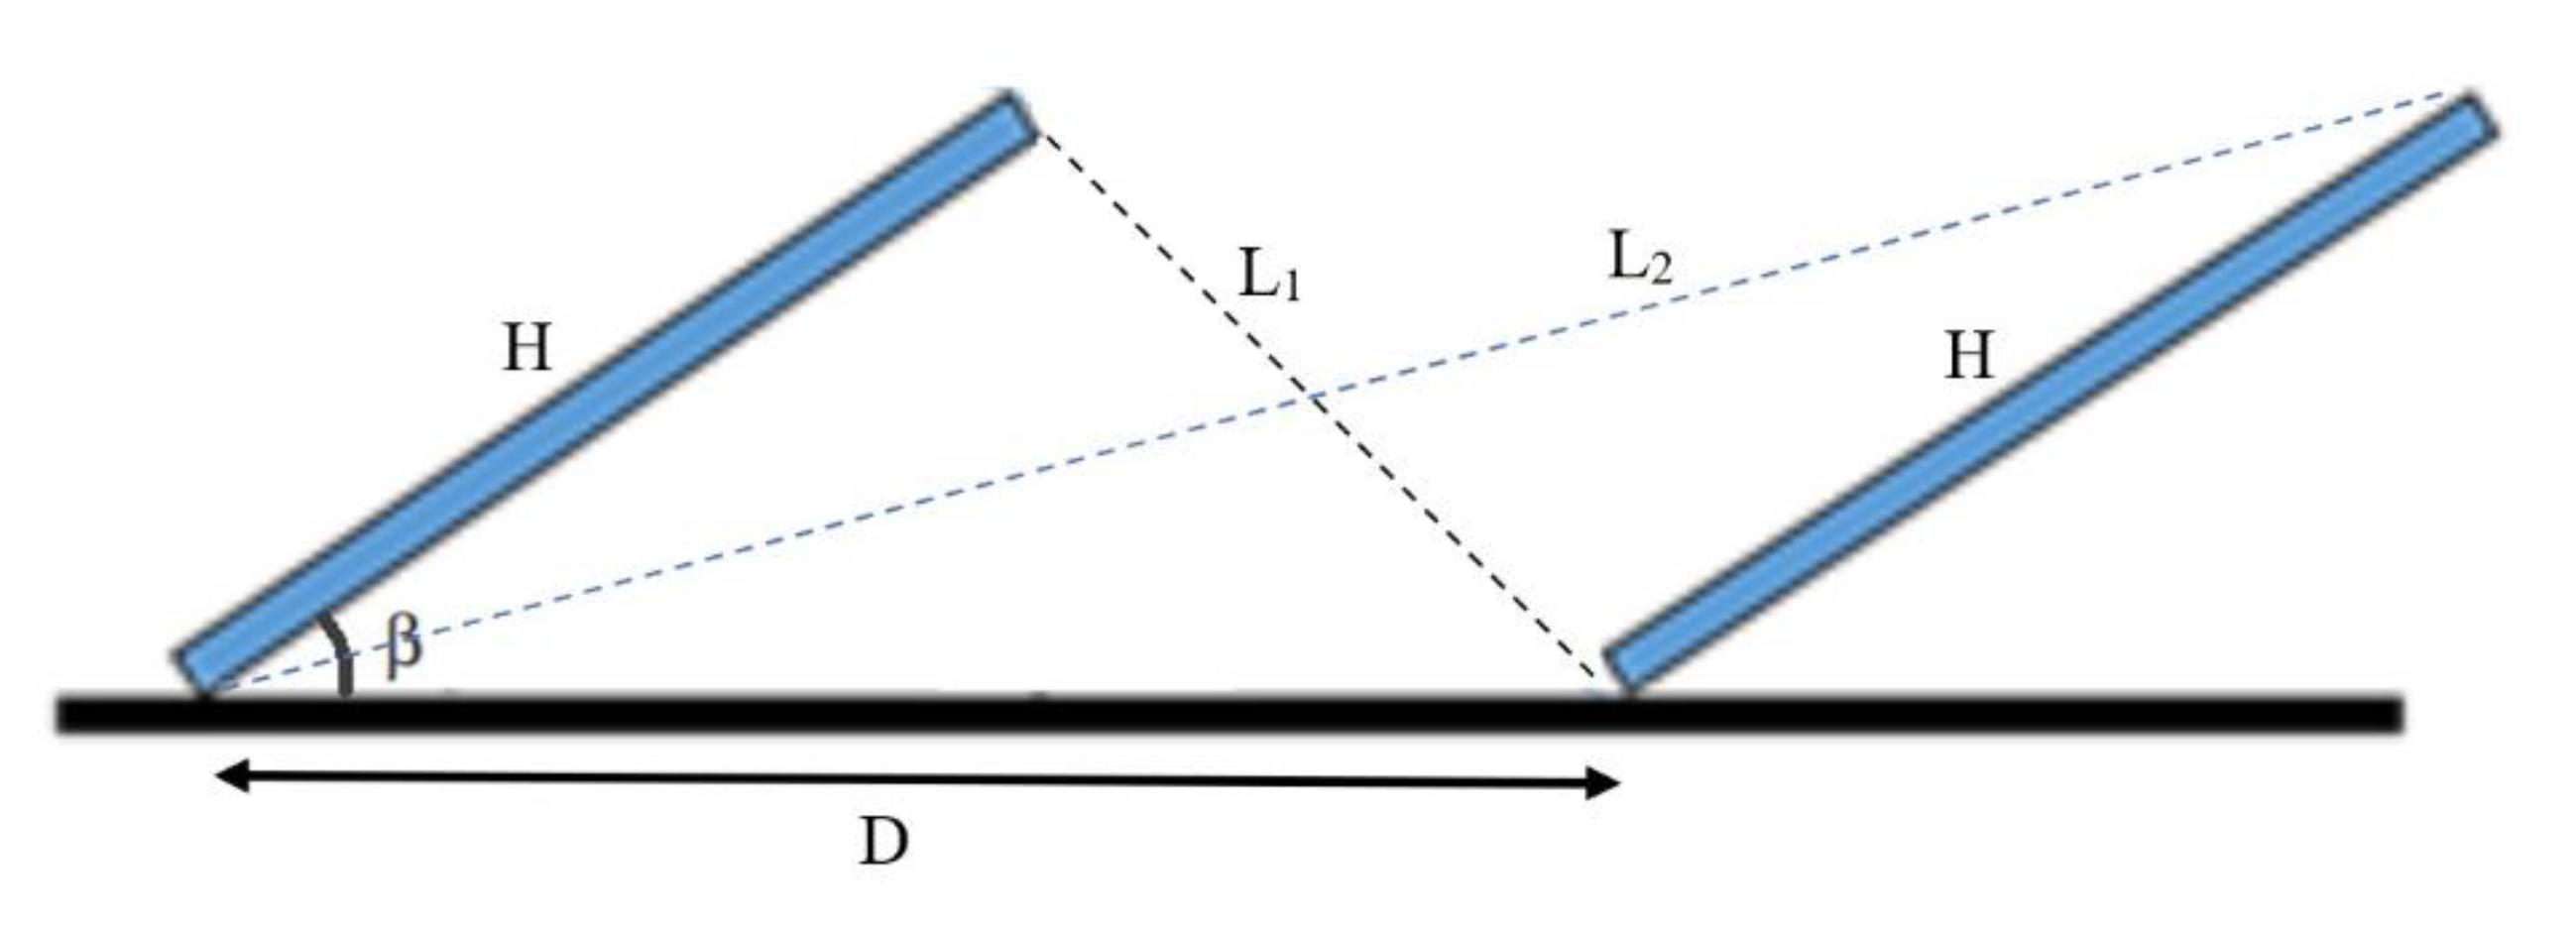
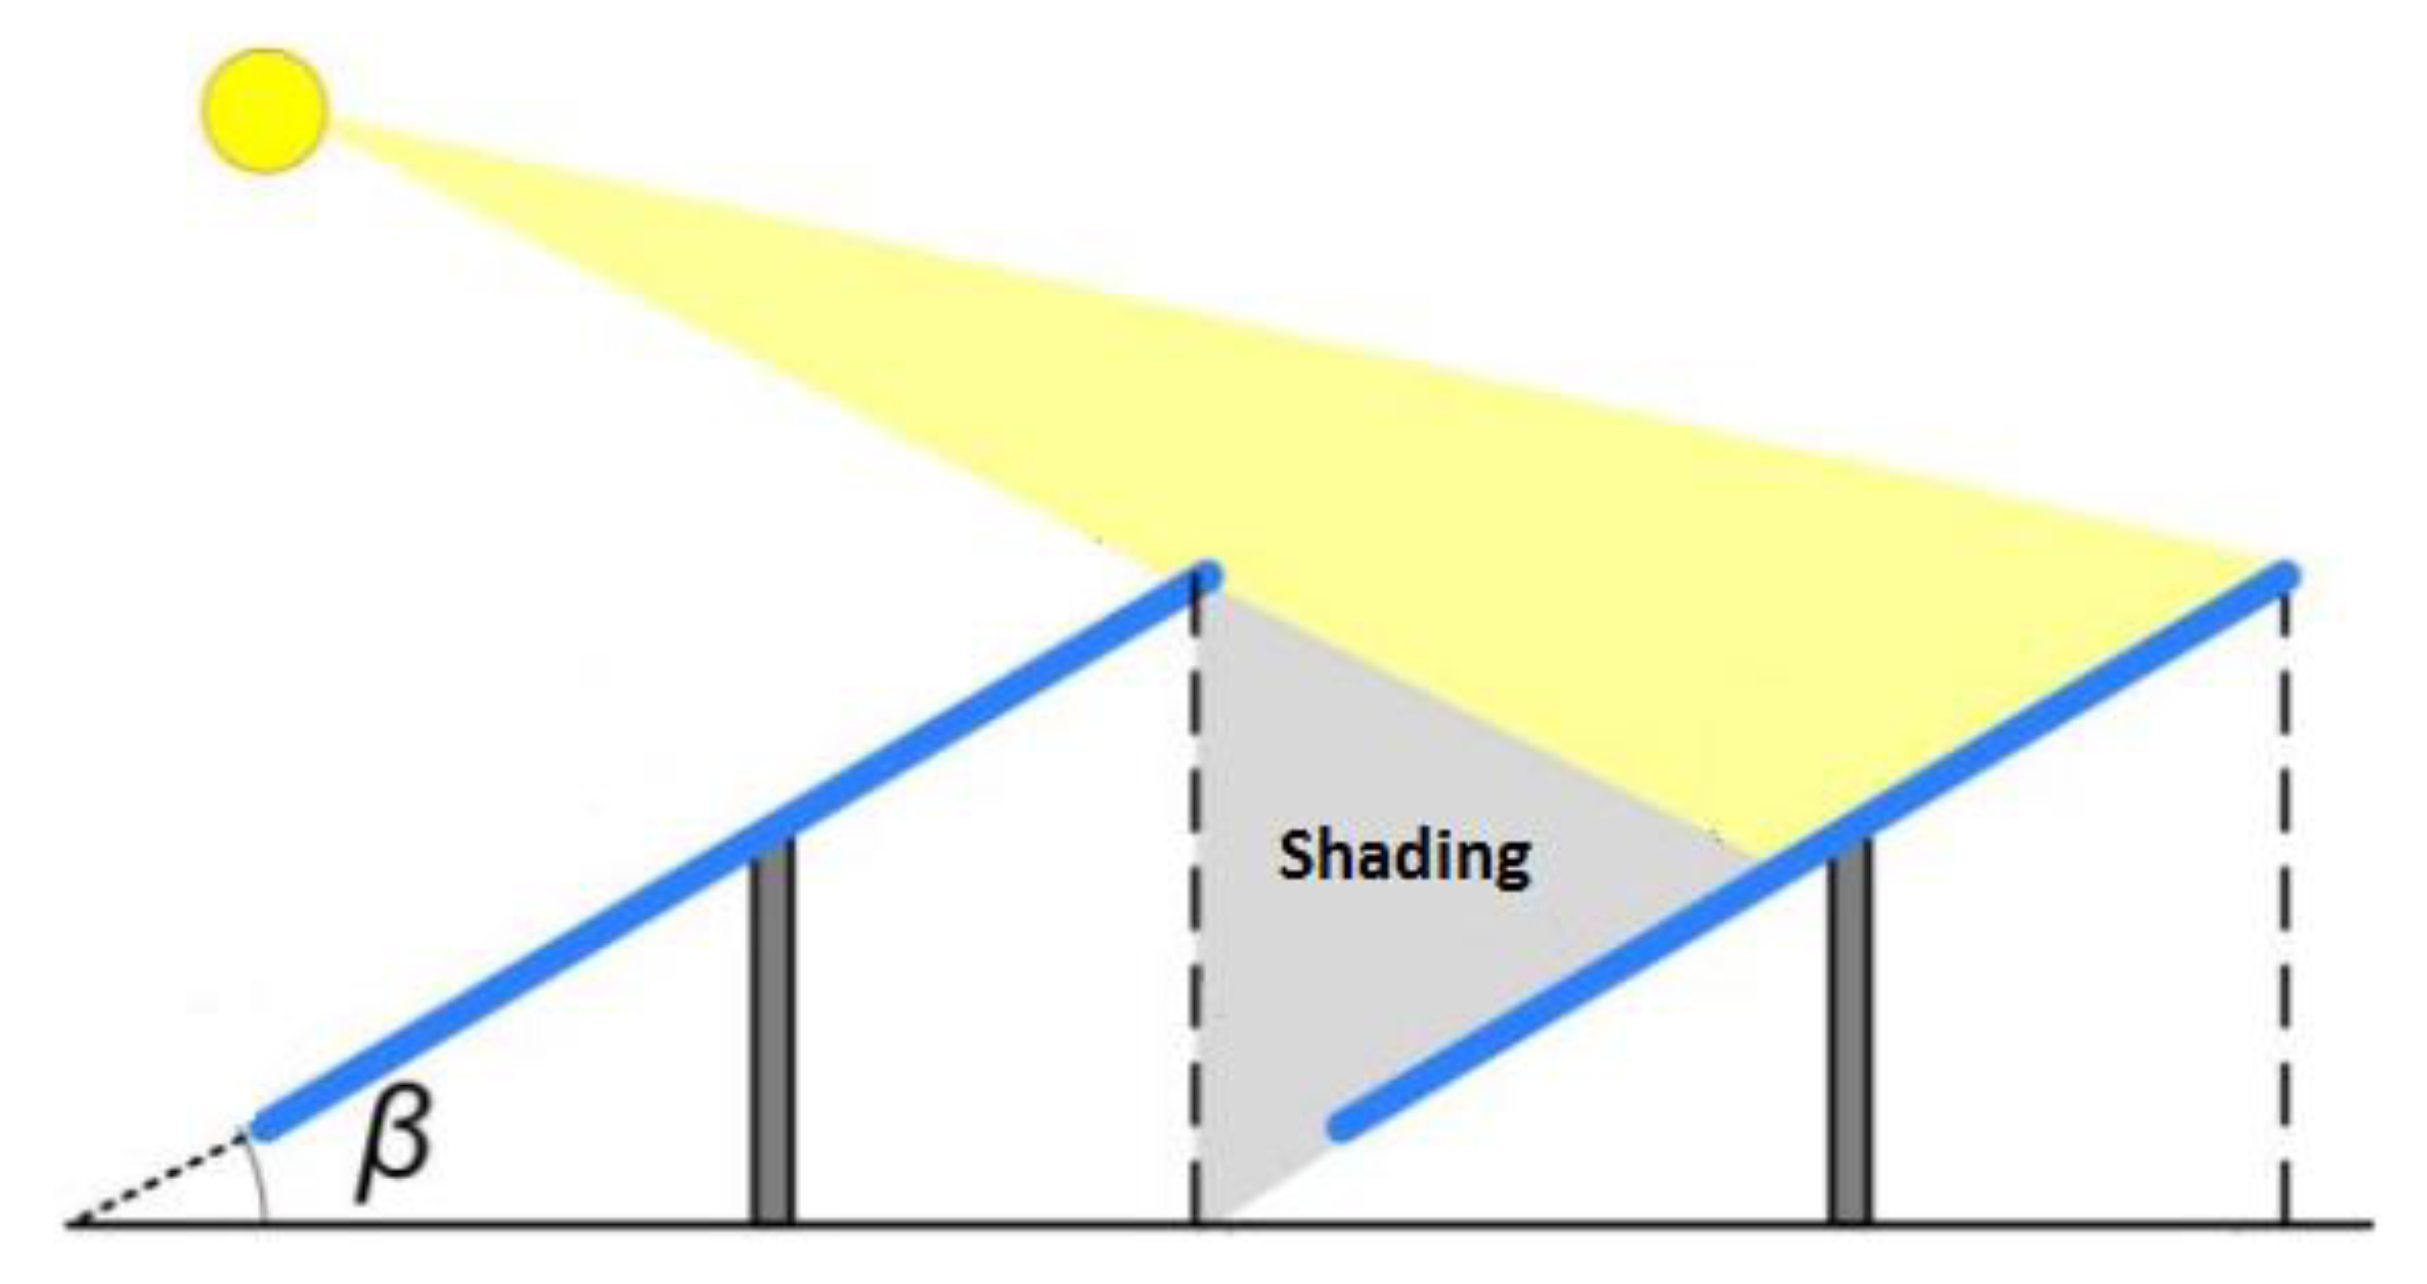
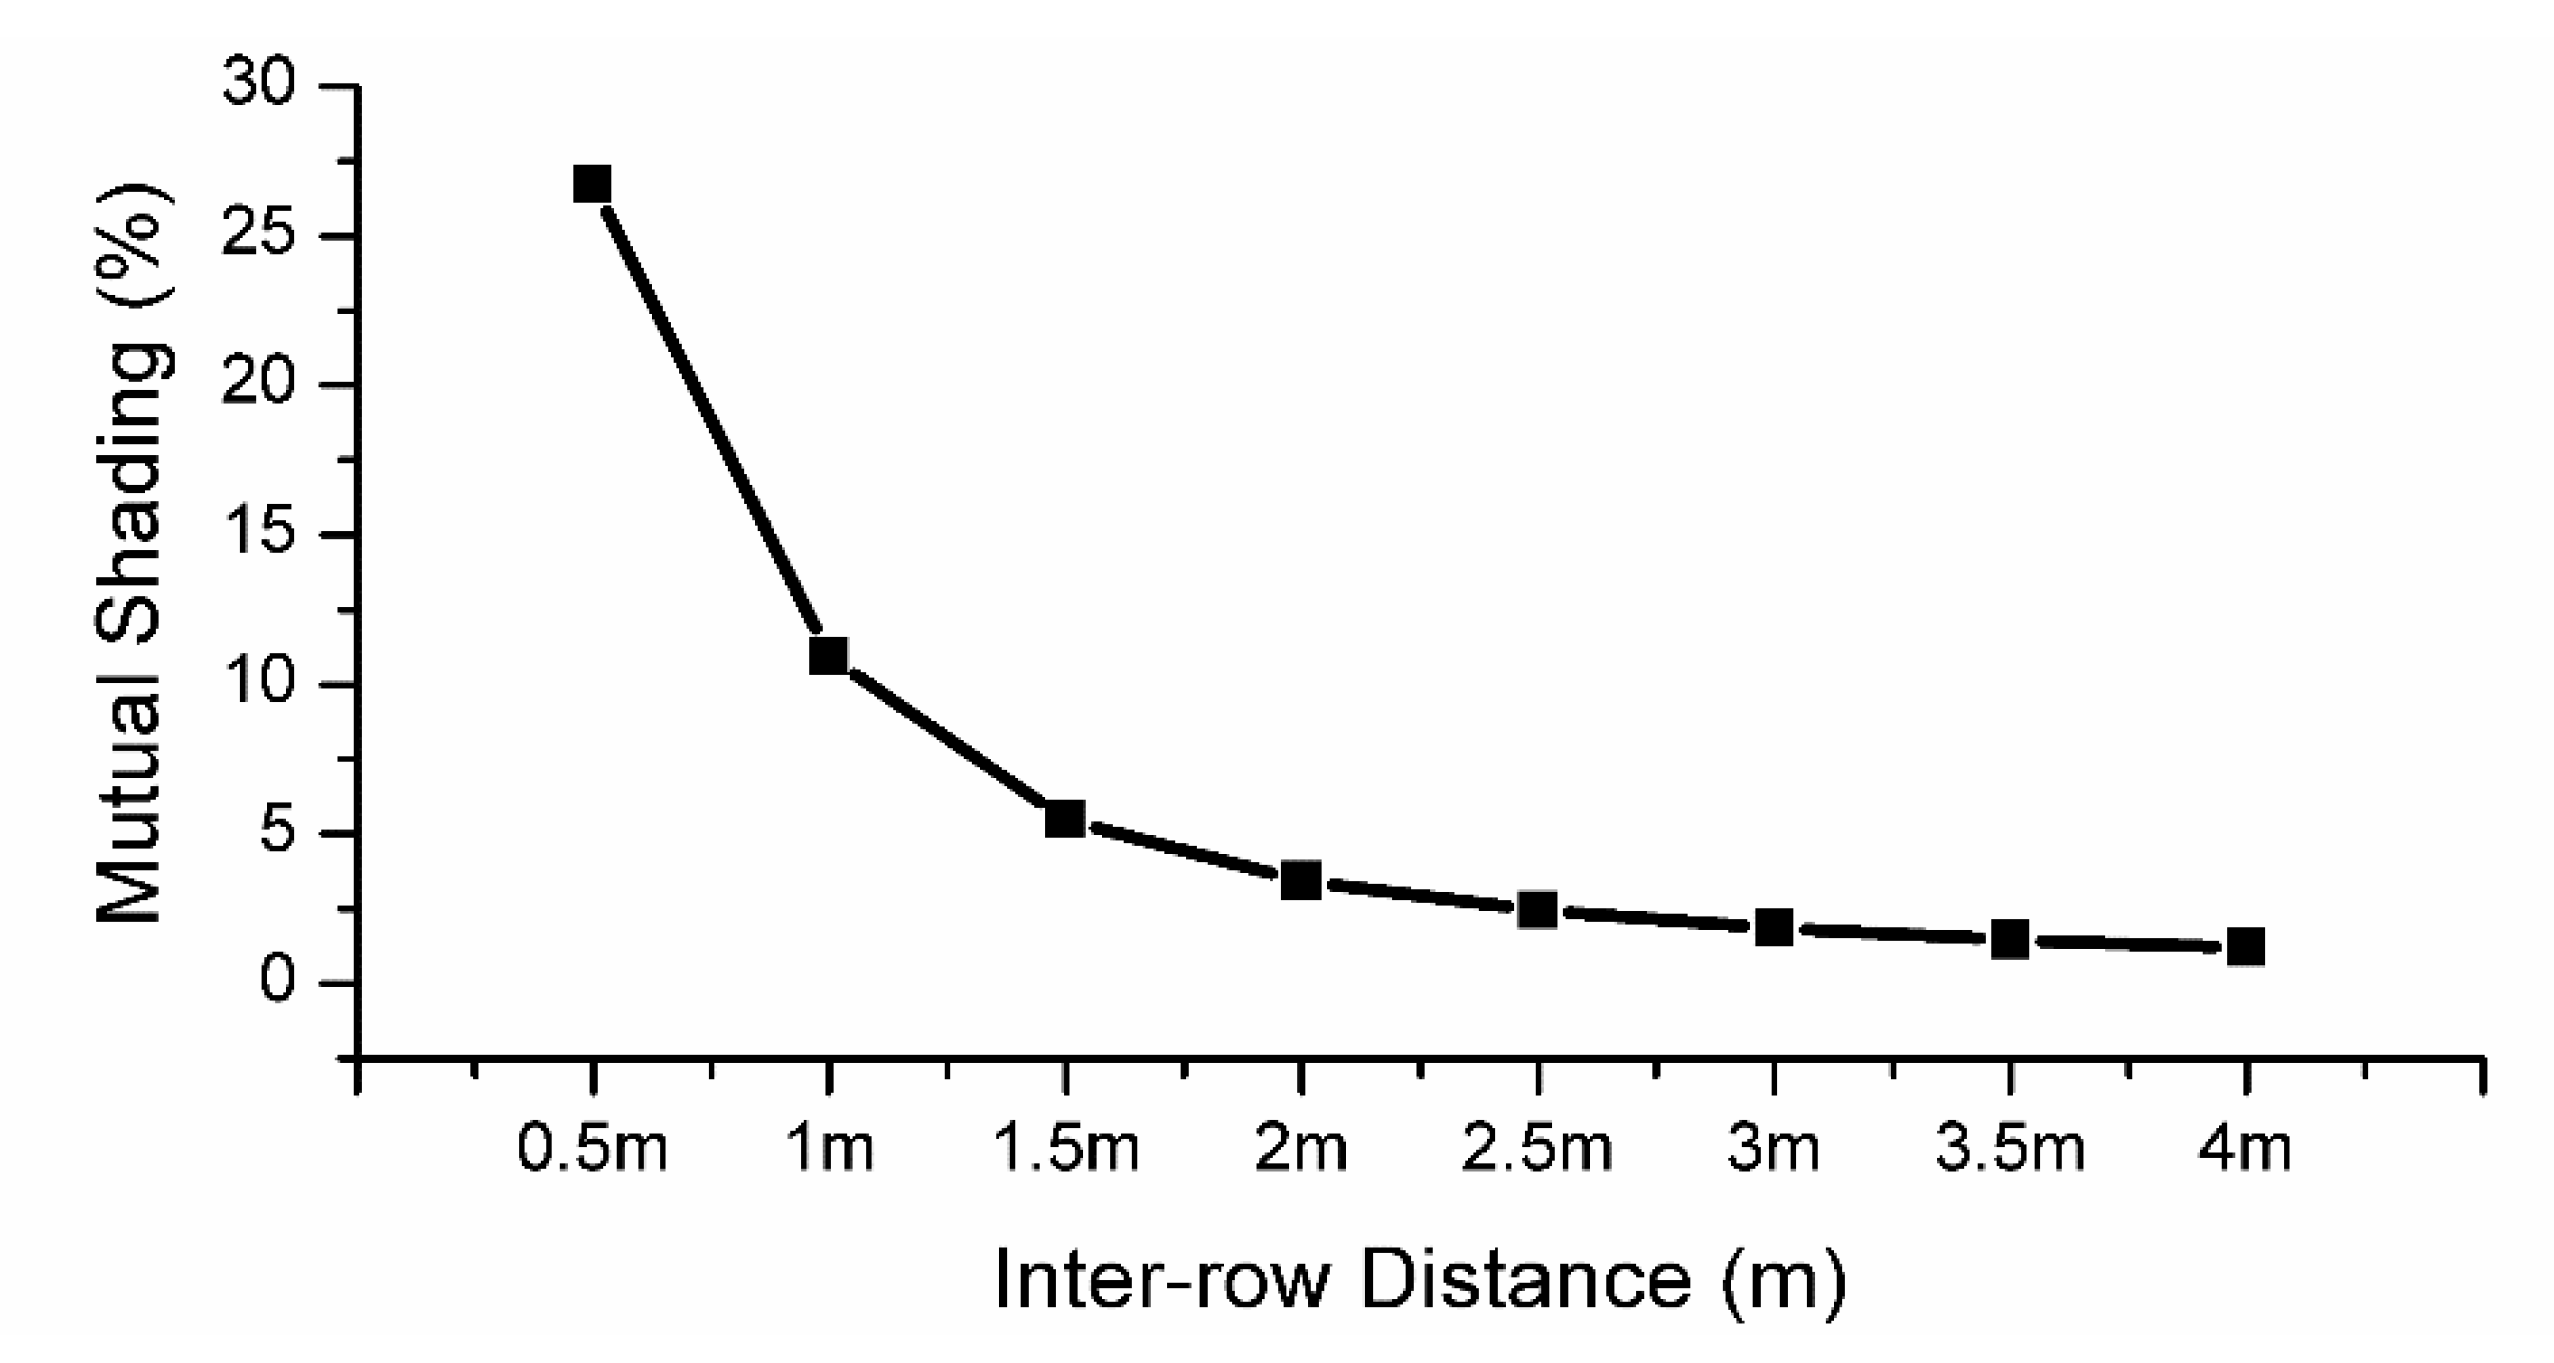
Figure 2 shows the layout of the PV system on the roof of the CEMU building for an interrow distance of 0.5 m. The PV modules are arranged in parallel rows, which are tested for various interrow distances to evaluate the losses due to the mutual shading of PV arrays. The total number of PV modules in the designed layout at the available area of the roof varies, with various interrow distances of parallel modules due to the limited area of the roof. A design summary of the ground-mounted and rooftop PV systems at various distances is presented in Table 3.

4. Thermal Analysis of the Building

The CEMU is a four-story building and the top floor of the building is analyzed because the shading benefit of the rooftop PV to curtail the cooling load is available only for the top floor.

4.1. Heat Flux

The cooling load for a building is decided by the total heat flux entering the building. The rooftop of the building receives heat flux in three ways:
(1)
Shortwave radiation that comprises diffused and direct radiation;
(2)
Longwave radiation due to the sky, surrounding air, and other surrounding factors;
(3)
Convection flux from the outside air.
The net heat flux entering into the roof of building is given by the following relation [50]
q H F = q S W R + q L W R + q a i r _ c o n v
where q L W R is the longwave radiation flux due to the surroundings, q a i r _ c o n v is the convection heat flux by the outer air, and q S W R is the heat flux due to solar radiation.
Any surface exchanges (releases or absorbs) thermal radiation with other bodies subject to the temperature difference between the bodies. The longwave radiation flux is due to the radiation exchange between the roof surface and other bodies such as the air, sky, and surrounding buildings that may release heat waves of various wavelengths. Since the building for this case study has no nearby high-rise buildings in its surroundings and the surface of the roof is facing the sky, the longwave heat flux due to the exchange of radiation with nearby buildings is ignored in this analysis. The longwave radiation flux can be expressed as [50].
q L W R = q s k y + q a i r
where q a i r and q s k y are the heat flux due to radiation exchange with the air and sky. According to the Stefan–Boltzmann law, the radiation received by a body from another hot body is dictated by the difference in the fourth power of temperatures of the radiation-emitting body and the radiation-absorbing body. After applying the Stefan–Boltzmann law, Equation (6) becomes [50,51].
q L W R = ε σ ( T s k y 4 T R S 4 ) + ε σ ( T a 4 T R S 4 )
where σ is the Stefan–Boltzmann constant ( 5.67 × 10 8 W/m2·K4) [51], ε is the emissivity of the surface (0.9) [51], T a , T R S , and T s k y are the air, roof surface and sky temperatures, respectively. The sky temperature cam be computed by the air temperature as [52].
T s k y = 0.0552 ( T a + 273.15 ) 1.5
The PV panels installed on the rooftop modify the view factor of the roof and they also contribute to longwave radiation. The longwave radiation components of the sky, surrounding air, and PV panels depend on their respective view factors. Therefore, Equation (7) becomes [50,51].
q L W R = ε σ F s k y ( T s k y 4 T R S 4 ) + ε σ F P V ( T P V 4 T R S 4 ) + ε σ F P V _ b ( T P V _ b 4 T R S 4 ) + ε σ F a i r ( T a 4 T R S 4 )
where T P V is the PV panel front surface temperature, T P V _ b is the PV panel back side temperature, F s k y , F P V , F P V _ b and F a i r , are rooftop view factors in relation to the sky, PV front, PV back and air, respectively. The PV panel surface temperature ( T P V ) is the same as the cell temperature ( T C ) given by Equation (3) [49]. The PV panel back side temperature ( T P V _ b ) is obtained by the following relation [53,54].
T P V _ b = T a + G T . e ( a + b V )
where V is the wind speed and coefficients a and b are −3.562 and −0.07862 [54].
The view factor of rooftop to sky is computed as (Figure 3).
F s k y = D + L 1 H 2 D
The view factor of rooftop to PV front is computed as (Figure 3).
F P V = D + H L 2 2 D
The view factor of rooftop to back side of PV is computed as (Figure 3).
F P V _ b = D + H L 1 2 D
where L 1 and L 2 depend on D , H and tilt angle β.
The sum of the view factors from a surface to the whole space is 1 [55]; therefore, the view factor to air is calculated
F a i r = 1 F s k y F P V F P V _ b
Both the direct and diffused radiation hitting the rooftop contribute to the shortwave radiation flux and can be expressed by the following relation [50].
q S W R = ( 1 α ) G H I
where α is roof surface albedo (0.3) [56]. The global solar radiations are reduced to diffused radiation for a PV-shaded roof [50].
q S W R = ( 1 α ) D i f f
where D i f f is the diffused solar radiation. The convection flux from outside air is given by [50,51]
q a i r   c o n v = h c ( T R S T a )
where h c is the convection coefficient. Therefore, the net heat flux into the roof of the building can be expressed by putting the expressions of longwave radiation flux, shortwave radiation flux and air convection heat flux from Equations (9), (16), and (17) in Equation (5) to give the net heat flux
q H F = ( 1 α ) D i f f + ε σ F s k y ( T s k y 4 T R S 4 ) + ε σ F P V ( T P V 4 T R S 4 ) + ε σ F P V _ b ( T P V _ b 4 T R S 4 ) + ε σ F a i r ( T a 4 T R S 4 ) + h c ( T R S T a )

4.2. Roof Surface Temperatures

The CEMU building is simulated in EnergyPlus software from the National Renewable Energy Laboratory (NREL) to determine the cooling load requirement and surface temperatures of the roof of the building under different shading scenarios. The data file containing detailed weather information such as temperature, humidity, wind speed, diffuse horizontal irradiance (DHI), direct normal irradiance (DNI), and GHI is loaded in EnergyPlus. The parameters of the building for EnergyPlus are tabulated in Table 4.
In the case of an uncovered roof, the solar radiation directly hits the roof and, in hot regions during the summer solstice, this solar radiation causes a high cooling load demand. The CEMU building is simulated with and without rooftop PV panels. The simulation results show that without rooftop PV, the temperature of the outer surface of the roof in the hot summer season reaches above 70 °C. The building is simulated again with rooftop PV panels by varying their interrow distance from 0 m to 4 m. These rooftop PVs are partially shading the roof of the building; as a result, they block the direct connection of solar radiation on the roof; therefore, the roof temperature decreases. The simulation results of both outer and inner surface temperatures of the CEMU building’s roof for a few hot summer days are presented in Figure 4. It can be observed that the temperatures of both inner and outer surfaces decrease by placing PV panels on the rooftop due to their shading benefit. As a result, the cooling energy required to maintain the comfortable indoor environment of the building decreases. The cooling energy requirement also increases with the increase in the interrow distance of parallel arrays of PV panels because a larger portion of the roof surface area is directly exposed to solar radiation at larger distances.

4.3. Cooling Energy Saving Advantage

The partial shading of the roof surface is an added advantage of the rooftop PV installation along with the land cost saving. This partial shading helps to reduce the cooling load during the hot summer season. The simulation results show that the cooling energy requirement of the top floor of the CEMU building decreases by placing the PV modules on the rooftop. This saving in energy can be considered as an added part of the actual energy generated by rooftop PVs. The simulation results showing the cooling load savings for the top floor of the CEMU building at various interrow distances of the PV modules are presented in Table 5.

5. Results and Discussion

5.1. Optimization of PV Systems

In order to receive maximum solar radiation, the PV modules are tilted at a particular angle to keep them facing the sun for a longer period of the day. This tilt angle of the PV modules causes mutual shading of the parallel PV modules. This shading reduces the efficiency of the PV system; therefore, it is very important to find an optimal interrow distance for maximum performance efficiency and minimum LCoE. The LCoE is taken as objective function and interrow distance is the optimization variable. The LCoE is the ratio of the lifecycle cost of the system to the total energy produced during the lifespan of the project. It shows the cost of per kWh of electricity and it is expressed by the following relation [47].
L C o E = C T A C E p
where E p is the annual energy output and C T A C is the total annualized cost, which is given by the following relation [57]
C T A C = C T P V × C R F
where C T P V is the net present value of the costs of all the components in the system and C R F is the capital recovery factor, which is given by the following expression [58]
C R F = r ( 1 + r ) N ( 1 + r ) N 1
where N is the lifetime of the project (25 years) and r denotes the interest rate (6%). The net present value of the costs of all the components is calculated as
C T P V = CC + C O & M _ N P V + C R e p _ N P V C S a l _ N P V C G _ N P V
where CC is the capital cost, which is sum of the engineering, procurement and construction (EPC) and financial costs, C O & M _ N P V is the present value of operation and maintenance cost, C R e p _ N P V is the present value of the replacement cost of equipment, C S a l _ N P V is the present worth of the components’ salvage value, and C G _ N P V is the present worth of the cooling load saving in terms of the grid electricity price. C G _ N P V is zero for the ground-mounted PV system and in the case of the rooftop PV system when the saving in cooling load is taken as an added part of the PV output. The net present values are computed by the following expressions [59].
o p e r a t i o n   a n d   m a i n t e n a n c e   c o s t c O & M _ N P V = i = 1 N c O & M × ( 1 + j ) i ( 1 + r ) i s a l v a g e   v a l u e c S a l _ N P V = c S a l × ( 1 + j ) i ( 1 + r ) i c o m p o n e n t   r e p l a c e m e n t   c o s t c R e p _ N P V = c R e p × x = 1 n ( 1 + j 1 + r ) x . L c o o l i n g   l o a d   s a v i n g   c o s t c G _ N P V = i = 1 N C G × ( 1 + j ) i ( 1 + r ) i }
where j is the inflation rate (2.5%), n is the number of replacements of a component, L is the life of the component, C O & M , C S a l , C R e p , and C G are the current values of operation and maintenance costs, salvage value, the cost of replacement of a component, and the cooling load saving cost in terms of the grid electricity price, respectively.
In order to calculate LCoE of the two configurations at various interrow distances, the economic parameters of the PV systems for two configurations are listed in Table 6.

5.1.1. Ground-Mounted PV System

One scenario for the tilted PV modules and their mutual shading is shown in Figure 5. This mutual shading leads to a reduction in the electrical output. In order to reduce these shading losses, the parallel PV modules can be placed at larger distances. The percentage of mutual shading of parallel rows of PV arrays is calculated by a 3D system advisor model (SAM) calculator using the approach detailed in [60]. It shows the amount of shading on a row of PV panels due to neighboring PV rows. The percentage of mutual shading of the PV system at various interrow distances of parallel rows of PV panels is shown in Figure 6. As the interrow distance increases, the shading decreases and the energy yield increases, but the large interrow distances require more land area and eventually more land cost. Therefore, finding the optimal interrow distance is very important. The LCoE and PV energy yields of the ground-mounted PV system at various interrow distances are shown in Figure 7. It can be observed, in Figure 7, that as the interrow distance increases, the PV energy yield increases sharply and the LCoE decreases, but this increase in energy yield becomes less effective at interrow distances greater than 1.5 m. The LCoE is minimal at an interrow distance of 1.5 m. The LCoE starts increasing with a further increase in the interrow distance because there is very little decrease in the shading losses with further increases in the interrow distance (Figure 6) and therefore the energy yield is almost constant at larger distances, but LCoE starts increasing at a sharp pace due to the increase in land area and cost. The optimal interrow distance for the minimum LCoE of the ground-mounted PV system is 1.5 m.

5.1.2. Rooftop PV System

As discussed in Section 5.1.1, the LCoE decreases and the energy yield increases with the increase in the interrow distance. In the case of the rooftop PV system, which has an added advantage of rooftop shading, this increased distance exposes a larger roof area to sun rays and increases the cooling load requirement (Table 5). For the rooftop PV system, the saving in the cooling energy load is also included in the calculations of energy yield and LCoE. Figure 8 shows the energy yield and LCoE for various interrow distances from 0.5 m to 4 m for three cases, i.e.,
(1)
Net LCoE calculated by taking into account cooling energy savings as part of PV output;
(2)
Net LCoE calculated by taking into account cooling energy savings in residential buildings’ electricity tariffs;
(3)
Net LCoE calculated by taking into account the cooling energy savings in government buildings’ electricity tariffs.
The LCoE decreases and the net energy yield (sum of electrical and saving yield) increases initially with the increasing interrow distance because of the decrease in mutual shading (Figure 6), but at larger interrow spacings, this relationship between net energy yield and LCoE with increasing interrow distances reverses because of the decrease in the cooling energy saving yield at larger distances. The optimal interrow spacing for minimum LCoE and maximum net energy yield for rooftop PV configuration is 2.5 m for all three cases.

5.2. Comparative Analysis of the Rooftop and Ground-Mounted Systems

In order to conduct a fair comparative analysis of the two configurations, the area of the land for ground-mounted configuration is taken to be the same as the available surface area of the rooftop configuration. The two systems are compared based on their economic and energy analyses.

5.2.1. Economic Analysis

The two important factors in analyzing the economic feasibility of a renewable energy project are LCoE and payback period. The LCoE values of the two PV systems for various interrow distances are compared in Figure 9. The Net LCoE for the rooftop configuration also includes the cooling load curtailment advantage. In order to calculate the cooling energy savings, the cost of electricity from the grid is taken as 8.5 ¢/kWh for government buildings and 4.8 ¢/kWh for residential buildings [61]. The Net LCoE of the optimized rooftop PV system is 5.07 ¢/kWh (Net-Rooftop), 5.10 ¢/kWh (residential buildings), and 4.65 ¢/kWh (government buildings), respectively, compared to 6.1 ¢/kWh for the optimized ground-mounted PV configuration.
The payback period for the PV system is the time duration in years required to recover the initial investment in the system in the form of savings in electricity bills or by selling electricity to the grid. The payback periods of the two systems are shown in Figure 10. The payback period of the ground-mounted system is longer than the rooftop PV system because the ground-mounted PV system involves the land cost as well. The net payback period of the rooftop PV system is calculated by adding the rooftop surface shading benefit. The net-payback periods of the optimized rooftop PV configuration are 2.9 years (Net-Rooftop), 3.0 years (residential buildings), and 2.7 years (government buildings), respectively, compared to 3.6 years for the optimized ground-mounted system.

5.2.2. Energy Analysis

The saving in cooling energy due to the partial shading of the roof by rooftop PV is included in the energy generated by the rooftop PV system, while the ground-mounted PV system does not have this advantage. Therefore, the net energy from the rooftop PV is higher than the ground-mounted PV. Figure 11 shows the energy output from the two systems at various interrow distances. The energy output decreases with the increasing interrow distance because the number of PV panels for a given surface area decreases as the interrow distance increases.
The optimal interrow distances for the ground-mounted and rooftop PV configurations are 1.5 m and 2.5 m, respectively. Figure 12 shows a comparison of the annual and cumulative energy output of the two configurations. The annual energy of the PV systems decreases in successive years because of the performance degradation of PV modules due to aging. A 0.5%/year performance degradation rate for the PV system is considered in this analysis [44,62]. Since the area is fixed, the increased interrow distance causes a reduction in the energy output. Hence, the two configurations are compared in such a way that the optimized case of each configuration is compared with the other configurations for the same interrow distance. Figure 12a shows a comparison of the optimized rooftop configuration with the ground-mounted configuration for the same interrow distance (2.5 m) and Figure 12b presents a comparison of optimized ground-mounted system with the same rooftop system (1.5 m). It is evident from Figure 12 that the rooftop system has a much better annual and cumulative energy output in both the cases, and the gap between the cumulative energy output of the two configurations increases with each passing year.
The capacity utilization factor (CUF) is a common parameter to compare different PV systems. It is the ratio of energy generated by the plant during a year to the possible energy output of the plant if it operates at the nameplate capacity for the whole year. It is normally represented as a percentage [44].
CUF = a n n u a l   e n e r g y   o u t p u t n a m e p l a t e   c a p a c i t y × 24 × 365
Figure 13 shows the CUF of the rooftop and ground-mounted PV systems. The rooftop PV system has a better CUF. The CUF of the optimized rooftop PV configuration is 26.7% compared to 23.8% for the optimized ground-mounted system.

6. Conclusions

A detailed performance analysis of rooftop and ground-mounted PV systems is carried out to determine the most feasible configuration in hot urban areas. The PV modules are placed at a particular tilt angle to receive the maximum amount of solar irradiance and operate at maximum efficiency, but the tilted PV modules cause mutual shading among the parallel arrays, which decreases their efficiency. The larger interrow distance helps to enhance the efficiency of the parallel PV modules, but this wider interrow distance requires more land area in the case of ground-mounted PV, while in the case of the rooftop PV system, more of the roof surface is exposed to direct sun radiation. Therefore, an optimized interrow distance between parallel PV modules is determined for the maximum energy yield, and minimum LCoE. The optimized distances for the ground-mounted and rooftop PV configurations are found to be 1.5 m and 2.5 m, respectively. The optimized rooftop PV has a CUF of 26.7% compared to 23.8% for the ground-mounted one. The rooftop PV is economically more feasible due to its shading advantage and the fact that no land is required. The LCoE of the optimized ground-mounted system is 6.1 ¢/kWh, while the LCoE of the optimized rooftop system, after including the shading benefits, is 5.07 ¢/kWh (Net-Rooftop), 5.1 ¢/kWh (residential buildings), and 4.65 ¢/kWh (government buildings). This shows a 16.9% (Net-Rooftop), 16.4% (residential buildings), and 23.7% (residential buildings) reduction in the LCoE of the ground-mounted configuration. From the results of this paper, it is concluded that the rooftop PV system is clearly a much better option than the ground-mounted PV in regions with hot climates.

Author Contributions

Conceptualization, A.B.A.; methodology, A.B.A. and M.Z.; software, A.B.A., G.A. and M.Z.; validation, A.B.A. and M.A.; formal analysis, M.A., A.B.A. and A.R.B.; investigation, A.B.A. and M.Z.; resources, M.A. and M.U.; data curation, A.B.A. and M.A.; writing—original paper, A.B.A. and M.Z.; reviewing and editing, A.B.A., M.U., G.A. and M.A.; visualization, M.Z. and A.R.B. All authors have read and agreed to the published version of the manuscript.

Funding

Majmaah University funded the research under contract number 1439-66.

Conflicts of Interest

The authors declare no conflict of interest.

Nomenclature

A P V area of PV modules
C T A C total annualized cost (US$)
C G current values of cooling load saving
C G _ N P V present worth of cooling load saving
C O & M _ N P V present value of operation and maintenance cost
C R e p _ N P V present value of replacement cost of equipment
C S a l _ N P V present worth of the components’ salvage value
C T P V net present value of the costs of all the components
D i f f diffused solar radiation (kWh/m2/day)
E p total energy produced (MWh)
F P V roof view factor to PV front
F P V _ b roof view factor to PV back
F s k y roof view factor to sky
F a i r roof view factor to air
G T solar irradiance on the plane of PV arrays
G T n solar irradiance for which T c n is defined
h c convection coefficient (W/m2·K)
jinflation rate (%)
Llife of the component
nnumber of replacements of a component
Nlifetime of the project (years)
q a i r heat flux component due to air radiation exchange (W/m2)
q a i r   c o n v     convection flux from outside air (W/m2)
q H F heat flux into the roof of building (W/m2)
q L W R longwave radiation flux due to the surroundings (W/m2)
q s k y heat flux component due to sky radiation exchange (W/m2)
q S W R heat flux due to solar radiation (W/m2)
rinterest rate
T a air temperature (°C)
T a n ambient temperature at which T c n is defined
T c PV cell temperature (°C)
T c n nominal operating cell temperature
T c , S T C PV cell temperature at standard test conditions (°C)
T P V PV panel surface temperature (°C)
T P V _ b PV panel back side temperature
T R S roof surface temperature (°C)
T s k y sky temperature (°C)
kWdcDC power output in kW
α roof surface albedo
α a PV array solar absorptance (%)
α p temperature coefficient of power (%)
ε emissivity of the surface
η m p _ S T C maximum power point efficiency at STC
η p c power conditioning efficiency (%)
η P V PV generation efficiency (%)
η r reference module efficiency (%)
σ Stefan–Boltzmann constant (W/m2.K4)
τ PV array solar transmittance (%)

Abbreviations

CCcapital cost
CEMUCollege of Engineering at Majmaah University
CUFcapacity utilization factor
DHIdiffuse horizontal irradiance
DNIdirect normal irradiance
EPCengineering, procurement and construction
GHIglobal horizontal irradiance
GHGgreenhouse gas
LCoElevelized cost of energy
POAplane of PV array
PVphotovoltaic
STCstandard test conditions

References

  1. Wu, P.; Ma, X.; Ji, J.; Ma, Y. Review on life cycle assessment of energy payback of solar photovoltaic systems and a case study. Energy Procedia 2017, 105, 68–74. [Google Scholar] [CrossRef]
  2. Peng, J.; Lu, L. Investigation on the development potential of rooftop PV system in Hong Kong and its environmental benefits. Renew. Sustain. Energy Rev. 2013, 27, 149–162. [Google Scholar] [CrossRef]
  3. Rezk, H.; Alghassab, M.; Ziedan, H.A. An Optimal Sizing of Stand-Alone Hybrid PV-Fuel Cell-Battery to Desalinate Seawater at Saudi NEOM City. Processes 2020, 8, 382. [Google Scholar] [CrossRef] [Green Version]
  4. Bhatti, A.R.; Salam, Z.; Sultana, B.; Rasheed, N.; Awan, A.B.; Sultana, U.; Younas, M. Optimized sizing of photovoltaic grid-connected electric vehicle charging system using particle swarm optimization. Int. J. Energy Res. 2019, 43, 500–522. [Google Scholar] [CrossRef]
  5. Afzaal, M.U.; Sajjad, I.A.; Awan, A.B.; Paracha, K.N.; Khan, M.F.N.; Bhatti, A.R.; Zubair, M.; Rehman, W.u.; Amin, S.; Haroon, S.S.; et al. Probabilistic generation model of solar irradiance for grid connected photovoltaic systems using weibull distribution. Sustainability 2020, 12, 2241. [Google Scholar] [CrossRef] [Green Version]
  6. Suárez-García, A.; Fariña, E.A.; Álvarez-Feijoo, M.; González-Peña, D.; Alonso-Tristán, C.; Díez-Mediavilla, M. Estimation of photovoltaic potential for electricity self-sufficiency: A study case of military facilities in northwest Spain. J. Renew. Sustain. Energy 2017, 9, 053503. [Google Scholar] [CrossRef] [Green Version]
  7. Zubair, M.; Awan, A.B.; Praveen, R.P.; Abdulbaseer, M.; Praveen, R.P.; Abdulbaseer, M. Solar energy export prospects of the Kingdom of Saudi Arabia. J. Renew. Sustain. Energy 2019, 11, 045902. [Google Scholar] [CrossRef]
  8. Elshurafa, A.M.; Alsubaie, A.M.; Alabduljabbar, A.A.; Al-hsaien, S.A. Solar PV on mosque rooftops: Results from a pilot study in Saudi Arabia. J. Build. Eng. 2019, 25, 100809. [Google Scholar] [CrossRef]
  9. Appavou, F.; Brown, A.; Epp, B.; Murdock, H.E.; Skeen, J. Renewables 2019 Global Status Report; REN21: Paris, France, 2019. [Google Scholar]
  10. Muteri, V.; Cellura, M.; Curto, D.; Franzitta, V.; Longo, S.; Mistretta, M.; Parisi, M.L. Review on Life Cycle Assessment of Solar Photovoltaic Panels. Energies 2020, 13, 252. [Google Scholar] [CrossRef] [Green Version]
  11. Byrne, J.; Taminiau, J.; Kurdgelashvili, L.; Nam, K. A review of the solar city concept and methods to assess rooftop solar electric potential, with an illustrative application to the city of Seoul. Renew. Sustain. Energy Rev. 2015, 41, 830–844. [Google Scholar] [CrossRef]
  12. Romero-lankao, P.; Dodman, D. Cities in transition: Transforming urban centers from hotbeds of GHG emissions and vulnerability to seedbeds of sustainability and resilience Introduction and Editorial overview. Curr. Opin. Environ. Sustain. 2011, 3, 113–120. [Google Scholar] [CrossRef]
  13. Byrne, J.; Hughes, K.; Wang, Y. Can Cities Sustain Life in the Greenhouse? Bull. Sci. Technol. Soc. 2006, 26, 84–95. [Google Scholar] [CrossRef]
  14. Huang, L.; Zheng, R. Energy and Economic Performance of Solar Cooling Systems in the Hot-Summer and Cold-Winter Zone. Buildings 2018, 8, 37. [Google Scholar] [CrossRef] [Green Version]
  15. EIA. World Energy Statistics; OECD Publishing: Paris, France, 2016.
  16. EIA. The Annual Energy Review 2006; Energy Information Administration (EIA): Washington, DC, USA, 2006.
  17. Ramli, M.A.M.; Twaha, S.; Alghamdi, A.U. Energy production potential and economic viability of grid-connected wind/PV systems at Saudi Arabian coastal areas. J. Renew. Sustain. Energy 2017, 9, 065910. [Google Scholar] [CrossRef]
  18. Awan, A.B.; Zubair, M.; Praveen, R.P.; Abukhalil, A.G. Solar Energy Resource Analysis and Evaluation of Photovoltaic System Performance in Various Regions of Saudi Arabia. Sustainability 2018, 10, 1129. [Google Scholar] [CrossRef] [Green Version]
  19. Prieto, A.; Knaack, U.; Auer, T.; Klein, T. Passive cooling & climate responsive façade design Exploring the limits of passive cooling strategies to improve the performance of commercial buildings in warm climates. Energy Build. 2018, 175, 30–47. [Google Scholar] [CrossRef]
  20. Asif, M. Growth and sustainability trends in the buildings sector in the GCC region with particular reference to the KSA and UAE. Renew. Sustain. Energy Rev. 2016, 55, 1267–1273. [Google Scholar] [CrossRef]
  21. Shaahid, S.M.; Elhadidy, M.A. Economic analysis of hybrid photovoltaic-diesel-battery power systems for residential loads in hot regions-A step to clean future. Renew. Sustain. Energy Rev. 2008, 12, 488–503. [Google Scholar] [CrossRef]
  22. Machete, R.; Paula, A. The use of 3D GIS to analyse the influence of urban context on buildings’ solar energy potential. Energy Build. 2018, 177, 290–302. [Google Scholar] [CrossRef]
  23. Piyatadsananon, P. Spatial factors consideration in site selection of ground-mounted PV power plants. Energy Procedia 2016, 100, 78–85. [Google Scholar] [CrossRef] [Green Version]
  24. Kazem, H.A.; Albadi, M.H.; Al-Waeli, A.H.A.; Al-Busaidi, A.H.; Chaichan, M.T. Techno-economic feasibility analysis of 1MW photovoltaic grid connected system in Oman. Case Stud. Therm. Eng. 2017, 10, 131–141. [Google Scholar] [CrossRef]
  25. Weniger, J.; Tjaden, T.; Quaschning, V. Sizing of residential PV battery systems. Energy Procedia 2014, 46, 78–87. [Google Scholar] [CrossRef] [Green Version]
  26. Tarigan, E.; Djuwari, D.; Kartikasari, F.D. Techno-economic Simulation of a Grid-connected PV System Design as Specifically Applied to Residential in Surabaya, Indonesia. Energy Procedia 2015, 65, 90–99. [Google Scholar] [CrossRef] [Green Version]
  27. Rehman, S.; Ahmed, M.A.; Mohamed, M.H.; Al-Sulaiman, F.A. Feasibility study of the grid connected 10 MW installed capacity PV power plants in Saudi Arabia. Renew. Sustain. Energy Rev. 2017, 80, 319–329. [Google Scholar] [CrossRef]
  28. Ramli, M.A.M.; Hiendro, A.; Bouchekara, H.R.E.H. Performance analysis of hybrid PV/diesel energy system in western region of Saudi Arabia. Int. J. Photoenergy 2014, 2014, 1–10. [Google Scholar] [CrossRef]
  29. Almarshoud, A.F. Technical and Economic Performance of 1MW Grid-connected PV system in Saudi Arabia. Int. J. Eng. Res. Appl. 2017, 7, 9–17. [Google Scholar] [CrossRef]
  30. EL-Shimy, M. Viability analysis of PV power plants in Egypt. Renew. Energy 2009, 34, 2187–2196. [Google Scholar] [CrossRef]
  31. Cronemberger, J.; Caama, E.; Vega, S. Assessing the solar irradiation potential for solar photovoltaic applications in buildings at low latitudes—Making the case for Brazil. Energy Build. 2012, 55, 264–272. [Google Scholar] [CrossRef] [Green Version]
  32. Zubair, M.; Ghuffar, S.; Shoaib, M.; Bilal Awan, A.; Bhatti, A.R. Assessment of PV Capabilities in Urban Environments, Case study of Islamabad, Pakistan. J. Sol. Energy Eng. 2020, 142, 061006. [Google Scholar] [CrossRef]
  33. Mandalaki, M.; Papantoniou, S.; Tsoutsos, T. Assessment of energy production from photovoltaic modules integrated in typical shading devices. Sustain. Cities Soc. 2014, 10, 222–231. [Google Scholar] [CrossRef]
  34. Mandalaki, M.; Zervas, K.; Tsoutsos, T.; Vazakas, A. Assessment of fixed shading devices with integrated PV for efficient energy use. Sol. Energy 2012, 86, 2561–2575. [Google Scholar] [CrossRef]
  35. Assouline, D.; Mohajeri, N.; Scartezzini, J. Large-scale rooftop solar photovoltaic technical potential estimation using Random Forests. Appl. Energy 2018, 217, 189–211. [Google Scholar] [CrossRef]
  36. Shukla, A.K.; Sudhakar, K.; Baredar, P. Design, simulation and economic analysis of standalone roof top solar PV system in India. Sol. Energy 2016, 136, 437–449. [Google Scholar] [CrossRef]
  37. Kumar, N.M.; Gupta, R.P.; Mathew, M.; Jayakumar, A.; Singh, N.K. Performance, energy loss, and degradation prediction of roof-integrated crystalline solar PV system installed in Northern India. Case Stud. Therm. Eng. 2019, 13, 100409. [Google Scholar] [CrossRef]
  38. Yadav, S.K.; Bajpai, U. Performance evaluation of a rooftop solar photovoltaic power plant in Northern India. Energy Sustain. Dev. 2018, 43, 130–138. [Google Scholar] [CrossRef]
  39. Zubair, M.; Awan, A.B.; Abo-khalil, A.G. NPC Based Design Optimization for a Net Zero Office Building in Hot Climates with PV Panels as Shading Device. Energies 2018, 11, 1391. [Google Scholar] [CrossRef] [Green Version]
  40. Akpolat, A.N.; Dursun, E.; Kuzucuoğlu, A.E.; Yang, Y.; Blaabjerg, F.; Baba, A.F. Performance analysis of a Grid-connected rooftop solar photovoltaic system. Electron 2019, 8, 905. [Google Scholar] [CrossRef] [Green Version]
  41. Zubair, M.; Awan, A.B.; RP, P. Analysis of photovoltaic arrays efficiency for reduction of building cooling load in hot climates. Build. Serv. Eng. Res. Technol. 2018, 39, 733–748. [Google Scholar] [CrossRef]
  42. Dondariya, C.; Porwal, D.; Awasthi, A.; Shukla, A.K.; Sudhakar, K.; Murali, M.M.; Bhimte, A. Performance simulation of grid-connected rooftop solar PV system for small households: A case study of Ujjain, India. Energy Rep. 2018, 4, 546–553. [Google Scholar] [CrossRef]
  43. Imam, A.A.; Al-Turki, Y.A.; Sreerama Kumar, R. Techno-economic feasibility assessment of grid-connected PV systems for residential buildings in Saudi Arabia-A case study. Sustainability 2020, 12, 262. [Google Scholar] [CrossRef] [Green Version]
  44. Awan, A.B.; Zubair, M.; Praveen, R.P.; Bhatti, A.R. Design and comparative analysis of photovoltaic and parabolic trough based CSP plants. Sol. Energy 2019, 183, 551–565. [Google Scholar] [CrossRef]
  45. Canadian Solar CS6X-350M-FG. Available online: http://www.solardesigntool.com/components/module-panel-solar/Canadian-Solar/4485/CS6X-350P-FG-1500/specification-data-sheet.html (accessed on 25 February 2020).
  46. Bhandari, B.; Poudel, S.R.; Lee, K.-T.; Ahn, S.-H. Mathematical modeling of hybrid renewable energy system: A review on small hydro-solar-wind power generation. Int. J. Precis. Eng. Manuf. Technol. 2014, 1, 157–173. [Google Scholar] [CrossRef]
  47. Awan, A.B.; Bhatti, A.R.; Zubair, M.; Khalil, A.G.A.; Ahmed, G.; Sidhu, S. Performance analysis of various hybrid renewable energy systems using battery, hydrogen, and pumped hydro—Based storage units. Int. J. Energy Res. 2019, 43, 6296–6321. [Google Scholar] [CrossRef]
  48. Awan, A.B. Performance analysis and optimization of a hybrid renewable energy system for sustainable NEOM city in Saudi Arabia. J. Renew. Sustain. Energy 2019, 11, 025905. [Google Scholar] [CrossRef]
  49. HOMER Hybrid Optimization Model for Electric Renewable. Available online: https://www.homerenergy.com/products/pro/docs/latest/how_homer_calculates_the_pv_cell_temperature.html (accessed on 25 June 2020).
  50. Awan, A.B. Optimization and techno-economic assessment of rooftop photovoltaic system. J. Renew. Sustain. Energy 2019, 11, 033501. [Google Scholar] [CrossRef]
  51. NREL EnergyPlus Engineering Reference. Available online: https://energyplus.net/sites/all/modules/custom/nrel_custom/pdfs/pdfs_v8.9.0/EngineeringReference.pdf (accessed on 5 June 2020).
  52. Peng, C.; Yang, J. The Effect of Photovoltaic Panels on the Rooftop Temperature in the EnergyPlus Simulation Environment. Int. J. Photoenergy 2016, 2016, 1–12. [Google Scholar] [CrossRef] [Green Version]
  53. Davis, M.W.; Fanney, A.H.; Dougherty, B.P. Prediction of building integrated photovoltaic cell temperatures. J. Sol. Energy Eng. Trans. ASME 2001, 123, 200–210. [Google Scholar] [CrossRef]
  54. Wang, D.; Qi, T.; Liu, Y.; Wang, Y.; Fan, J.; Wang, Y.; Du, H. A method for evaluating both shading and power generation effects of rooftop solar PV panels for different climate zones of China. Sol. Energy 2020, 205, 432–445. [Google Scholar] [CrossRef]
  55. Maor, T.; Appelbaum, J. View factors of photovoltaic collector systems. Sol. Energy 2012, 86, 1701–1708. [Google Scholar] [CrossRef]
  56. Simpson, J.R.; McPherson, E.G. The effects of roof albedo modification on cooling loads of scale model residences in Tucson, Arizona. Energy Build. 1997, 25, 127–137. [Google Scholar] [CrossRef]
  57. Lazou, A.A.; Papatsoris, A.D. Economics of photovoltaic stand-alone residential households: A case study for various European and Mediterranean locations. Sol. Energy Mater. Sol. Cells 2000, 62, 411–427. [Google Scholar] [CrossRef]
  58. Maleki, A.; Ameri, M.; Keynia, F. Scrutiny of multifarious particle swarm optimization for finding the optimal size of a PV/wind/battery hybrid system. Renew. Energy 2015, 80, 552–563. [Google Scholar] [CrossRef]
  59. González, A.; Riba, J.R.; Rius, A. Optimal sizing of a hybrid grid-connected photovoltaic and wind power system. Appl. Energy 2015, 154, 752–762. [Google Scholar] [CrossRef] [Green Version]
  60. Gilman, P. SAM Photovoltaic Model Technical Reference; National Renewable Energy Laboratory: Golden, CO, USA, 2015; pp. 1–63. [Google Scholar]
  61. Saudi Electricity Company. Available online: https://www.se.com.sa/en-us/customers/Pages/TariffRates.aspx (accessed on 30 June 2020).
  62. Awan, A.B.; Zubair, M.; Chandra Mouli, K.V.V. Design, optimization and performance comparison of solar tower and photovoltaic power plants. Energy 2020, 199, 117450. [Google Scholar] [CrossRef]
Figure 1. Daily average global horizontal irradiance (GHI), daily average and daytime average temperatures and load profile.
Energies 13 03639 g001
Figure 2. Layout of rooftop PV system for College of Engineering at Majmaah University (CEMU) building’s roof at interrow distance of 0.5 m.
Energies 13 03639 g002
Figure 3. Layout view factor of roof to sky and front side of PV panel.
Energies 13 03639 g003
Figure 4. Roof surface temperatures without and with rooftop PVs at different interrow distances. (a) Inside. (b) Outside.
Energies 13 03639 g004
Figure 5. Parallel tilted PV modules facing sun and their shading caused by tilt angle.
Energies 13 03639 g005
Figure 6. Diffuse shading at various interrow distances.
Energies 13 03639 g006
Figure 7. Energy yield and levelized cost of energy (LCoE) of the ground-mounted PV configuration.
Energies 13 03639 g007
Figure 8. Energy yields and LCoE for rooftop PV configuration.
Energies 13 03639 g008
Figure 9. LCoE of ground-mounted and rooftop PV configurations at various interrow distances.
Energies 13 03639 g009
Figure 10. Payback periods of ground-mounted and rooftop PV configurations at various interrow distances.
Energies 13 03639 g010
Figure 11. Energy output at various interrow distances.
Energies 13 03639 g011
Figure 12. Annual and cumulative energy comparison. (a) Optimized rooftop vs. ground-mounted PV. (b) Optimized ground-mounted vs. rooftop PV.
Energies 13 03639 g012
Figure 13. Capacity utilization factor (CUF) of the ground-mounted and rooftop PV systems.
Energies 13 03639 g013
Table 1. Monthly tilt angles for optimal performance at Majmaah. Adopted from [44] (License Number: 486659005457).
JanFebMarAprMayJunJulAugSeptOctNovDec
51°43°29°13°23°39°48°53°
Table 2. PVmodule characteristics [45].
ParameterValue
STC power rating350 W
Module peak efficiency17.93%
Temperature coefficient of power−0.39%/°C
Nominal operating cell temperature43 °C
Maximum power current (Imp)9.21 A
Maximum power voltage (Vmp)38.1 V
Module Length1.968 m
Module Width0.992 m
Table 3. Design summary.
Distance0.5 m1.0 m1.5 m2.0 m2.5 m3.0 m3.5 m4.0 m
Parameters
Total number of PV modules1768148012071054918816748680
Modules per string1717171717171717
Number strings10487716254484440
Total area of PV modules3451 m22787 m22356 m22057 m21792 m21593 m21460 m21327 m2
Inverter capacity60 kW60 kW60 kW60 kW60 kW60 kW60 kW60 kW
Number of inverters87665554
Table 4. Parameters of building.
ParameterValue
Population density inside the top floor of the building5 people/100 m2
Thermostat setting of the cooling loads25 °C
Thermostat setting of heating loads20 °C
Electrical equipment load power density11 W/m2
Lighting load power density11 W/m2
Windows characteristics
Exterior layer (clear)3 mm
Air gap13 mm
Interior layer (clear)3 mm
Roof characteristics (exterior)
Solar reflectance0.3
Outer layer—concrete 100 mm M11
Specific heat840 J/kg·K
R-value0.2 K·m2/W
2nd layer—ceiling airspace resistance
R-value0.2 K·m2/W
3rd layer—F16 acoustic tile
Specific heat590 J/kg·K
R-value0.32 K·m2/W
Roof characteristics (Interior)
Outer layer—concrete 100 mm M11
2nd layer—ceiling airspace resistance
3rd layer—F16 acoustic tile
Table 5. Cooling energy requirement and saving at various interrow distances of PV modules.
Interrow Spacing of PV ArraysCooling Energy Requirement (kWh)Cooling Energy Saving (kWh)Percentage Saving (%)
0.5 m728,271136,95515.83
1.0 m751,785113,44013.10
1.5 m763,171102,05411.79
2.0 m777,29487,93110.16
2.5 m787,67977,5478.96
3.0 m797,79767,4287.79
3.5 m808,96256,2646.50
4.0 m819,50945,6175.27
Without rooftop PV865,22600
Table 6. Economic parameters of the PV system [44].
ParameterCost (Ground-Mounted PV)Cost (Rooftop PV)
PV module450 US$/kWdc450 US$/kWdc
Inverter130 US$/kWdc130 US$/kWdc
Labor150 US$/kWdc200 US$/kWdc
Balance of system100 US$/kWdc100 US$/kWdc
Land for ground-mounted PV30,000 US$/acre-
O&M costs for ground-mounted PV10 US$/kW/year20 US$/kW/year
Sales tax5.0%5.0%

