Article

Design, Development, and Performance of a 10 kW Polymer Exchange Membrane Fuel Cell Stack as Part of a Hybrid Power Source Designed to Supply a Motor Glider

1
Faculty of Energy and Fuels, AGH University of Science and Technology, Av. Mickiewicza 30, 30-059 Cracow, Poland
2
Faculty of Electrical Engineering Automatics, Computer Science and Biomedical Engineering, AGH University of Science and Technology, Av. Mickiewicza 30, 30-059 Cracow, Poland
3
Faculty of Mechanical Engineering and Robotics, AGH University of Science and Technology, Av. Mickiewicza 30, 30-059 Cracow, Poland
*
Author to whom correspondence should be addressed.
Energies 2020, 13(17), 4393; https://doi.org/10.3390/en13174393
Submission received: 16 July 2020 / Revised: 21 August 2020 / Accepted: 24 August 2020 / Published: 26 August 2020
(This article belongs to the Special Issue Fuel Cell Systems for Transportation Electrification)

Abstract

:
A 10 kW PEMFC (polymer exchange membrane fuel cell) stack consisting of two 5 kW modules, (A) and (B), connected in series with a multi-function controller unit was constructed and tested. The electrical performance of the V-shaped PEMFC stack was investigated under constant and variable electrical load. It was found that the PEMFC stack was capable of supplying the required 10 kW of electrical power. An optimised purification process via ‘purge’ or humidification, implemented by means of a short-circuit unit (SCU) control strategy, enabled slightly improved performance. Online monitoring of the utilisation of the hydrogen system was developed and tested during the operation of the stack, especially under variable electrical load. The air-cooling subsystem consisting of a common channel connecting two 5 kW PEMFC modules and two cascade axial fans was designed, manufactured using 3D printing technology, and tested with respect to the electrical performance of the device. The dependence of total partial-pressure drop vs. ratio of air volumetric flow for the integrated PEMFC stack with cooling devices was also determined. An algorithm of stack operation involving thermal, humidity, and energy management was elaborated. The safety operation and fault diagnosis of the PEMFC stack was also tested.

Graphical Abstract

1. Introduction

The anticipated changes in climate have forced the aviation industry to reduce emissions. The application of fuel cell technology to electric aircraft propulsion is becoming a topic of great interest due to its undoubted advantages in limiting pollution from emissions and noise. Hydrogen–oxygen fuel cells, as power sources, offer a high level of efficiency in the direct conversion of hydrogen fuel into electricity [1,2]. The multifunctional integration of fuel cells into airplanes, involving the harvesting of byproducts such as water, heat, or oxygen-depleted exhaust air, enables these cells to perform vital processes such as de-icing, cabin air conditioning, water supply, or fire suppression in luggage compartments or fuel tanks. The application of fuel cells as a part of auxiliary power unit systems designed for aerospace has also been extensively developed in recent years [3,4]. In order to extend flight time, an increasing number of attempts are being made in the European Union and other countries to integrate fuel cells as components of hybrid power sources for supplying electric propulsion in small aircraft. The California-based firm Zero Avia has announced significant advances in developing a zero-emission hydrogen fuel cell electric powertrain for small aircraft aimed at decarbonising aviation and reducing operational costs for aircraft serving the regional flight sector. Many fuel cells companies have also been involved in the design and supply of fuel cell power modules for new lightweight aircraft and motor gliders [5,6,7,8]. The potential for and reliability of the application of fuel cells to electrical propulsion have also been confirmed by the results of test flights of transport aircraft powered by fuel cells within the Environmentally Friendly Inter City Aircraft powered by Fuel Cells (ENFICA-FC) project as well as for Antares-H2 flight tests carried out by Deutsches Zentrum für Luft und Raumfahrt (DLR Germany) [9,10]. Polymer exchange membrane fuel cells (PEMFCs), considered the most promising power sources for road and aviation transport applications, are known for their high values of power density, low operating temperatures, and rapid start-up periods. A PEMFC fuel cell stack can be designed and constructed in various ways. One option is dependent on the type of cooling medium. It was found that effective cooling is necessary for the safety and operational efficiency of high-powered PEMFC stacks [11,12]. The application of a liquid cooling system, compared to air cooling, enables more uniform temperature distribution. It was found that liquid cooling systems are more suitable because the heat transfer coefficients for liquid flow are much higher than those for air flow. The main drawbacks of liquid cooling include the great amount of power consumed by the accessory system, coolant degradation, and increases in the mass of overall system take-off weight [13,14]. In the case of an air-cooled PEMFC stack, a simple cooling system and devices characterised by low levels of power consumption can be implemented, although the resulting efficiency level may be lower than in devices using a liquid cooling medium. The air-cooling option is also attractive for PEMFC stacks designed for drones or light aircraft applications due to reduced space or weight requirements [15,16]. Open-cathode PEMFC stack architecture has become very popular for a wide power range, from 10 W to 10 kW. PEMFC stacks involving graphite as well as metallic bipolar plates are available on commercial markets dedicated to transport applications. The dynamic performance of a PEMFC stack is time-dependent, involving several typically transient processes: start-up, shutdown, and electrical load changes. The transient response to operating conditions is an indication of the complex interaction between electrical and physicochemical parameters and dynamic response. Temperature distribution, mass flow reagents (hydrogen, oxygen) inside the configuration, parameters of instantaneous pressure, and humidity levels are all very important factors in the response of PEMFC stacks. Fuel cell systems offer intriguing potential for power generation aboard wide-bodied aircraft. The byproducts of the on-board operation of fuel cells are water, heat, and oxygen-depleted air; these can be harnessed, resulting in savings in terms of resources and reductions in overall system take-off weight [17,18]. Experimental tests performed in a laboratory environment are necessary to establish crucial operating conditions for PEMFC stacks. The development of sensor elements for each subsystem of a PEMFC stack and the collection of related data are very important for the control strategy and construction design of a microcontroller unit [19,20]. Power sources involving PEMFC stacks can also be built from smaller units. The modular construction of fuel cell stacks using several lightweight PEMFC stacks―which are simpler in terms of construction and can be air-cooled more cheaply as opposed to a single stack, which is larger, heavier, and more complicated in terms of construction and thus must be liquid-cooled at greater costs―also yields additional benefits. The use of several modules offers simple scalability and flexible configuration of fuel cell stacks in terms of dimensions (spatial arrangements) as well as changes in electrical parameters. A 30 kW PEMFC stack constructed from three modules was tested in a long-distance Antares H2 in 2013 [10,21]. De Bernadinis et al. showed that in order to supply a DC electrical load with a significant power level, a multi-stack power source is required [22]. Candusso et al. analysed the topologies of a four-stack coupling which could be used as a power source for future applications. Fuel cell modules can be autonomously or serially coupled with their power converter and connected to the load. These modules can also be twin-coupled to the power converter prior to connection in order to increase voltage per module [23].
The aim of this paper was to present comprehensive results of the design and performance of an air-cooled 10 kW PEMFC stack consisting of two 5 kW modules connected in series as part of a prototype hybrid power source for a motor glider. Special emphasis was placed on determination of the impact of ambient conditions and of elaborated algorithms of purification and humidification processes on the electrical and thermal performance of the PEMFC stack. The potential for online control of all electrical parameters, hydrogen consumption, and temperature distribution by means of a specially elaborated microcontroller unit was also investigated and is discussed in the present paper.

2. Experimental Part

2.1. Description of the 10 kW PEMFC Stack along with the Balance of the Fuel Cell Power Plant

Specifications for the 10 kW PEMFC stack equipped with the balance of the fuel cell power plant, which was necessary for normal performance and security, are given in Figure 1. The components are denoted using numbers 1–20 as listed below:
Figure 1 presents the range of the different hydrogen partial pressures which can occur during storage of compressed gas in composite cylinders and during transmission through installation of the final supply of the V-shaped PEMFC stack: HP H2—high-pressure range for hydrogen installation (max 350 bar); MP H2—mid-pressure range (5 bar); and LP H2—low-pressure range (0.5 bar).
No. 1a,b. Composite cylinders, each with a capacity of 12 dm3, for the storage of compressed hydrogen (source: HES/Horizon, Singapore).
No. 2. Braided steel high-pressure gas line used to connect two composite bottles (Manta, Opole, Poland, product manufactured at our request and to our specifications).
No. 3. Hydrogen pressure reducer, HP-350 bar/LP-5 bar, with a shut-off valve and a quick connector for refuelling hydrogen aboard a motor glider using bottles (Manta, Opole, Poland, product manufactured at our request and to our specifications).
No. 4. AST20HA precision sensor monitoring the pressure of compressed hydrogen gas in composite tanks (A) and (B) (American Sensor Technologies (AST) Inc., Budd Lake, NJ, USA).
No. 5. Elaborated and manufactured monitoring system for hydrogen consumption during PEMFC stack performance or hydrogen storage in composite tanks (measurement of partial pressure of hydrogen PH2 and temperature T).
No. 6. Steel pipes for the transmission of gaseous hydrogen fuel in a gas installation (Rectus, Poland).
No. 7. EL-PRESS P-602CV digital electronic pressure controller (Bronkhorst High-Tech, Ruurlo, The Netherlands) aimed at stabilising partial pressure (PH2, ~0.5 bar) in accordance with the requirements of the PEMFC stack.
No. 8. Bleed ball valve for cleaning the hydrogen gas installation (Rectus, Poland).
No. 9. Hydrogen supply valve to modules (A) and (B) of the 10 kW PEMFC stack (2 pcs.) (SNS Pneumatic Components).
No. 10. Hydrogen purge valve from modules (A) and (B) of the 10 kW PEMFC stack (2 pcs.) (SNS Pneumatic Components).
No. 11. Hydrogen purge outlet from the PEMFC stack outside the fuselage.
No. 12. Elaborated and manufactured common air-cooling channel connecting two modules, (A) and (B), of the PEMFC stack (the authors’ own design, manufactured using 3D FDM printing technology: a TierTime Inspire D290 3D printer).
No. 13. Two-stage axial fan for cooling a V-type PEMFC stack (the authors’ own design, manufactured using 3D printing technology a TierTime Inspire D290 3D printer).
No. 14. Elaborated and manufactured PEMFC stack microcontroller connected to the motor glider’s on-board computer.
No. 15. Motor glider’s elaborated and manufactured on-board computer.
No. 16. Master H2 hydrogen detector signalling a possible hydrogen fuel leak to the on-board computer.
No. 17. Speed controller for a two-stage axial fan.
No. 18. Electrical power supply unit for the manufactured two-stage axial fan.
No. 19a,b. Fuel cell modules A and B, respectively, for the elaborated and constructed V-shaped 10 kW PEMFC stack.
No. 20. The protective air cassette filter (SFM filtry Łuczak, Stara Wies c. Nadarzyn, Poland).
A project description for the entire concept of the electrical motor glider, complete with technical data (general layout, dimensions, carbon fibers/epoxy airframe specifications, design of the electric propulsion system and preliminary test of propulsion system involving V-type PEMFC stack was included in the previous paper [24].

2.2. Electrical Construction of the Prototype 10 kW V-Shaped PEMFC Stack

A complete system based on a 10 kW PEMFC stack with a microcontroller unit was designed and constructed as a component of hybrid power sources (a 10 kW PEMFC plus a 40 kW battery) to supply a motor glider. (The stack was constructed from two 5 kW modules connected in series (Figure 2). A single membrane electrode assembly (MEA) and graphite bipolar plates were used to construct the stack. The active area of a single PEMFC membrane is ~140 cm2. The thickness of a Nafion-based membrane is approximately 30 μm. The total mass of completed V-type PEMFC stack with the balance of the fuel cell power plant (Figure 1) did not exceed ~65 kg.
The output of the open-circuit voltage was designed to equal 200–240 V. The maximum power output Pmax was expected to reach 10 kW within a range of 100–140 V, with the current falling within a range of 70–75 A. The 10 kW PEMFC stack was compacted in a V shape with a common cooling system.
The air outlet channel and a two-stage fan were elaborated and manufactured using 3D FDM printing technology. Additional components such as the above that might be needed to operate the stack collectively known as the balance of fuel cell power plant (BOP) systems were also elaborated and integrated. The main subsystems included a hydrogen/air supply system, a cooling system, and a power conditioning system.
In the 10 kW V-type PEMFC stack, Pt1000 temperature sensors were randomly installed in modules (A) and (B). Additionally, type J secondary sensors were also installed in locations similar to those of the Pt1000 sensors outside the stack in order to enable comparisons between measurements.

2.3. Design and Construction of the Air Supply and Cooling System

In the proposed PEMFC stack, air is necessary to supply oxygen for cathode reduction reactions which occur on the cathode side of MEA membranes in the stack as well as to remove heat during stack operation. The main component of the air supply system is a common channel connected with a two-stage fan. The shape and dimensions of the channel were designed and optimised. The main factor considered crucial for PEMFC stack performance is air volume flow rate vs. total pressure drop during air flow (efficiency of cooling systems). Heat must be removed from fuel cells. Temperatures no higher than 65 °C must be maintained in all MEAs in modules (A) and (B) of the stack. A secondary factor involves the geometric dimensions (potential space) for installation of a cooling system of this type in the limited space of the fuselage. A model and the actual construction of a two-stage fan were elaborated. The design was executed by means of an integrated 1D/3D numerical procedure based on CFD simulations, used at the preliminary design stage to choose among competitive one or two-dimensional geometries and subsequently to test the generated three-dimensional geometries. Calculations concerning the range of the shape parameters, dimensions, and permissible loads of blades were carried out using Vista AFD software. Before beginning the elaboration of the final design and construction of the two-stage axial fan, measurements of the dependence of the drop in partial static pressure vs. volume of air flow were made on the installed system in the PEMFC stack.
The developed design model of the two-stage axial fan is shown in Figure 3. Most of the components were 3D printed. Most of the elements were manufactured using 3D printing technology via a TierTime Inspire D290 3D printer.

2.4. The Microcontroller Unit System for Management of the 10 kW PEMFC Stack and Algorithm of Signal Connection and PEMFC Stack Performance

A diagram of the Microcontroller Unit (MCU) System for Management of the 10 kW PEMFC stack is presented in Figure 4. As shown, the MCU controller, which steers the purge valves, on/off SCU, and air blower, contains a powerful STM32F4 processor, an analogue signal conditioning block, a power supply unit, and power amplifiers for valves and SCU control. The applied analogue input PH2 conveys information about the hydrogen pressure in the tank. Voltages U1 and U2, generated by the two PEMFC cells, and the currents I1 and I2 flowing through them are measured by voltage and Hall effect current transducers (with galvanic isolation), respectively. Cell temperatures are measured and monitored using Pt1000 sensors connected to a specialised active RTD interface that communicates with the processor using the Serial Peripheral Interface (SPI) protocol. The analogue signal conditioning block is responsible for adjusting the voltage values obtained from the sensors to a value within the range acceptable to the ADC converter incorporated into the STM32F4. Measured quantities are converted by this block into voltages within a range of 0 to 3.3 V. All recorded signals are sampled with a frequency of 1 kHz. Each of the units used to build the controller requires different power supply parameters. Therefore, the power block is used to generate additional voltages of +12, +5, and +3.3 V. The control algorithm running on the processor was built in the form of a finite-state machine (FSM) responsible for the safety of fuel cell operation, the implementation of start-and-stop procedures, and the control of cell parameters (SCU and purge pulses). The controller is also responsible for the implementation of security procedures related to the current parameters (temperature, voltage, and H2 pressure) of the stack.
The procedure for running a V-type PEMFC power source using the elaborated microcontroller unit is as follows. Once the on/off button is pressed (or information about starting the fuel cell power source is received via CAN bus), the controller starts a two-stage axial cooling fan by sending a pulse-width modulation (PWM) start signal to the blower’s speed controller. Then, once it has been determined that the cooling function is operating properly and that the fuel cell temperature is below the safe value of 70 °C, the hydrogen inlet solenoid valves to the two fuel cell modules (supply valves 1 and 2) are permanently opened until the fuel cell stack is turned off. Simultaneously, the hydrogen outlet solenoid valves (purge valves 1 and 2) are opened for 3 s to purge and remove gases in the anode spaces of the stack and to fill the spaces with hydrogen. Following the purging and supply of fresh hydrogen to the stack, voltage appears in both modules (yellow and grey curves in Figure 1), reaching a value of ca. 120 V for each module, corresponding to the open-circuit voltage (OCV). The controller measures the voltage and, upon determining that it is above 100 V, states that hydrogen has been supplied to the stack correctly and that no further purification of the stack is necessary. It then permits the next step of the start-up procedure to be taken. In the absence of voltage during the purification procedure, the controller reports a lack of hydrogen and turns off the stack. The controller’s next step during the start-up procedure is a sequence of 3 short-term, 10 ms SCU (system control unit) short circuits for each fuel cell module, shifted by 0.4 s relative to each other, in order to activate and humidify the stack.
Figure 5 presents the FSM algorithm managing the operation of a V-shaped PEMFC fuel cell stack consisting of two modules of fuel cells, A and B. In the time from t = 0 s to t = 19 s, the MCU performs the starting procedure for the stack; as of time t > 20 s, the MCU goes into control and steering mode for the duration of normal stack operation.
The MCU unit sends the following sequence of control signals during the actuation procedure:
After pressing the start button (or receiving the start signal via CAN bus):
  • At t = 1 s, the blower cooling the PEMFC stack starts and the implemented control algorithm regulates the rotation velocity in relation to stack temperature (Fan signal in Figure 4).
  • The PWM control signal, at a frequency of 50 Hz, is sent to the blower power controller (duration of the high state is changed within the range 0.8–2 ms).
  • At t = 4 s, all the valves are opened (valve1—hydrogen supply valve to module A; valve2—hydrogen purge valve from module A; valve3—hydrogen supply valve to module B; valve4—hydrogen purge valve from module B) in order to flush the anode space of the fuel cell stack and fill it with hydrogen.
  • Beginning at t = 8 s, three alternating opening (1 s) and closing (1 s) impulses of the flushing and cleaning valves (hydrogen purge valves: valve2 and valve4) are generated. During this time, the voltage of the stack is measured and checked. The procedure is continued as long as the voltage value is correct (over 100 VDC, signifying that hydrogen has filled the anode space of the fuel cell). Then, both of the abovementioned valves are closed and switched to normal close work mode.
  • In the next phase, beginning at t = 15 s, the controller performs the sequence of alternating, transient short circuits of the SCU1 and SCU2 circuits (the duration of a single SCU impulse is 45 ms with a break of 1.6 s between subsequent impulses) in order to activate and properly moisten the A and B modules of the stack.
  • If the voltage on both modules of the fuel cells stacks is still over 100 VDC (t = 19.4 s), the electromagnetic relay is switched on (the controller generates a high-level control signal—the Relay signal in Figure 4). In this way, an external load is connected to the fuel cell stack. The state machine of the control algorithm is switched to normal operating mode.
In normal operating mode, the controller starts valve2 and valve4 cyclically, every 10 s, to purify the anode space of the stack. Simultaneously, with a time offset of ca. 5 s in relation to the opening of valve2 and valve4, the SCU1 and SCU2 circuits are actuated. Attention should be paid to ensure that none of the impulses steering the outlet valves and SCUs overlap. The shift between successive control signals sent from the controller, valve2 → valve4 → SCU2 → SCU1, is set at 2.5 s in order to avoid their simultaneous occurrence and to ensure the proper sequence and time intervals between them.

2.5. Hydrogen Monitoring System throughout the Fuel System

The aim of the hydrogen monitoring system is to monitor online variation in hydrogen partial pressure in the composite tanks and potential leakage from the hydrogen installation. In the former case, measurement of hydrogen pressure pH2 in composite tanks is useful for predicting the duration of PEMFC stack operation with nominal power. The latter function provides accurate information about leakage of gaseous hydrogen from the fuel system or PEMFC stack. The hydrogen monitoring system has been implemented in the form of a distributed system. The hydrogen monitoring node and the main PEMFC controller are connected via a CAN bus link. In addition to hydrogen pressure, other CAN messages relating to important fuel cell parameters (max. temperature, voltages, PEMFC status) are exchanged between these two nodes. The hydrogen controller is responsible for measuring the temperature and pressure of the hydrogen supply system and for operating the LCD display presenting all relevant information. The presented measurement control structure, containing two nodes, enables a reduction in the CPU load of the main PEMFC controller.

2.6. Electrical Measurements of the Performance of the 10 kW PEMFC Stack

Based on the voltage (U)-current (I) curves, P-I dependences were determined. The U-I and P-I curves vs. time were measured using electronic loads (two parallel-connected high-power electronic loads (Chroma 63204, NDN, Warsaw, Poland). Variations in current (I) and voltage (U) during operation of the humidification implemented by the SCU system were measured using the oscilloscopic method (Rigol DS1062CA digital oscilloscope, Suzhou, China). Direct measurement of voltage was accomplished by means of probes equipped with an oscilloscope. In the case of current (I), measurements were performed indirectly. Current (I) was estimated to be equivalent to the voltage drop during short-circuit current flow through a 1000 A/100 mV current shunt. During operation of the PEMFC stack, total consumption of hydrogen was measured. Flow meters and pressure controllers were applied to determine total consumption of hydrogen. The amount of compressed hydrogen accumulated in the composite cylinders was monitored by AST2000H2 hydrogen pressure sensors (American Sensor Technologies, Inc., Budd Lake, NJ, USA). The hydrogen pressure supplied to the stack was monitored by an electronic pressure regulator (EL-PRESS digital electronic pressure controller, Bronkhorst High-Tech, Ruurlo, The Netherlands). Temperature distribution during the operation of the stack was monitored by Pt1000 resistance temperature sensors located inside PEMFC modules (1) and (2) in the stack. Signals from temperature measurement, on the basis of which the operation of cooling fans was monitored, were sent to the PEMFC controller. During the electric measurements, the energy consumption of the auxiliary devices was analysed, and the measurements monitored. Using the PowerLog 6S logger, the parameters (voltage, current, and power) of the fan system cooling the stack were recorded.

2.7. Measurements of the Efficiency of the Air-Cooling System

In order to determine flow characteristics, a test bench was prepared in compliance with PN-EN ISO 5801:2012. As shown in Figure 6, at the tube inlet, a louvre damper (1) controlled by means of a stepper motor was mounted along with a Delta Ohm HD48T thermohygrometer (2). The number (3) denotes a flow straightener assigned the task of normalising the velocity profile. Flow rate measurements were made using a Dwyer meter (4) and a Halstrup-Walcher P26 differential pressure transmitter. Pressure on the suction side was determined by means of a Voltcraft VPT-100 anemometer (6). The other elements of the test bench comprised two cascade axial fans (7), a Sentry ST723 digital tachometer (8), a speed regulator (9), and a data acquisition unit (12). The air properties were determined using a Comet D4130 digital thermohygrometer/barometer (5), whereas electrical measurements were made with a wattmeter (10), a voltmeter, and an ammeter (11). The details of the experimental setup for the described measurements were previously described in [25].

3. Results

3.1. Performance of a 10 kW PEMFC Stack under Constant Electrical Load

The behaviour of a PEMFC stack under constant and variable electrical load has a great effect on the safety and effectiveness of its operation as a component for a hybrid power source designed to supply a propulsion system. The open-cathode PEMFC stack concept was used to construct a 10 kW V-type PEMFC stack consisting of two series connected to two modules (A) and (B). According to the specifications of the project, ambient air was used for cooling as well as for the provision of oxygen for cathode electrochemical reduction. Air was supplied mainly by two cascade axial fans.
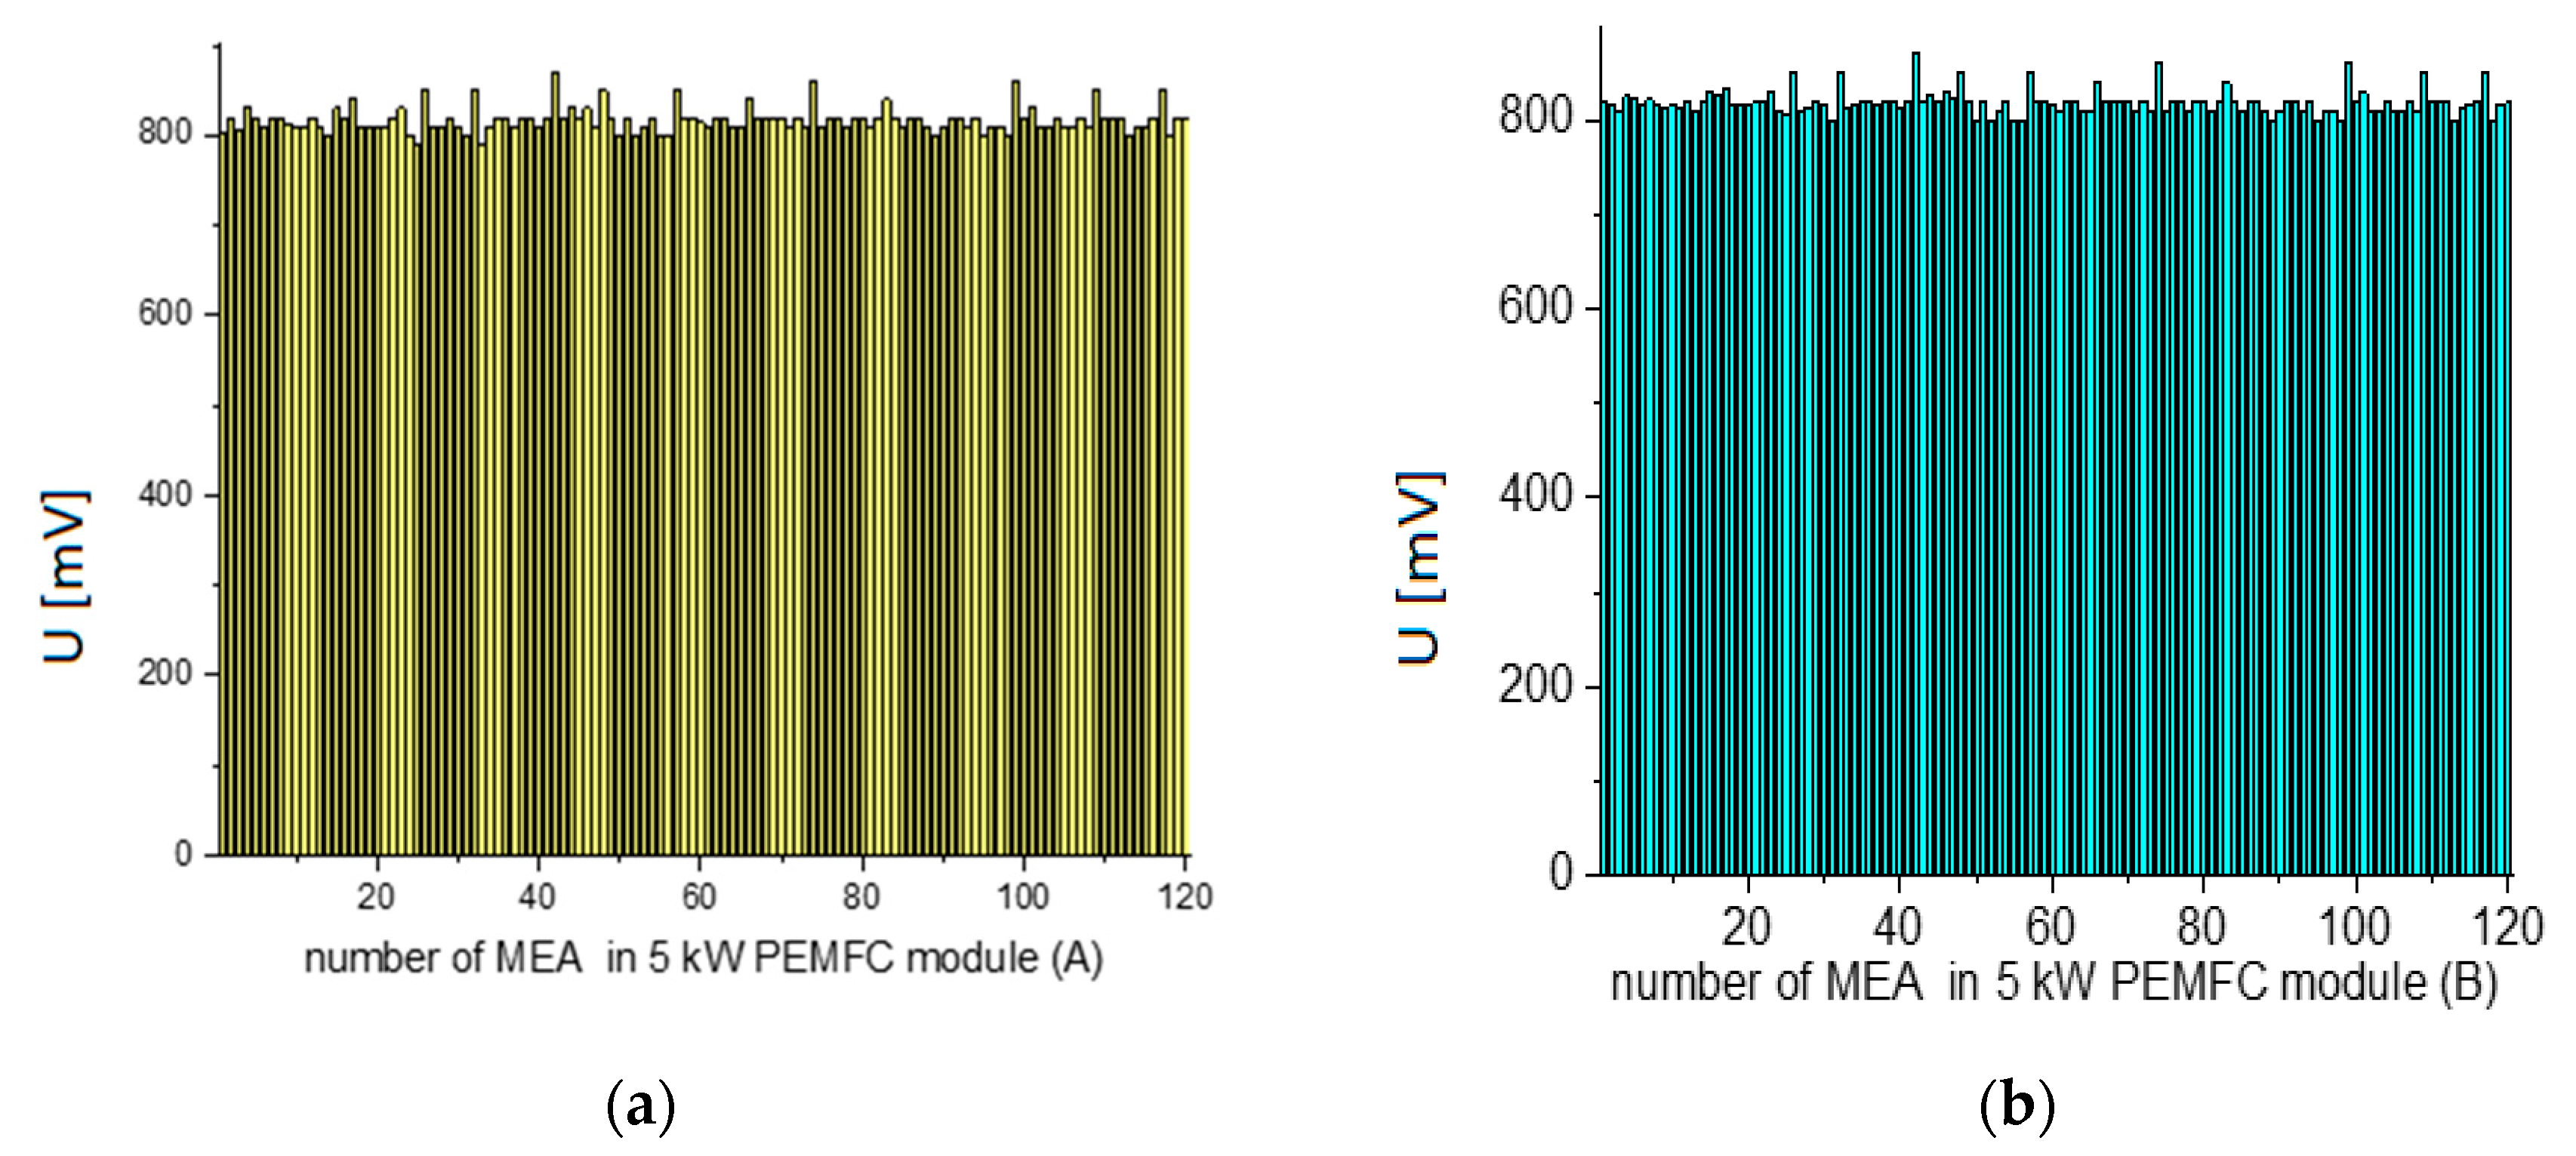
Figure 7a,b presents the distribution of the voltage recorded for single MEA fuel cells in the PEMFC assembled module (A) or (B). The electrical load 10 A was applied.
Based on analysis of Figure 7b, it can be concluded that all MEA PEMFCs operated randomly in all modules (A) or (B) under applied electrical load I = 10 A.
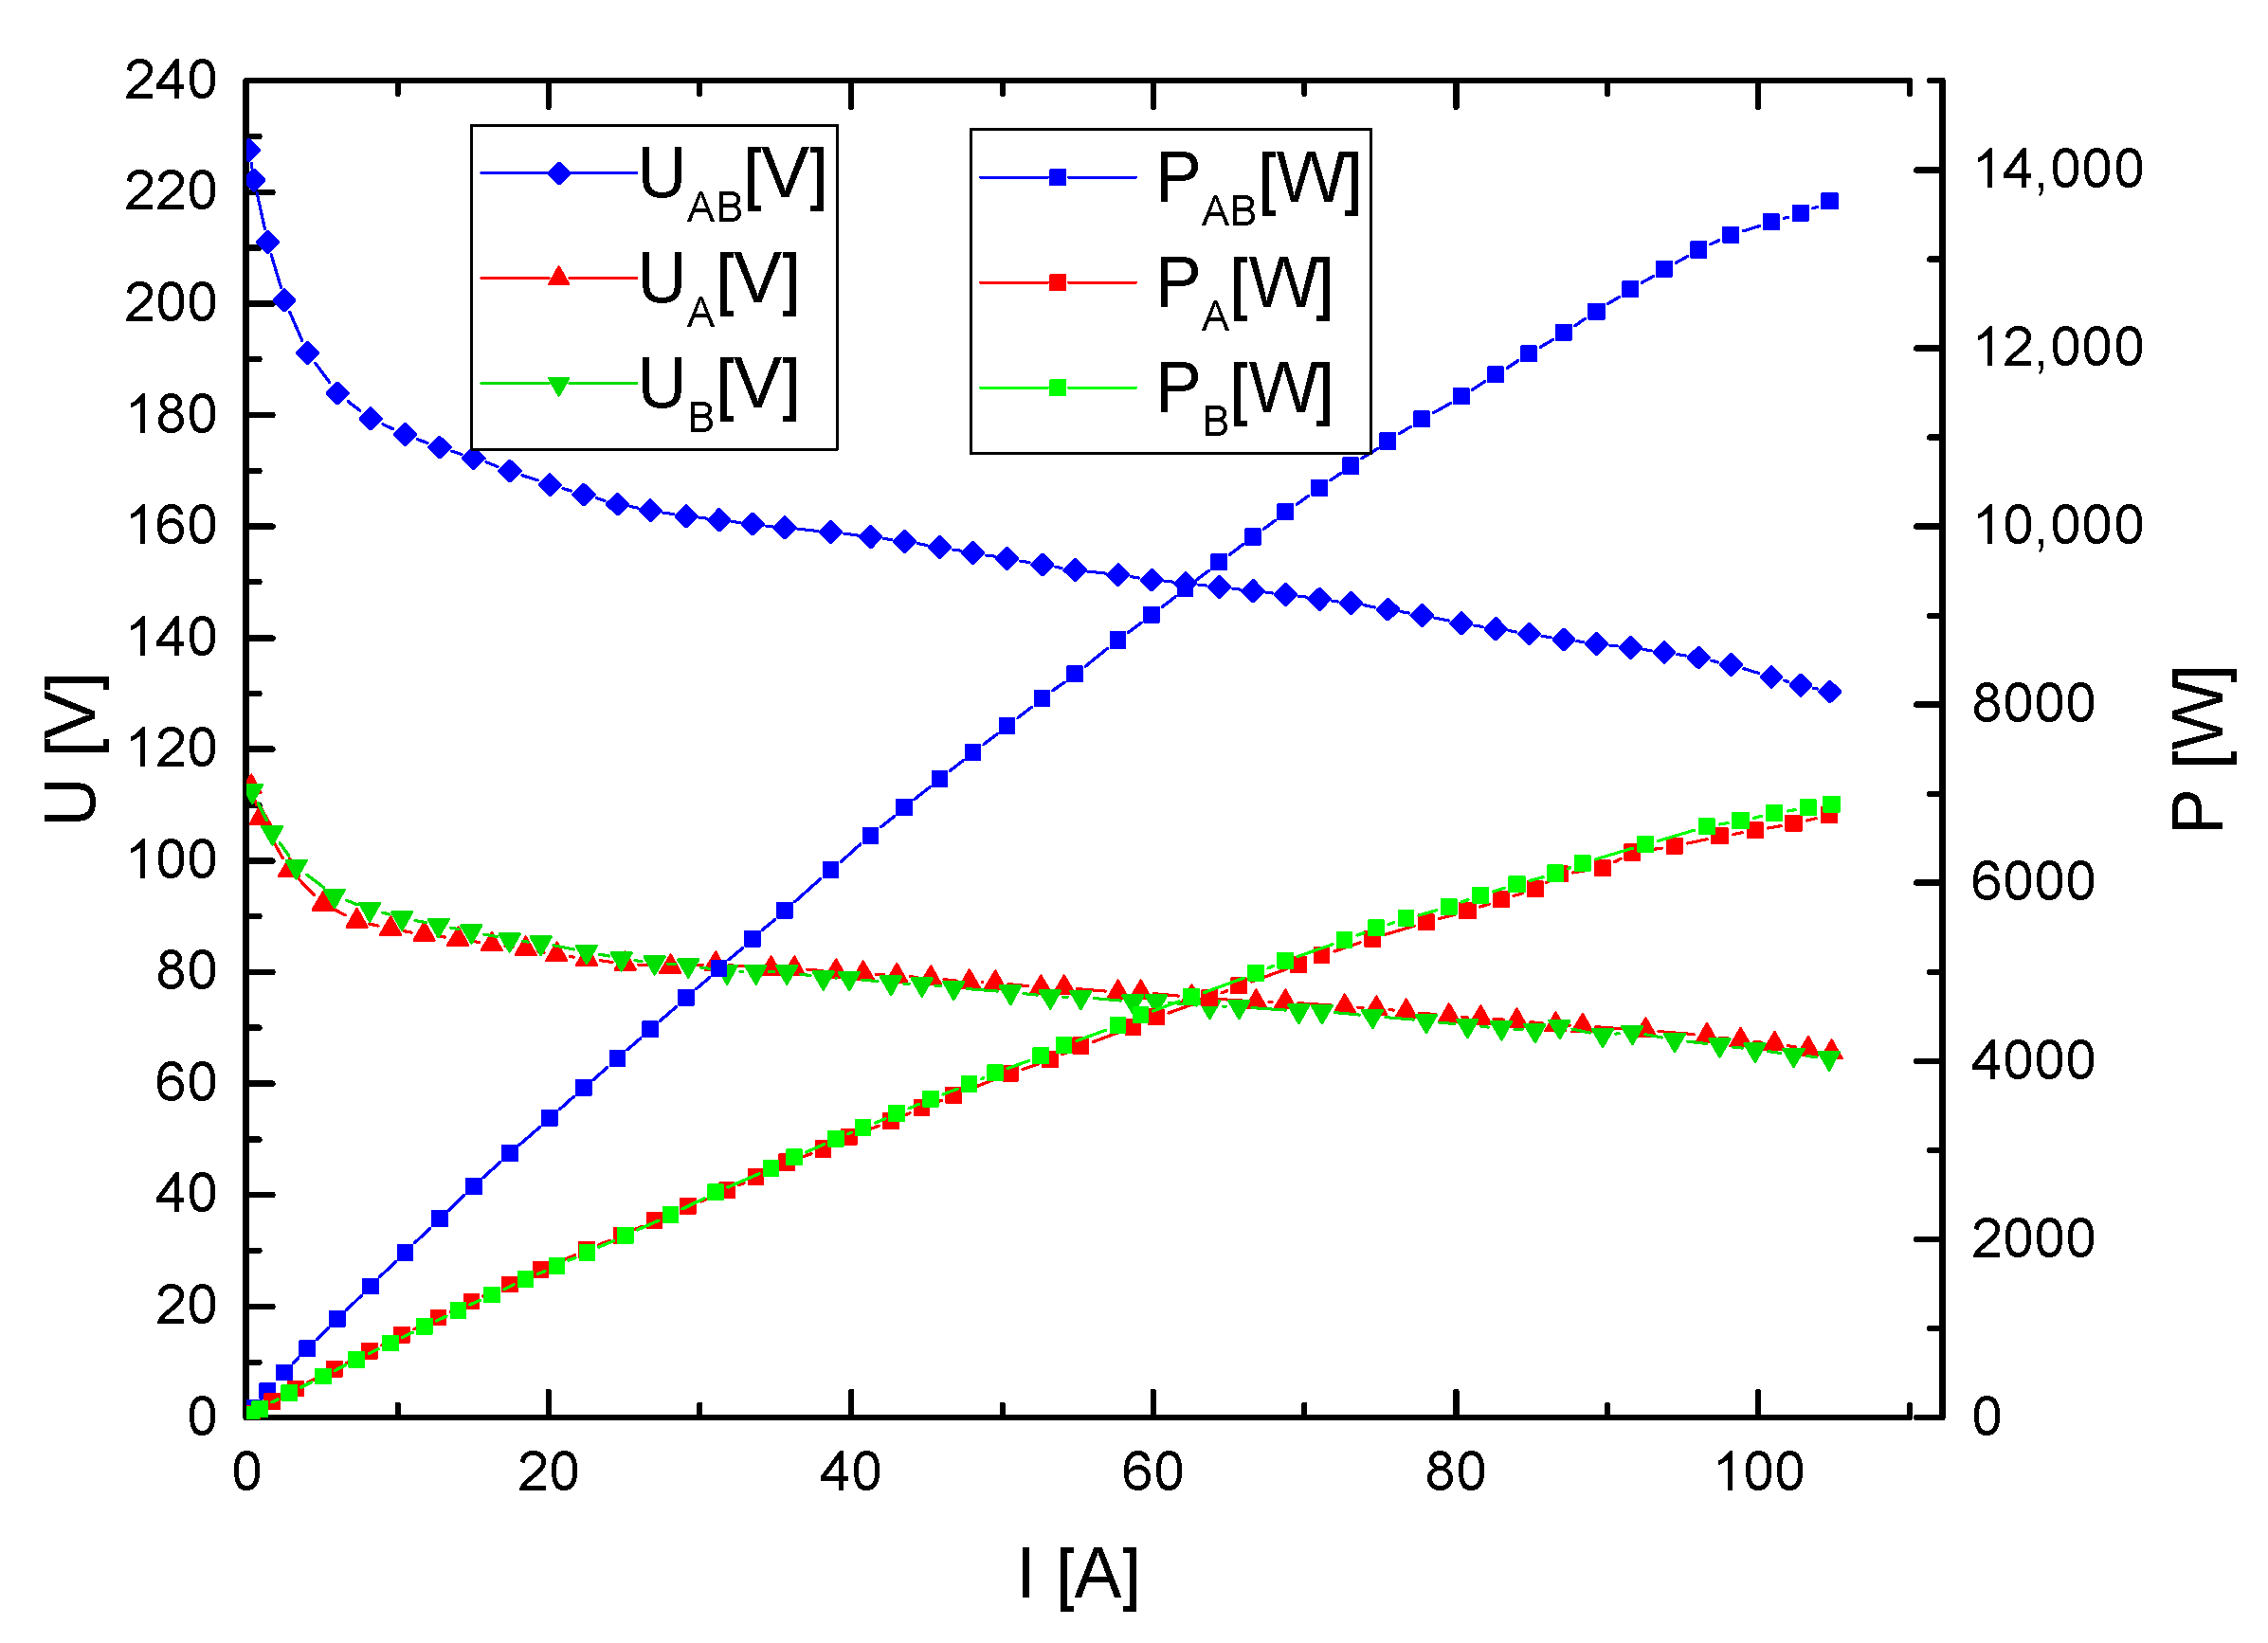
In the next tests (Figure 8), the U-I and P-I curves were recorded for module (A) or (B) and for the 10 kW PEMFC stack.
It was also found that no differences in electrical performance were observed for both modules used for construction of the V-type PEMFC stack. The analysis of these curves also indicated that PEMFC stack (A) and (B) exhibited slightly higher power than the assumed 5 kW. This fact allowed for a short-term application of an electrical load that may be slightly higher than 10 kW. Based on these results, the nominal power of PEMFC stack is established for 10 kW for continuous application in the PEMFC-based power source.
The boundary restrictions resulting from the installation of the device in the motor glider platform were also taken into consideration. The V-type PEMFC stack is to be installed in the fuselage in the immediate vicinity of the propeller [24].
The streamlined air produced by the rotation of the propeller can be also conducted into the area occupied by the stack. The air entering the cathode channels—which, in terms of temperature and humidity, cannot be controlled easily—exerts an impact on the electrical efficiency of the stack. Testing for aeronautical fuel cell applications in the first stage of the experiments was carried out in laboratory environments while taking into account restrictions arising from the installation of the device within the motor glider platform. The representative voltage (U)-current (I) and power (P)-current (I) dependencies, recorded in various ambient conditions, was a crucial element of analysis and provided data concerning the effect of variations in temperature on the performance of the PEMFC stack.
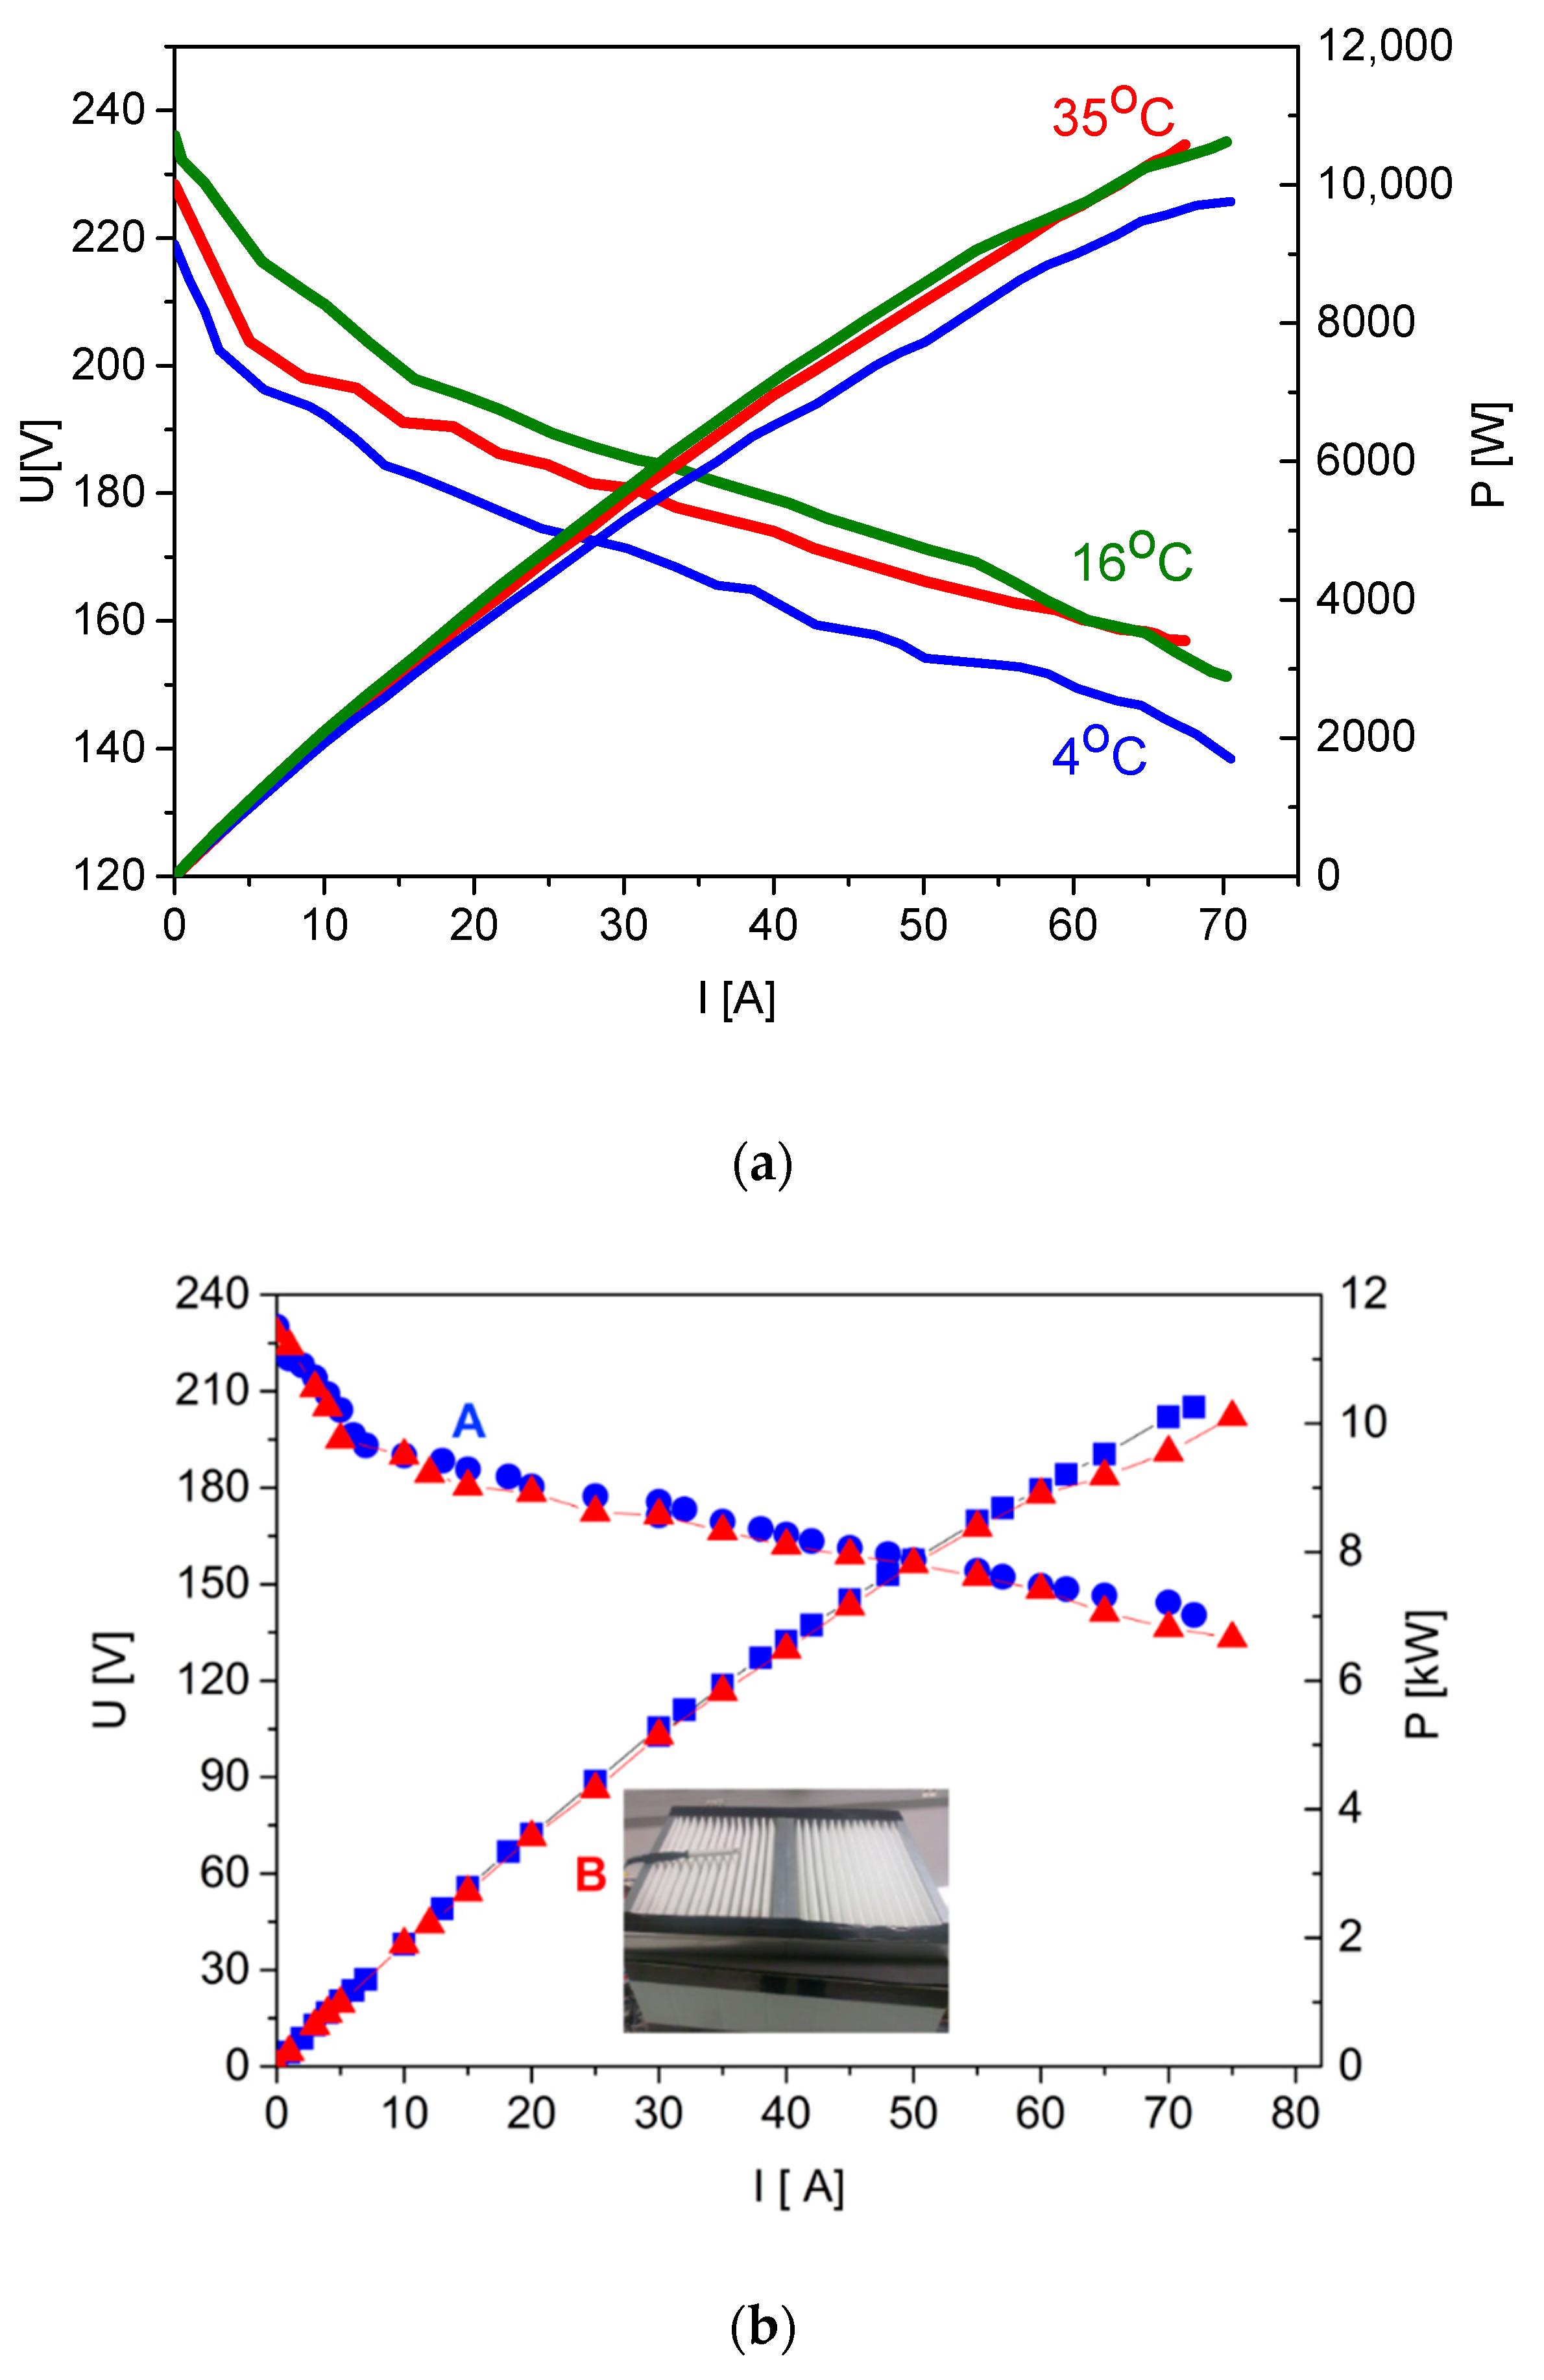
Figure 9a presents the U-I and P-I curves recorded in different measurement conditions. It can be seen from the U-I curve that the open-circuit voltage (OCV) of the PEMFC stack was ~230 V DC. As the current increased, the voltage decreased linearly to approximately 154 V at 67 A. The electrical power of the 10 kW PEMFC stack reached more than 10 kW in all investigated conditions. In all cases, the power output of the PEMFC stack slightly exceeded 10 kW, although the variation in final performance was no more than 5–7% in comparative analysis. At lower temperatures, such as ~4–10 °C, values obtained from the first run of the stack were lower. The application of a slow electrical load with a current of 5–10 A for 5–10 min enabled the attainment of good performance levels in 2 or 3 runs. All of these experimental data indicated that the constructed V-type PEMFC stack was capable of achieving the assumed nominal power of 10 kW in various conditions. The impact of ambient conditions on PEMFC stack performance is important for practical applications of these stacks as power sources for various devices.
The problem of ambient conditions (temperature, humidity) was also analysed using different models for simulation and experimental tests performed on PEMFC stacks with various values of nominal electrical power and types of construction. Rosa et al. [26], analysing the impact of temperature, air flow rate, hydrogen flow rate, and pressure on the performance of a 300 W PEMFC stack, found that the stack was practically unaffected by operating conditions (temperature, humidity); however, slightly higher power output was achievable with a slight increase in hydrogen pressure up to 150 mbar. Bayrak et al. [27] also investigated the impact of ambient temperature on the performance of a 200 W PEMFC stack connected to a battery in a hybrid power source. A Li-ion or Ni-MH battery was integrated with a PEMFC stack during experimental tests. It was observed that the hydrogen consumption of fuel cells increased when the ambient temperature was near 40 °C. The range of investigated temperatures varied from 0 to 40 °C. In the case of lower temperatures near 0 °C, some researchers have found that the elaborated procedure for starting the PEMFC stack also had a considerable impact on its final output.
Cano et al. [28], in a review paper, analysed a free air-breathing PEMFC fuel cell, characterising its thermal behaviour at a near-freezing temperature. In the case of two different ambient temperatures (24 or 3.5 °C), it was found that the relative deviation between models and experimental temperatures was characterised by an error of less than 5%. The deviation observed at near-freezing operating conditions was higher at the beginning of the experiment, i.e., the first run of the PEMFC stack. Analysis of the data contained in [26,27,28] also indicated close agreement with our results concerning the performance of the constructed V-type PEMFC stack (Figure 9a).
Figure 9b summarises the U-I and P-I curves recorded for a fuel cell stack operating freely in laboratory conditions (A) and in conditions with limited air inlet (B), i.e., with side surfaces from the inlet duct side in the bipolar plates of both PEMFC stack modules covered with foamed polystyrene boards, and the PEMFC stack protected from above with a cassette filter, designed to shield the device against possible solid impurities that may occur at the airport during take-off of a powered sailplane. The proposed test was to reflect the integration of a V-type PEMFC fuel cell stack and simulate additional air intake restrictions in the powered sailplane’s hull. This description is consistent with Figure 1, the structure of the powered motor glider, and the arrangement of power plant components presented in [24].
The analysis of U-I and P-I curves recorded in the same laboratory conditions and applied electrical current load in the range 1 to 75 A did not indicate a difference in power output of the PEMFC stack.
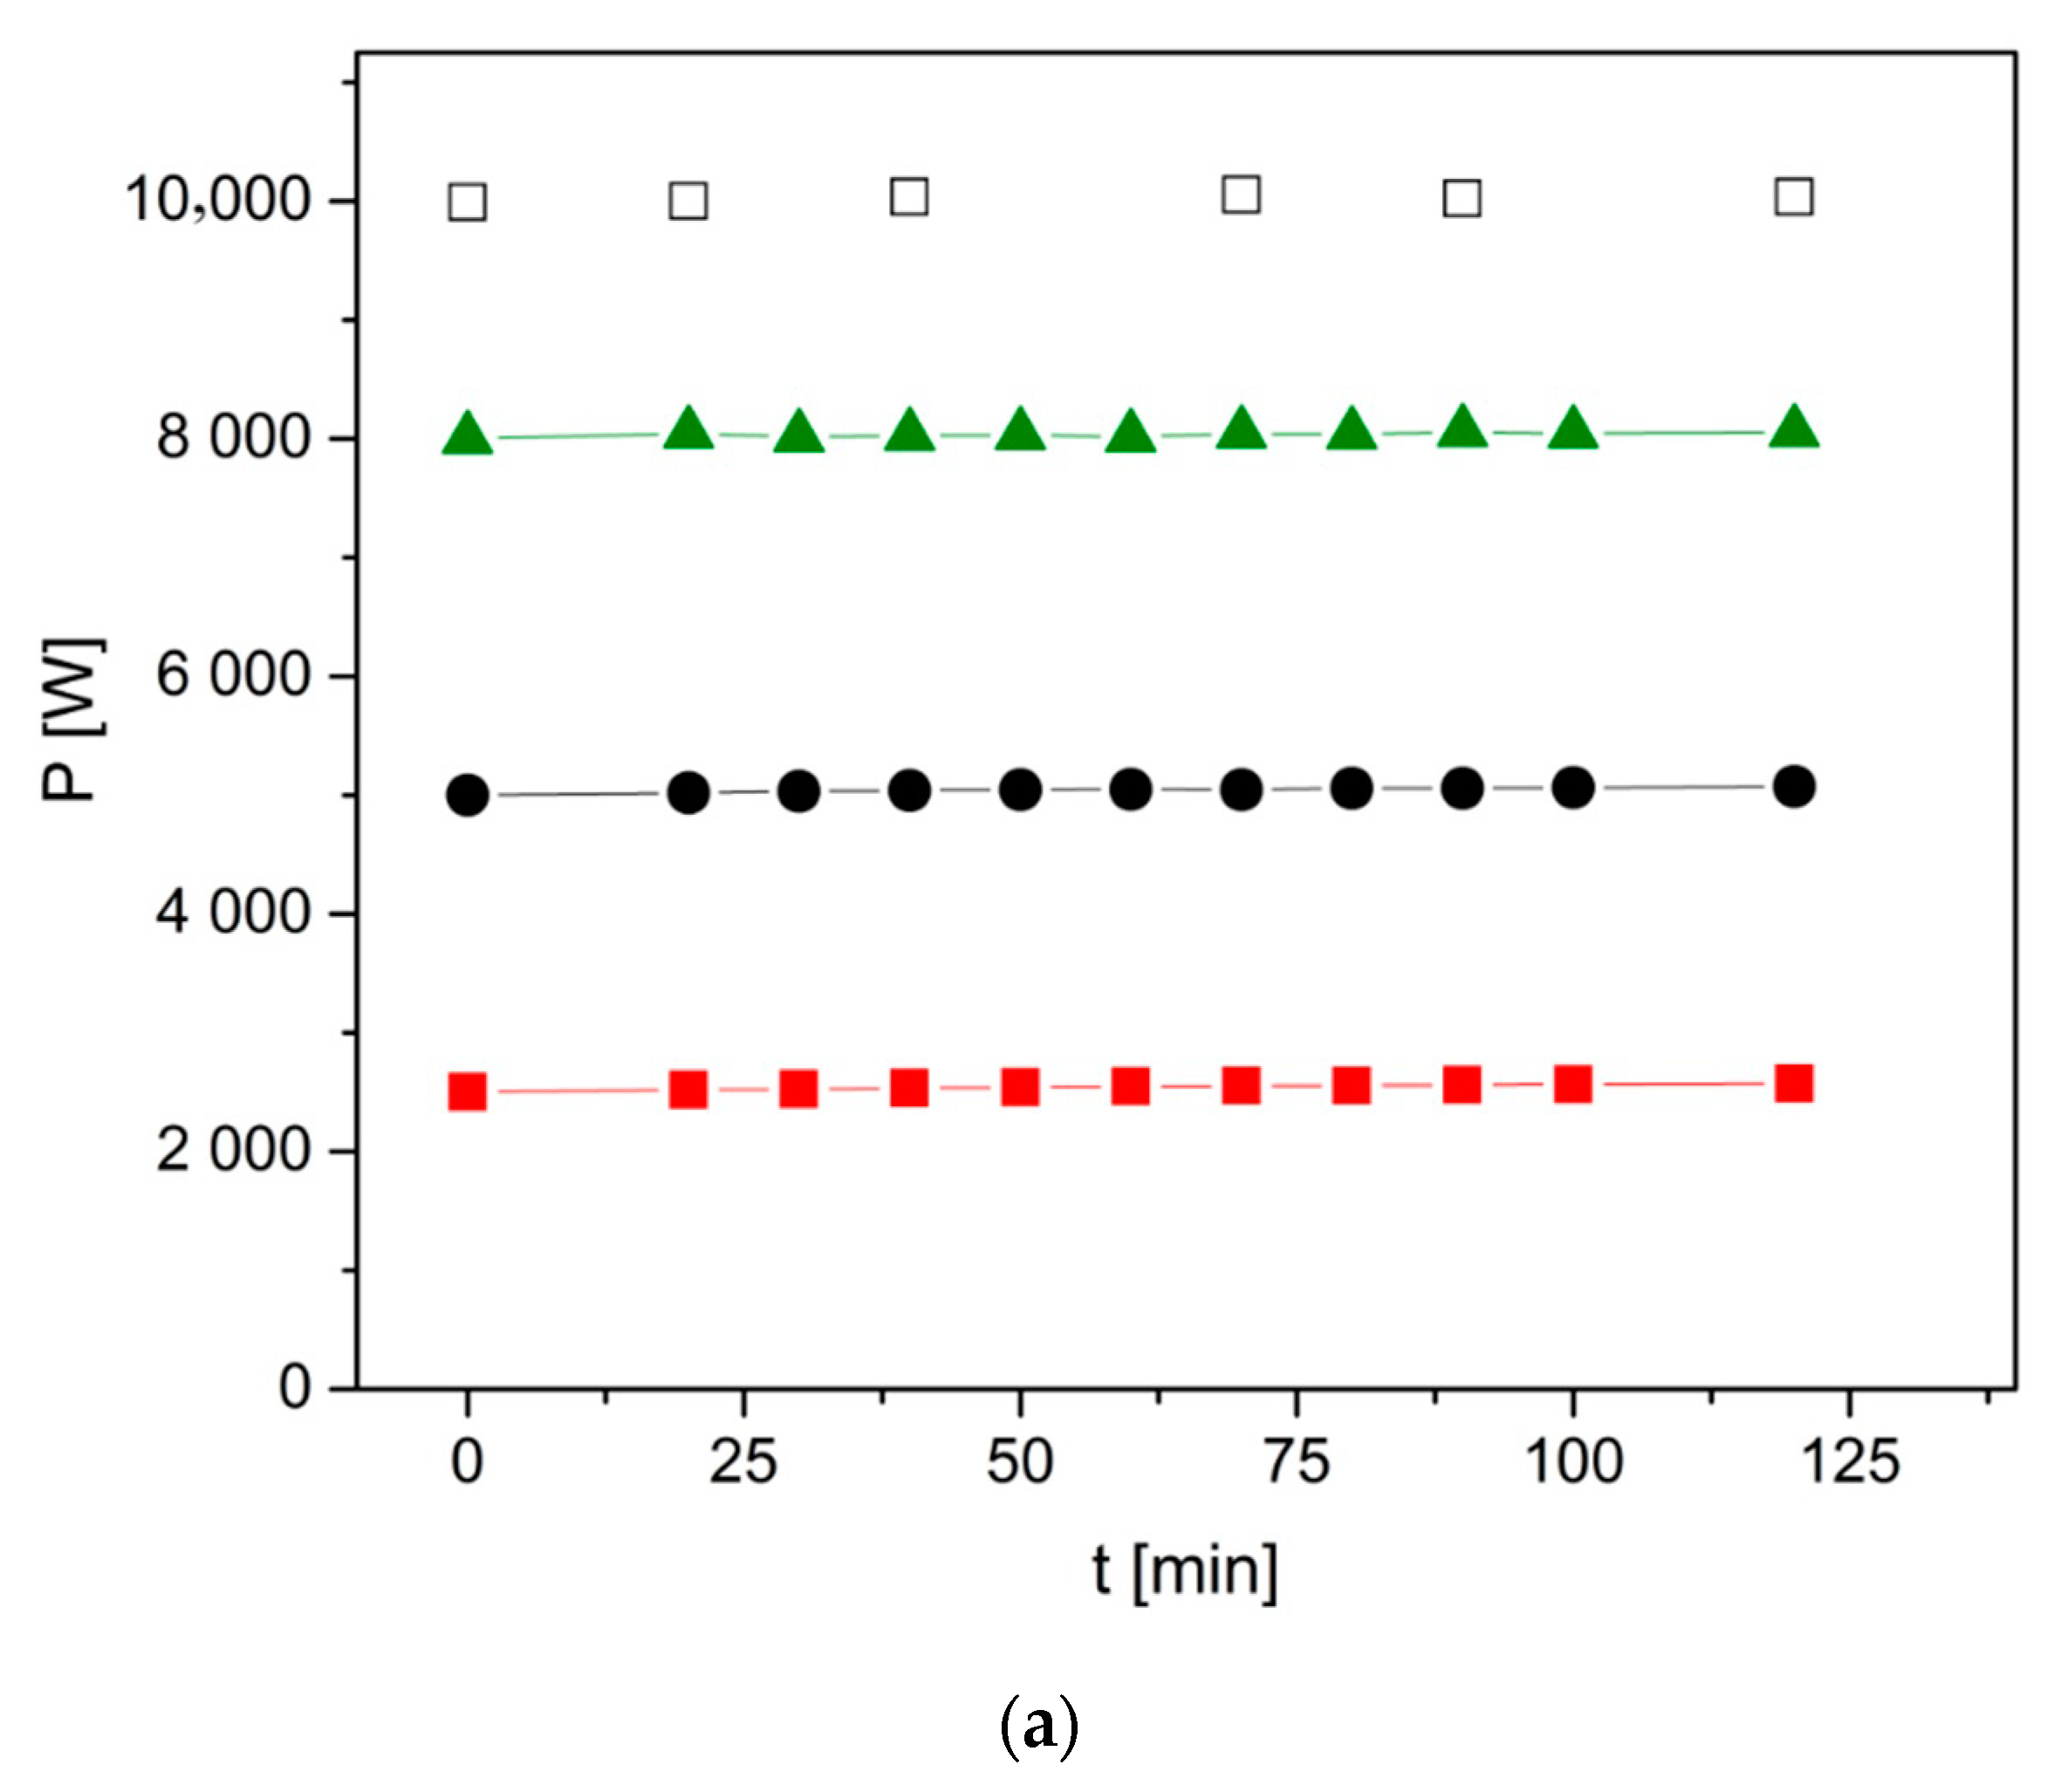
The variation in electrical power P produced by the stack vs. time was determined under an applied electrical current load (Figure 10a,b). The experiments were carried out for 2 h. During PEMFC performance, an elaborated procedure of purging and SCU was applied.
As can be seen in 
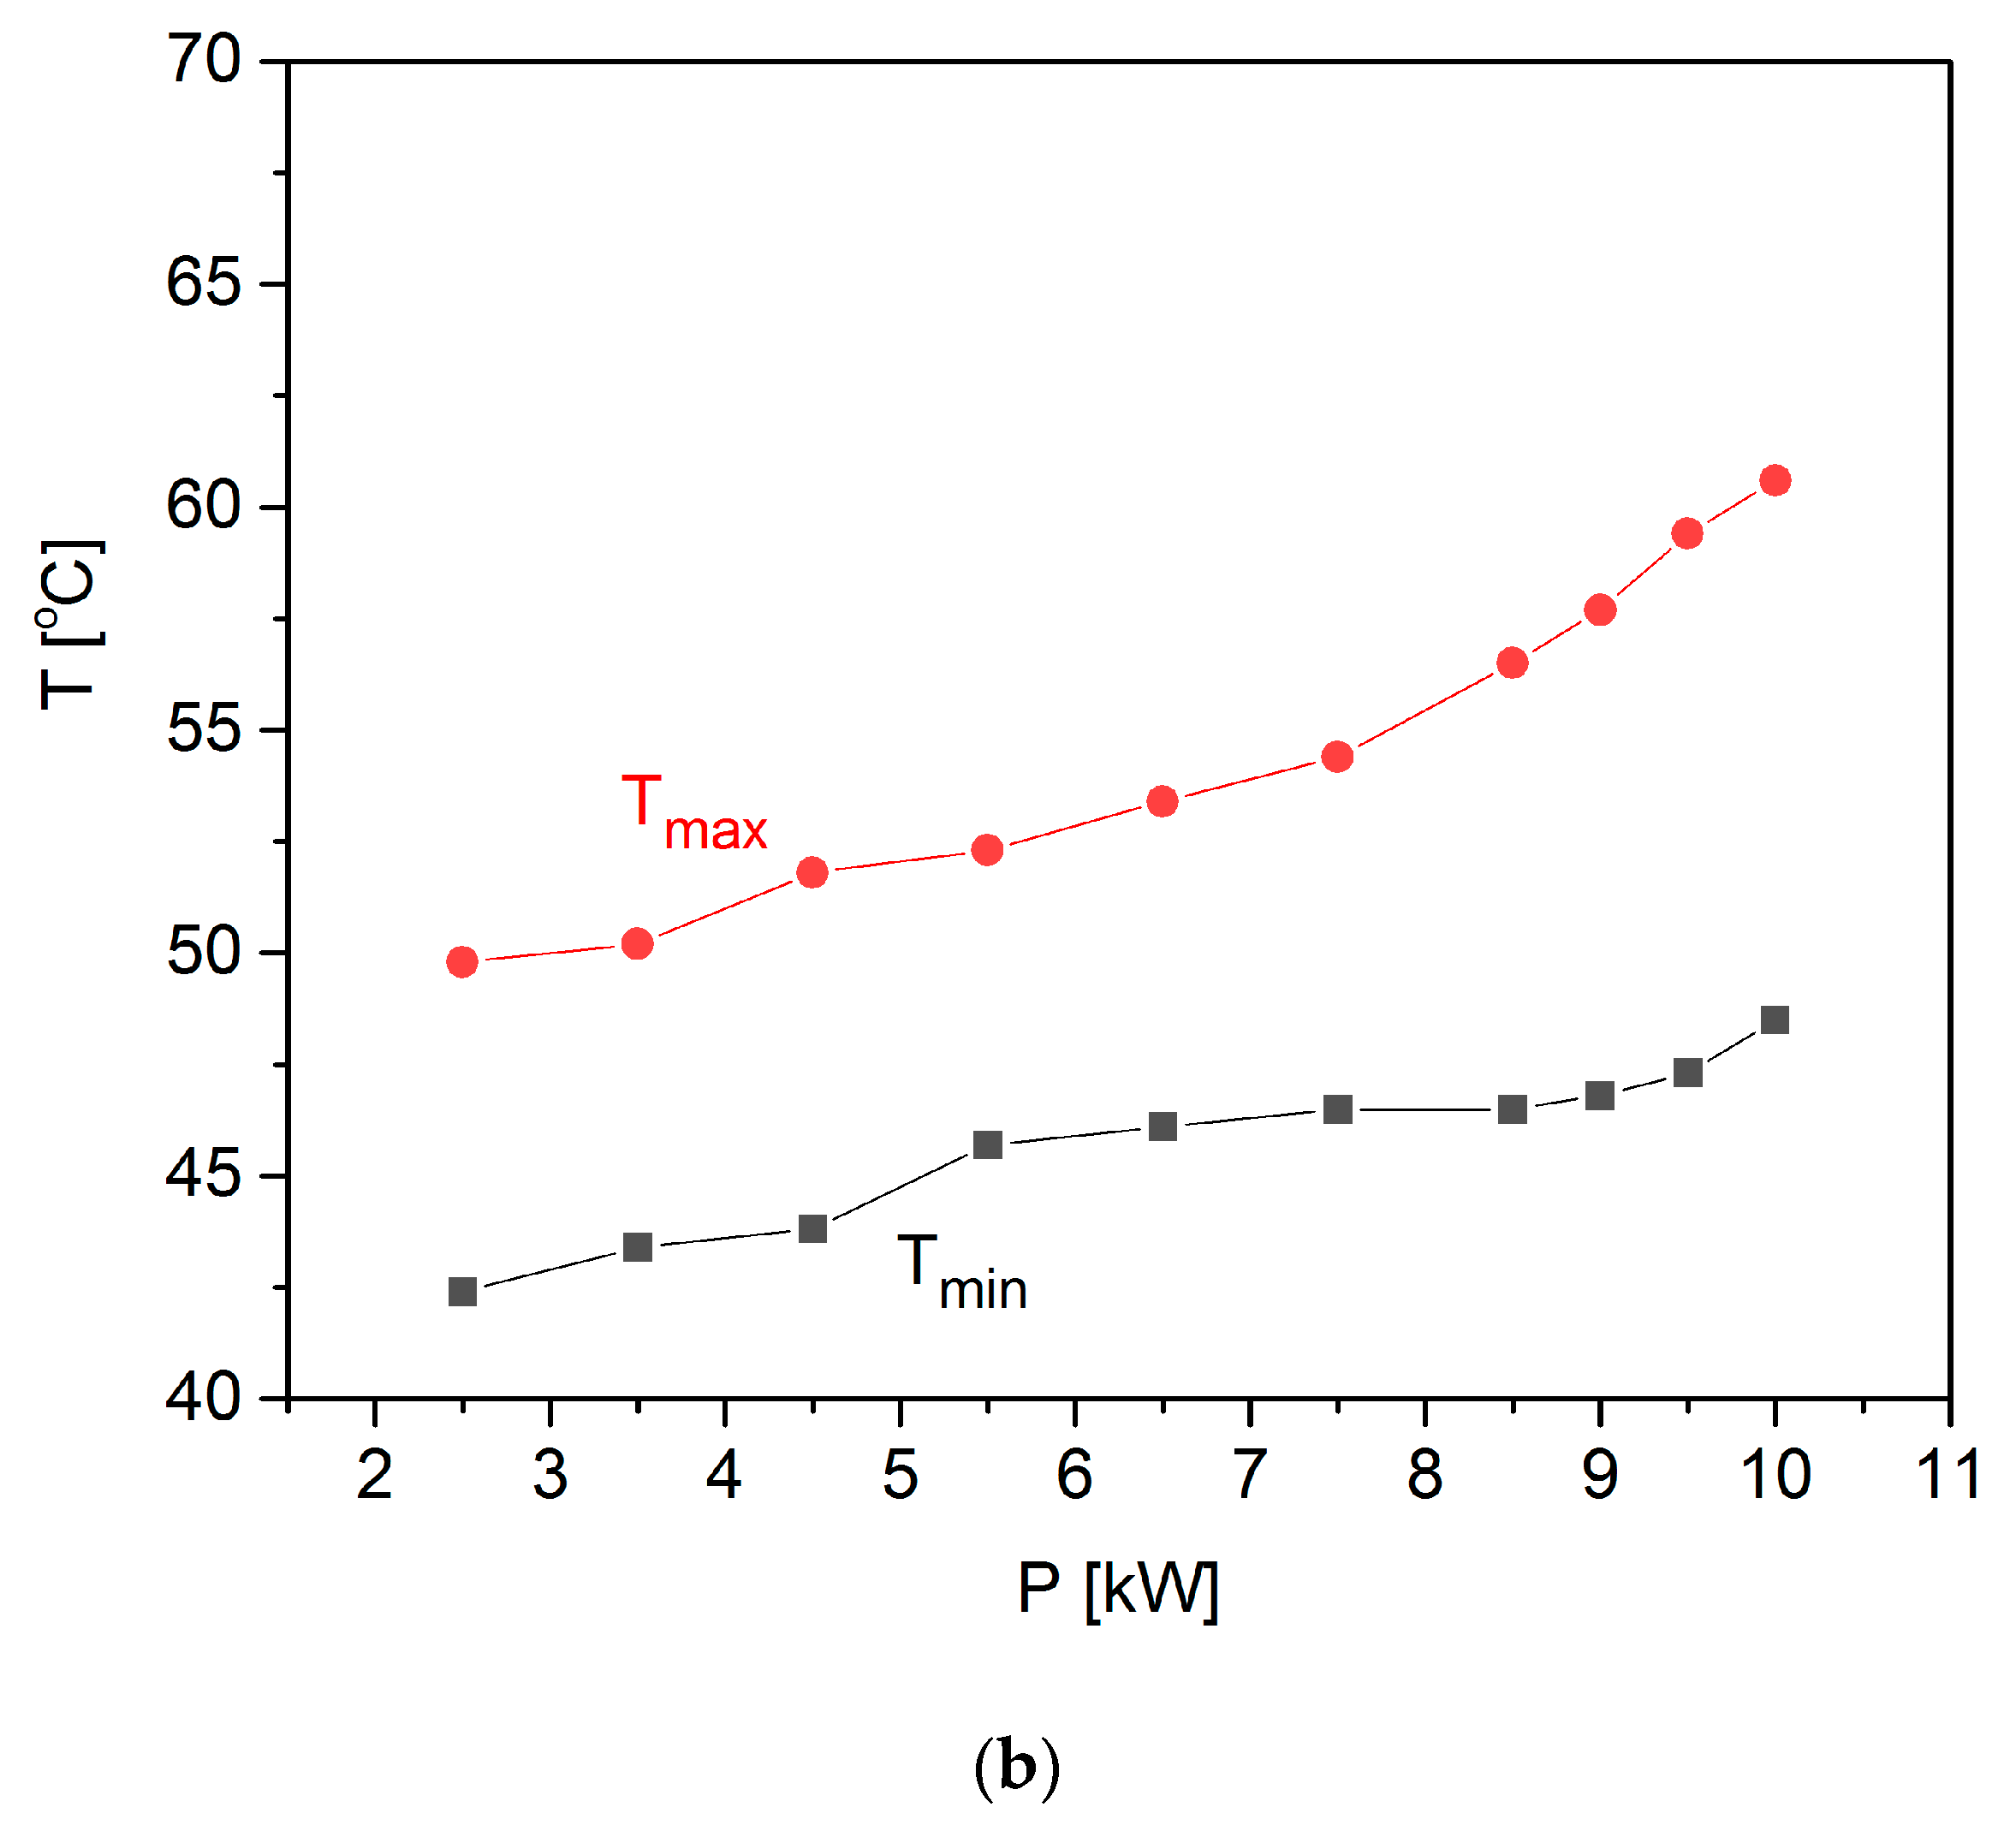
Figure 10a, a slow increase in electrical power was noted during the applied experiment within the range 2.5–5 kW. Within a range of 6–10 kW, a fairly stable level of power was produced by the stack. In Figure 7b, the variation in Tmin and Tmax temperature recorded during this experiment has been added to the graph. Tmin or Tmax increased when the PEMFC stack reached higher power values. The highest temperature was no higher than 65 °C; however, the difference (ΔT) between Tmin and Tmax was no greater than 12 °C.
Zhang [29] suggested that the most favourable operating temperature for a PEMFC stack is usually within the range 55–80 °C. In the case of application in a motor glider platform made from a carbon-based composite, where the assumed temperature was established within the range 60–65 °C, the investigated two-module PEMFC stack operated properly in terms of stability of power and peak temperature attained.

3.2. Analysis of Hydrogen Fuel Consumption during V-Type PEMFC Stack Operation

Analysis of hydrogen fuel consumption during PEMFC stack operation is very important for all transport applications. Efficient control and management strategies of hydrogen fuel consumption are necessary in order to predict the time of operation of a 10 kW PEMFC stack when operating as a part of integrated hybrid power sources. The hydrogen injected into the anode chamber is supposed to be fully consumed in dead-end operation mode. This means that theoretical losses are close to 0%. However, nitrogen and water can easily penetrate a Nafion-based membrane. Excess water and nitrogen that have crossed over in the anode reduce the concentration of hydrogen at the catalyst surface, causing performance losses. Purging the anode with hydrogen removes water and nitrogen and thus restores the performance of the stack. According to Strahl et al. [30], the optimal purge strategy depends on suitable heat and water management and considerably impacts the durability and performance of the stack.
The ratio of fuel utilisation to electricity production, purification of the stack carried out during the purge process, and the level of humidification implemented by means of the SCU process should all be considered when estimating the time of performance of a V-type PEMFC stack in a propulsion unit.
Manufacturers of PEMFCs recommend the use of the short-circuiting method, aimed at improving performance of these fuel cells over time. In products manufactured by the Ballard or Horizon company, the controller unit includes the option to periodically interrupt the performance of a PEMFC stack via maintenance of water content. One of the main drawbacks of SCU performance is that when ‘voltage dip’ occurs in an operating SCU, voltage values are close to 0. Some electronic devices, in this case certain producers of DC/DC, are sensitive to brief power outages of this type However, there is a lack of data and understanding regarding ways to improve the performance of single MEA cells and to optimise the short-circuiting strategy for fuel cell stacks constructed from smaller modules. The performance of the SCU also has a considerable impact on the integration of other devices, such as DC/DC, into a hybrid power source [31].
Gupta et al. [32] elaborated a procedure aimed at the optimisation of SCU performance through maximising cumulative average power density gain and minimising the time required to recover energy losses during short-circuiting. These authors obtained voltage improvements ranging from 10% to 12% in voltage (U)-time (s) curves for different current densities in a 100 W PEMFC stack. They also found that minimum short-circuiting time is a function of double-layer capacitance. Electrochemical impedance spectroscopy is a useful technique which can help to solve double layers in electrochemistry. Kim et al. [
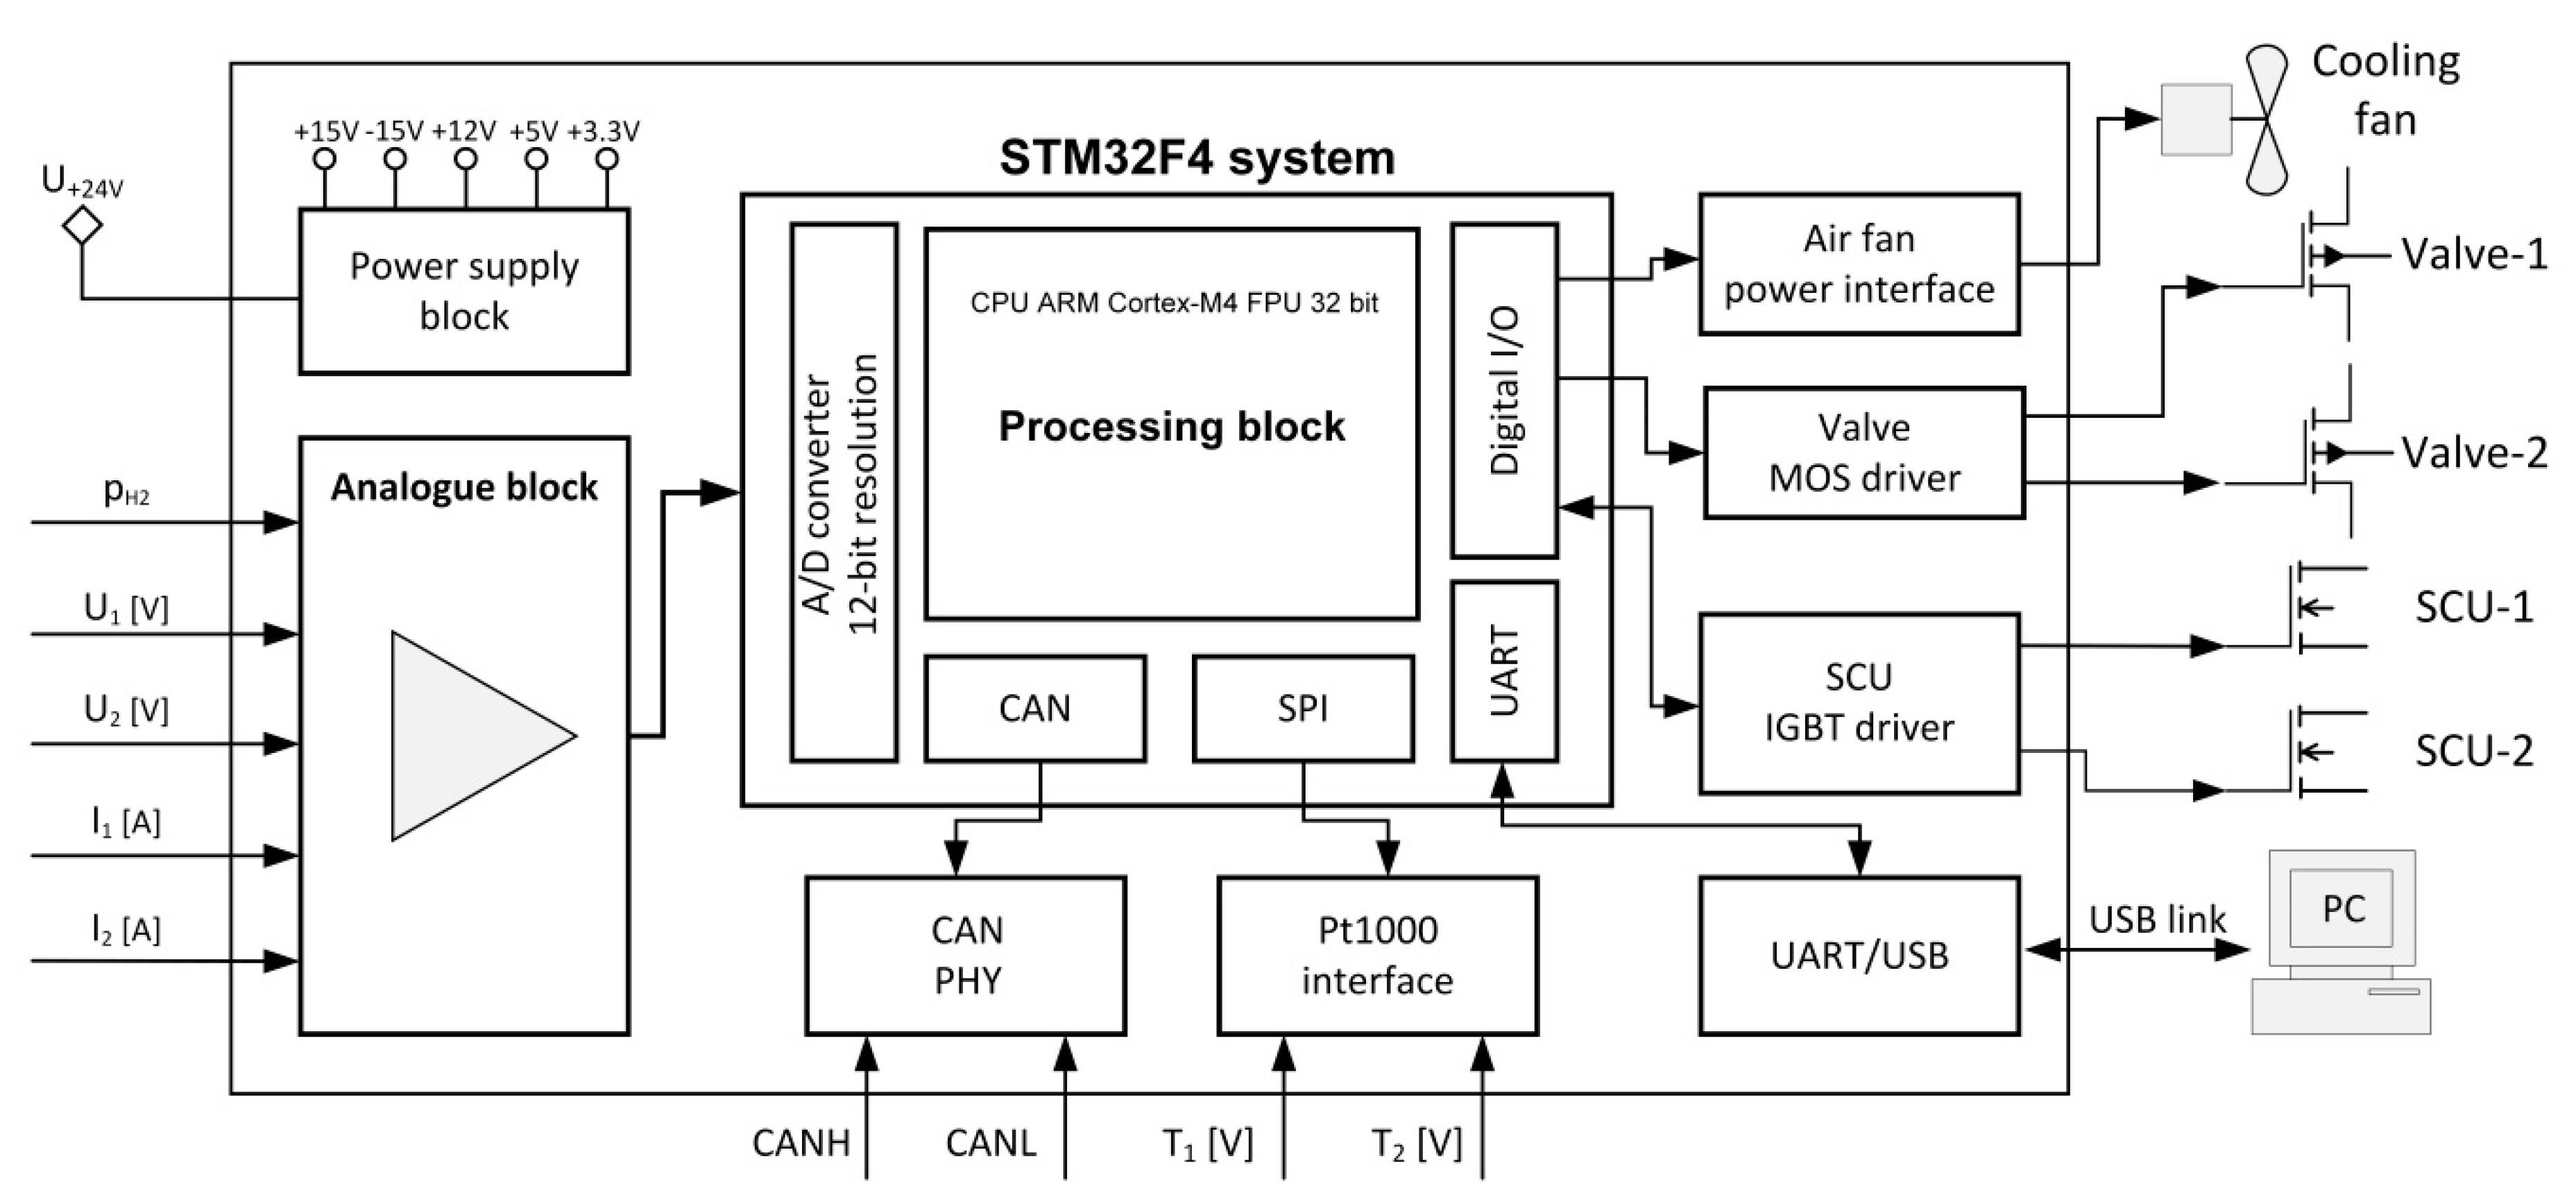
33] used the SCU method to humidify a PEMFC stack for an unmanned aerial vehicle (UAV) application in order to prevent it from drying out. In UAV applications in particular, humidity control becomes more important as the boiling point of water decreases along with increases in flight altitude. A fuel cell controller incorporating a short-circuit unit was developed and a battery hybridised with the PEMFC stack to compensate for lost power when the latter was short-circuited. The performance of the stack was evaluated for the interval (period) and duration of the short circuit. Using this method, the power output was improved by 16% when the short-circuit control was operated in optimal conditions. In the present study, a SCU system was also elaborated and integrated into the fuel cell controller as shown in 
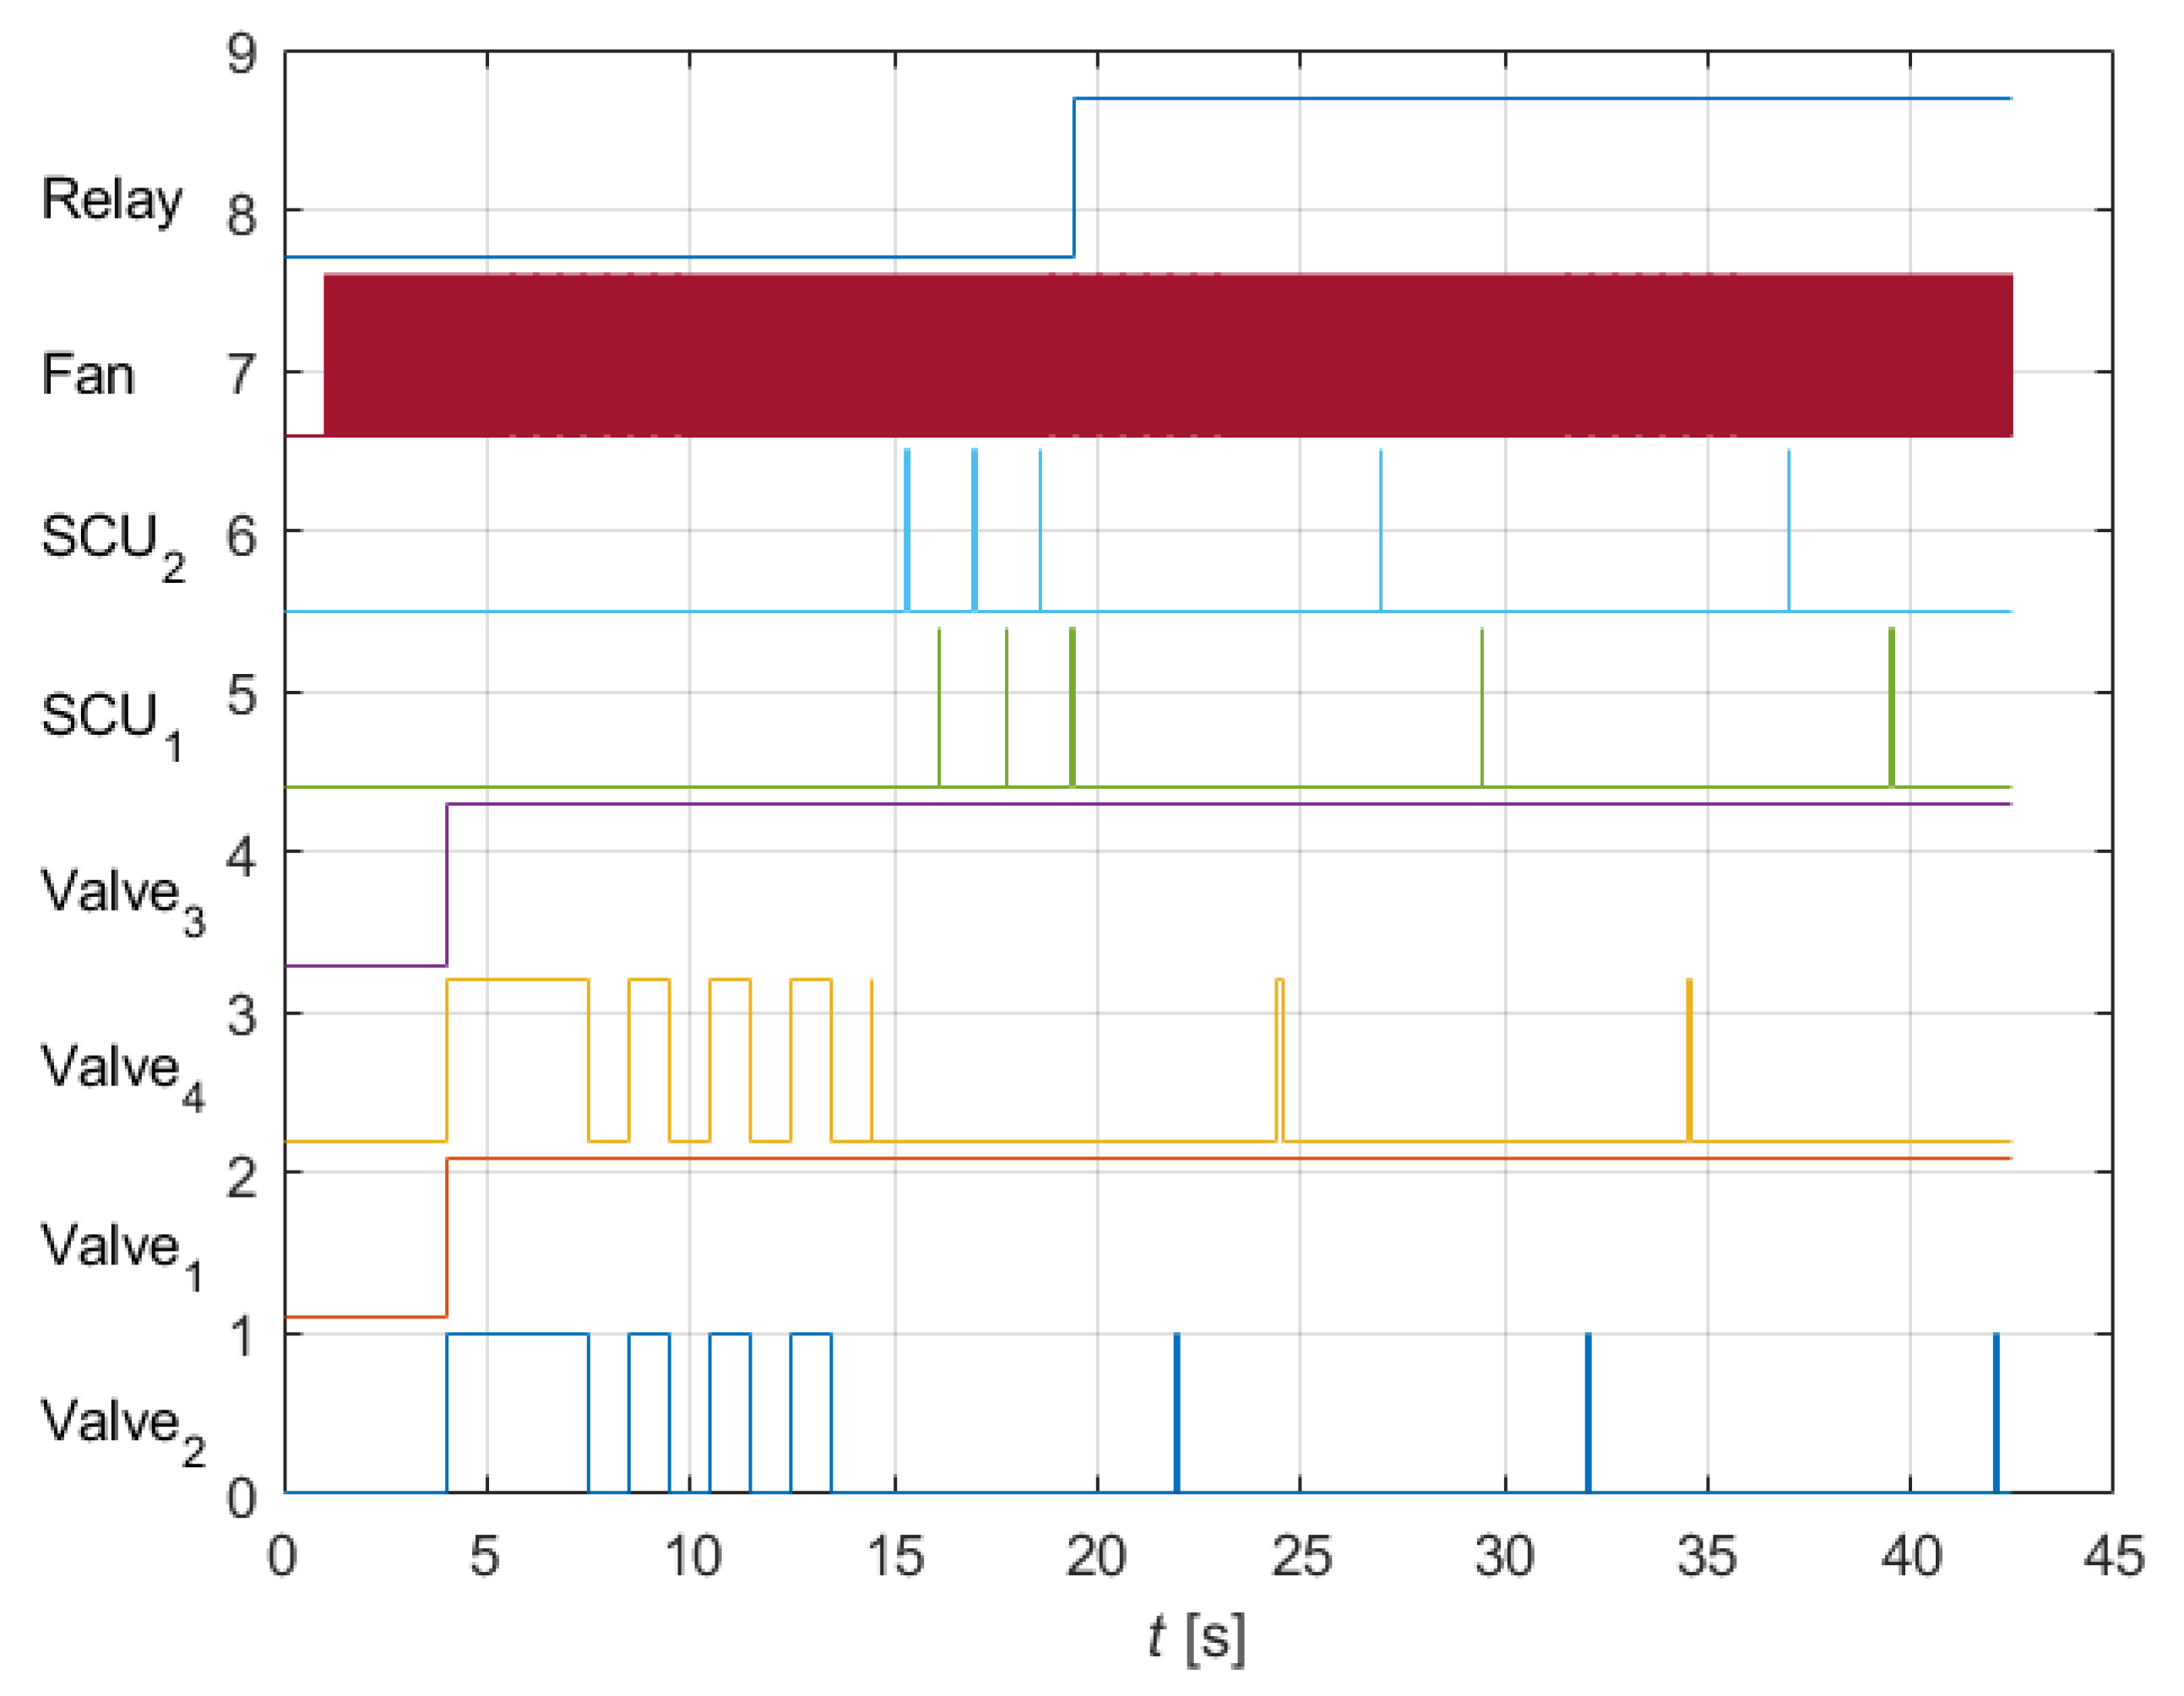
Figure 3. Data on modular PEMFC stacks involving SCU units and their impact on performance are limited. In the constructed V-type PEMFC, the SCU process can be implemented in two different ways: the SCU can either occur simultaneously in modules (A) or (B) or be staggered. The use of two SCU systems, 1 and 2 (causing short-term short circuits of the PEMFC stack for purposes of self-healing), enables control of the short circuits so that they occur at maximum intervals relative to each other during the operation of the stack, thus preventing a sudden voltage drop to 0 V in the output of the PEMFC module, which might be unfavourable for all devices in the propulsion system. In addition, purification of the anode space via periodic (every 10 s) opening of the H2-out solenoid ‘purge’ valve for each of the module piles should be shifted in terms of time so as to avoid excessive pressure drop in the hydrogen supply line due to the high intensity of flow in the motor glider installation. An analysis of hydrogen consumption involving the purge and SCU performance of the PEMFC stack under variable electrical load was also carried out in situ. Special emphasis was placed on analysis based on the variation of pressure, monitored online by pressure sensors installed in composite bottles. This procedure of measuring online variation in hydrogen pressure should also be considered in predictions of operating time for a PEMFC stack in a propeller system along with transmission of information on the expected time of operation of the fuel cells and the amount of stored hydrogen as a fuel to an on-board computer.
In this study, the minimal hydrogen value and the highest level of fuel consumption vs. electrical power produced by a V-type PEMFC stack was determined during operation under constant as well as dynamic loads.
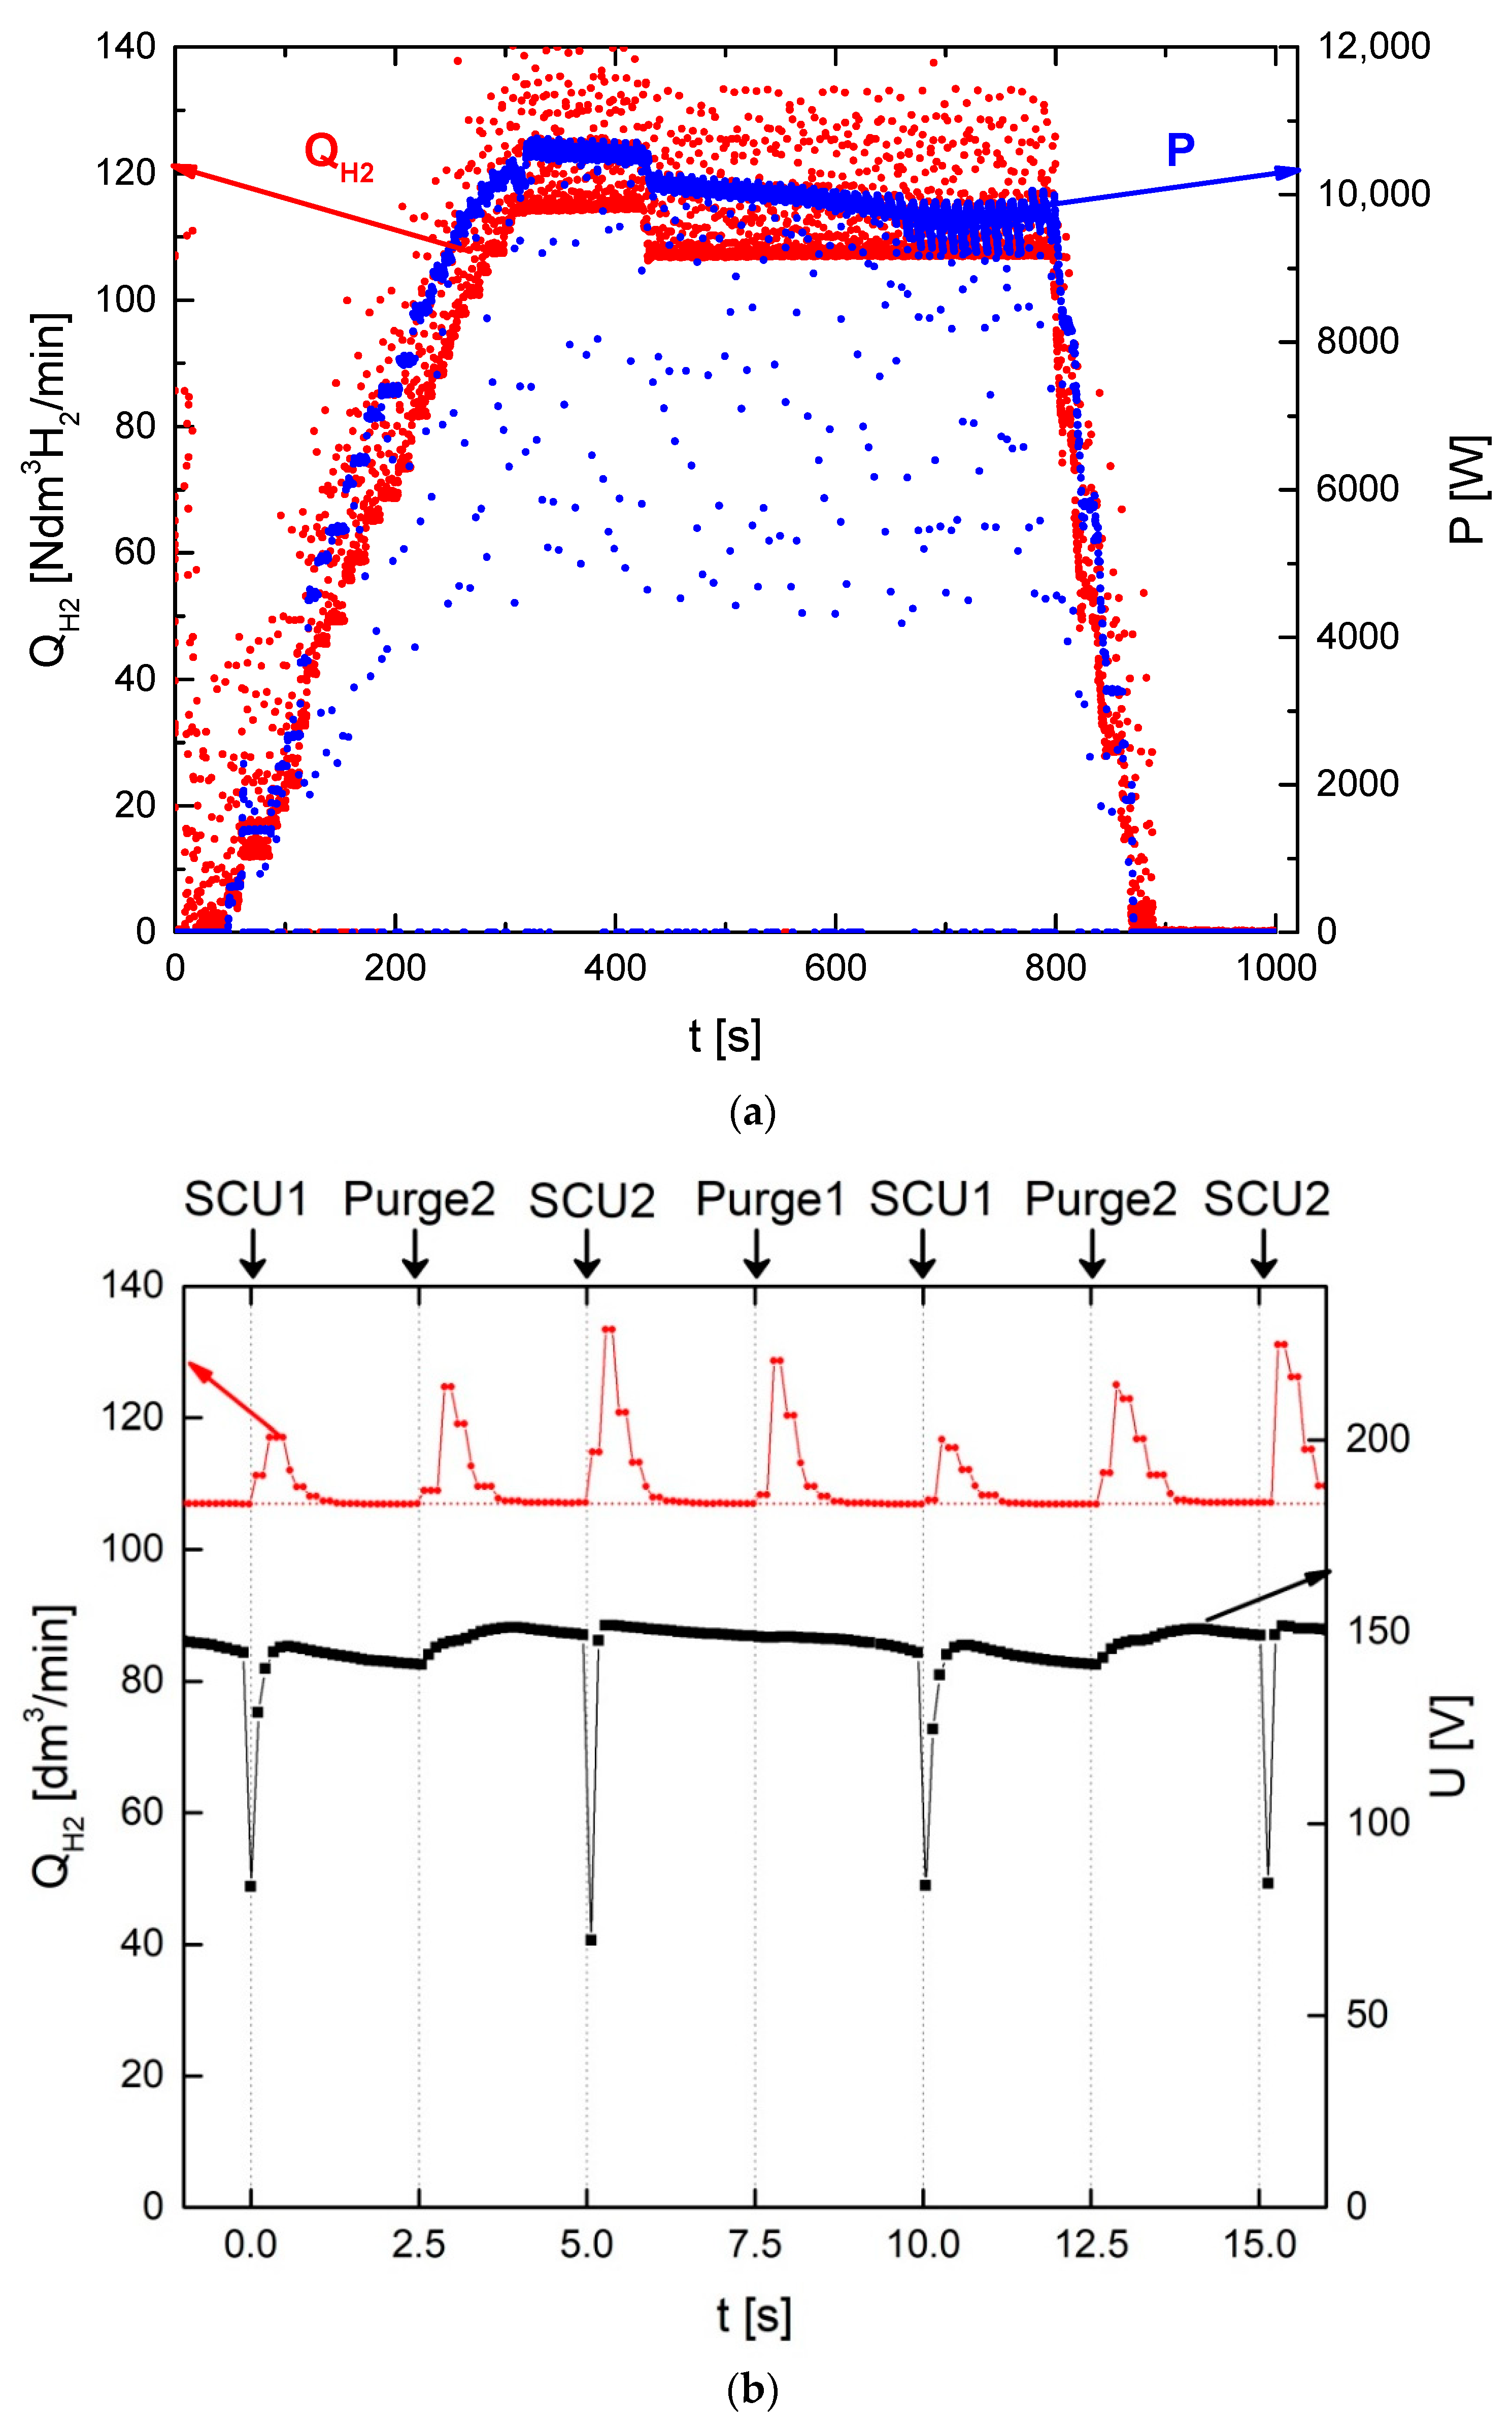
Figure 11a presents the total analysis of hydrogen consumption during electrical power production. In addition, performance during purification (purge operation) or the humidification process realised via the SCU mode was also measured for the V-type PEMFC stack.
Figure 11b presents the variation in hydrogen flow QH2 as well as voltage U vs. time during SCU operation of the 10 kW PEMFC stack under electrical load. In the voltage vs. time dependence, a reduction in voltage by half is visible every 5 s. These reductions were related to the operation of the SCU system, which shorted one of the two modules every 10 s (shorting one SCU module and, 5 s later, the other) for purposes of auto-humidification, which was accomplished during the short-circuit current flow. At the time of the occurrence of a short circuit in the SCU, an increase in hydrogen flow rate QH2 (dm3/min), associated with increased consumption during short-circuit current flow, can also be seen in the diagram in Figure 11b.
Increases can also be observed in hydrogen flow rate between short circuits, associated with the opening of the solenoid valves at the hydrogen outlet from the anode spaces of fuel cell modules A and B, described as Purge 1 and Purge 2. Hydrogen flow during the operation of the electricity generator with the fuel cell stack equalled 123 Ndm3 H2/min; during the operation of the SCU1 and SCU2 systems and the opening of the Purge 1 and Purge 2 flushing solenoids, this value temporarily increased to 140–150 Ndm3 H2/min. It was estimated that hydrogen consumption increases by 4–8% during SCU and purge operation.
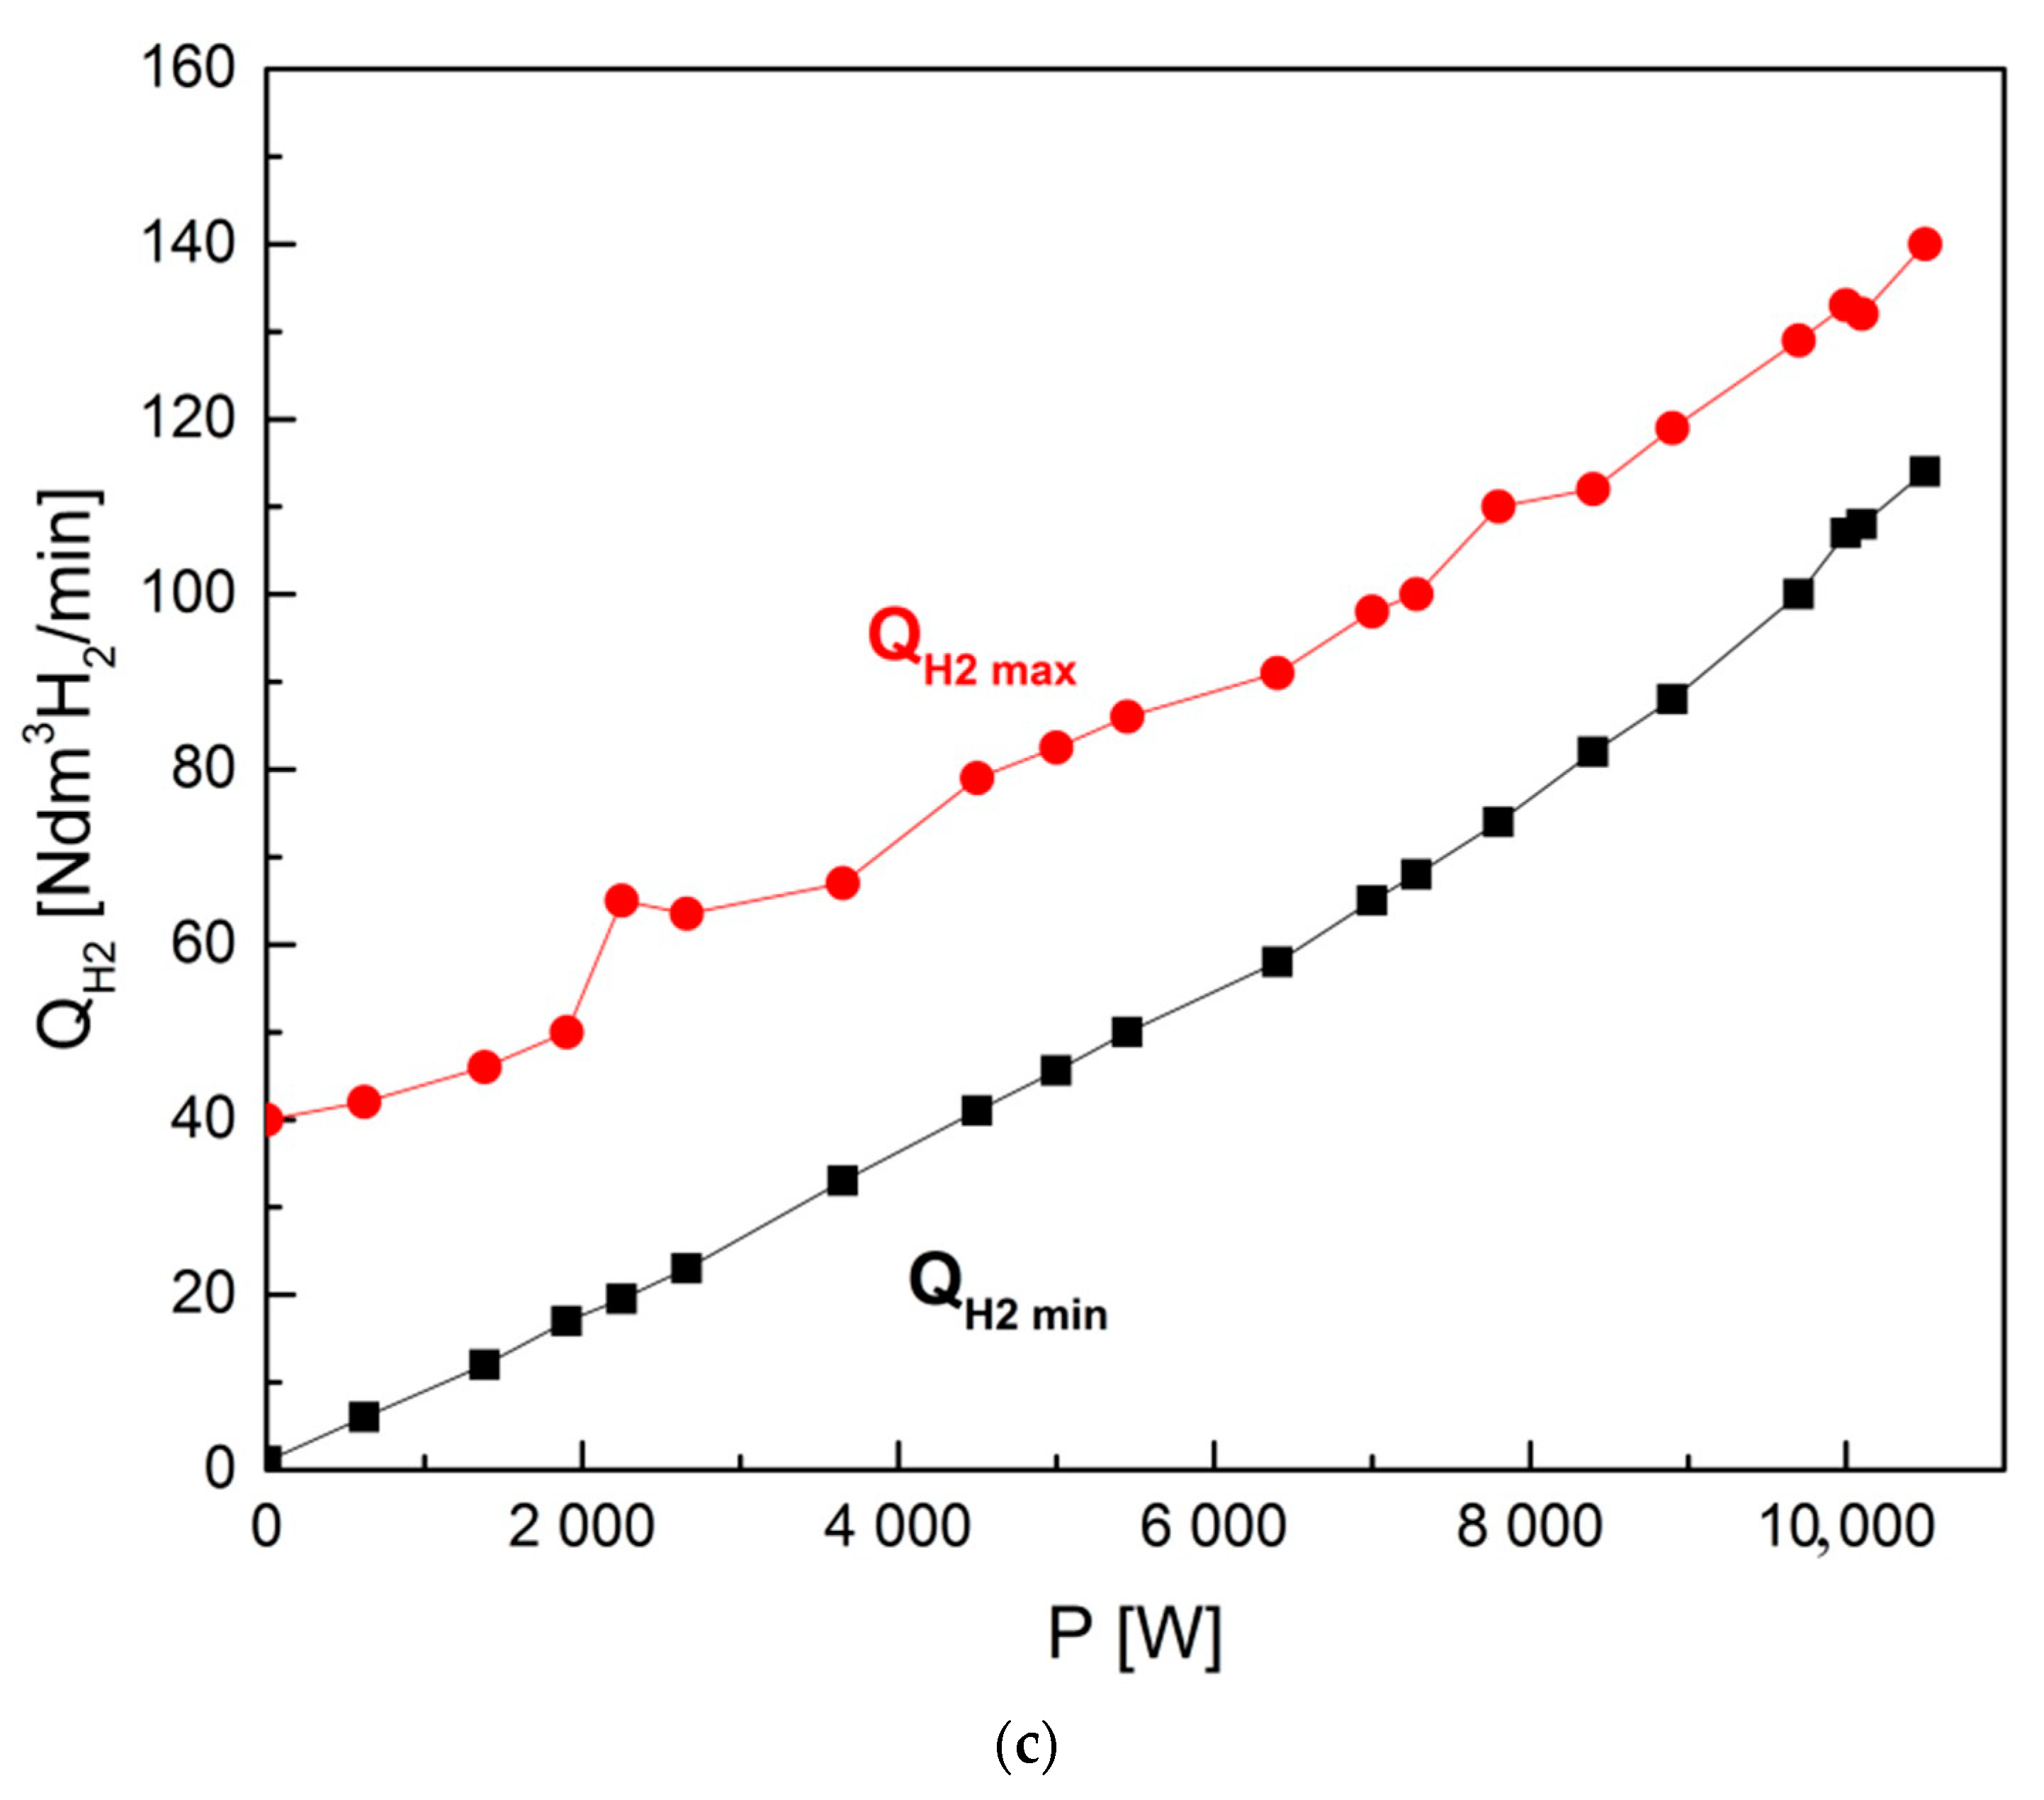
Figure 11c presents the representative hydrogen dependence of intensity of hydrogen flow measured during the operation of a PEMFC stack on declared electrical power. The highest flow rate of hydrogen was estimated at ~140 m3/min for V-type PEMFC stack operation at electrical power of 10 kW.
It was found that the intensity of hydrogen volume flow increased nearly linearly with increases in the electrical power produced by the PEMFC stack. It was also observed that minimal consumption of fuel might directly correspond to utilisation of production of electrical power by the investigated power source. In the case of a PEMFC operating with 10 kW of power, the consumption of hydrogen was established at ~114 dm3/min (without purge and SCU processes). The consumption of hydrogen during purification of the PEMFC stack via the purge process as well as under humidification implemented via the SCU module during operation of this device was also measured and considered.
Gaseous hydrogen is stored in two composite cylinders and supplied directly to the PEMFC stack. The efficiency ε of the electrical V-type PEMFC stack can be calculated according to Formula (1),
ε = E e l E H 2 ,
as the ratio of the electricity measured at the terminals of the stack to the chemical energy of hydrogen consumed during stack operation. 
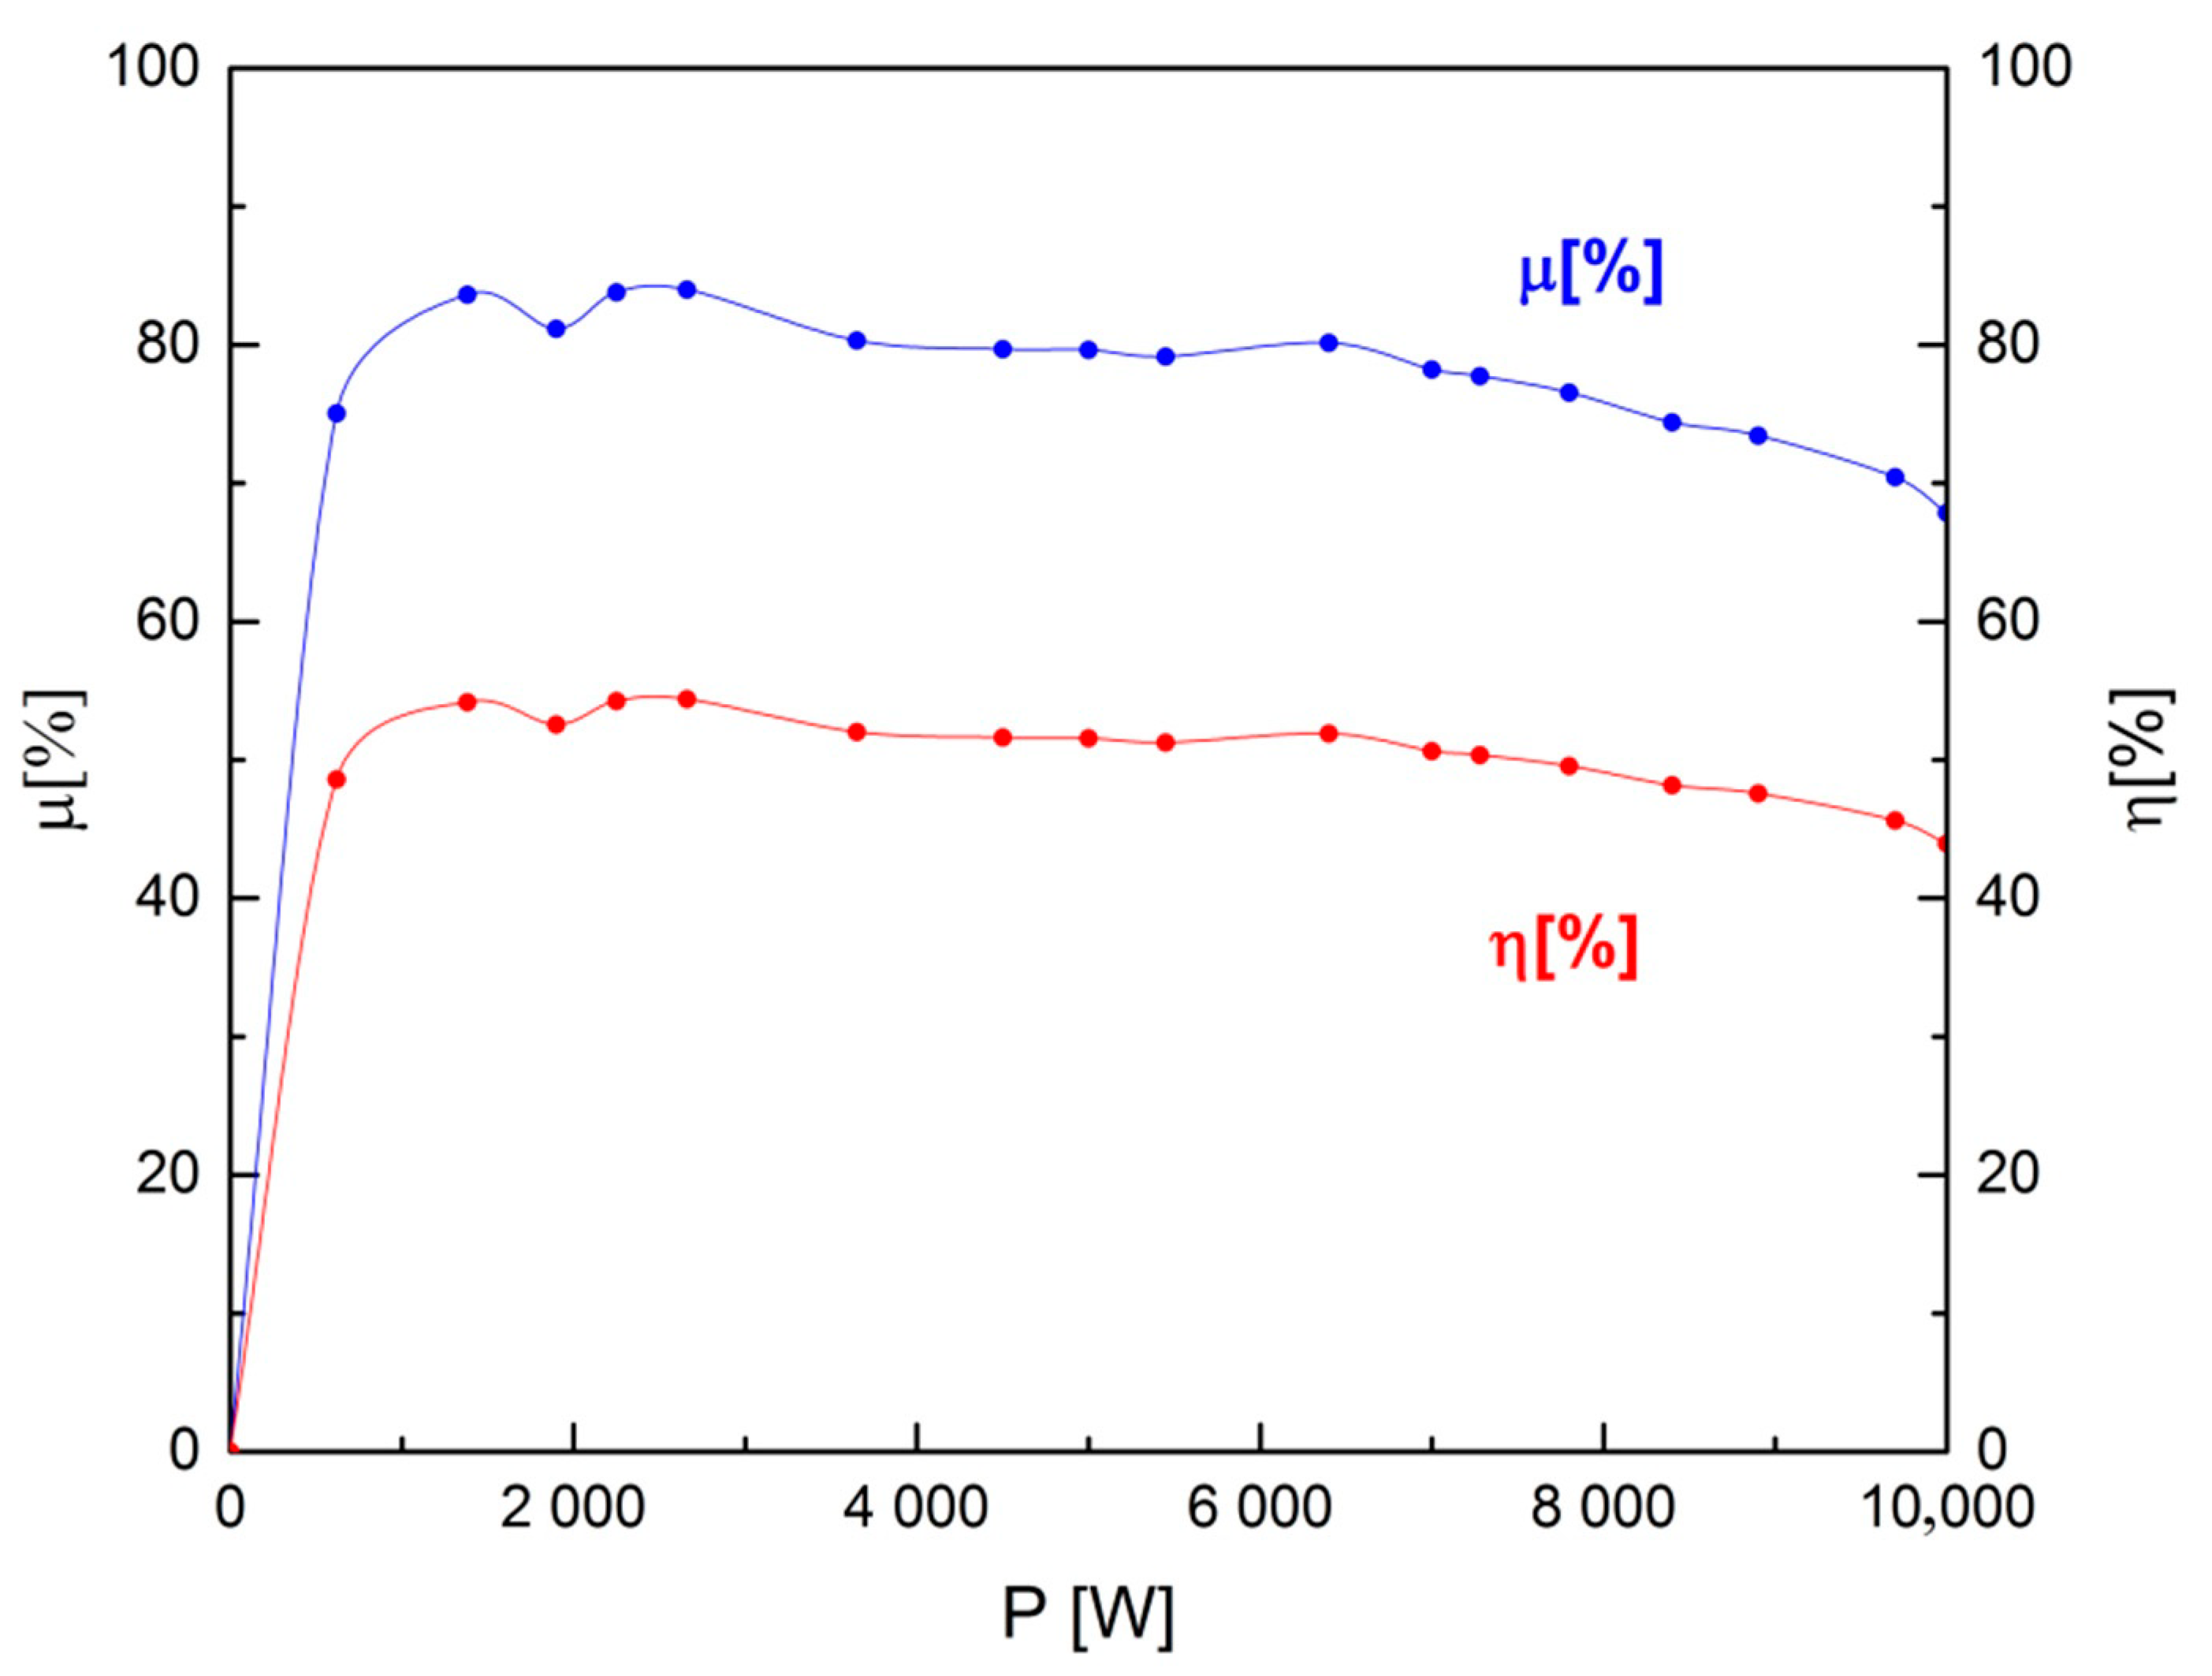
Figure 7a presents the variation of electrical efficiency vs. the power produced by the constructed V-type PEMFC stack. As can be seen, electrical efficiency close to 50% is observed within a power range of 1–7 kW; following attainment of 8 kW, a small decrease was observed. At 10 kW, electrical efficiency was close to 45%. This value is close to that indicated in all data existing in the literature regarding an air-cooled PEMFC stack.
According to paper [31], the hydrogen utilisation coefficient was calculated according to the following formula
μ = a 1.48 U   100 %
where: U (the PEMFC stack’s open-circuit voltage) is 0.97 V/cell and the ideal open-circuit voltage is 1.48 V/cell.
The dependence of hydrogen utilisation during production of electrical power by the stack is also presented in Figure 12. As can be seen, a coefficient of fuel utilisation close to 80% was recorded over a wide range of power, from 1 to 7 kW. An increase in electric power produced by the V-type stack above 7 kW caused a reduction in this value to about 70%. In this construction, the recovery of hydrogen from purging processes was not considered.
The effect of power output of the PEMFC stack on the dynamic variation of electrical load generated by the propulsion energy system is necessary for practical applications in transport. The dynamic response of the hydrogen-oxygen fuel cell is required in order for it to quickly adapt to changes in electrical load in the course of different missions. A PEMFC stack is composed of main subsystems involving reagents such as air or hydrogen, cooling devices, and other devices used to control the stack’s performance. The operation of each exerts a considerable impact on the performance and durability of the stack as a complete electrochemical power source. The impact of these subsystems on the dynamic response of fuel cells was taken into consideration in simulations, modelling, and experimental studies [34,35,36,37].
In this study, detailed investigations were conducted involving variations in electrical power and temperature vs. time of applied variable electrical load. 
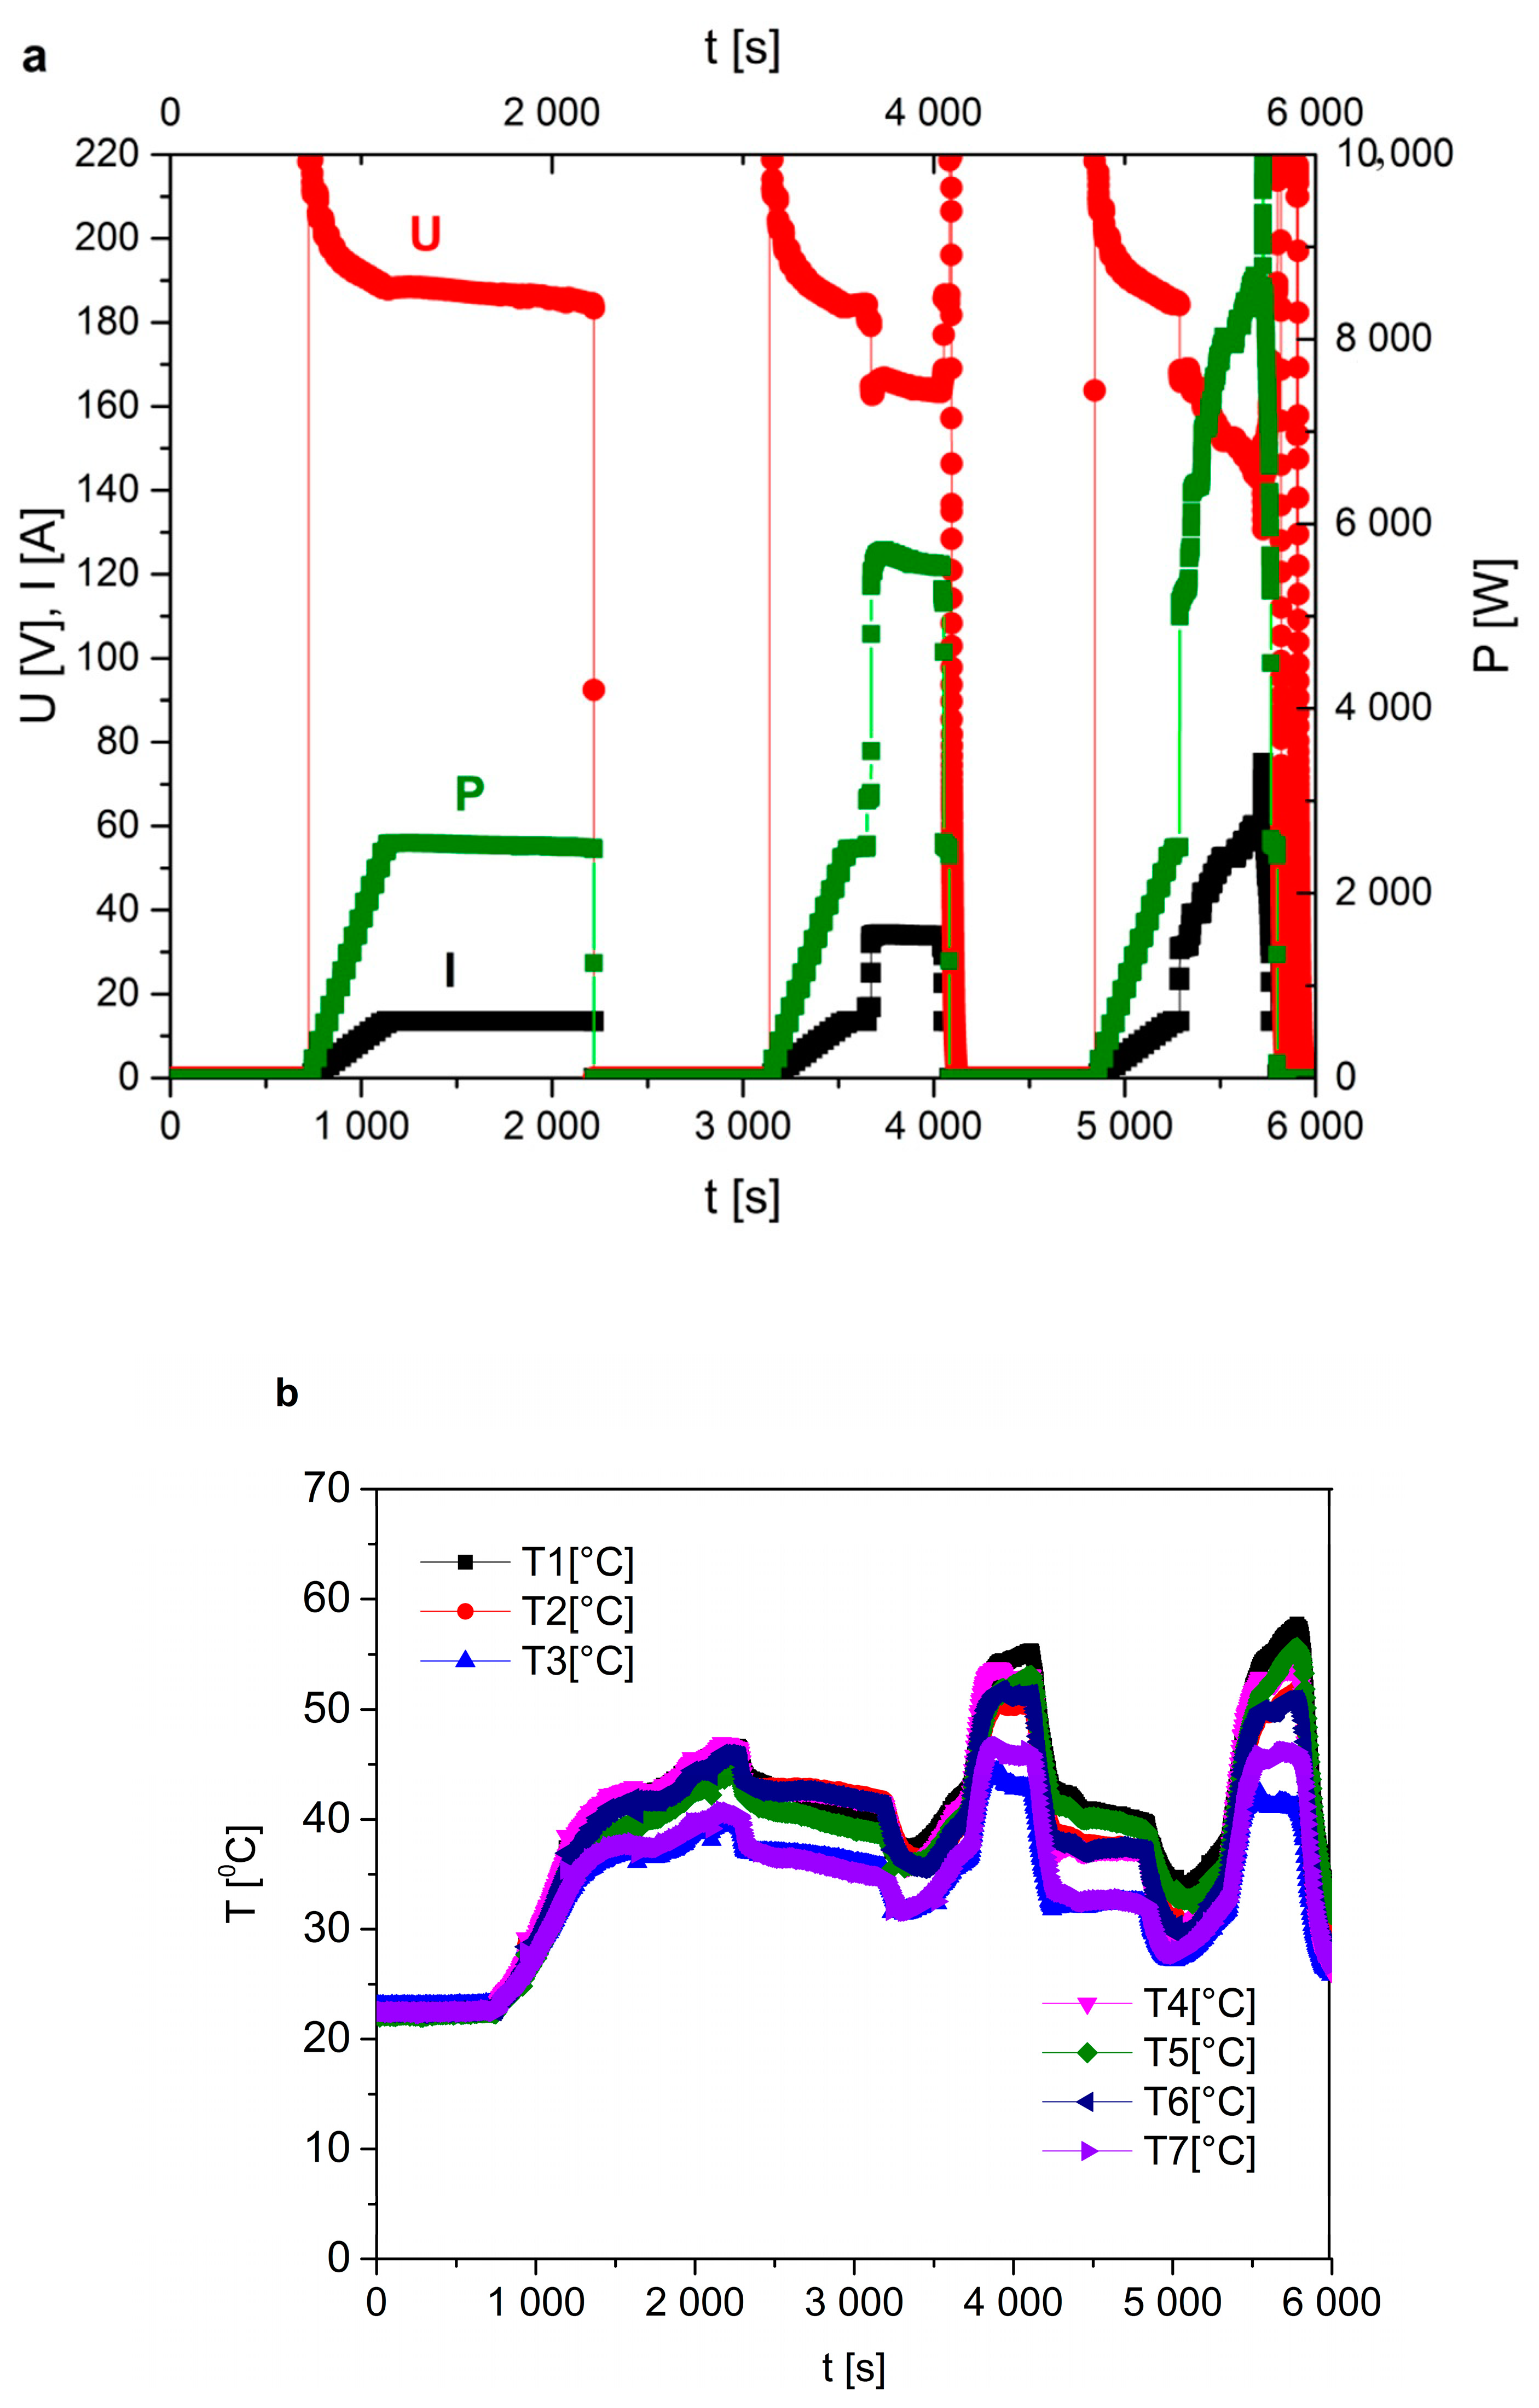
Figure 10a presents an example of a test examining the variation in electrical parameters such as voltage (U), current (I), and electrical power (P) vs. time.
The first run of the constructed V-type PEMFC stack was conducted immediately after supplying hydrogen to two modules. After 750 s, when the PEMFC stack was initiating operation, the current load increased with a ramp of 1 A per 30 s to achieve electrical power of 2.5 kW (one-fourth of nominal power) in conditions characterised by current (I) = 13.5 A and voltage (U) = 183 V; the PEMFC stack operated in these conditions for no longer than 1000 s. Subsequently, the investigated power source was turned off. When turned on a second time, the assumed electrical load of the PEMFC stack rose to 5 kW. After the power source was turned on again for 3200 s, the current (I) load increased with a ramp of 1 A/30 s until it reached 13.5 A and P = 2.5 kW. At t = 3800 s, an increase in the current to 5.5 kW (164 V, 34 A) was reached. This load was continued up to 4100 s. Subsequently, the PEMFC stack was turned off again. In the third test, at t = 4800 s, the electrical current load also increased with a ramp of 1 A/30 s, to 2.5 kW, and again at 5300 s to 5.5 kW (164 V, 34 A). At t = 5600 s, the power source reached the nominal power of 10 kW (130 V, 75 A).
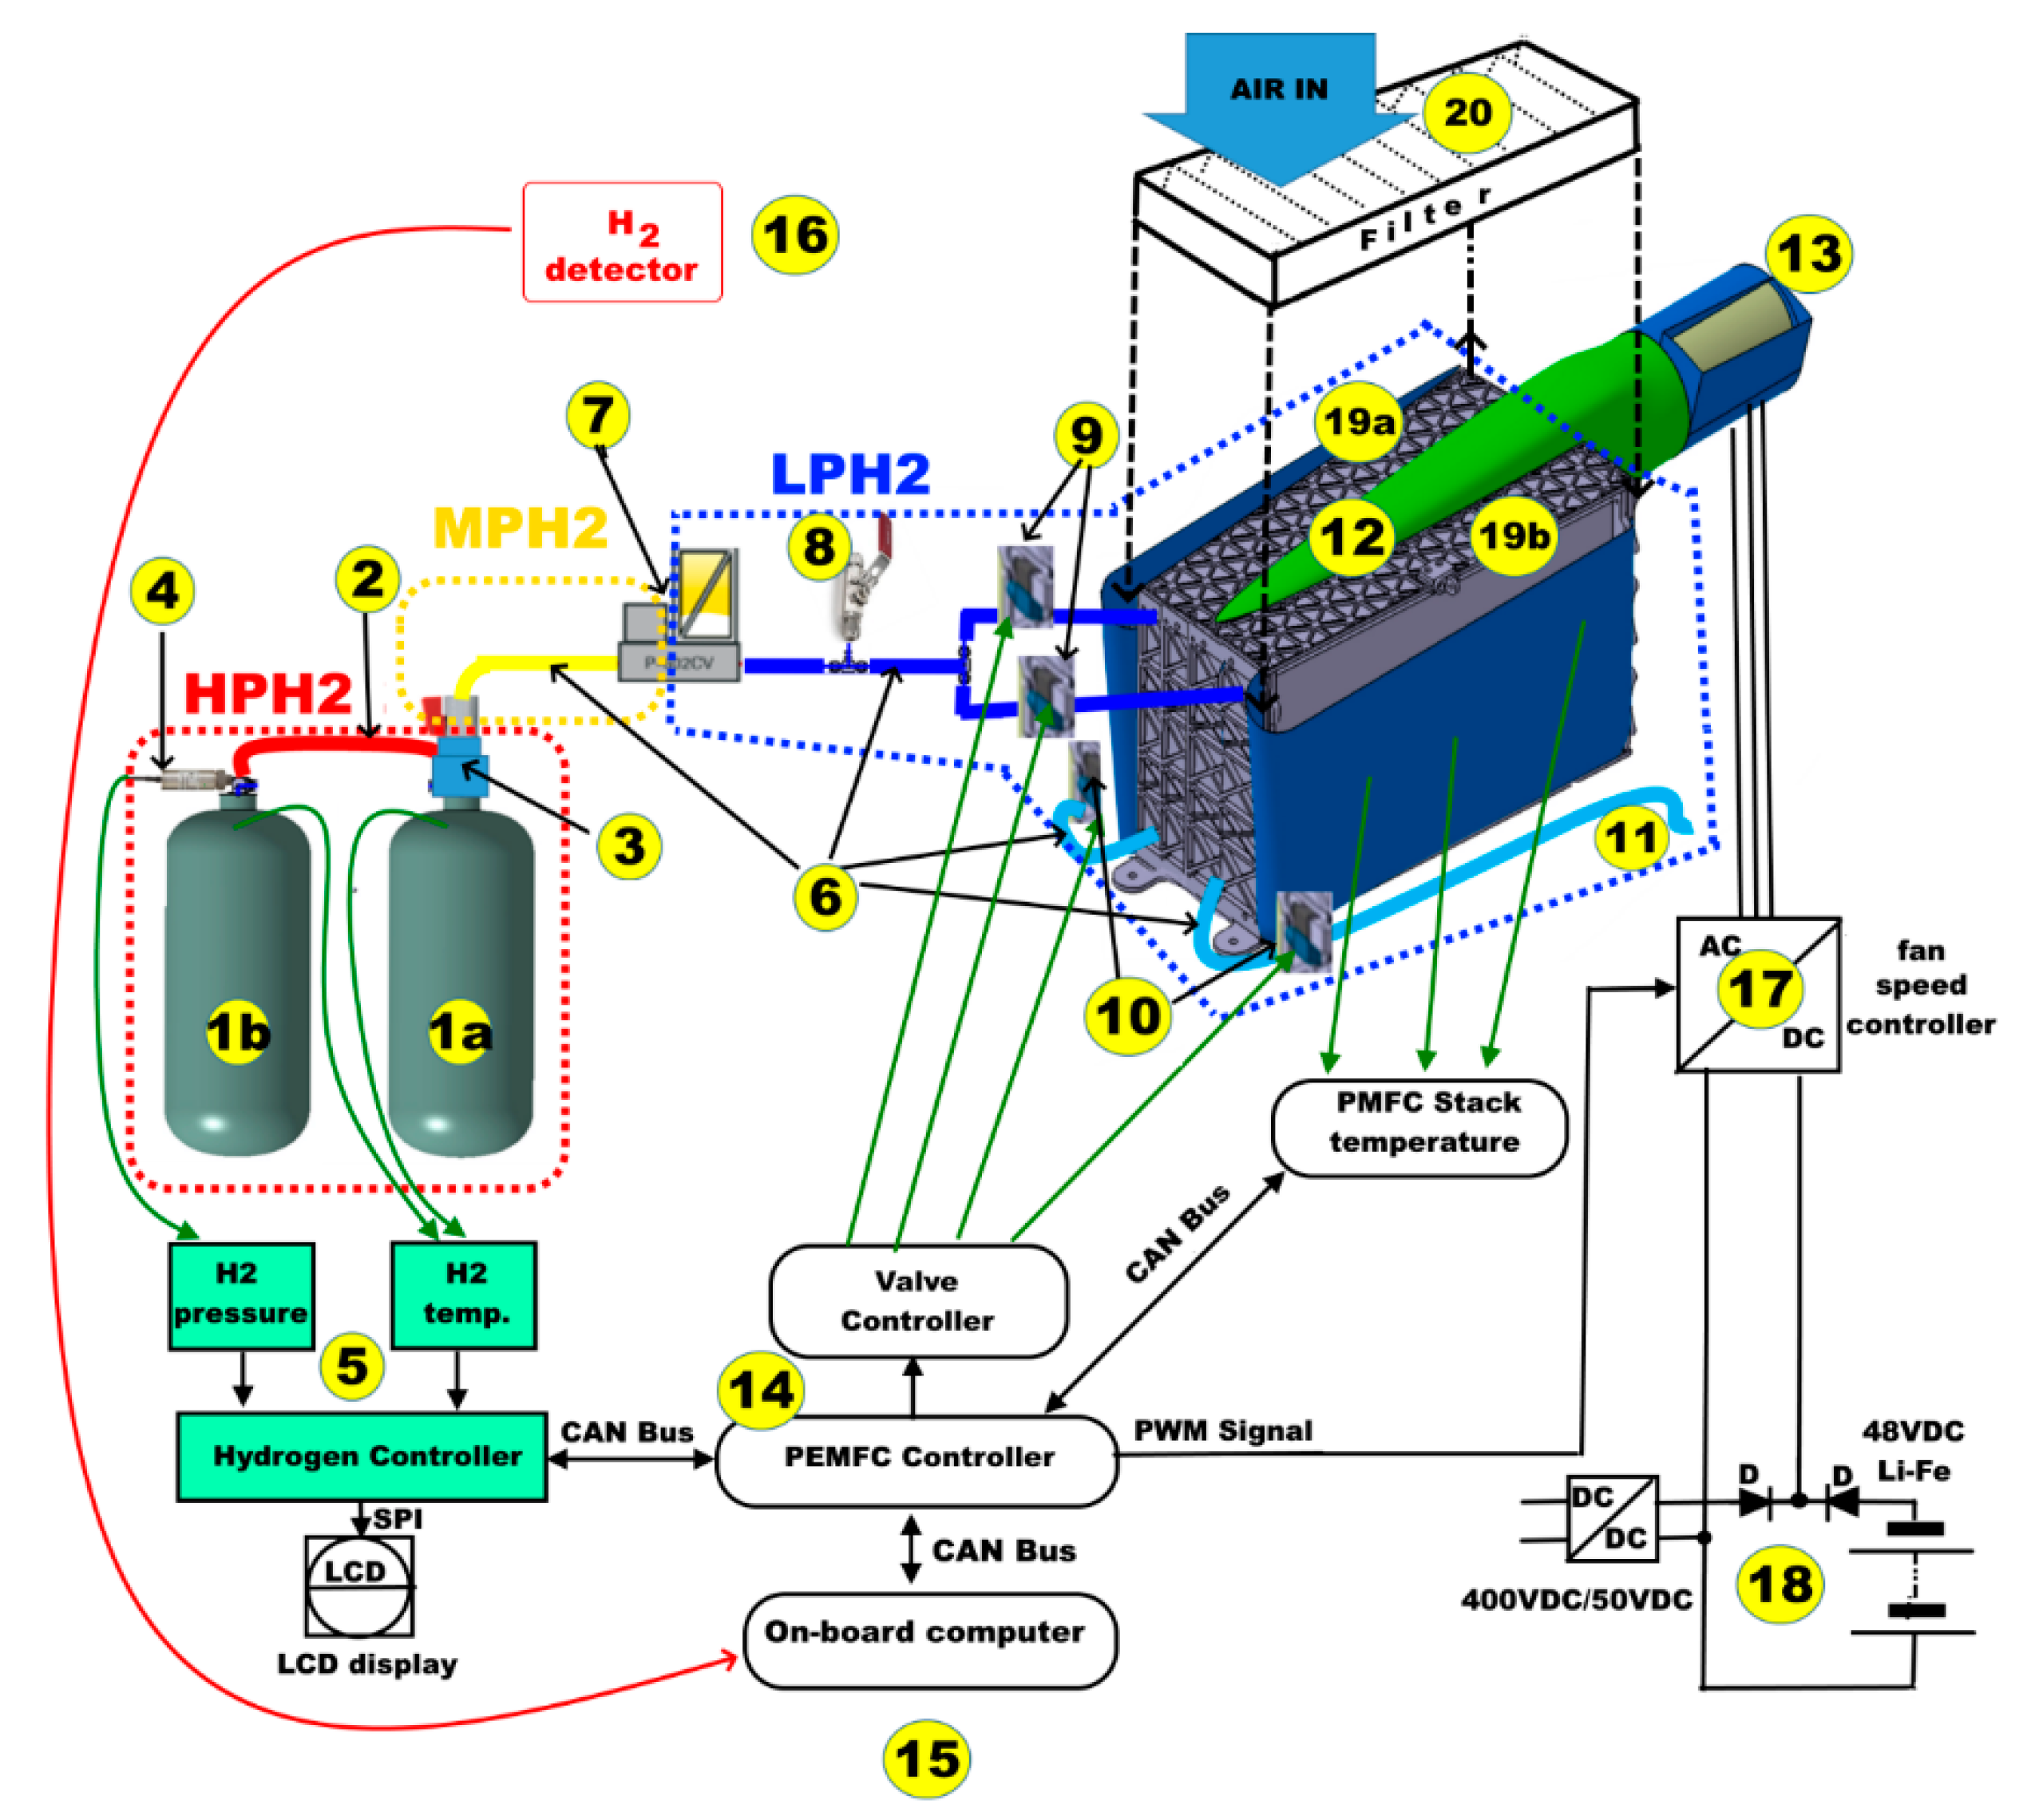
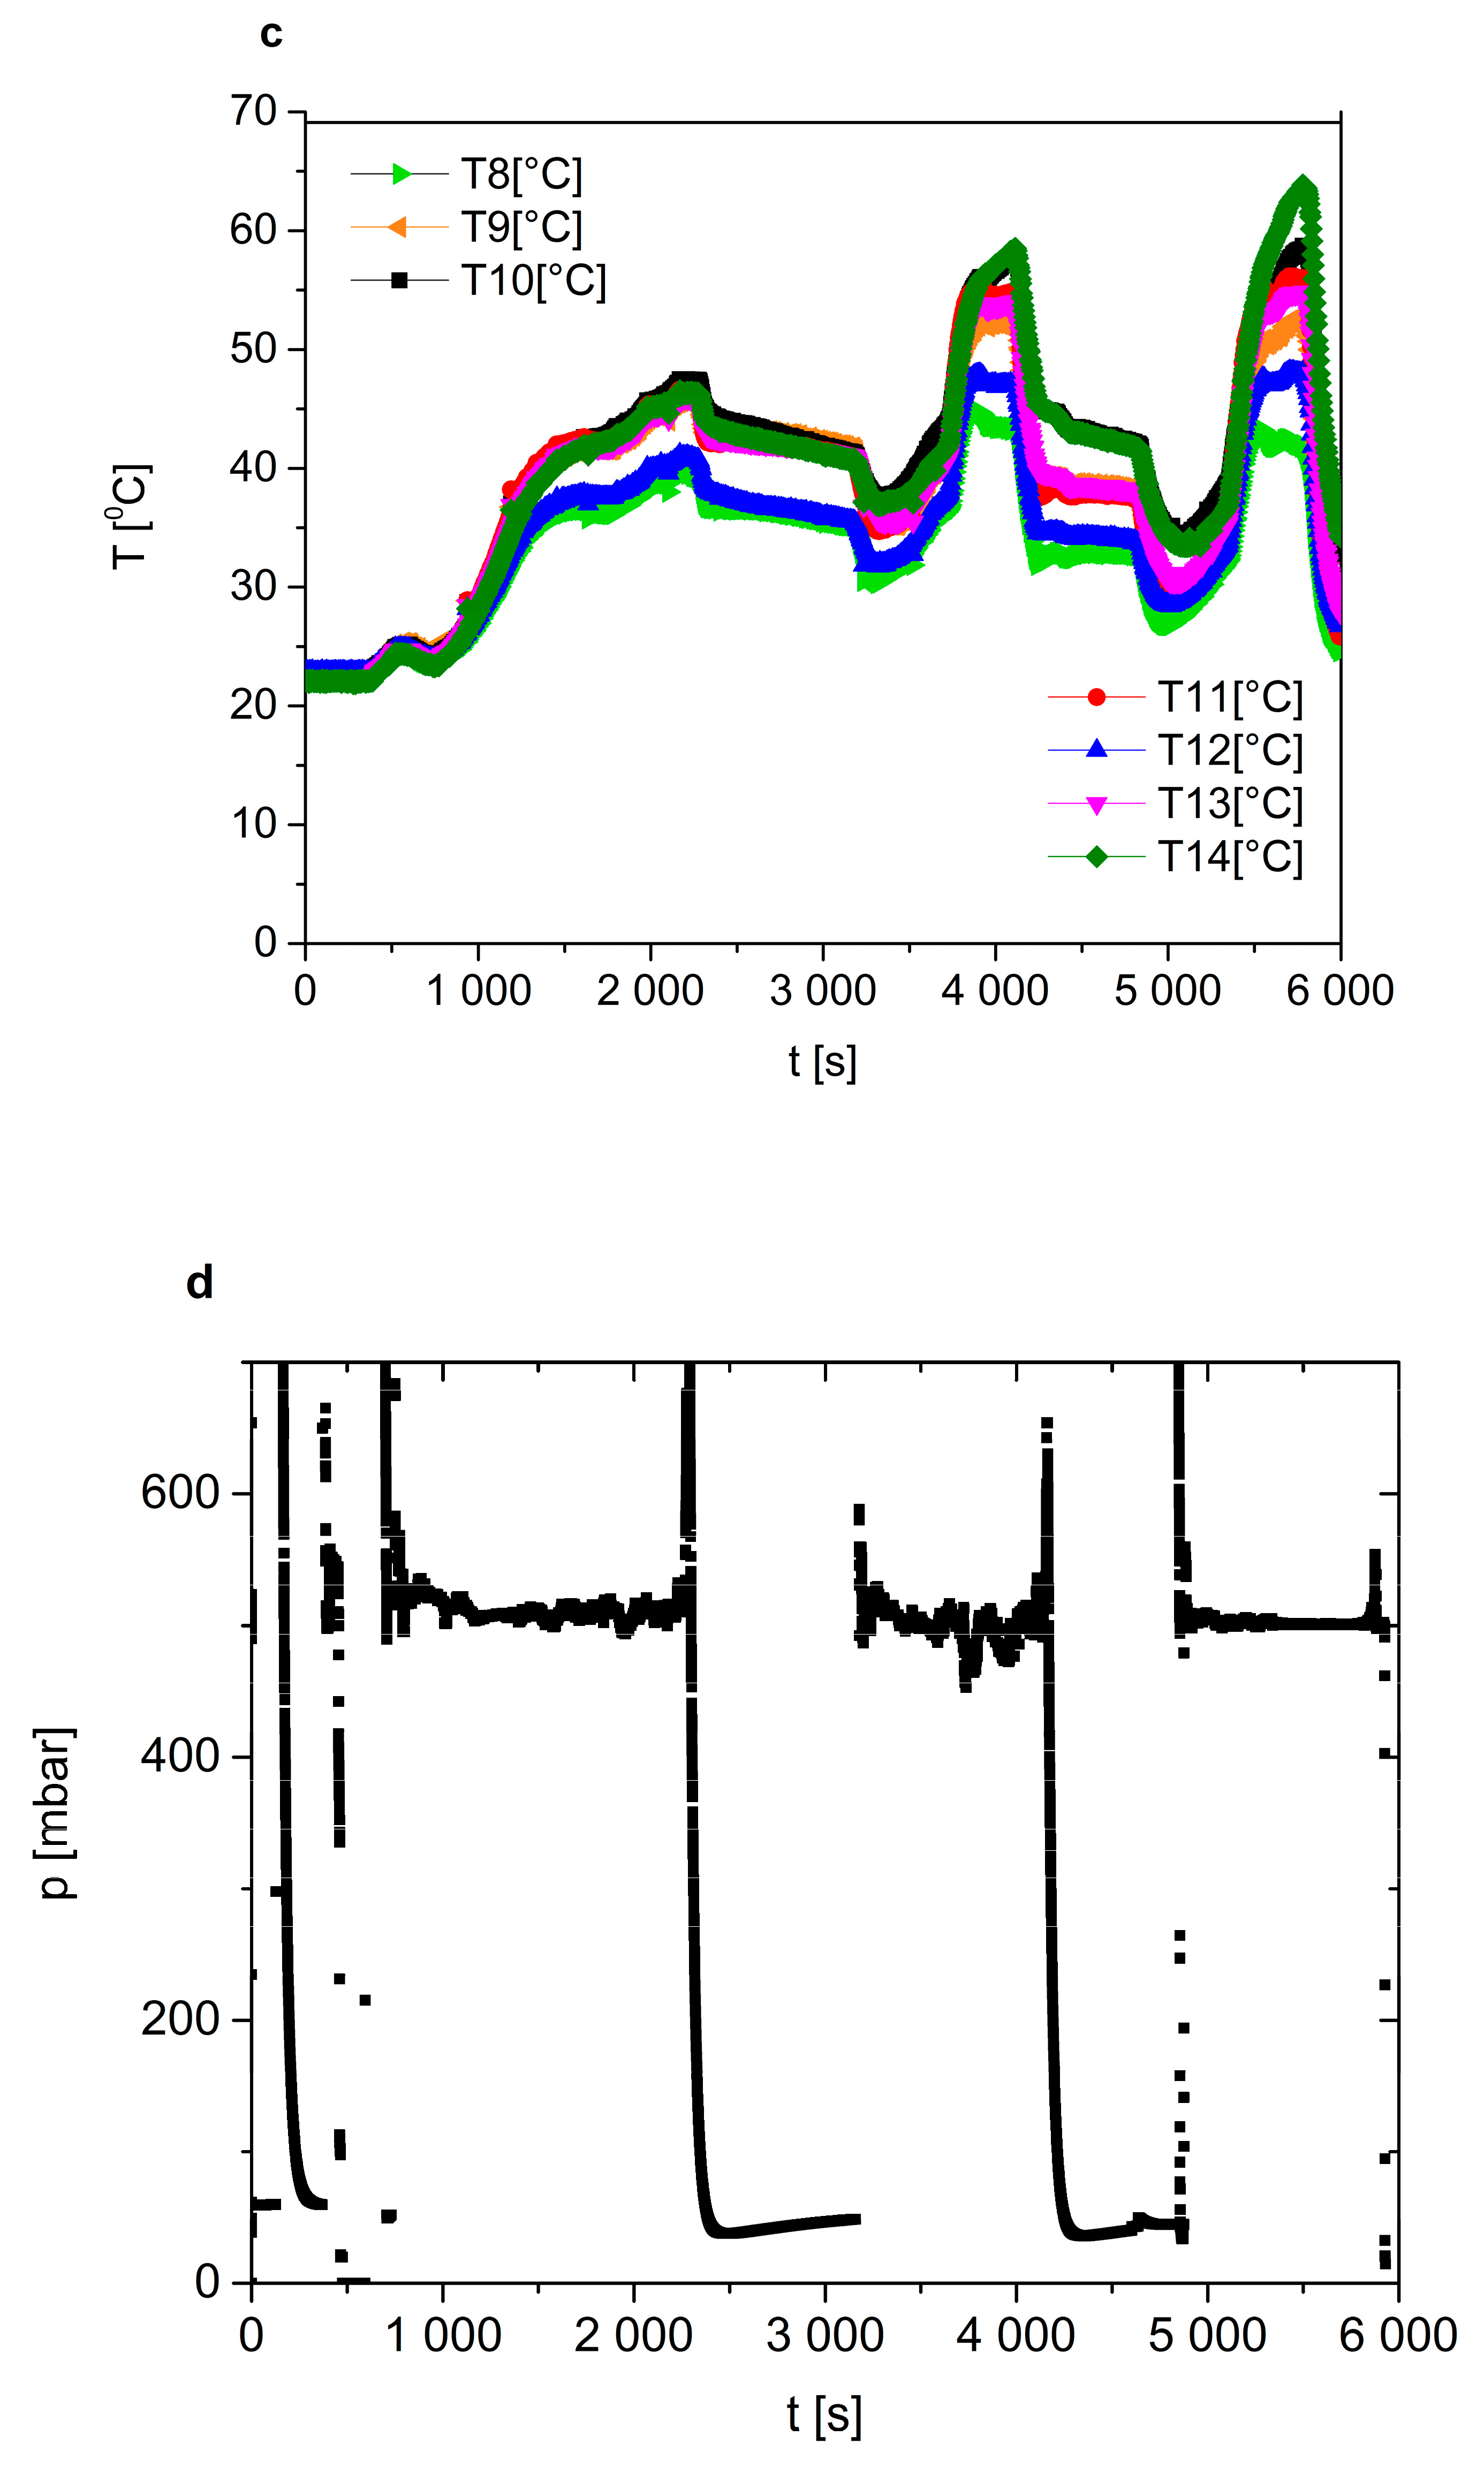
Analysis of temperature distribution is also necessary to ensure the performance and durability of a PEMFC stack designed for transport and avionic applications. The distribution of temperature T measured in the stack in module (A) or (B) is presented in Figure 13b,c. The installation locations of temperature sensors T1–T14 correspond to Figure 2. The temperature sensors measuring the temperature in module (A) are marked T1–T7 in module (B) T8–T14. T15 denotes a reference temperature measured in the outlet channel. All collected data refer to the electrical performance of the PEMFC stack in the conditions shown in Figure 13a.
As can be seen from Figure 13b,c, the temperature increased when the stack operated with higher electrical power. The maximum temperature of the stack with 10 kW of power was ~60 °C. Increases in temperature were observed for sensors T1, T5, T10, and T14, i.e., the points farthest from the air outlet channel of the constructed stack. The lowest temperatures were recorded by T3 and T8, the points near the outlet channel. The temperature difference ΔT between the minimum and maximum recorded temperatures increased with increasing loads, reaching values of approximately 12–13 °C in the measurement conditions corresponding to Figure 13a.
Stabilisation of the partial pressure of the hydrogen (pH2) introduced directly into the anode chambers of the PEMFC stack should also be analysed under variable electrical load. The variation of pH2 vs. time under applied experimental conditions (from Figure 13a) is presented in Figure 13d.
As can be seen in the graph in Figure 13d, the experimental data show the average value of hydrogen stabilisation pressure established by an automatic electronic pressure regulator at the hydrogen input of the 10 kW PEMFC stack. The hydrogen inlet pressure changed due to the operation of the anode flushing system (periodic opening of the purge flush valve every 10 s). It can be seen that over the entire tested load range of the 10 kW PEMFC stack, adequate hydrogen flow capacity is ensured, maintained by the pressure regulator an average level of P = 500 mbar depending on the degree of electrical load of the device. The increase in electrical power results in a higher level of hydrogen consumption and a lower average value of pressure stabilisation; however, the use of an active pressure regulator (with stabilisation pressure set at 500 mbar) enabled the pressure to be maintained at the required level. The most stable pressure values (PH2) occurred during the third start-up when the stack was fed with hydrogen from composite cylinders, as the supply line was then shortest and no pressure drops caused by increased flow in the course of flushing of the anode space (opening the ‘purge’ valve) occurred.
In the case of the constructed V-type 10 kW PEMFC stack, hydrogen consumption under variable dynamic load operation during the humidification process as well as purification carried out by means of the short-circuit unit (SCU) were also analysed. The purification of the MEA during the purging process has a great impact on stack performance. There is no description in the literature concerning the response of hydrogen consumption under variable electrical load. For practical applications involving the constructed V-type PEMFC stack and variation in dynamic hydrogen consumption occurring during the purge via the SCU process should be discussed. These data are necessary to elaborate real-time control of the operation of the fuel cell power system. The PEMFC stack suffers from reversible performance loss during operation caused by oxidation of the Pt catalyst which, in turn, reduces the electrochemically active surface area. An improvement in PEMFC performance (a small gain of potentials) due to purging processes is expected based on the removal of the Pt hydroxide and oxide layers formed on the Pt catalyst, thus resulting in a larger effective surface area of Pt available for the electrochemical reaction [38,39].
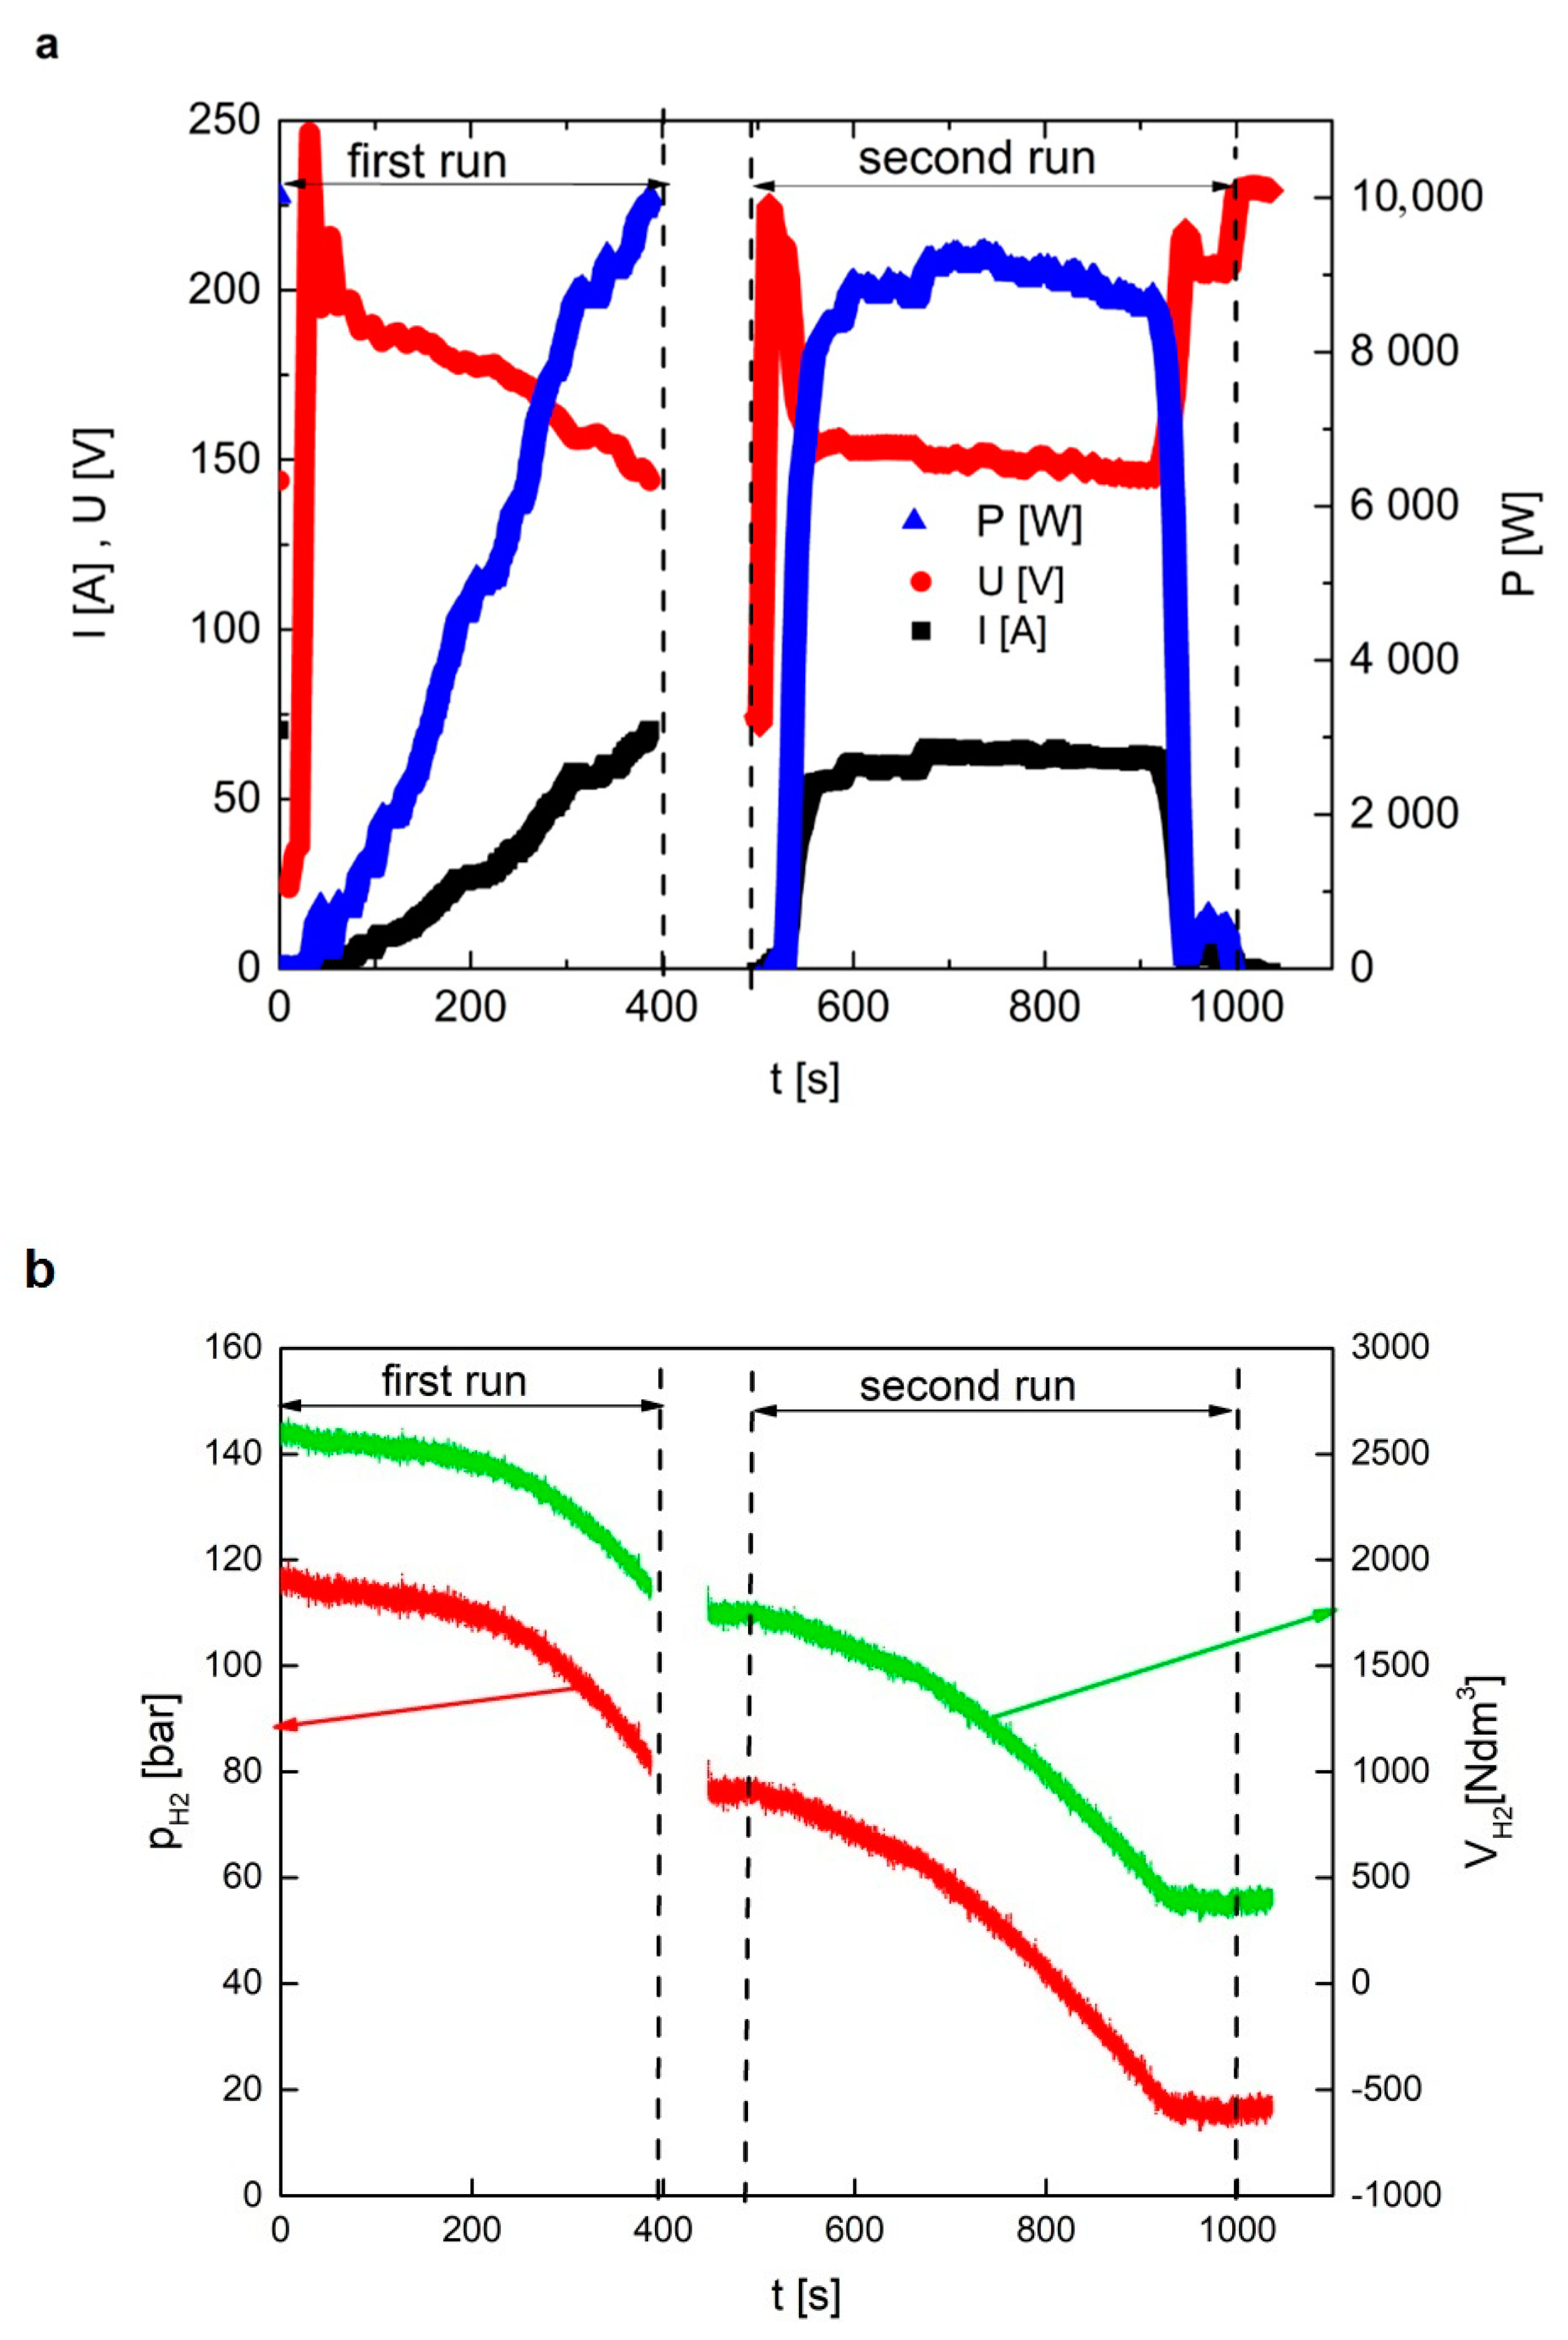
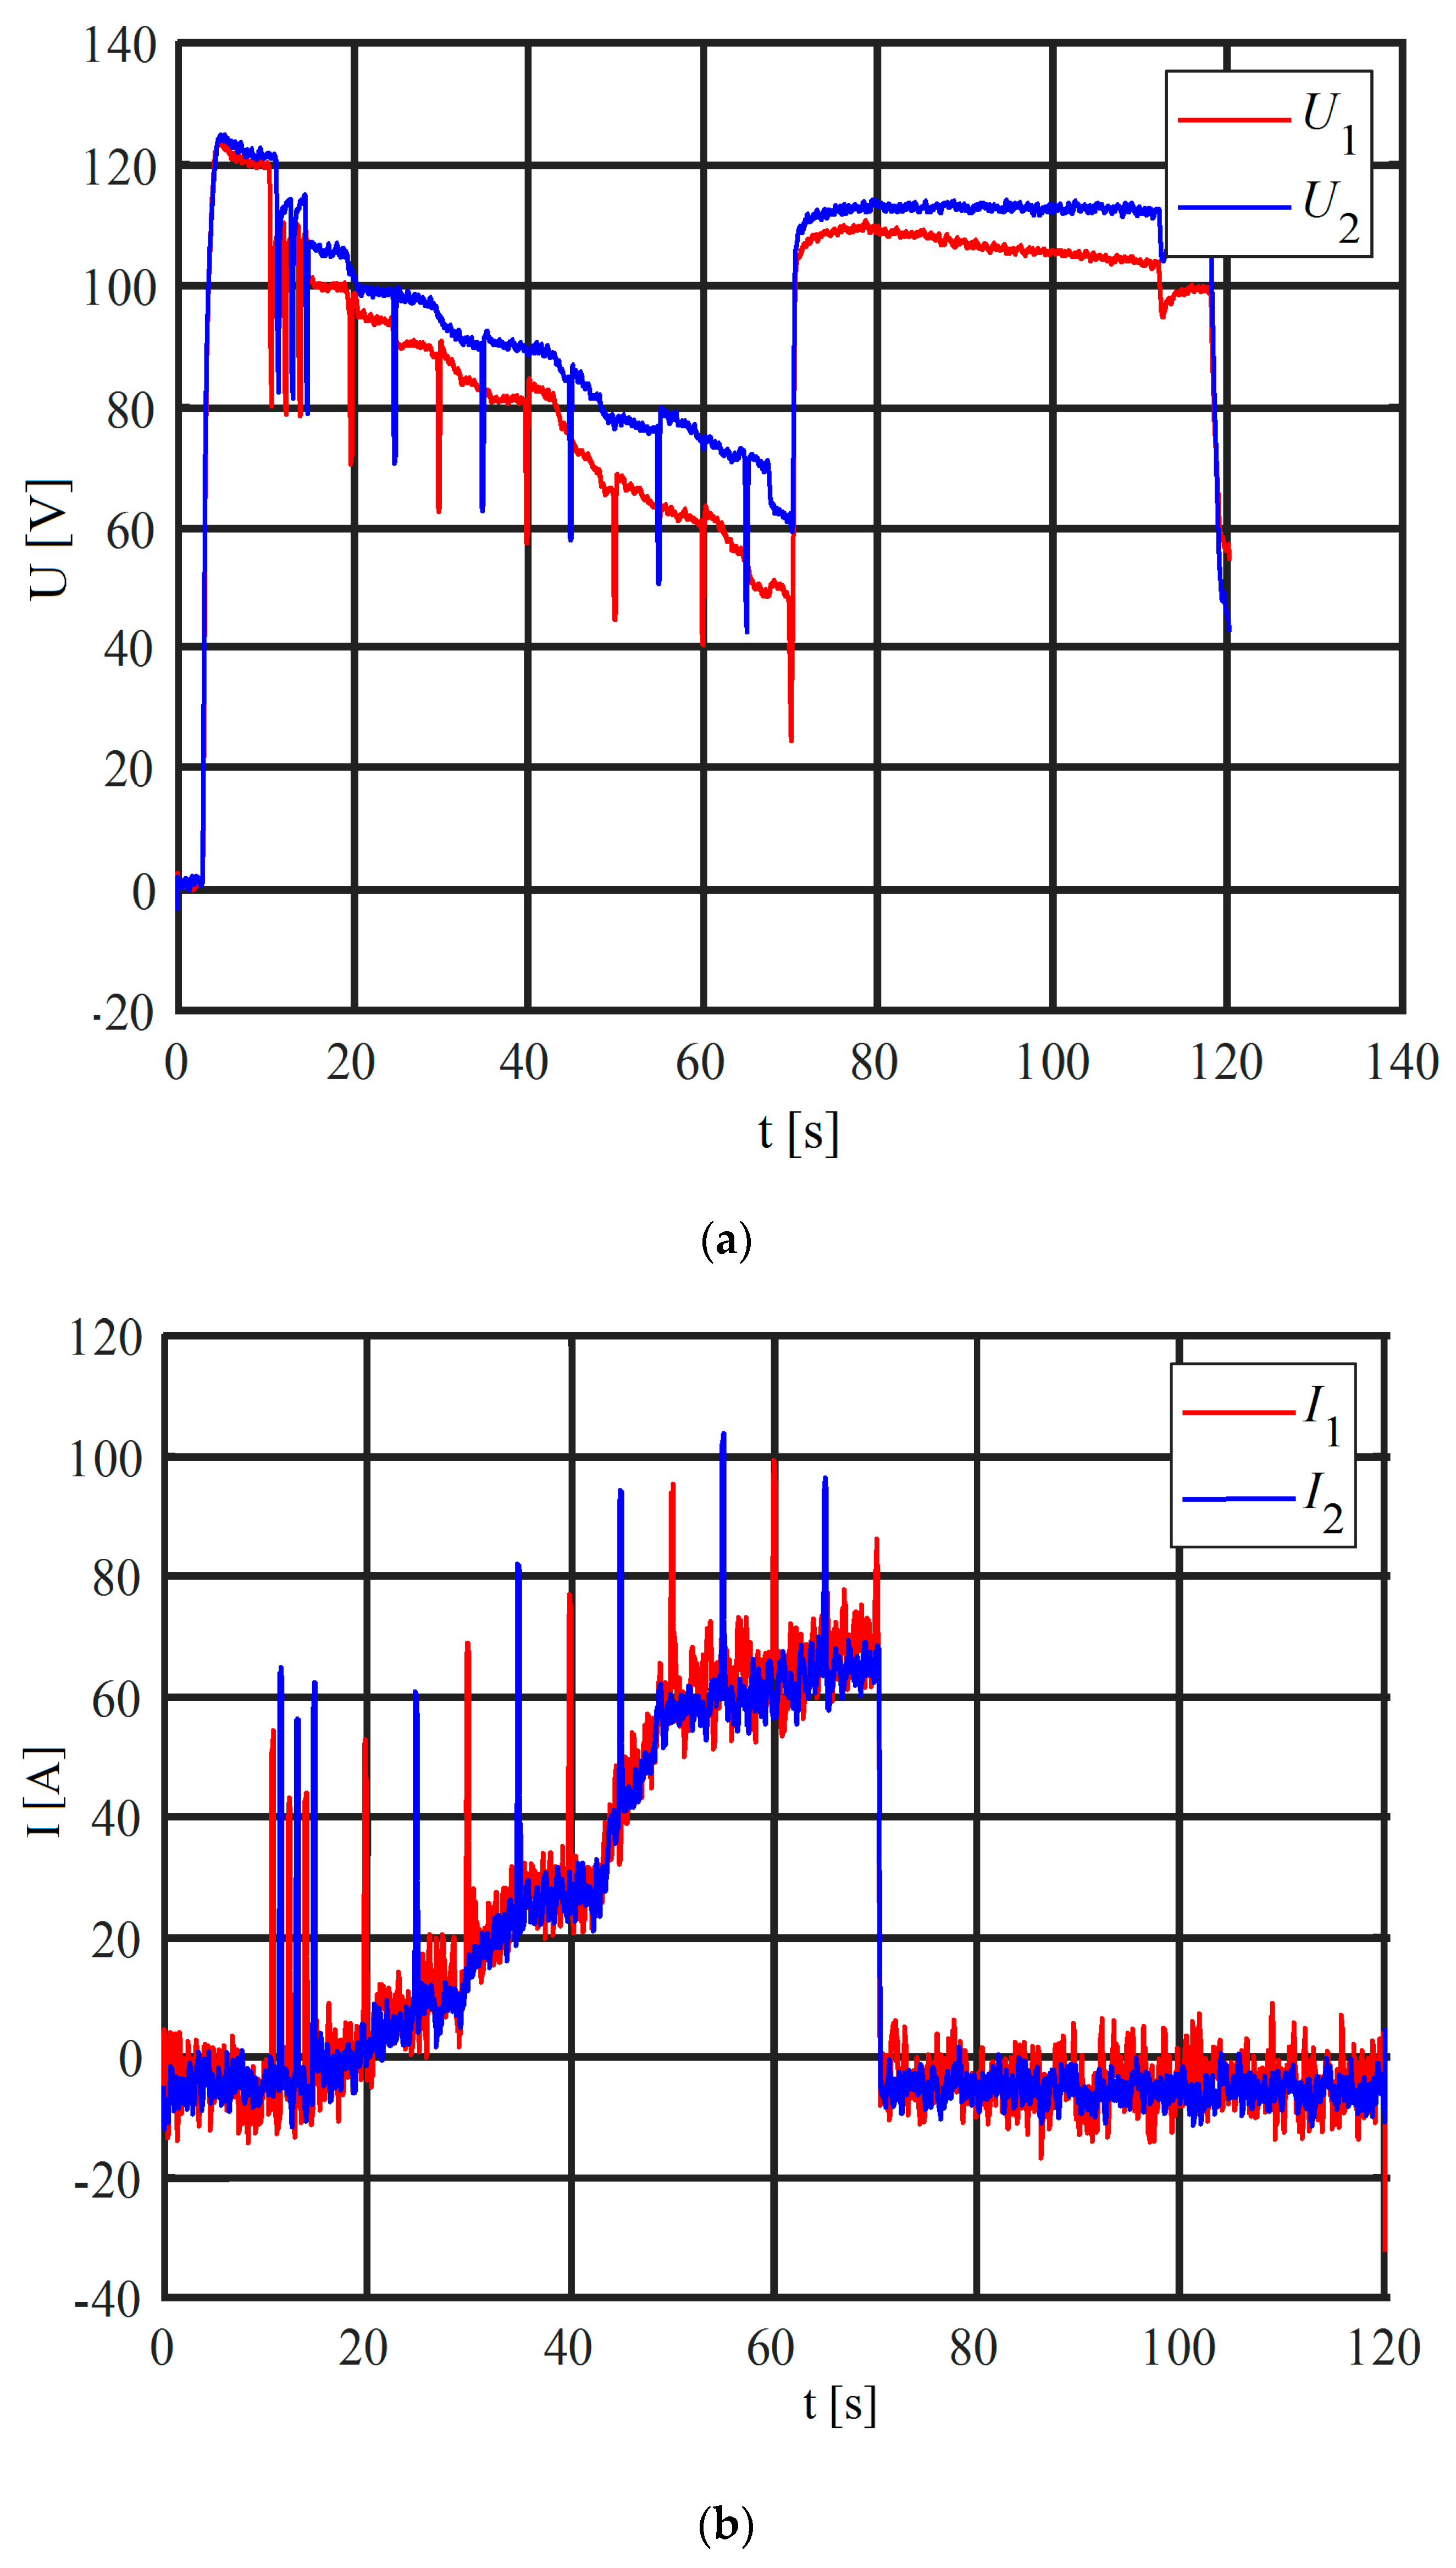
Figure 14a presents the variation of electrical parameters such as voltage (U), current (I), and electrical power (P) during the operation of the V-type constructed PEMFC stack under variable electrical load, involving a procedure in which the device is first turned on, then turned off, and finally turned on again. The variation in partial pressure, the volume of hydrogen storage in composite cylinders, and the amount of fuel consumed during electrical operation of the PEMFC stack vs. time during this experiment are presented in Figure 14b.
The experimental conditions are given in Figure 14a. In the first part of the experiment (from 0 to 400 s), the hydrogen pressure varied between 120 and 80 bar due to the utilisation of hydrogen in the fuel cell stack. In these conditions, the electrical load of the stack was increased from 0 to 10 kW and the stack was turned off. During the second part of the experiment (450–1000 s), hydrogen pressure varied between 80 and 20 bar due to the utilisation of hydrogen for performance of the stack with 8 kW of power. Analysis of variation in the hydrogen volume, which was stored in two composite cylinders and then utilised during the operation of the stack within the period of time under consideration, was also carried out. In the case of operation of the stack under 9–9.5 kW, which took place over a period ranging from 9 to 14 min, the consumption of total hydrogen was calculated about 145 dm3 H2/min. This estimated value is in close agreement with the consumption measured directly by F-202AV-M20-RAD-44-V mass flow controller. This device was also used during the measurement of intensity of hydrogen flow presented in Figure 11.

3.3. Investigations of an Air-Cooling Performance System for the 10 kW V-Type PEMFC Stack

One of the key functions of an air-cooling system integrated with a PEMFC stack applied in a hybrid power source supplying a propulsion system is to ensure proper humidity and thermal management during operation under variable electric dynamic load. Ensuring adequate air flow while removing heat from the stack is a crucial factor in determining the performance and durability of this power source. Waste heat production from a PEMFC stack depends on operating conditions under different electrical loads. Intensification of air flow within a V-type PEMFC stack eliminates local overheating, thus significantly prolonging its trouble-free operation. However, it is important to maintain proper humidity in the membrane as the excessive flow of non-humidified air can lead to its drying out, thus increasing the internal electrical resistance of the stack and, as a consequence, significantly impairing its performance [16,40,41].
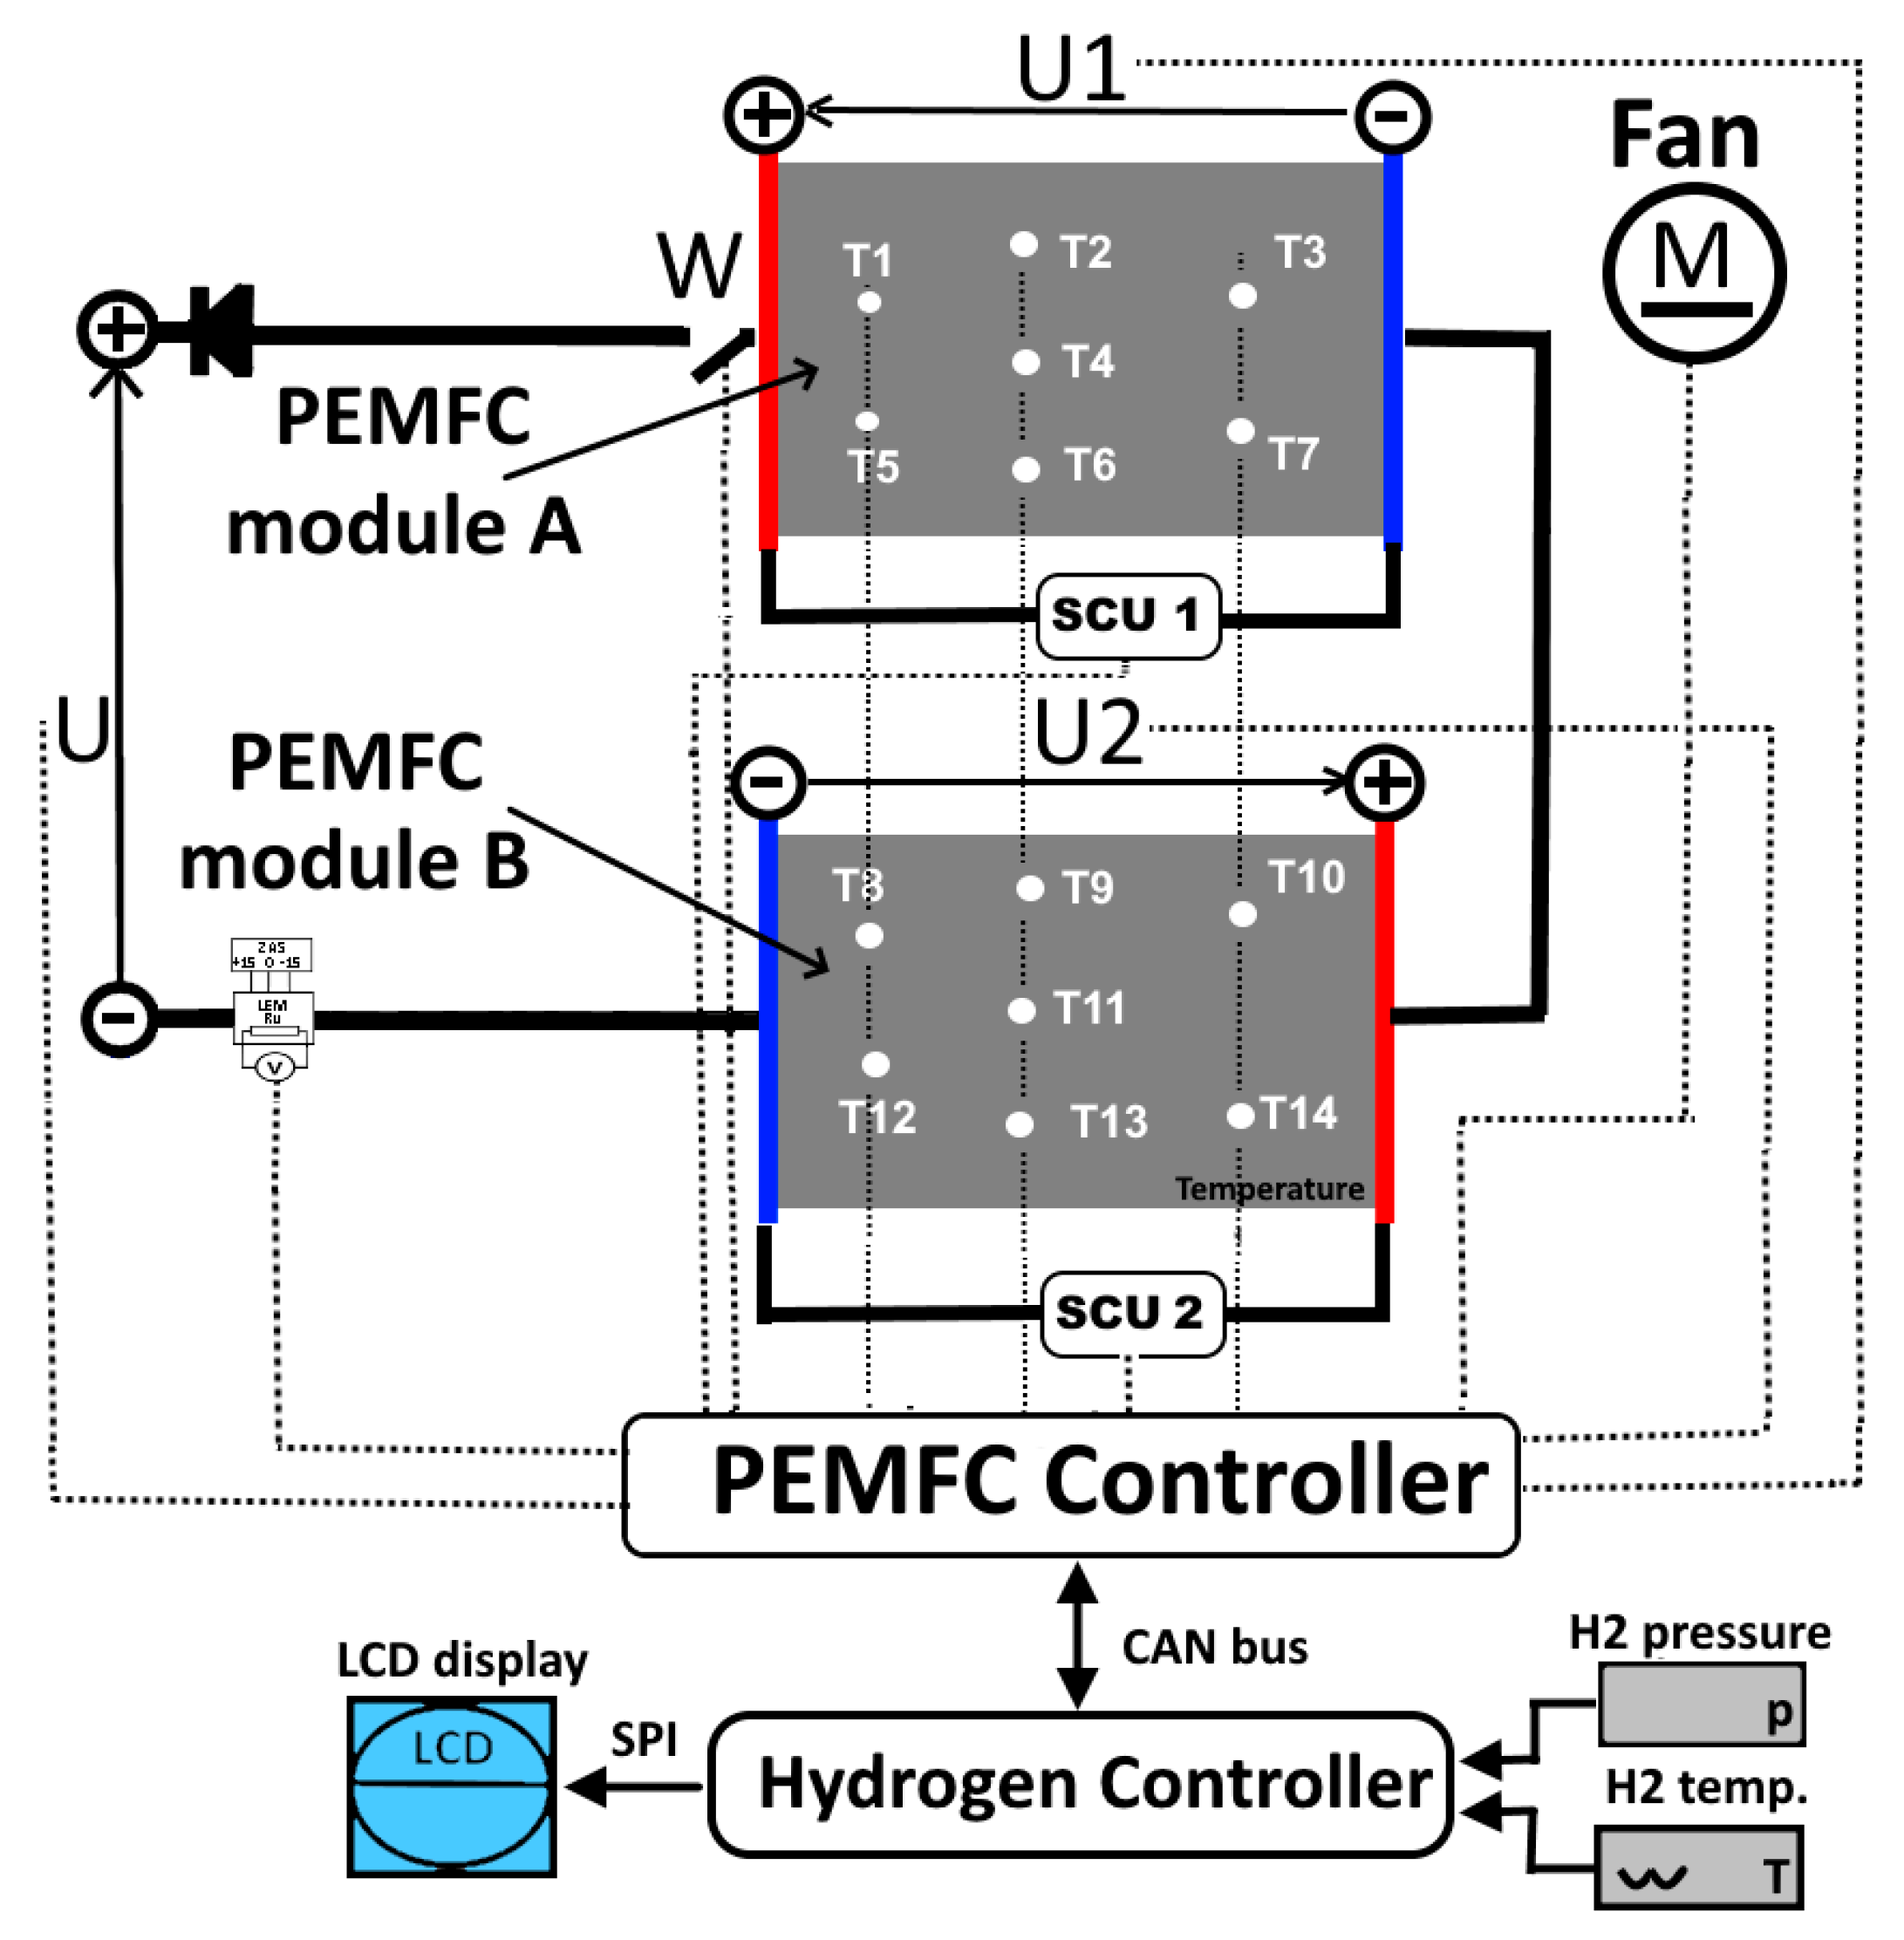
A cooling system managed by effective control algorithms plays the main role in maintaining proper stack operation parameters. Achievement of a high level of control efficiency is understood as the use of follow-up control in accordance with the electrical load state of the PEMFC stack while maintaining the high level of internal efficiency of the flow-inducing fans. An additional criterion for the designed cooling system is its intended use in a powered glider, which necessitates reductions in its size and weight. In the elaboration of an air-cooling system for a 10 kW V-type PEMFC stack, the first thing to be considered is an air-flow installation for air volume flow, as energy loss may occur due to fluid viscosity and channel geometry changes, due to which a drop in partial pressure may occur. In the elaborated system, with air flowing from two cascade axial fans into the inlet of the stack, losses in air volume flow occurred along with partial pressure drops. The high level of efficiency of a cooling system operating with two axial fans is highly recommended.
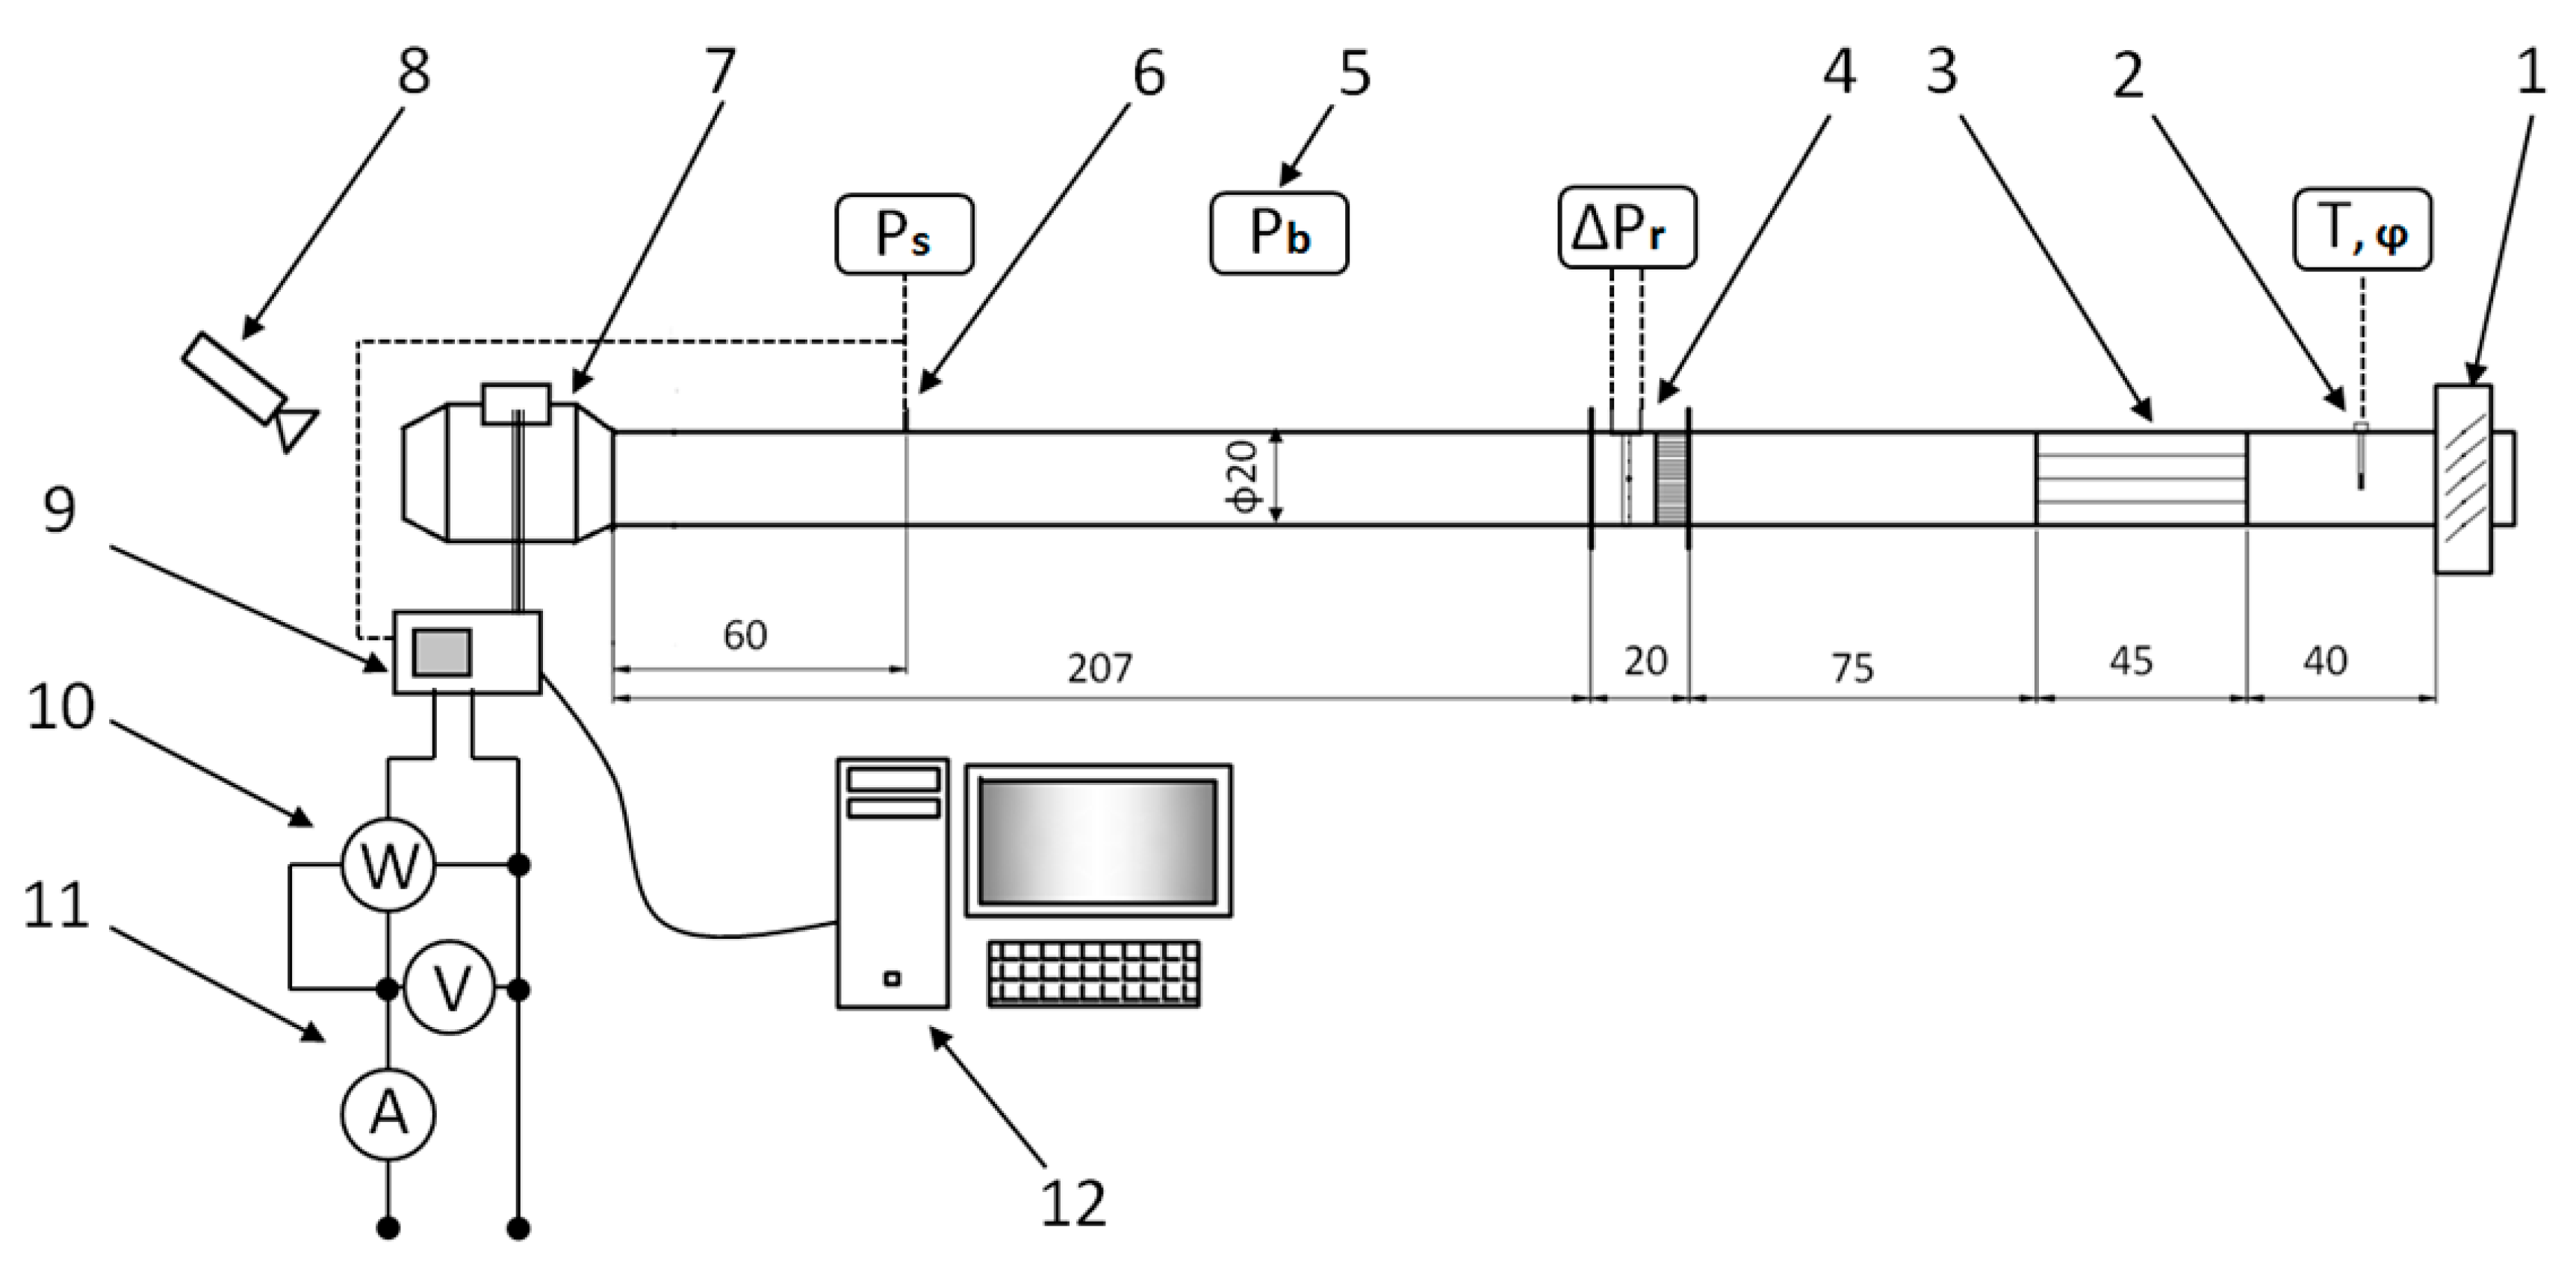
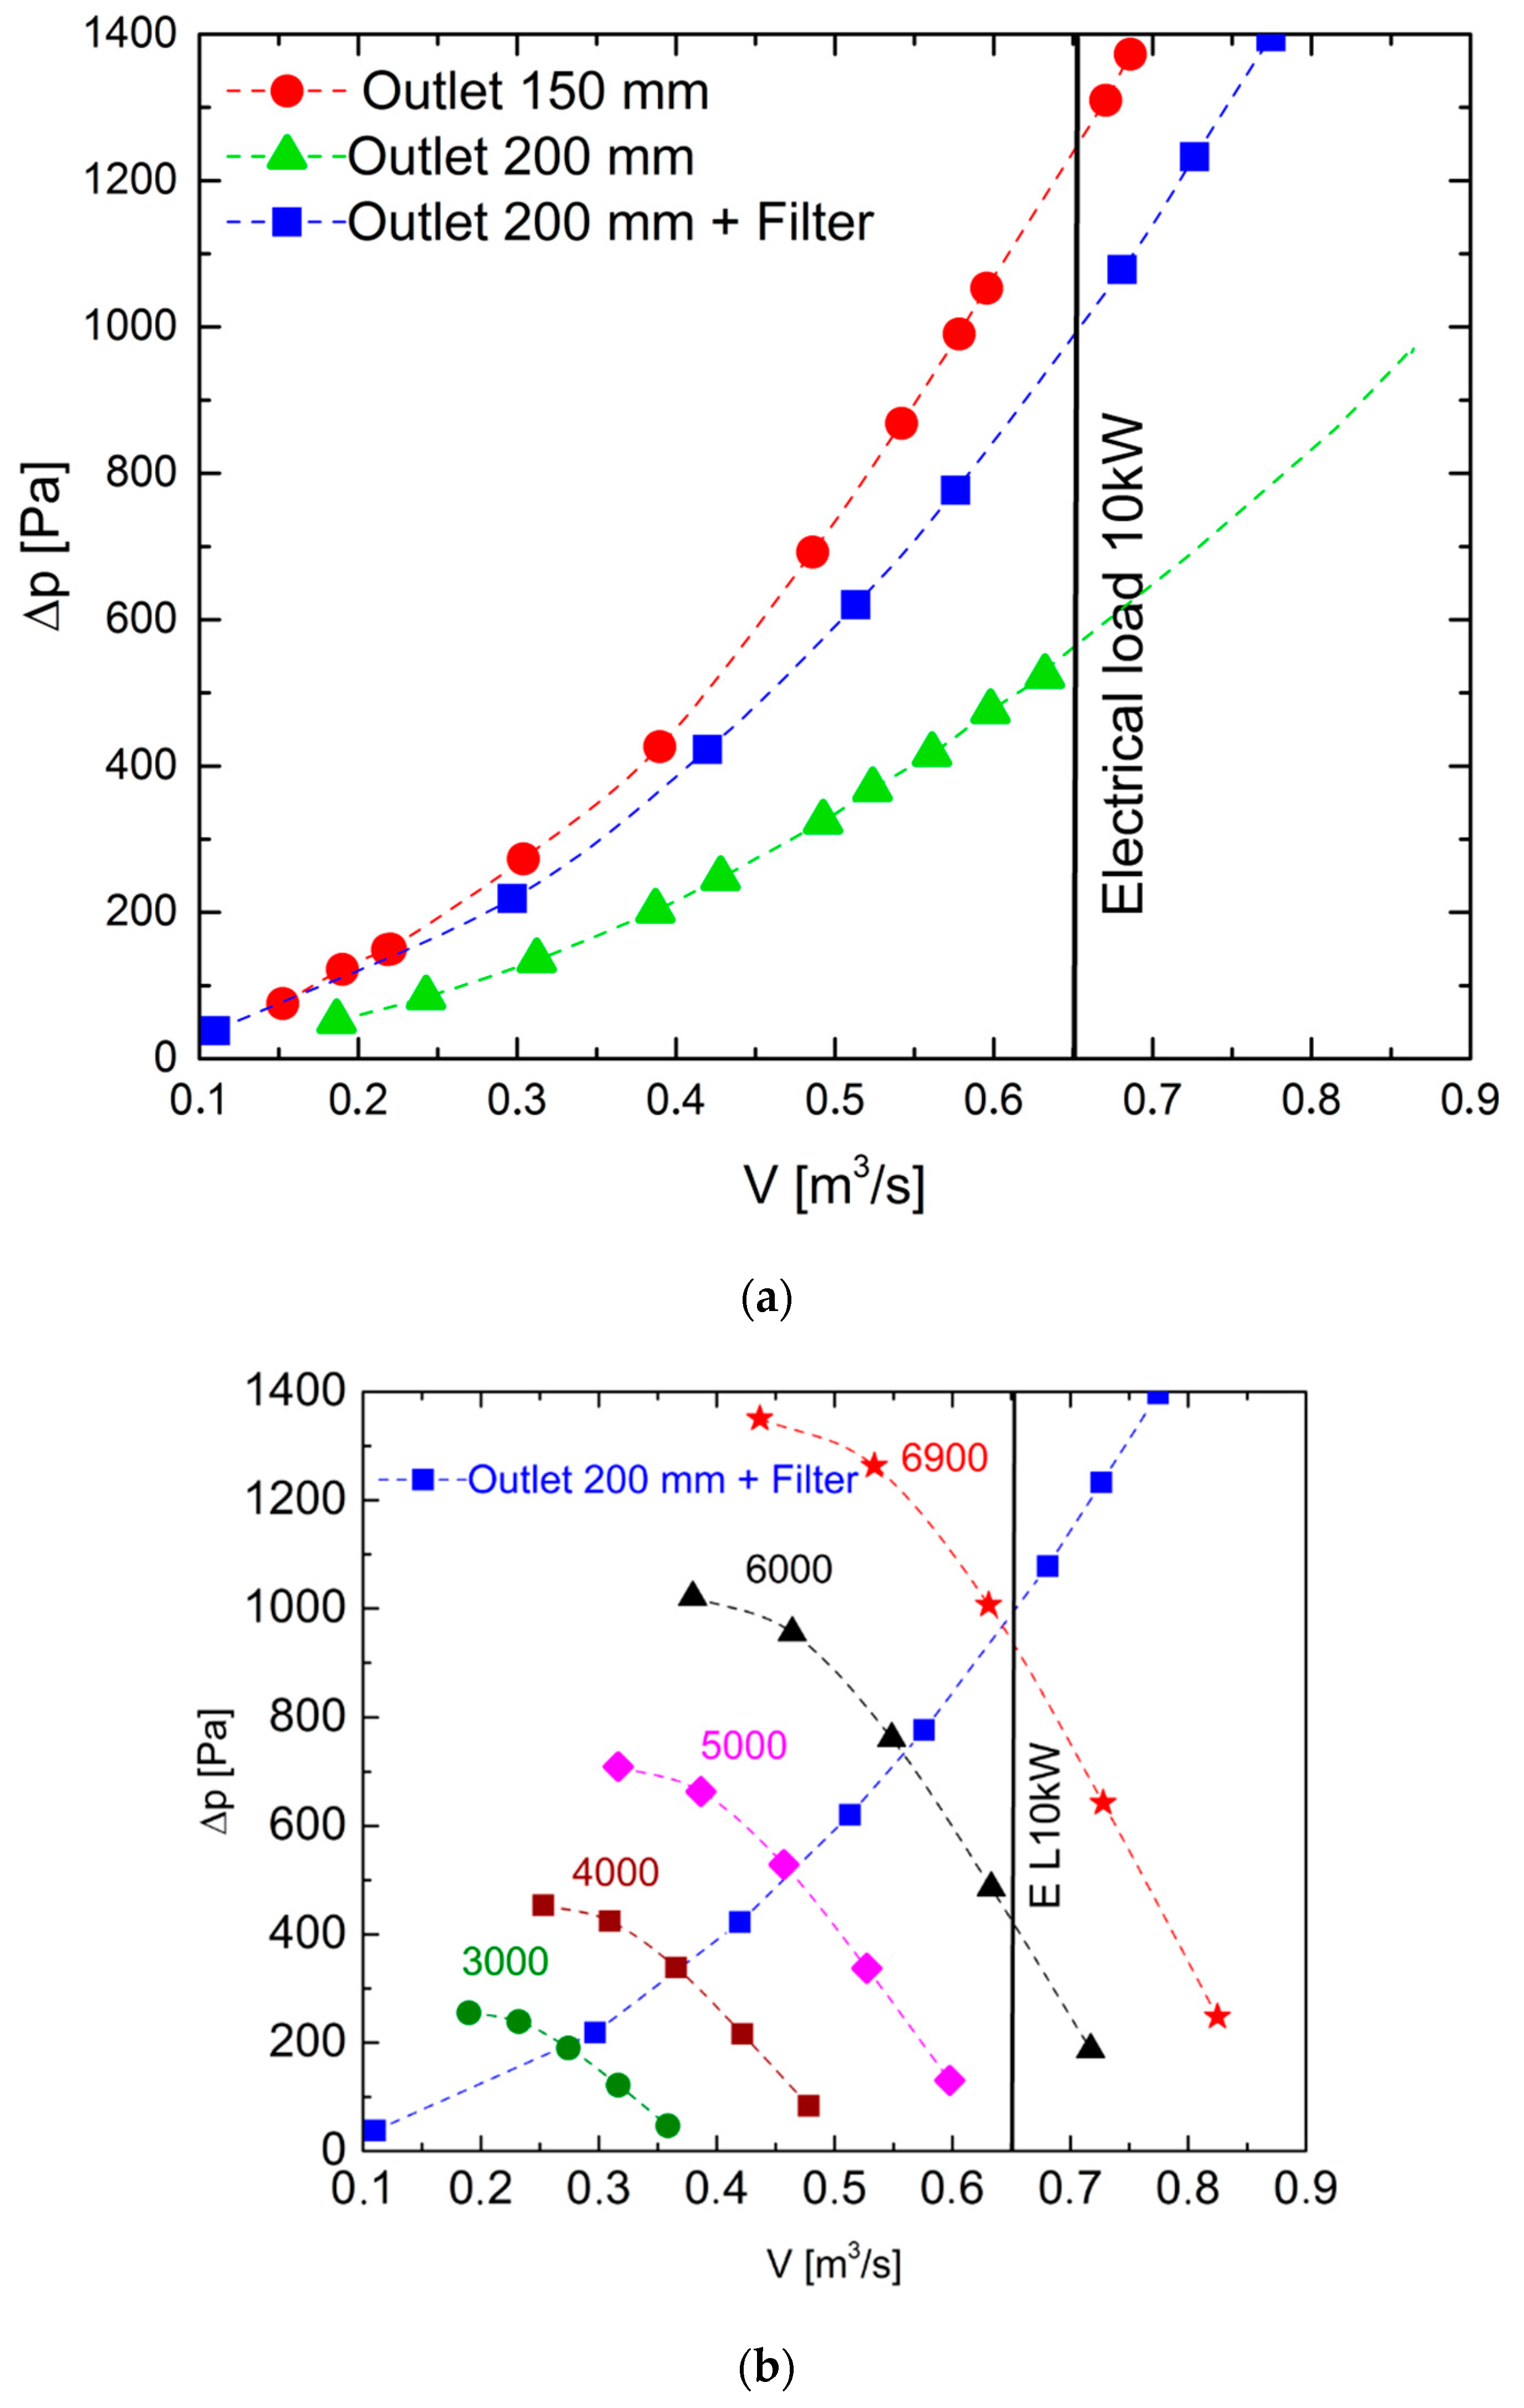
Figure 15a presents the dependence of total pressure losses (Δp) vs. volumetric flow rate (V) determined for the cooling system (whose experimental setup is presented and explained in Figure 6). Two diameters for the outlet (D1 = 150 mm, D2 = 200 mm) to the V-channel were considered in the design of this system. At the nominal electrical power of a 10 kW PEMFC stack, it was found that the required air volumetric flow rate is about 0.65 m3/s. In these conditions, the maximum temperature was close to 65 °C; however, the observed gradient of temperature was no higher than 12 °C. The experimentally measured losses of partial pressure (Δp) vs. air flow rate corresponding to electrical power of 10 kW were estimated at approximately 1200 Pa. In order to reduce the pressure losses, the diameter was increased from 150 to 200 mm. This modification led to a reduction in total pressure losses by more than half, i.e., to ca. 550 Pa. It is also known that in order to overcome air flow resistance, electrical power consumption increases nearly linearly relative to pressure losses. In the course of these investigations, the application of protective dust filters in the air-cooling system to cover the V-type PEMFC stack was also considered. Application of protective filters is necessary in aviation implementations due to the solid airborne contaminants which are caught on this surface during take-offs and landings. It was found that the geometry with the applied filter caused an increase in partial losses by 100 Pa for the nominal power of 10 kW.
Figure 15b presents the dependence of pressure losses vs. air volumetric flow rate. Data obtained from a numerical simulation as well as from the experimental tests are presented; close agreement was obtained. The data presented in Figure 15b show that in a 10 kW V-type PEMFC stack operated at nominal power, the rotor speed required to ensure adequate cooling is 6900 rpm.
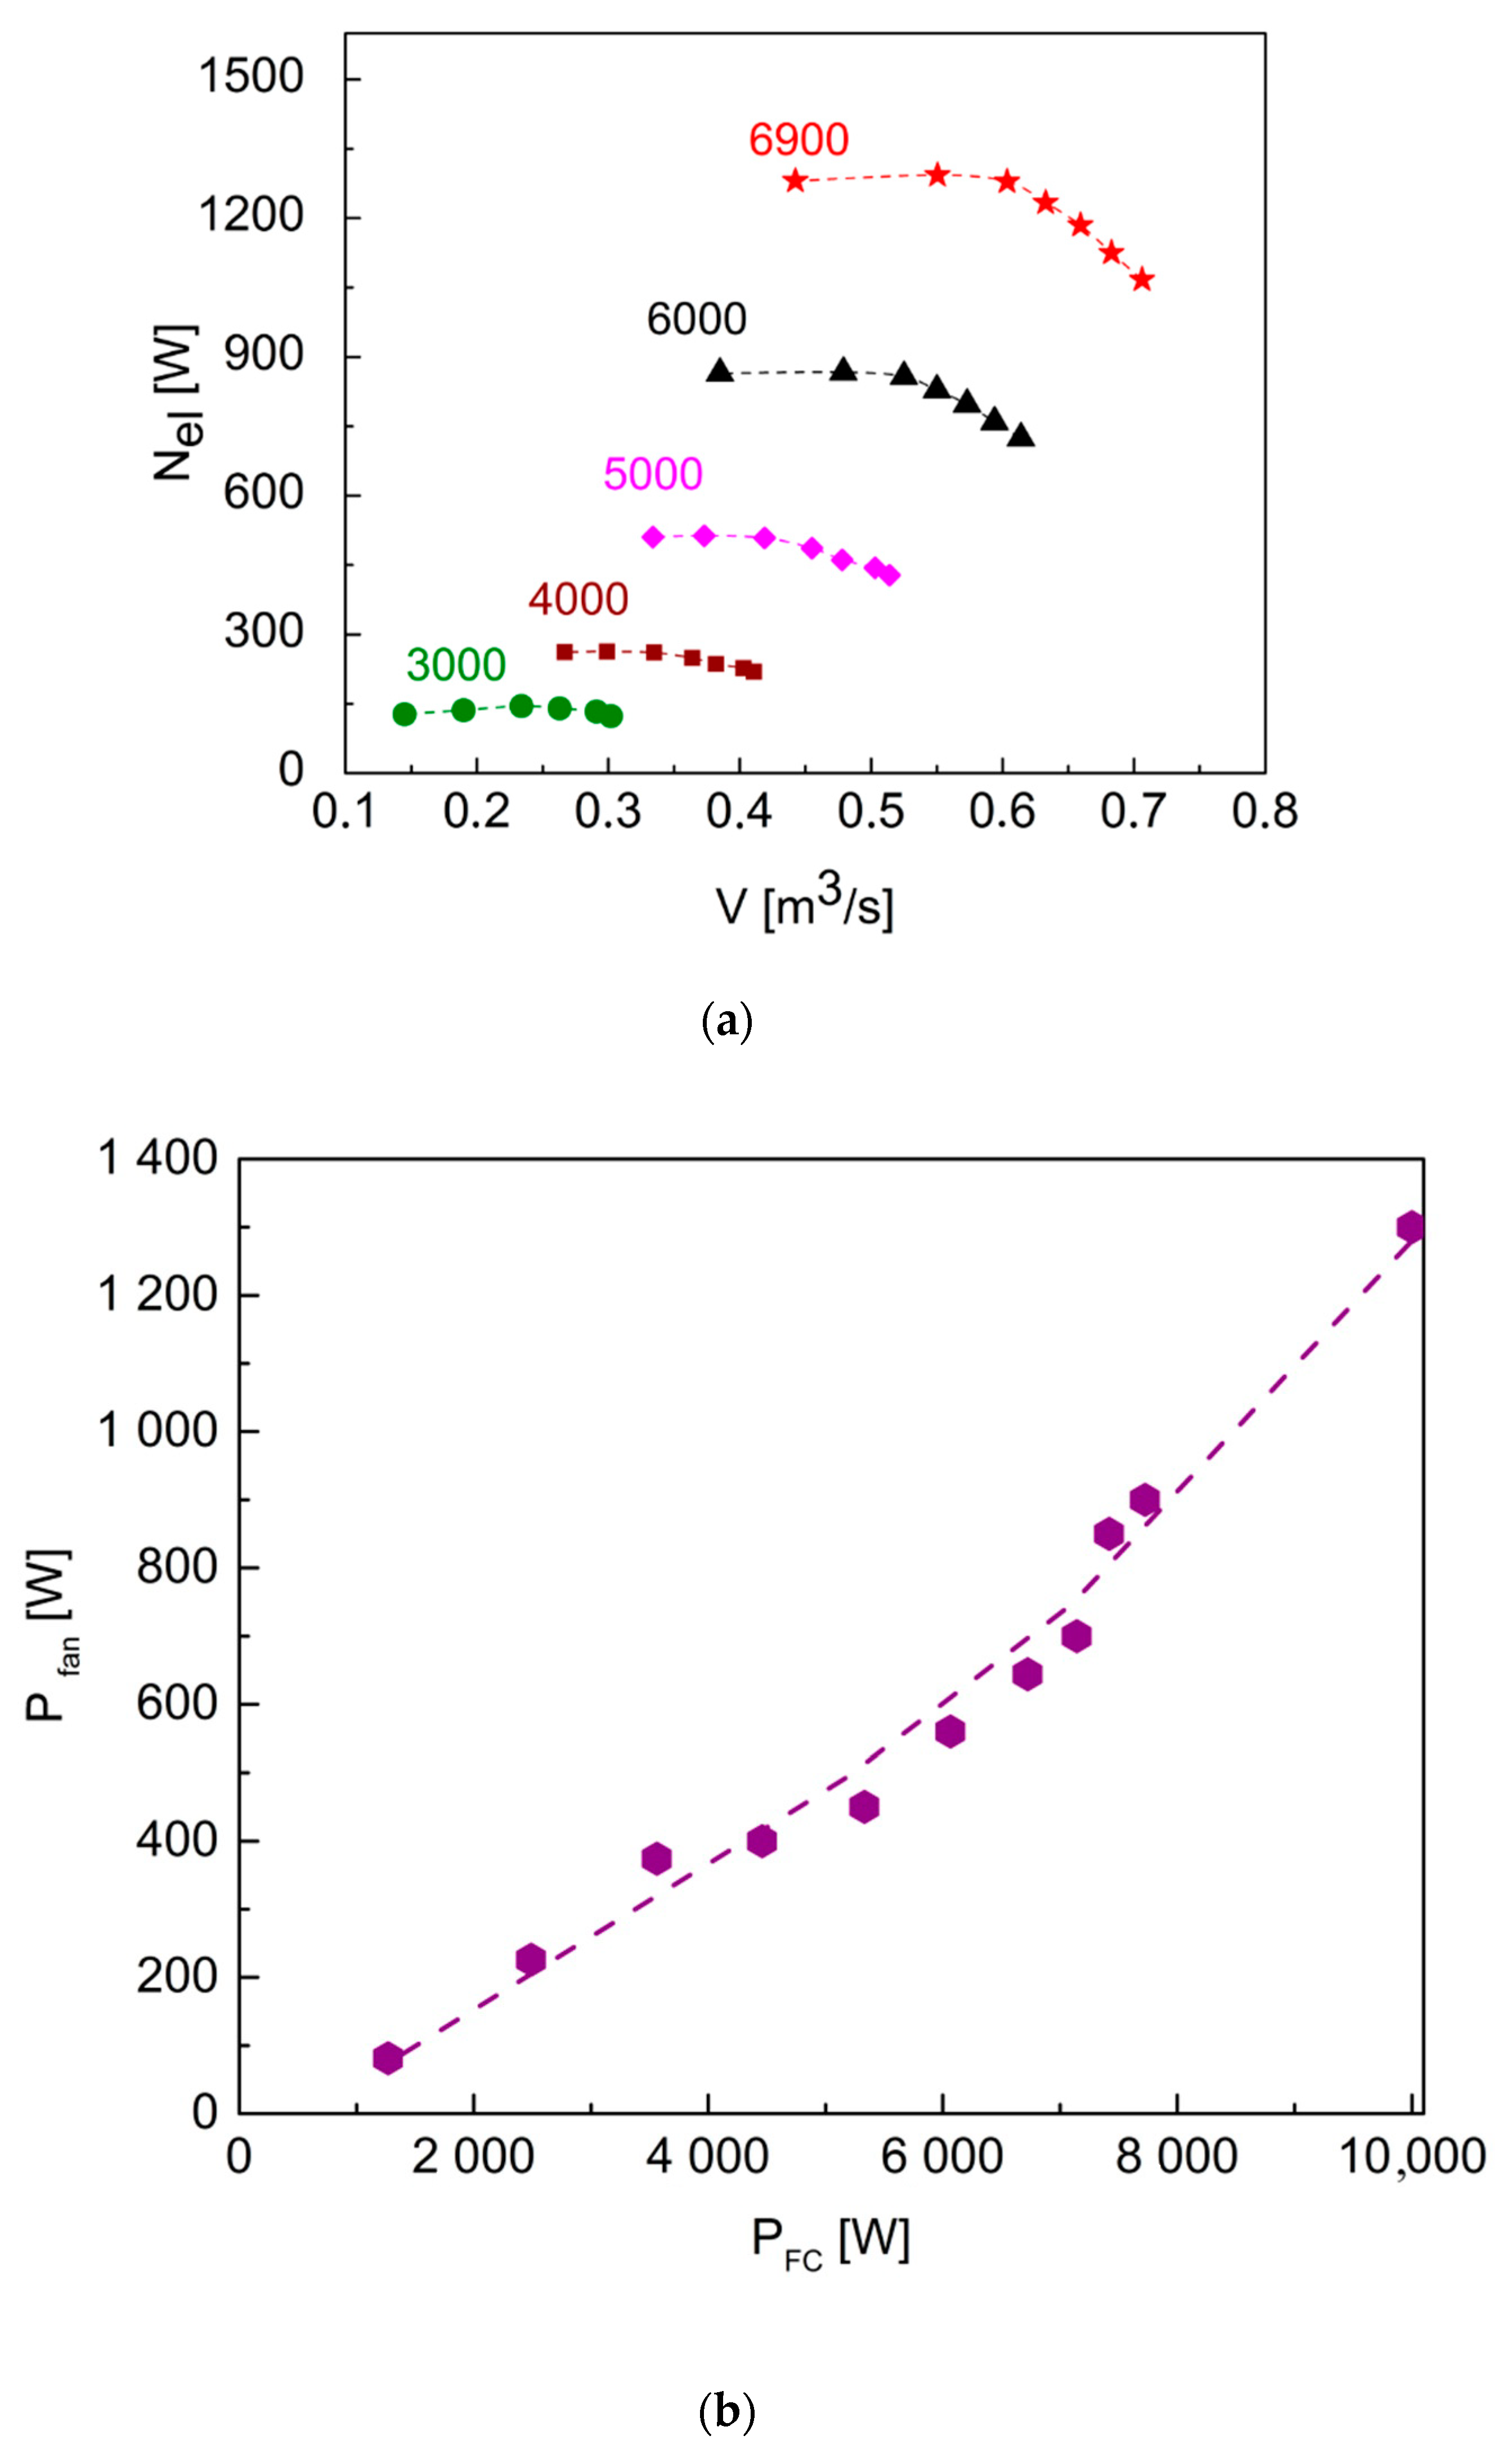
Figure 16a presents the dependence of the predicted consumption of power required for supplying two cascade axial fans vs. volumetric air flow; Figure 16b presents the dependence of electrical power consumed during operation of a V-type PEMFC stack on cooling system performance. The data were obtained during measurements of consumed power Nel vs. electrical power produced by a PEMFC stack with an elaborated cooling system.
Figure 16a presents the estimated power consumption needed for the operation of two cascade axial fans with different rotation speeds (n). As can be seen, during operation of a PEMFC stack at nominal power of 10 kW, 1.2–1.3 kW is required to run cooling fans at a rotation speed of 6900 rpm.
Figure 16b presents the electrical power required to supply the fans during the cooling of a PEMFC stack operating at different levels of nominal power. The experimental results agree closely with those from the elaborated numerical model of two cascade axial fans.

4. Security Monitoring of the 10 kW PEMFC Stack

The most important issue was the development and experimental verification of procedures for detecting unusual or unsafe operating conditions in a V-type constructed PEMFC stack. In such conditions, a warning or alarm signal should be sent to the controller of the stack. This should lead to the automatic shutdown of the PEMFC stack, depending on the severity of the danger [42,43].
The elaborated fuel cell controller is intended to monitor the operating conditions of modules (A) and (B) and the performance of the entire system of the designed and constructed PEMFC stack. In the case of the electrical system and the series connection between the two 5 kW modules, the continuous control and monitoring system measures parameters such as the voltage (Figure 17a) and current (Figure 17b) in the individual modules (A) and (B) and the hydrogen pressure in the composite tanks.
As mentioned previously, the hydrogen monitoring and control system was implemented in the form of a distributed system, with the PEMFC stack controller node as the most important node. The controller is, among others, responsible for the operational security of the entire system. Process variables such as temperature, voltage, current, and the pressure of hydrogen stored in composite cylinders are continuously monitored and the established safety limits/thresholds are checked. This is done regardless of the state in which the designed finite state machine (FSM) is processed. The short-term peaks of the sharp voltage drop observed in the diagrams (Figure 17a) and the rapid increase in current intensity (Figure 17b) measured in module A or B result from short-circuit current flow during the operation of the SCU system; therefore, during SCU operation, the controller does not check the thresholds for safe voltage and current so as not to result in unnecessary electric disconnection of the stack. If any process variable exceeds the allowable value, the control algorithm is switched to the ‘shutdown’ state in which the fuel cell stack stops safely. In practice, this means cooling the stack below the set temperature limit (70 °C) and reducing the voltage of each cell to safe values (40 VDC). In Figure 17, the moment the load is disconnected from the stack can be noted at 70 s. The ‘shutdown’ state of the control algorithm begins. The entire shutdown process takes up to 120 s. Importantly, the controller enables the launch of the stack and connects the fuel cell load only when the generated voltage is greater than the minimum set value (110 VDC, 2 × 55 VDC), the temperature is below the maximum value (70 °C), and the hydrogen pressure is above 20 bar. When the pressure drops below 20 bar, the system displays a warning and sends a signal via CAN bus to the on-board computer concerning the depletion of hydrogen. If the hydrogen pressure drops below 15 bar in the composite tanks (in order to ensure adequate hydrogen overpressure in the tanks and to prevent their aeration), the hydrogen fuel cell supply is disconnected by means of closing the hydrogen supply valve, thus preventing the stack from starting. In case of emergency, the hydrogen system can also be stopped locally using the physical stop button or remotely by sending a CAN stop frame.
The authors also mentioned that the developed 10 kW fuel cell stack control system monitors variations in the current and voltage of the fuel cell module (A) and (B), enabling an independent assessment of each of the modules under varying electrical loads. During operation of the V-type PEMFC stack, the electrical performance of individual MEAs in the stack may gradually become and lose their original characteristics (Figure 8). A direct comparison of the U–I and P–I characteristics of both modules, (A) and (B), enables determination of which module, (A) or (B), is characterised by slightly inferior electrical parameters. The main reason for this phenomenon may be local microcracks in the MEA membrane, leading to a reduction in the voltage level of the PEMFC stack. Other possible reasons include the presence of single cells with differing electrical parameters. During long-term operation under different electrical loads and ambient conditions, some cells reflect inferior electrical characteristics compared to the best cells.
In addition, an increase in electrical resistance due to uneven air flow or an incorrectly selected purge process may lead to uneven cleaning of the MEA anode surface and a reduction in the surface area of single MEA cells operating in this module. Figure 17a presents an example of one such situation. The curves were recorded following 3000 h of PEMFC stack operation; some cells were characterised by inferior electrical parameters, which constituted information concerning the necessity for their replacement. The results of these tests are important from the point of view of diagnostics of the electrical parameters of a PEMFC stack. These data enable the formulation of communications which should be sent during test flights to the on-board computer that manages the entire operation of the power system in the propulsion unit.

5. Conclusions

The conception, design, and performance of a 10 kW V-shaped PEMFC stack along with the balance of the fuel cell power plant were presented. Based on electrical investigations, the elaborated PEMFC stack is capable of operating with a required nominal power of 10 kW in the propeller unit. The efficiency of the PEMFC stack falls within the observed range in the technical data for the stack. The distribution of temperature along the whole length of the stack in both modules (A) and (B) vs. increase of electrical power was investigated. It was found that the temperature increased with increases in power, but did not exceed 65 °C. This temperature was established as the boundary for frame laminate construction. The elaborated and optimised purge and SCU strategy enabled the acquisition of average voltage improvement from 5% to 10% at different current densities. It was demonstrated that the postponed time in SCU performance and short time of operation enabled improvement and minimisation of the time required to recover energy during short-circuiting. Hydrogen consumption for the production of electrical energy as well as the involvement of additional processes such as purge and SCU, was estimated during PEMFC stack operation under different electrical loads. The two elaborated and constructed 3D cascade axial fans tested during PEMFC stack operation ensure adequate volumetric air flow for safe operation. The addition of a dust filter on top of the PEMFC stack did not cause a considerable drop in pressure, which might have limited the safety performance of all cooling systems during two-module stack operation. The elaborated and tested MCU unit also proved adequate for controlling variations in electrical parameters such as voltage (U), current (I), and power (P) as well as others such as distribution of temperatures and pressure (p) of hydrogen consumed during stack operation and stored in two composite cylinders. The proper management of energy and hydrogen distribution in the two-module stack was also tested and demonstrated. The safety procedures elaborated for the MCU unit during stack operation were also verified and enabled the establishment of future assumptions for elaboration energy distribution in a hybrid propulsion system. The obtained results and tests of the first prototype V-type PEMFC stack enabled indication of a new solution for the reduction of the total mass of the complete power source.

Author Contributions

M.D.: conception of the paper, writing, original draft preparation, supervision and interpretation of experimental parts, contribution to the entire experimental part, data curation; A.R.: experimental part of all electrical investigations described in the paper, graphs; M.R.: conception and design of the microcontroller unit, software preparation, data curation; T.S.: conception and elaboration of the model, construction of two cascade axial fans, investigations of the cooling system, data visualisation for this part; P.D.: modelling, software, and execution of 3D printing of some elements of the cooling system, preparation of graphs and resources. All authors have read and agreed to the published version of the manuscript.

Funding

The work was financially supported by The National Centre for Research and Development within the project no. PBS3/A6/24/2015. Some of the measurements were performed using the research infrastructure of the AGH Centre of Energy.

Conflicts of Interest

The authors declare no conflict of interest.

References

  1. Renouard-Vallet, G.; Saballus, M.; Schmithals, G.; Schirmer, J.K.K.; Friedrich, A. Improving the environmental impact of civil aircraft by fuel cell technology: Concepts and technological progress. Energy Environ. Sci. 2010, 3, 1458–1468. [Google Scholar] [CrossRef]
  2. Baroutaji, A.; Wilberforce, T.; Ramadan, M.; Olabi, A.G. Comprehensive investigation on hydrogen and fuel cell technology in the aviation and aerospace sectors. Renew. Sustain. Energy Rev. 2019, 106, 31–40. [Google Scholar] [CrossRef] [Green Version]
  3. Pratt, J.W.; Klebanoff, L.E.; Munoz-Ramos, K.; Akhil, A.A.; Curgus, D.B.C.; Schenkman, B.L. Proton exchange membrane fuel cells for electrical power generation on-board commercial airplanes. Appl. Energy 2013, 101, 776–796. [Google Scholar] [CrossRef] [Green Version]
  4. Elitzur, S.; Rosenband, V.; Gany, A. On-board hydrogen production for auxiliary power in passenger aircraft. Int. J. Hydrog. Energy 2017, 42, 14003–14009. [Google Scholar] [CrossRef]
  5. Zero Avia Unveils Fuel Cell Powered Prototype Light Aircraft Flight Test. Available online: https://www.sciencedirect.com/science/article/pii/S1464285919303682?dgcid=rss_sd_all (accessed on 12 June 2020).
  6. Flight Tests on Way for Boeing Fuel Cell Airplane. Fuel Cells Bull. Available online: https://www.sciencedirect.com/science/article/pii/S1464285907701566 (accessed on 12 June 2020).
  7. Godula-Jopek, A.; Westenberger, A. Hydrogen-Fueled Aeroplanes, Compendium of Hydrogen Energy, Volume 4: Hydrogen Use, Safety and the Hydrogen Economy; Woodhead Publishing Series in Energy; Woodhead Publishing: Sawston, UK, 2016; pp. 67–85. [Google Scholar]
  8. Romeo, G.; Cestino, E.; Borello, F.; Correa, G. Engineering method for air cooling design and two-seat propeller driven aircraft powered by fuel cells. J. Aeosp. Eng. 2011, 24, 79–88. [Google Scholar] [CrossRef]
  9. Romeo, G.; Borello, F.; Correa, G.; Cestino, E. ENFICA-FC: Design of transport aircraft powered by fuel cell & flight test of zero emission 2-seater aircraft powered by fuel cells fueled by hydrogen. Int. J. Hydrog. Energy 2013, 38, 469–479. [Google Scholar]
  10. Rathke., P.; Thalau, O.; Kallo, J.; Schirmer, J.; Stephan, T. Long distance flight testing with the fuel cell powered aircraft Antares DLR-H2. In Proceedings of the Deutscher Luft und Raumfahrtkongress 2013, Stuttgart, Germany, 10–12 September 2013. [Google Scholar]
  11. Piela, P.; Mitzel, J. Polymer electrolyte membrane fuel cell efficiency at the stack level. J. Power Sources 2015, 292, 95–103. [Google Scholar] [CrossRef]
  12. Zhao, J.; Li, X. A review of polymer electrolyte membrane fuel cell durability for vehicular applications: Degradation modes and experimental techniques. Energy Convers. Manag. 2019, 199, 1120–1122. [Google Scholar] [CrossRef]
  13. Bargal, M.H.S.; Abdelkareem, A.A.M.; Tao, Q.; Li, J.; Shi, J.; Wang, Y. Liquid cooling techniques in proton exchange membrane fuel cell stacks: A detailed survey. Alex. Eng. J. 2020, 59, 635–655. [Google Scholar] [CrossRef]
  14. Ghasemi, M.; Ramiar, A.; Ranjbar, A.A.; Rahgoshay, S.M. A numerical study on thermal analysis and cooling flow fields effect on PEMFC performance. Int. J. Hydrog. Energy 2017, 42, 24319–24337. [Google Scholar] [CrossRef]
  15. Chen-Yum, C.; Keng-Pin, H.; Wei-Mon, Y.; Ming-Ping, L.; Chen-Cheng, Y. Development and performance diagnosis of a high power air-cooled PEMFC stack. Int. J. Hydrog. Energy 2016, 27, 11784–11793. [Google Scholar] [CrossRef]
  16. Kim, B.; Lee, Y.; Woo, A.; Kim, Y. Effects of cathode channel size and operating conditions on the performance of air-blowing PEMFCs. Appl. Energy 2013, 111, 441–448. [Google Scholar] [CrossRef]
  17. Ling, C.Y.; Cao, H.; Chen, Y.; Han, M.; Birgersson, E. Compact open cathode feed system for PEMFCs. Appl. Energy 2016, 164, 670–675. [Google Scholar] [CrossRef]
  18. Torija, S.; Prieto-Sanchez, L.; Ashton, S.J. In-situ electrochemically active surface area evaluation of an open-cathode polymer electrolyte membrane fuel cell stack, In-situ electrochemically active surface area evaluation of an open-cathode polymer electrolyte membrane fuel cell stack. J. Power Sources 2016, 327, 543–547. [Google Scholar] [CrossRef]
  19. Mao, L.; Jackson, L.; Davies, B. Investigation of PEMFC fault diagnosis with consideration of sensor reliability. Int. J. Hydrog. Energy 2018, 35, 543–547. [Google Scholar] [CrossRef]
  20. Cao, Y.; Li, Y.; Zhang, G.; Jermsittiparsert, K.; Nasseri, M. An efficient terminal voltage control for PEMFC based on an improved version of whale optimization algorithm. Energy Rep. 2020, 6, 530–542. [Google Scholar] [CrossRef]
  21. Fu-Cheng, W.; Chih-Hsun, P. The development of an exchangeable PEMFC power module for electric vehicles. Int. J. Hydrog. Energy 2014, 39, 3855–3867. [Google Scholar]
  22. De Bernardinis, A.; Péra, M.C.; Garnier, J.; Hissel, D.; Coquery, G.; Kauffmann, J.M. Fuel Cells multi-stack power architectures and validation of 1 kW parallel twin stack PEFC generator based on high frequency magnetic coupling dedicated to on board unit. Energy Convers. Manag. 2008, 49, 2367–2383. [Google Scholar] [CrossRef]
  23. Candusso, D.; Harel, F.; De Bernardinis, A.; François, X.; Péra, M.C.; Hissel, D.; Schott, P.; Coquery, G.; Kauffmann, J.-M. Characterization and modelling of a 5 kW PEMFC for transportation applications. Int. J. Hydrog. Energy 2006, 31, 1019–1030. [Google Scholar] [CrossRef]
  24. Czarnocki, P.; Dudek, M.; Drabarek, K.; Frączek, W.; Iwański, G.; Miazga, T.; Nikoniuk, M.; Raźniak, A.; Rosół, M. Electric motor-glider powered by a hydrogen fuel cell stack. In MATEC Web of Conferences; EDP Sciences: Les Ulis, France, 2019; Volume 304, p. 03011. [Google Scholar]
  25. Pietruszka, A.; Siwek, T.; Kalawa, W.; Lis, Ł.; Stefański, S.; Sztekler, K. The effect of blade slots on flow behaviour in a fan impeller. EPJ Web Conf. 2019, 213, 02067. [Google Scholar] [CrossRef]
  26. Santa Rosa, D.T.; Pinto, D.G.; Silva, V.S.; Rangel, C.M. High performance PEMFC stack with open-cathode at ambient pressure and temperature conditions. Int. J. Hydrog. Energy 2007, 32, 4350–4357. [Google Scholar] [CrossRef]
  27. Bayrak, Z.U.; Kaya, U.; Oksuztepe, E. Investigation of PEMFC performance for cruising hybrid powered fixed-wing electric UAV indifferent temperatures. Int. J. Hydrog. Energy 2020, 45, 7036–7042. [Google Scholar] [CrossRef]
  28. Cano, M.H.; Kelouvani, S.; Agbossou, K.; Dube, Y. Review: Free air breathing proton exchange membrane fuel cell: Thermal behaviour characterization near freezing temperature. J. Power Sources 2014, 246, 650–858. [Google Scholar] [CrossRef]
  29. Zhang, G.; Kandlikar, S.G. A critical review of cooling techniques in proton exchange membrane fuel cell stacks. Int. J. Hydrog. Energy 2012, 37, 2412–2429. [Google Scholar] [CrossRef]
  30. Strahl, S.; Husar, A.; Franco, A.A. Electrode structure effects on the performance of open-cathode proton exchange membrane fuel cells: A multiscale modeling approach. Int. J. Hydrog. Energy 2014, 39, 9752–9767. [Google Scholar] [CrossRef] [Green Version]
  31. Ma, H.; Cheng, W.; Fang, F.; Hsu, C.; Liu, C. Compact design of 10 kW Proton Exchange Membrane Fuel Cell Stack Systems with Microcontroller units. Energies 2014, 7, 2498–2514. [Google Scholar] [CrossRef]
  32. Gupta, G.; Wu, B.; Mylius, S.; Offer, G.J. A systematic study on the use of short circuiting for the improvement of proton exchange membrane fuel cell performance. Int. J. Hydrog. Energy 2017, 42, 4320–4327. [Google Scholar] [CrossRef] [Green Version]
  33. Jincheol, K.; Dong-Min, K.; Sung-Yug, K.; Suk Woo, N.; Taegyu, K. Humidification of polymer electrolyte membrane fuel cell using short circuit control for unmanned aerial vehicle applications. Int. J. Hydrog. Energy 2014, 39, 7925–7930. [Google Scholar]
  34. Nanadegani, F.S.; Lay, E.N.; Iranzo, A.; Salva, J.A.; Sunden, B. On neural network modeling to maximize the power output of PEMFCs. Electrochim. Acta 2020, 348, 136345. [Google Scholar] [CrossRef]
  35. Peng, F.; Ren, L.; Zhao, Y.; Li, L. Hybrid dynamic modeling-based membrane hydration analysis for the commercial high-power integrated PEMFC systems considering water transport equivalent. Energy Convers. Manag. 2020, 205, 112385. [Google Scholar] [CrossRef]
  36. Hung, Y.H.; Lin, P.H.; Wu, C.H.; Hong, C.W. Real-time dynamic modeling of hydrogen PEMFCs. J. Frankl. Inst. 2008, 345, 182–203. [Google Scholar] [CrossRef]
  37. Huang, Z.; Jian, Q.; Zhao, J. Experimental study on improving the dynamic characteristics of open-cathode PEMFC stack with dead-end anode by condensation and circulation of hydrogen. Int. J. Hydrog. Energy 2020. [Google Scholar] [CrossRef]
  38. Won Choi, J.; Yong-Sheen, H.; Jeong-Hoon, S.; Dae Hueng, L.; Suk Won, C.; Min Soo, K. An experimental study on the purge characteristics of the cathodic dead-end mode PEMFC for the submarine or aerospace applications and performance improvement with the pulsation effects. Int. J. Hydrog. Energy 2010, 35, 3698–3711. [Google Scholar] [CrossRef]
  39. Toyoaki, M.; Jixin, C.; Siegel, J.B.; Stefanopoulou, A.G. Degradation phenomena in PEM fuel cell with dead-ended anode. Int. J. Hydrog. Energy 2013, 38, 11346–11356. [Google Scholar]
  40. Barreras, F.; Lopez, M.A.; Lozano, A.; Barranco, J.E. Experimental study of the pressure drop in the cathode side of air-forced open cathode proton exchange membrane fuel cells. Int. J. Hydrog. Energy 2011, 36, 7612–7620. [Google Scholar] [CrossRef]
  41. Zhao, C.; Xing, S.; Chen, M.; Liu, W.; Wang, H. Optimal design of cathode flow channel for air-cooled PEMFC with open cathode. Int. J. Hydrog. Energy 2020, 45, 17771–17781. [Google Scholar] [CrossRef]
  42. Reddy, K.Y.; Sudhakar, N. ANFIS-MPPT control algorithm for a PEMFC system used in electric vehicle applications. Int. J. Hydrog. Energy 2019, 44, 15355–15369. [Google Scholar] [CrossRef]
  43. Wang, F.C.; Lin, H.L.; Chou, M.C. Multivariable Robust Control for a 500W Self-Humidified PEMFC System. Eur. J. Control 2011, 17, 429–441. [Google Scholar] [CrossRef]
Figure 1. The concept of a polymer exchange membrane fuel cell (PEMFC) stack with the balance of the fuel cell power plant.
Energies 13 04393 g001
Figure 2. A 10 kW PEMFC stack with PEMFC controller and hydrogen unit.
Energies 13 04393 g002
Figure 3. The developed design model of the two-stage axial fan.
Energies 13 04393 g003
Figure 4. Diagram of the MCU-based controller of the fuel cell stack.
Energies 13 04393 g004
Figure 5. Sequence of steering signals sent by an MCU system regulating the operation of the V-shaped PEMFC stack.
Energies 13 04393 g005
Figure 6. Installation for measurements of the efficiency of the air-cooling system.
Energies 13 04393 g006
Figure 7. (a) The voltage U distribution recorded for single MEA placed in 5 kW module (A). (b) The voltage U distribution recorded for single MEA placed in 5 kW module (B).
Energies 13 04393 g007
Figure 8. The U-I and P-I dependencies recorded for module (A) or (B) and after electrical series connections of both modules (A + B).
Energies 13 04393 g008
Figure 9. (a) Voltage U-current I or power P-current I dependencies recorded for a 10 kW PEMFC stack in different ambient conditions. The numbers above the curves denote the temperature (°C) of the performed measurements. (b) The U-I and P-I curves recorded for the PEMFC fuel cell stack operating freely in laboratory conditions (A) and in conditions with limited air inlet (B).
Energies 13 04393 g009
Figure 10. (a) Stability of the power output P of a V-type PEMFC stack with constant electrical load vs. duration of experiments. (b) Variation in minimal (Tmin) or maximal (Tmax) temperature recorded during PEMFC stack performance under electrical load, from 2.5 to 10 kW. Data refer to the conditions described in Figure 10a.
Energies 13 04393 g010aEnergies 13 04393 g010b
Figure 11. (a) Variation in intensity of hydrogen flow QH2 vs. time recorded during V-type PEMFC stack operation. (b) Indication of the effect of a purge (Purge 1 or Purge 2) and humidification realised by means of SCU1 or SCU2 processes vs. time on hydrogen utilisation QH2 during V-type PEMFC stack operation. The conditions are reflected in (a) (a narrower excerpt from the time graphs in (b)). (c) Hydrogen fuel consumption QH2: minimal Qmin or highest Qmax values of the intensity of the flow of fuel during PEMFC stack operation under electrical load.
Energies 13 04393 g011aEnergies 13 04393 g011b
Figure 12. Electrical efficiency ε and hydrogen utilisation μ vs. electrical power produced by the PEMFC stack.
Energies 13 04393 g012
Figure 13. (a) Variation in voltage (U), current (I), and power (P) of a PEMFC stack vs. time, recorded during operation under variable electrical load. (b) Temperature distribution in module (A) during operation of a V-type PEMFC stack according to the conditions presented in (a). (c) Temperature distribution in module (A) during operation of a V-type PEMFC stack according to the conditions presented in (a). (d) Stabilisation of partial pressure H2 during introduction of fuel into a V-type PEMFC stack.
Energies 13 04393 g013aEnergies 13 04393 g013b
Figure 14. (a) Variation in voltage (U), current (I), and power (P) of the PEMFC stack vs. time, recorded during operation under variable electrical load. (b) Variation in hydrogen pressure (PH2) as volume of hydrogen vs. time, monitored during PEMFC operation.
Energies 13 04393 g014
Figure 15. (a) Total pressure losses (∆p) vs. volumetric flow rate determined for a cooling system integrated with a V-type PEMFC stack. (b) Total pressure losses (∆p) vs. volumetric flow rate determined for a cooling system integrated with a V-type PEMFC stack. Data for different rotor speeds (1/min): dotted line—data from a numerical simulation; figures and symbols—data from experimental measurements.
Energies 13 04393 g015
Figure 16. (a) Estimated electrical power Nel needed to supply two constructed cascade axial fans vs. expected volumetric air flow. (b) Measured electrical power Pfan needed to supply the cooling system vs. the electrical power produced by the PEMFC stack (PFC).
Energies 13 04393 g016
Figure 17. (a) Voltage (U1 and U2) vs. time recorded during investigation of the safety procedures of two-module PEMFC stack operation. (b) Current (I1 and I2) vs. time recorded during investigation of the safety procedures of two-module PEMFC stack operation.
Energies 13 04393 g017

