Environmental and Economic Sustainability of Electric Vehicles: Life Cycle Assessment and Life Cycle Costing Evaluation of Electricity Sources †


Department of Management, Sapienza University of Rome, Via del Castro Laurenziano 9, 00161 Rome, Italy
*
Author to whom correspondence should be addressed.
†
This Paper is an Extended Version of the Paper Published in 20th IEEE International Conference on Environment and Electrical Engineering (EEEIC 2020), Web Conference, 9–12 June 2020, pp. 309–402.
Energies 2020, 13(23), 6292; https://doi.org/10.3390/en13236292
Submission received: 2 November 2020
/
Revised: 24 November 2020
/
Accepted: 27 November 2020
/
Published: 29 November 2020
(This article belongs to the Special Issue Selected Papers from 20 IEEE International Conference on Environment and Electrical Engineering (EEEIC 2020))
Abstract
:The electro-mobility of vehicles could solve the negative effects of road transport, by decreasing greenhouse gas emissions. However, some electric vehicles also have a negative impact on the environment related to the nature of electricity used. This paper aims to evaluate the electricity sources for electric vehicles using a Life Cycle Thinking approach. Life cycle assessment, using several midpoints and endpoint methods, highlighted that the most damaging sources were lignite and diesel, while hydropower, wind, and biomass were the most sustainable ones. Cumulative energy demand showed that biomass used the least energy (0.034 MJ eq.), but originates from 100% non-renewable sources. Lignite, which also comes from 100% non-renewable sources, used the most energy (17.791 MJ eq.). The lowest carbon footprints were for wind, biomass, and photovoltaic (<0.1 kg CO2 eq). Municipal waste incineration and natural gas had a medium impact, while lignite, coal, peat, and diesel had a high impact (>1.0 kg CO2 eq.). Considering life cycle costing, photovoltaic electricity generation was the most expensive (0.2107 USD/kWh) while natural gas the cheapest (0.0661 USD/kWh). Therefore, this study presents an integrated approach that may offer a valid tool for decision-makers, giving them the possibility to choose the electricity sources for electric vehicles.
1. Introduction
A total of 80% of the global energy consumption is attributed to the G20 countries (European Union, United Kingdom, South Africa, Turkey, Saudi Arabia, Russia, China, India, Korea, Japan, Indonesia, Australia, Canada, Mexico, Argentina, and Brazil) [1]. A great quantity (12 Gtoe) of energy was consumed in 2019, with an increase of 0.9%. In the same year, CO2 emissions did not increase, maintaining the previous year record (33 Gt CO2 eq.) [2]. A different trend can be seen between G20 countries—industrialized countries, such as those in the European Union and Japan, are trying to lower their energy consumption. However, in other countries (e.g., China, India, and Russia) a great increase (above 3%) in energy consumption has been registered [3]. Energy consumption and CO2 emissions are directly correlated. Indeed, there is a linear relationship between the energy consumed and the number of greenhouse gases emitted [4]. Among the most impacting segments, transport represents 24% of the total emissions and 33% of the total energy consumption. Thus, the effect of the transport area is one of the major global issues that directly and indirectly influence the environment [5]. The worldwide demand for transport has risen, due to the increase in population, urbanization, global mobility, and economic movements. Road transports are the most utilized in the globe, accounting for more than 70% of all transport sector. This type of transport was associated with up to 75% of the energy demand in the transport area [6]. Recently, a new form of transport has increased in popularity, electric mobility. This innovative mobility method would result in a significant decrease of future greenhouse gas emissions; therefore, electro-mobility presents a major opportunity to solve the negative effect that vehicles involved in road transports have on the environment [7]. Some studies have been dedicated to evaluating the sustainability of electric mobility. In this study, the Life Cycle Thinking (LCT) methodology was extensively used to evaluate sustainability. The LCT assessment studies the impacts during the entire life cycle of a product—electric vehicles in this case—from the raw materials used in the disposal scenario [8]. This kind of study highlighted that some electric vehicles have a negative impact, particularly in their production and use [9]. However, they have sustainable maintenance compared to fuel vehicles. Electric mobility has a great potential to reduce global warming, but the environmental impacts depend on the nature of electricity used [10,11].
Starting from these results, this paper aims to evaluate the electricity sources (biomass, coal, diesel, hydropower, lignite peat, municipal waste incineration, natural gas, photovoltaic, and wind) to power the electric vehicles using an LCT approach. Firstly, a literature review on the energy consumption of vehicles powered with different fuels was performed. Then, the applied methodologies were described, i.e., life cycle assessment, life cycle costing, cumulative energy demand, and carbon footprint. The results of the Life Cycle Impact Assessment of the different sources by means of several midpoint and endpoint methods, such as ReCiPe 2016, ILCD 2011, CML-IA, IMPACT 2002+, and EPD (2013), were discussed and compared with the ones of other methodologies involved. Therefore, an integrated approach was applied to evaluate the impacts of the electricity sources used in electric mobility.
2. Literature Review
The use of electric mobility is spreading worldwide, and academic studies are following its inevitable growth. To date, data from Scopus® showed about 105,000 contributions containing “electric vehicles” in their title, abstract, or keywords. The number of publications on this topic has undergone a huge increase in the last 20 years—starting from 731 publications in 2000 to 11,308 in 2019. To date, the number of studies on the topic of sustainability in electric mobility are 6126 (5.8% of the total), whereas the papers dealing with the life cycle thinking approach accounted for 4.5% of the total (about 4800). In the LCT studies reported in the literature, one of the main challenges was the evaluation and comparison of conventional and electric vehicles [12,13,14]. Furthermore, the environmental impacts and the energy efficiency of the engines in these two types of vehicles were compared. The battery-electric vehicles had a higher energy efficiency compared to that of conventional vehicles (fuel cell vehicles); however, the difference was small. This feature of the electric vehicles was found only if the charging electricity comes from renewable source, in accordance with the aim of this paper [15,16,17,18]. The literature studies have reported that another issue associated with electric vehicles is the battery typology. The results of life cycle assessments of batteries varied significantly depending on the LCA methodology approach. The results showed a huge variability in terms of the environmental impact assessment, particularly for climate change impacts. It was found that the CO2 eq emissions per kWh of battery capacity ranged from 50 to 313 g CO2 eq/kWh depending on the battery typology but also the LCA methodology involved. However, electric vehicles had a lower carbon footprint than conventional vehicles, such as diesel- or petrol-powered [19,20,21,22]. A strategy to reduce greenhouse gas emissions that has been implemented in electric vehicles is the integration of charging systems. The evaluation of different charging strategies highlighted that these systems could decrease the emissions related to the battery life cycle by between 4% and 11% [23]. The integration of photovoltaic solar modules into electric vehicles has been shown to be a particularly effective approach. The LCA of this integration showed a large reduction in emissions—from 0.435 kg CO2 eq/kWh (system without photovoltaic integration) to 0.357 kg CO2 eq/kWh [24].
In addition to electric mobility, other clean technologies in road transport are emerging, one of which is the use of H2 as fuel. This technology has often been integrated into hybrid vehicles, replacing conventional fuels. A recent study compared the CO2 eq and NOx emissions of H2, electric, and conventional technologies for the transport sector [25]. It was highlighted that H2 technology can reduce fuel consumption, with competitive emissions against electric vehicles. The integration of fuel cell vehicles with H2-tech produced the lowest greenhouse gas emission and a comparable NOx one. The best production of H2 was defined. Another study was carried out in this area by comparing H2 hydrogen fuel productions, i.e., conventional, renewable from biomass, and renewable from wind [26]. Three environmental indicators were used: carbon footprint, cumulative energy demand, and acidification. The conventional H2 production method had the highest values in all three indicators. The biomass-based production had the lowest carbon footprint (expressed as CO2 eq.), whereas the wind-based had the lower non-renewable energy requirement.
To summarize, the evaluation of emissions related to road transport focused on the fact that the electric vehicles offer a great reduction in greenhouse gases. Additionally, the integration of this mobility with a self-charging system or the use of H2 fuels led to better environmental performances of vehicles using conventional technology.
3. Materials and Methods
The LCT methodology was employed to evaluate the economic and environmental sustainability of different energy sources. Two main approaches of LCT were herein applied, the Life Cycle Assessment (LCA) and the Life Cycle Cost (LCC) [27,28].
3.1. Life Cycle Assessment
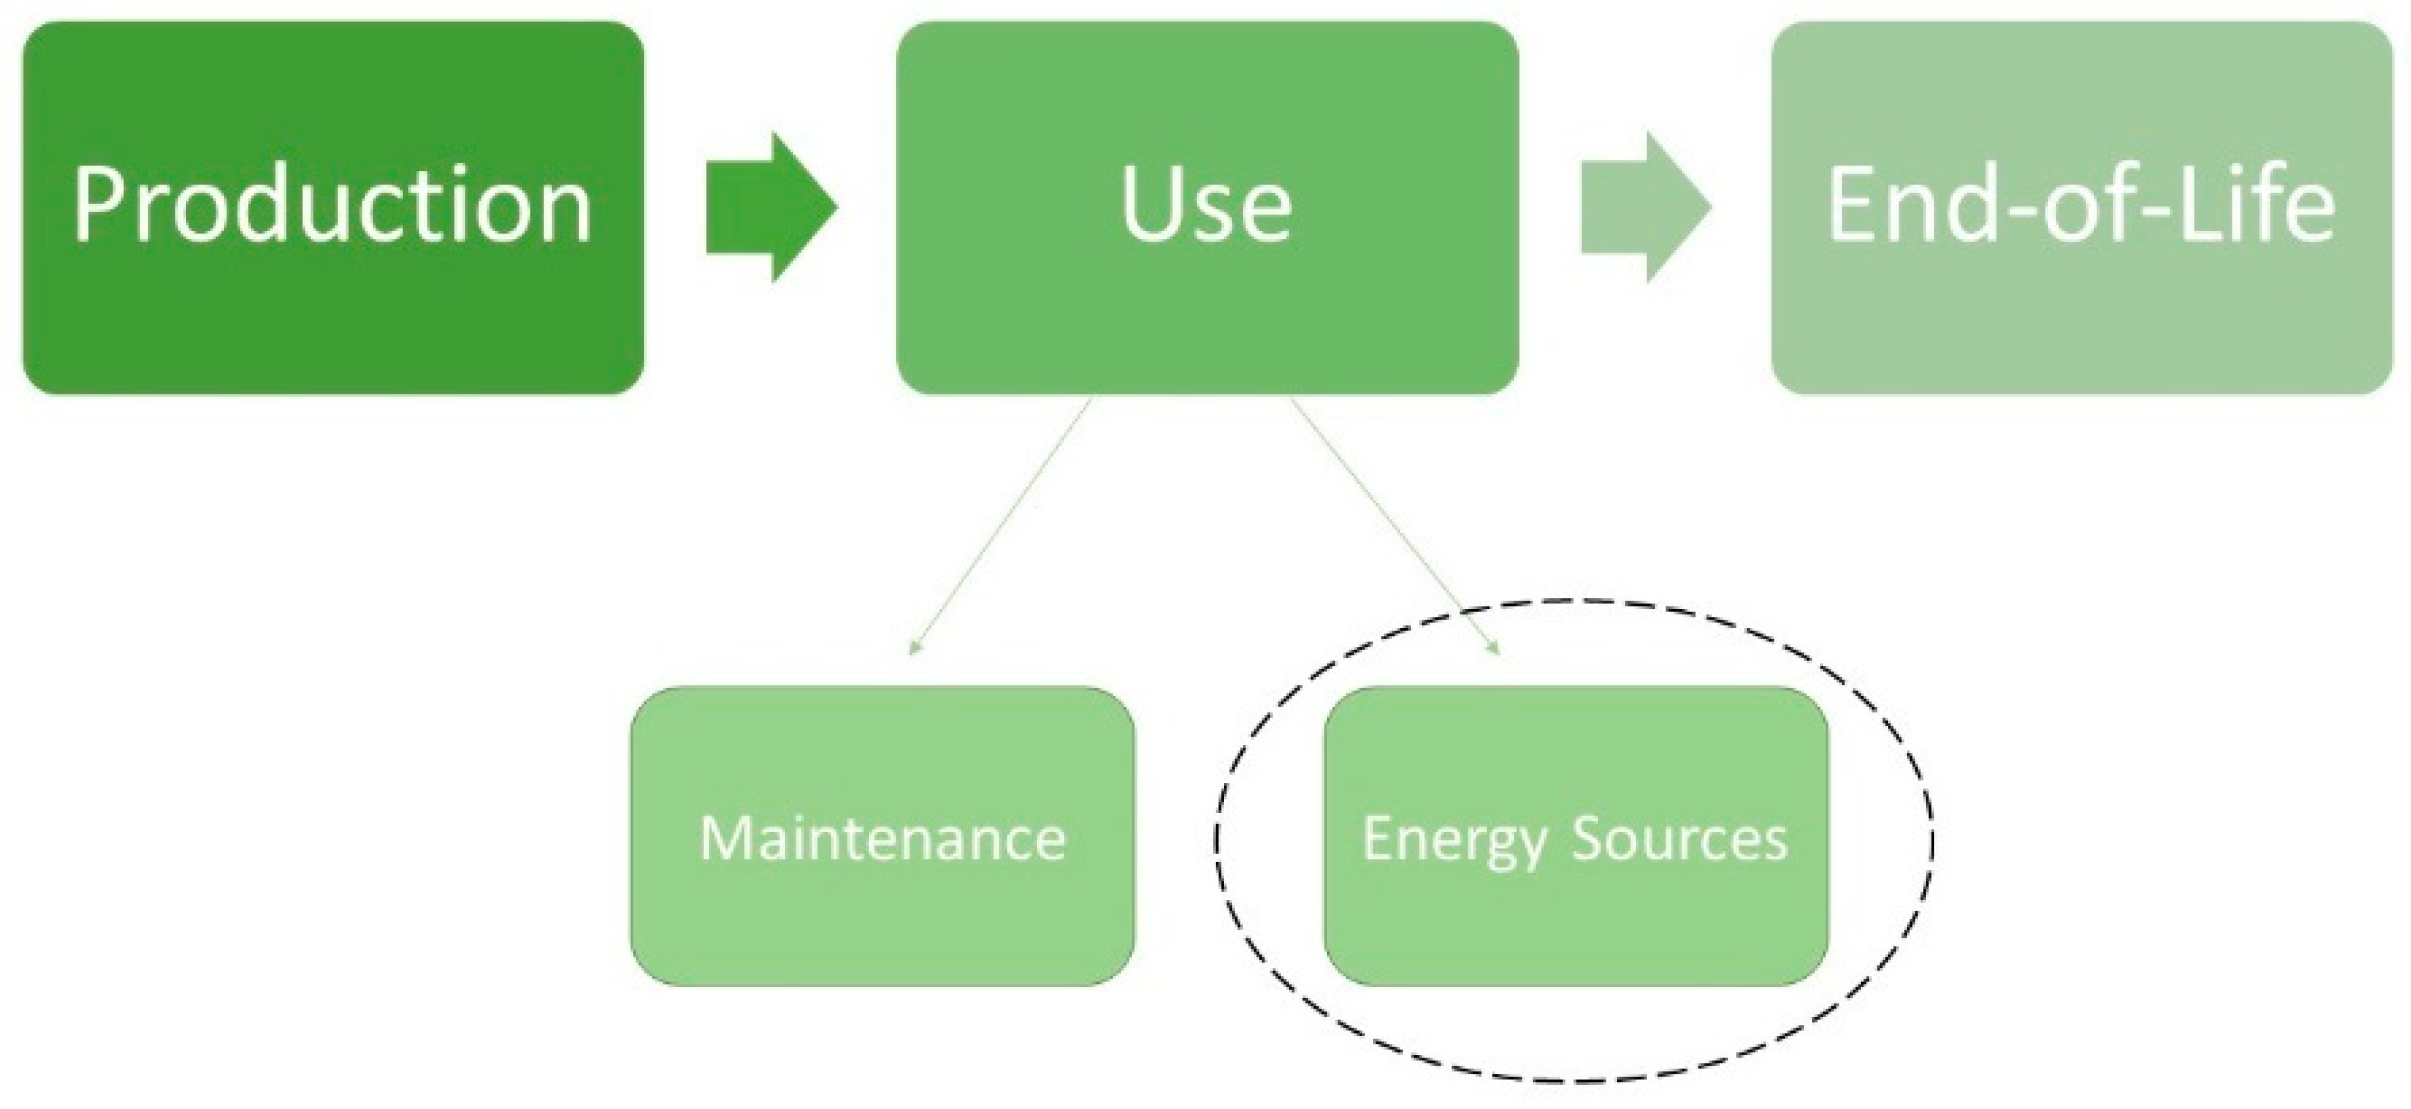
Goal and Scope definition: the objective of this LCA is the evaluation of the production of several energy sources involved in electric mobility (biomass, coal, diesel, hydropower, lignite, peat, municipal waste incineration, Natural Gas, Photovoltaic, and Wind). The functional unit chosen was 1 kW/h of energy [29]. The system boundaries of the analyzed system are reported in Figure 1.
Life Cycle Inventory: the data regarding energy production have been collected from November 2019 to January 2020. All the data concern Italian energy production.
Life Cycle Impact Analysis: the impacts were calculated using several methods through the software SimaPro 8.5., i.e., ReCiPe 2016 midpoint and endpoint, ILCD 2011, CML-IA, IMPACT 2002+, and EPD (2013) [30,31,32,33]. These methods are considered midpoint indicators that highlight a single environmental problem. Moreover, the ReCiPe 2016 endpoint method was applied by assessing three endpoint indicators (Human Health, Ecosystems, and Resources) [34,35]. It is noteworthy that there is not a standard reference level for each indicator, but they can be used to compare different systems by using the same inventory and the same analysis method.
3.2. Cumulative Energy Demand
Cumulative energy demand (CED) is a tool that is widely applied to investigate the energy used throughout the life cycle of a good or service [36,37]. This approach can be considered as a screening indicator for the environmental impact analysis, but it does not replace an assessment with the use of comprehensive impact assessment methods, such as ReCiPe 2016 or ILCD 2011. Therefore, an integrated approach to CED and other impact assessment methods was highly recommended. The CED-indicator was split up into two main categories (Renewable and Non-renewable) and eight sub-categories (fossil, nuclear, biomass, wind, solar, geothermal, water). In this case, the value of wind, solar, and geothermal sub-categories have been aggregated. CED indicators are calculated according to the intrinsic value of the energy, determined by the amount of energy withdrawn from nature (expressed in MJ-equivalents) [38].
3.3. Carbon Footprint
Carbon footprint was determined according to IPPC guidelines [39] by considering the following greenhouse gases (GHGs): carbon dioxide, methane, nitrous oxide, hydrocarbons, hydrofluorocarbons, chlorofluorocarbons, hydrochlorofluorocarbons, perfluorocarbons, halon, fluorinated ethers, and sulfur hexafluoride. Each of the GHGs have a different greenhouse effect; therefore, the CO2 equivalents were calculated as follows:
where G.G.i is the greenhouse gas quantity produced and Ki is the CO2 equivalents coefficient of that gas [40].
3.4. Life Cycle Costing
The LCC evaluation defines the total cost of products and services, taking into account its complete life cycle [41]. The assessment permits the cost drivers to be defined and to recognize the possible cost savings in a system [42]. In the LCC, the total cost is considered with the goal to support the decision-makers in the choices concerning variation of some parameters in the life cycle of specific products or services, highlighting the most cost-efficient and competitive solutions for the production process [43,44].
4. Results
The results of the environmental impact evaluation using the different LCIA methods are reported in Table S1.
4.1. ReCiPe 2016 Midpoint
The first method reported is the ReCiPe 2016 midpoint that involves six impact categories dealing with air, five categories for the water, five categories for the land, and two categories dealing with human health [45,46]. For the categories regarding the air, the results were heterogeneous. The electricity generated by hydropower systems has a lower impact in the following categories, global warming = 5.870 × 10⁻³ kg CO2 eq., stratospheric ozone depletion 1.150 × 10⁻⁹ kg CFC-11 eq. and fine particulate matter formation = 2.271 kg PM2.5 eq. The lignite energy source had high impacts in these category (respectively, 1.785 kg CO2 eq., 4.243 × 10⁻⁷ kg CFC-11 eq. and 9.789 × 10⁻³ kg PM2.5 eq.). The biomass source had the largest impact on the ozone formation categories for both human health and ecosystems damage (9.533 × 10⁻³ kg NOx eq. and 1.496 × 10⁻² kg NOx eq., respectively) and it had no impact on the ionizing radiation one. For the photovoltaic source, with which low impacts are generally associated, the ionizing radiation has the highest impact (9.793 × 10⁻³ kBq Co60 eq.).
4.2. ILCD 2011
The ILCD 2011 method provides information on the five categories dealing with the air, five on water, and three categories on soil and human health [47,48]. In terms of air, lignite had the greatest impact in three of the five categories (climate change = 1.801 kg CO2 eq., particulate matter = 3.264 × 10⁻³ kg PM2.5 eq. and photochemical ozone formation = 3.235 × 10⁻³ kg NMVOC eq.). Hydropower had lower impacts for the same categories (respectively, 6.015 × 10⁻³ kg CO2 eq., 6.850 × 10⁻⁷ kg PM2.5 eq. and 9.437 × 10⁻⁶ kg NMVOC eq.). In the ozone depletion category, the biomass source was the most eco-friendly (8.714 × 10⁻¹⁴ kg CFC-11 eq.) despite the fact that the municipal waste incineration source had the highest value (4.781 × 10⁻⁴ kg CFC-11 eq.) in terms of ozone depletion. Photovoltaics had a drawback associates with the high level of ionizing radiation (2.380 × 10⁻⁸ CTUe), as reported in the ReCiPe 2016 midpoint method. For the categories relating to water, overall, the wind source had a minor impact, while coal and lignite had the highest.
4.3. CML-IA
In the CML-IA (baseline) methods, there were eleven impact categories. The majority of the categories concerned air and water impacts—only 20% of the categories covered soil and human health damages [49,50]. By this method, coal, diesel, lignite, and peat had a similar global warming potential, emitting 1.150 kg CO2 eq., 1.134 kg CO2 eq., 1.803 kg CO2 eq. and 1.176 kg CO2 eq., respectively. In terms of ozone layer depletion, the municipal waste incineration had the highest value (4.781 × 10⁻⁸ kg CFC-11 eq.) while biomass had the lower (9.498 × 10⁻¹⁴ kg CFC-11 eq.). However, biomass had the greatest impact in terms of photochemical oxidation (2.310 × 10⁻² kg C2H4 eq.).
4.4. IMPACT 2002+
The IMPACT 2002+ [33,41] method takes four categories of human health into account, with biomass had fewer carcinogens (7.990 × 10⁻⁷ kg C2H3Cl eq.) and non-carcinogens impacts (1.641 × 10⁻⁴ kg C2H3Cl eq.), while it had the largest impact in terms of respiratory organics (2.402 × 10⁻² kg C2H4 eq.). In this last category, hydropower had the lowest value (3.492 × 10⁻⁷ kg C2H4 eq.) as well as in the respiratory inorganics (1.724 × 10⁻⁶ kg PM2.5 eq.). In the human health categories, in addition to biomass, the sources with the largest impact were diesel (non-carcinogens = 7.870 × 10⁻² kg C2H3Cl eq.), lignite (respiratory inorganics = 9.399 × 10⁻³ kg PM2.5 eq.) and photovoltaic (carcinogens = 1.729 × 10⁻³ kg C2H3Cl eq.). For water, the hydropower source had the lowest impact in all three categories analyzed, i.e., aquatic ecotoxicity = 5.860 × 10⁻² kgTEG water, aquatic acidification = 9.215 × 10⁻⁶ kg SO2 eq, and aquatic eutrophication 1.136 × 10⁻⁸ kg PO4 P-lim. In terms of the negative aspects, the response was various with coal, lignite, and natural gas as the highest-impact sources. Hydropower and biomass were also the most sustainable sources in terms of the soil and air impacts, while lignite and municipal waste incineration were the least sustainable.
4.5. EPD (2013)
The last method is used to generate an Environmental Product Declaration, an eco-label recognized by the European Community [51,52,53]. This method was based on the CML-IA one for the following categories: global warming, ozone layer depletion, photochemical oxidation, abiotic depletion, and abiotic depletion-fossil fuel. The other two categories are acidification and eutrophication. In both these categories, hydropower had the lowest impact—9.172 × 10⁻⁶ kg SO2 eq. and 1.157 × 10⁻⁶ kg PO43− eq., respectively. In the acidification category, coal had the largest impact—(6.293 × 10⁻³ kg SO2 eq.)—while lignite contributed most to eutrophication (1.350 × 10⁻² kg PO43− eq.).
4.6. ReCiPe 2016 Endpoint
The assessment using the ReCiPe 2016 endpoint method involved the study of 22 impact categories. These categories were summarized into three main targets, i.e., human health, ecosystems, and resource scarcity [46,54,55]. Furthermore, three different measurement units reflect the 22 categories (Table S2). The human health impact categories were expressed by the Disability-Adjusted Life Year (DALY). This unit determines the overall disease burden, expressed as the number of years lost due to ill health, disability, or early death. In all the categories of this area, the lowest impact was recorded in the electrical energy generated from hydropower. The highest impact was found for lignite in the global warming (2.231 × 10⁻⁵ DALY) and human carcinogenic toxicity (4.429 × 10⁻⁵ DALY) categories and coal in the stratospheric ozone depletion (5.706 × 10⁻¹⁰ DALY), fine particulate matter formation (8.678 × 10⁻⁹ DALY), and human non-carcinogenic toxicity (2.682 × 10⁻⁵ DALY) categories.
In the ecosystems assessment, the impact categories are expressed as species/year, which is a way to measure the extinction rate of living species. For the ecosystems, the highest-impact electricity source was lignite in terms of terrestrial global warming, freshwater global warming, marine eutrophication, freshwater ecotoxicity, and marine ecotoxicity. Biomass had the highest impact in the ozone formation category (1.931 × 10⁻⁹ species/year), natural gas in the terrestrial acidification one (1.258 × 10⁻⁹ species/year), and photovoltaic in the terrestrial ecotoxicity one (2.009 × 10⁻¹¹ species/year). The lowest impacts were found for wind in the water categories, such as marine eutrophication freshwater and marine ecotoxicity, and hydropower in the other categories.
Moreover, the impact categories dealing with resource scarcity are expressed in United States Dollars (USD). For this endpoint, the most expensive electricity source was diesel, while hydropower was the cheapest.
4.7. Cumulative Energy Demand
To quantify the energy withdrawn from nature by the electricity sources analysed, the cumulative energy demand (CED) was calculated, and the results were expressed as MJ eq., as reported in Table 1 [56,57]. Biomass was the source that used the least energy (0.034 MJ eq.), but its provenience was 100% non-renewable fossil. A similar trend was found for diesel, natural gas, lignite, peat, and coal (100%, 100%, 99%, 99%, and 98% non-renewable fossil source, respectively). However, while biomass had the lowest value of energy withdrawn from nature, the above-mentioned sources withdrew more energy, from 10.823 MJ eq. for coal to 17.791 MJ eq. for Lignite. Wind used 0.130 MJ eq. of which 87% originated from non-renewable fossil sources, 10% from non-renewable nuclear sources, and just 3% from renewable water sources. The municipal waste incineration used 6.918 MJ eq. originating from non-renewable fossil sources (59%), renewable biomass (12%), renewable wind (18%), and renewable water (11%). Photovoltaic and hydropower used more renewable energy. The source of 5.035 MJ eq. of photovoltaic was 77% renewable solar, and 3% renewable water, with the remaining 20% originating from non-renewable fossil and nuclear.
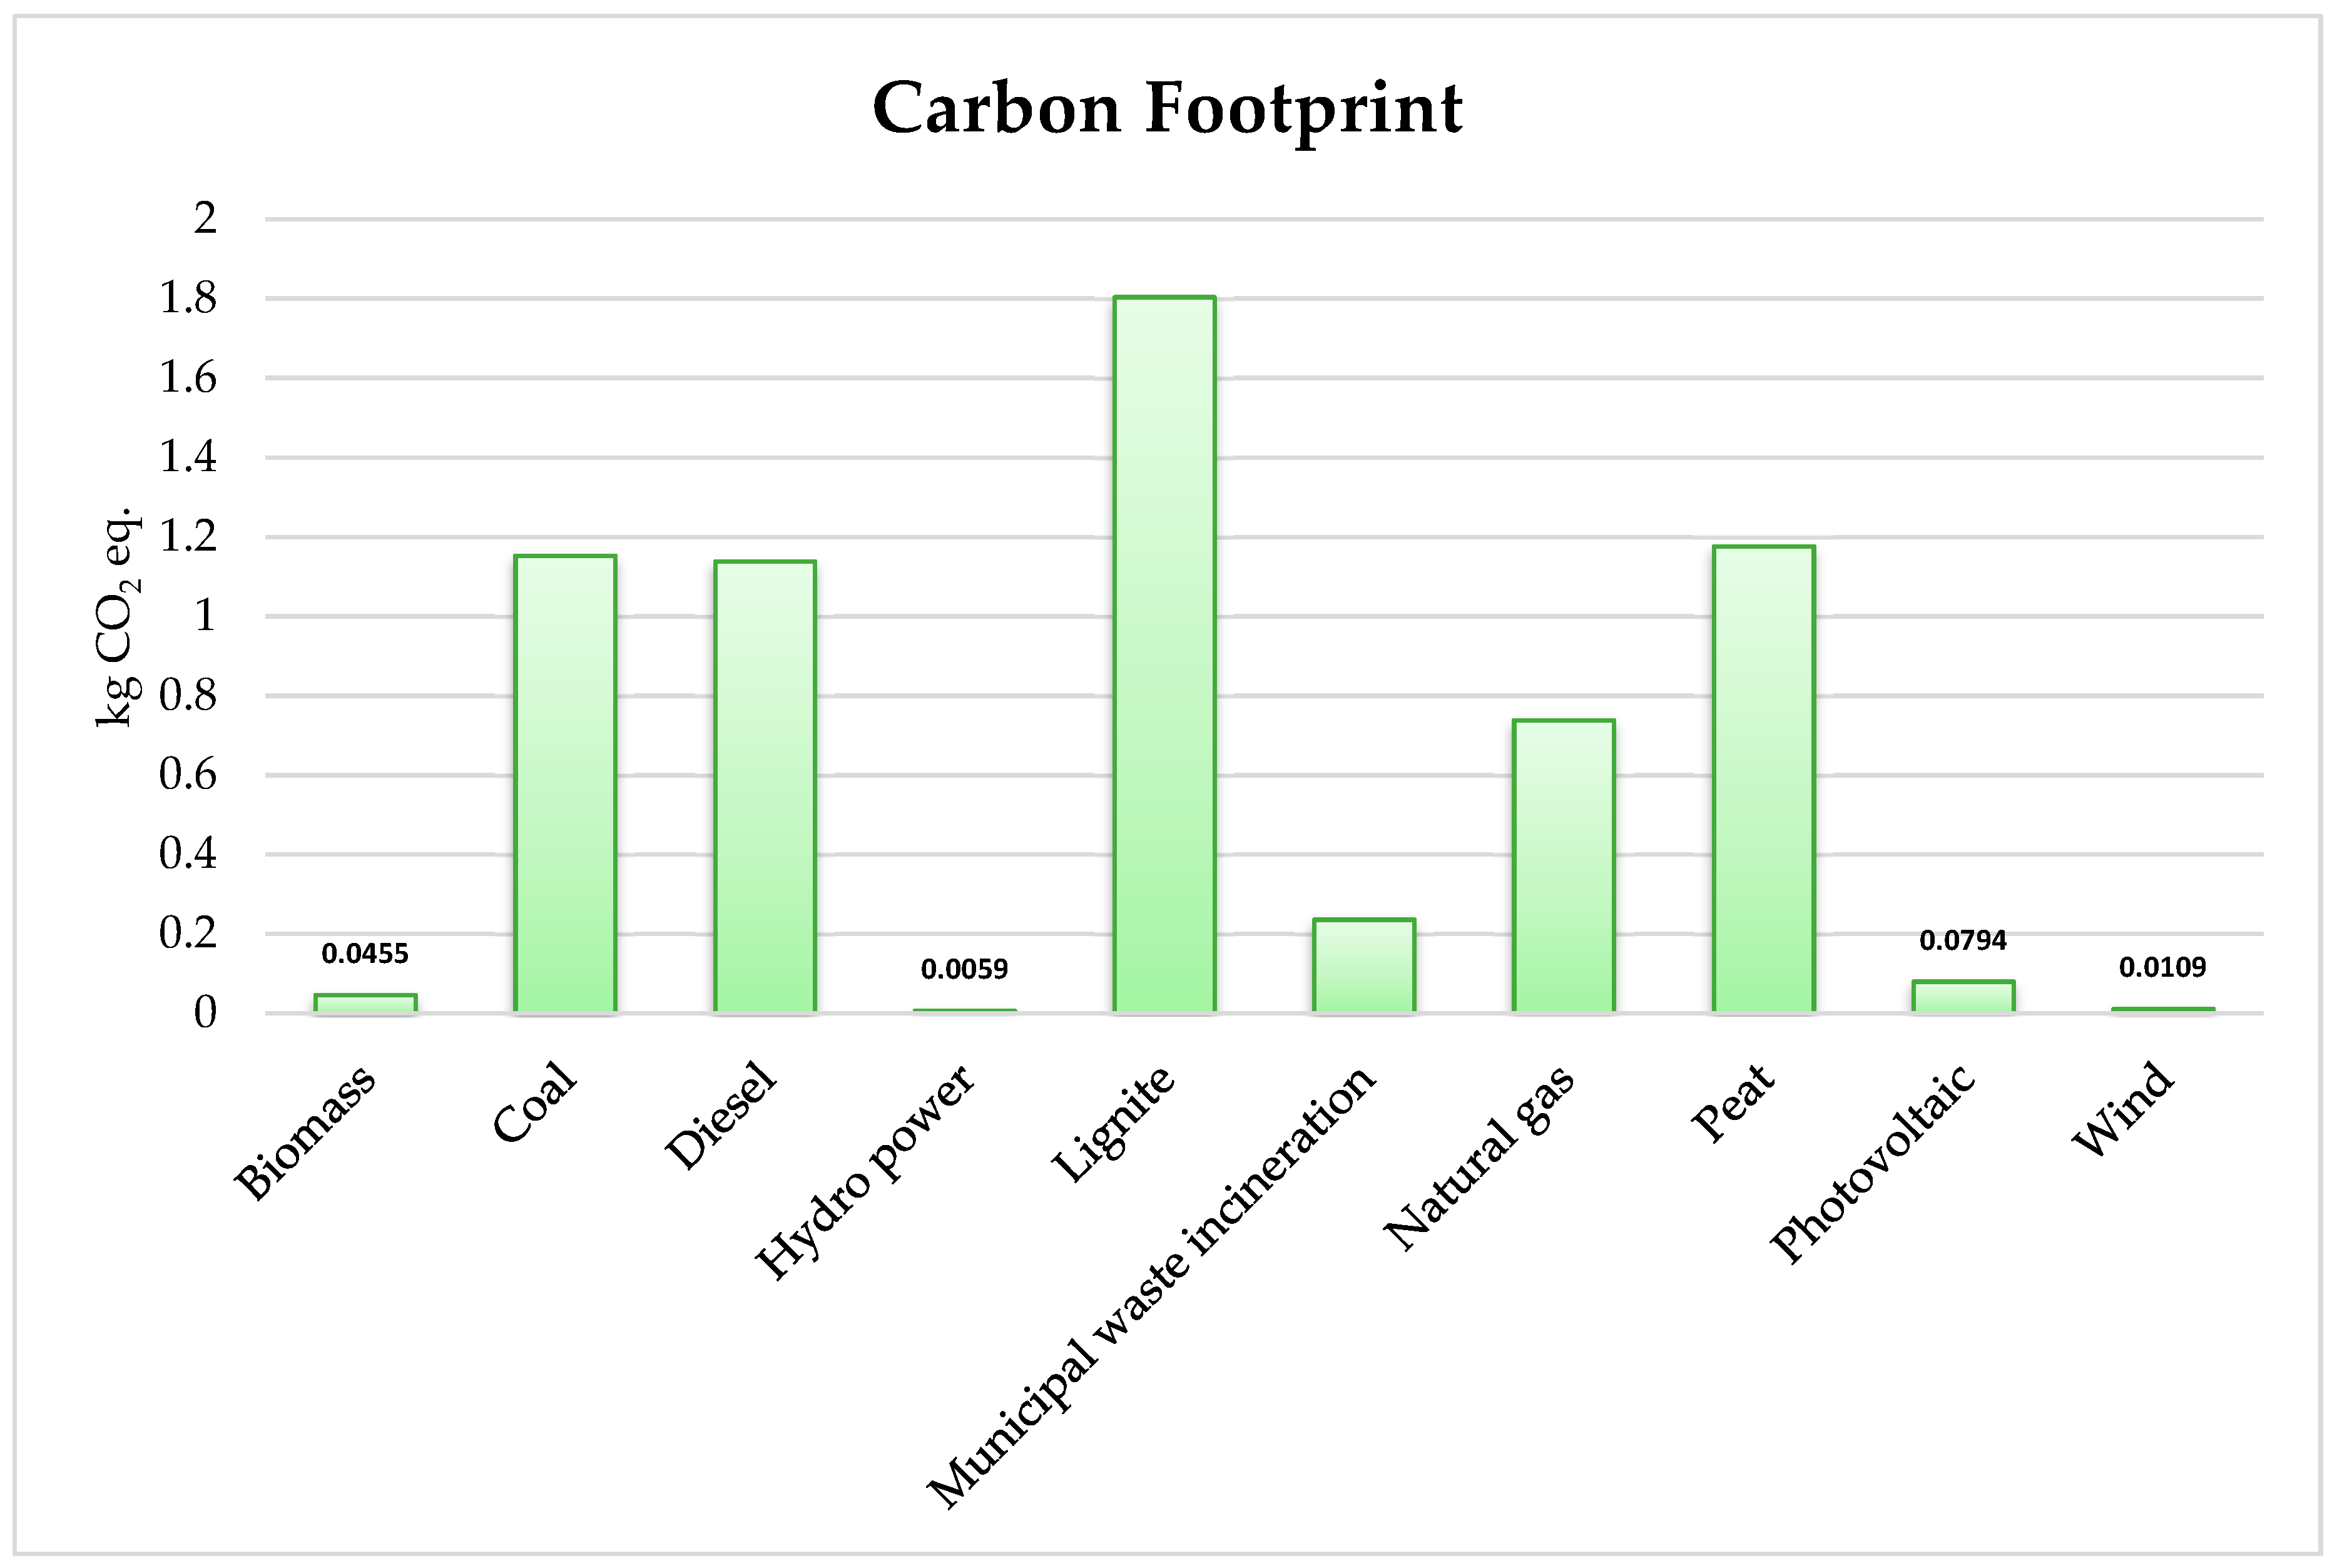
4.8. Carbon Footprint
The Carbon Footprint (CF) was recognized worldwide as a reliable and suitable indicator to evaluate the environmental impact of activities [58,59,60]. This tool has a unique calculation method, which is described in the International Panel on Climate Change (IPCC) guidelines [61,62]. The results of the CF calculation of the different electricity sources, analyzed in this study, are reported in Figure 2. From the results of the LCA and CED analysis, lignite had the highest CF (1.8036 kg CO2 eq.) of the evaluated electricity sources, followed by peat (1.1760 kg CO2 eq.), coal (1.1520 kg CO2 eq.), diesel (1.1375 kg CO2 eq.) and natural gas (0.7382 kg CO2 eq.). The lowest CF was of hydropower with 0.0059 kg CO2 eq., a huge difference from lignite, coal, and diesel. Furthermore, wind, biomass, and photovoltaic had a low CF (0.0109 kg CO2 eq., 0.0455 kg CO2 eq. and 0.0794 kg CO2 eq., respectively).
4.9. Life Cycle Costing
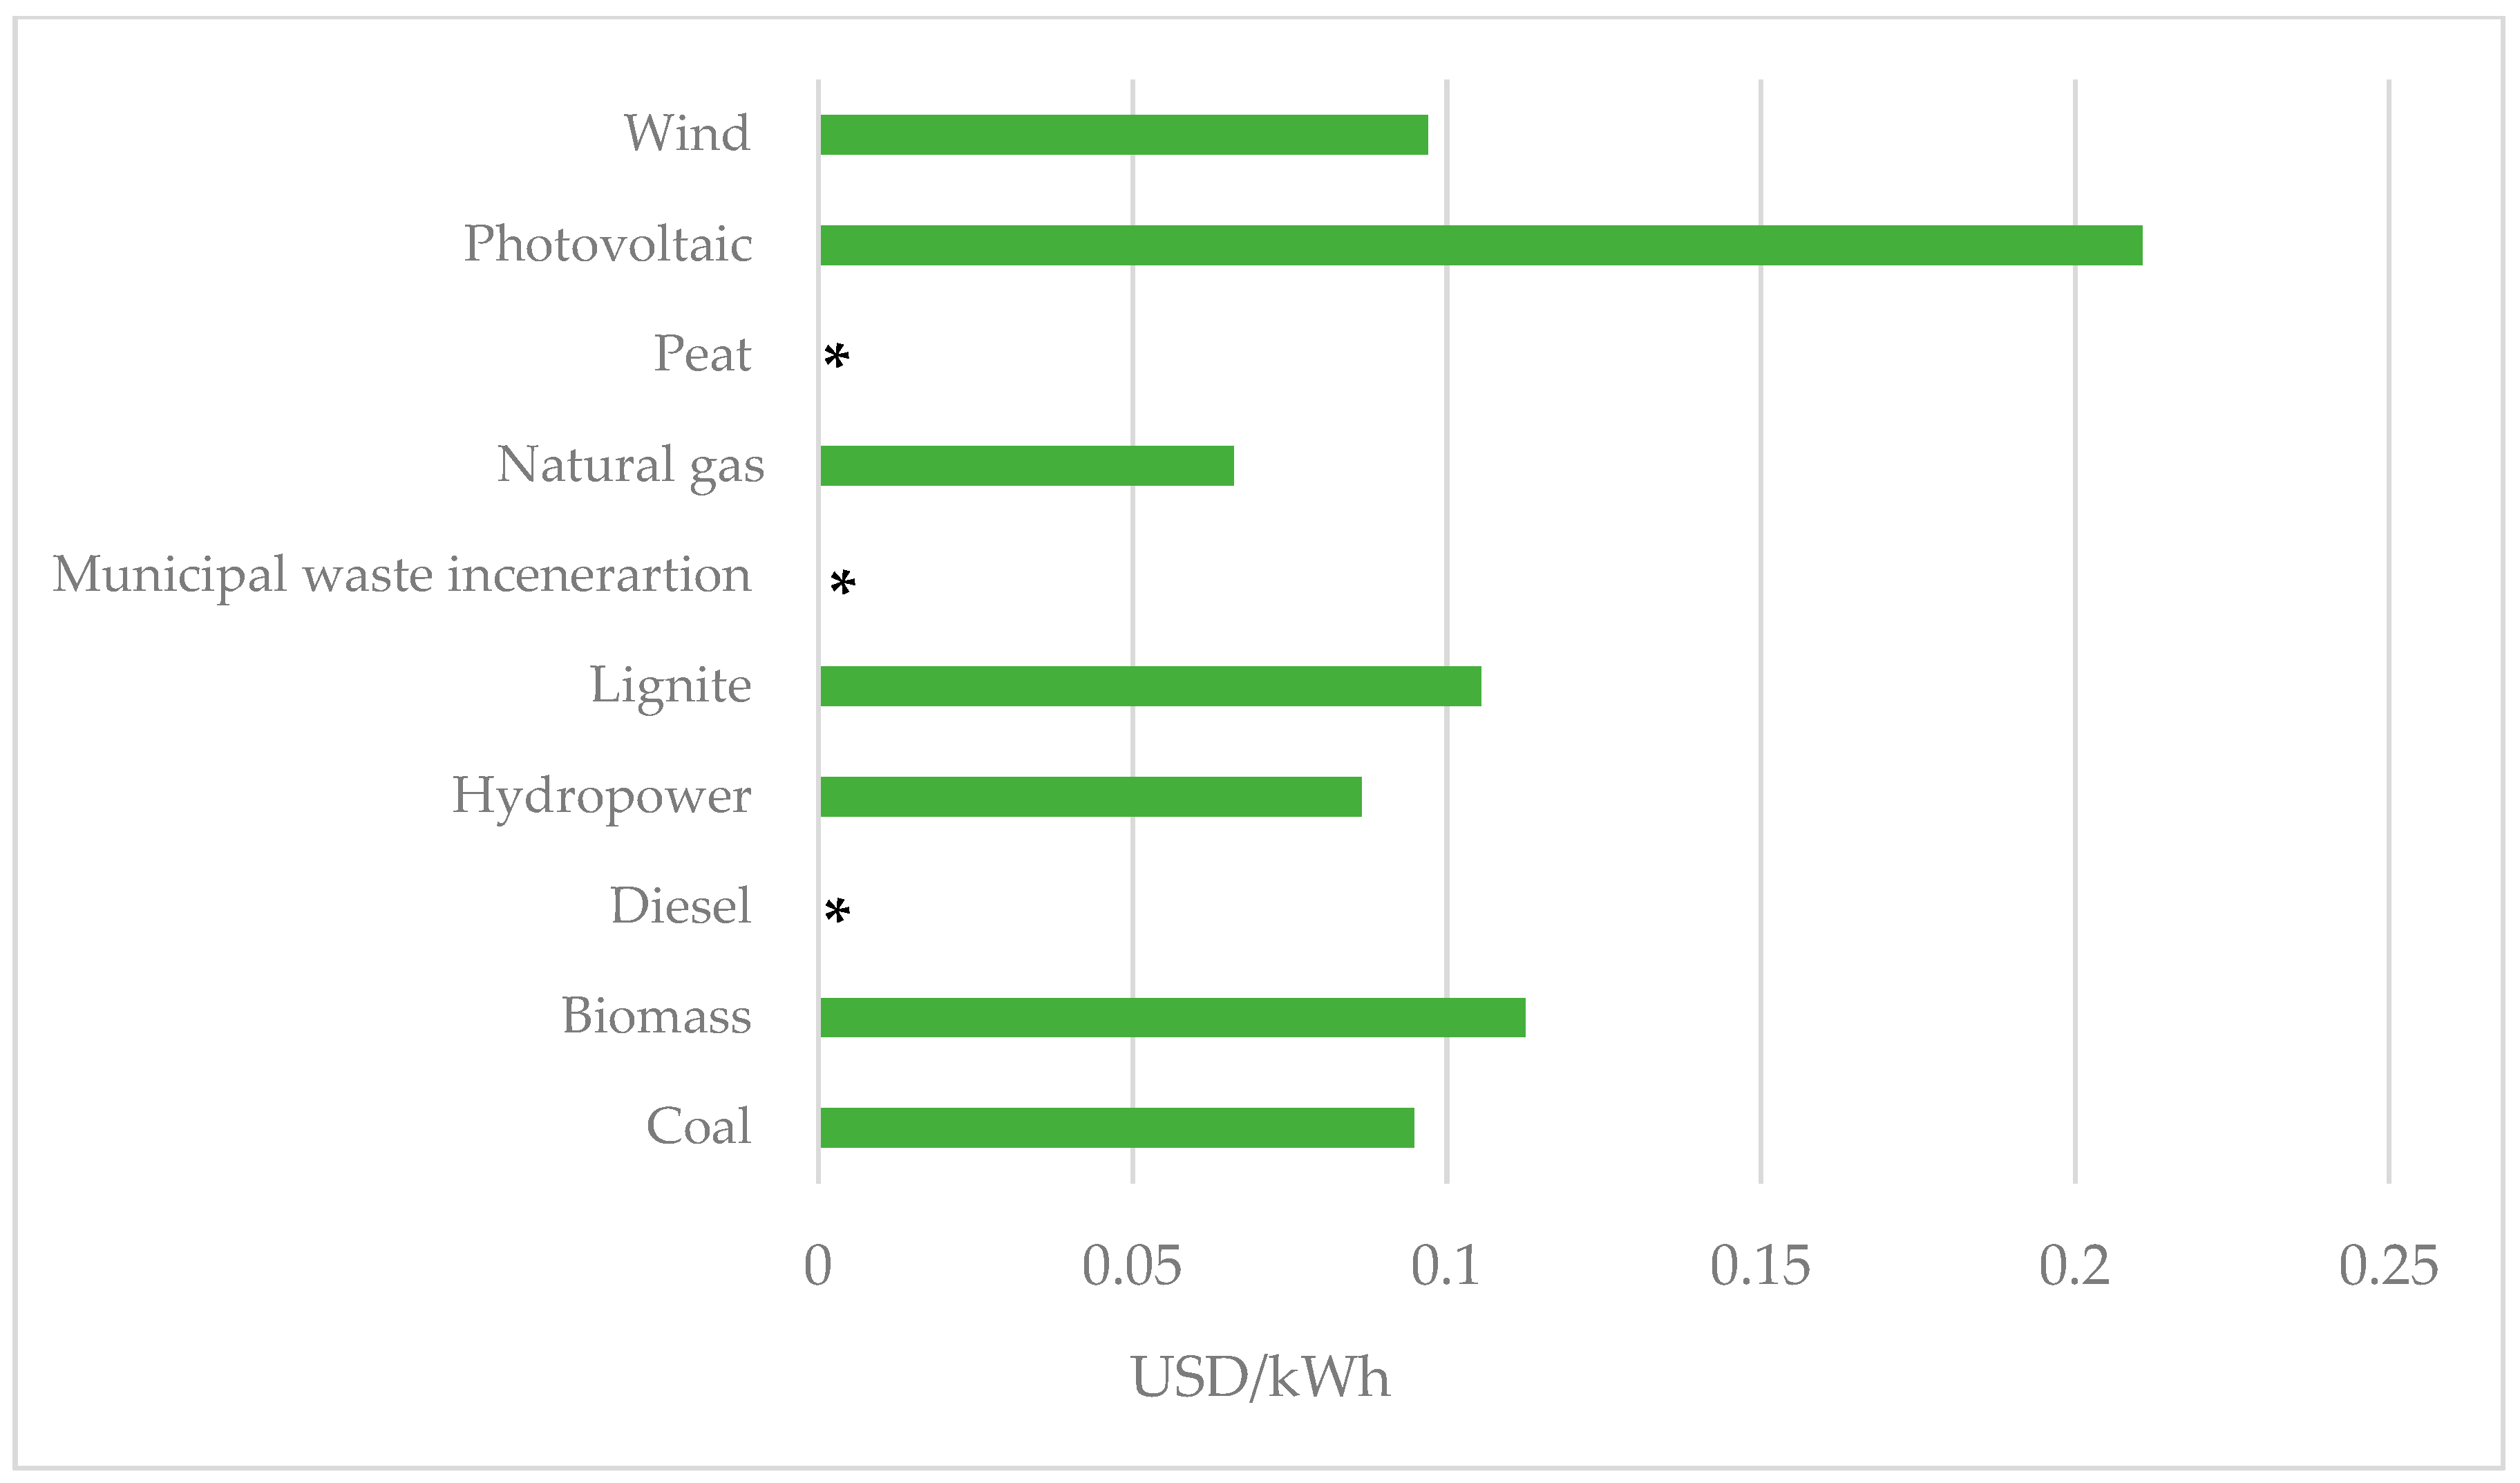
The costs of the electricity production were herein assessed to evaluate which source of electricity was the cheapest using the LCC methodology [63,64,65]. The results are shown in Figure 3 and are expressed in USD for 1 kW/h. The costs refer to Italian electricity production and no data have been reported for diesel, municipal waste incineration, and peat sources.
5. Discussion
5.1. Midpoint Method Comparison
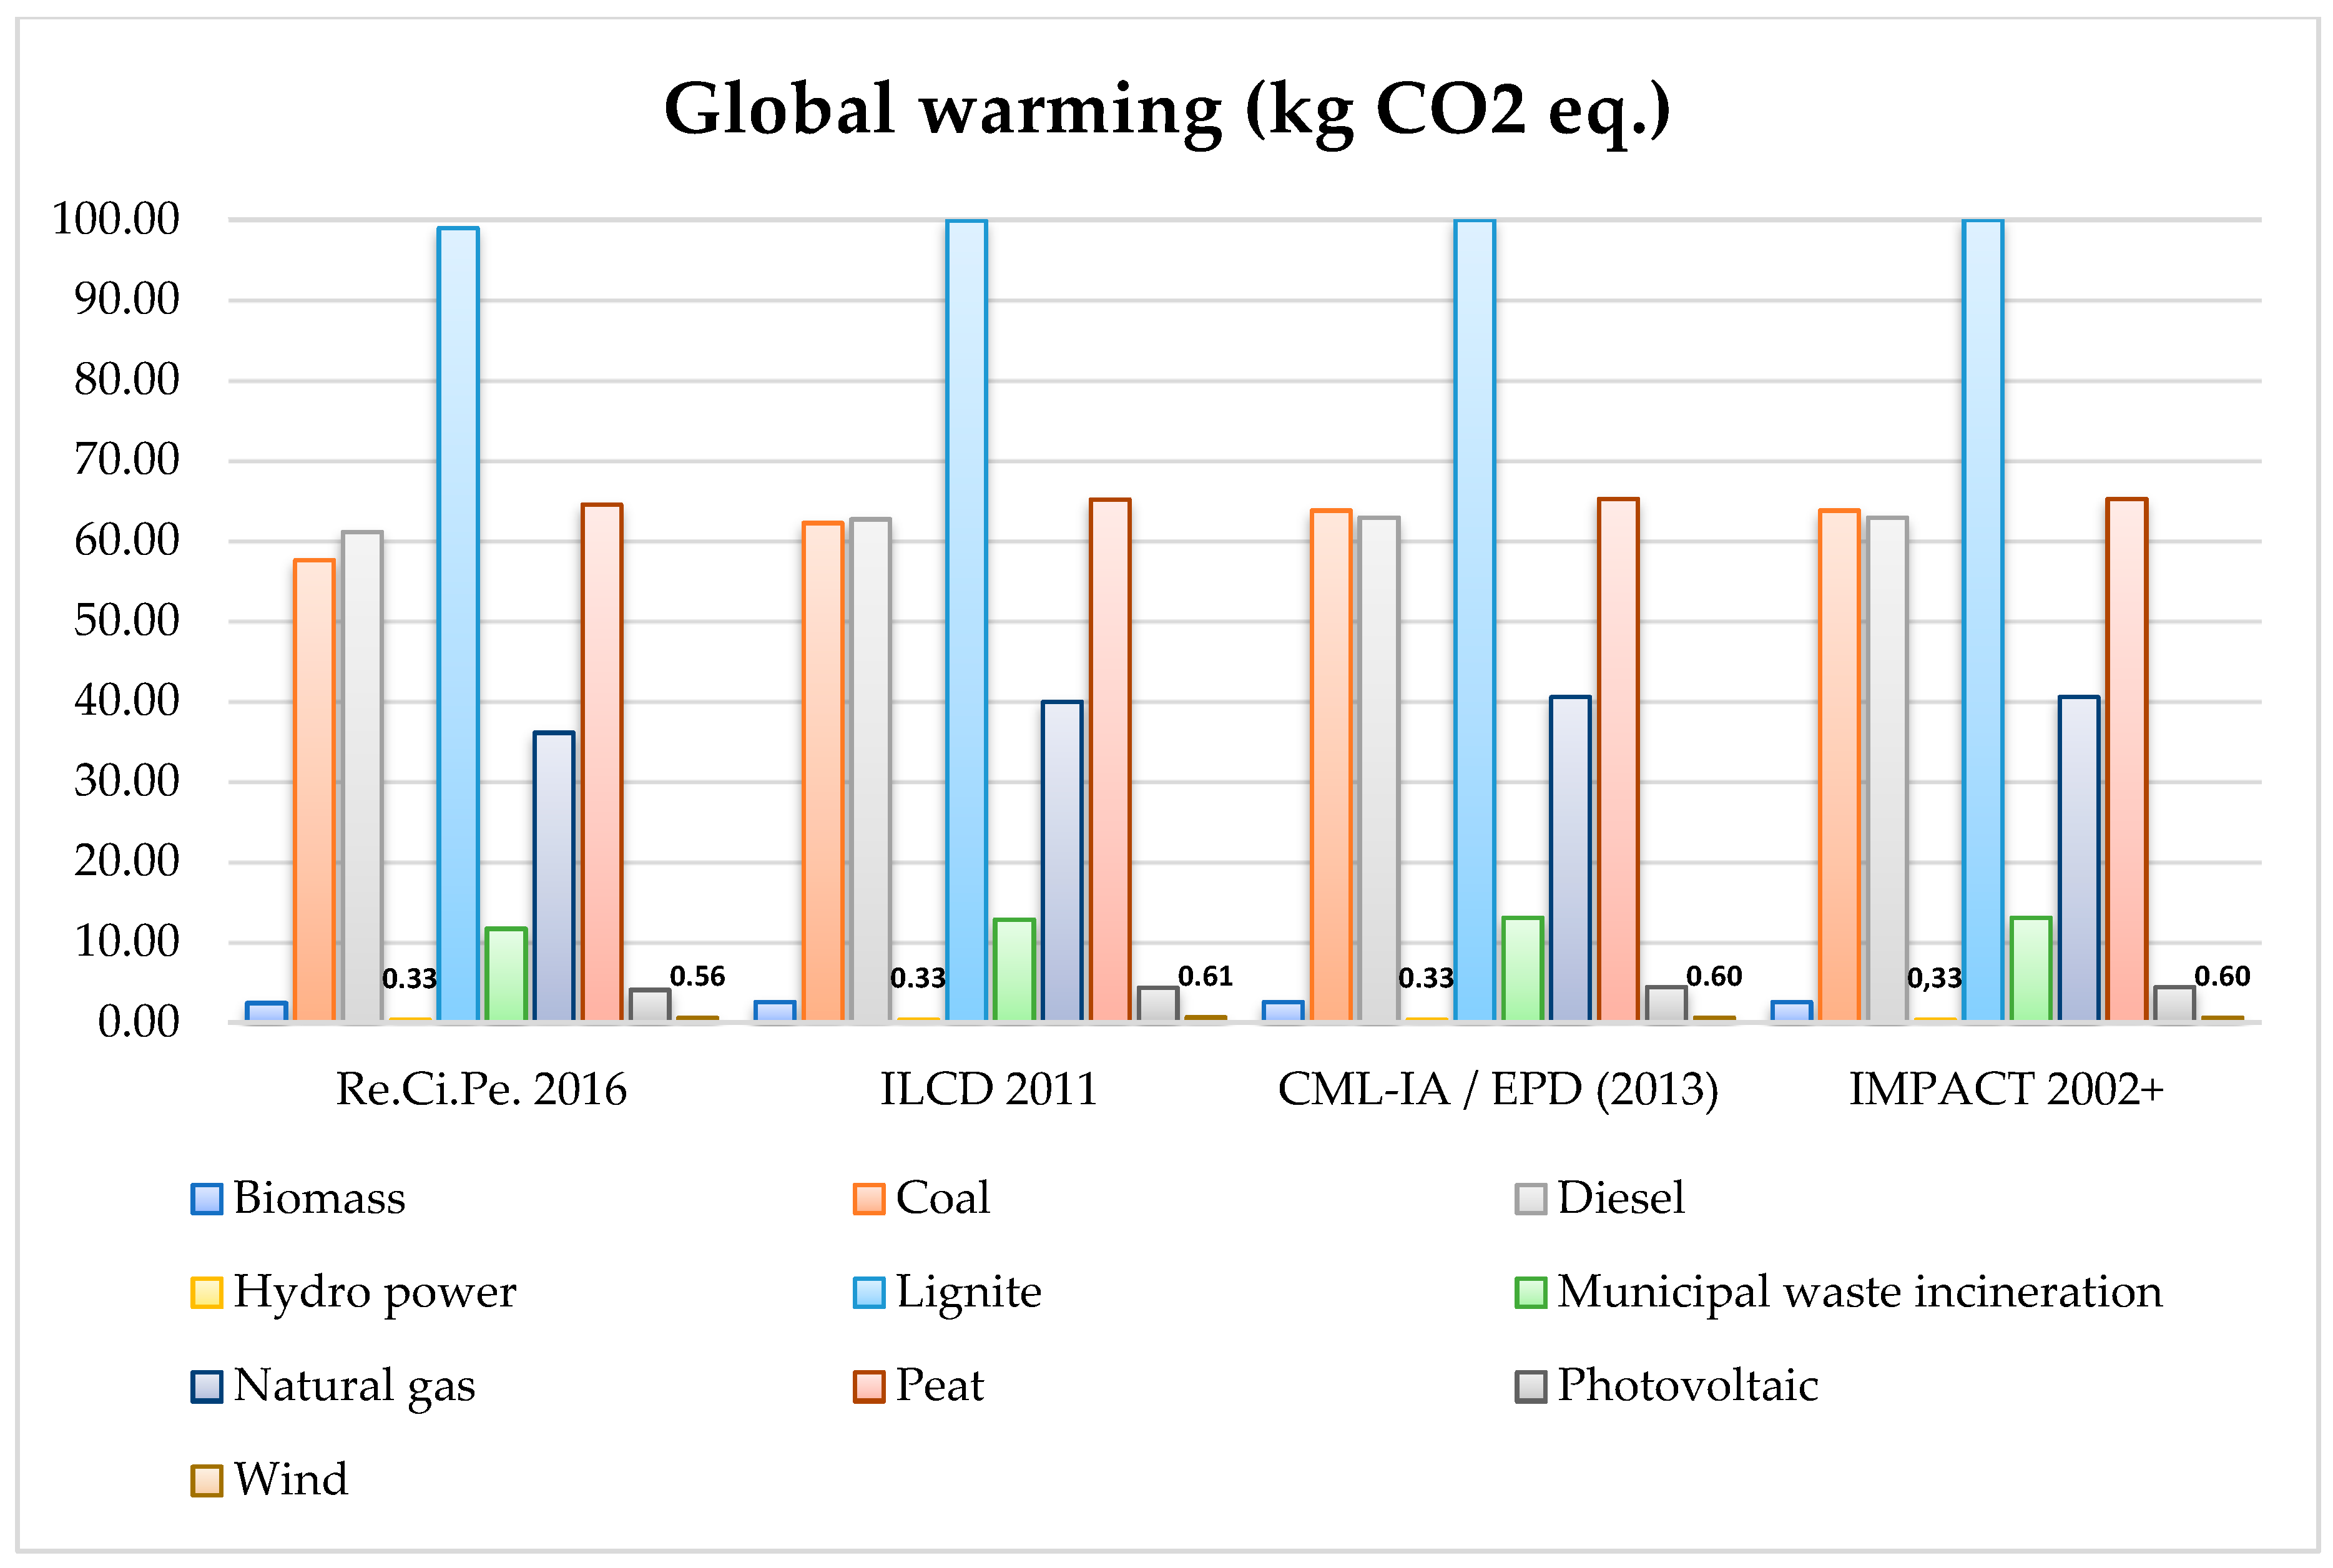
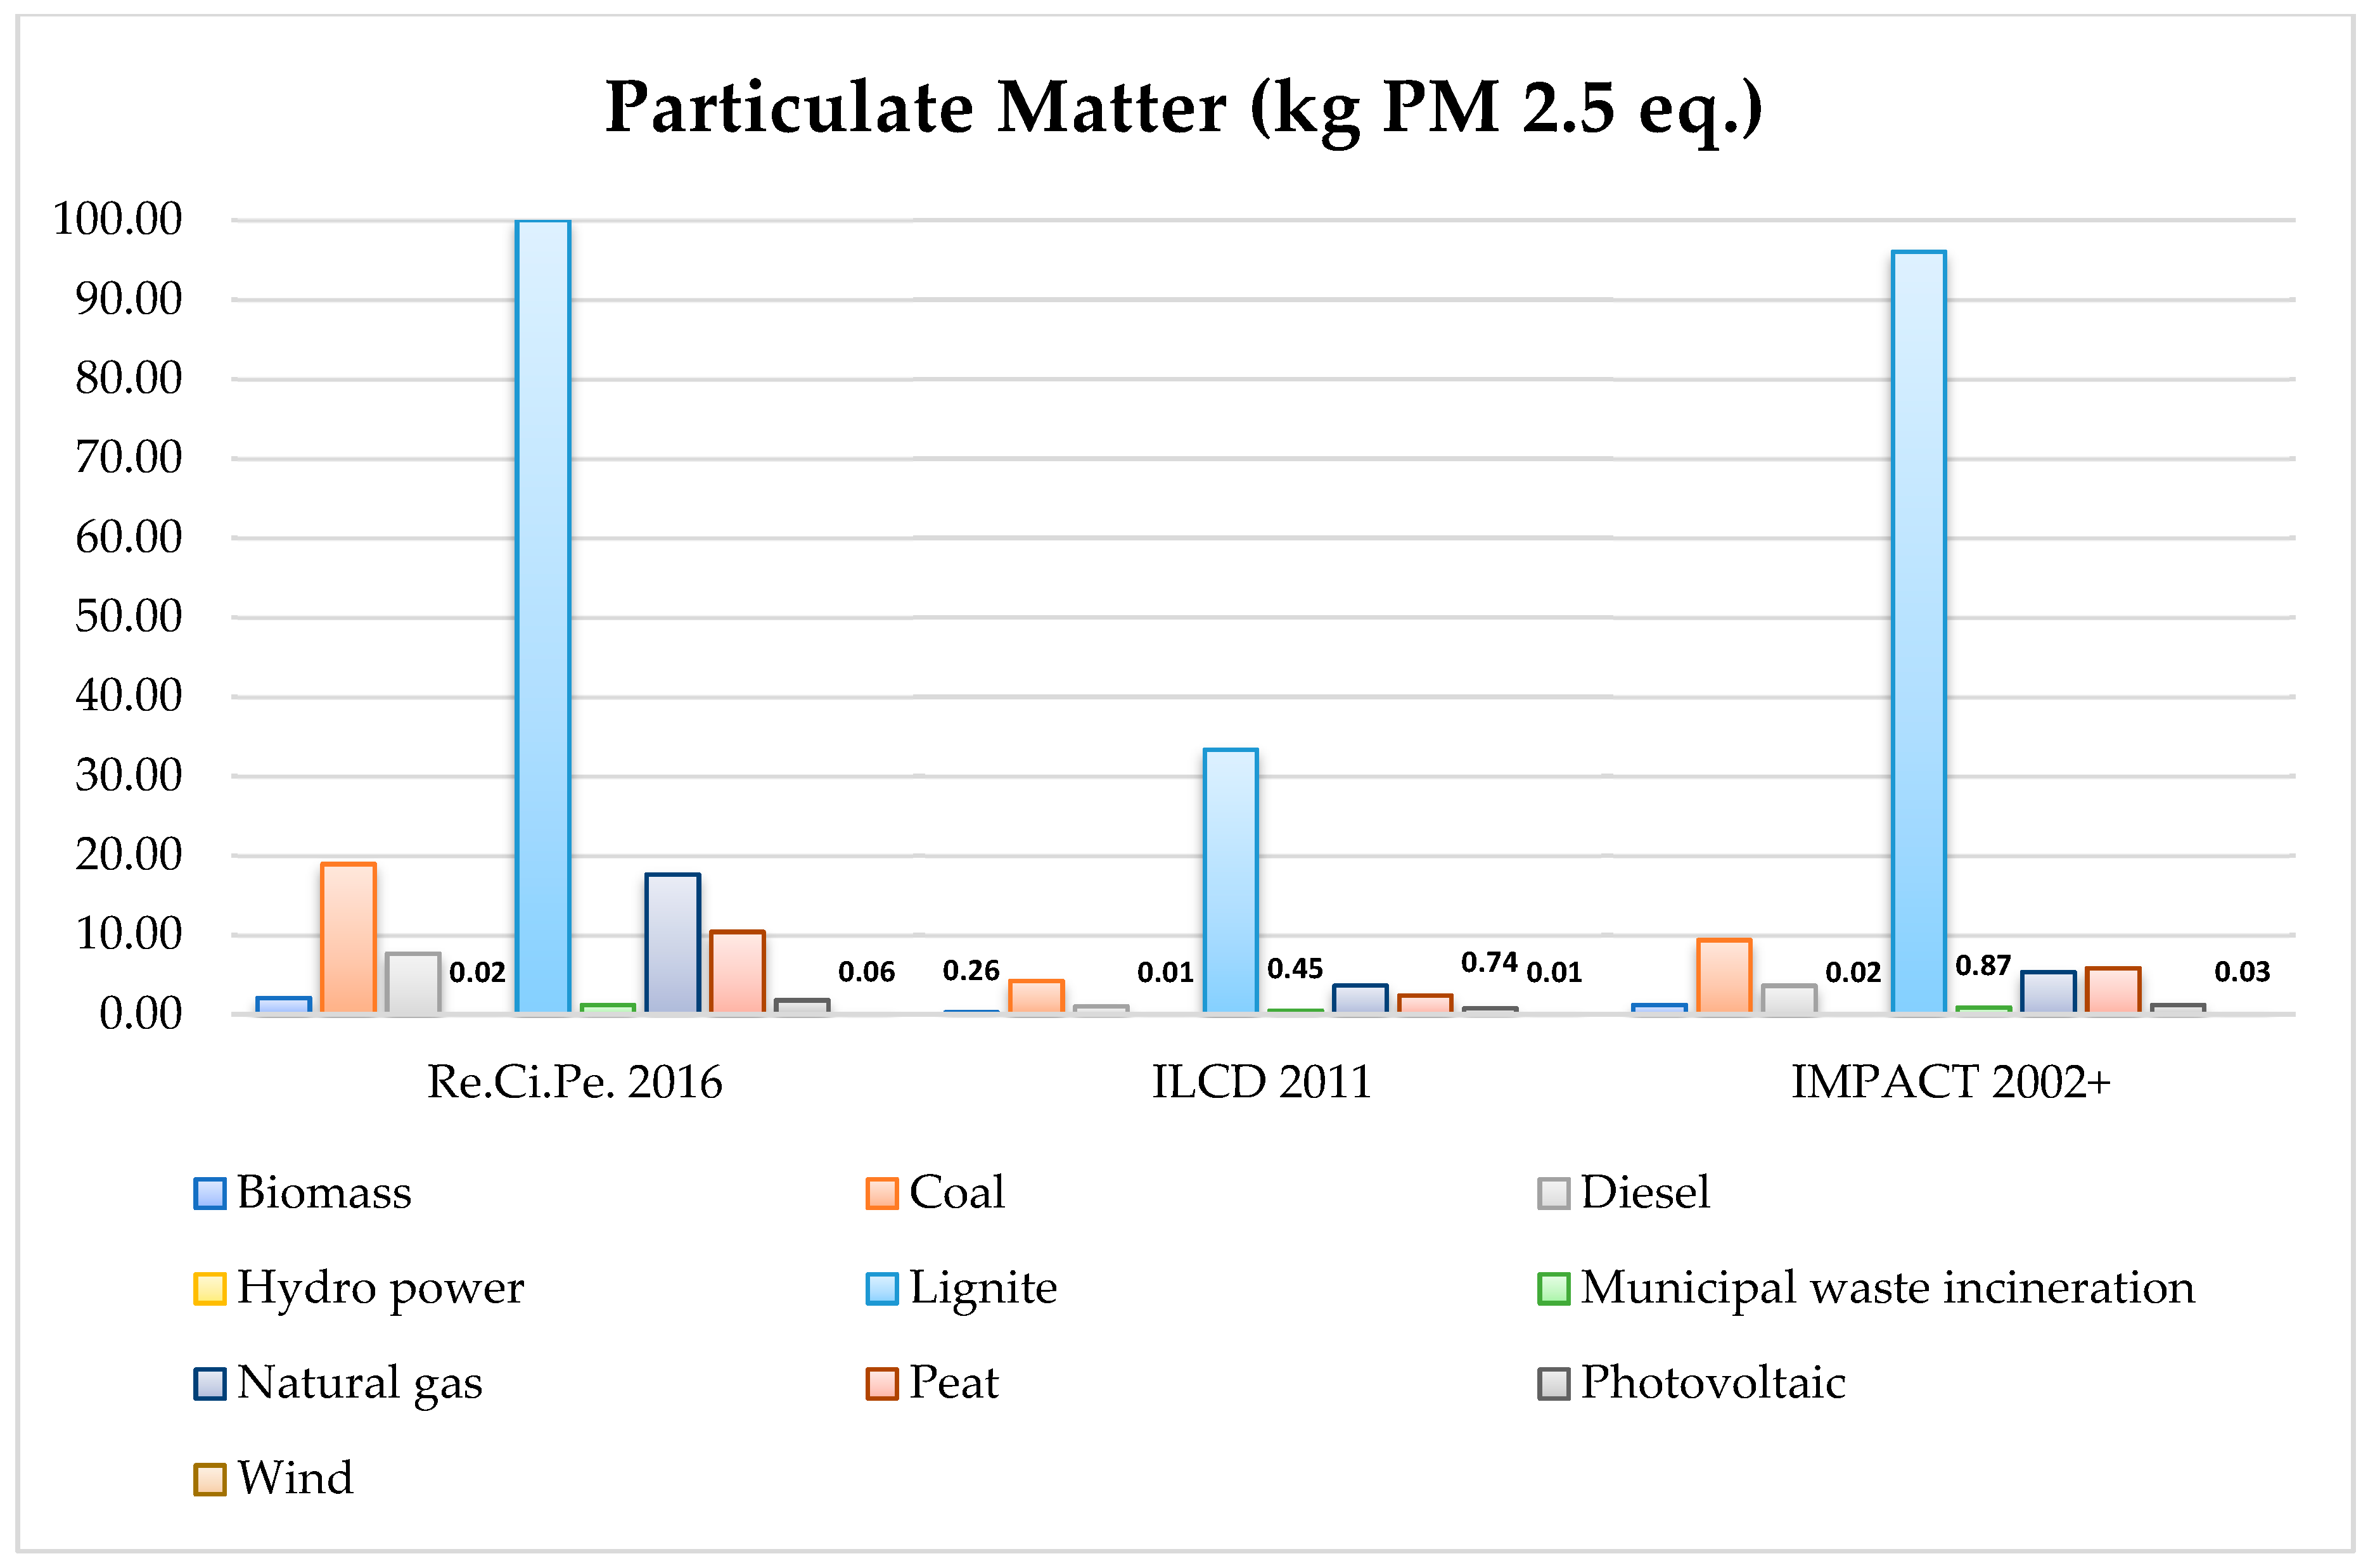
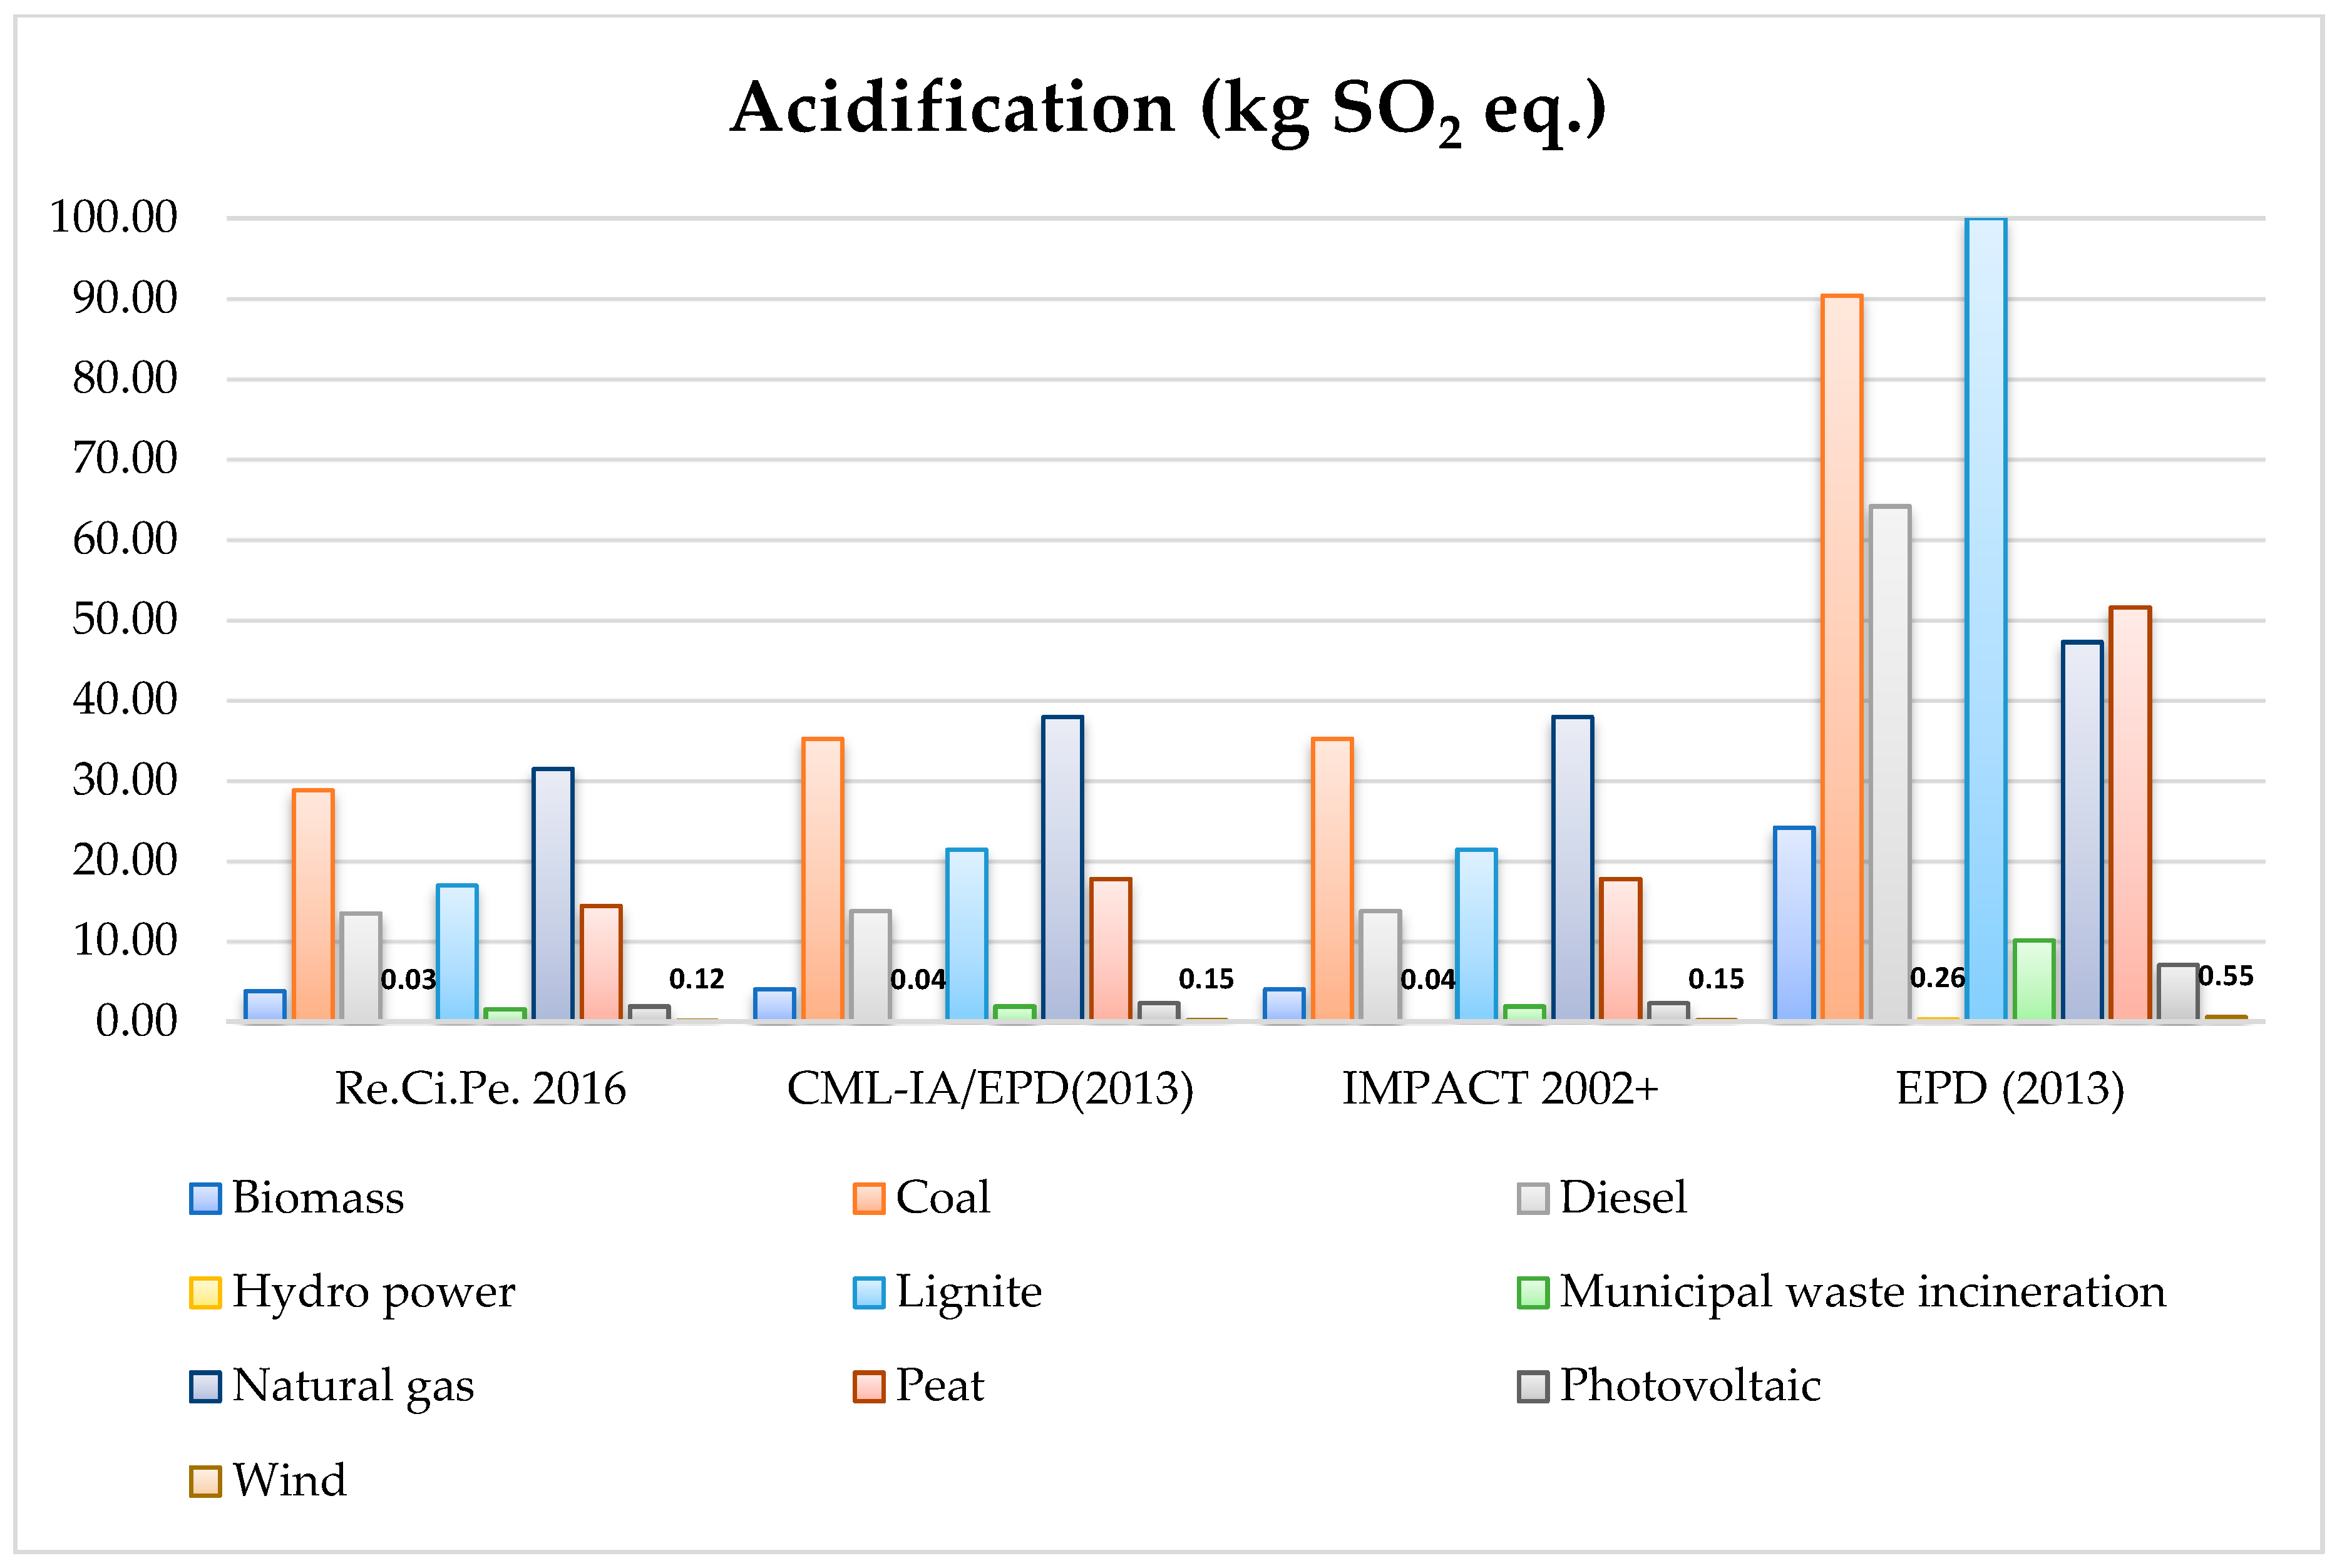
To assess the environmental impacts of the electricity sources, six midpoint LCIA methods have been applied and compared, i.e., ReCiPe 2016, ILCD 2011, CML-IA, IMPACT 2002+, and EPD (2013). The results associated with the different impact categories were heterogeneous. Moreover, even if the category described the same damage, the measurement unit used was different. For example, the category dealing with ionizing radiation is described by kBq Co-60 eq. in the ReCiPe 2016 method, CTUe in ILCD 2011, and Bq C-14 eq. in IMPACT 2002+. Therefore, it is not possible to compare values with different measurement units, even if they are described in the same impact category. Nevertheless, some categories are expressed in a unique measurement unit. The first one is the global warming category, expressed as kg of CO2 eq. for all the methods analyzed. To compare the data, Figure 4 shows the percentage of each source relative to the highest-impact one. In all the midpoint methods, the highest-impact source in the global warming category was lignite (100%), followed by peat (65%). The greatest difference was found for the coal and diesel sources. In the ReCiPe 2016 and ILCD 2011 methods, diesel showed a higher value than coal. In contract, in the CML-IA/EPD (2013) and IMPACT 2002+ methods, the trend was the opposite. The other sources did not highlight significant differences. The second category was the particulate matter in the ReCiPe 2016, ILCD 2011, and IMPACT 2002+ methods, expressed as kg of PM2.5 eq. (Figure 5). Additionally, in this case, the highest values were found for lignite but there was a great difference between ILCD 2001 and the other two methods. All the values in the ILCD 2001 method for particulate matter were 70% less if compared with ReCiPe 2016 and IMPACT 2002+. So, the ILCD 2001 method was not appropriate to describe the impacts associated with particulate matter. The least comparable category was the acidification one, which was expressed in kg SO2 eq. for all the methods analyzed, except for the ILCD 2011 one. The ReCiPe 2016, CML-IA, and IMPACT 2002+ methods had the same trend for the impacts in this category (Figure 6). Natural gas was the highest-impact source, followed by coal, lignite, and peat. The results of the EPD (2013) method showed 10% to 80% higher values than the other ones. For this method, lignite had the highest overall environmental impact, followed by coal, diesel, and natural gas.
5.2. Endpoint Method
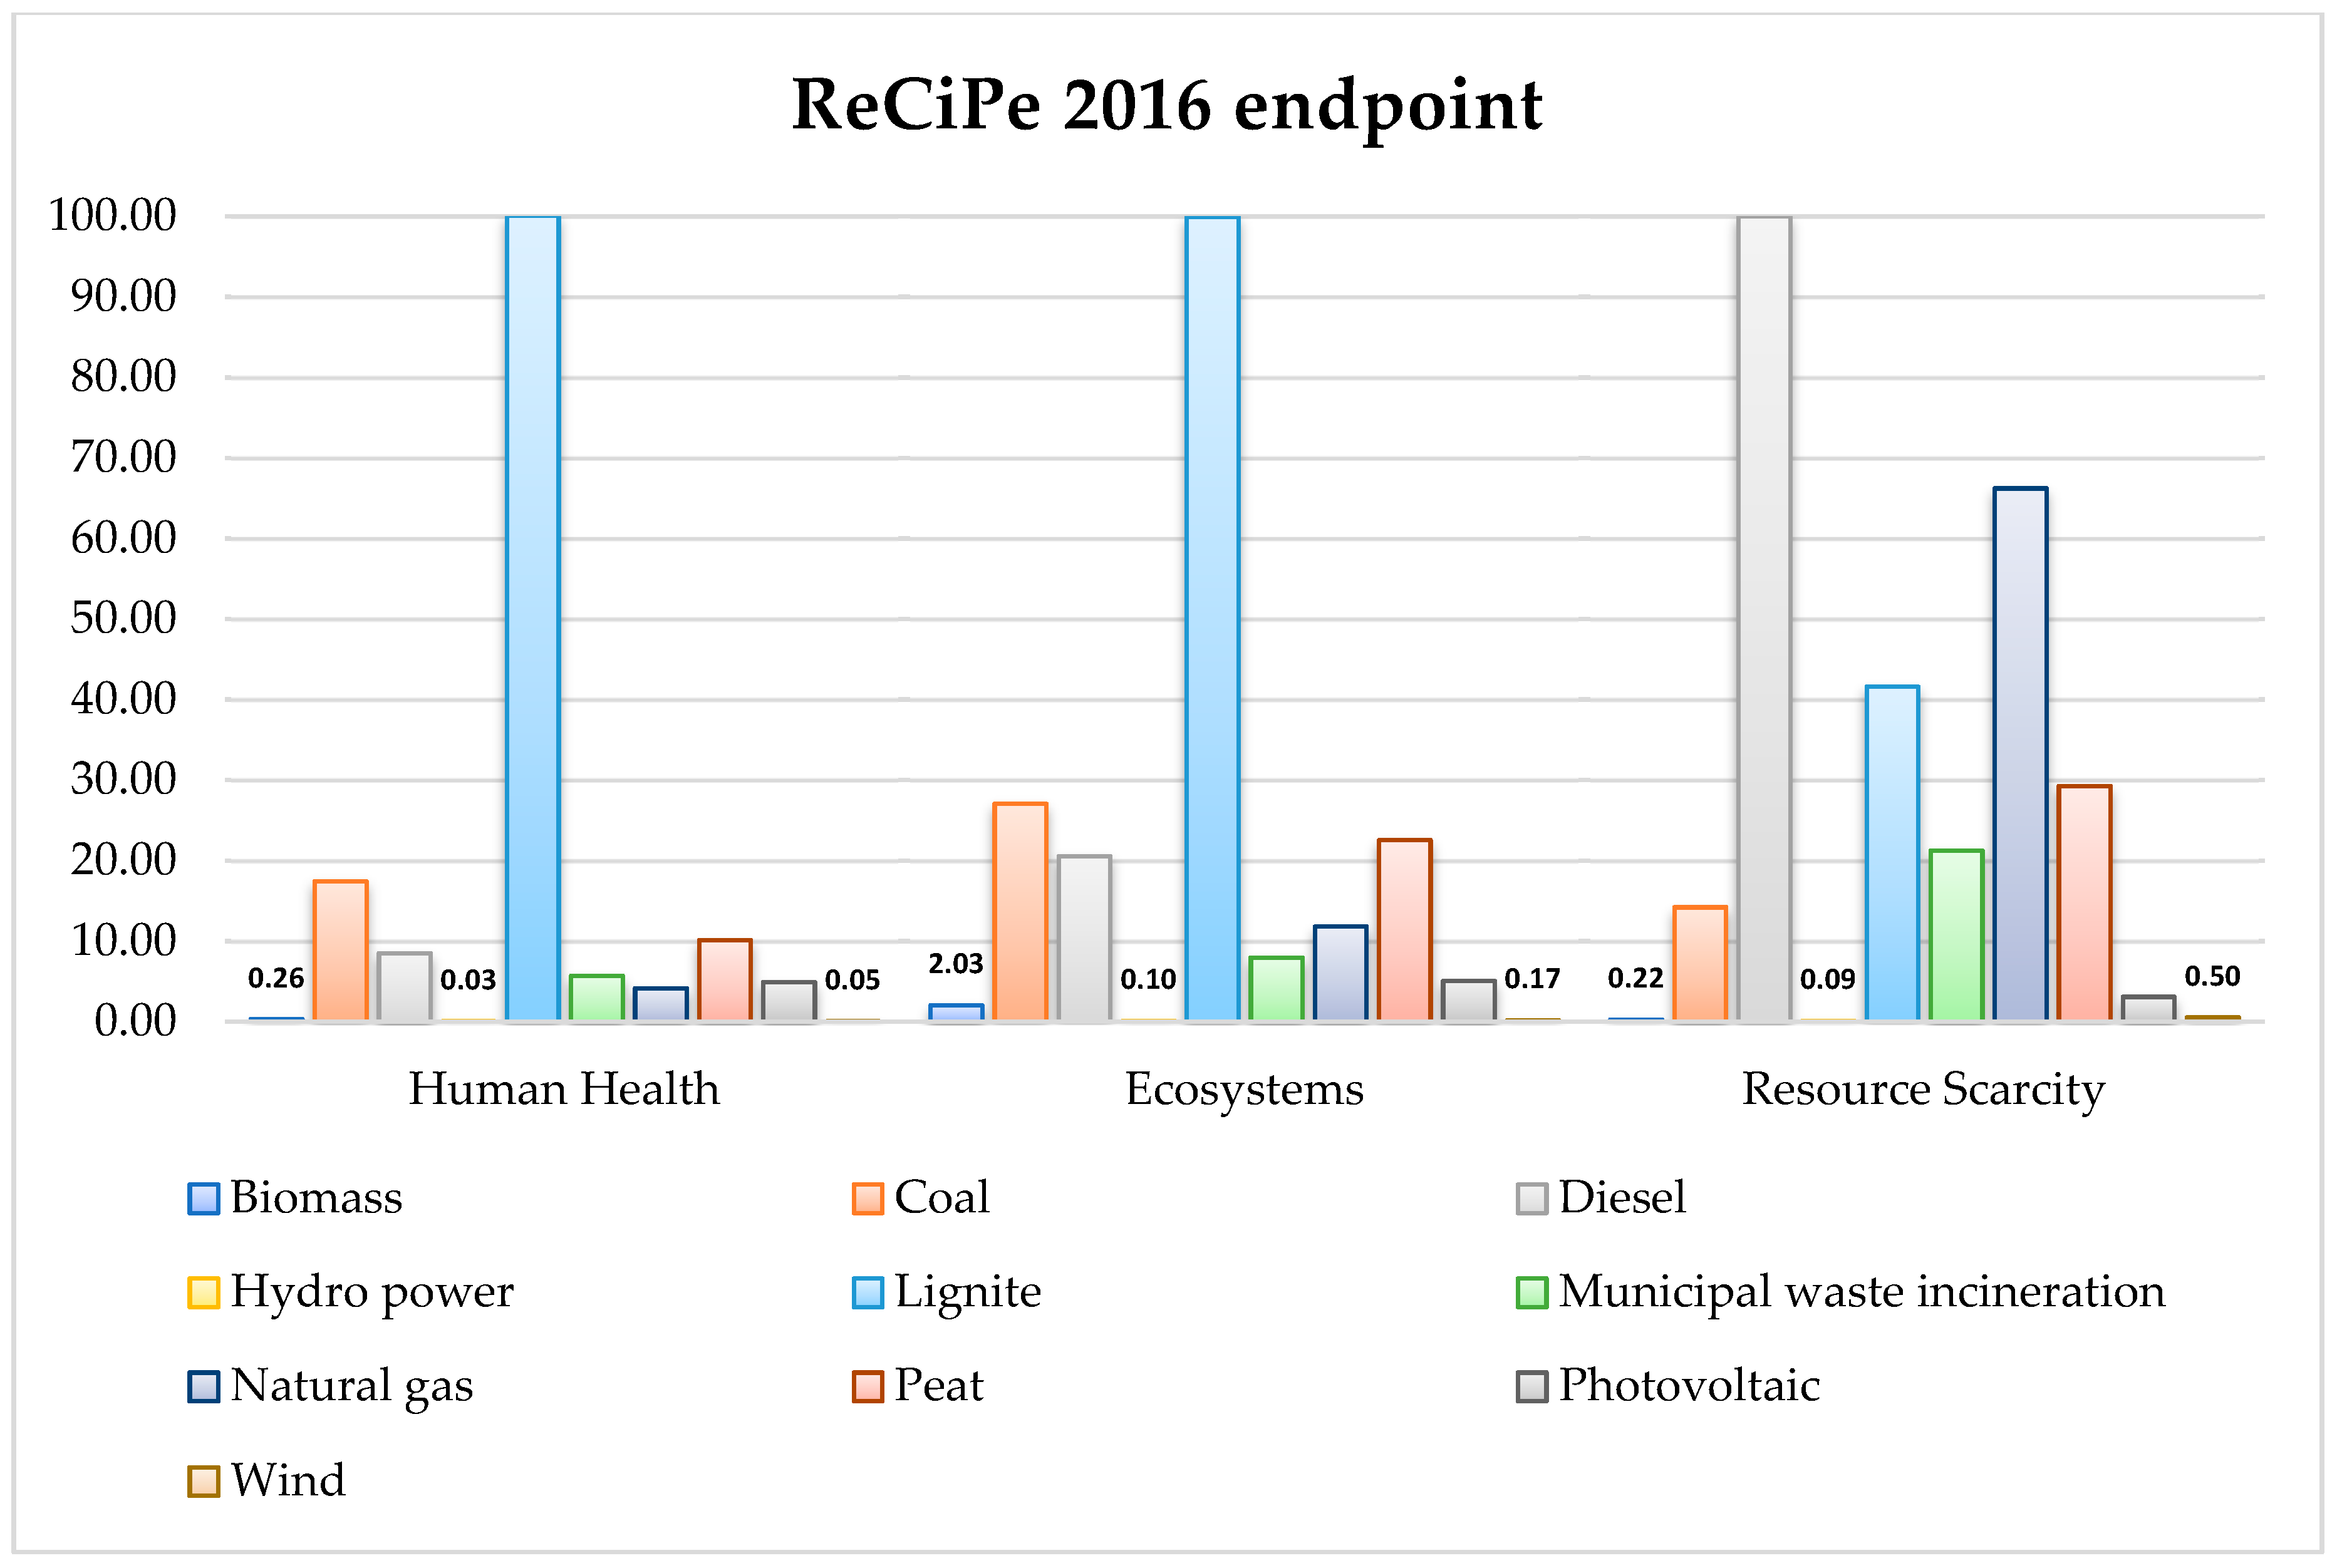
Since the ReCiPe 2016 endpoint method involved the use of only three measurement units, it was possible to compare and to summarize the impacts from different categories in the three main areas (human health, ecosystems, and resources scarcity). Therefore, the impact categories values with the same measurement unit were summarized. In Figure 7, the relative percentages of each source are shown, compared to the highest value calculated. In this way, it was possible to highlight the total impact and to valorize the real contributions of each source in the area studied. In terms of human health, lignite was the source with the highest impact (100%), followed by coal (17%) and peat (10%), while those with the least impact were hydropower (0.03%), wind (0.05%), and biomass (0.26%). The same energy sources also had the lowest values in terms of ecosystem impact (0.10%, 0.17%, and 2.03%, respectively) while lignite, coal, and peat had here the highest impact. In terms of resource scarcity, the trend of the sustainable sources was the same while that of the highest impact ones was quite different. Diesel had the highest value in this area, followed by natural gas (66%), lignite (41%), and peat (29%).
5.3. Single Issue Method
In addition to the impact assessment with midpoint and endpoint methods, some individual issues were evaluated, i.e., cumulative energy demand, carbon footprint, and cost analysis. In the CED, biomass was the source with the lowest value (0.034 MJ eq.), even if its origin was 100% non-renewable fossil. Lignite, with an energy use of 17.791 MJ, was the source with the highest CED value. For the CED, the best source was wind, which had a negative value in the renewable parameter, indicating that there is not a withdrawal but a release of energy. The results of the carbon footprint evaluation confirmed that the most environmentally friendly sources were hydropower, wind, biomass, and photovoltaic (CF < 0.1 kg CO2 eq.). A medium impact was attributable to municipal waste incineration and natural gas (CF < 1.0 kg CO2 eq.) and a high impact to lignite, coal, peat, and diesel (CF > 1.0 kg CO2 eq.). In addition, the cost analysis using LCC highlighted that the largest cost is for photovoltaic electricity generation (0.2107 USD/kWh), while the other sources have costs ranging from 0.086 to 0.11 USD/kWh. In this analysis, cheapest electricity generation was found for natural gas (0.0661 USD/kWh).
6. Conclusions
This study provided an evaluation of the environmental and economic sustainability of electricity sources used for electric vehicles, i.e., coal, peat, lignite, diesel, natural gas, hydropower, wind, municipal waste incineration, photovoltaic, and biomass. A life cycle assessment was conducted by comparing the results of six midpoint and one endpoint methods for the calculation of the impacts. The midpoint methods provided heterogeneous results. In the global warming category (kg CO2 eq.), the highest-impact sources were lignite, peat, and coal, while the lowest-impact ones were hydropower and photovoltaic. The same trend was highlighted in the particulate matter category (kg P.M. 2.5 eq.). ILCD 2011 underestimated values, this method seems more appropriate for water considerations. It was possible to make another comparison of the acidification category (kg SO2 eq.). In this category, ReCiPe 2016, CML-IA and IMPACT 2002+ had the same impact trend. The highest-impact source was natural gas, followed by coal and lignite. The EPD (2013) method showed values that were between 10% and 80% higher than the other ones. In addition, in this method, lignite was the highest-impact source, while natural gas ranked fifth.
The endpoint analysis method provided information on the impacts on human health, ecosystems, and resource scarcity areas. In terms of human health, lignite was the highest-impact source, followed by coal and peat, while hydropower, wind, and biomass were the most sustainable. In terms of ecosystem, the same categories had the lowest values, while lignite, coal, and peat had the highest. In terms of resource scarcity, the trend of the sustainable sources was the same, while diesel had the highest value, followed by natural gas, lignite, and peat. In addition, the cumulative energy demand and carbon footprint indicators were calculated. Biomass was the source that used the least energy (0.034 MJ eq.), but its origin was 100% non-renewable. Lignite also had 100% non-renewable origins and used the most energy (17.791 MJ eq.). The lower CFs were for wind, biomass, and photovoltaic (0.0109 kg CO2 eq., 0.0455 kg CO2 eq. and 0.0794 kg CO2 eq., respectively). A medium impact was observed for municipal waste incineration and natural gas (CF < 1.0 kg CO2 eq.) and a high impact for lignite, coal, peat, and diesel (CF > 1.0 kg CO2 eq.).
A life cycle costing was conducted to evaluate the economic sustainability of the analyzed sources. Photovoltaic electricity generation was the most expensive (0.2107 USD/kWh), natural gas was the cheapest (0.0661 USD/kWh), and the other sources had a cost ranging from 0.086 to 0.11 USD/kWh.
Therefore, the analysis of the environmental and economic sustainability herein proposed was proved suitable to evaluate the impacts of the electricity sources used in electric mobility. This study might provide a valid tool for decision-makers, offering them the possibility to choose the electricity sources considering the impacts that they want to reduce. Furthermore, an integrated approach of an LCA of the vehicles with the results of this study could be applied. For instance, if the vehicle LCA resulted in a large emission of particulate matter, thanks to this study, one could choose to use hydropower or photovoltaic electricity sources, as these were found to have the lowest impact in this category. A limitation of this study is the heterogeneous results provided by the evaluation. Nevertheless, this was a particular limit of LCA studies, as it has been reported in the literature section for H2 production. In addition, there was no single environmentally friendly way to produce H2—it depended on the considered indicator. Another issue was the fact that the data were based on Italian electricity production, so they described a local situation. For these reasons, there are many avenues for further research such as the expansion of the inventory to describe and to evaluate a global or European condition. Moreover, further work to build on this study could involve the integrated evaluation of electric vehicle production and their disposal using an LCT approach.
Supplementary Materials
The following are available online at https://www.mdpi.com/1996-1073/13/23/6292/s1, Table S1: LCIA results for different electricity sources by ReCiPe 2016, ILCD 2011, CML-IA, IMPACT 2002+, and EPD (2013) midpoint methods. Data employed in the elaboration reported in Section 4, Figure 1 (Global warming), Figure 2 (Particulate Matter) and Figure 3 (Acidification), Table S2: LCIA results for different electricity sources by ReCiPe 2016 endpoint method. Data employed in the elaboration reported in Section 4.7. and Figure 4.
Author Contributions
M.R., L.G. and R.R. contributed equally to the paper. All authors have read and agreed to the published version of the manuscript.
Funding
This research received no external funding.
Conflicts of Interest
The authors declare no conflict of interest.
References
- Qiao, H.; Zheng, F.; Jiang, H.; Dong, K. The greenhouse effect of the agriculture-economic growth-renewable energy nexus: Evidence from G20 countries. Sci. Total Environ. 2019, 671, 722–731. [Google Scholar] [CrossRef] [PubMed]
- Adedeji, A.R.; Zaini, F.; Mathew, S.; Dagar, L.; Petra, M.I.; De Silva, L.C. Sustainable energy towards air pollution and climate change mitigation. J. Environ. Manag. 2020, 260, 109978. [Google Scholar] [CrossRef] [PubMed]
- De Cian, E.; Sue Wing, I. Global Energy Consumption in a Warming Climate. Environ. Resour. Econ. 2019, 72, 365–410. [Google Scholar] [CrossRef]
- Li, J.; Wang, L.; Li, T.; Zhu, S. Energy security pattern spatiotemporal evolution and strategic analysis of G20 countries. Sustainability 2019, 11, 1629. [Google Scholar] [CrossRef] [Green Version]
- Pao, H.T.; Chen, C.C. Decoupling strategies: CO2 emissions, energy resources, and economic growth in the Group of Twenty. J. Clean. Prod. 2019, 206, 907–919. [Google Scholar] [CrossRef]
- Marmiroli, B.; Messagie, M.; Dotelli, G.; Van Mierlo, J. Electricity generation in LCA of electric vehicles: A review. Appl. Sci. 2018, 8, 1384. [Google Scholar] [CrossRef] [Green Version]
- Lombardi, L.; Tribioli, L.; Cozzolino, R.; Bella, G. Comparative environmental assessment of conventional, electric, hybrid, and fuel cell powertrains based on LCA. Int. J. Life Cycle Assess. 2017, 22, 1989–2006. [Google Scholar] [CrossRef]
- Bekel, K.; Pauliuk, S. Prospective cost and environmental impact assessment of battery and fuel cell electric vehicles in Germany. Int. J. Life Cycle Assess. 2019, 24, 2220–2237. [Google Scholar] [CrossRef]
- Marmiroli, B.; Venditti, M.; Dotelli, G.; Spessa, E. The transport of goods in the urban environment: A comparative life cycle assessment of electric, compressed natural gas and diesel light-duty vehicles. Appl. Energy 2020, 260, 114236. [Google Scholar] [CrossRef]
- Rosenfeld, D.C.; Lindorfer, J.; Fazeni-Fraisl, K. Comparison of advanced fuels—Which technology can win from the life cycle perspective? J. Clean. Prod. 2019, 238, 117879. [Google Scholar] [CrossRef]
- Malandrino, O.; Rapa, M.; Ruggieri, R.; Vinci, G. Is the electric mobility really green? A Life Cycle Thinking approach. In Proceedings of the 2020 IEEE International Conference on Environment and Electrical Engineering and 2020 IEEE Industrial and Commercial Power Systems Europe, EEEIC/I and CPS Europe, Madrid, Spain, 9–12 June 2020. [Google Scholar]
- Meyer, I.; Leimbach, M.; Jaeger, C.C. International passenger transport and climate change: A sector analysis in car demand and associated CO2 emissions from 2000 to 2050. Energy Policy 2007, 35, 6332–6345. [Google Scholar] [CrossRef]
- Streimikiene, D.; Baležentis, T.; Baležentiene, L. Comparative assessment of road transport technologies. Renew. Sustain. Energy Rev. 2013, 20, 611–618. [Google Scholar] [CrossRef]
- Faria, R.; Marques, P.; Moura, P.; Freire, F.; Delgado, J.; De Almeida, A.T. Impact of the electricity mix and use profile in the life-cycle assessment of electric vehicles. Renew. Sustain. Energy Rev. 2013, 24, 271–287. [Google Scholar] [CrossRef]
- Helmers, E.; Marx, P. Electric cars: Technical characteristics and environmental impacts. Environ. Sci. Eur. 2012, 24, 14. [Google Scholar] [CrossRef] [Green Version]
- Simpson, A.G. Full-cycle assessment of alternative fuels for light-duty road vehicles in Australia. In Proceedings of the Seventh Annual Environmental Research Conference, Sydney, Australia, 1–4 December 2003. [Google Scholar]
- Hacker, F.; Harthan, R.; Matthes, F.; Zimmer, W. Environmental impacts and impact on the electricity market of a large scale introduction of electric cars in Europe-Critical Review of Literature. ETC/ACC Tech. Pap. 2009, 4, 56–90. [Google Scholar]
- Majeau-Bettez, G.; Hawkins, T.R.; Strømman, A.H. Life Cycle Environmental Assessment of Lithium-Ion and Nickel Metal Hydride Batteries for Plug-In Hybrid and Battery Electric Vehicles. Environ. Sci. Technol. 2011, 45, 4548–4554. [Google Scholar] [CrossRef]
- Girardi, P.; Brambilla, C.; Mela, G. Life Cycle Air Emissions External Costs Assessment for Comparing Electric and Traditional Passenger Cars. Integr. Environ. Assess. Manag. 2020, 16, 140–150. [Google Scholar] [CrossRef] [Green Version]
- Temporelli, A.; Carvalho, M.L.; Girardi, P. Life Cycle Assessment of Electric Vehicle Batteries: An Overview of Recent Literature. Energies 2020, 13, 2864. [Google Scholar] [CrossRef]
- Cusenza, M.A.; Bobba, S.; Ardente, F.; Cellura, M.; Di Persio, F. Energy and environmental assessment of a traction lithium-ion battery pack for plug-in hybrid electric vehicles. J. Clean. Prod. 2019, 215, 634–649. [Google Scholar] [CrossRef]
- Peters, J.F.; Baumann, M.; Zimmermann, B.; Braun, J.; Weil, M. The environmental impact of Li-Ion batteries and the role of key parameters—A review. Renew. Sustain. Energy Rev. 2017, 67, 491–506. [Google Scholar] [CrossRef]
- Xu, L.; Yilmaz, H.Ü.; Wang, Z.; Poganietz, W.-R.; Jochem, P. Greenhouse gas emissions of electric vehicles in Europe considering different charging strategies. Transp. Res. Part D Transp. Environ. 2020, 87, 102534. [Google Scholar] [CrossRef]
- Kanz, O.; Reinders, A.; May, J.; Ding, K. Environmental Impacts of Integrated Photovoltaic Modules in Light Utility Electric Vehicles. Energies 2020, 13, 5120. [Google Scholar] [CrossRef]
- DeSantes, J.; Molina, S.; Küpper, K.; Lopez-Juarez, M. Comparative global warming impact and NOX emissions of conventional and hydrogen automotive propulsion systems. Energy Convers. Manag. 2020, 221, 113137. [Google Scholar] [CrossRef]
- Valente, A.; Iribarren, D.; Candelaresi, D.; Spazzafumo, G.; Dufour, J. Using harmonised life-cycle indicators to explore the role of hydrogen in the environmental performance of fuel cell electric vehicles. Int. J. Hydrog. Energy 2020, 45, 25758–25765. [Google Scholar] [CrossRef]
- Petit-Boix, A.; Llorach-Massana, P.; Sanjuan-Delmás, D.; Sierra-Pérez, J.; Vinyes, E.; Gabarrell, X.; Rieradevall, J.; Sanyé-Mengual, E. Application of life cycle thinking towards sustainable cities: A review. J. Clean. Prod. 2017, 166, 939–951. [Google Scholar] [CrossRef] [Green Version]
- Tintelecan, A.; Constantinescu-Dobra, A.; Martis, C. LCA Indicators in Electric Vehicles Environmental Impact Assessment. In Proceedings of the 2019 Electric Vehicles International Conference, Bucharest, Romania, 3–4 October 2019. [Google Scholar]
- Carradori, S.; D’Ascenzo, F.; Esposito, A.; Musarra, M.; Rapa, M.; Rocchi, A. A sustainable innovation in the Italian glass production: LCA and Eco-Care matrix evaluation. J. Clean. Prod. 2019, 223, 587–595. [Google Scholar] [CrossRef]
- EC-JRC-Institute for Environment and Sustainability. Characterisation Factors of the ILCD Recommended Life Cycle Impact Assessment methods, Database and Supporting Information, 1st ed.; Publications Office of the European Union: Luxembourg, 2012; ISBN 9789279227271. [Google Scholar]
- Guinee, J.B. Handbook on life cycle assessment operational guide to the ISO standards. Int. J. Life Cycle Assess. 2002, 7, 311–313. [Google Scholar] [CrossRef]
- Sleeswijk, A.W.; Van Oers, L.F.; Guinée, J.B.; Struijs, J.; Huijbregts, M.A. Normalisation in product life cycle assessment: An LCA of the global and European economic systems in the year 2000. Sci. Total. Environ. 2008, 390, 227–240. [Google Scholar] [CrossRef]
- Jolliet, O.; Margni, M.; Charles, R.; Humbert, S.; Payet, J.; Rebitzer, G.; Rosenbaum, R. IMPACT 2002+: A new life cycle impact assessment methodology. Int. J. Life Cycle Assess. 2003, 8, 324–330. [Google Scholar] [CrossRef] [Green Version]
- Rapa, M.; Vinci, G.; Gobbi, L. Life Cycle Assessment of Photovoltaic Implementation: An Italian Case Study. Int. J. Civ. Eng. Technol. 2019, 10, 1657–1663. [Google Scholar]
- Vinci, G.; Esposito, A.; Rapa, M.; Rocchi, A.; Ruggieri, R. Sustainability of Technological Innovation Investments: Photovoltaic Panels Case Study. Int. J. Civ. Eng. Technol. 2019, 10, 2301–2307. [Google Scholar]
- Dealy, J.M. Handbook of industrial energy analysis, I. Boustead and G. F. Hancock, John Wiley & Sons, New York, 1979, 422 pages. $69.50. AIChE J. 1980, 26, 174. [Google Scholar] [CrossRef]
- Pimentel, D.; Hurd, L.E.; Bellotti, A.C.; Forster, M.J.; Oka, I.N.; Sholes, O.D.; Whitman, R.J. Food production and the energy crisis. Science 1973, 182, 443–449. [Google Scholar] [CrossRef] [PubMed]
- Frischknecht, R.; Wyss, F.; Knöpfel, S.B.; Lützkendorf, T.; Balouktsi, M. Cumulative energy demand in LCA: The energy harvested approach. Int. J. Life Cycle Assess. 2015, 20, 957–969. [Google Scholar] [CrossRef]
- Campiglia, E.; Gobbi, L.; Marucci, A.; Rapa, M.; Ruggieri, R.; Carradori, S. Hemp Seed Production: Environmental Impacts of Cannabis Sativa L. Agronomic Practices by Life Cycle Assessment (LCA) and Carbon Footprint Methodologies. Sustainability 2020, 12, 6570. [Google Scholar] [CrossRef]
- Vinci, G.; Rapa, M. Hydroponic cultivation: Life cycle assessment of substrate choice. Br. Food J. 2019, 121, 1801–1812. [Google Scholar] [CrossRef]
- Langdon, D. Towards a Common European Methodology for Life Cycle Costing (LCC)—Literature Review; Davis Langdon Management Consulting: London, UK, 2007; pp. 43–49. [Google Scholar]
- Korpi, E.; Ala-Risku, T. Life cycle costing: A review of published case studies. Manag. Audit. J. 2008, 23, 240–261. [Google Scholar] [CrossRef] [Green Version]
- Vinci, G.; Ruggeri, M.; Rapa, M.; Ruggieri, R. Smart cities in Italy: An intelligent contribution to sustainable development. Int. J. Innov. Technol. Explor. Eng. 2019, 8, 105–110. [Google Scholar]
- Woodward, D.G. Life cycle costing—Theory, information acquisition and application. Int. J. Proj. Manag. 1997, 15, 335–344. [Google Scholar] [CrossRef]
- Mahmud, M.; Huda, N.; Farjana, S.H.; Lang, C. Techno-Economic Operation and Environmental Life-Cycle Assessment of a Solar PV-Driven Islanded Microgrid. IEEE Access 2019, 7, 111828–111839. [Google Scholar] [CrossRef]
- Huijbregts, M.A.J.; Steinmann, Z.J.N.; Elshout, P.M.F.; Stam, G.; Verones, F.; Vieira, M.; Zijp, M.; Hollander, A.; Van Zelm, R. ReCiPe2016: A harmonised life cycle impact assessment method at midpoint and endpoint level. Int. J. Life Cycle Assess. 2017, 22, 138–147. [Google Scholar] [CrossRef]
- Wolf, M.-A.; Düpmeier, C.; Kusche, O. The International Reference Life Cycle Data System (ILCD) Format-Basic Concepts and Implementation of Life Cycle Impact Assessment (LCIA) Method Data Sets. In Proceedings of the EnviroInfo, Ispra, Italy, 5–7 September 2011; pp. 809–817. [Google Scholar]
- Mehta, Y.D.; Shastri, Y.; Joseph, B. Economic analysis and life cycle impact assessment of municipal solid waste (MSW) disposal: A case study of Mumbai, India. Waste Manag. Res. 2018, 36, 1177–1189. [Google Scholar] [CrossRef] [PubMed]
- Heede, P.V.D.; Mignon, A.; Habert, G.; De Belie, N. Cradle-to-gate life cycle assessment of self-healing engineered cementitious composite with in-house developed (semi-)synthetic superabsorbent polymers. Cem. Concr. Compos. 2018, 94, 166–180. [Google Scholar] [CrossRef]
- Universiteit Leiden CML-IA Characterisation Factors. Available online: https://www.universiteitleiden.nl/en/research/research-output/science/cml-ia-characterisation-factors (accessed on 25 October 2020).
- De Moraes, P.J.U.; Allison, J.; Robinson, J.A.; Baldo, G.L.; Boeri, F.; Borla, P. life Cycle Assessment (LCA) and Environmental Product Declaration (EPD) of an Immunological Product for Boar Taint Control in Male Pigs. J. Environ. Assess. Policy Manag. 2013, 15, 1350001. [Google Scholar] [CrossRef]
- Hardy, J.; Owens, V. Life Cycle Analysis and Environmental Product Declarations: North American Market Analysis; Light House Sustainable Building Centre Society: Vancouver, BC, Canada, 2013. [Google Scholar]
- Del Borghi, A.; Gallo, M.; Strazza, C. An evaluation of environmental sustainability in the food industry through Life Cycle Assessment: The case study of tomato products supply chain. J. Clean. Prod. 2014, 78, 121–130. [Google Scholar] [CrossRef]
- Huijbregts, M.; Steinmann, Z.J.N.; Elshout, P.M.F.M.; Stam, G.; Verones, F.; Vieira, M.D.M.; Zijp, M.; van Zelm, R. ReCiPe 2016; National Institute for Public Health and the Environment: Catharijnesingel, The Netherlands, 2016. [Google Scholar]
- Mehmeti, A.; Angelis-Dimakis, A.; Arampatzis, G.; McPhail, S.J.; Ulgiati, S. Life Cycle Assessment and Water Footprint of Hydrogen Production Methods: From Conventional to Emerging Technologies. Environments 2018, 5, 24. [Google Scholar] [CrossRef] [Green Version]
- Huijbregts, M.A.J.; Hellweg, S.; Frischknecht, R.; Hendriks, H.W.M.; Hungerbühler, K.; Hendriks, A.J. Cumulative Energy Demand as Predictor for the Environmental Burden of Commodity Production. Environ. Sci. Technol. 2010, 44, 2189–2196. [Google Scholar] [CrossRef] [Green Version]
- Patel, M. Cumulative energy demand (CED) and cumulative CO2 emissions for products of the organic chemical industry. Energy 2003, 28, 721–740. [Google Scholar] [CrossRef]
- Pandey, D.; Agrawal, M.; Pandey, J.S. Carbon footprint: Current methods of estimation. Environ. Monit. Assess. 2011, 178, 135–160. [Google Scholar] [CrossRef]
- Caro, D. Carbon footprint. In Encyclopedia of Ecology; Elsevier: Amsterdam, The Netherlands, 2018; ISBN 9780444641304. [Google Scholar]
- Wiedmann, T.; Minx, J. A Definition of ‘Carbon Footprint. Ecol. Econ. Res. Trends 2008, 1, 1–11. [Google Scholar]
- Attari, S.Z.; Krantz, D.H.; Weber, E.U. Climate change communicators’ carbon footprints affect their audience’s policy support. Clim. Chang. 2019, 154, 529–545. [Google Scholar] [CrossRef]
- Misra, A.; Panchabikesan, K.; Gowrishankar, S.K.; Ayyasamy, E.; Velraj, R. GHG emission accounting and mitigation strategies to reduce the carbon footprint in conventional port activities—A case of the Port of Chennai. Carbon Manag. 2017, 8, 45–56. [Google Scholar] [CrossRef]
- Pitcher, G.S. Management Accounting in Support of Strategy; Business Expert Press: New York, NY, USA, 2018; ISBN 9781947843813. [Google Scholar]
- Gransberg, D.D. Life Cycle Costing for Engineers. Constr. Manag. Econ. 2010, 28, 1113–1114. [Google Scholar] [CrossRef]
- Hunkeler, D.; Lichtenvort, K.; Rebitzer, G. Environmental Life Cycle Costing; Crc press: Boca Raton, FL, USA, 2008; ISBN 9781420054736. [Google Scholar]
Figure 1.
System boundaries for the Life Cycle Thinking approach.

Figure 2.
Carbon footprint results for human health, calculated according to the IPPC guideline.

Figure 3.
Costs analysis of electricity sources examined (* data not found).

Figure 4.
Comparison of global warming category by midpoint methods, expressed as a relative percentage.
Figure 4.
Comparison of global warming category by midpoint methods, expressed as a relative percentage.

Figure 5.
Comparison of the particulate matter category using midpoint methods, expressed as a relative percentage.
Figure 5.
Comparison of the particulate matter category using midpoint methods, expressed as a relative percentage.

Figure 6.
Comparison of acidification category using midpoint methods, expressed as a relative percentage.
Figure 6.
Comparison of acidification category using midpoint methods, expressed as a relative percentage.

Figure 7.
ReCiPe 2016 endpoint results for human health, ecosystems, and resource scarcity, expressed as a relative percentage.
Figure 7.
ReCiPe 2016 endpoint results for human health, ecosystems, and resource scarcity, expressed as a relative percentage.


Table 1.
Cumulative energy demand results for different electricity sources.
| CED Sub-Categories (MJ) | Biomass | Coal | Diesel | Hydropower | Lignite | Municipal Waste | Natural Gas | Peat | Photovoltaic | Wind |
|---|---|---|---|---|---|---|---|---|---|---|
| Non-renewable, fossil | 0.034 | 10.646 | 15.478 | 0.027 | 17.695 | 0.0594 | 12.639 | 11.378 | 0.887 | 0.113 |
| Non-renewable, nuclear | - | 5.280 × 10⁻² | - | 2.508 × 10⁻³ | 5.074 × 10⁻² | 3.766 × 10⁻³ | - | 4.805 × 10⁻² | 1.273 × 10⁻¹ | 1.331 × 10⁻² |
| Non-renewable, biomass | - | 6.346 × 10⁻⁵ | - | - | 2.424 × 10⁻⁵ | 3.024 × 10⁻⁵ | - | 1.816 × 10⁻⁵ | 1.818 × 10⁻⁴ | - |
| Renewable, biomass | - | 9.336 × 10⁻² | - | - | 8.586 × 10⁻³ | 8.493 × 10⁻¹ | - | 6.937 × 10⁻³ | 3.030 × 10⁻² | - |
| Renewable, wind, solar, geothermal | - | 5.380 × 10⁻³ | - | 2.497 × 10⁻⁶ | 5.139 × 10⁻³ | 1.271 | - | 4.376 × 10⁻³ | 3.860 | −1.253 × 10⁻³ |
| Renewable, water | - | 2.565 × 10⁻² | - | 4.236 | 3.062 × 10⁻² | 7.345 × 10⁻¹ | - | 2.097 × 10⁻² | 1.304 × 10⁻¹ | 4.204 × 10⁻³ |
| Total | 0.034 | 10.823 | 15.479 | 4.267 | 17.791 | 6.918 | 12.639 | 11.457 | 5.035 | 0.130 |
Publisher’s Note: MDPI stays neutral with regard to jurisdictional claims in published maps and institutional affiliations. |
© 2020 by the authors. Licensee MDPI, Basel, Switzerland. This article is an open access article distributed under the terms and conditions of the Creative Commons Attribution (CC BY) license (http://creativecommons.org/licenses/by/4.0/).
Share and Cite
MDPI and ACS Style
Rapa, M.; Gobbi, L.; Ruggieri, R. Environmental and Economic Sustainability of Electric Vehicles: Life Cycle Assessment and Life Cycle Costing Evaluation of Electricity Sources. Energies 2020, 13, 6292. https://doi.org/10.3390/en13236292
AMA Style
Rapa M, Gobbi L, Ruggieri R. Environmental and Economic Sustainability of Electric Vehicles: Life Cycle Assessment and Life Cycle Costing Evaluation of Electricity Sources. Energies. 2020; 13(23):6292. https://doi.org/10.3390/en13236292
Chicago/Turabian StyleRapa, Mattia, Laura Gobbi, and Roberto Ruggieri. 2020. "Environmental and Economic Sustainability of Electric Vehicles: Life Cycle Assessment and Life Cycle Costing Evaluation of Electricity Sources" Energies 13, no. 23: 6292. https://doi.org/10.3390/en13236292
Note that from the first issue of 2016, this journal uses article numbers instead of page numbers. See further details here.