Article

Methodology and Software Tool for Energy Consumption Evaluation and Optimization in Multilayer Transport Optical Networks

1
Department of Automation, Lublin University of Technology, Nadbystrzycka 36, 20-618 Lublin, Poland
2
Department of Telecommunications, Lviv Polytechnic National University, 79013 Lviv, Ukraine
3
School of Computer Science, Hubei University of Technology, Wuhan 430068, China
4
Department of Mechanics and Machine Building, University of Economics and Innovations in Lublin, Projektowa 4, 20-209 Lublin, Poland
*
Author to whom correspondence should be addressed.
Energies 2020, 13(23), 6370; https://doi.org/10.3390/en13236370
Submission received: 22 October 2020 / Revised: 28 November 2020 / Accepted: 30 November 2020 / Published: 2 December 2020
(This article belongs to the Special Issue Electromagnetic Energy in Modern Engineering and Medical Technologies)

Abstract

:
In communication networks, the volume of traffic, the number of connected devices and users continues to grow. As a result, the energy consumption generated by the communication infrastructure has become an important parameter that needs to be carefully considered and optimized both when designing the network and when operating it in real-time. In this paper, the methodology of calculation of complex parameters of energy consumption for transport telecommunication networks is proposed. Unlike the known techniques, the proposed methodology takes into account heterogeneity and multilayer networks. It also takes into account the energy consumption parameter during the downtime of the network equipment in the process of processing the service data blocks, which is quite an important task for improving the accuracy of energy consumption at the stage of implementing the energy-saving network. We also developed simulation software to estimate and manage the energy consumption of the optical transport network using the LabVIEW environment. This software tool allows telecommunication network designers to evaluate energy consumption, which allows them to choose the optimal solution for the desired projects. The use of electro-and acousto-optical devices for optical transport networks is analyzed. We recommended using electro-optical devices for optical modulators and acousto-optical devices for optical switches. The gain from using this combination of optical devices and the parameter of rij electro-optical coefficient and M2 acousto-optical quality parameter found in the paper is about 36.1% relative to the complex criterion of energy consumption.

1. Introduction

The issue of energy efficiency and energy saving is becoming more and more topical in the modern world [1]. These two concepts are united by a common goal-energy conservation and its correct use. Energy efficiency is the use of certain technologies, which make it possible to reduce the amount of energy consumed, without changing the rules of its use by the consumer [2,3]. Energy-saving, in its turn, is a series of measurements aimed at saving energy and its rational use.
Up to the present time, telecommunications equipment consumes approximately 5% of electricity from total electricity output [4,5]. Scaling up the network infrastructure to maintain a constant demand for telecommunications services is not in itself a simple task, but its solution, while trying to minimize the environmental impact and reduce the amount of electricity consumed by these telecommunications networks by an order of magnitude increases the complexity of the rapidly developing telecommunications industry [6]. Sequentially, demand for information services continues to increase, leading to an increase in this indicator.
There are a number of reasons for the decline in telecom energy consumption [7]. Due to the growing number of subscribers and the demand for telecommunication services, the bandwidth requirements for networks are increasing [8,9]. However, the proper energy consumption of networks is a more important problem than the required bandwidth, since energy consumption alone limits its growth. In addition, high-speed transport optical networks require reliable data processing devices at both the edge and the border nodes [10]. With increased data rates, the energy consumption of the network nodes increases significantly due to the higher load of their processors [11]. These problems can be one of the major operational obstacles and, in the worst-case scenario, may prevent the delivery of new services and applications [12,13,14].
To provide the required quality of service, higher demands are placed on the switching elements of the network, thereby causing an increase in the control voltages of these devices, which leads to the increased energy consumption of these networks [15]. In addition, an increase in these voltages leads to a shortening of the reliable life of the devices. It is forcing the search and development of new methods, criteria, elements and devices of the network to provide its required operating parameters, with low capital and operating costs for the operator and high quality of service (QoS) for subscribers [16,17,18]. Network equipment designers pay great attention to the energy efficiency of systems, as this factor has a significant impact on the cost of their operation and often determines the choice of specific equipment [19].
The simulation tools can significantly reduce the effort and time required to select the right solution. The existing simulators provide varying degrees of analysis for the communication, application and energy fields [20]. However, they do not provide enough flexibility to estimate energy consumption for a wide range of network hardware platforms. None of them presents how the energy consumption of the network as a whole should be determined, and the energy consumption values are approximate and do not take into account equipment of different vendors and the power that is consumed during the downtime of the equipment, in the processing of service data blocks.
Thus, the urgent task is to develop a universal methodology of determining the energy consumption parameter automated in the form of a software product, which will allow obtaining this parameter for any architecture of the information communication network, the configuration of network devices and for equipment from different vendors.
This paper is organized as follows. In Section 2, previous related studies about different strategies to tackle the problem of energy consumption evaluation and optimization in telecommunication networks are discussed. Then, Section 3 introduces the proposed methodology for calculating the energy consumption of a multilayer telecommunications network. Section 4 describes the development of a simulation tool for studying energy consumption in multilayer communication networks. The simulation strategies and the obtained results are presented and analyzed in Section 5. Section 6 introduces the discussion. Finally, Section 7 concludes this work.
To facilitate understanding following formulations, Table 1 clarifies all mathematical notations throughout this paper.

2. Related Work

Optical transmission technologies make it possible to significantly reduce the overall energy consumption of communication networks [21]. For this reason, there is growing interest in how to take advantage of the energy-saving opportunities offered by optical networks. In addition, parallel research is being conducted to improve the energy efficiency of optical networks themselves.
In [22] authors present a brief overview of the general model of the energy consumption of telecommunications networks, built on the principle of “bottom-up”. The purpose of this paper is to provide an intuitive introduction to telecommunications networks and to model the energy consumption of services without having to rely on detailed information about network equipment, which is usually very difficult to obtain. The model presented in this paper is therefore based on typical equipment data (available from vendor equipment data) and simple network architecture parameters (such as the number of jumps). The model presented in this paper is tested to provide energy consumption estimates for a wide range of network scenarios, among others: customer premises equipment, access networks, edge and core networks, and services provided via the network.
A new method for evaluating network energy consumption on a national scale is presented in [23]. In the proposed method, energy overheads are quantified and introduced as overhead costs by comparing the energy consumption estimated from network configuration models (bottom-up methods) with reports on actual energy consumption (top-down methods). The proposed “unified” method is able to provide long-term forecasts of future technological trends, including changes in network architecture.
In work [24] the authors presented a network model of the energy consumption in optical IP networks and used this model to estimate the energy consumption of the Internet. The model includes the core, metro and edge networks, access and video distribution networks, and takes into account the energy consumption in switching and transmitting equipment.
Ward Van Heddeghem and Filip Idzikowski [25] proposed a simplified analytical model for estimating energy consumption in multilayer telecommunications networks, which can be used for large networks where modeling is expensive or computationally impossible.
Today, there are techniques that can be used to determine and evaluate the energy consumption parameter. For example, the Telecommunication Energy Consumption Center at the University of Melbourne identifies four approaches for improving network energy consumption [26]: architectural, technological, protocol, and cloud. This paper also presents the approximate cost of electricity for devices for both electrical and optical domains when processing one bit of information (the approximate values of which are presented in the section “Investigating the bottlenecks of transport optical networks” that affect energy consumption). However, this model does not show how the power consumption of the network as a whole should be determined, and the given power consumption values are approximate and do not take into account equipment from different manufacturers. Thus, the proposed model by the University of Melbourne envisages a number of approaches for reducing the power consumption of transport optical networks, using approximately found energy values of devices in this network.
Another model was developed by the Milan Polytechnic [27]. This model is based on the multilevel structure of transport optical networks. It considers methods for determining the energy consumption of the boundary and intermediate nodes. Additionally, this model takes into account different types of equipment transfer from different manufacturers and data transfer rates. However, this model does not take into account the power consumed during downtime in the processing of service data blocks, which is important enough to improve the accuracy of energy consumption determination. Hence, it is an important scientific and practical task to develop the most accurate universal methodology for calculating the energy consumption of information and communication networks in order to optimally select the necessary network equipment for the construction of energy-efficient telecommunication systems.
The research work [28] is aimed at reducing the power consumption of IP over the WDM backbone network. Already known strategies of light path bypass and traffic cleaning are used. While the previously proposed schemes based on approaches to bypassing light routes and traffic cleaning capabilities have been implemented and, therefore, can reduce the overall power consumption of the optical backbone network, they do not take into account, firstly, the number of installed light traces in the virtual topology and, secondly, the use of residual bandwidth of existing light traces. The present study overcomes the above disadvantages by introducing three new heuristic schemes that allow to significantly reduce the number of established light paths in the virtual topology and use the residual capacity of optical paths through more efficient use of light path resources. These heuristic schemes will focus on energy efficiency issues related to the design and operation of the length division multiplexing (WDM) optical network.
In article [29] the authors pay special attention to the sleep mode of the guard dog with different periods of sleep change for several optical network devices (ONU). This is due to the fact that in the traditional ONU mode, optical line terminal (OLT) traffic must be constantly monitored and checked, and therefore always remain active even in the absence/light traffic, which leads to a loss of most of the power Passive optical network (PON). The authors first simulated a sleep mode based on the Markov chain model to analyze the impact of each key parameter on system performance in terms of energy efficiency and packet latency. Since sleep mode is the key to saving energy, we developed four different variants of sleep period variations (e.g., constant, linear_1, linear_2, and exponential models) to study the effect of these different models on integrated performance in terms of normalized costs. Using extensive simulations, the author found that in a guard dog’s sleep mode the effect of the number (n) of state pairs (sleep, listening) would be negligible and the effect of other parameters on performance would be analyzed in a comprehensive manner. The minimal normalized cost can be calculated from four different variations of the sleep period, which represent the optimal compromise between the two conflicting performance parameters listed above.
In work [30], the authors claim that spatial analysis of the indicative surfaces thus yields a set of the optimized sample geometries recommended for designers who develop electro-optic modulators or deflectors. Just by switching from the standard cell geometry to the optimized cell geometry, as determined in the present work, one may improve almost three times the modulation efficiency of electro-optic devices based on lithium niobate crystals. This results in a corresponding reduction of their driving voltages being evidently of great practical importance for many applications. We based our work on this work, because it was our author Kaidan M. V. who found the necessary value of control voltage, which significantly reduces the energy consumption of a network device with electro-optical modulator.
Therefore, the purpose of the work is to develop a universal methodology for calculating energy consumption in infocommunication systems, taking into account their heterogeneity and multilayer, as well as the power parameter that is consumed when network equipment is idle during the processing of service data blocks and finding the necessary value of control voltage, which significantly reduces the energy consumption of a network device with electro-optical modulator.
Generalizations of the main works listed above are shown in Table 2.

3. Methodology for Calculating the Energy Consumption of Multilayer Telecommunications Network

One of the key parameters in the field of telecommunications energy is the energy consumption parameter [31]. This parameter refers to the amount of electricity consumed in transmitting one bit of information between two nodes [32,33,34]. Determining this parameter is an important task not only for reducing the required amount of energy for telecommunication networks, but also for the network as a whole.
Based on the analysis of works [35] for calculation the complex parameter of energy consumption, the authors determined the main criteria that affect the energy consumption of information and communication systems: namely, the number and structure of nodes involved, type of transport technology, network architecture, size of the data block channel level, type of equipment used, number of intermediate optoelectronic transformations, type of switching, use of wave converters, number and type of regeneration points, number of WDM systems. On the basis of these criteria, a complex parameter of energy consumption of Formula (1) for homogeneous networks and Formula (2) for heterogeneous multilayer network was formed. Depending on the type of information network under study, each criterion included in Formulas (1) and (2) will be calculated using certain mathematical expressions. The sequence of mathematical actions aimed at solving the problems of studying the energy consumption of the information and communication network form a universal method of calculating energy consumption.
In the process of building a homogeneous network, the complex parameter of energy consumption is determined by:
P p . c . = M × ( 2 × P E d g e + N × P O + K × P E + P R O E + P d _ t i m e ) + P t r a n s p
where Pp.c.—general energy consumption of the network in the transmission of information data, PEdge—power consumption of the edge node, PO i PE—energy consumption of intermediate nodes without and with intermediate optoelectronic conversion, respectively, N and K—number of nodes without and intermediate optoelectronic conversion, M—number of data blocks, Ptransp—power consumption for open through channels, PROE—power consumption for regeneration equipment, Pd_time—power consumed in equipment idle time, hereinafter unit the power consumption parameter is presented in Watts (W).
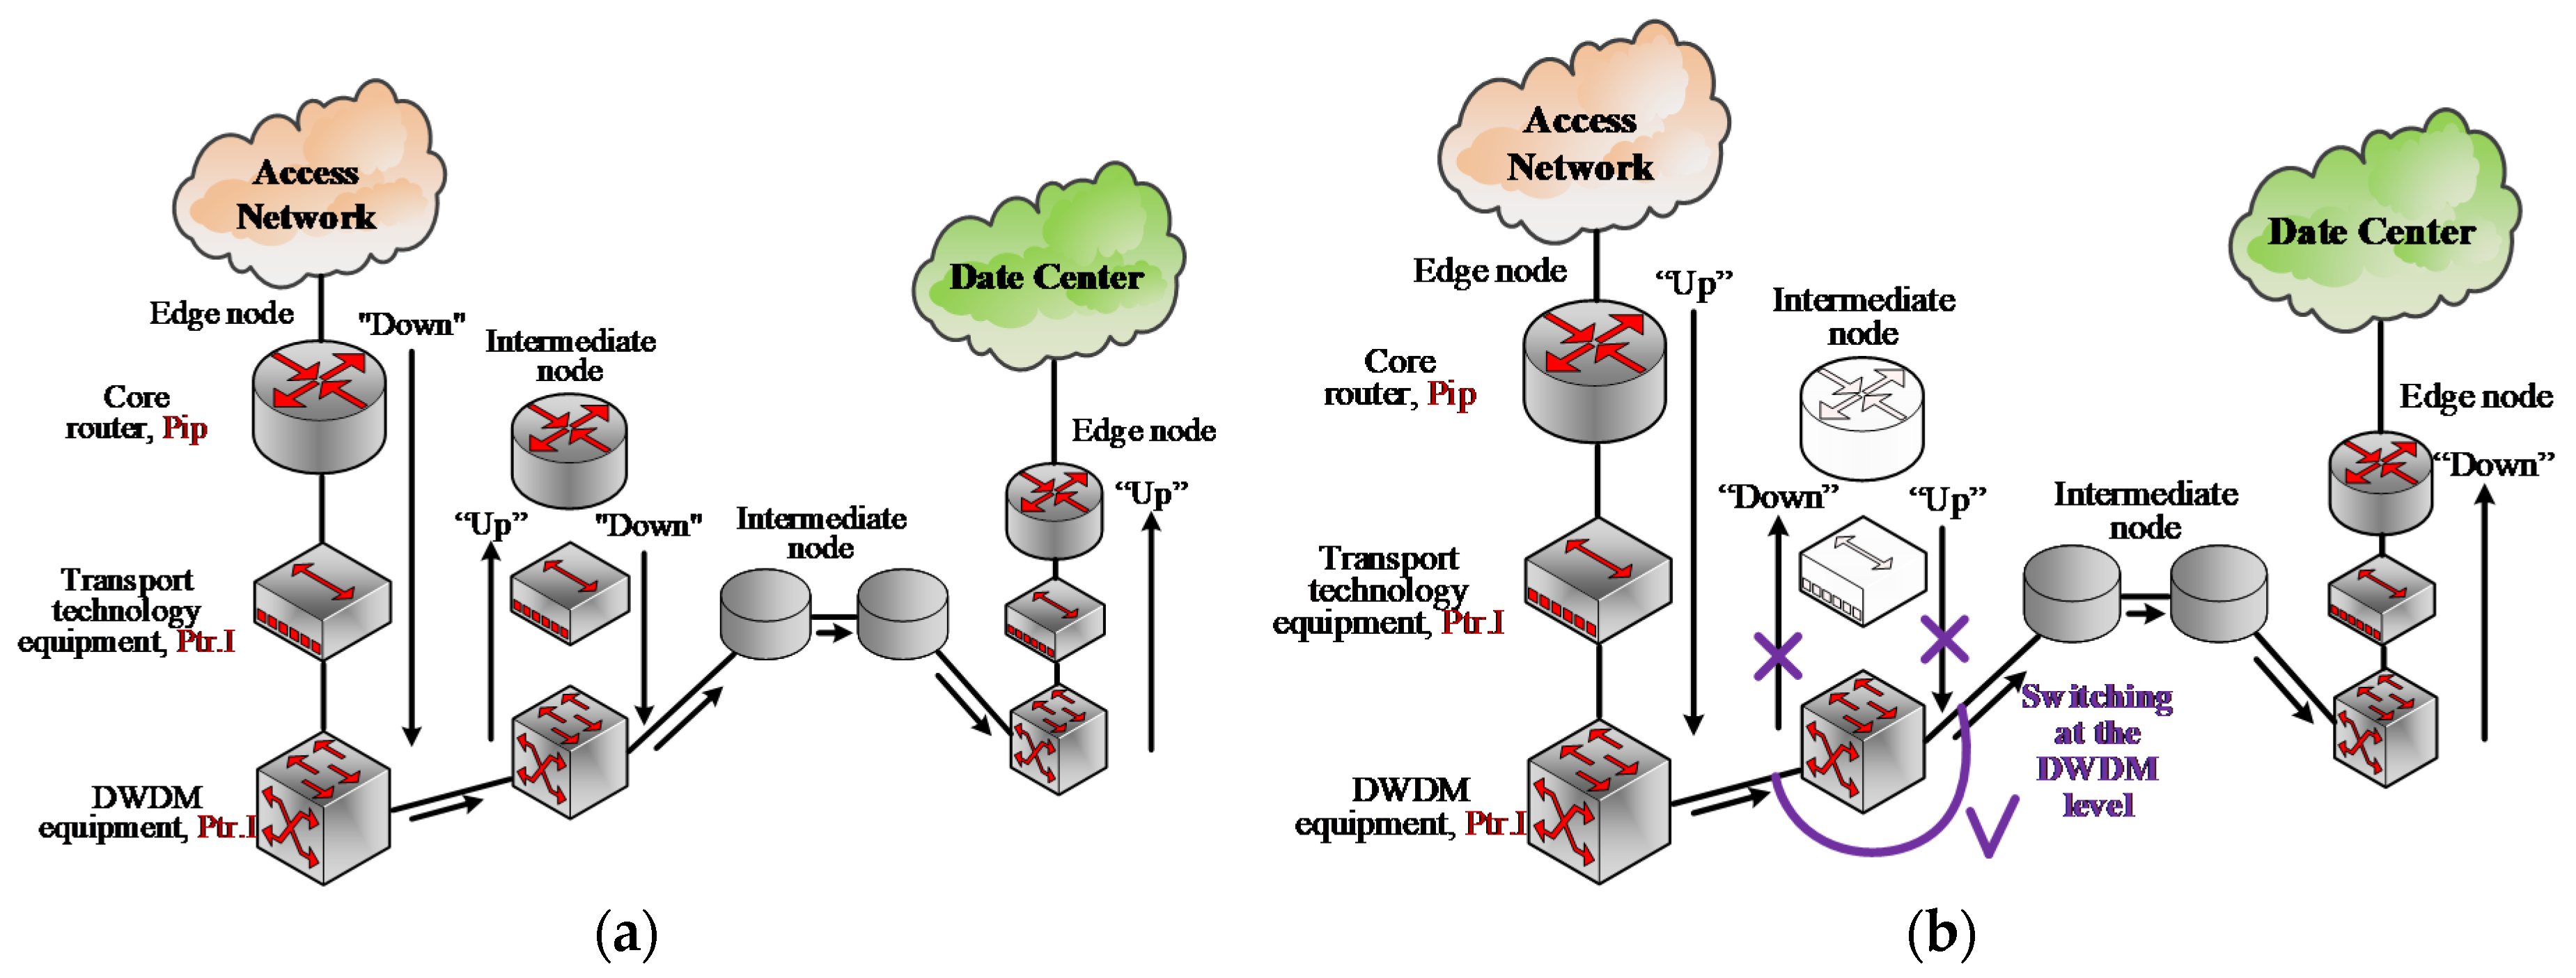
Modern information communication networks have the property of heterogeneity and multilayer. The multilayer structure of the transport infocommunication network with intermediate optoelectronic transformation and without intermediate optoelectronic conversion is depicted in Figure 1.
The complex energy parameter for these systems can be defined as the total electricity consumption of each of the levels, which is an alternative to Formula (1)
P e . c . = P I P + P t r . l + P D W D M
where P I P is the total electricity consumption of the network layer devices of the OSI (Open Systems Interconnection) model, P t r . l —the electricity consumption of the data link layer of the OSI model, P D W D M —the total electricity consumption of the Dense Wavelength Division Multiplexing (DWDM) equipment at the physical layer of the OSI model from end to end of the network.
The value of the power consumption parameter (W/bit) is relatively small, so it should be determined which data block will be used to determine this parameter. In order to improve accuracy, the energy efficiency parameters are determined by taking into account the signal load of the channel and network level, so the calculation of this parameter is relative to the data block of the channel level. It also takes into account the energy consumption parameter during the downtime of the network equipment in the process of processing the signal data blocks, which is quite an important task for improving the accuracy of energy consumption at the stage of implementing the energy-saving network. We suggest calculating for the link-level data block, since the calculation for the Internet Protocol (IP) packet will not allow taking into account the second level signaling information, which will affect the calculation of the power consumption parameter. As a result, the formula should be used to determine this parameter.
P b i t = P p . c . L b l o c k = M × ( 2 × P E d g e + N × P 0 + K × P E + P R O E + P d _ t i m e ) + P t r a n s p L b l o c k
where Lblock—the length of the link-layer data block (the number of block bits).
To determine the energy consumption of the devices shown in Formula (3), the technique proposes to separate the energy consumption of the devices of the electric and optical domains. Domain allocation is based on the type of signal the device is working with. For example, if the device works with an optical signal then it refers to the optical domain, if the electrical signal then to the electrical domain. Accordingly, for the electric domain of the network, the electricity costs for processing one data block will be:
P e q u p . e l = P max N b
where Pmax is the power consumption of the network device at its maximum load (W/s), Nb is the number of data blocks that the device can process (per 1 s).
For network devices (router), the Pmax power consumption parameter is defined as
P m a x ( v ) = P C h a s ( v ) + u = 0 U P r o c P P r o c ( v u ) + i = 0 N L C P L C ( v i ) ,
where v —the type of chassis, controller, installed linear cards, configuration and traffic profile of the device, depending on the data rate in the components of the router. Function PChas(v) determines the energy consumption of the chassis, Uproc—the number of controllers used, Pproc(vu)—the energy consumption of a particular type of controller, NLC—the number of linear cards used, PLC(vi)—determines the energy consumption of all linear cards in the basic configuration (physical interfaces), port adapters, switch factories, and control modules). The amount of PLC(vi) is represented as
i = 0 N L C P L C ( v i ) = j = 0 J P L I M P P L I M ( v j ) + j = 0 J S W P S W ( v j ) + j = 0 J M S C P M S C ( v j ) ,
where PPLIM(vj)—power consumption of interface modules and port adapters PLIM (Physical Layer Interface Module), PSW(vm)—power consumption of switching factories SW (Switch Fabric), PMSC(vk)—power consumption of control modules MSC (Modular Services Card).
Accordingly, the function that determines the power consumption of the network-level device is represented as
P m a x ( v ) = P C h a s ( v ) + u = 0 U P r o c P P r o c ( v u ) + j = 0 J P L I M P P L I M ( v j ) + j = 0 J S W P S W ( v j ) + j = 0 J M S C P M S C ( v j ) ,
Increasing transmission speed requires more productive and high-speed elements. As the transmission speed increases, there is a significant increase in the power consumption of the controller and line cards of the router. For the optical domain, the power required to process a single data block is determined by the formula:
P = P e q u i p . o p × L b l o c k V
where Pequip.op(t) is the power consumption of the device level link per unit time, V is the speed of transmission of the optical signal in the network (in bits per second).
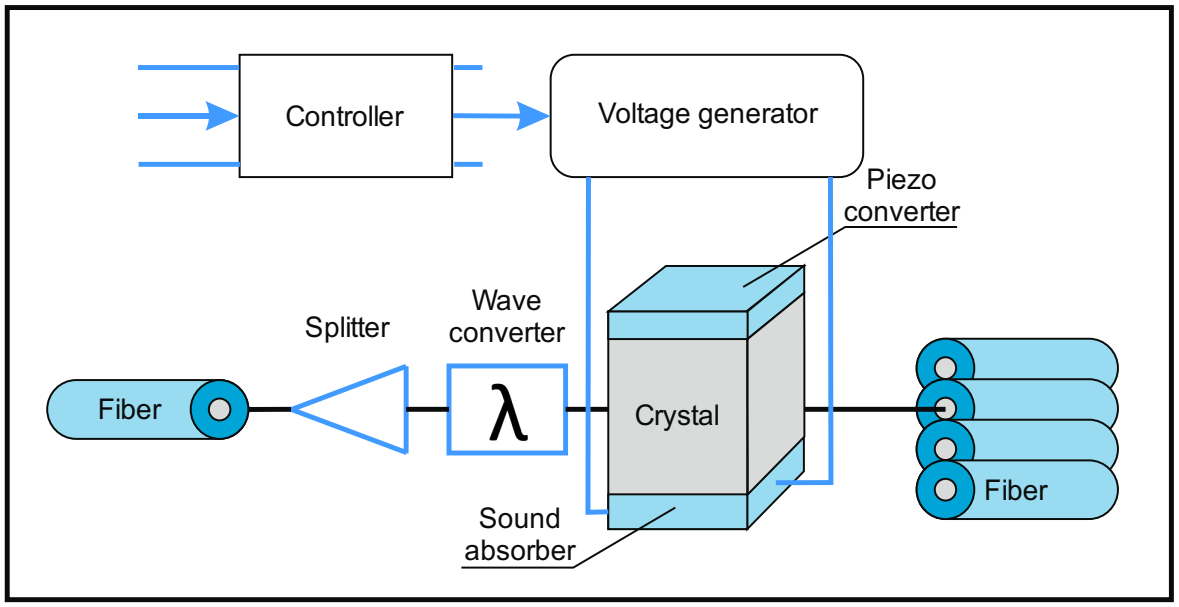
Figure 2 shows the structure of the acousto-optic switch according to which the formula for calculation of energy consumption is given.
The power consumption of the proposed device architecture is determined by the following formula:
P e q u i p . s w i t c h ( v ) = P p r o c ( v ) + P g e n V ( v ) + P w a v e ( v ) + P c o o l ( v ) ,
where Pproc(v) is the controller’s power consumption, PgenV(v) is the power consumption of the voltage generator, Pwave(v) is the energy consumed by the wave conversion, Pcool(v) is the energy consumed by the cooling of the switch and is determined by:
P c o o l ( v ) = k e × ( P p r o c ( v ) + P g e n V ( v ) + P w a v e ( v ) )
In [36] it is noted that when a switch consuming 1 W of electricity, it consumes up to 1 W of electricity for its cooling. We accept the parameter ke within 0.5 ≤ ke 1, which determines the fraction of electricity that falls on cooling from the total power consumption of the switch.
The power consumption of the PgenV(v) generator is determined from the general definition of power—the output of voltage and current
P g e n V ( v ) = I × U m a n a g ( t ) d t ,
where Umanag is the control voltage applied to the switch, the value of the control voltage of the acousto-optic switch changes in the range 0 < Umanag < Uacous. The maximum allowable control voltage of the Uacous generator required to ensure the Bragg mode is determined by the formula
U a c o u s = λ π × f p × d i j × Q m × 2 × η × H n M 2 × L a × 6.4 × b a × l a × Z з в ,
where i—the width and length of the sound column, Z з в —the acoustic resistance of the sound material, f p —the resonant frequency of the piezoelectric transducer, d i j —piezo-module of the material, Q m —the piezoelectric material of the piezoelectric transducer, L a —the length of the acousto-optic interaction, M 2 —the AO coefficient, H n —the width p converter.
In the next stage of the technique, the energy consumption of the boundary and intermediate nodes is determined. At the border nodes, the information processing process is carried out in one direction, respectively, the energy consumption is determined at the input P E d g e i n p u t and output P E d g e o u t p u t nodes according to the formulas
P E d g e i n p u t = P I P + P t r . l + P m o d u l a t o r D W D M ,
P E d g e o u t p u t = P I P + P t r . l + P r e c e i v e r D W D M ,
where P m o d u l a t o r D W D M is the electricity consumption of the electro-optical modulator, P r e c e i v e r D W D M —the energy consumption of the photodetector.
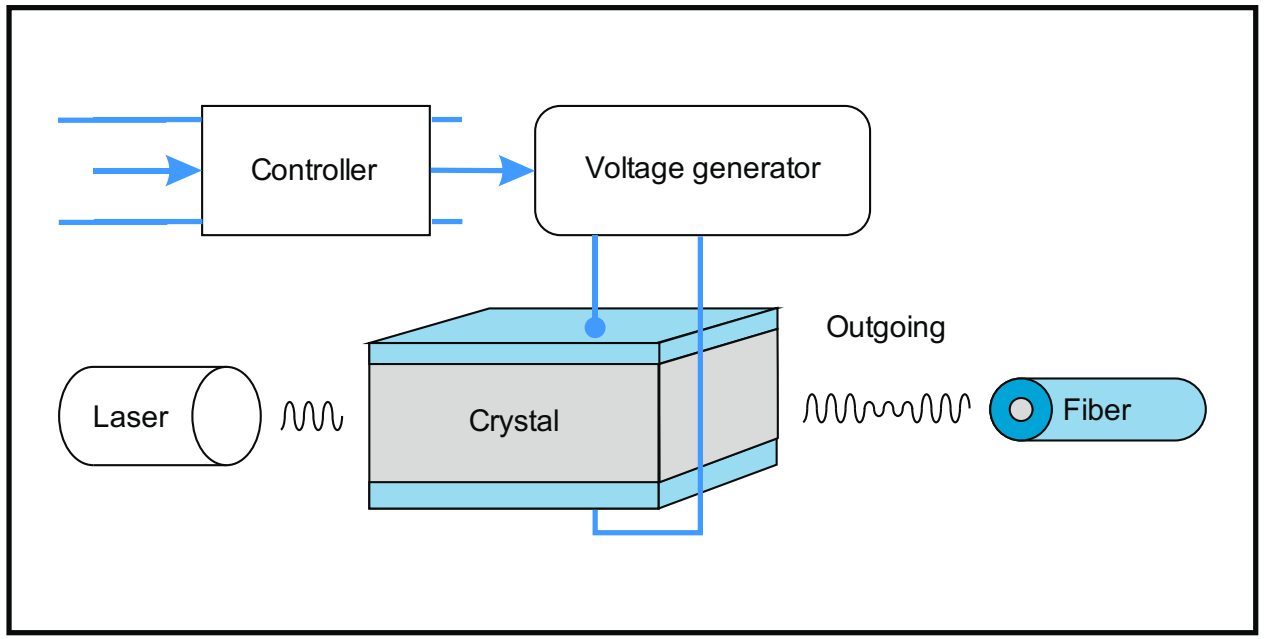
Based on the structure of the electro-optical modulator (Figure 3), the energy consumption of the electro-optical module-torus will be
P m o d u l a t o r D W D M ( v ) = P p r o c ( v ) + P g e n V m ( v ) + P c o o l ( v ) ,
where Pproc(v) is the energy consumption of the controller, which is determined by the energy consumption of the controller, PgenV(v) is the energy consumption of the electrical signal, Pcool(v) is the energy consumed to cool the modulator and is determined
P c o o l ( v ) = k e × ( P p r o c ( v ) + P g e n V m ( v ) )
Substituting formulas, the modulator’s power consumption will be determined
P m o d u l a t o r D W D M ( v ) = ( k e + 1 ) × ( P p r o c ( v ) + P g e n V m ( v ) )
The instantaneous power consumption of the PgenV(v) generator is equal to the product of instantaneous values of voltage and current. The control voltage is the maximum value of the control voltage Umanag(t) for the symmetric structure of the electro-optical modulator. The total energy consumption of the generator for the structure of the electro-optical voltage modulator is determined by the following formula:
P g e n V m ( v ) = I × U m a n a g ( t ) d t ,
where 0 < Umanag < Uλ/2.
For intermediate nodes, the determination of the power consumption parameter depends on the type of switching at the DWDM level and the mode of data transmission. If such a node uses an electrical switching matrix at the DWDM level, then usually it also involves the transmission of all data to the upper level for processing. In this case, the energy consumption of the intermediate node with intermediate opto-electronic conversion is
P E = P I P + 2 × P t r . l . + P r e c e i v e r D W D M + P m o d u l a t o r D W D M
From Formula (19), it follows
P D W D M = i = 1 n + 1 ( P m o d u l a t o r D W D M i + P r e c e i v e r D W D M i ) + P e q u i p .
where n is the number of transit nodes; P e q u i p . —power consumption of amplifiers, isolators, converters and other devices used in the network, excluding the power consumption of modulators and receivers.
The absence of intermediate optoelectronic conversion at such nodes indicates the use of an optical switching matrix at the DWDM level. For example, for fully optical networks, this requires opening through-channels between the originator node and the recipient node. Accordingly, data blocks do not come from the optical domain. Opening such a channel requires redundancy of time and spectral resources of the network. To open it, a certain number of service data blocks (Nsignal.) are sent, for which Ptransp power is consumed, which is taken into account in certain energy consumption parameters (Formula (3)). These blocks reserve the spectral and frequency resources of the network. Accordingly, the energy consumed at the site without optoelectronic conversion will be:
P O = P s w + P e q u i p .
where Psw is the energy consumed by an optical switch, P e q u i p . —is the energy consumed by equipment, including attenuators, filters and other devices besides switches and devices associated with it.
As described above, the energy consumption of fully optical switches is determined by the energy consumption of the optical switching matrix, the use of wave convectors and optical amplifiers. Accordingly, the energy consumption of such devices is determined.
P s w = ( P s + P w c + P O A ) × L b l o c k V
where Ps is the power consumption of the optical switch, Pwc is the power consumption of the optical wave converter as the wavelength changes, POA is the power consumption of the optical amplifier, V is the transmission rate.
Energy consumption of regeneration equipment is based on the use of optical amplifiers as well as 3R regenerators. From here, we determine the electricity consumption per unit of data.
P R O E = L b l o c k V ( Q P O A + T P 3 R )
where Q is the number of optical amplifiers used from point A to point B, T is the number of 3R regenerators used from point A to point B, POA is the power consumption of the optical amplifier per time unit, P3R is the electricity consumption of the electric regenerator.
To determine the total power consumption of the infocommunication network, it is necessary to calculate the control voltage for the electro-optical modulator and acousto-optic switch.
To determine the total power consumption of the infocommunication network, it is necessary to calculate the control voltage for the electro-optical modulator and acousto-optic switch. The control voltage is selected from 0 < Umanag < Uλ/2. For electro-optical materials, the control voltage is determined by the half-wave voltage at which the change in transmittance is achieved [37].
U λ / 2 = λ d 2 n 3 r i j L ,
where λ is wavelength, d is sample thickness, n is refractive index, rij electro-optical coefficient, L crystal length, where 0 < Umanag < Uλ/2.
As can be seen from Formula (25), with a larger value of the electro-optical coefficient, less voltage is required to achieve the required change in the transmittance coefficient. In [29], a study was conducted to find the geometries of the orientations of a sample with experimental values. For the values of the electro-optical coefficients and for the one found, a half-wave voltage parameter was calculated for a lithium niobate crystal. The initial data for the calculation are d = 13.4 mm, L = 18.5 mm.
In [29] for rij = 3.4·10−12 m/V the half-wave voltage parameter Uλ/2 = 5588 V. The electro-optical coefficient rij = 39.7·10−12 m/V at θ = 43 found in [29] allows to obtain a value Uλ/2 = 510.9 V that is 90.8% less than the previous value, which significantly reduces the energy consumption of such a device.
For acousto-optic devices, the parameter that determines the power consumption is, which also determines the transmission ratio [38]
η = π 2 2 λ 2 M 2 L H P a ,
where λ is the wavelength, M2 is the parameter of acousto-optic quality, L is the length of acoustic interaction, H is the height of the ultrasonic piezo converter, Pa is the acoustic power. Accordingly, the parameter is determined by
P a = 6.4 b a l a Z з в f p 2 d i j 2 Q m 2 U 2 ,
where b·i·l—the width and length of the sound column, Zзв—the acoustic resistance of the material of the conductor, fp—the resonant frequency of the piezoelectric transducer, dij—the piezo-module of the piezoelectric material, Qm — the mechanical quality of the piezoelectric transducer, U—the control voltage.
From Formulas (26) and (27) it is easy to see that with a larger value of the acousto-optical quality parameter M2, less acoustic power and, correspondingly, less control voltage are required to achieve the required level of transmission coefficient of the device. Based on Formulas (26) and (27), the control voltage of the acousto-optic switch is obtained
U = λ π × f p × d i j × Q m × 2 × η × H M 2 × L × 6.4 × b × l × Z з в ,

4. Development of a Simulation Tool for Studying Energy Consumption in Multilayer Communication Networks

On the basis of the above-described methodology, the software tool in the LabVIEW environment was developed, which allows for automated calculation of energy consumption parameters for info-communication networks of any topology. The flow chart that explains the proposed simulation tool is depicted in Figure 4. First of all, we should set up the structure of the optical transport network (1):
  • Build necessary amount of nodes
  • Setup links between these nodes
Then, should setup necessary parameters for these nodes and links (2–7). In the software tool, we can use switches with opto-electronic conversion or all-optical switches (2). If we use all-optical switches we should specify the key technology for these switches—acousto-optic or electro-optic effect (4). This is a big part of the parameters of the optical switch (5) where we also add parameters of link levels (data block length, etc.) Then, we can calculate the power consumption (8) of the specific node (7) based on the parameters of the IP router, complex parameters of the equipment of the link level, and parameters of the optical linear path (6) and DWDM equipment. When preprocessing procedures were completed, our simulation tool started to generate input traffic for our network and provide the core simulation based on the mathematical model proposed in Section 3. In the end, the simulation tool returns the parameters of the energy efficiency for a specific configuration of the network (10).
Features of the developed software tool:
-
allows us to use equipment from different manufacturers (technical features of each of the equipment for both electric and optical domains are taken into account).
-
to simulate two modes of data transmission (with and without intermediate optoelectronic conversion—O/E/V and without it—O/O/O);
-
change the speed of data transmission (the speed can be changed in the range from 1 to 100 Gbit/s);
-
reproduce power consumption of network elements (limit and intermediate nodes, regeneration equipment and in the processing of service data).
-
change any parameters dynamically during the simulation process;
-
determine the power consumption of electrical and acousto-optical devices at different values of their technical parameters, especially at different values of electro-optical coefficient rij and acousto-optical quality parameter M2;
-
combine the use of acousto-optic and electro-optic devices like switches and modulators;
-
it allows us to show the impact of changes in both network parameters and technical characteristics of the same devices on the power consumption of the network as a whole.
The calculation of the control voltage of lithium niobate crystal for the previous and found in our work [39] parameter of acoustic quality was carried out. Usually, the values of rij depend on the chosen material, the optical wavelength and change from one direction to another. For example, for LiNbO3 rij = 5–18·10−12 m/V [40]. Input data for calculation are represented in Table 3, Table 4, Table 5 and Table 6.

5. Results

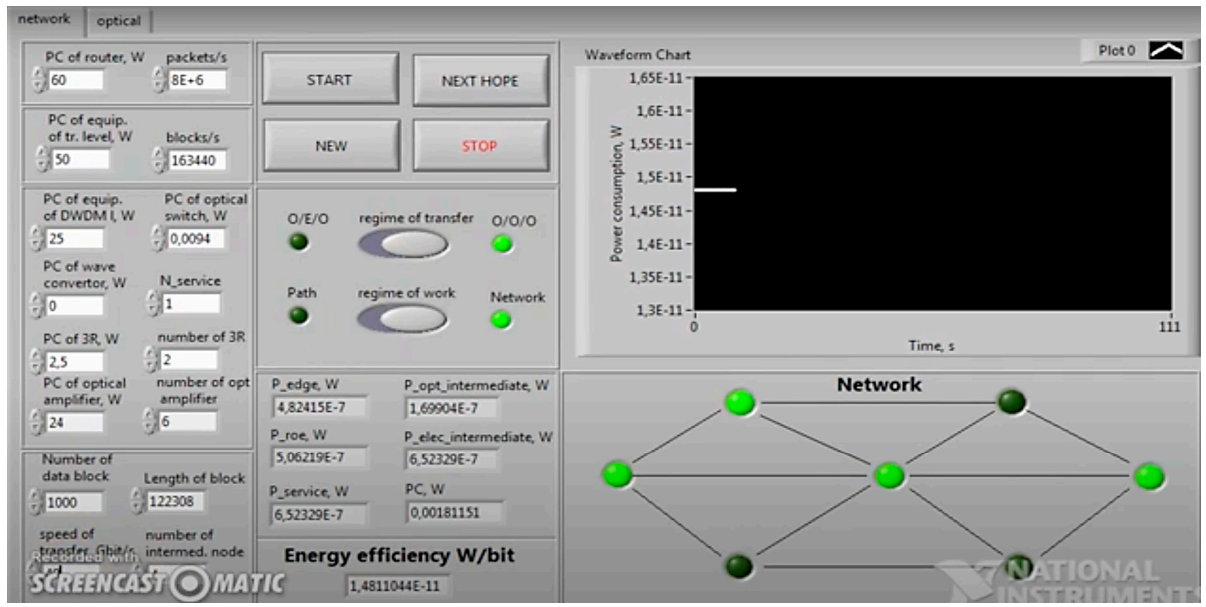
The proposed software tool makes it possible to determine the energy efficiency value at various network operating parameters. In real-time, it is possible to change the data rate, the length of the working data blocks, the energy capacity of the equipment, modes of transmission, the parameters of electro-and acousto-optical to achieve the required value of energy efficiency.
We obtain a basic setup for the measurement of (power) energy consumption of the optical transport network. Energy consumption is 14.8·10−12 w/bit for basic configuration (Figure 5).
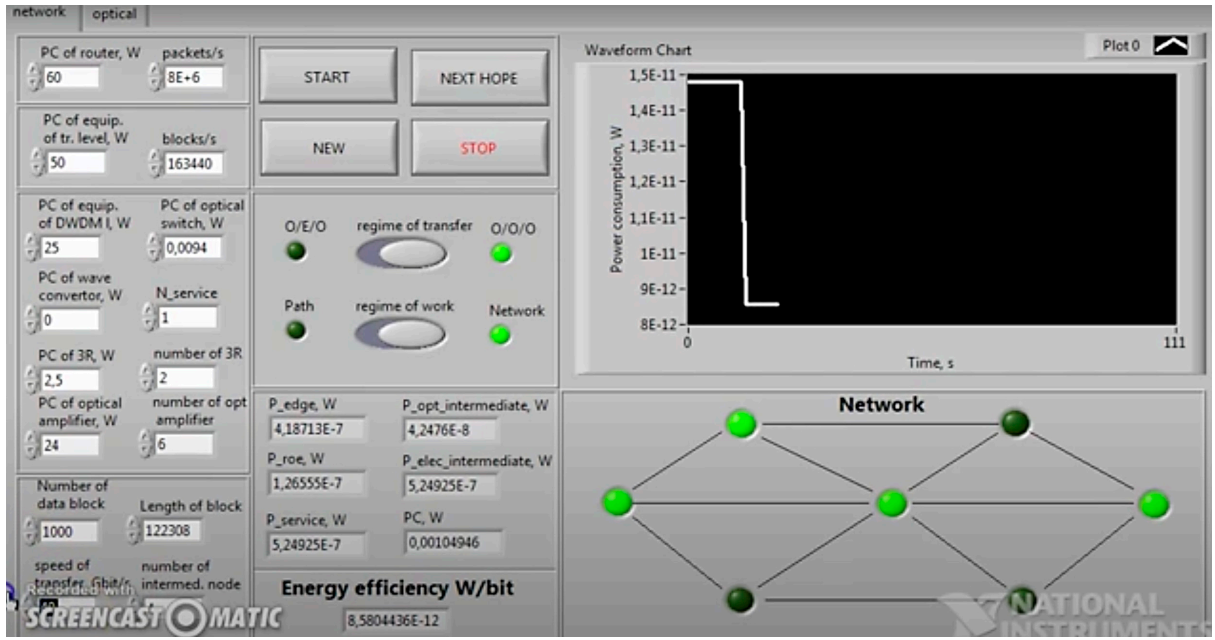
We increase the speed of transfer of the optical channel from 10 to 40 Gbps. In this case, energy consumption is decreased from 14.8·10−12 w/bit to 8.58·10−12 w/bit (Figure 6). Equipment of link-level consumes a lot of energy even when the switching matrix does not perform any action for CPU, cooling, etc. For 100 Gbps, energy consumption is 7.33·10−12 w/bit. This means that increasing the speed of transfer can decrease the energy consumption of the link level. All this manipulation is made without using an optoelectronic conversion on the intermediate nodes of the link level.
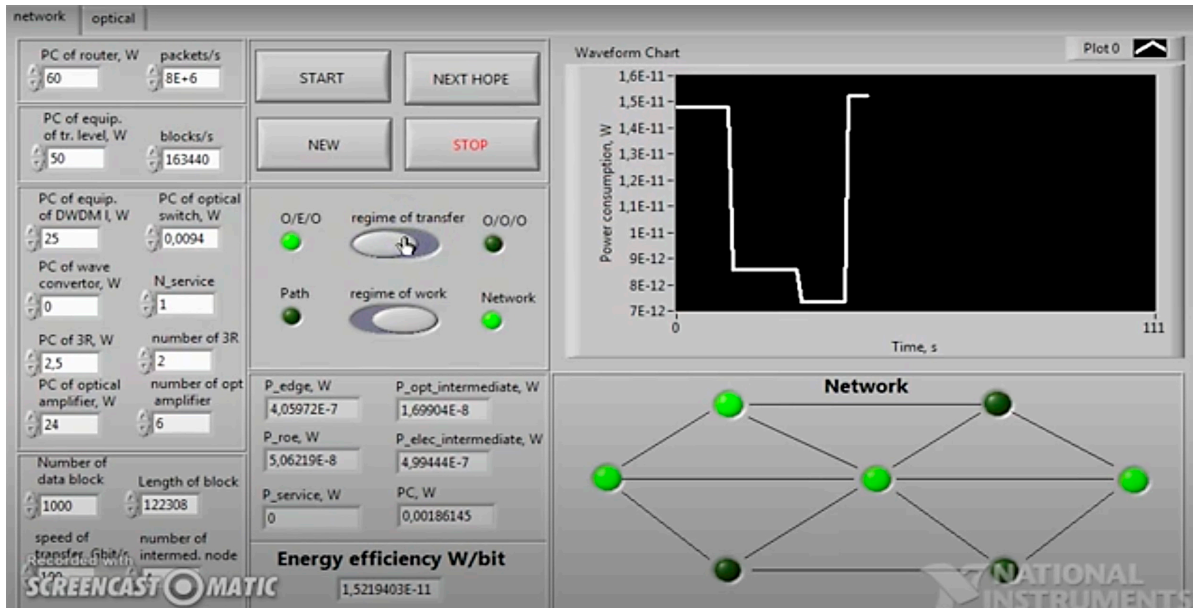
Then, we switch to the mode with opto-electronic conversion on the intermediate nodes of the link level. It increases energy consumption from 7.33·10−12 w/bit to 15.2·10−12 w/bit (Figure 7). Opto-electronic conversion is almost 90% of energy consumption switches of link level.
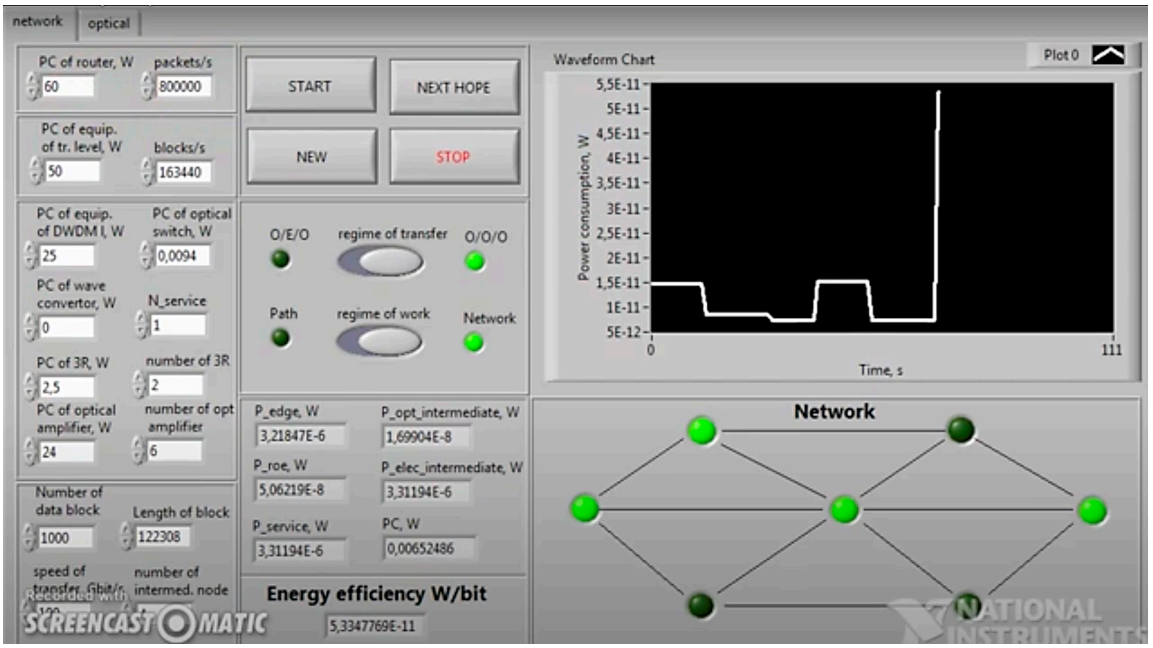
Equipment at the network-level consumes the biggest part of the optical transport network. This experiment presents that when we decrease the number of packages from 8,000,000 to 800,000, energy efficiency changes from 15.2·10−12 w/bit to 53.33·10−12 w/bit (Figure 8). Package aggregation is an important part of decreasing the energy consumption of an optical transport network.
We also present the influence of optical parameters of switching matrix all-optical switches. For example, if we use acousto-optic switches and change parameter M2 from 7·10−15 to 14·10−15, there is an energy consumption decrease from 23.6·10−12 w/bit to 18.8·10−12 w/bit (Figure 9). This happens because we need less energy for switching optical flow if we use material where parameter M2 is bigger.
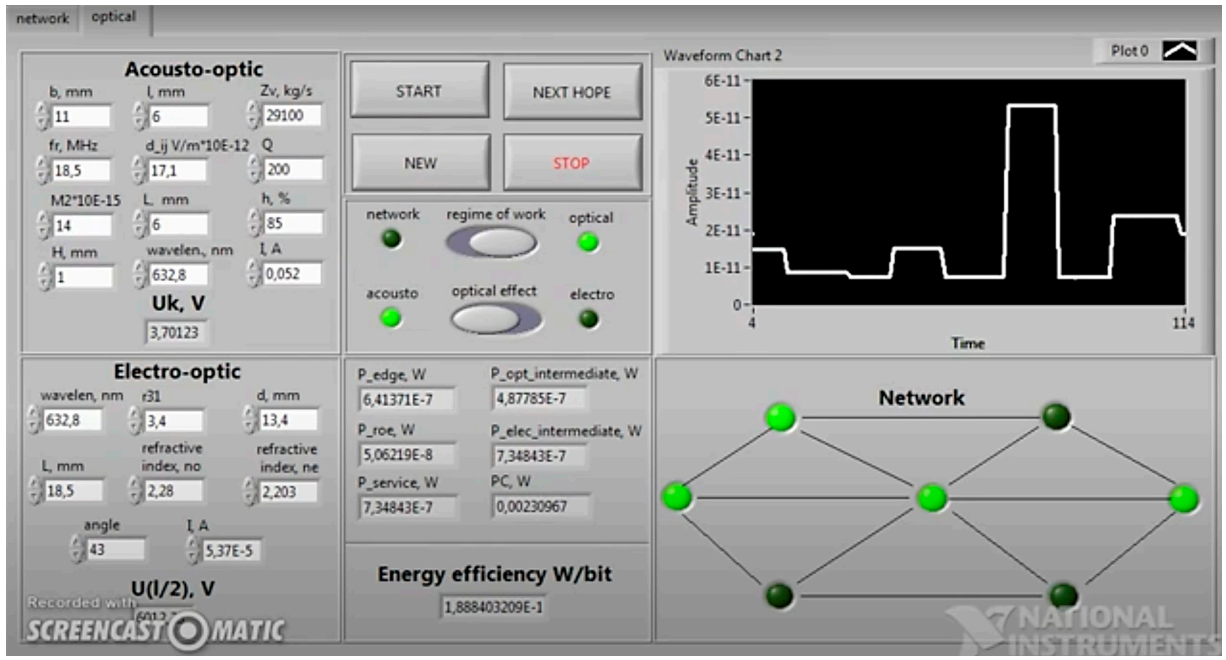
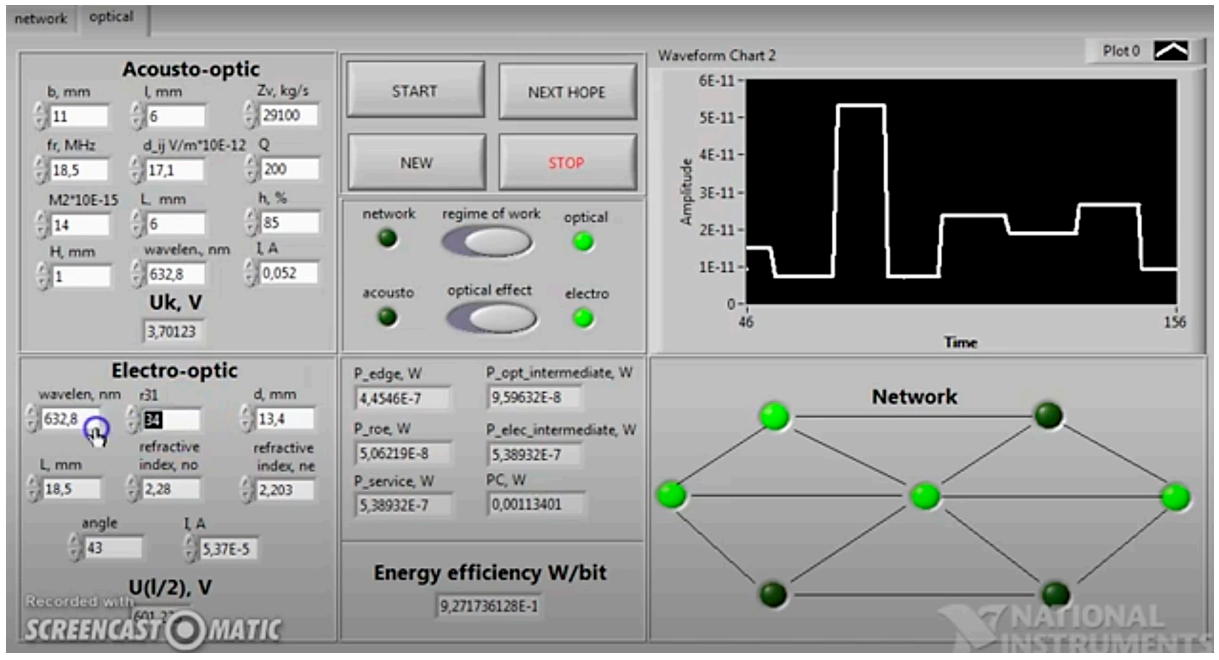
This is the same when we use electro-optic switches. For example, when we change parameter r31(rij) from 3.4·10−12 to 34·10−12, it means that we use a specific cut of Lithium Niobate crystal which allows us to obtain an electro-optic effect with less energy (Figure 10).
It is observed that at rij = 3.4·10−12 m/V and M2 = 7·10−15 s3/kg, the parameter of energy consumption makes 1,2832 pW, and at rij = 39.7·10−12 m/V, M2 = 15.9·10−15 s3/kg found in work [30], energy consumption parameter is 0.8195 pW. Accordingly, the reduction of the energy consumption parameter is observed by 36.1% for the network as a whole, which is quite a lot for a telecommunications operator.
The software product makes it possible to recreate the network architecture and for it to determine this complex energy consumption parameter on the basis of multi-criteria optimization. Moreover, the software product is suitable for testing scientific research in the direction of reducing the power consumption of transport optical networks. It is shown on the basis of electro-and acousto-optical devices and their corresponding electro-optical coefficient rij and acousto-optical quality parameter M2.

6. Discussion

Since the energy efficiency parameter shows the energy consumption for transmitting one bit of information between two nodes, to reduce this parameter, the operator should implement the latest technologies that remove intermediate optoelectronic conversion. In digital transmission systems with speeds up to 1 Gbps, internal modulated lasers are used. At high baud rates, this type of modulation leads to laser instability which has a negative impact on data transmission. Therefore, high-speed transmission lines use semiconductor lasers with external modulation, the principle of which is based on electro or acousto-optical effects. It follows that the prospect of effective use of materials, search for appropriate cuts and orientations for them on the basis of appropriate electro and acousto-optical coefficients, is an actual problem. It should be noted that at higher values of these coefficients, a lower control voltage is required, an example of which is described below. In this work, we present the calculations of the control voltage parameter for electro and acousto-optical cells at the previously defined corresponding to the optical coefficients of the required level of energy saving. This in turn leads to the installation of fully optical switches and high-performance modulators. Since acoustic and electro-optical effects have proven their reliability and good performance in these devices, a comparative analysis of the use of these effects for the same devices should be made. This is because the devices based on these effects maintain optimal network performance. An important parameter for such devices is the value of the control voltage. This is due to the fact that in fully optical networks, the optical signal is transported only in optical form. It follows that the physical and data link-layer equipment determines most of the energy consumption of such networks. Therefore, improving the energy efficiency of optical switches and modulators is an important task and requires a comprehensive approach to its solution. The approach and software tool developed in the work that the computer design of systems can be carried out to find the optimal parameters to ensure the required level of energy efficiency. In real-time, it is possible to change the data transmission speed, the length of the working data blocks, the power capacity of the equipment, the transmission modes, and the acoustic and electro-optical parameters to achieve the required value of the energy efficiency parameter.

7. Conclusions

The parameters of the criteria that influence the energy consumption of such networks in terms of architectural and technological approaches are namely the number and structure of the nodes involved, the network architecture, the type of transport technology, the size of the block of equipment, the type of intermediate optoelectronic transformations, the type of switching, use of wave converters, number and type of regeneration points, number of WDM systems waves. On the basis of these parameters of criteria, a universal methodology for determining the complex parameter of the complex criterion of energy consumption of multilayer networks was developed. Using this methodology in practice will allow the calculation of the energy consumption of the infocommunication multilayer network at the design stage in order to select the optimal parameters for the construction of energy.
Using the proposed methodology, the software product was developed, which allows to simulate the process of energy consumption of the multilayer network and prove the effectiveness of the complex criterion for evaluation of the energy consumption parameter in the process of comparison under conditions of changes in parameters and equipment of the network. Moreover, the software product is suitable for testing scientific research aimed at reducing the energy consumption of transport optical networks. This is shown on the basis of electro-and acousto-optical devices and their corresponding electro-optical coefficient rij and acousto-optical quality parameter M2. The use of electro-and acousto-optical devices for optical transport info-communication networks was analyzed. It is recommended to use electro-optical devices for optical modulators and acousto-optical devices for optical switches. Influence of change of electro-optical coefficient and parameter of acousto-optical quality on the power consumption of investigated architecture of info-communication network as a whole is investigated. According to this technique, any telecommunication network can be the object of research.

Author Contributions

Conceptualization, K.P. and M.B.; methodology, K.P. and M.K.; software, V.A.; validation, K.P. and D.P.; formal analysis, I.D.; writing—original draft preparation, K.P. and M.B.; writing—review and editing, K.P. and O.K.; visualization, K.P.; supervision, M.K.; project administration, K.P.; funding acquisition, K.P. and D.P. All authors have read and agreed to the published version of the manuscript.

Funding

This research was supported by the project No. 0120U102201 “Development the methods and unified software-hardware means for the deployment of the energy efficient intent-based multi-purpose information and communication networks”. This work was supported by the Ministry of Education and Science of Ukraine under project for young researches (no 0119U100435). This work was financed in the framework of the project Lublin University of Technology—Regional Excellence Initiative, funded by the Polish Ministry of Science and Higher Education, contract no. 030/RID/2018/19 and contract no. FN-31/E/EE/2020.

Conflicts of Interest

The authors declare no conflict of interest.

References

  1. Fernández-Fernández, A.; Cervelló-Pastor, C.; Ochoa-Aday, L. Energy Efficiency and Network Performance: A Reality Check in SDN-Based 5G Systems. Energies 2017, 10, 2132. [Google Scholar] [CrossRef] [Green Version]
  2. Hafeez, G.; Alimgeer, K.S.; Wadud, Z.; Shafiq, Z.; Ali Khan, M.U.; Khan, I.; Khan, F.A.; Derhab, A. A Novel Accurate and Fast Converging Deep Learning-Based Model for Electrical Energy Consumption Forecasting in a Smart Grid. Energies 2020, 13, 2244. [Google Scholar] [CrossRef]
  3. Przystupa, K.; Koziel, J. Analysis of the quality of uninterruptible power supply using a UPS. In 2018 Applications of Electromagnetics in Modern Techniques and Medicine (PTZE); IEEE: Piscataway, NJ, USA, 2018; pp. 191–194. [Google Scholar]
  4. Koutitas, G.; Demestichas, P. A review of energy efficiency in telecommunication networks. Telfor J. 2010, 2, 2–7. [Google Scholar]
  5. Kozieł, J.; Przystupa, K. Using the FTA method to analyze the quality of an uninterruptible power supply unitreparation UPS. Prz. Elektrotechniczny 2019, 95, 77–80. [Google Scholar]
  6. Aris, A.M.; Shabani, B. Sustainable Power Supply Solutions for Off-Grid Base Stations. Energies 2015, 8, 10904–10941. [Google Scholar] [CrossRef] [Green Version]
  7. Martin, A.D.; Cano, J.M.; Silva, J.F.A.; Vázquez, J.R. Backstepping Control of Smart Grid-Connected Distributed Photovoltaic Power Supplies for Telecom Equipment. IEEE Trans. Energy Convers. 2015, 30, 1496–1504. [Google Scholar] [CrossRef]
  8. Klymash, M.; Savchuk, R.; Pozdnyakov, P.; Beshley, M. The Researching and Modeling of Structures of Mobile Networks for Providing of Multiservice Radio Access. In Proceedings of the International Conference on Modern Problem of Radio Engineering, Telecommunications and Computer Science, Lviv-Slavske, Ukraine, 21–24 February 2012; pp. 281–282. [Google Scholar]
  9. Beshley, M.; Romanchuk, V.; Seliuchenko, M.; Masiuk, A. Investigation the Modified Priority Queuing Method Based on Virtualized Network Test Bed. In Proceedings of the Experience of Designing and Application of CAD Systems in Microelectronics, Lviv, Ukraine, 24–27 February 2015; pp. 1–4. [Google Scholar]
  10. Zhu, M.; Sun, Q.; Zhang, S.; Gao, P.; Chen, B.; Gu, J. Energy-Aware Virtual Optical Network Embedding in Sliceable-Transponder-Enabled Elastic Optical Networks. IEEE Access 2019, 7, 41897–41912. [Google Scholar] [CrossRef]
  11. Cengiz, K.; Dag, T. A Review on the Recent Energy-Efficient Approaches for the Internet Protocol Stack. J Wirel. Commun. Netw. 2015, 2015, 108. [Google Scholar] [CrossRef] [Green Version]
  12. Klymash, M.; Beshley, M.; Stryhaluk, B. System for Increasing Quality of Service of Multimedia Data in Convergent Networks. In Proceedings of the 2014 First International Scientific-Practical Conference Problems of Infocommunications Science and Technology, Kharkov, Ukraine, 22 December 2014; pp. 63–66. [Google Scholar]
  13. Romanchuk, V.; Beshley, M.; Polishuk, A.; Seliuchenko, M. Method for Processing Multiservice Traffic in Network Node Based on Adaptive Management of Buffer Resource. In Proceedings of the 2018 14th International Conference on Advanced Trends in Radioelecrtronics, Telecommunications and Computer Engineering (TCSET), Slavske, Ukraine, 20–24 February 2018; pp. 1118–1122. [Google Scholar]
  14. Pytka, J.; Budzyński, P.; Józwik, J.; Michałowska, J.; Tofil, A.; Łyszczyk, T.; Błażejczak, D. Application of GNSS/INS and an Optical Sensor for Determining Airplane Takeoff and Landing Performance on a Grassy Airfield. Sensors 2019, 19, 5492. [Google Scholar] [CrossRef] [Green Version]
  15. Chavarria-Reyes, E.; Akyildiz, I.F.; Fadel, E. Energy Consumption Analysis and Minimization in Multi-Layer Heterogeneous Wireless Systems. IEEE Trans. Mob. Comput. 2015, 14, 2474–2487. [Google Scholar] [CrossRef]
  16. Ahmed, M.; Ahmad, I.; Habibi, D. Green Wireless-Optical Broadband Access Network: Energy and Quality-of-Service Considerations. IEEE/OSA J. Opt. Commun. Netw. 2015, 7, 669–680. [Google Scholar] [CrossRef]
  17. Beshley, M.; Kryvinska, N.; Seliuchenko, M.; Beshley, H.; Shakshuki, E.M.; Yasar, A.-U.-H. End-to-End QoS “Smart Queue” Management Algorithms and Traffic Prioritization Mechanisms for Narrow-Band Internet of Things Services in 4G/5G Networks. Sensors 2020, 20, 2324. [Google Scholar] [CrossRef] [Green Version]
  18. Beshley, M.; Romanchuk, V.; Chervenets, V.; Masiuk, A. Ensuring the Quality of Service Flows in Multiservice Infrastructure Based on Network Node Virtualization. In Proceedings of the 2016 International Conference Radio Electronics Info Communications (UkrMiCo), Kiev, Ukraine, 11–16 September 2016; pp. 1–3. [Google Scholar]
  19. Jun, S.; Przystupa, K.; Beshley, M.; Kochan, O.; Beshley, H.; Klymash, M.; Wang, J.; Pieniak, D. A Cost-Efficient Software Based Router and Traffic Generator for Simulation and Testing of IP Network. Electronics 2020, 9, 40. [Google Scholar] [CrossRef] [Green Version]
  20. Orgerie, A.-C.; Amersho, B.L.; Haudebourg, T.; Quinson, M.; Rifai, M.; Pacheco, D.L.; Lefèvre, L. Simulation Toolbox for Studying Energy Consumption in Wired Networks. In Proceedings of the 2017 13th International Conference on Network and Service Management (CNSM), Tokyo, Japan, 26–30 November 2017; pp. 1–5. [Google Scholar]
  21. Bolla, R.; Bruschi, R.; Davoli, F.; Cucchietti, F. Energy Efficiency in the Future Internet: A Survey of Existing Approaches and Trends in Energy-Aware Fixed Network Infrastructures. IEEE Commun. Surv. Tutor. 2011, 13, 223–244. [Google Scholar] [CrossRef]
  22. Hinton, K.; Jalali, F.; Matin, A. Energy Consumption Modelling of Optical Networks. Photonic Netw. Commun. 2015, 30, 4–16. [Google Scholar] [CrossRef]
  23. Ding, X.; Wu, J. Study on Energy Consumption Optimization Scheduling for Internet of Things. IEEE Access 2019, 7, 70574–70583. [Google Scholar] [CrossRef]
  24. Baliga, J.; Ayre, R.; Hinton, K.; Sorin, W.V.; Tucker, R.S. Energy Consumption in Optical IP Networks. J. Lightwave Technol. JLT 2009, 27, 2391–2403. [Google Scholar] [CrossRef]
  25. Van Heddeghem, W.; Idzikowski, F.; Vereecken, W.; Colle, D.; Pickavet, M.; Demeester, P. Power Consumption Modeling in Optical Multilayer Networks. Photonic Netw. Commun. 2012, 24, 86–102. [Google Scholar] [CrossRef] [Green Version]
  26. Tucker, R.; Hinton, K.; Ayre, R. Energy-Efficiency in Cloud Computing and Optical Networking. In Proceedings of the 2012 38th European Conference and Exhibition on Optical Communications, Amsterdam, The Netherlands, 16–20 September 2012; pp. 1–32. [Google Scholar]
  27. Musumeci, F.; Vismara, F.; Grkovic, V.; Tornatore, M.; Pattavina, A. On the Energy Efficiency of Optical Transport with Time Driven Switching. In Proceedings of the 2011 IEEE International Conference on Communications (ICC), Kyoto, Japan, 5–9 June 2011; pp. 1–5. [Google Scholar]
  28. Beletsioti, G.; Papadimitriou, G.; Nicopolitidis, P. Energy-Aware Algorithms for IP Over WDM Optical Networks. J. Lightwave Technol. 2016, 34, 2856–2866. [Google Scholar] [CrossRef]
  29. Zhu, M.; Zeng, X.; Lin, Y.; Sun, X. Modeling and analysis of watchful sleep mode with different sleep period variation patterns in PON power management. IEEE/OSA J. Opt. Commun. Netw. 2017, 9, 803–812. [Google Scholar] [CrossRef]
  30. Andrushchak, A.S.; Mytsyk, B.G.; Demyanyshyn, N.M.; Kaidan, M.V.; Yurkevych, O.V.; Dumych, S.S.; Kityk, A.V.; Schranz, W. Spatial Anisotropy of Linear Electro-Optic Effect in Crystal Materials: II. Indicative Surfaces as Efficient Tool for Electro-Optic Coupling Optimization in LiNbO3. Opt. Lasers Eng. 2009, 47, 24–30. [Google Scholar] [CrossRef]
  31. Idzikowski, F.; Chiaraviglio, L.; Cianfrani, A.; López Vizcaíno, J.; Polverini, M.; Ye, Y. A Survey on Energy-Aware Design and Operation of Core Networks. IEEE Commun. Surv. Tutor. 2016, 18, 1453–1499. [Google Scholar] [CrossRef]
  32. Hoque, M.A.; Siekkinen, M.; Nurminen, J.K. Energy Efficient Multimedia Streaming to Mobile Devices—A Survey. IEEE Commun. Surv. Tutor. 2014, 16, 579–597. [Google Scholar] [CrossRef]
  33. Li, S.; Kim, J.G.; Han, D.H.; Lee, K.S. A Survey of Energy-Efficient Communication Protocols with QoS Guarantees in Wireless Multimedia Sensor Networks. Sensors 2019, 19, 199. [Google Scholar] [CrossRef] [Green Version]
  34. Kahalo, I.; Beshley, H.; Beshley, M.; Panchenko, O. Enhancing QoS and Energy Efficiency of LTE/LTE-U/Wi-Fi Integrated Network Based on Adaptive Technique for Radio Structure Formation. In Proceedings of the 2019 IEEE 2nd Ukraine Conference on Electrical and Computer Engineering (UKRCON), Lviv, Ukraine, 2–6 July 2019; pp. 1167–1170. [Google Scholar]
  35. Kaidan, M.; Andrushchak, V.; Pitsyk, M. Calculation Model of Energy Efficiency in Optical Transport Networks. In Proceedings of the 2015 Second International Scientific-Practical Conference Problems of Infocommunications Science and Technology (PICST), Kharkiv, Ukraine, 13–15 October 2015; pp. 167–170. [Google Scholar]
  36. Viet, V.H.; Nhat, M.P.Q.; Quoc, N.H. A Model of Adaptive Grouping Scheduling in OBS Core Nodes. J. Converg. 2014, 5, 9–13. [Google Scholar]
  37. Lopatina, P.; Krishtop, V. Electro-optic modulator for fiber-optic communication lines. Univ. News. Instrum. Mak. 2009, 52, 67–71. [Google Scholar]
  38. Fedelesh, V.; Stegura, M.; Yurkin, I.; Babidorich, P. Acousto-optic modulators and deflectors based on chalcogenide glasses (As2S3)1−xHg(Ge)x. Sci. Visnyk Uzhgorod Univ. Ser. Phys. 2009, 24, 157–166. [Google Scholar]
  39. Andrushchak, A.S.; Chernyhivsky, E.M.; Gotra, Z.Y.; Kaidan, M.V.; Kityk, A.V.; Andrushchak, N.A.; Maksymyuk, T.A.; Mytsyk, B.G.; Schranz, W. Spatial anisotropy of the acoustooptical in Lithium Niobate Crystals. J. Appl. Phys. 2010, 108, 103118. [Google Scholar] [CrossRef]
  40. Capmany, J.; Fernández-Pousa, C.R. Quantum Modelling of Electro-Optic Modulators. Laser Photonics Rev. 2011, 5, 750–772. [Google Scholar] [CrossRef] [Green Version]
Figure 1. The three-tier structure of the transport infocommunication network with intermediate optoelectronic transformation is (a) and without intermediate optoelectronic conversion in (b).
Energies 13 06370 g001
Figure 2. The structure of the acousto-optic switch.
Energies 13 06370 g002
Figure 3. The structure of the electro-optical modulator.
Energies 13 06370 g003
Figure 4. Flow chart that explain the proposed simulation tool.
Energies 13 06370 g004
Figure 5. The front panel of the software tool that calculates the energy efficiency parameter.
Energies 13 06370 g005
Figure 6. The front panel of the software tool that calculates the energy efficiency parameter when the speed of transfer of the optical channel change from 10 to 40 Gbps.
Energies 13 06370 g006
Figure 7. The front panel of the software tool that calculates the energy efficiency parameter when we switch to the mode with opto-electronic conversion on the intermediate nodes of link level.
Energies 13 06370 g007
Figure 8. The front panel of the software tool that calculates the energy efficiency parameter when we decrease the number of packages from 8,000,000 to 800,000.
Energies 13 06370 g008
Figure 9. The front panel of the software tool that calculates the energy efficiency parameter when we use acousto-optic switches and change parameter M2 from 7·10−15 to 14·10−1.
Energies 13 06370 g009
Figure 10. The front panel of the software tool that calculates the energy efficiency parameter when we change parameter r31(rij) from 3.4·10−12 to 34·10−12.
Energies 13 06370 g010
Table 1. Notations.
Table 1. Notations.
SymbolMeaningSymbolMeaning
Pp.cgeneral energy consumption of the networkPwave(v)the energy consumed by the wave conversion
POenergy consumption of intermediate nodes without O-EPcool(v)the energy consumed by the cooling of the switch and is determined
PEenergy consumption of intermediate nodes with E-Okethe share of electricity accounted for by cooling
Nnumber of nodes without O-EUmanagthe control voltage applied to the switch
Knumber of nodes with E-OUacousthe maximum allowable control voltage
Mnumber of data blocks Z з в the acoustic resistance of the sound material
Ptransppower consumption for open through channels f p the resonant frequency of the piezoelectric transducer
PROEpower consumption for regeneration equipment d i j piezo-module of the material
Pd_timepower consumed in equipment idle time Q m the piezoelectric material of the piezoelectric transducer
P I P the total electricity consumption of the network layer devices L a the length of the acousto-optic interaction
P t r . l the electricity consumption of the data link layer M 2 the AO coefficient
P D W D M the total electricity consumption of the physical layer H n the width p converter
Lblockthe length of the data block P E d g e i n p u t the energy consumption is determined at the input nodes
Pmaxthe power consumption of the network device at its maximum load P E d g e o u t p u t the energy consumption is determined at the output nodes
Nbthe number of data blocks that the device can process P mod . r D W D M the electricity consumption of the electro-optical modulator
PChas(v)determines the energy consumption of the chassis P rec . D W D M the energy consumption of the photodetector
Uprocthe number of controllers used P e q u i p . the power consumption of amplifiers, isolators used in the network
Pproc(vu)the energy consumption of a particular type of controllerNsignalcertain number of service data blocks
NLCthe number of linear cards used P e q u i p . the energy consumed by equipment
PLC(vi)the energy consumption of linear cardsPswthe energy consumed by an optical switch
PPLIM(vj)power consumption of interface modules and port adapters PLIMPsthe power consumption of the optical switch
PSW(vm)power consumption of switching factories SWPwcthe power consumption of the optical wave converter
PMSC(vk)power consumption of control modules MSCPOAthe power consumption of the optical amplifier
Pequip.op(t)the power consumption of the device level link per unit timeQthe number of optical amplifiers used from point A to point B
Vthe speed of transmission of the optical signal in the networkTthe number of 3R regenerators used from point A to point B
Table 2. Related main works.
ReferencesDescriptionDifferences with Our Work
[21]This article describes methodologies how to measure power consumption for different network, not only optical transport network even data center. However, there are several mathematical models for calculating power consumption for different equipment. In general, this article describes the general approaches for measuring power consumption in different telecommunication networks.This article does not include influence electro-optic and acousto-optic effect as key technology of all-optical switches for measurement power consumption. This article does not have mathematical models and simulation model. This article is similar to the review article.
[22]This work describes the algorithm of optimization power consumption in telecommunication network of the Internet of Things. Article proposes methodologies for calculation power consumption for a lot of equipment internet of things.This article does not include the influence of electro-optic and acousto-optic effect on measurement power consumption. This article does not include the schema of simulation model which should demonstrate how to calculate the parameter of energy efficiency.
[23]Authors take into account different networks (access, edge, core) for calculation power consumption. One of the features is methodology for calculation power consumption in different access networks.This article does not include the influence of electro-optic and acousto-optic effect as key technology of all-optical switches for measurement power consumption. This article has a description of measurement power consumption in IoT networks but not in optical transport networks.
[24]This work describes methodology of calculation power consumption for different telecommunication networks. One of the features is simplified methodology for calculating the power consumption of networksThis article does not include the influence of electro-optic and acousto-optic effect as key technology of all-optical switches for measurement power consumption.
[25]This work describes power consumption for different devices and technologies of telecommunication networks. One of the features is the calculation power consumption of telecommunication networks in combination with cloud computing systems.This article does not include the influence of electro-optic and acousto-optic effect as key technology of all-optical switches for measurement power consumption.
[26]This paper describes various energy-efficient solutions that are considered, usually consisting of a two-layer network architecture by providing a fully optical transport layer, since the corresponding energy savings can be achieved through optical technologies. The optical switching is particularly suited to significantly reduce the number of optical/electronic/optical transformations and electronic processing operations requiring high power.The author does not show how the power consumption of the network as a whole should be determined, and the set values of power consumption are approximate and do not take into account equipment from different manufacturers. This research paper does not address the effect of electro-optical and acousto-optical effects as a key technology for all-optical switches to measure power consumption.
Table 3. Energy consumption of telecommunication equipment (optical domain).
EquipmentConsumption, Wt/hBrand Model, Manufacturer
Equipment of DWDM level24Wt (per wavelength)Fujitsu Flashwave
Optical switch0.094EOspace Electro
Optical EDFA amplifier2.5FINISAR single Channel Micro EDFA
3R regeneration243R Regeneration technology XFP Module Optics
Table 4. The operating parameters of electro-and acousto-optic devices.
Acousto-Optical Device
CrystalLiNbO3
The thickness of the crystal, d, mm13.4
The length of the crystal L, mm18.5
Electro-optical coefficient, rij, ×10−12 m/V3.4; 39.7
Electro-Optical Device
Piezoelectric transducer resonant frequency f, MHz18.5
Piezomodule of the piezoelectric transducer d, ×10−12 m2/V17.1
Mechanical quality factor, Q200
Transmission ratio (efficiency parameter) η, %85
Height of the piezoelectric transducer, H, mm6
Length of acoustic interaction, L, mm6
Width of an acoustic column, b, mm11
Height of an acoustic column, l, mm6
Acoustic resistance of the material, Zzv, ×103 s3/kg29.1
Table 5. Input parameters for simulation of energy efficiency.
ParameterValue
Number of intermediate nodes3
Architecture of nodeThree-level
Kind of transport technologyOTN
Length of data block, in bits Lblock122,368 (OTN); 8000 (IP)
The speed of transmission of the optical signal in the network, V10
Number of data block, M1000
Type of equipment usedCisco, Huawei, Mikrotik, EOspace, Fujitsu Flashwave, HiLink
Number of intermediate optoelectronic conversion, K0
Type of switchingoptical
Using wave converters0
Number of optical amplifiers, Q6
Number of 3R regenerators, T2
Table 6. Energy consumption of telecommunication equipment (electrical domain).
EquipmentConsumption, Wt/hThe Number of Data Block which Can Process the Device, NmaxBrand Model, Manufacturer
Core router608mln IP packetsMikrotik Cloud Core Router 1036-12G-4S
Equipment of transport level (transponder)50163440blocks (OTU)Cisco ONS 15,454 10-Gbps Multirate Enhanced Transponder
Publisher’s Note: MDPI stays neutral with regard to jurisdictional claims in published maps and institutional affiliations.

