Review

Distributed Generation: A Review on Current Energy Status, Grid-Interconnected PQ Issues, and Implementation Constraints of DG in Malaysia

1
Department of Electrical and Electronics Engineering, Universiti Tenaga Nasional, Kajang 43000, Malaysia
2
Institute of Power Engineering, Universiti Tenaga Nasional, Kajang 43000, Malaysia
*
Author to whom correspondence should be addressed.
Energies 2020, 13(24), 6479; https://doi.org/10.3390/en13246479
Submission received: 25 September 2020 / Revised: 16 November 2020 / Accepted: 20 November 2020 / Published: 8 December 2020
(This article belongs to the Section F: Electrical Engineering)

Abstract

:
Electric supply is listed as one of the basic amenities of sustainable development in Malaysia. Under this key contributing factor, the sustainable development goal aims to ensure universal access to an affordable, clean, and reliable energy service. To support the generation capacity in years to come, distributed generation is conceptualized through stages upon its implementation in the power system network. However, the rapid establishment growth of distributed generation technology in Malaysia will invoke power quality problems in the current power system network. In order to prevent this, the current government is committed to embark on the development of renewable technologies with the assurance of maintaining the quality of power delivered to consumers. Therefore, this research paper will focus on the review of the energy prospect of both fossil fuel and renewable energy generation in Malaysia and other countries, followed by power quality issues and compensation device under a high renewable penetration distribution network. The issues and challenges of distributed generation are presented, with a comprehensive discussion and insightful recommendation on future work of the distributed generation. In accordance with the addressed highlights in this paper, it would serve as the criterion on upcoming revolution of distributed generation integrated along with the traditional network in Malaysia.

1. Introduction

Relying on natural resources, such as fossil fuels, might not be a viable option in electricity generation [1,2]. The main reason for this is because fossil fuels will eventually face the brink of depletion in years to come. Under a large utilization on these resources, the contributing effects on the carbon footprint can be very alarming to the environment [3,4,5]. Therefore, alternative solutions, such as renewable sources (RESs), are introduced to support the surging demand of electricity and at the same time, to reduce the greenhouse gas effects caused by CO2 emission [6,7]. Cost reduction, bulking market demand, and an attractive rate of return on renewable technologies are also some of the reasons contributing to the subsequent factor upon realizing RE as one of the prominent generations in the grid [8,9]. In 2019, at least four countries (Denmark, Germany, Uruguay, and Iceland) met 30% of their electricity generation based on two prominent source of renewable energy, which are solar and wind [10]. By strategizing renewable policies and adapting to the trends of the energy market, this would further lead to an increase in high penetration of renewable energy towards electrifying the load demand. Looking at the current market in renewable technology, solar is listed as one of the cheapest renewable sources at the moment. This makes leading countries, such as China, venture further on the feasibility of solar energy deployment in its grid system. Consequently, solar electricity could generate at a lower cost compared to fossil fuels under a high RE penetration grid system [11].
Presently, the Malaysian government has looked into the promising growth of RE to sustain the demand of electricity in the future [12]. On this matter, this leads to the concept of integrating renewable energy (RE) sources within the distribution network. In this approach, the power losses between generation and load can be reduced, decreasing fossil fuel consumption economically in addition to promoting green energy [8,13]. In consideration of implementing the concept of distributed generation (DG), policies have been introduced to encourage industries and public in adopting RE generation [14,15,16]. Numerous initiatives and incentives on installation and operational costs, pricing tariffs, tender program, and research grants have been proposed to empower the RE strategies towards sustainable development goals (SDG) in the energy sector [12,17,18]. This substantially subsidizes the larger needs of fossil fuel generation, which can be lowered or compensated by RE technology within the distribution network, which is shown in Figure 1. As for now, there are many mini hydro power generators, roof-top, and smaller-scaled solar farms, and biomass generators are interconnected within the distributed network to support the load demand by utilizing a greener energy to preserve the environment [2,7,19,20].
However, there are limitations that contribute to the ineffectiveness of DG in providing support to the grid system [22,23,24]. Through integration of RES into the grid system, power quality issues are presumably higher as compared to the traditional grid system. To maintain the stability of the integrated grid system with RES, power quality standards are constantly revised to maintain the quality of power delivered to the consumer. Both solar and wind renewables are an example of RES that are heavily affected by the changes within its surroundings and environment, which compromise the effectiveness of the RE generation [24]. From an inconsistent generation of RE, this would lead to a disorganized power dispatch from the primary source (fossil fuel generation) towards the consumer loads [24,25]. Traditionally, when there is a high penetration in RE, curtailment would be the best practice to limit the generation on the RE supply to the grid [26,27]. However, performing curtailment in order to limit the RE generation is not economically beneficial as it will not fully maximize the potential of the RE generation [23]. Besides this, with sudden unpredictable intermittency in RE generation, it would compromise the stability of the grid system, which could lead to a possible risk of brownout or blackout. Hence, in regards to both the unavoidable high RE penetration and intermittency, implementing power quality (PQ) compensation devices in the grid system would resolve the addressed problems earlier [23,28,29].
Therefore, an in-depth analysis and details on the trends of fossil fuel and renewable energy development in Malaysia and other leading countries is described in Section 2. For Section 3, the grid integration power quality standards and issues in Malaysia are discussed within the distribution network/distributed generation. Next, Section 4 focuses on the power quality compensation devices in a distribution network in terms of its topology and control algorithm or technique in resolving power quality problems, which is addressed in Section 3. Lastly, in Section 5, a critical review will be presented to deliberate on the issues, challenges, and future recommendations of distributed generation in Malaysia. From the mentioned reviews above, this would substantially improve the stated problem faced in the distribution network in terms of carbon emission reduction, improving RE generation and cost-effectiveness, and lastly to ensure the quality of power delivered within the grid system.

2. Current Global Energy Trends in Power Generation

Electricity is one of the necessities in our daily life. As the world progresses rapidly, the overall consumption of energy increases as well. Traditionally, fossil fuel generation contributes fully on the electricity generation to meet its demand. Under heavy consumption of fossil fuels, it eventually raises the public awareness towards the environment on greenhouse gas effects (GHG) [30,31,32]. Therefore, alternative energy sources, such as the renewables, were introduced to reduce the consumption of fossil fuels and, at the same time, to minimize the effects of carbon emission in contributing to greenhouse effects (GHG). Well-developed countries in the USA, Europe, Japan, and China are currently investing in research and development of renewable technologies with the hope to make it more viable in power generation in order to phase out fossil fuels in the future [5,27]. Focusing the direction on sustainable development goals on affordable and clean energy (SDG 7), this could solve energy security concerns, reducing carbon emission and improving the country’s economics [30,33].
Malaysia is a country blessed with an abundance of resources and strategically located near the equator, which makes it hot and sunny throughout the years [14]. This has provided Malaysia with the capability to venture into the renewable energy (RE) sector and provides more opportunities for the country’s growth [14,20]. By introducing renewable sources to the grid, it could solve the scarcity of fossil fuels, while at the same reducing the carbon footprint towards the environment. With the Renewable Energy Act proposed in 2011, many initiatives were introduced to regulate the relevant standards and establishment of green energy across the country, which includes incentives and benefits on RE sources [34].
Currently, Malaysia has only acquired 2% of the energy harnessed from the total energy mix on renewables, which is shown in Figure 2. The acquired percentage of renewable excludes a large hydro generation capacity of more than 100 MW considering some of its negative impacts towards the environment [35]. Despite this, the Malaysian government aims to achieve a target of up to 20% in the year 2025, which amounts to 4000 MW from the current RE generation [14,36]. The main focus of the projected energy is to reduce the dependency of fossil fuels and increase the projection of renewable generation in the future. At present, the dependency of fossil fuels is relatively high, whereby the overall generation of the energy mix comes mostly from gas and coal plants [14]. To sustain a higher energy demand subsequently, Malaysia would need to take a big leap in exploring the potential of renewable technology, especially for solar, hydro, and biomass.
In the following subsection, a comprehensive review is conducted on the present status of fossil fuel and renewable energy in Malaysia and other leading countries. Additionally, there will be an insight on the strategies initiated by the country’s government in promoting renewable energy and policies that would benefit all parties and the environment through a reduction of carbon emission.

2.1. Fossil Fuel Generation

Fossil fuels have been the largest and most prominent source of generation in the world. Referring to the data obtained in [37], the global consumption of fossil fuels and coal has increased more than 1300-fold as compared with the early years. At present, crude oil remains the top in the energy consumption, followed by coal and natural gases, which tops at 39%, followed by 33% and 28%, respectively. With the tremendous increase in fossil fuel consumption, this indicates that the energy demand across the globe has been significantly increasing in line with the generated sources [30]. Under large consumption of fossil fuels, there were concerns regarding the scarcity of fossil fuels and the effects of carbon emission towards the environment [33,38]. A prediction on the depletion of resources has been proposed by [39] in determining the life expectancy of fossil fuels in the United State. Under the proposed theory, there was a significant trend to forecast the peak resource production and determining the depletion of the resources as well. In reference to the statistical data provided in Figure 3, the maximum production of the resources was recorded to be in the year of 1970, which tallies up to the findings in [39].
Hence, maximum production of resources has already been exceeding its years, which ends with the amount of 3.52 billion. From the bell curve, the expectancy of depletion of these resources will come to an end in another few decades. Up to now, there were no records or signs indicating that the resources will deplete at the moment. Surprisingly, there was a production surge recorded in 2008 (1.83 billion) to 2015 (3.44 billion). The reason for this is because there was a major discovery of a shale oil refinery in the USA, which contributed to a surge in the production of oil fuels [40]. Based on a statistical review on the world energy in 2016, the expectancy was roughly estimated to be around 115 years on coal depletion and 50 years for oil and gases [41]. From the estimation on both in [39,41], it might be untrue as the energy demand varies with time depending on yearly consumption, breakthrough of newer technology, and the lifestyle of the consumer. With an unknown expectancy of depending on an uneven distribution on the natural resources, it may cause a negative impact towards the economy and the purchasing ability in the market price [38]. This influences the possible outcome of energy security vulnerability in the country.
Carbon emission has been a huge problem towards the environment and health. According to [4], the carbon emission released by fossil fuels is the major cause of global warming. It was found by the same author that around 93% of the greenhouse effects are contributed by the fuel combustion process in 2011. On the current obtained data from [38], coal has the highest emission factor as compared with the other fossil fuels followed by coke and lignite. The reason towards the large CO2 emission is due to a lower purchasing price and higher availability of coal as compared to other fossil fuels [14]. Another reason might be the increasing energy consumption, which contributes to higher generation needs to sustain the demand of the load of the same year. To reduce the carbon emission footprints, some countries have looked into better fossil fuel alternatives, such as natural gases, to reduce the carbon emission [36,37]. In 2015, the European Union also proposed implementation of a climate change energy policy, which hopes to reduce carbon emission, dependency of single suppliers, and energy efficiency [33]. It was reported by the Energy Commission in Malaysia [42] that Malaysia is one of the largest gas and coal reserves due to the abundance of natural resources. With a higher energy consumption to cover the necessities of the overall Malaysia population, the country is well-prepared to meet its demand on a comfortable margin. Therefore, natural gas has been the largest primary generation, which contributed 43.5% of the overall generation in 2016 [14]. However, Malaysia is consistently coping with huge demands internally and externally, which makes the country at a higher risk to energy security issues. Besides this, due to the increase in electricity consumption throughout the years, this has led to an increase in carbon emission, which amounted to 250.3 million tons in 2018 [43].
The development of National Energy Policy in 1979 came into effect to serve the need for energy in Malaysia [15]. The three identified principles of the energy objective component, which will be the guide for the energy sectors, are supply, utilization, and environmental. This policy will promote the effective utilization and cost effectiveness of the energy supply and at the same time minimize the negative effects towards the environment. In seeking alternatives in reducing fossil fuel consumption, the initiative on renewable energy comes into effect from the establishment of the National Renewable Energy Policy in 2009, which targets the total renewable energy of 20% to the electricity generation in 2025 [42,44]. Under the joint efforts by the government and Malaysian Green Technology Corporation (GreenTech Malaysia in Bandar Baru Bangi, Malaysia), the Low Carbon Cities Framework (LCCF) was launched in 2011 in order to guide and assess the growth in urban cities along with the support towards the sustainable development in Malaysia [43,45]. The main objective of LCCF is to reduce the carbon emission from urban cities, which contribute 70% of the overall emission within the country, which looks into the energy usage, petrol vehicles, and solid waste management. In 2018, 33.5% was from the local authorities that had participated in the LCCF framework assessment. Under this assessment, there were several activities proposed in reducing the carbon emission within several cities of Malaysia. Overall, there were 19 participants from 7 different locations. The seven locations were Majlis Bandaraya Shah Alam (MBSA), Majlis Perbandaran Klang (MPK), Majlis Perbandaran Seberang Prai (MPSP), Majlis Perbandaran Subang Jaya (MPSJ), Majlis Perbandaran Hang Tuah Jaya (MPHTJ), Universiti Malaya (UM), and Universiti Teknologi Malaysia (UTM), which presented on their low carbon action plan and succeeded in reducing carbon emissions, as shown in Figure 4a,b. Through the LCCF assessment, it was recorded that the total carbon emission from the 7 locations was reduced to an estimated percentage of 62.35% through several initiatives, which were conducted by the local authorities in its respective area, as shown in Figure 4b. Despite having the most initiatives conducted through the LCCF assessment, the carbon emission reduction of the respective area (6.15%) was found to be significantly low as compared to MPK (17.7%), MPSJ (15.1%), and MPHTJ (9%). UM was recorded as the lowest among the 7 participating locations, which is below the average with a percentage of 1.8%.
From the following study, there are a few factors that need to be considered on the effectiveness of the carbon emission reduction. The initial factor would be the demographic of the sample area, which considers the environment of work and living lifestyle that leads to a significant impact on the energy demand. Next, the consideration of the geographical location plays an important role in determining the feasibility of renewable technology deployment within the sample area. Lastly, more participation from public local authorities could contribute to a larger impact in reduction of carbon emission by following proper energy saving tips and taking part in any environmental-related campaign, such as recycling, planting trees, and zero-waste management.

2.2. Renewable Energy

An alternative generation that relies on only natural sources or any process that are constantly available are defined as renewable energy (RE) [46]. Up to date, there are five prominent renewable energies, which consist of solar, wind, hydro, geothermal, and biomass [2,47,48,49]. With the current technology present in the distribution system, industry players are keen to look into the sustainability of energy sources in tackling the scarcity of fossil fuels and at the same time to generate electricity under a zero-carbon emission level. Renewable energy may be a huge trend in the present, but due to the low generation capacity of RE sources, the question remains on the capability of RE in phasing out the existing fossil fuels in the next few years. The authors of [35] predict that the demand of renewable energy could exceed more than a trillion watts in the upcoming five years. The over demand of renewable sources is identified and has been concluded through several key factors on its driving potential in replacing fossil fuels, environmental impacts, and positive economic growth of a country [2,15,32]. Thus, the support of the government in promoting the concept of green energy with an expected drop in technology prices of renewables contributes to the upcoming growth of the energy sector, and is very encouraging in the near future [50]. Through the implementation of policies and regulations, it will encourage the industry sector and public to play a role in the sustainability of a cleaner energy in later years. At the moment, solar, hydro, and biomass are listed as the well-known renewable sources in Malaysia due to the climate, abundance of raw materials, and its geographical features. For wind generation, according to the report in [51], it is implied that an estimation of 500 to 2000 MW of electricity could be harnessed from wind energy in Malaysia, which meets the demand of between 3.5% and 14% of power generation in the year 2020. However, it was further mentioned that low wind speeds could only be seen throughout the year, which is lesser than 5 m/s on average [51]. The capability of wind generation could be seen during the monsoon season, which occurs only in a certain period of the month, which varies with the geographical location of Malaysia [52]. Therefore, it is insignificant to consider both wind and geothermal RE towards the energy mix in Malaysia. Hence, a detailed comparative review on the trends, initiative, and breakthrough of RE, namely photovoltaics, hydropower, biomass, and energy, in Malaysia and other countries will be further discussed in the subsection below.

2.2.1. Photovoltaics

Under mass production of solar photovoltaic panels (PV), the future prospects of solar generation are taken positively throughout the renewable market and industries [8,53]. Photovoltaic technology has been one of the potential renewable sources able to provide an affordable electricity system, and clean and scalable technology as compared to other renewable sources [54]. At the moment, China, Taiwan, the USA, Japan, and Germany are the leading manufacturers of solar panels in the world [54]. In 2017, China installed 53.3% of the world’s total solar capacity, which is followed by India, which accounts 10% of the overall generation [55,56]. This makes China one of the notable countries specifically in solar technologies, where the country itself dominates 60% of the PV production in the world market [50]. The prospect of solar renewables is very promising due to the declination price of raw materials in solar production [9,50]. Hence, large-scale generation of solar -based power has started to gain more attraction in the Middle East, North Africa, and countries within Asia [57,58,59]. The initiative to promote solar energy may come in various approaches and target audiences. Benefits and incentives given vary in different forms and places. Some initiatives and incentives to promote solar energy are PV installation discounts, higher rates on feed-in-tariff (FiT) and net energy metering (NEM) schemes, cost effectiveness between RE generators and utility companies, and lastly the encouragement of more research and development in improving the existing RE technologies [54,60,61]. Table 1 shows some of the initiatives that the governments of different countries have set to encourage the public and their direction on solar renewables.
Solar energy has been a very well-known renewable source in Malaysia due to its annual tropical weather [14]. With an average irradiance of 4000–5000 Wh/m2, Malaysia is capable of harnessing an average of 4–8 h of electricity generated from PV panels in a day [62]. In relation to this, several initiatives have been proposed by the government to promote solar energy, such as providing tenders on a large-scale solar (LSS) program and the introduction of roof-top solar projects in commercial and residential areas [14,36]. LSS is an arrangement of competitive bidding to reduce the levelized cost of energy (LCOE) under the development of PV plants [47]. Until 2019, there were three cycles of bidding awarded by the Energy Commission, which offers up to 370–500 MW PV generation scale [19]. Besides the LSS program, there were initiatives encouraging the public to install solar panels on the rooftop of their houses or premises [46,63,64,65]. Under the roof-top installation initiatives, it would allow any excess generation from the PV to be fed back into the grid. This eventually would benefit in terms of increasing the transmission efficiency between the source and load, reducing fossil generation during peak hours, and indirectly mitigating the possible risk of voltage fluctuations in the distribution network. By introducing the two programs mentioned earlier, this would reduce the carbon emission of the fossil fuel generation, providing more job opportunities and boosting the country’s economy.

2.2.2. Hydropower

Hydropower is a form of renewable source that converts the flow of water to electricity. It was recorded in 2016, whereby the hydrogeneration accounted for 71% of the total renewable generation in the world [6]. Hence, hydropower is often being used during peak-shaving purposes within the power grid due to its ability to respond to demand fluctuations compared with other generation sources [66]. Besides this, the conversion efficiency of a well-operated hydropower can reach up to 85% as the process is directly converted from a form of mechanical work (turbines) to electricity [20]. In addition, the dams of the hydropower can be used to reserve water supplies and flood control [6]. European countries, such as Switzerland, favor the construction of hydropower plants due to its climate and topology, and they successfully contributed 36.4% of the total electricity generation in 2015 [66,67].
Unfortunately, as indicated in [6], an estimated number of 546 dams were removed from the USA in the years between 2006 and 2014. This amount kept increasing in some parts of the European countries, which have constantly removed their dams. The reason for this is due to an unbearable cost of dam construction, geological dependencies, and disruption of the ecological environment [2,66]. The construction of larger dams possibly serves the growing population in a high-demand urban city. However, this causes dissatisfaction within rural communities, whereby the construction of dams would disrupt their lands [6]. Thus, this consideration has led to a more small-scale hydropower technology. Europe has installed a large number of small-scale hydropower under the capacity of 10 MW with low operational cost. With the embarking potential of these smaller hydropower, it manages to supply 13 million households and manages to secure low carbon emission [2]. Run-of River (RoR) is another type of small-scale hydropower that runs on a river, supplying electricity to its nearest consumer. RoR benefits in terms of ecological migration of the local communities, lesser impact towards the environment, and a high return of investment.
In 2014, hydropower was the leading RE source, with 83.24% of the RE generation capacity, which contributes to 15.9% of Malaysia’s total energy production [20]. An average annual rainfall of 2540, 2630, and 3850 mm3 was recorded in Peninsular, Sabah, and Sarawak, making the potential of hydropower viable in the country [2,20]. It is undeniable that hydropower plays a major role in the country’s energy mix as one of the promising RE sources aside from solar [20]. However, due to an improbable cost of large hydropower construction with a long period on return-of-investment, Malaysia is looking forward to small hydro technologies at the moment [14,36]. Under the 4th to 11th Malaysian Plans, which were established in 1981 to 2020, an initiative on rural electrification was emphasized, which aims to provide electricity via mini-hydropower for rural areas [20]. In 1982, small hydro pilot projects were installed with the capacity of 6225 kW, ranging from 25 to 1870 kW per unit. To promote small hydropower among private sectors, there were a few incentives proposed under the Small Renewable Energy Program in 2001 [12]. The program focuses on having a small renewable power plant to sell electricity to the grid with a maximum generation capacity of 10 MW. Under the program, 87.7 MW or 30% of the projects are all based on a mini hydropower project. FiT schemes were introduced later in 2011, which enlist Feed-in Approval Holders (FIAHs) to sell renewable energy to the grid under a set of rates depending on the RE capacity [63].

2.2.3. Biomass and Bioenergy

It was reported in [72] that 1.6 billion tons of food and waste products are discarded annually, with an amount of USD 2.6 trillion losses estimated across the world. As a result, the waste product also accounts for 4.4 giga-tons of CO2 emission annually. Under circumstances where waste is beyond control, possible ideas and methods were proposed to utilize the food wastage into something more significant and to reduce food wastage at the same time. Hence, to provide an answer to the following problem, bioenergy has been introduced to reduce wastage problems. Bioenergy is one of the strategies adopted by most countries, which turns organic waste product into a form of energy in supporting the daily needs whether in the transportation sector, generation of electricity, or in a form of heating application [73,74]. The process of thermochemical conversion produces biofuel, which is commonly used for transportation fuels. Biogases that are often used for electricity generation are converted by biochemical decomposition from the organic waste [75]. Through this method, the processed product in the form of fuels and gases could be utilized by the consumer. Bioenergy is categorized as a renewable source, which requires a combustion process to generate electricity, which bears a similar characteristic to conventional fossil fuels. According to the International Renewable Energy Agency [76] in 2012, Europe and North and South America have 85% of the total capacity installed globally, which represents a figure of 1.2% of the total generation capacity in the world in 2010. At the moment, bioenergy has contributed more than 2 MW of the total generation capacity in 2016 [74]. In Europe, several policies have been made that hope to fulfil the sustainability on their Renewable Energy Directives in 2009 and to encourage more deployment of renewables in Europe [17].The notable mentions of this policy specify the requirements and scheme of bioenergy under this policy to maintain the sustainability of the environment. Biofuels are required to meet the minimum GHG savings of 35% as compared to fossil fuels, which increased from 50% in 2017, followed by 60% in 2018. The policy mentioned the sustainability of GHG saving criteria for biogases under the installation capacity of 0.5 MW in 2020 [17]. Aside from a restriction on carbon emission, the policy includes benefits and initiatives to encourage the use of bioenergy sources, which propose the FiT and FiP (feed-in-premium) scheme as well as providing tenders and grants on renewable sources [17]. With this, the policy enforcement on carbon emission aims to ensure the sustainability of the environment and at the same time, to encourage more RE sources to grow in the country.
Malaysia produces 168 million tons of organic waste per annum, which includes palm oil, rubber, sugarcane, and coconut waste [14,73]. Being one of the largest palm oil producers globally, Malaysia produces 71.3 million tons of waste solely based on palm oil [73]. With an abundance of organic waste from the agriculture plantations, biomass was introduced as one of the major RE generations in Malaysia. Biomass accounted for 1.8% of the total energy mix generation of Malaysia in 2010. To date, Malaysia has a total capacity of 104.45MW of biomass power plants successfully installed across the country [12]. Waste-to-energy (WTE) initiatives were one of the concepts introduced by the government in converting waste products into steam to power the turbines. The initiative tends to mitigate landfill problems and at the same time, to preserve the environment [36]. From this, the prospect of bioenergy in Malaysia is favorable in RE generation.

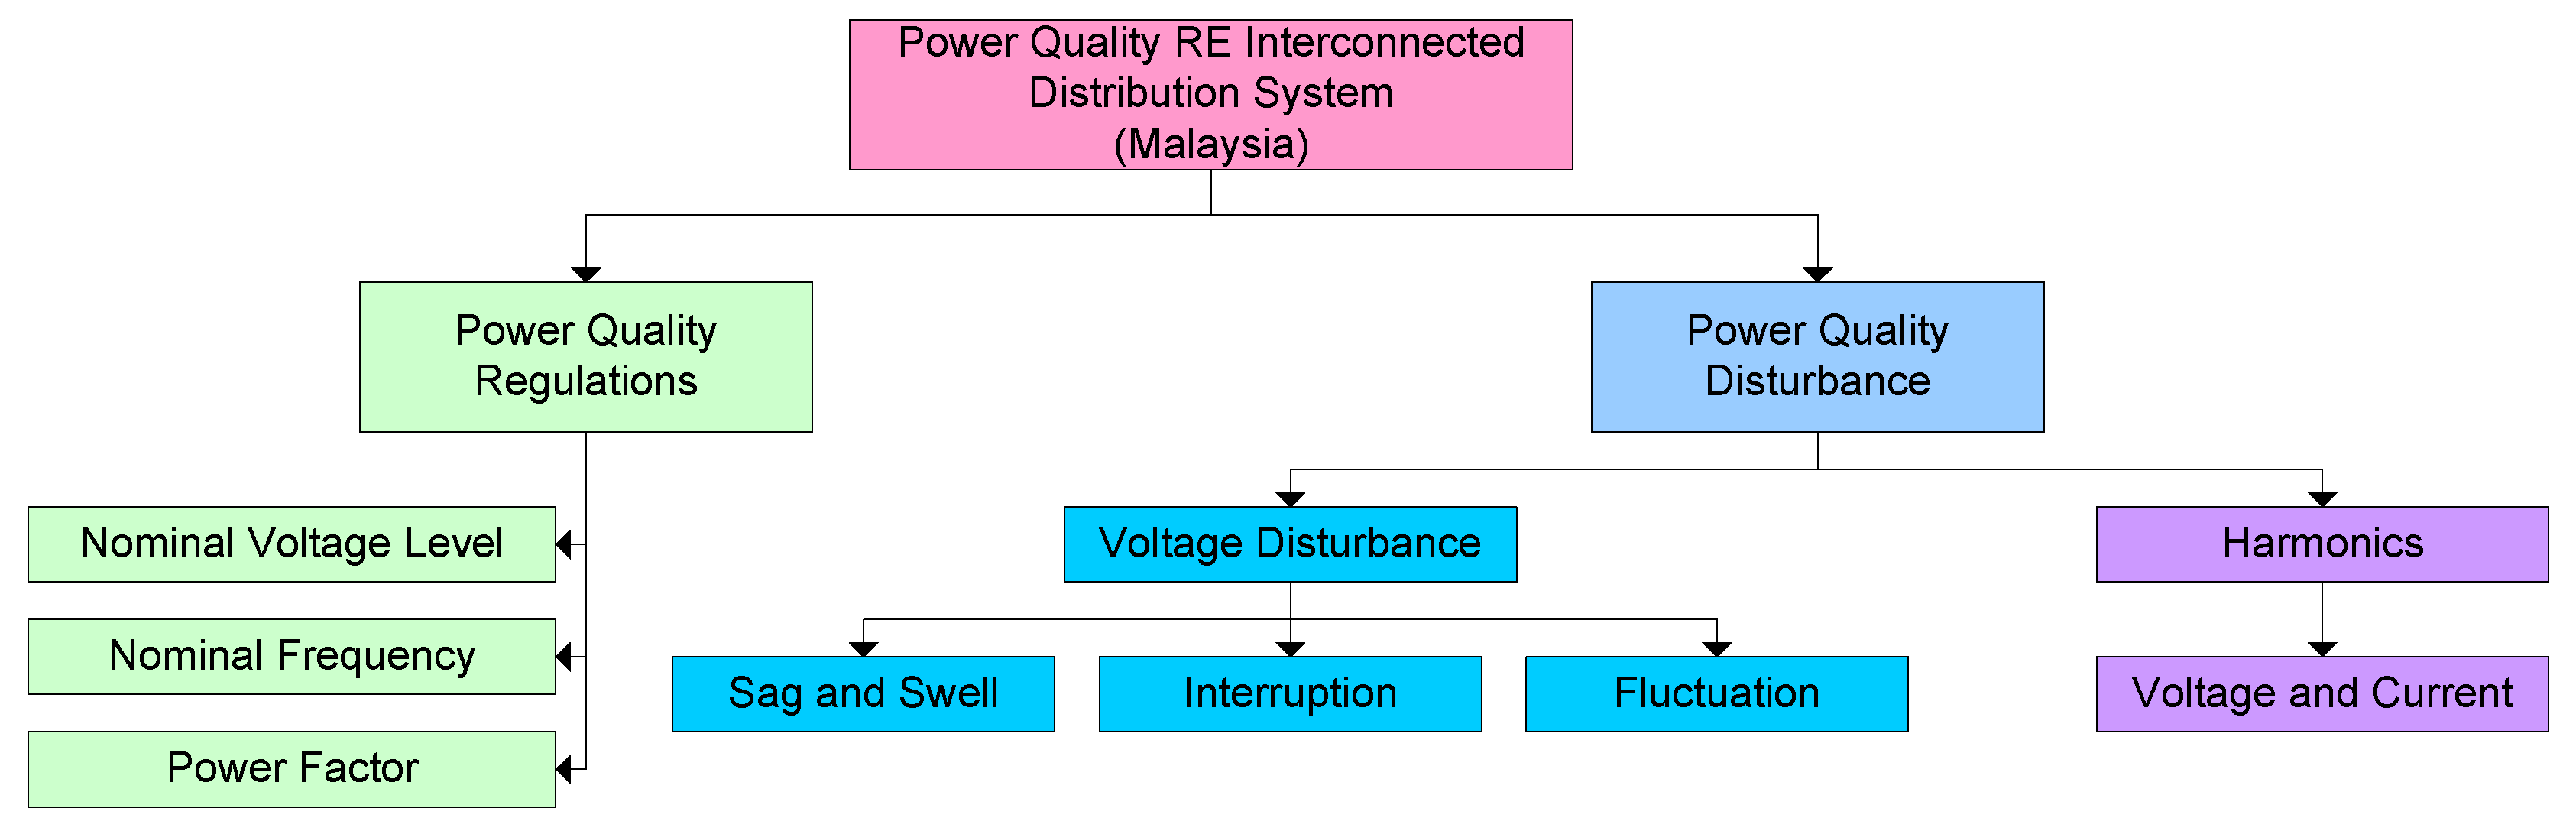
3. Power Quality Issues in Grid-Integrated Renewable Energy Sources (RESs)

The ineffective power delivered to the consumer is often associated with power quality issues. As more renewable sources are integrated along with the traditional grid system, power quality problems are more distinct if it remains unattended [77,78]. Consequently, with a rapid establishment of distributed generation without proper planning, there might be possibilities of over- or under-generation from the renewable sources to the grid [32,79]. Solar renewable is one of the heavily environment-dependent RE generations as it could only achieve its maximum generation point in a certain period of time. This makes solar generation very unreliable in achieving constant generation as compared to hydro and biomass. Renewable penetration refers to the ratio of renewable generation with respect to the total energy generation. The penetration level is observed to be more precipitable when it is above 15% [54]. At the moment, the problem of inconsistent RE generation is still a concern to the electrical utility in scheduling the primary generation capacity, especially within the residential areas. The term duck-curve comes into place, whereby in the afternoon, the generation of PV achieves its highest peak to a lower load demand; likewise, lower PV generation when there is a high demand in load [80]. Under circumstances, if there were a large number of installed rooftop PVs in the residential area, it would lead to a major breakdown due to voltage instability. Aside from the penetration level, PVs are also prone to intermittency issues. Under circumstances of undetermined climate conditions and sudden changes in weather conditions, this causes voltage fluctuation or flickers in the grid. Intermittency of renewable generation could be predictable based on the average weather climate in a day; however, it may not be possible for sudden power dispatching to meet the demand of the load.
Hence, the enforcement of power quality standards was introduced, which serves as a guideline to prevent any possible effects of unwelcome events from occurring within the grid network and the grid integration of renewable sources. The common power quality regulations and disturbances, which are shown in Figure 5, within an RE interconnected distribution system will be discussed in the subsection below.

3.1. Voltage and Frequency Regulations

The nominal range for the LV supply in Malaysia would be 230/400 V with a tolerance of +10%, −6%, which follows the MS IEC 60038 standards [81]. The nominal frequency (50 Hz) on the same network is permitted to fluctuate less or equal to ±1%. The following standard is applied to all forms of source, which is interconnected within a normal condition of a main low-voltage distribution grid.

3.2. Voltage Disturbance

In distribution networks or a distributed generation, the most encountered power quality issues are voltage interruption, voltage sag, and voltage swell [82]. As defined in IEEE 1159-1995 [83,84], voltage sags and swell are a type of power quality problem that occur when there is an increase or decrease of its root mean square within a half cycle to a minute. A short decrease in power supply or load current to less than 10% of the nominal voltage in less than one minute is often classified as an interruption [85]. Voltage sag often causes tripping issues, overheating of inductive equipment, flickering of light, and damage to sensitive electronic device. On the other hand, voltage swell leads to overheating of equipment and damage to the insulators, especially transmission cables. If the problem persists for a longer period of time, this will lead to longer voltage dynamic variation of the sustained interruption, and over- and undervoltage concerns [84]. Thus, an overall summary of the PQ issues of voltage sag, swell, and interruption is presented in Table 2.
Environment-dependent RE technology, such as solar and wind, is prone to the effects of voltage fluctuations. Therefore, when there is fluctuation present in the grid, overvoltage relay will trip off to protect the inverter [88]. However, for this reason, this would not be feasible as it would indirectly compromise the availability and reliability of PV generation in the distribution grid system. To prevent frequent tripping of the inverter in the distribution network, SEMI F47 and IEEE 1547 was introduced to ensure all electronic equipment stays connected within a tolerable percentage of low-voltage ride through (LVRT) [89,90].

3.3. Harmonics

Voltage source converters (VSCs), variable frequency drives (VFDs), and uninterruptable power systems (UPSs) are examples of the common non-linear loads that present in the distributed generation system. The behavior of drawing a non-sinusoidal current exhibited by the non-linear loads will invoke the presence of harmonics. Electrical harmonics waveform is a period of wave consisting of a fundamental frequency of either voltage or current, which results in the production of a waveform distortion under repetitive waveforms under multiple frequencies [91]. By applying the Fourier series analysis, a mathematical representation of the harmonic sequence is shown in (1) [92]:
y ( t ) =   Y 0 + h = 1 h = Y h 2 sin ( h ω t   φ h )
where Y0 is the value of the fundamental frequency of either the voltage or current; Yh is the root mean square value of the harmonic order of h; ω is the angular frequency, which is also represented by 2πf; and φh is the displacement of the harmonic component when t = 0. The presence of harmonics can cause damage to the equipment in the grid system. Overheating of the equipment and cable wires is one of the effects of harmonic distortion [93]. In the grid system, the most significant causes of the harmonic are due to the operation of the non-linear device or loads [33,94]. The characterization of the harmonic waveform is presented in a ratio, which is often represented with the term of “total harmonics distortion” or THD level. Total harmonic distortion is often expressed in the form of either voltage or current, vTHD and iTHD. The following equations of the THDs are presented in (2) and (3), respectively [95]:
v T H D ( % ) = 100 %   × V 2 2 + V 3 2 + V 4 2 + V n 2 V 1 2
i T H D ( % ) = 100 % ×   I 2 2 + I 3 2 + I 4 2 + I n 2 I 1 2
Different devices or applications will have a certain permittable tolerance of the level of harmonics to ensure the effects of voltage or current harmonics would not cause any disruption or damage to the grid system and devices. The permissible THD in the Malaysian distribution grid system follows the standards of IEC 61000-3-4, IEC 61000-3-6, and IEEE 519-91 [91]. The following permissible THD for current is shown below in Table 3. As for bus voltages, which lie between the range of 0.23–69 kV, the permissible voltage THD should be lower than 5% at the point of common coupling (PCC) [91].

3.4. Power Factor

The permissible lagging power factor in the Malaysian distribution system states that the power factor in industries and commercial taking in a supply of less than 33 kV should be more than 0.85 and a supply of more than 132 kV should maintain its power factor at 0.9 [96]. This is to ensure that there will be no penalty imposed to the industry players, subsequently prolonging the lifespan of the equipment. Normally, in residential loads within the distribution system, the power factor is not a huge concern as the resistive loads are larger compared to inductive loads. According to [97], the implementation of a more renewable source in a distribution network contributes to a significant drop in the power factor. Under a high penetration level of renewable sources, the excess generation will inject more active power into the grid system, which indirectly causes the change in the reactive power flow in the distribution network [98]. With the integration of renewable sources in the current distribution network, it is essential to maintain a good power factor by deploying power compensation devices or capacitor banks to maintain a good power factor.

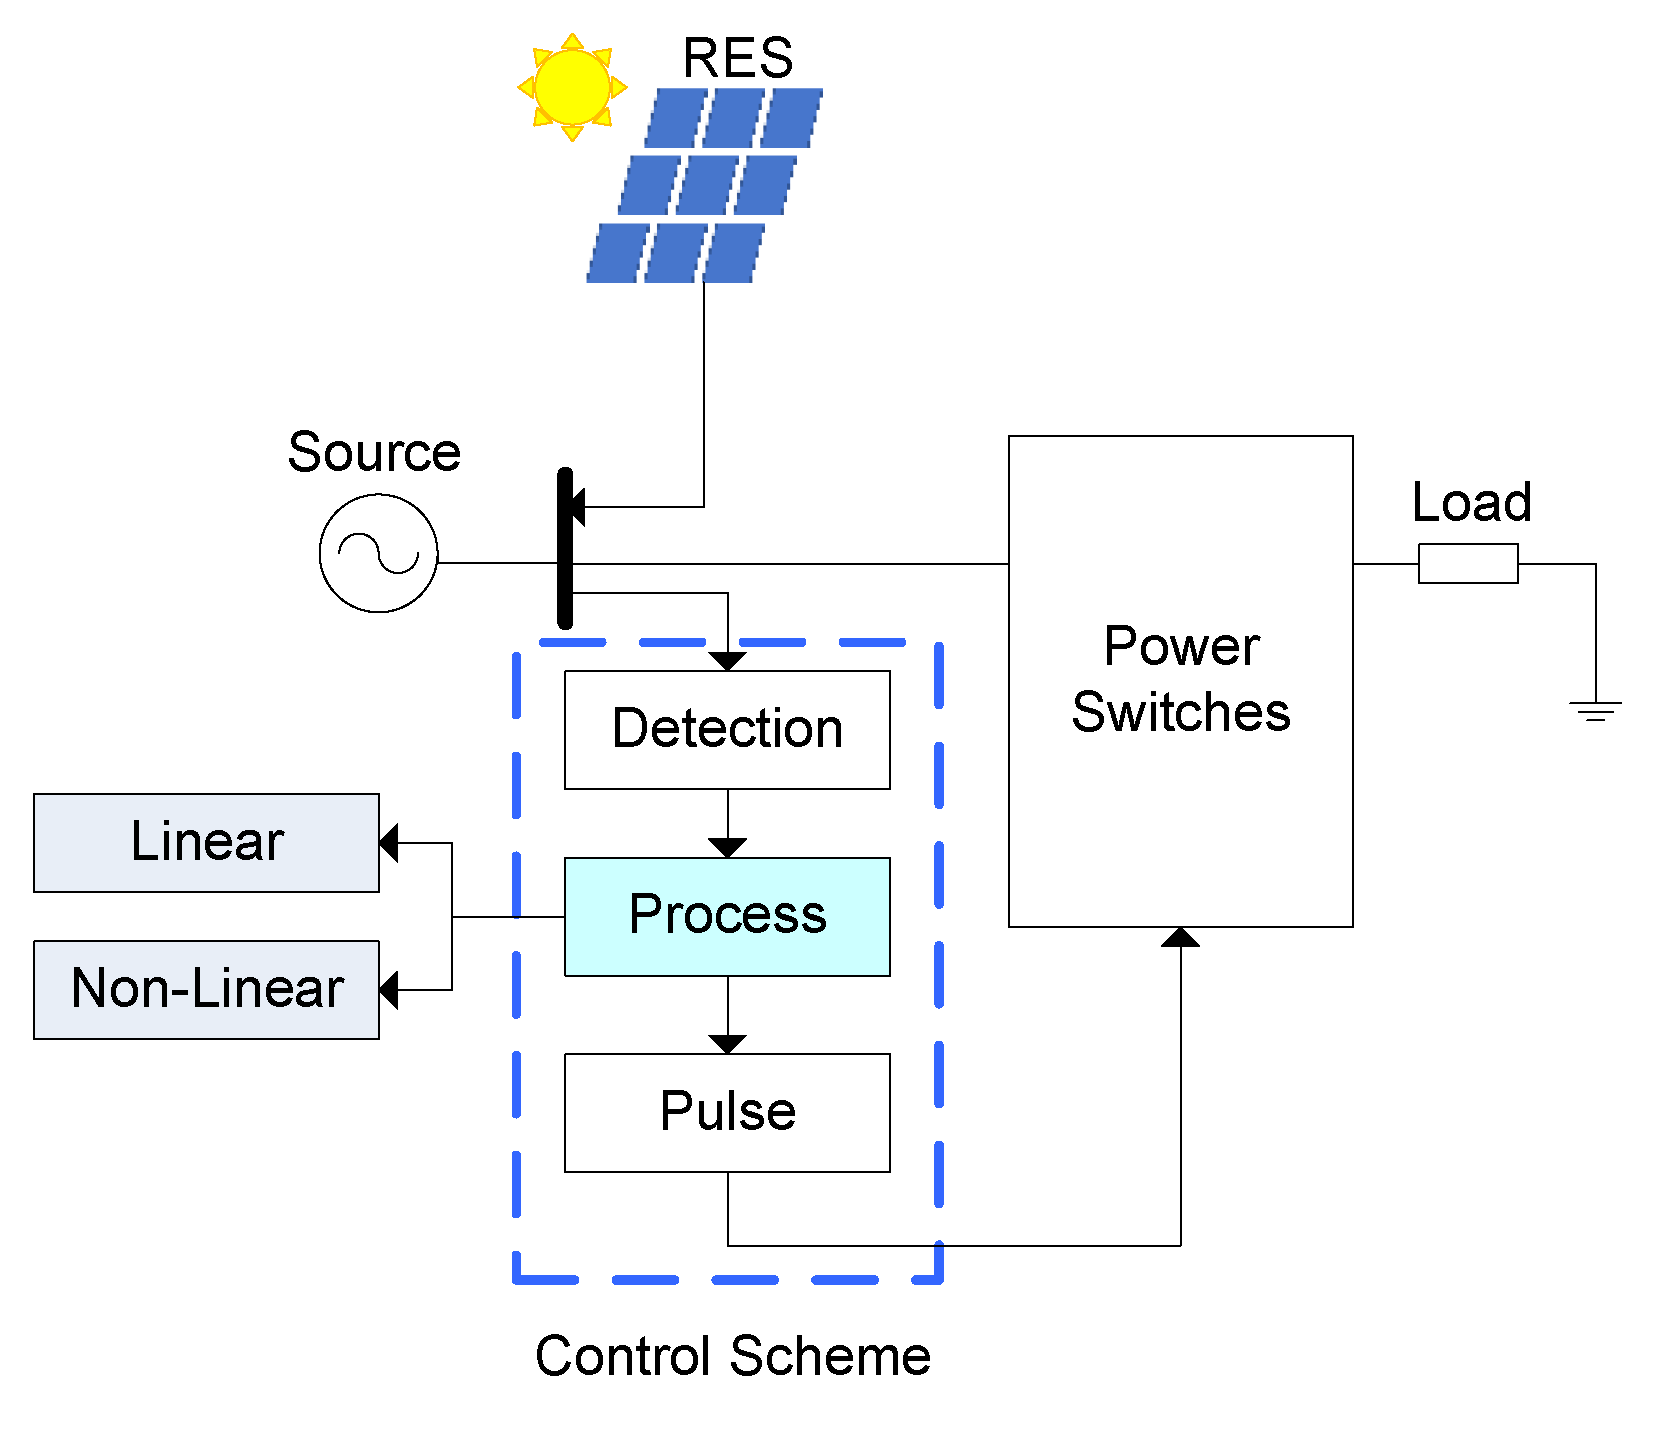
4. Power Quality Correction Device and Its Control Methods

Looking back to the development of distributed generation in recent years, power quality issues are not severe due to the low penetration of renewables in Malaysia. As renewable technology is getting more mature in the distribution network, power quality issues should not be taken lightly. It is important to maintain good-quality power, which would prolong the lifespan of the equipment, ensure the stability of the grid system, and improve the efficiency of the power transfer from source to load [99,100]. With the current prospect of renewable source deployment and a significant increase in the load demand within the distribution network, power compensation device is favorable in order to prevent any voltage instability, harmonic distortion, and low power factor caused by the high RE penetration or intermittency. Thus, a smaller-scale distribution power compensation device is deployed within the low voltage-grid system to solve the addressed matter. On top of this, deployment of a distribution compensation device is very encouraging with an increase in performance and decrease in the purchasing price of power electronics along with the growth of the market demand. Currently, there are more studies on the enhancement of power compensation devices to improve the performance and the assurance of strengthening energy security within the network [101]. Therefore, in the following subsection, the characterization of PQ compensation devices namely series, shunt, and series-shunt compensator, is presented on its construction topology, followed by current control strategies of the PQ compensator within the grid-interconnected RES network.

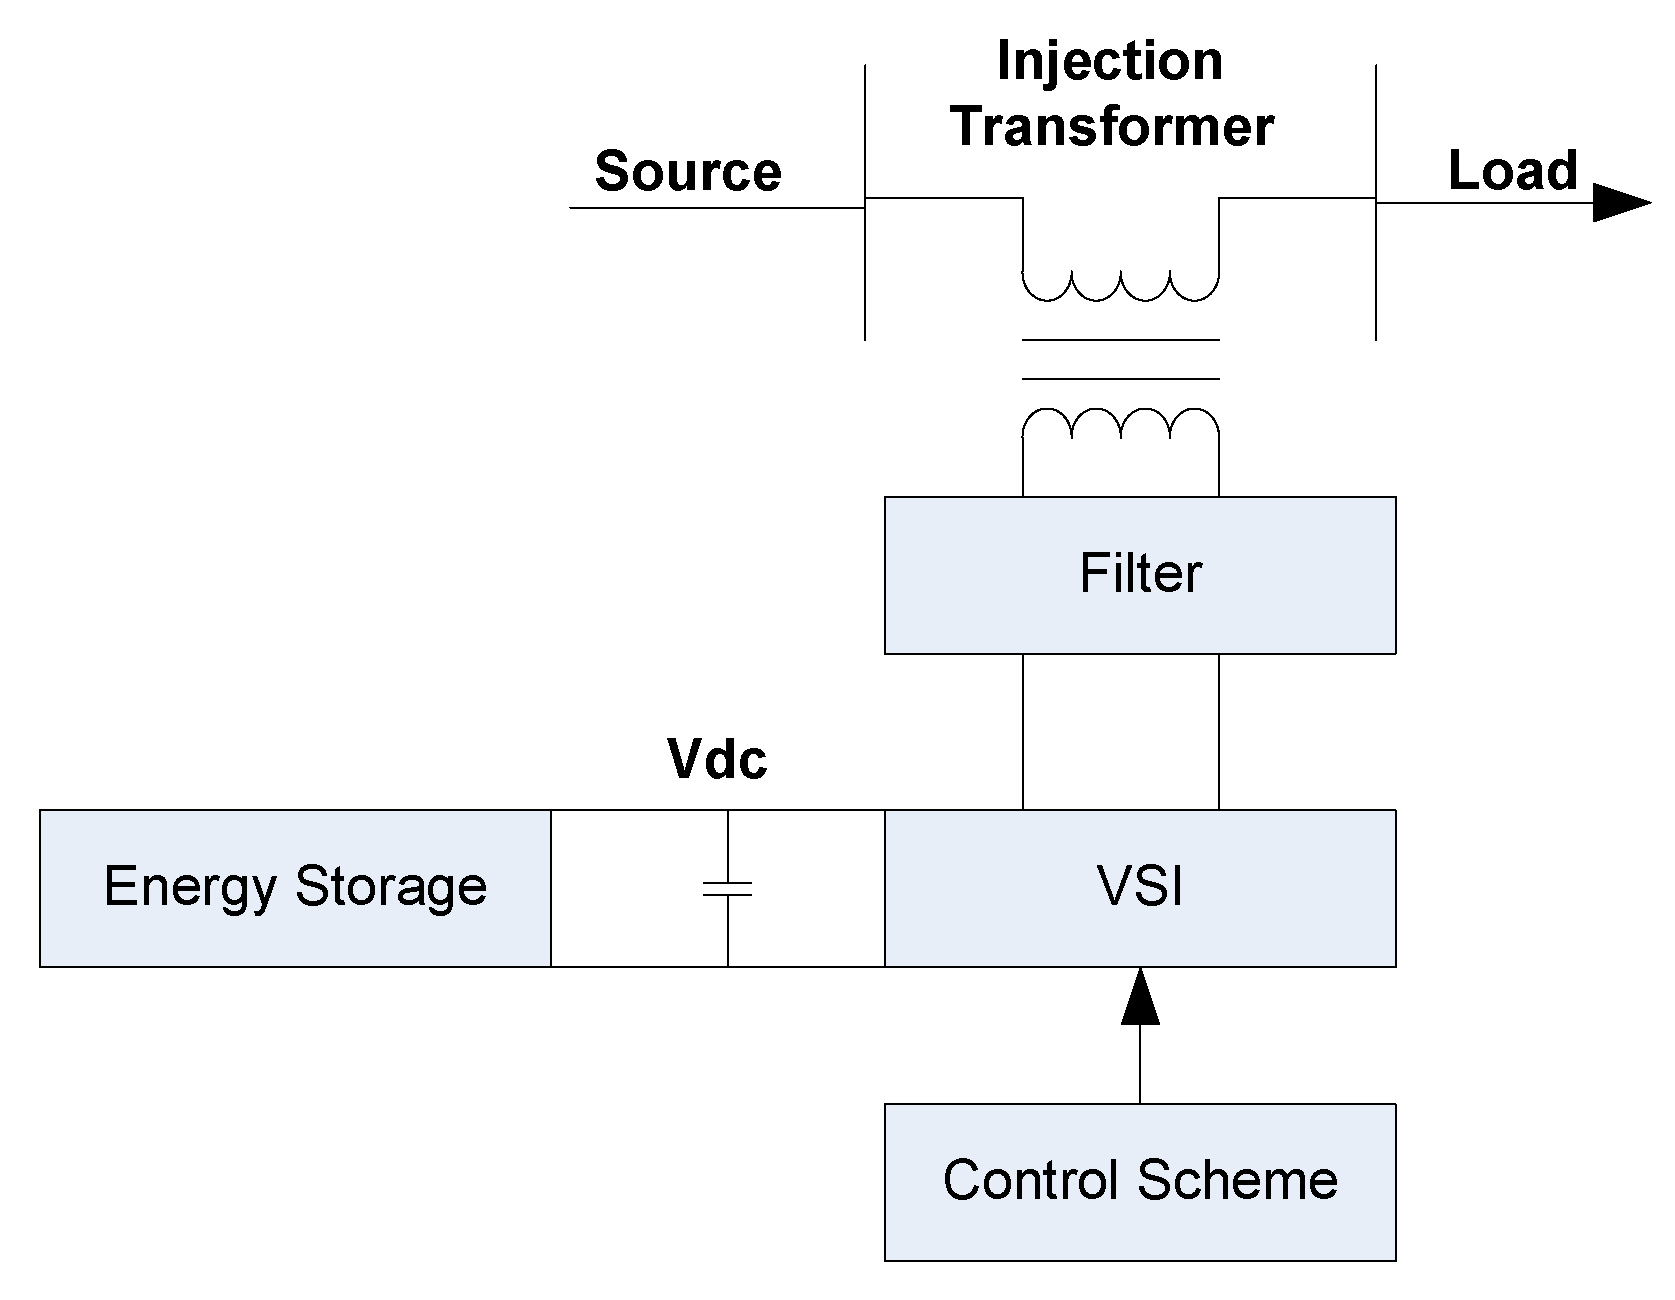
4.1. Series PQ Compensator

A dynamic voltage restorer (DVR) is classified as one of the power compensation devices, which is a connected series in the distribution network, as shown in Figure 6. A DVR consists of a few main components, the function of which is described as follows:
  • Injection transformer—The function of an injection transformer is to inject the desired voltage magnitude when there is the presence of voltage fluctuation, sag, or swell within the network.
  • Filter—The purpose of having a filter is to suppress harmonics either at the LV side (inverter) or at the HV side (load).
  • Voltage-Source Inverter (VSI)—A VSI performs conversion of AC/DC or DC/AC of the desired frequency and phase angle of the voltage source.
  • Energy Storage and Vdc (DC-Link)—Both energy storage and Vdc are essential in providing active power requirement for DVR during the presence of voltage sag or swell.
DVR is one of the robust power compensation devices as it can operate on two methods [103]. The first method is the reactive power injection technique, which is based on the load current angle. Despite this, the reactive power technique is not very appealing as the effect could be more significant if only the injected voltage is high. The second method is the active compensation technique, which could solve voltage fluctuation immediately by in-phase boosting from the energy storage. However, this method is expensive compared to the reactive injection technique. In recent advancements of DVR, a few improvements have been done in improvising the topology and improving the robustness of this compensation device. In [102], the work focused on the modification of a conventional DVR to be integrated along with a grid-connected solar system. The proposed work replaced the existing energy storage with PV panels to perform active compensation to solve single and three-phase fault within the grid system. It was concluded in the work that the proposed DVR topology successfully maintained the voltage level of the system at a value that is close to the nominal voltage level with an acceptable current THD level. In another work by [104], an interline DVR topology was presented, which combined two DVR in an adjacent feeder within the same network. On this configuration, it benefits in terms of a cost reduction of having two Vdc and a better power flow between two DVRs without any energy storage utilization via active compensation. Unfortunately, this configuration could not perform well on conditions of heavy over- or undervoltage due to the lack of an energy storage system.

4.2. Shunt PQ Compensator

The Static VAr Compensator is one of the prominent FACTS devices that uses the shunt compensation technique to maintain the stability of the voltage and offers power factor correction in a grid system [101,105]. The construction of the Static VAr Compensator device consists of a coupling transformer, which responds to an economic criterion at a higher voltage and to suppress the presence of current harmonics, followed by the thyristor-controlled reactor (TCR), fixed capacitor (FC), or a thyristor switched capacitor (TSC) in absorbing or injecting reactive power during compensation. There were also other shunt configurations, such as the thyristor switched reactor (TSR), where the reactor is placed before the switches. The working principle of the thyristor-controlled switches is that they are adjusted based on the firing angle, α, which varies from 90° to 180° to control the variation of the current in each half cycle [106]. There were also configurations, such as TSR and TSC, which only turn on by a 90° firing angle and off on a 180° firing angle. With only two mode of operation on TSR, it has limited scope of application as to compared to TCR. The main advantage of TSR is because it generates no harmonics unlike TCR, which invokes odd harmonics [107]. According to [108], TCR-FC benefits in terms of a larger operating range in reactive power generation due to the large increase of the branch of FC, unlike TSC, which only provides a limited number of steps or branches less than four depending on the number of the capacitor bank [107]. On the other hand, TSC benefits from rapid switching of larger capacitor banks in maintaining the stability of voltage instantly as compared to mechanical switches with lesser wear and tear. To yield a better result in power quality compensation, the combination on all shunt branches TSC, TCR/TSR, and FC is constructed to complement one another [108]. With the combination of TCR/TSR-TSC-FC on an SVC, as shown in Figure 7a, it could provide larger reactive power generation, good estimation of reactive power compensation based on selective switching steps from TSC, and lower power losses in the network. From the projection of costing analysis, this would significantly lower the capital costs on equipment sizing on losses and lower maintenance costs based on its previous configurations on SVC technologies [107,109].
Similar to SVC, a static synchronous compensator (STATCOM), as shown in Figure 7b, is one of the shunt-connected FACTS devices that compensates reactive power, which is modelled based on a synchronous motor where the capacitive and inductive element can be controlled by changing the voltage angle [111]. Unlike the shunt branches present in SVC, which makes it bulkier and requires a higher component rating in terms of compensation, the main component of the STATCOM is modelled based on the voltage source converter or a current source converter. A DC source is connected as part of the inverter to provide the VSI either current or voltage on STATCOM operation [110]. In reactive power injection, both active and reactive power within the grid are exchanged by the STATCOM, which regulates the difference on both of the power parameters to zero to achieve its desired output. The benefits of using a STATCOM as compared to an SVC is due to its smaller operational size, simplicity, and a lower THD level [111]. However, this would require a faster processing controller upon realizing the discussed merits earlier. Due to the rapid advancement of the shunt compensation technology present in the power system network, this leads to sightings of hybrid topology present within the power system network. The main objective of the hybrid technology is to compensate the high THD level and breakthrough of the reactive compensation cap of the previous SVC by presenting the combination of an active filter and STATCOM topology, respectively. In the following work proposed by [112,113], it focuses on the work in the modelling of a hybrid shunt-compensator (SVC and STATCOM) configuration with an active filter within the distribution feeder. Both had agreed that the hybrid topology yields better performance in current harmonics reduction, and a faster dynamic response with a lower requirement of the existing PQ compensation device.

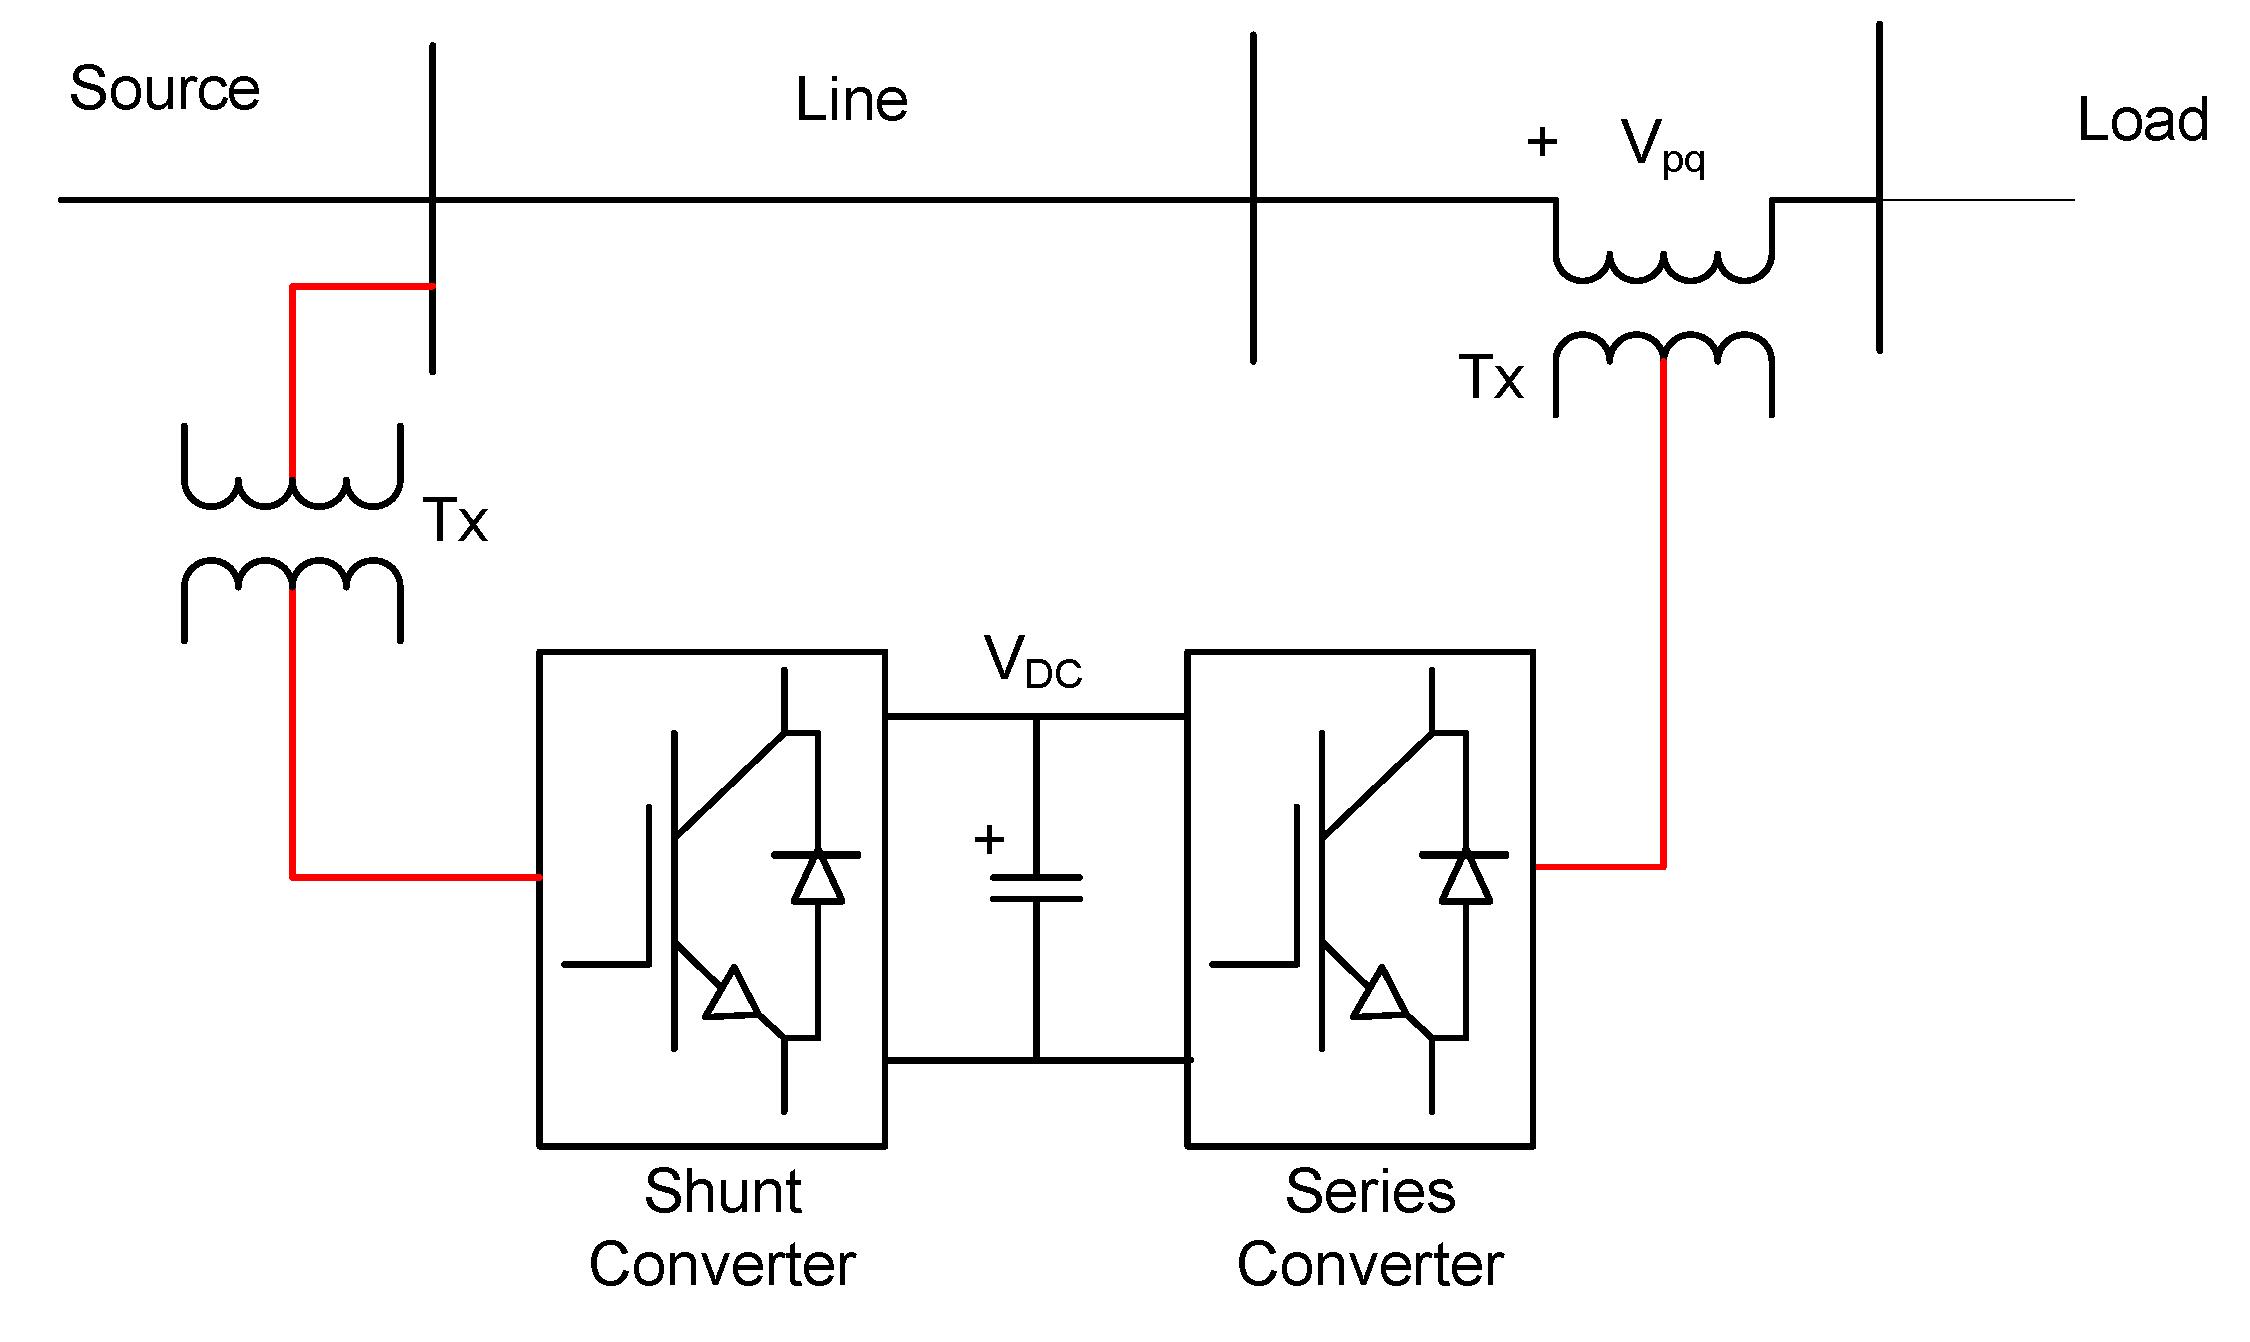
4.3. Series-Shunt Compensation Device

One of the well-known configurations of both series and shunt power compensation within the power system network is the unified power flow controller (UPFC), which is constructed through two transformers (series and shunt), two power converters (back-to-back), and lastly a DC link. Looking at the general topology of UPFC, as shown in Figure 8, there are two modes of operation of the UPFC (series and shunt) to perform power compensation simultaneously within the network [99,100]. In the operation of series configuration, the converter controls the voltage magnitude and phasor angle injection of the line from 0 to Vpq,max and 0 to 360 degrees, respectively. Any excessive real power or demand absorbed by the series converter will be stored at the DC link. On the other hand, the shunt converter converts demand from the DC link and sends it to the line through reactive power compensation in order to maintain the permissible line voltage. To summarize on the points earlier, UPFC has the capability of a series (static synchronous series compensator) and shunt (STATCOM) compensator in terms of power compensation, but it performs independently in power flow control on the transmission line [114].
Due to its unique characteristic in terms of power compensation and flow control, there is a recent finding on the deployment of UPFC within the distribution network/distributed generation. A comparative study on the reactive power compensation in a wind power plant conducted by [114] in analyzing the performance of both STATCOM and UPFC in voltage loss reduction during the events of faults within the grid system. It was shown that UPFC achieves a higher compensation of voltage losses as compared to STATCOM while both of the power compensation devices are able to keep the wind turbine running normally. In another work on voltage instability mitigation in a wind energy system machine, [115] proposed a hybrid isolated power system through implementation of a UPFC power compensation device. The outcome of the proposed work met its objective in terms of reactive power stabilization and was able to assist in mitigating reactive power crowding and voltage deflection.

4.4. Control Strategies for PQ Compensation Device

The PQ compensation device is commonly modelled based on three major components, which are the topology of switches, network grid system (DG or distribution network), and lastly, the control scheme. To correspond with power quality issues or faults on the power system network, the control scheme plays a vital role in deciding, optimizing, and regulating based on the behavior of the grid system in attending the mentioned problems. From Figure 9, the breakdown of the control scheme is divided into three parts, which are the detection scheme (input), process control (process), and pulse generation (output).
In the past, the advancement of control schemes is fairly low as most of the switching process is done mostly by manual operators in resolving PQ problems [116,117]. To consider most of the repetitive events, safety issues and emerging technology that occur within the current grid system, numerous studies on the control scheme have been welcomed at present. To date, there are two categories of process control strategies, which are the linear and non-linear control strategy of the PQ compensation device, as shown in Figure 10.
For many years, most of the PQ compensation devices have worked on a linear control method due to its simplicity, faster response time, and lower noise. However, this would not be practically applicable as there are more non-linear loads, switches, and renewable source present within the grid system. Therefore, there are eminent studies revolving on the non-linear control strategy which is able to cope with intermittency of renewable generation and transitioning of a different load that is unbound to any period of time. Under a few selective studies of PQ compensation devices that were conducted, (i) p-q theory, (ii) adaptive (ACS), (iii) model predictive (MPC), (iv) artificial intelligence (AI), and (v) sliding mode (SMC) are adopted as the most popular non-linear PWM control strategy in mitigating power quality issues. Fundamental frequency switching (FFS), on the other hand, is one of the non-linear modulation techniques that reflects based on changes in frequency. The following control technique, which is summarized in Table 4, on a non-linear control strategy is further explained in the subsection below.

4.4.1. p-q Theory

Conventionally, the instantaneous power theorem has mostly been applied in PQ compensation devices in solving the power quality disturbance of a grid system under a non-linear condition. Among the notable strategies of the universal set of power would be the p-q theorem. However, it was mentioned in [119] that instantaneous reactive power (IRP) would not be able to compensate loads under voltage distortion at the point of common coupling (PCC). To consider the possible integration of RES within the traditional grid system would either require a better control technique or algorithm to attend the mentioned issue. In the work proposed by [128], they aimed to mitigate the harmonics of both the current and voltage at PCC by using a DSTATCOM. Similar to the conventional modelling of the p-q theorem as shown in Figure 11, the work started by obtaining the voltage at the PCC together with the load line current. This is followed by Clarke’s transformation to obtain the αβ coordinate in order to calculate the real and imaginary power of the load. Lastly, the inverse transform of p-q theorem is used to compute the αβ coordinate currents. The obtained current component is then set as the reference current for the compensator after removing the fundamental frequency components via a high pass filter. By applying the proposed technique through formulation of power factor components and instantaneous power, it demonstrates the capability of harmonics suppression despite the presence of voltage harmonics in PCC.

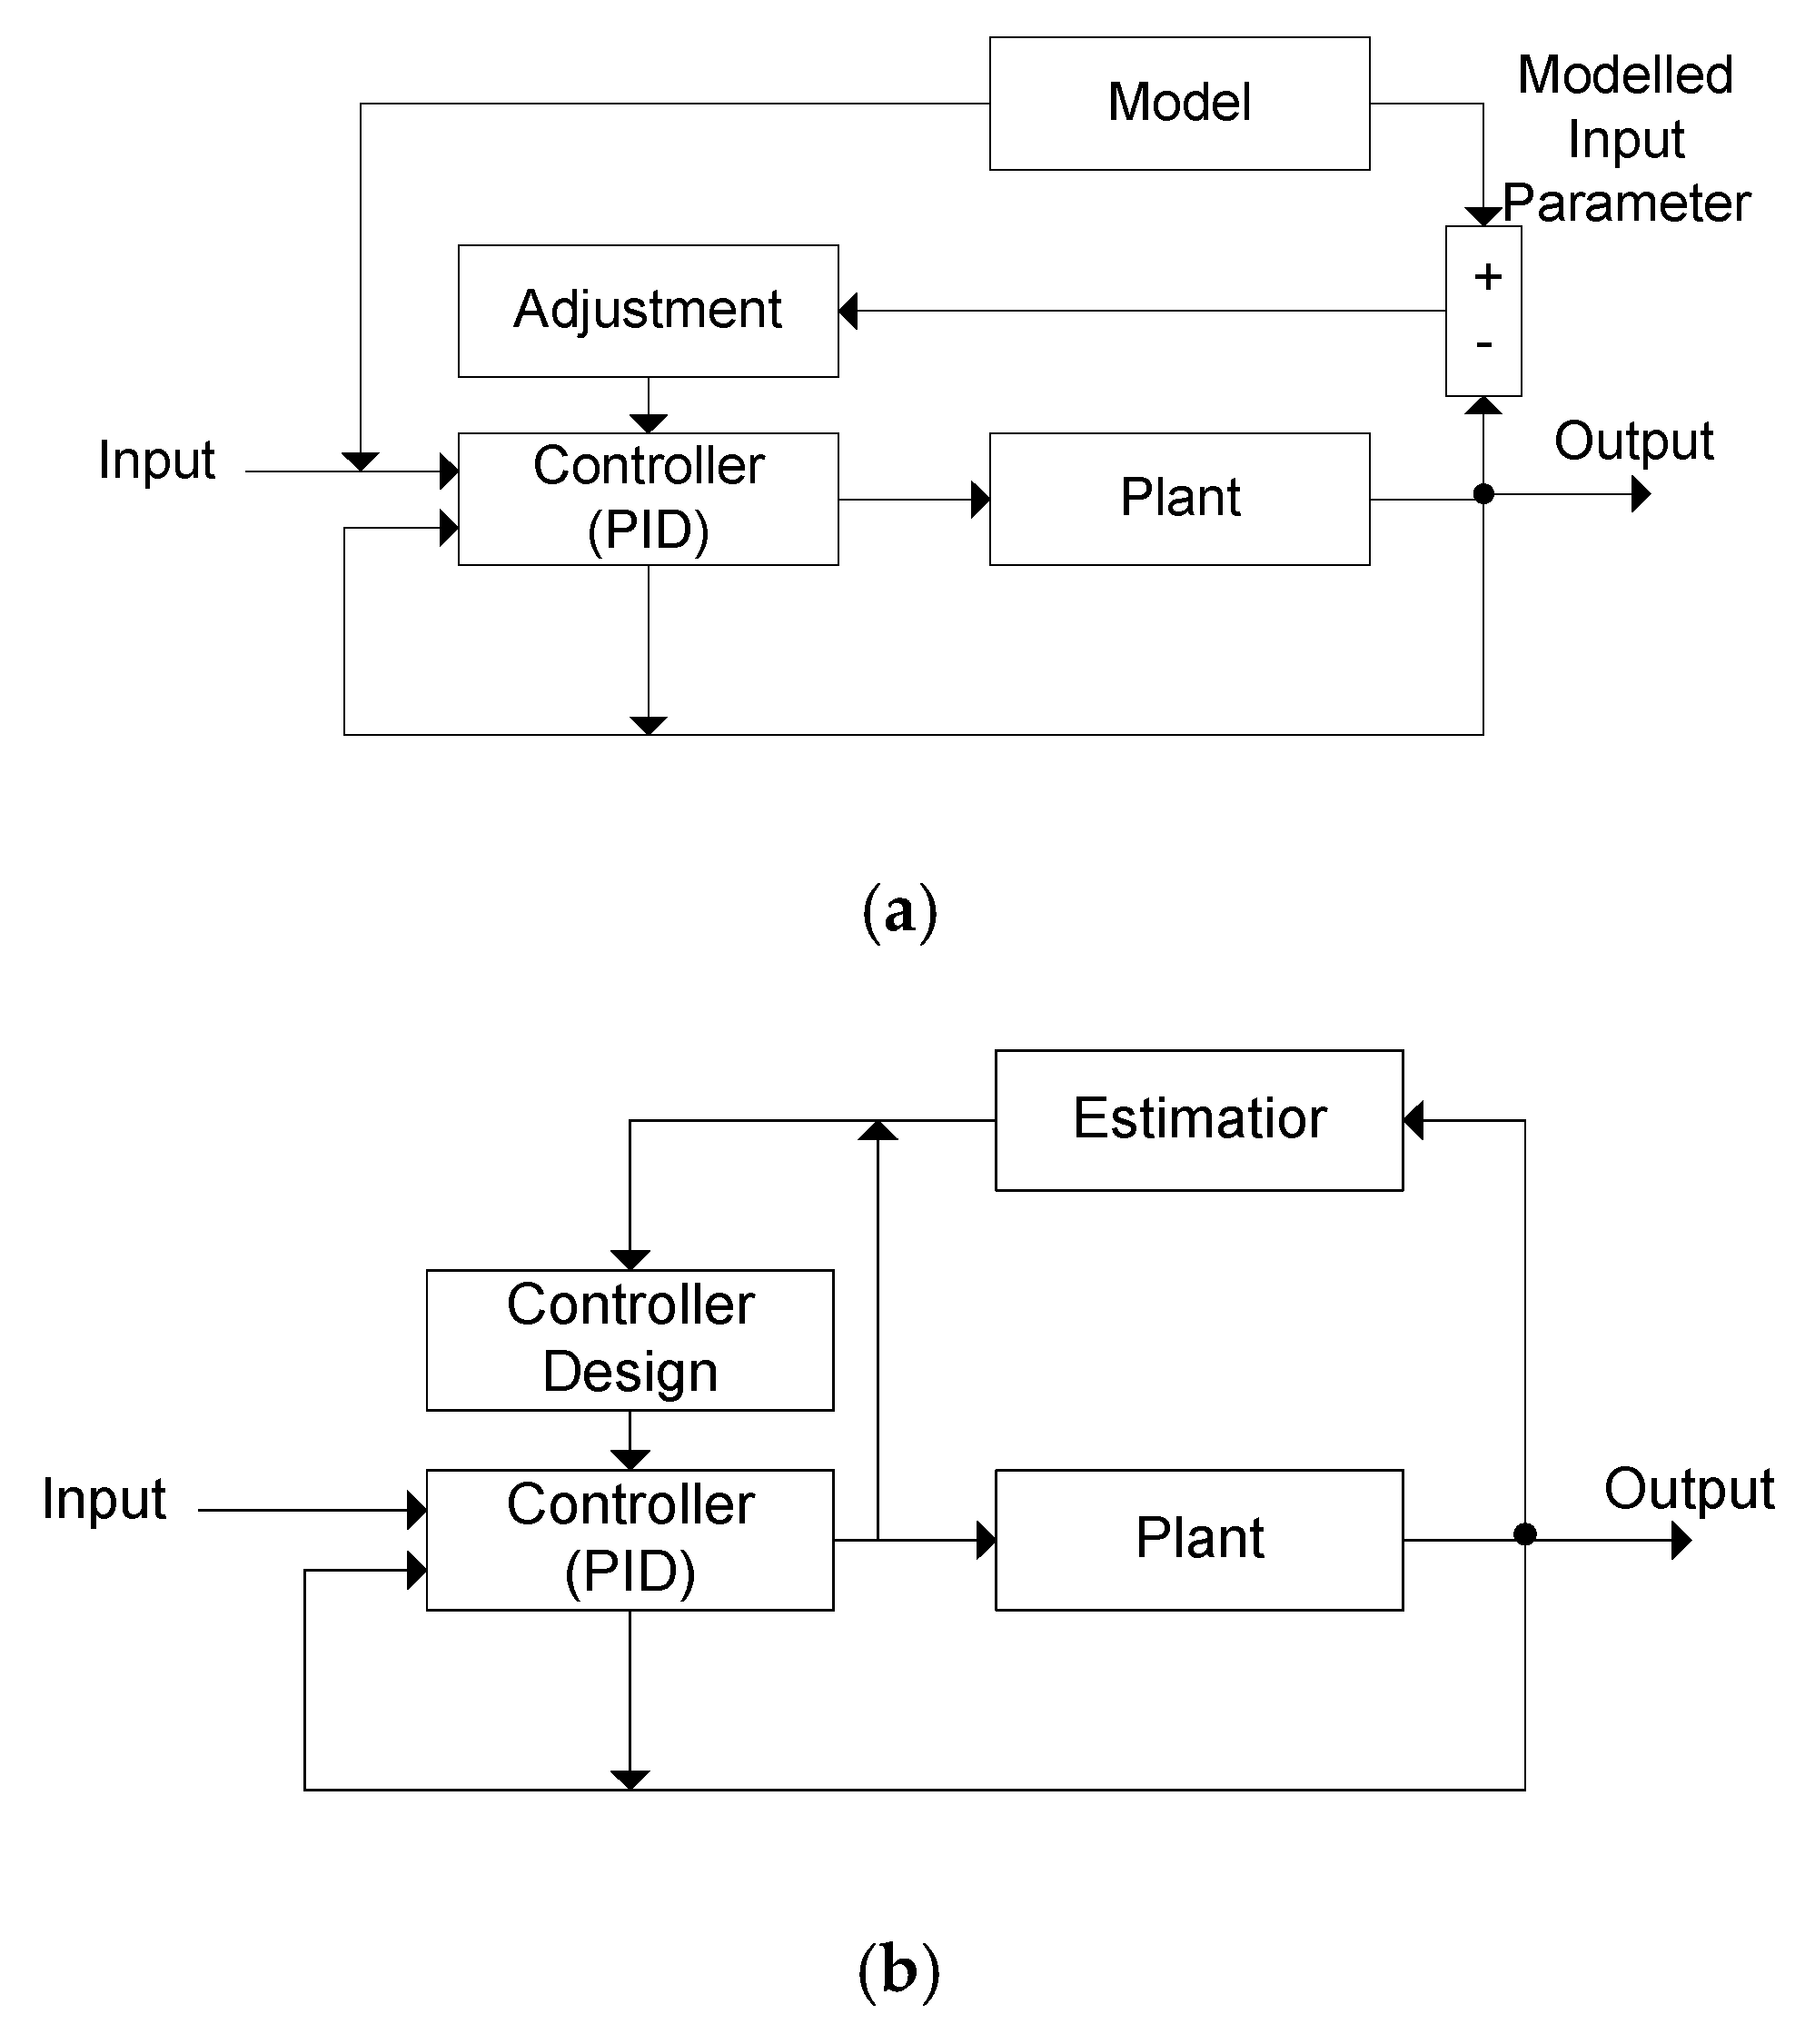
4.4.2. Adaptive Control (ACS)

ACS is a type of non-linear control, which is capable to adapt to changes and performs self-tuning in accordance with the changes in the output system. Currently, there are two types of ACS, which are the direct and indirect adaptive control, as shown in Figure 12a,b, respectively.
The parameter of direct adaptive control is corrected by the difference of the output and reference signal. On the other hand, indirect adaptive control is designed based on the estimator model, which continuously computes the new parameter that will be updated to the process model of the system [118,129]. Unfortunately, as the present grid system is more inclined towards non-linear loads and intermittence from RES, the direct adaptive approach is not capable of evaluating the dynamic response from the network under non-parametric uncertainties [121]. Thus, an indirect adaptive approach is more in favor in a grid-interconnected RES. In [120], a comparison study on the performance of two control techniques, which are the indirect model reference adaptive control (MRAC) and adaptive PI on a STATCOM in a grid-integrated wind energy system during the events of faults at the PCC. It was observed from the proposed work that MRAC surpasses the adaptive PI control technique in achieving a faster clearance time with less overshoot. Another work in [129] revolves on the drawback of the power converters, which are bound to dwell-time constraints that cause the model to remain active before it could switch to another mode of operation. Eventually, this would lead to slower switching of the power converters [130]. Therefore, the following work has adopted the piecewise affine (PWA) system along with both adaptive control (direct and indirect) to minimize the dwell-time constraints of converters, which eventually guarantees a faster switching, convergence on all parameter and tracking errors to zero. Aside from the above mentioned, the ACS control technique is also commonly found in the application of a boost converter [131] and grid-tied PV inverters [132].

4.4.3. Model Predictive Control (MPC)

Model predictive control is one of the non-linear control techniques that performs optimization on the predicted future output in the process system. In general, the MPC control technique has a distinct advantage in terms of robustness, simplicity, and dealing with uncertainties on a multivariable system. MPC works on both the set models, which are the finite control (FCS) and continuous control (CCS). The working principle of FCS considers the single switching state in a sampling period under different switching frequencies, which indirectly invokes a large power ripple and higher THD and switching losses. Unlike CCS, which operates based on a predictive direct power control under a fixed single switching frequency, it offers a better steady-state performance with a lower THD as compared to FCS [122,123,133]. A study on the control scheme improvement of a DSTATCOM was conducted by [134] in mitigating the harmonics problem on an LV distribution network under a heavy non-linear load condition. FCS-MPC is proposed in this work, enhancing the existing technique to offer better robustness and flexibility of the FACTS control scheme. The work yields good results in terms of harmonics reduction and power factor correction without having the needs of energy storage for the D-STATCOM. In another work conducted by [133], two main groups of MPC control techniques (finite and continuous) were evaluated based on their performance and design for an induction machine. From the comparative study conducted, it was shown that both FCS and CCS exhibits a good dynamic performance in retaining all of the system parameters within its limit. In a detailed comparison of both of the MPC control techniques from the work, MPC-FCS outshines MPC-CCS regarding the performance of torque capability under high speed levels. However, the weightage of the work conducted based on the two-control scheme is not equitable as the parameter of the outer loop is leaning towards an advantage of the MPC-FCS. Nonetheless, MPC-CCS still leads MPC-FCS in terms of a lower computational burden, which eventually contributes to a lower cost and faster decision process. The following application of MPC is also present in RE-based AC microgrids for VSI [135] and high-penetration grid-interconnected RES with BESS [136].

4.4.4. Artificial Intelligence (AI)

To deal with parametric uncertainties during the events of power quality disturbances, artificial intelligence is one of the distinguished control techniques, which excels in the adaptive learning approach, robust application, and guarantees optimal solutions under a non-linear system. The control technique of an AI can be categorized into two techniques, which are the optimization and classification-based techniques. The following concepts and examples for both AI techniques are shown in Table 5 below.
From the table above, it reviews eminent studies on the two AI technique, which are based on several research works related to PQ disturbance in a grid-interconnected RES and energy storage systems. From the outcome of both the classification and optimization technique, it can be concluded that:
  • Under a non-linear condition, convergence is met on both AI control techniques.
  • In terms of the computational process, it varies depending on the technique used to further optimize the objective function.
  • A hybrid technique is required to narrow down the uncertainties in the parameter or value in order to improve the accuracy and a faster computational process of the system.
In addition to the above mentioned, there are numerous works that incorporate the AI technique in FACTS device [140,141,142], MPPT [125,143], and hybrid non-linear control strategies [120,139], which are present within the DG/distribution network.

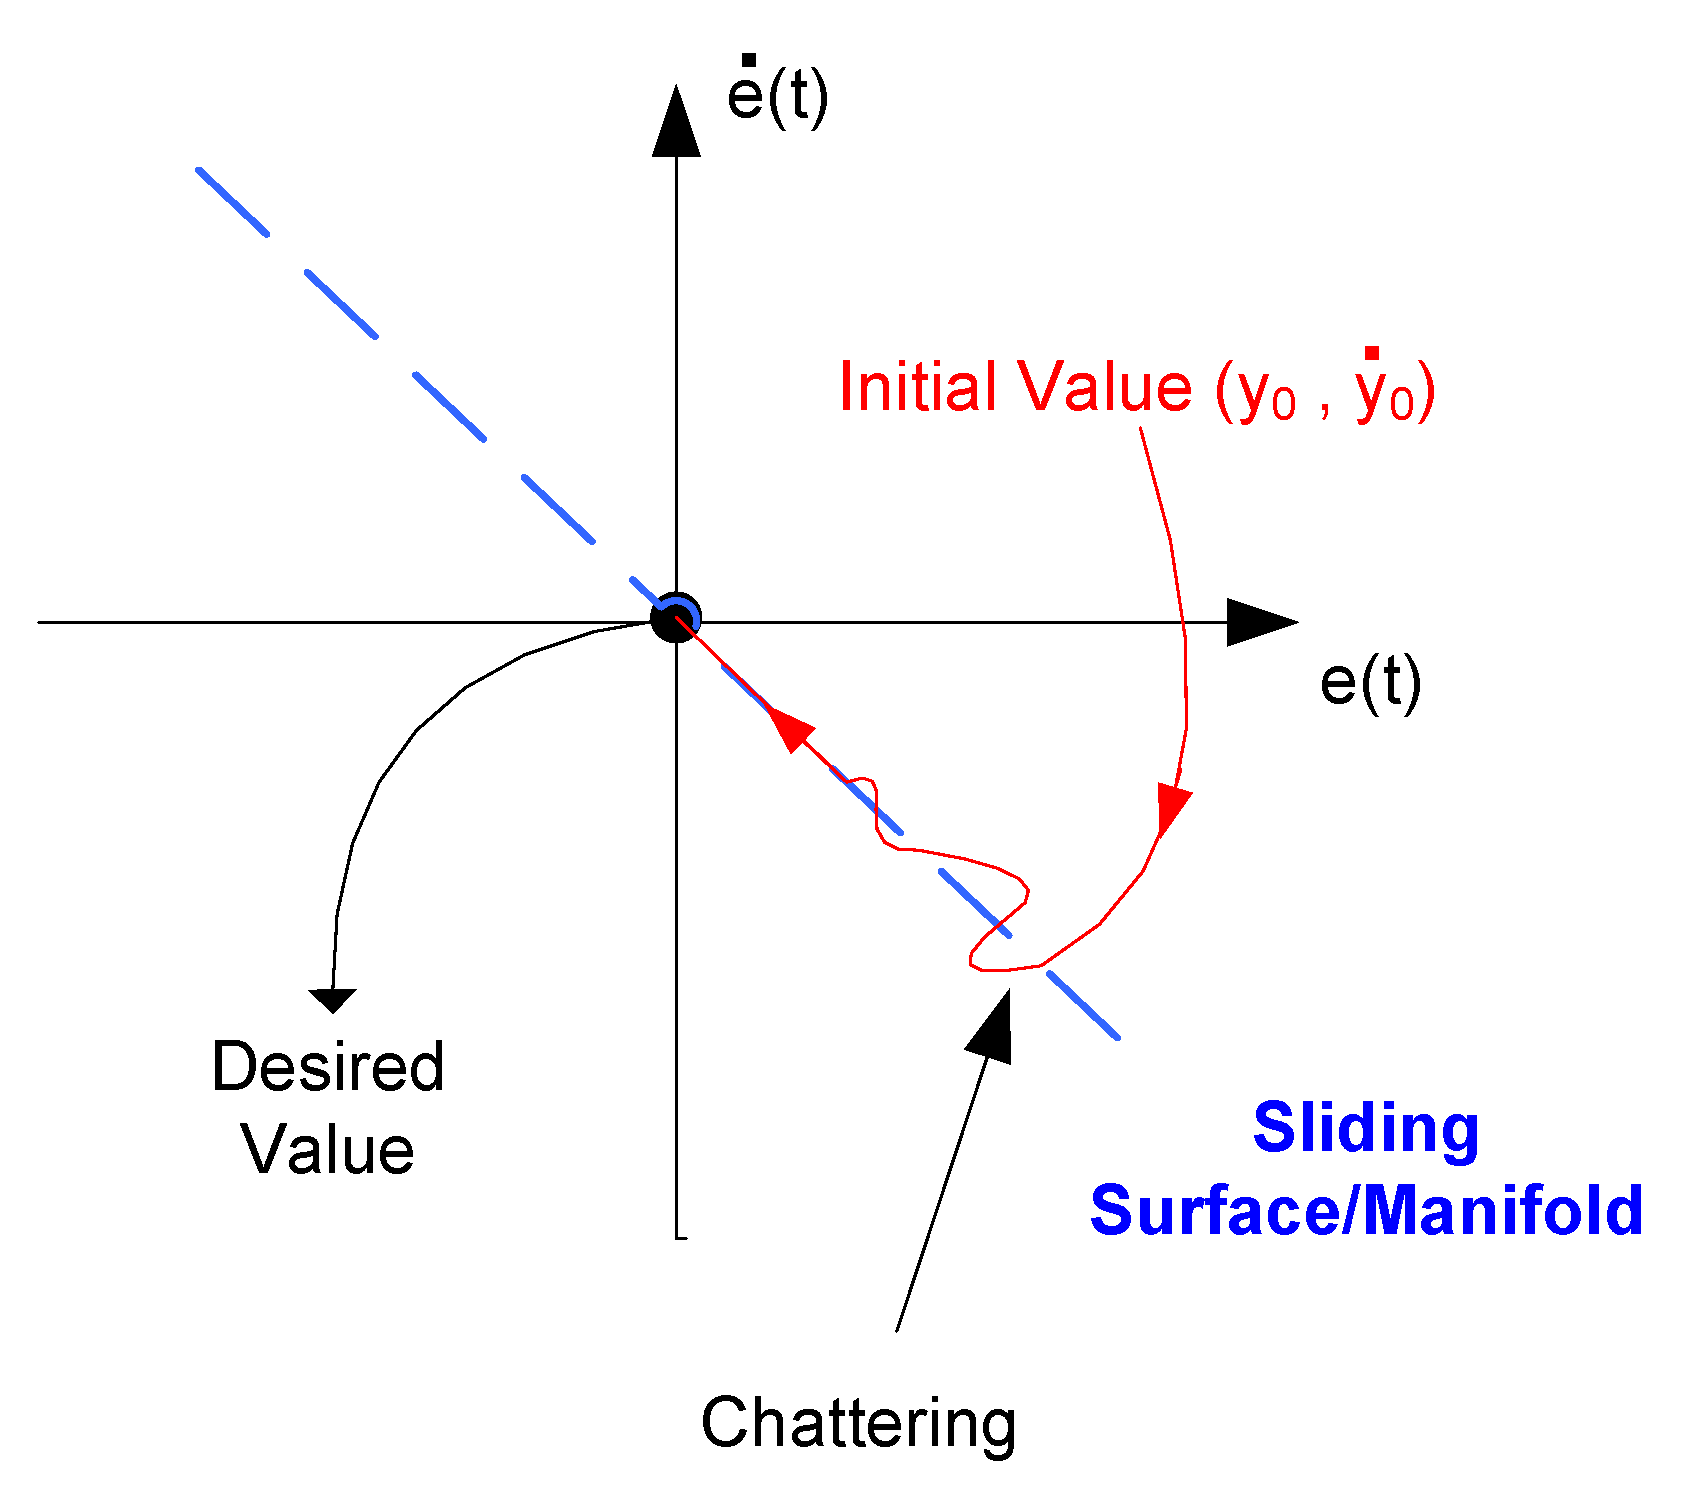
4.4.5. Sliding Mode Control (SMC)

To handle systems that are non-linear under an uncertainty condition, SMC is one of the best methods that provides fast convergence in achieving stability [118]. The control scheme involves the selection of a sliding manifold and derivation of control signals on the reaching, existence, and stability condition. The working principle of SMC is based on the sliding movement between two input values until the system approaches the sliding manifold to converge with the origin, which is portrayed in Figure 13 [144,145].
Previously, SMC would require different switching frequencies in its mode of operation, which leads to more harmonics problems. In regards to the grid-interconnection RES, SMC are also prone to a high chattering magnitude due to the effects of renewable intermittency [146,147]. Therefore, there are notable works on improving the drawback of the SMC control technique by fixing a constant switching frequency through deployment of a dual loop control structure along with the conventional PI controller [147]. In order to mitigate the chattering problem of SMC, integration of a higher order SMC via the combination of two sliding controls and a robust exact differentiator (RED) in a STATCOM was proposed by [145] within an IEEE 14-bus under different loading conditions. From the work concluded, the proposed control scheme is able to eliminate chattering caused by external disturbance and improve the overall transient stability of the system. Another work on the performance analysis SMC in a DVR is presented by [148], which focuses on the performance of the mentioned PQ compensation device in resolving different types of voltage sag issues. The proposed SMC could attend all types of voltage sag issues but suffers from minor chattering and oscillation, which causes high power switching losses during the compensation. The SMC control technique is present in applications of the FACTS device for synchronous generation [149], speed control of a DC motor [150,151], and DC-DC converter [152].

4.4.6. Fundamental Frequency Switching (FFS)

In the FFS control scheme, a frequency- based switching can only be done by turning on or off in one cycle at a time [153]. The main objective of FFS is to select two switching angles of θ1 and θ2 to obtain the desired fundamental frequency voltage and eliminating odd harmonics [126,127]. The first order of harmonics is neglected as it represents the original voltage waveform of the system and in a three-phase inverter system, the triple harmonics have already been cancelled out in the line-to-line voltage [126]. The simplified formulas, which is derived from the Fourier series expansion, are shown below in Equations (4) and (5) [127]:
cos θ 1 +   cos θ 2 =   m a
cos N θ 1 +   cos N θ 2 =   0
where ma is the output voltage modulation index and N is the odd harmonics order (5,7….). To obtain the output voltage modulation index, it can be represented in Equation (6) [126]:
m a =   V 1 ( 4 π 1 ) × ( V d c 2 )
where Vi is the original voltage waveform and Vdc is the voltage DC source or capacitor.
According to [111], FFS offers a better performance under a lower switching frequency, which contributes to low switching and voltage losses. In addition, FFS can operate under a larger-scale application especially in a transmission network, whereby PWM could only operate under the low-voltage applications. Despite its advantage, the working principle of FFS is more complex and limited as compared to PWM [154]. Therefore, in a distribution grid application, PWM would still be a better option as compared to FFS, which offers more flexibility and simplicity on various applications in PQ compensation devices, grid-feeding converters, and active filters.

5. Challenges and Recommendations of Distributed Generation

Fossil fuel generation remains as a question in terms of the trends on energy security, viability, and its compelling effects towards the environment. With the current upscaling of renewable sources, it is certainly challenging as the expectancy of dominating the overall fossil fuel generation is most likely not possible at the moment. Due to that, the current RE technologies could only shave off the peak demand of the primary generation during the peak hours. The prominent renewables in Malaysia, especially solar, hydro, and biomass, which contributes to an overall of 2% on its total generation capacity, is relatively low to sustain the forecast energy demand in later years. Thus, at the moment, it is expected that fossil fuels will still be the main generation to support most of the load demand. In this section, a critical review on the challenges of stagnation and setbacks of RES and power quality disturbance within the grid-interconnected RES or DG in Malaysia is presented thoroughly. On the above mentioned, a brief suggestion is presented on the future work in the distributed generation/distribution network, which welcomes the upcoming technology of electric vehicles and smart grids in the current grid system.

5.1. Public Awareness

According to the survey conducted by [155], it was found that most Malaysians are aware of the importance of renewables as an alternative source in replacing conventional fossil fuel generation. A high fraction of 98.8% of respondents agreed that the impact of having a renewable source could bring a positive impact towards the environment in terms of carbon emission and global warming. Unfortunately, it was recorded that 50.6% of respondents were unaware regarding the efforts or initiatives of the government in enhancing the implementation on RE technologies. This indicates the lack of exposure by the government towards public awareness in promoting renewable energy. In regard to the topic earlier, it was found that the costs of installing a renewable source are not cheap, which was agreed with by 80.7% of the respondents. For this reason, the current government should reassess the policy and its initiative to encourage the public in partaking in the roadmap, which aligns with the current RE technology in the country. On this purpose, the initiative could include several points by:
  • STEM Program—Promote awareness on renewables to young children, students, and teachers to encourage them to be involved in any CSR projects that are relevant to any topic on science, technology, engineering, and mathematics (STEM).
  • R&D Investment—Initiate more funding and investment in the R&D projects, which aims to improvise the performance, efficiency, and cost reduction of RE technologies. The points could be strengthened by providing a more detailed set of rules or pricing on grid assessments and by reducing the hassle in license applications [156].
  • Gamification Technology—Introducing the gamification element, which includes a rewarding process in terms of vouchers, prizes, coupons, or discounts that are related to any RE technology and energy saving [157]. This could encourage the public the be more aware of the trends and current advancements of renewable energy, which indirectly contributes to the economic growth and relevant initiatives of the country.
  • Digital Advertising—Engagement on social media platforms, such as WhatsApp, Facebook, or Telegram, to promote the benefits of RE technology in Malaysia and other countries. Through social media, it would be easier to obtain and share information from a single click on the device [155]. In the recent advancement of social media technologies, there are options to scope the target audience, which is specifically categorized by their demographic and geographical location. By getting the appropriate target audience, it would benefit the RE industry in promoting their product to the potential customers.

5.2. Economic and Cost Considerations

Commercializing RE is not an easy task, especially within larger-scaled generation due to high operating costs with a lower return on investment. Therefore, the government is keen to look into RE generations, which are easily available, suitable to the climate of the country, have cleaner energy, and are cheaper with a feasible return of cost in a short period. A small-scaled technology is introduced in the distribution network that fits these criteria, such as the roof-top-solar and small hydro and pilot projects on biomass. In an effort to attract more potential customers and industry players, the government has implemented several policies to promote the RE initiatives [12,158].
  • For the rooftop solar program, one of the constraints is due to the low rates proposed on the FiT scheme. This results in a longer payback period of the investors to achieve its return-of-investment (ROI). In addition, the overall cost does not include the operational and maintenance cost of the installation on roof-top solar over the period of 21 years [63,158]. Therefore, net energy metering (NEM) was proposed to stimulate the Malaysia Renewable Energy uptake in 2018 [46]. Unlike the previous FiT scheme, NEM allows the users to use the electricity first and if there is any excess generation, it will be fed into the grid.
  • The cost of building a hydropower plant is more expensive than developing a thermal power plant due to its huge capital investment [20]. The higher loan refunding and cost overrun has put most of the hydro developers under a heavy pressure. Therefore, the mini hydro plant was introduced under the rural electrification program, which targets the development of rural areas in Malaysia. Mini hydro power generation is often placed in some areas, which are far from the location of the load demand [36]. This causes a huge loss on operation cost and is not economically viable on its return of investment. Apart from this, there was a lack of support from private sectors towards the development of small hydropower projects. Hence, the Malaysian government is keen and proactive in providing more research funds and expertise in bringing the potential of mini hydro power to a higher level
  • As for biomass generation, a relatively high investment cost is required to establish a generation plant. According to [159], the expected payback period would take around 5 years, which was heavily disapproved by the palm oil millers (POME) in developing a biomass power plant within their mills. Additionally, the palm oil mill itself is able to generate sufficient electricity from their own boiler and turbines. This eventually leads to the stagnant growth of biomass in Malaysia. Through initiatives in the Biomass Development Plan in 2016, Sabah and Sarawak aimed to be the leading state in terms of biomass generation. With the abundant resource, which was up to 43.5 million dry tons of raw material, this would boost the capacity of renewable generation to 20% by the year 2025. The center of attraction of the biomass generation is mainly through an attractive FiT rate, which encourages more palm oil millers to generate their own electricity and at the same time, sustaining the demand on the grid.
Aside from the discussion earlier, the government could provide a more affordable loan to the public or industries by reducing the interest rate of banks on any installments involved in any installation in renewable technologies. Hence, the support from the government is important in bringing up the prospect of renewable energy, more investment opportunities, and at the same time, providing more jobs to the locals in elevating the gross national income (GNI) of Malaysia.

5.3. Geographical Location

Through initiatives of promoting renewable energy sources especially on hydropower, there were several drawbacks, which makes the growth of hydropower stagnant for the past few years. For small hydro generation, only the local community located near the plant could benefit from the generation source. Any load located far from the plant will not be able to receive it as the generation capacity is fairly low. Considerations to construct a hydro plant might require a certain landscape or terrain to maximize the potential of water flow. Hence, the growth of hydro generation within the distribution network is constricted within areas with constant water flow. To obtain higher generation, it would require larger hydropower and dams to cope with the load demand consistently. In exchange, this will result in deforestation and a loss of home of the local communities. To improve the current hydropower generation and breaking the landscape constraints, the following research studies were conducted:
  • Pico Hydropower—Both works [160,161] proposed a pico-hydro technology that utilizes rainwater to harvest energy. The work implementation was set within urban houses and buildings to accommodate the load demand, which is lesser than 5 kW.
  • Hybrid Hydropower—Hybrid hydropower generation offers the combination of two or more different sources either from renewable or fossil fuel generation. The combination of the hybrid RES could be integrated either with solar or biomass, which would be able to sustain the demand of the grid system either during rainy or sunny weather.
  • Turbine Selection and Improvement—A proper selection of a hydro turbine with a tweak improvement in its structural design could improve the generation efficiency of a mini hydro power.

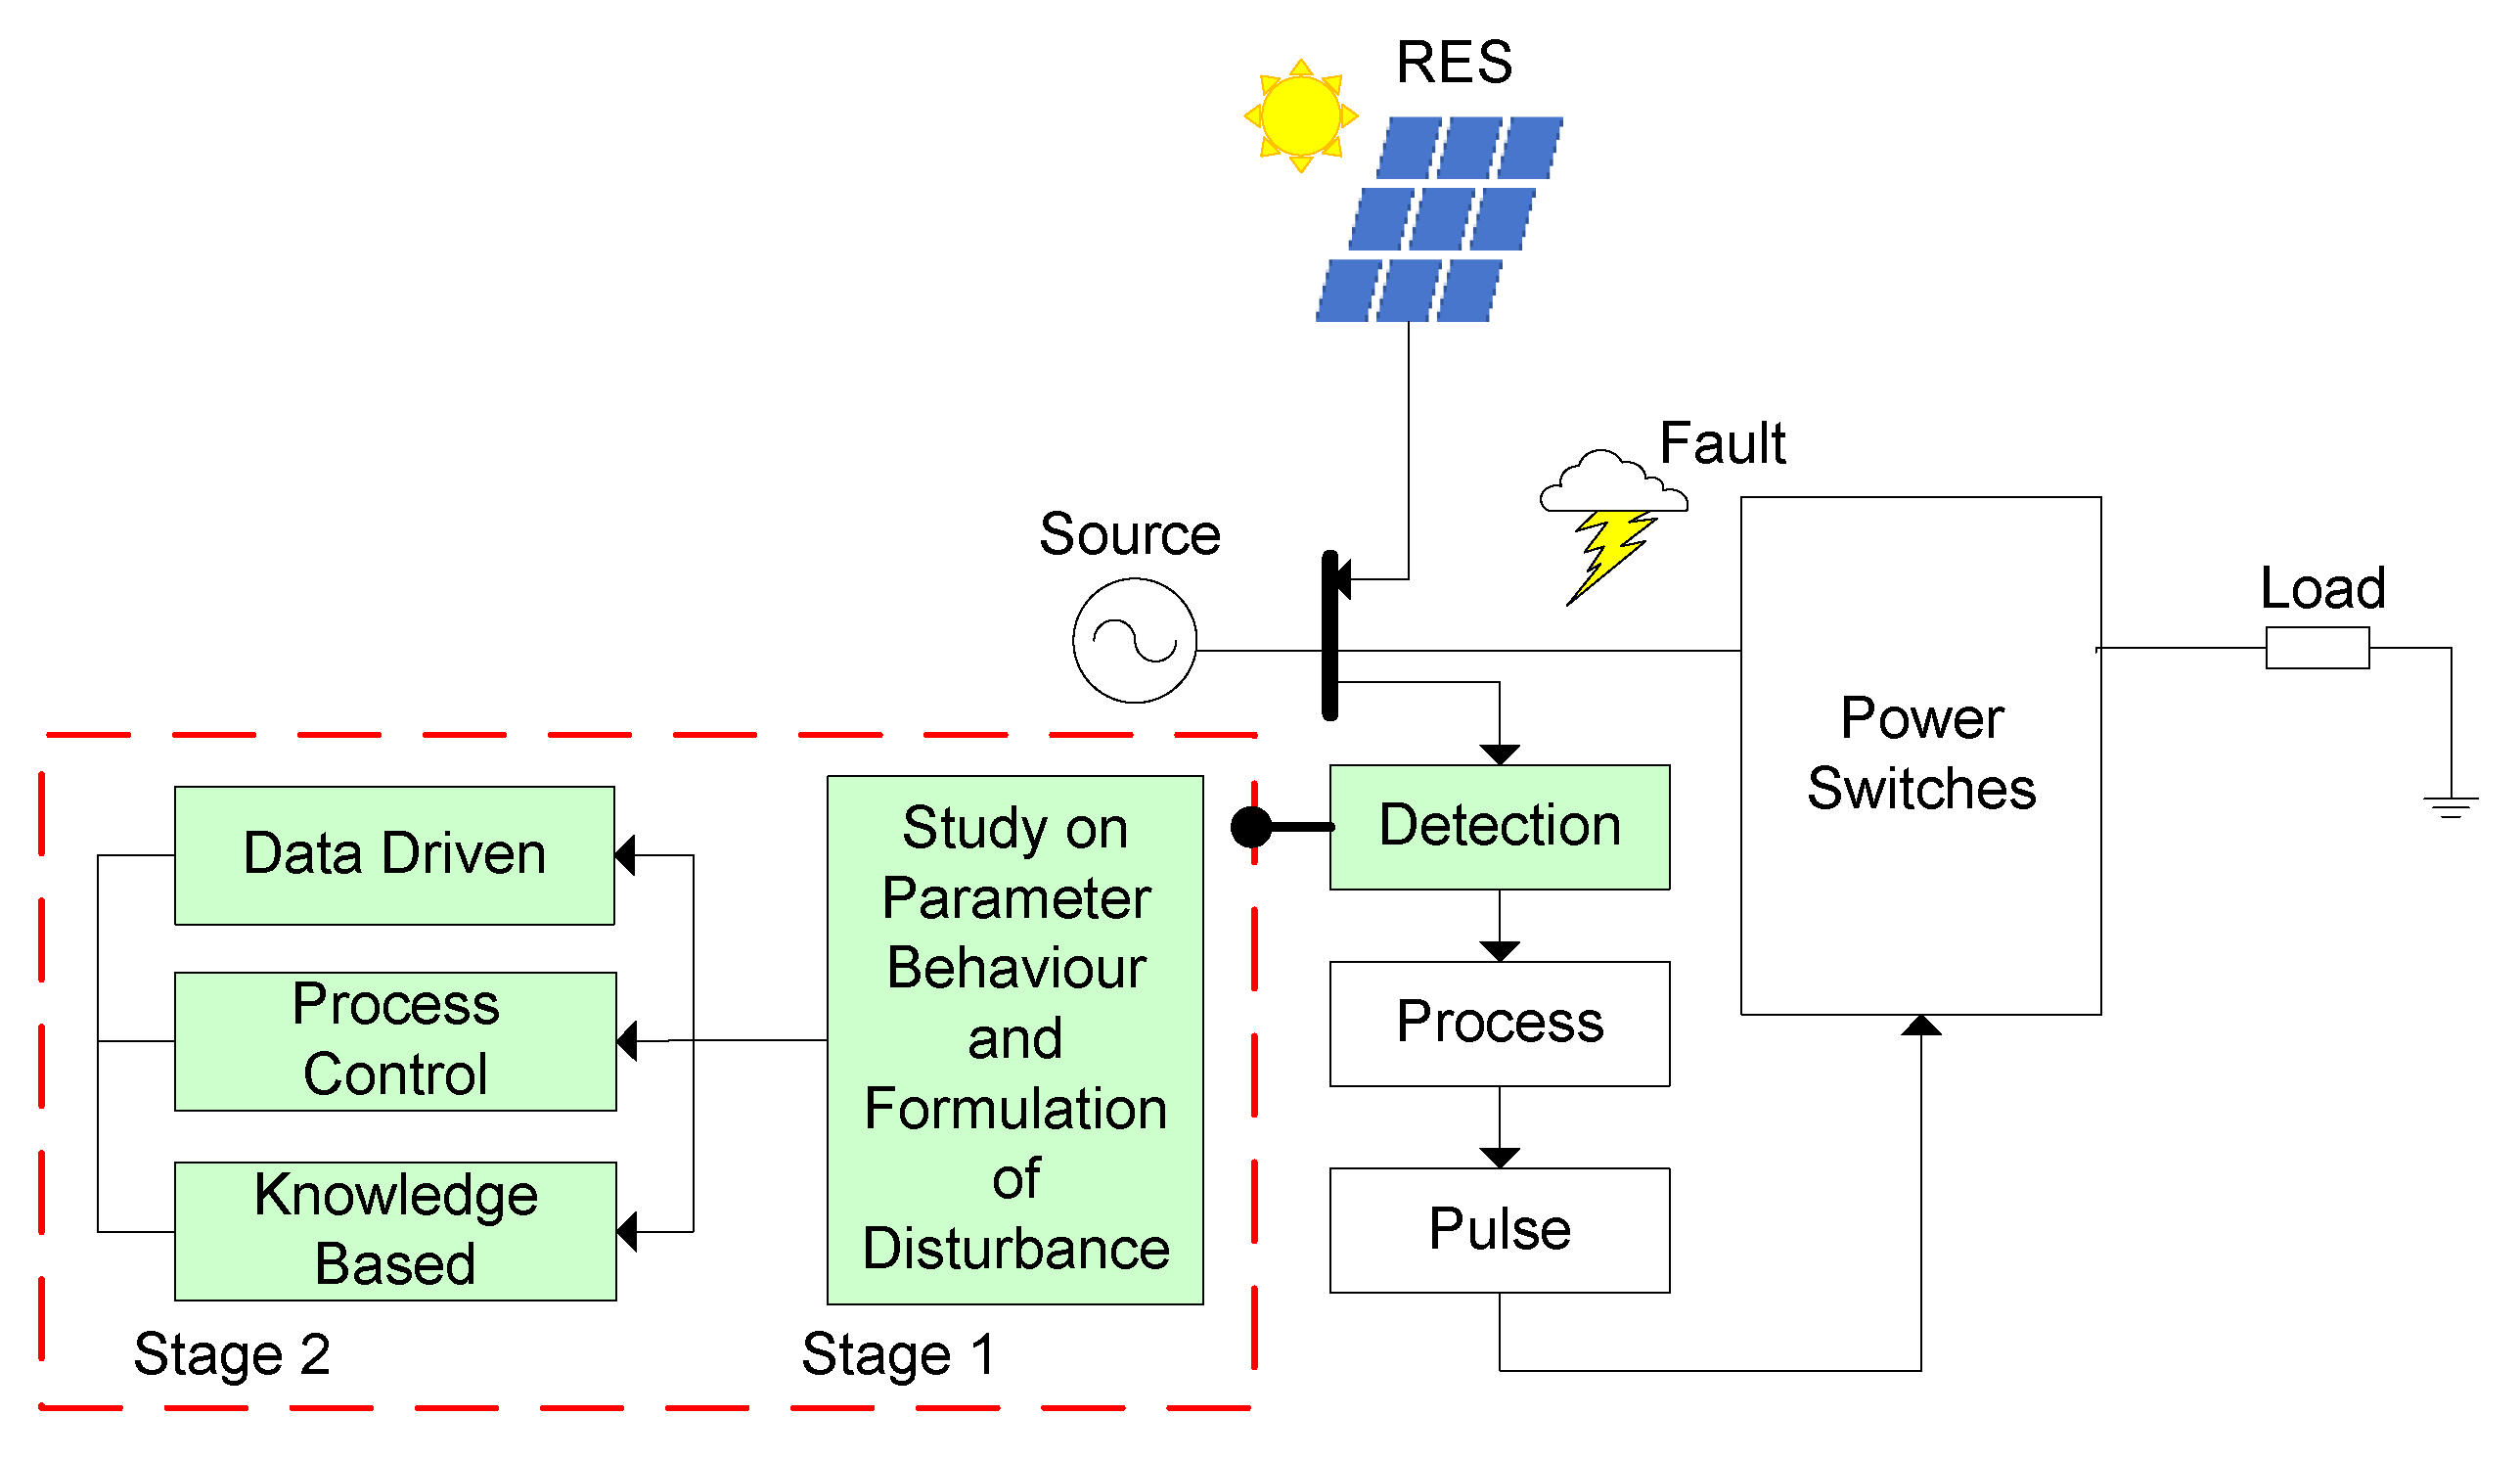
5.4. Improvement of Fault and Voltage Fluctuation Detection Scheme in a Non-Linear Control Scheme

Presently, there were numerous studies conducted in a FACTS device that focused in replacing the existing control scheme (linear control) with a more adaptive and robust controller (non-linear control) as discussed in Section 4. Towards achieving a better evaluation of the control system, the detection scheme plays an important role in estimating, deciding, and differentiating any PQ disturbance that happens within the grid-interconnected RES system. By having a detection scheme, it would reduce the imprecise computation of the control scheme in determining the possible occurrence of power quality disturbance. In the past, the conventional detection scheme would only provide detection of a lower fault condition, whereby some of it requires a higher computational process to improve the accuracy and larger localization on fault or fluctuation detection in the grid system [124]. Unfortunately, this leads to a higher computational burden and complexity of the system. At the moment, the detection scheme for grid-interconnected RES is still not fully developed as compared to the existing fault detection. The reason is due to the unpredictable behavior of the RES, which also includes several internal factors, such as partial shading, degradation, and contamination of the RES [125]. Therefore, several improvisation detection methods have been identified from various studies that have been conducted; which are the data driven [162,163], process model [164,165,166], and knowledge based [167,168], as shown in Figure 14. From the overall objective of the proposed detection scheme, it could offer better accuracy, simplicity, and a faster computation as compared to the conventional detection method. In the following subsection below, two stages of the detection scheme process are explained on the grid-interconnected PV module, whereby the parameter formulation of both the fault and PV behavior along with an overview of the representation of the process on the non-linear control scheme.

5.4.1. First Stage of the Detection Scheme (Parameter and Behavioral Study of Fault and RES in a Grid System)

In this improvised detection scheme, the network and DG will be studied beforehand in order to gather more parameters, knowledge understanding, and training sets for further computation of the characteristic and behavior on the fault, intermittency, and other possible factors that could affect the performance of the control scheme. Afterwards, the gathered parameters will be formulated in a form of equations or knowledge representation, which can be perceived by the detection scheme. Therefore, the following formulated conditions for PQ disturbances and internal factors on degradation and contamination are as shown below.
  • Balanced and Unbalanced Fault Condition—The presence of fault has been very common in the power system network, regardless of traditional or grid-interconnected with RES/energy storage. Effects caused by the presence of fault causes voltage interruption, sag, or swell. The formula to calculate short-circuit current (S.C.) for both balance (B.F.) and unbalance fault (U.B.F.) are as shown in Equations (7) and (8) [169]:
    I i j ( F ) = V i ( F ) V j ( F ) Z i j
      I i j 0 , 1 , 2 = V i 0 , 1 , 2 ( F ) V j 0 , 1 , 2 ( F ) Z i j 0 , 1 , 2
    where i and j are the sending and receiving end, Z is the line impedance from the sending to receiving end, and V is the voltage on both the sending and receiving end. For an unbalanced fault, the number 0, 1, 2 indicates a zero, positive, and negative sequence, respectively.
  • PV Shading—PV shading has been an unavoidable phenomenon, which is caused by a sudden change in the environment due to clouds or rainy conditions. This will lead to voltage fluctuation, which causes inefficient generation of the maximum power from PV panels. The following formulation of the voltage string module shading is as shown in (9) and the current array under shading in (10) [170]:
    V m s _ y = X = 1 n m s V y _ x
    I a r r a y ( V ) =   y = 1 n m p I m s y ( V )
    where nms and nmp are the number of modules for series and parallel, j is the sum of voltage of the nms modules, and Vms and Ims are both the voltage and current of the PV module in the matrix form of x = row (series) and y = column (parallel), respectively.
  • Degradation and Contamination—Degradation defines the deterioration of the lifespan of the RES over a period of time. On the other hand, contamination describes the presence of impurities on the RES, which are caused by external events due to interferences caused by human or the environment. This, however, reduces the efficiency of the RES. At the moment, there is no exact formula for degradation or contamination because the following problems are heavily affected by various factors, such as the durability, performance, and effectiveness rate, of the PV panels by the manufacturers. Therefore, one of the conventional methods to calculate the degradation and contamination rate is based on the time varying parameter, which is shown in (11):
    D   a n d   C = 1 ( t 0 t + 1 P ( t ) P ( t + 1 ) P ( t ) )
    where t is the time period either in monthly or annually, and P(t) is the power generated for this time period. The degradation and contamination rate will stop when the value reaches zero. In the proposed detection scheme, the effects of degradation or contamination (D & C) should be one of the benchmarks that indicates the current state of the PV condition and is not to be mistaken as one of the PQ disturbances.
From the formulation of the mentioned disturbance, the following considerations will be set into the decision model of the detection scheme for further evaluation based on the real-time parameter extraction from the grid system. The following process flow will be discussed in the next subsection.

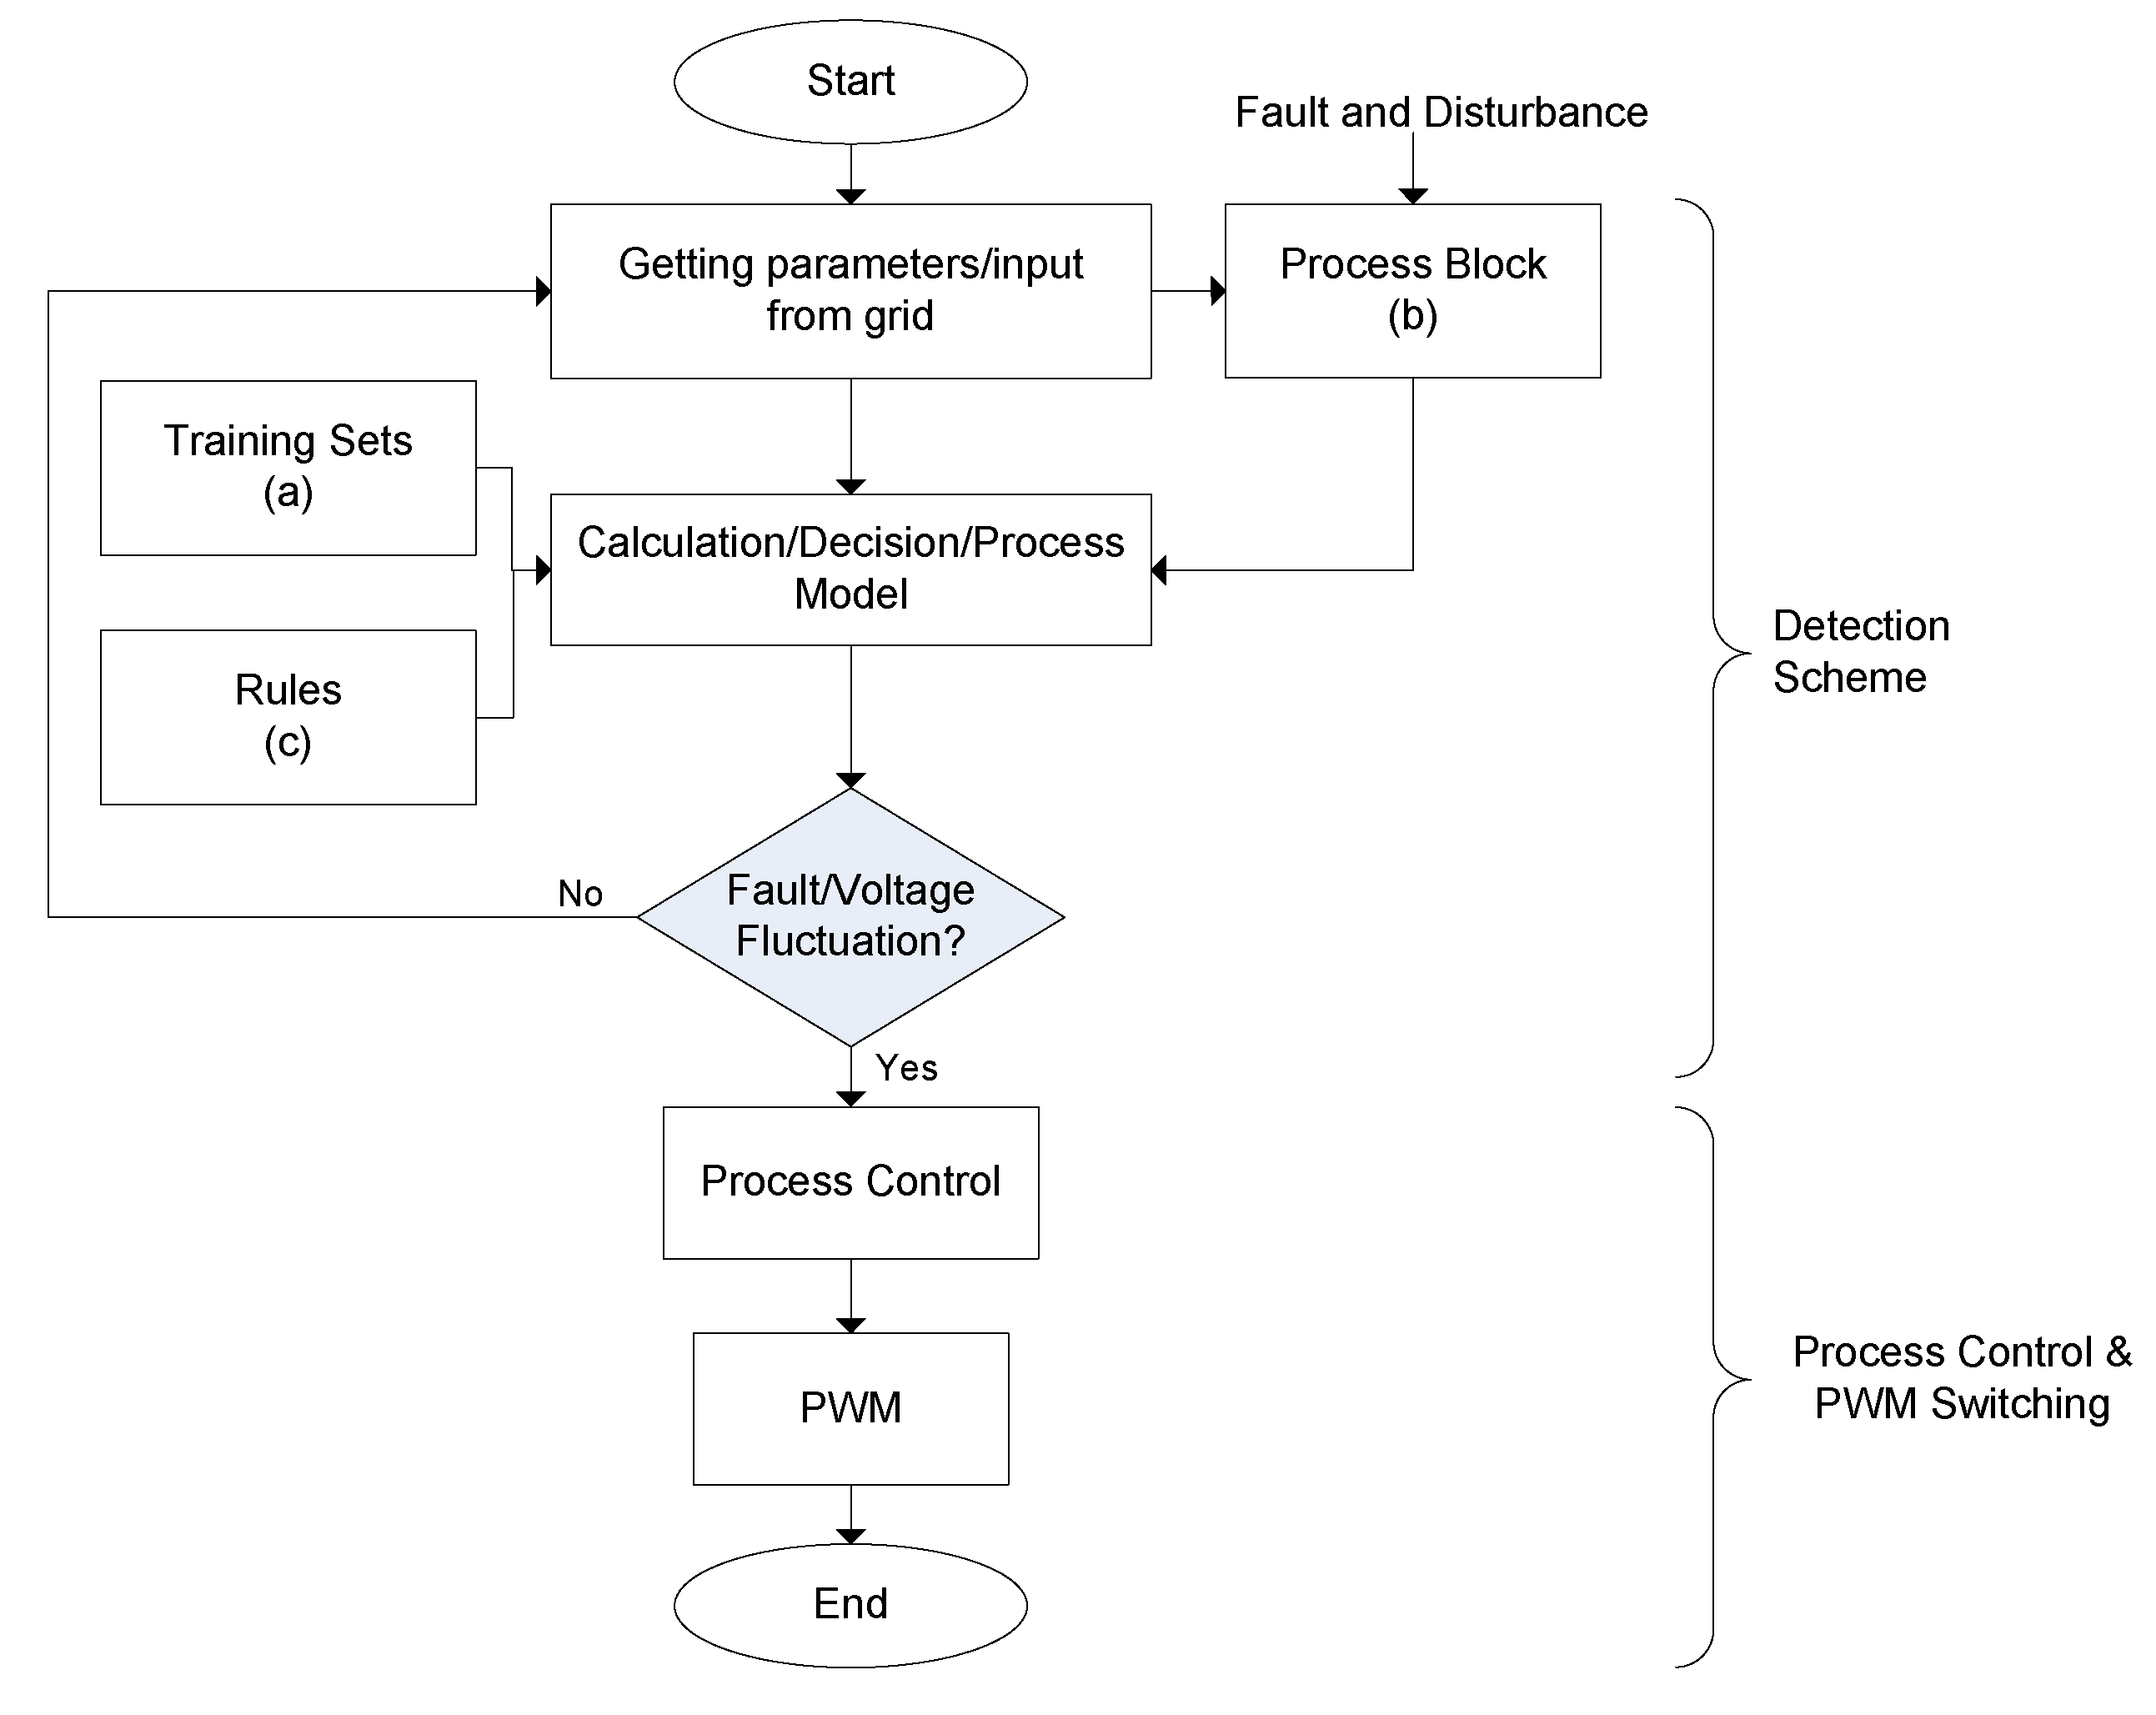
5.4.2. Second Stage of Detection Scheme (Process Flow)

After the first stage of the detection scheme, the flow-of-work as shown in Figure 15 starts by sampling the grid input or parameter to either one (a, b or c) of the mentioned detection strategies.
(a)
Data-Driven Detection Scheme: For the data-driven detection scheme, a training algorithm along with the pre-set data are taken to compare with the input value from the grid. The input value that is closest (NN) or abnormality (principle component analysis) to the pre-defined value in the training set will be selected as the output value to determine the presence of voltage fluctuation or fault.
(b)
Process Model Detection Scheme: The process block will be modelled with an actuator and sensor in order to perform the comparison of the input values from grid. At this stage, the process model will consistently log the input data from the grid and compare it with output to generate the residues, which then will be used to decide on the detection or presence of voltage fluctuation or fault.
(c)
Knowledge-Based Detection Scheme: Knowledge-based rules are formed by determining the state condition of the input parameters first from the grid. The initial step or fuzzification will convert the input values from the grid into forms of graphs (membership function). Afterwards, the membership function will be evaluated through the set of rules in different logic operators. Lastly, the output from the fuzzy is then de-fuzzified to obtain a crisp value, which will decide if there is a presence of voltage fluctuation or fault.
From the generated output of the detection scheme, it will repetitively check on any changes in the input parameter, rules, conditions, or decision. Any voltage fluctuation or fault that is present within the grid system will trigger the respective condition. Next, the output from the detection scheme process will then be fed into the respective control scheme for further computation, which corresponds accordingly to the PQ losses. The computation of the control scheme earlier will translate the output in the form of pulses, which triggers the power electronic switches for PQ compensation. Therefore, this improvised detection scheme has addressed improvements in determining the stochastic behavior of the solar RES and fault detection in quantifying the exactness of disturbance in order to enhance further the computation process and decision for the control scheme.

5.5. Limitation and Substitution of FACTS Device on Grid-Interconnected RES/DG

The FACTS device is undeniably one of the best power compensation devices, which is commonly found within the transmission or distribution network. Therefore, power compensation devices, such as series and shunt FACTS devices, are deployed within the power network. As weather changes rapidly, sometimes within a split second, a faster computational control technique is proposed to mitigate the problem, which is discussed earlier in Section 4. However, in a distribution system especially within the residential area, the effects of reactive power compensation of the shunt FACTS might be less significant as most of the household loads are resistive [171]. With a larger current draw during compensation, it would indirectly cause overheating in the cable or equipment. Therefore, an active power compensation or series FACTS devices, such as DVR or static synchronous series compensator (SSSC), could provide a better option in handling voltage fluctuation problems within the distribution grid system. Apart from the series FACTS, there are other selections on the PQ compensation technique, which provides a better control response, compensation performance, and lower implementation cost. The following examples are as shown below:
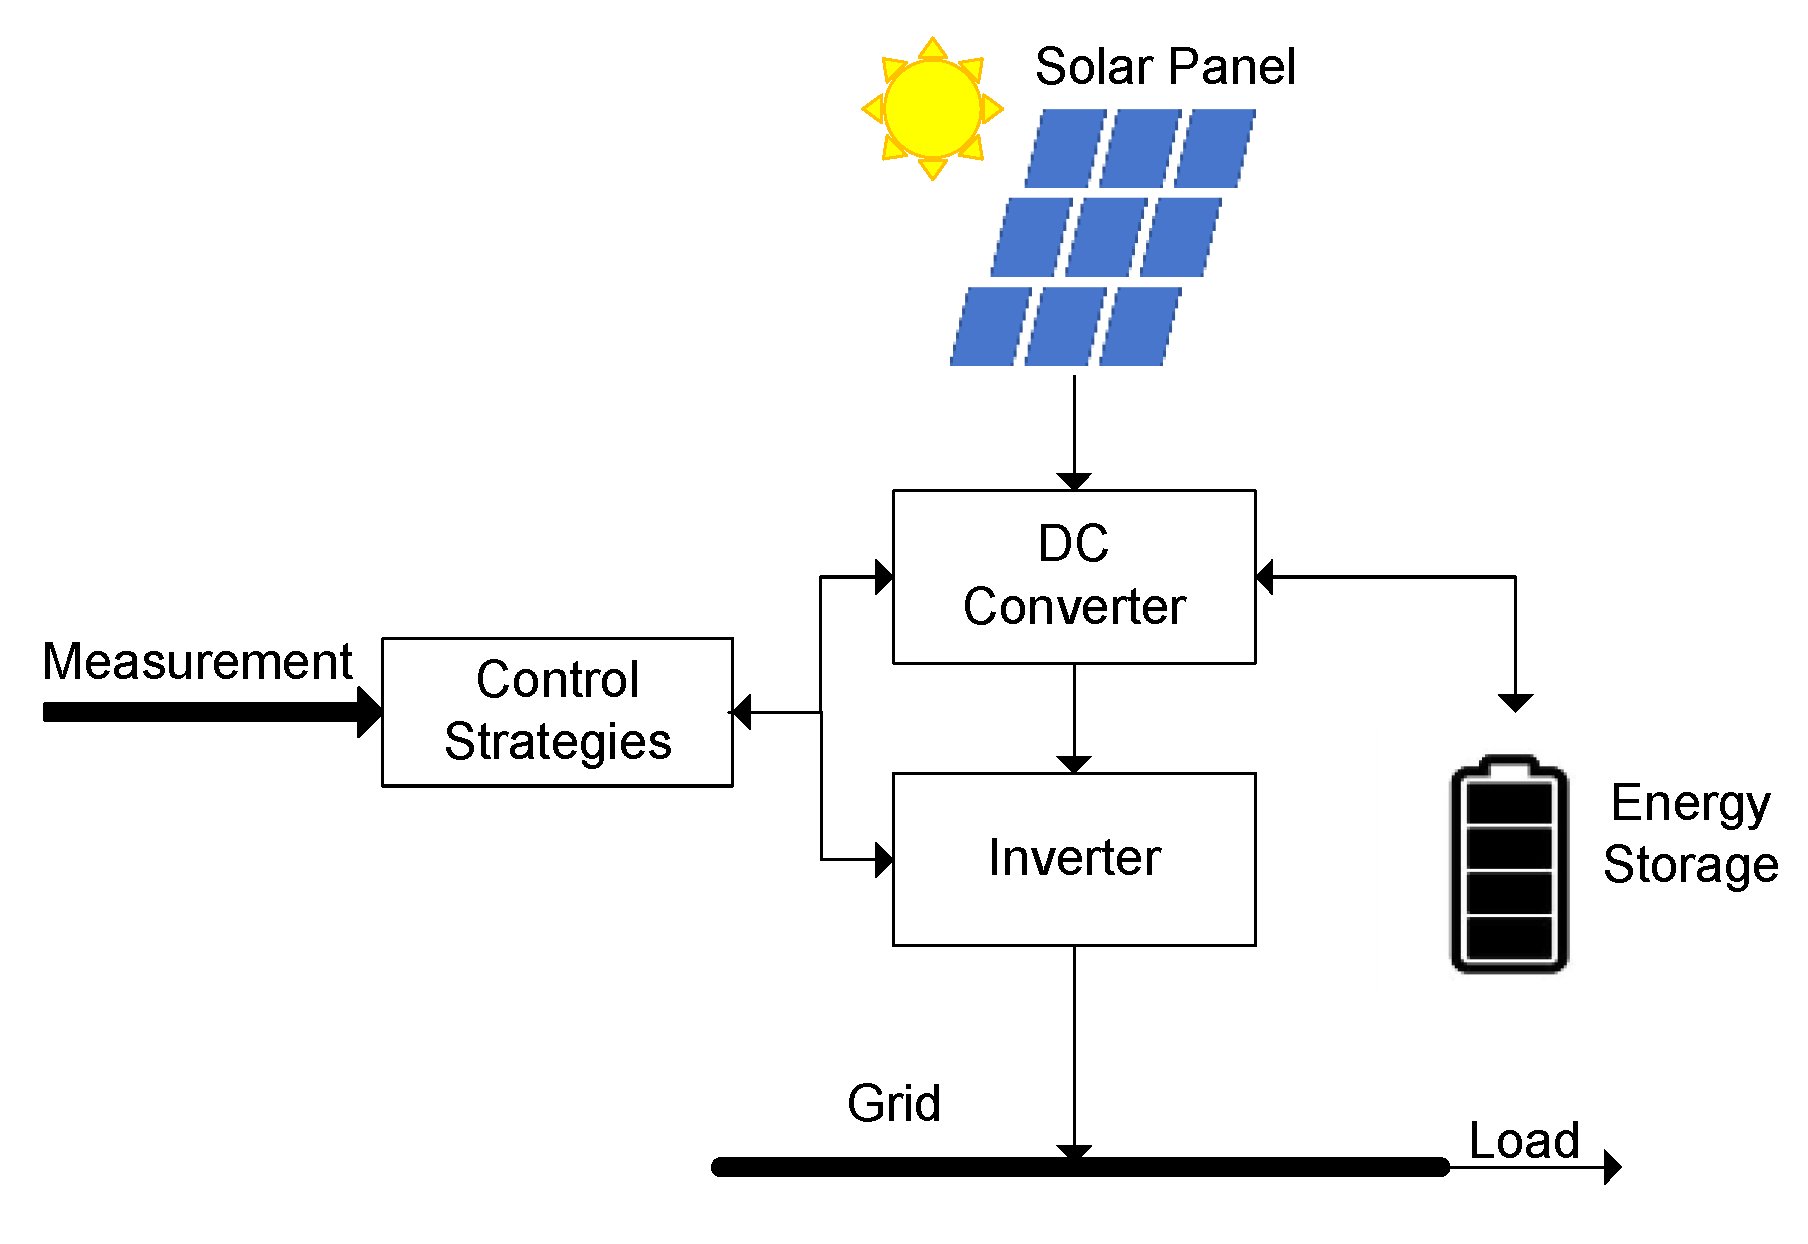
  • Energy Storage Configuration: Battery energy storage system or BESS is one of the methods to maintain the voltage level by charging during peak hours (PV penetration). Currently, there are two possible ways for a battery to operate when it is fully charged. The first method would be grid support through active or reactive power compensation, as shown in Figure 16 [172]. Another way to utilize the battery is by supporting the household loads during the peak demand [173]. BESS could offer PQ compensation on all voltage disturbances (fluctuation, sag, swell, over- and undervoltage), peak shaving, and back-up supply if there is any breakdown in the grid system.
  • Solid-State Transfer Switch: The basic concept of solid-state transfer switch (SSTS) by having two sources of generation (primary and back up), which operates based on the mode of control on the power electronics switches. In a normal condition, the main source will supply normally to the load. However, if a power disturbance occurs in the network, such as the voltage sag or swell, the backup supply will turn on instead of the primary source. In STSS, only one switch can be turned on at a time, and the other switch will remain closed [174]. STSS provides the optimal solution in any types of short voltage interruption and disturbance within a few milliseconds to a few cycles.
  • Transformer Tap Changer: Tap changer offers voltage regulation by changing coils at primary/secondary side in accordance with the grid voltage level. Transformer taps are slower as compared with other voltage regulation techniques but able to withstand voltage changes in a longer period of time. The transformer tap changer is often paired with other PQ compensation devices in maintaining the voltage stability of the grid. A tap changer could only provide over- and undervoltage regulation when there is excessive generation of high-penetration RES interconnected on the grid system.
  • Maximum power point tracker (MPPT): MPPT is also one of the strategies in maximizing the output power of the renewable sources and at the same time, preventing voltage fluctuation problems. Two conventional methods that have been commonly used are the perturb and observation (P&O) and incremental conductance method, which can detect the voltage and current from the PV to track the maximum power point of the solar generation [175]. With the current research on a more robust application, especially in dealing with external disturbance from the PV, a more sophisticated control strategy is proposed on the MPPT controller, such as the sliding mode control, which is able to outperform its predecessor in terms of yielding a higher output power, increasing conversion efficiency, and achieving a lower harmonic reduction [95,176]. MPPT ensures that the PV could operate at its maximum power in any PQ disturbances on the events of voltage fluctuation caused by intermittency and high penetration of PV.
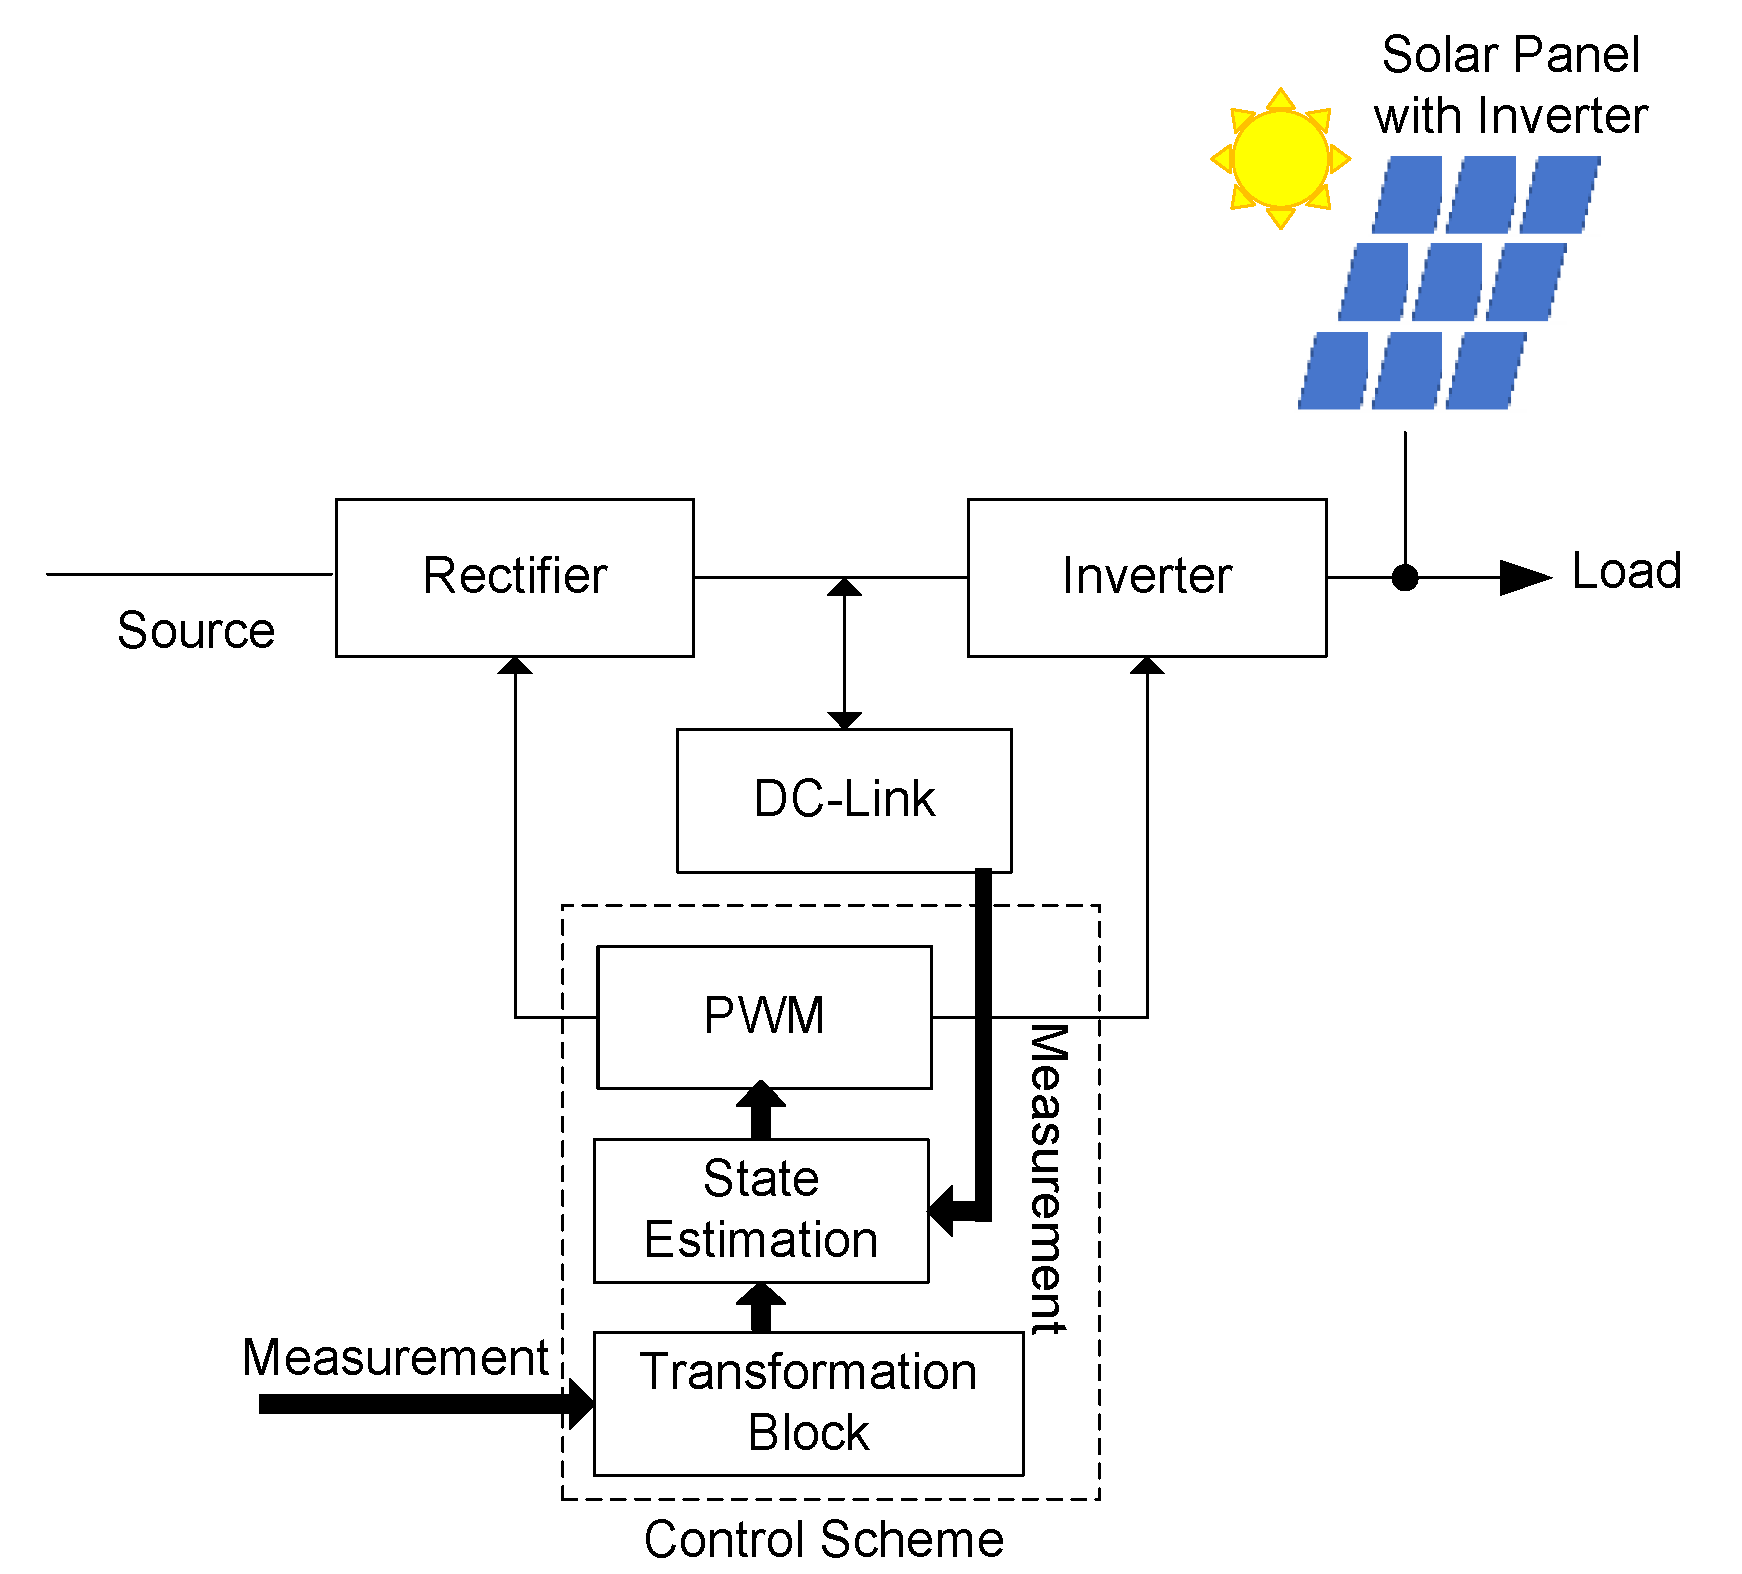
  • Grid-Feeding Configuration: Through a proper configuration of a converter integrated into the grid system, a systematic energy management of fossil fuel and renewable generation could be achieved. In cases such as the distributed generation (DG), it is essential to have a strategical energy dispatch method to fully utilize the generation potential of RE sources and at the same time it indirectly prevents the effect of over- or undervoltage. At the moment, there are two control strategies of a grid-feeding topology, which are the voltage-oriented control (VOC) and direct power control (DPC) [177]. By implementing a power dispatch control strategy in the distribution network, as shown in Figure 17, it would maximize the generation output of the DG by controlling the power flow of the main source by using converters through charging or discharging of the DC link. Grid feeding could resolve over- and undervoltage problems by performing power dispatching within the main grid, which stores the main grid supply into the DC link if there is excess generation from the RES and discharges is when the grid is encountering any undervoltage problems.

5.6. Future Recommendations for the Malaysian Distribution Network/Distributed Generation

In Section 2, Section 3 and Section 4, a review was conducted on the trends and power quality issues within the Malaysian distribution network or distributed generation. Next, an extensive analysis was conducted on the current issues, challenges, and suggestions in deploying renewable energy within the distribution grid as reference to Section 5.1, Section 5.2, Section 5.3, Section 5.4 and Section 5.5. To embrace the upcoming technology, such as the electrical vehicle (EV) or smart grids, in years to come, there are a few recommendations that can be considered to improve the performance, security, and stability within the Malaysian distribution network/distributed generation.
  • The growth of renewables in Malaysia will be increasing tremendously in the future. With a proper scheduling and planning in power dispatch by the grid operator, it would reduce energy security risks and power quality issues, and at the same time, maximizing the generation of RE sources in the Malaysian distribution grid system.
  • A power flow study should be conducted in all grid systems before and after the deployment of RE or equipment. The reason is to prevent any possible risk of voltage instability within the grid system. At the moment, only the transmission grid systems (132, 275, and 500 kV) in Malaysia are frequently being analyzed as the non-linearity (reactive element) of the system is much higher compared to the distribution system level (33, 11, and 0.4 kV). With the deployment of a few renewable sources in the current distribution grid system, it would be insignificant to do so. However, as the number increases, it would cause a compelling effect in power quality issues within the grid. Through power flow study, it could also optimize the deployment of power correction devices in terms of cost and size reduction.
  • Presently, there is not much work on combining two detection schemes (hybrid-detection scheme) to fit it into a single system. Current works that is related to hybrid-detection schemes are mostly on fuzzy logic and data-driven techniques, such as ANN [178,179] or GA [180]. Through an in-depth computation and analysis of the detection scheme, it will contribute to a faster computational process and achieve a better optimization in the classification of fault and intermittency, variation of the controller’s parameter, and a faster clearance time of power compensation devices.
  • To consider the deployment of any new technology in the Malaysian grid system, standards, guidelines, and grid code should be consistently revised and proposed beforehand to check on the permissible tolerance of the equipment in order to prevent any possible damage in the grid network. As an example, the technology advancement of EV is still immature in Malaysia. Considering the applications in EV, such as vehicle-to-grid (V2G) or wireless charging stations, it will need a more extensive review on the current electrical standard to prevent any possible damage from happening in the grid system. Similarly, in the smart grid, there will be newer standards of security and data protection to prevent any possible threat or attack from hackers.

6. Conclusions

A comprehensive study on the distributed generation is mentioned and discussed in the following studies above:
  • Fossil fuel generation would not be a long-term solution to electrical generation in years to come. In overcoming the energy security concerns, a sustainable and cleaner technology is proposed to improve the cost effectiveness and capacity reduction on the fossil fuels through renewable generation.
  • In a distribution system or a distributed generation, the assurance to deliver uninterrupted power is one of the objectives in maintaining the grid stability and at the same time to improve the lifespan of the equipment. Through relevant power quality standards and regulations, this would minimize any possible disturbance or tripping to happen within the grid. In certain unavoidable conditions, such as faults or climate change, power quality issues should be handled properly to reduce the risk of voltage collapse in the distribution grid.
  • On power quality-related problems, it can be solved by recommending suitable voltage and power quality devices with a distinctive control scheme to subdue the effects on the PQ-related problems, such as voltage disturbance, harmonics, and power factor.
Therefore, this review has addressed several challenges and constraints, and provided sufficient suggestion in hopes to anticipate as rapid development of distributed generation in Malaysia.

Author Contributions

Conceptualization and Methodology J.Y.L. and K.H.O.; Writing Original-Draft Preparation J.Y.L.; Supervision and Project Management R.V. and A.K.R.; Funding Acquisition and Resource M.B.M. All authors have read and agreed to the published version of the manuscript.

Funding

The APC is funded by Tenaga Nasional Berhad under the Universiti Tenaga Nasional (UNITEN) BOLD Grant 2020 and UNITEN BOLD Publication Fund.

Acknowledgments

The author would like to thank and acknowledge Universiti Tenaga Nasional (UNITEN) for its support in funding the project under BOLD Grant 2020 and UNITEN BOLD Publication Fund.

Conflicts of Interest

Author declares no conflict of interest.

List of Abbreviations

ACAlternating Current
ACSAdaptive Control System
AIArtificial Intelligence
ANNArtificial Neural Network
B.F.Balanced Fault
BESSBattery Energy Storage System
CCSContinuous Control System
CO2Carbon Dioxide
DGDistributed Generation
DLDistribution Licensee
DPCDirect Power Control
DSTATCOMDistribution Static Synchronous Compensator
DVRDynamic Voltage Restorer
D & CDegradation and Contamination
EVElectrical Vehicle
FACTSFlexible Alternating Current Transmission System
FCFixed Capacitor
FCSFinite Control System
FFSFundamental Frequency Switching
FIAHFeed-in-Approval Holder
FiTFeed-in-Tariff
FLFuzzy Logic
GHGGreenhouse Effect
GNIGross National Income
IRPInstantaneous Reactive Power
LCCFLow Carbon Cities Framework
LSSLarge-Scale Solar
MPCModel Predictive Control
MPPTMaximum Power Point Tracking
MRACModel Reference Adaptive Control
NEMNet Energy Metering
NNNeural Network
P&OPerturb and Observation
PCAPrinciple Component Analysis
PCCPoint of Common Coupling
PIProportional-Integrator
PQPower Quality
PSOParticle Swarm Optimization
PVPhotovoltaics
PWAPiecewise Affine
PWMPulse Width Modulation
RERenewable Energy
RESRenewable Energy Source
ROCRenewable Obligation Certificate
ROIReturn-of-Investment
RoRRun-of-River
SMCSliding Mode Control
SRECSolar Renewable Energy Credit
SSTSSolid-state Transfer Switch
STATCOMStatic Synchronous Compensator
SVCStatic VAr Compensator
TCRThyristor Controlled Reactor
THDTotal Harmonic Distortion
TSCThyristor Switched Capacitor
TSRThyristor Switched Reactor
U.B.F.Unbalanced Fault
UPSUninterrupted Power Supply
V2GVehicle-to-Grid
VOCVoltage Oriented Control
VSCVoltage Source Converter
VSIVoltage Source Inverter

References

  1. Mekhilef, S.; Saidur, R.; Safari, A.; Mustaffa, W.E.S.B. Biomass energy in Malaysia: Current state and prospects. Renew. Sustain. Energy Rev. 2011, 15, 3360–3370. [Google Scholar] [CrossRef]
  2. Chala, G.T.; Ma’Arof, M.I.N.; Sharma, R. Trends in an increased dependence towards hydropower energy utilization—A short review. Cogent Eng. 2019, 6. [Google Scholar] [CrossRef]
  3. Hall, D.O. Biomass energy in industrialised countries—A view of the future. For. Ecol. Manag. 1997, 91, 17–45. [Google Scholar] [CrossRef]
  4. Bimanatya, T.E.; Widodo, T. Fossil fuels consumption, carbon emissions, and economic growth in Indonesia. Int. J. Energy Econ. Policy 2018, 8, 90–97. [Google Scholar]
  5. Parsons, J.; Buongiorno, J.; Corradini, M.; Petti, D. A fresh look at nuclear energy. Science 2019, 363, 105. [Google Scholar] [CrossRef] [PubMed]
  6. Moran, E.F.; Lopez, M.C.; Moore, N.; Müller, N.; Hyndman, D.W. Sustainable hydropower in the 21st century. Proc. Natl. Acad. Sci. USA 2018, 115, 11891–11898. [Google Scholar] [CrossRef] [Green Version]
  7. Reid, G.; Wynn, G. The future of solar power in the United Kingdom. Energies 2015, 8, 7818–7832. [Google Scholar] [CrossRef] [Green Version]
  8. Gaetan, M.; Sinead, O.; Manoel, R. Global market outlook. EPIA Eur. Photovolt. Ind. Assoc. 2018, 60. [Google Scholar] [CrossRef]
  9. Green, M.A. How Did Solar Cells Get So Cheap? Joule 2019, 3, 631–633. [Google Scholar] [CrossRef] [Green Version]
  10. Energy Systems Integration and Enabling Technologies. Available online: https://www.ren21.net/gsr-2020/chapters/chapter_06/chapter_06/#sub_2_1 (accessed on 8 September 2020).
  11. China brings solar home. Nat. Energy 2019, 4, 623. [CrossRef] [Green Version]
  12. Sovacool, B.K.; Drupady, I.M. Examining the small renewable energy power (SREP) program in Malaysia. Energy Policy 2011, 39, 7244–7256. [Google Scholar] [CrossRef]
  13. Gandoman, F.H.; Ahmadi, A.; Sharaf, A.M.; Siano, P.; Pou, J.; Hredzak, B.; Agelidis, V.G. Review of FACTS technologies and applications for power quality in smart grids with renewable energy systems. Renew. Sustain. Energy Rev. 2018, 82, 502–514. [Google Scholar] [CrossRef]
  14. Abdullah, W.S.W.; Osman, M.; Ab Kadir, M.Z.A.; Verayiah, R. The Potential and Status of Renewable Energy Development in Malaysia. Energies 2019, 12, 2437. [Google Scholar] [CrossRef] [Green Version]
  15. Jalal, T.S.; Bodger, P. National energy policies and the electricity sector in Malaysia. In Proceedings of the ICEE 2009—3rd International Conference on Energy and Environment: Advancement Towards Global Sustainability, Malacca, Malaysia, 7–8 December 2009; pp. 385–392. [Google Scholar] [CrossRef] [Green Version]
  16. Gasperic, S.; Mihalic, R. Estimation of the efficiency of FACTS devices for voltage-stability enhancement with PV area criteria. Renew. Sustain. Energy Rev. 2019, 105, 144–156. [Google Scholar] [CrossRef]
  17. Banja, M.; Sikkema, R.; Jégard, M.; Motola, V.; Dallemand, J.F. Biomass for energy in the EU—The support framework. Energy Policy 2019, 131, 215–228. [Google Scholar] [CrossRef]
  18. Kamimoto, M.; Hayashi, H. Sunshine Project Solar Photovoltaic Program and Recent Activities in Japan. Int. J. Sol. Energy 1982, 1, 185–195. [Google Scholar] [CrossRef]
  19. Govt to Offer 1000 MW Solar Quota under LSS@MEnTARI. Available online: https://www.nst.com.my/news/nation/2020/05/595985/govt-offer-1000mw-solar-quota-under-lssmentari (accessed on 5 June 2020).
  20. Hossain, M.; Huda, A.S.N.; Mekhilef, S.; Seyedmahmoudian, M.; Horan, B.; Stojcevski, A.; Ahmed, M. A state-of-the-art review of hydropower in Malaysia as renewable energy: Current status and future prospects. Energy Strateg. Rev. 2018, 22, 426–437. [Google Scholar] [CrossRef]
  21. Office of Air and Radiation (OAR)—United States Environmental Protection Agency. Distributed Generation of Electricity and its Environmental Impacts. Available online: https://www.epa.gov/energy/distributed-generation-electricity-and-its-environmental-impacts (accessed on 3 July 2020).
  22. Colmenar-Santos, A.; Reino-Rio, C.; Borge-Diez, D.; Collado-Fernández, E. Distributed generation: A review of factors that can contribute most to achieve a scenario of DG units embedded in the new distribution networks. Renew. Sustain. Energy Rev. 2016, 59, 1130–1148. [Google Scholar] [CrossRef]
  23. Root, C.; Presume, H.; Proudfoot, D.; Willis, L.; Masiello, R. Using Battery Energy Storage to reduce renewable resource curtailment. In Proceedings of the 2017 IEEE Power & Energy Society Innovative Smart Grid Technologies Conference (ISGT), Washington, DC, USA, 26–29 September 2017; pp. 1–5. [Google Scholar]
  24. Soroudi, A. Energy Storage Planning for Resiliency enhancement against Renewable Energy Curtailment. In Proceedings of the IET International Conference on Resilience of Transmission and Distribution Networks (RTDN 2017), Birmingham, UK, 26–28 September 2017; pp. 1–5. [Google Scholar]
  25. Howlader, A.M.; Sadoyama, S.; Roose, L.R.; Sepasi, S. Experimental analysis of active power control of the PV system using smart PV inverter for the smart grid system. In Proceedings of the 2018 IEEE International Conference on Power Electronics and Drive Systems, Chennai, India, 18–21 December 2018; pp. 497–501. [Google Scholar] [CrossRef]
  26. Denholm, P. Energy storage to reduce renewable energy curtailment. In Proceedings of the 2012 IEEE Power & Energy Society General Meeting, San Diego, CA, USA, 22–26 July 2012; pp. 1–4. [Google Scholar] [CrossRef]
  27. Joos, M.; Staffell, I. Short-term integration costs of variable renewable energy: Wind curtailment and balancing in Britain and Germany. Renew. Sustain. Energy Rev. 2018, 86, 45–65. [Google Scholar] [CrossRef]
  28. Kim, I.; Harley, R.G. The transient behavior of the Volt/Var control of photovoltaic systems for solar irradiation variations. In Proceedings of the 2016 IEEE Electrical Power and Energy Conference EPEC, Ottawa, ON, Canada, 12–14 October 2016. [Google Scholar] [CrossRef]
  29. Malekpour, A.R.; Pahwa, A. A Dynamic Operational Scheme for Residential PV Smart Inverters. IEEE Trans. Smart Grid 2017, 8, 2258–2267. [Google Scholar] [CrossRef]
  30. Tiwari, R.; Babu, N.R. Recent developments of control strategies for wind energy conversion system. Renew. Sustain. Energy Rev. 2016, 66, 268–285. [Google Scholar] [CrossRef]
  31. Al-Ogaili, A.S.; Aris, I.B.; Verayiah, R.; Ramasamy, A.; Marsadek, M.; Rahmat, N.A.; Hoon, Y.; Aljanad, A.; Al-Masri, A.N. A Three-Level Universal Electric Vehicle Charger Based on Voltage-Oriented Control and Pulse-Width Modulation. Energies 2019, 12, 2375. [Google Scholar] [CrossRef] [Green Version]
  32. Al-Shetwi, A.Q.; Sujod, M.Z. Harmonic distortion and voltage imbalance study of photovoltaic power plant connected to the Malaysian grid. J. Telecommun. Electron. Comput. Eng. 2018, 10, 1–6. [Google Scholar]
  33. Chindris, M.; Cziker, A.; Miron, A. UPQC–The best solution to improve power quality in low voltage weak distribution networks. In Proceedings of the 2017 International Conference on Modern Power Systems, MPS 2017, Cluj-Napoca, Romania, 6–9 June 2017; pp. 1–8. [Google Scholar]
  34. Azit, A.H.M.; Sulaiman, S.; Sher, A.A. TNB Technical Guidebook on Grid-Interconnection of Photovoltaic Power Generation System to LV and MV Networks; Tenaga Nasional Berhad: Kuala Lumpur, Malaysia, 2013. [Google Scholar]
  35. Li, X.; Gui, F.; Li, Q. Can hydropower still be considered a clean energy source? Compelling evidence from a middle-sized hydropower station in China. Sustainability 2019, 11, 4261. [Google Scholar] [CrossRef] [Green Version]
  36. Suruhanjaya Tenaga Energy Commission. Shaping the Future of Malaysia’s Energy Sector; Suruhanjaya Tenaga Energy Commission: Putrajaya, Malaysia, 2019; Volume 18.
  37. Fossil Fuels—Our World in Data. Available online: https://ourworldindata.org/fossil-fuels (accessed on 3 June 2020).
  38. Martins, F.; Felgueiras, C.; Smitkova, M.; Caetano, N. Analysis of fossil fuel energy consumption and environmental impacts in european countries. Energies 2019, 12, 964. [Google Scholar] [CrossRef] [Green Version]
  39. Hubbert, M.K. 10 Hubbert Peak Theory. Energy 2009, 1, 649–676. [Google Scholar]
  40. Liu, H.; Li, J. The US shale gas revolution and its externality on crude oil prices: A counterfactual analysis. Sustainability 2018, 10, 697. [Google Scholar] [CrossRef] [Green Version]
  41. British Petroleum (BP). Statistical Review of World Energy; British Petroleum (BP): London, UK, 2018. [Google Scholar]
  42. Suruhanjaya Tenaga Energy Commission. Energy in Malaysia: Towards a Brighter Future; Suruhanjaya Tenaga Energy Commission: Putrajaya, Malaysia, 2017; Volume 12.
  43. Malaysia Continues Efforts to Reduce Carbon Footprint—Greentech Malaysia. Available online: https://www.greentechmalaysia.my/malaysia-continues-efforts-to-reduce-carbon-footprint/ (accessed on 8 September 2020).
  44. Sustainable Energy Development Authority (SEDA) National Renewable Energy Policy. Available online: http://www.seda.gov.my/policies/national-renewable-energy-policy-and-action-plan-2009/ (accessed on 12 December 2019).
  45. Kaur, S. Call to Embrace Low-Carbon, Development Approaches. Available online: https://www.nst.com.my/property/2018/08/404184/call-embrace-low-carbon-development-approaches (accessed on 28 July 2020).
  46. NEM—Renewable Energy Malaysia. Available online: http://www.seda.gov.my/reportal/nem/ (accessed on 15 July 2019).
  47. Sustainable Energy Development Authority (SEDA) Large Scale Solar [LSS]. Available online: http://www.seda.gov.my/reportal/large-scale-solar/ (accessed on 12 December 2019).
  48. Perea-Moreno, M.A.; Samerón-Manzano, E.; Perea-Moreno, A.J. Biomass as renewable energy: Worldwide research trends. Sustainability 2019, 11, 863. [Google Scholar] [CrossRef] [Green Version]
  49. Bird, L.; Cochran, J.; Wang, X. Wind and Solar Energy Curtailment: Experience and Practices in the United States; National Renewable Energy Lab.: Golden, CO, USA, 2014. [CrossRef] [Green Version]
  50. BBC News. Future Energy: China Leads World in Solar Power Production. Available online: https://www.bbc.com/news/business-40341833 (accessed on 4 June 2020).
  51. Malaysia—Asia Wind Energy Association 2020. Available online: https://www.asiawind.org/research-data/market-overview/malaysia/ (accessed on 7 November 2020).
  52. Malay Mail. Malaysia. MetMalaysia: Monsoon Transition Phase to Begin Thursday. Available online: https://www.malaymail.com/news/malaysia/2020/09/22/metmalaysia-monsoon-transition-phase-to-begin-thursday/1905641 (accessed on 7 November 2020).
  53. Zhang, S.; He, Y. Analysis on the development and policy of solar PV power in China. Renew. Sustain. Energy Rev. 2013, 21, 393–401. [Google Scholar] [CrossRef]
  54. Gul, M.; Kotak, Y.; Muneer, T. Review on Recent Trend of Solar Photovoltaic Technology. Energy Explor. Exploit. 2016, 34, 485–526. [Google Scholar] [CrossRef] [Green Version]
  55. Gulaliyev, M.G.; Mustafayev, E.R.; Mehdiyeva, G.Y. Assessment of Solar Energy Potential and Its Ecological-Economic Efficiency: Azerbaijan Case. Sustainability 2020, 12, 1116. [Google Scholar] [CrossRef] [Green Version]
  56. Liu, Y.; Zhang, R.Q.; Huang, Z.; Cheng, Z.; López-Vicente, M.; Ma, X.R.; Wu, G.L. Solar photovoltaic panels significantly promote vegetation recovery by modifying the soil surface microhabitats in an arid sandy ecosystem. L. Degrad. Dev. 2019, 30, 2177–2186. [Google Scholar] [CrossRef]
  57. Solar is Gaining Traction in MENA Region—But Plenty of Obstacles Remain—pv Magazine International. Available online: https://www.pv-magazine.com/2020/01/17/mesia-outlines-past-progress-future-promise-in-sweeping-look-at-solar-across-middle-east-and-north-africa/ (accessed on 4 June 2020).
  58. Mokri, A.; Ali, A.M.; Emziane, M. Solar energy in the UAE: A review. Renew. Sustain. Energy Rev. 2013, 28, 340–375. [Google Scholar] [CrossRef]
  59. Elavarasan, R.M.; Shafiullah, G.; Padmanaban, S.; Kumar, N.M.; Annam, A.; Vetrichelvan, A.M.; Mihet-Popa, L.; Holm-Nielsen, J.B. A Comprehensive Review on Renewable Energy Development, Challenges, and Policies of Leading Indian States with an International Perspective. IEEE Access 2020, 8, 74432–74457. [Google Scholar] [CrossRef]
  60. Sait, M.A.; Chigbu, U.E.; Hamiduddin, I.; de Vries, W.T. Renewable energy as an underutilised resource in cities: Germany’s “Energiewende” and lessons for post-brexit cities in the United Kingdom. Resources 2019, 8, 7. [Google Scholar] [CrossRef] [Green Version]
  61. Fraunhofer Institut für Solare Energiesysteme (ISE). Recent Facts about Photovoltaics in Germany; Fraunhofer ISE: Freiburg, Germany, 2020; Volume 1, p. 92. [Google Scholar]
  62. Mohammad, S.T.; Al-Kayiem, H.H.; Aurybi, M.A.; Khlief, A.K. Measurement of global and direct normal solar energy radiation in Seri Iskandar and comparison with other cities of Malaysia. Case Stud. Therm. Eng. 2020, 18, 100591. [Google Scholar] [CrossRef]
  63. Sustainable Energy Development Authority (SEDA). Feed-in-Tariff. Available online: http://www.seda.gov.my/reportal/fit/#:~:text=Malaysia’s Feed-in Tariff (FiT,grid for a specific duration (accessed on 12 December 2019).
  64. Suruhanjaya Tenaga Energy Commission. Guidelines for Solar Photovoltaic Installation on Net Energy Metering Scheme; Suruhanjaya Tenaga Energy Commission: Putrajaya, Malaysia, 2019.
  65. SEDA. NEM Concept. Available online: http://www.seda.gov.my/net-metering/nem-concept/ (accessed on 2 July 2019).
  66. Kaunda, C.S.; Kimambo, C.Z.; Nielsen, T.K. Hydropower in the Context of Sustainable Energy Supply: A Review of Technologies and Challenges. ISRN Renew. Energy 2012, 2012, 1–15. [Google Scholar] [CrossRef]
  67. Eurelectric Powering People. VGB Powertech. Facts of Hydropower in the EU; Eurelectric Powering People: Brussels, Belgium; VGB Powertech: Essen, Germany, 2018. [Google Scholar]
  68. Peters, M.; Fudge, S.; High-Pippert, A.; Carragher, V.; Hoffman, S.M. Community solar initiatives in the United States of America: Comparisons with—And lessons for—The UK and other European countries. Energy Policy 2018, 121, 355–364. [Google Scholar] [CrossRef]
  69. Tamil Nadu Energy Development Agency. Tamil Nadu Solar Energy Policy—2019. Available online: http://teda.in/wp-content/uploads/2019/02/SOLARPOLICY2019.pdf (accessed on 6 November 2020).
  70. Elavarasan, R.; Shafiullah, G.; Manoj Kumar, N.; Padmanaban, S. A State-of-the-Art Review on the Drive of Renewables in Gujarat, State of India: Present Situation, Barriers and Future Initiatives. Energies 2019, 13, 40. [Google Scholar] [CrossRef] [Green Version]
  71. Zhong, S.; Liu, C.; Qin, L. Solar industry development and policy support in China. Energy Procedia 2011, 5, 768–773. [Google Scholar] [CrossRef] [Green Version]
  72. Jain, S.; Newman, D.; Cepeda-Márquez, R.; Zeller, K. Global Food Waste Management: An Implamentation Guide for Cities; Full Report; World Biogas Association: London, UK, 2018; pp. 1–145. [Google Scholar]
  73. Ozturk, M.; Saba, N.; Altay, V.; Iqbal, R.; Hakeem, K.R.; Jawaid, M.; Ibrahim, F.H. Biomass and bioenergy: An overview of the development potential in Turkey and Malaysia. Renew. Sustain. Energy Rev. 2017, 79, 1285–1302. [Google Scholar] [CrossRef]
  74. Freiberg, A.; Scharfe, J.; Murta, V.C.; Seidler, A. The use of biomass for electricity generation: A scoping review of health effects on humans in residential and occupational settings. Int. J. Environ. Res. Public Health 2018, 15, 354. [Google Scholar] [CrossRef] [PubMed] [Green Version]
  75. Beschkov, V. Biogas, Biodiesel and Bioethanol as Multifunctional Renewable Fuels and Raw Materials. In Frontiers in Bioenergy and Biofuels; InTechOpen: Rijeka, Croatia, 2017; Volume 28, pp. 517–525. [Google Scholar]
  76. International Renewable Energy Agency (IRENA). Secretariat Biomass for Power Generation; International Renewable Energy Agency: Abu Dhabi, UAE, 2012; pp. 1–60. [Google Scholar]
  77. Chua, K.H.; Lim, Y.S.; Taylor, P.; Morris, S.; Wong, J. Energy storage system for mitigating voltage unbalance on low-voltage networks with photovoltaic systems. IEEE Trans. Power Deliv. 2012, 27, 1783–1790. [Google Scholar] [CrossRef]
  78. Worighi, I.; Maach, A.; Hafid, A.; Hegazy, O.; Van Mierlo, J. Integrating renewable energy in smart grid system: Architecture, virtualization and analysis. Sustain. Energy Grids Netw. 2019, 18, 100226. [Google Scholar] [CrossRef]
  79. Rahman, A.S.; Janakiraman, P.A.; Somasundaram, P. Voltage sag and swell mitigation based on modulated carrier PWM. Int. J. Electr. Power Energy Syst. 2015, 66, 78–85. [Google Scholar] [CrossRef]
  80. Torabi, R.; Gomes, A. The duck curve characteristic and storage requirements for Greening the Island of Porto Santo. In Proceedings of the International Conference on Energy and Sustainability in Small Developing Economies—ES2DE, Funchal, Portugal, 9–12 July 2018. [Google Scholar]
  81. Suruhanjaya Tenaga Energy Commission. Voltan Nominal. Available online: https://www.st.gov.my/en/web/general/details/144 (accessed on 17 August 2020).
  82. Tenaga Nasional Berhad. Voltage Sag Solutions for Industrial Customers Sag Solutions for Industrial Customers; Tenaga Nasional Berhad: Kuala Lumpur, Malaysia, 2011; Volume 5. [Google Scholar]
  83. Bingham, P.R. Sags and Swells. Available online: https://www.dranetz.com/wp-content/uploads/2014/02/sags-and-swells.pdf (accessed on 23 July 2020).
  84. IEEE Std 1159-2019. IEEE Recommended Practice for Monitoring Electric Power Quality; Springer: Dordrecht, The Netherlands, 2019; Volume 2019. [Google Scholar]
  85. Bayliss, C.R.; Hardy, B.J. Power Quality—Voltage Disturbances. In Transmission and Distribution Electrical Engineering; Newnes: Oxford, UK, 2012; pp. 1013–1026. [Google Scholar] [CrossRef]
  86. Huang, J.; Jiang, Z. Power Quality Assessment of Different Load Categories. Energy Procedia 2017, 141, 345–351. [Google Scholar] [CrossRef]
  87. Chawda, G.S.; Shaik, A.G.; Shaik, M.; Sanjeevikumar, P.; Holm-Nielsen, J.B.; Mahela, O.P.; Palanisamy, K. Comprehensive Review on Detection and Classification of Power Quality Disturbances in Utility Grid with Renewable Energy Penetration. IEEE Access 2020, 1. [Google Scholar] [CrossRef]
  88. Ansari, A.S.; Mizani, A.R.; Ashouri, S.; Moghani, S.J. Fault Ride-Through Capability Enhancement for Microinverter Applications. J. Renew. Energy 2019, 2019, 1–12. [Google Scholar] [CrossRef]
  89. Horak, J. Power quality: Measurements of sags and interruptions. In Proceedings of the IEEE Power Engineering Society Transmission and Distribution Conference, Dallas, TX, USA, 21–26 May 2006; pp. 733–739. [Google Scholar] [CrossRef]
  90. Tenaga Nasional Berhad (TNB). Technical Guideline for Connection of Indirect Solar PV Power Generation for Net Energy Metering; Tenaga Nasional Berhad (TNB): Kuala Lumpur, Malaysia, 2017. [Google Scholar]
  91. Langella, R.; Testa, A.; Alii, E. IEEE Power and Energy Society IEEE Recommended Practice and Requirements for Harmonic Control in Electric Power Systems; IEEE: Piscataway Township, NJ, USA, 2014. [Google Scholar]
  92. Sušin, D.; Nemec, M.; Ambrožič, V.; Nedeljković, D. Limitations of Harmonics Control in Power Converters. Electronics 2019, 8, 739. [Google Scholar] [CrossRef] [Green Version]
  93. Collinson, A.; Stones, J. Power quality. Power Eng. J. 2001, 15, 58–64. [Google Scholar] [CrossRef]
  94. Halpin, S.M.; Card, A. Power Quality, 3rd ed.; Elsevier Inc.: Amsterdam, The Netherlands, 2011; ISBN 9780123820365. [Google Scholar]
  95. Alhafadhi, L.; Teh, J. Advances in reduction of total harmonic distortion in solar photovoltaic systems: A literature review. Int. J. Energy Res. 2020, 44, 2455–2470. [Google Scholar] [CrossRef]
  96. Tenaga Nasional Berhad (TNB). Power Factor—Tenaga Nasional Berhad. Available online: https://www.tnb.com.my/commercial-industrial/power-factor (accessed on 17 August 2020).
  97. Alberts, J.A.; De Kock, J.A. Impact on power factor by small scale renewable energy generation. In Proceedings of the 25th International Conference on the Domestic Use of Energy (DUE), Rio de Janeiro, Brasil, 2–5 April 2017; pp. 146–151. [Google Scholar] [CrossRef]
  98. Farhoodnea, M.; Mohamed, A.; Shareef, H.; Zayandehroodi, H. Power Quality Impact of Renewable Energy based Generators and Electric Vehicles on Distribution Systems. Procedia Technol. 2013, 11, 11–17. [Google Scholar] [CrossRef] [Green Version]
  99. Parvathy, S.; Thampatty, K.C.S. Dynamic Modeling and Control of UPFC for Power Flow Control. Procedia Technol. 2015, 21, 581–588. [Google Scholar] [CrossRef] [Green Version]
  100. Aloh, J.M.; Ogbuefi, U.C.; Mbunwe, M.J.; Madueme, T.C. Evaluating the Performance of Unified Power Flow Controller ( UPFC ) On Fault Current Limitation in the Nigrian 330kv Power System. IOSR J. Electr. Electron. Eng. 2017, 12, 61–70. [Google Scholar] [CrossRef]
  101. Rawat, A.K.; Pandey, A.S.; Srivastava, A.K. Reactive Power Compensation in Single Phase Distribution System using SVC, STATCOM & UPFC. Int. Res. J. Eng. Technol. 2017, 4, 2017. [Google Scholar]
  102. Pal, R.; Gupta, S. Topologies and Control Strategies Implicated in Dynamic Voltage Restorer (DVR) for Power Quality Improvement. Iran. J. Sci. Technol. Trans. Electr. Eng. 2020, 44, 581–603. [Google Scholar] [CrossRef]
  103. El-Khattam, W.; Elnady, A.; Salama, M.M.A. Dynamic voltage restorer cost reduction in the distributed generation environment. Electr. Power Compon. Syst. 2004, 32, 611–626. [Google Scholar] [CrossRef]
  104. Moradlou, M.; Karshenas, H.R. Design strategy for optimum rating selection of interline DVR. IEEE Trans. Power Deliv. 2011, 26, 242–249. [Google Scholar] [CrossRef]
  105. Kececioglu, O.F.; Gani, A.; Sekkeli, M. A performance comparison of static VAr compensator based on Goertzel and FFT algorithm and experimental validation. Springerplus 2016, 5. [Google Scholar] [CrossRef] [Green Version]
  106. Nwohu, M.N. Voltage Stability Improvement using Static Var Compensator in Power Systems. Leonardo J. Sci. 2009, 14, 167–172. [Google Scholar]
  107. Igbinovia, F.O.; Fandi, G.; Svec, J.; Muller, Z.; Tlustý, J. Comparative review of reactive power compensation technologies. In Proceedings of the 16th International Scientific Conference on Electric Power Engineering, Kouty nad Desnou, Czech Republic, 20–22 May 2015; pp. 2–7. [Google Scholar] [CrossRef]
  108. Song, Y.H.; Allan, T.J. Flexible AC Transmission Systems (FACTS); Song, Y.H., Johns, A.T., Eds.; The Institution of Engineering and Technology, IET: Stevenage, UK, 1999; ISBN 9780852967713. [Google Scholar]
  109. Lomi, A.; Dhadbanjan, T. A Balanced Operation of Static VAR Compensator for Voltage Stability Improvement and Harmonic Minimization. Int. J. Emerg. Electr. Power Syst. 2018, 19, 1–9. [Google Scholar] [CrossRef]
  110. Ma, Y.; Huang, A.; Zhou, X. A review of STATCOM on the electric power system. In Proceedings of the IEEE International Conference on Mechatronics and Automation—ICMA 2015, Beijing, China, 2–5 August 2015; pp. 162–167. [Google Scholar] [CrossRef]
  111. Shinde, O.K.; Pulavarthi, V.R.S.V.B. STATCOM converters and control: A review. In Proceedings of the International Conference on Data Management, Analytics & Innovations—ICDMAI 2017, Pune, India, 24–26 February 2017; pp. 145–151. [Google Scholar] [CrossRef]
  112. Rahmani, S.; Hamadi, A.; Al-Haddad, K.; Dessaint, L.A. A combination of shunt hybrid power filter and thyristor-controlled reactor for power quality. IEEE Trans. Ind. Electron. 2014, 61, 2152–2164. [Google Scholar] [CrossRef]
  113. Tokiwa, A.; Yamada, H.; Tanaka, T.; Watanabe, M.; Shirai, M.; Teranishi, Y. New hybrid static var compensator with series active filter. In Proceedings of the International Conference on Power Electronics and Drives Systems, Tehran, Iran, 13–15 February 2018; pp. 901–906. [Google Scholar] [CrossRef]
  114. Panah, S.F.; Panah, T.F.; Ghannad, G.A. Reactive power compensation in wind power plant with short circuit in power plant line via UPFC. In Proceedings of the 2016 IEEE International Conference on Renewable Energy Research and Applications, ICRERA 2016, Birmingham, UK, 20–23 November 2020; IEEE: Piscataway Township, NJ, USA, 2017; Volume 5, pp. 173–176. [Google Scholar]
  115. Gandhar, A.; Gupta, S.; Tiwari, M.; Gandhar, S. A continuous mitigation of kVAR-voltage problem of hybrid isolated power system using UPFC. J. Inf. Optim. Sci. 2020, 41, 317–325. [Google Scholar] [CrossRef]
  116. Rao, L.B.; Kumar, P.P.S. Mitigation of unbalanced voltage sags and swells of power system in utility side by using Sen Transformer. Int. J. Eng. Technol. 2018, 7, 267–273. [Google Scholar] [CrossRef] [Green Version]
  117. Chen, N.; Jonsson, L.E. A new Hybrid power electronics on-load tap changer for power transformer. In Proceedings of the IEEE Applied Power Electronics Conference and Exposition (APEC), Charlotte, NC, USA, 15–19 March 2015; pp. 1030–1037. [Google Scholar] [CrossRef]
  118. Nguyen, H.M.; Naidu, D.S. Evolution of wind turbine control systems. In Encyclopedia of Control Systems, Robotics, and Automation; EOLSS Publishers: Oxford, UK, 2010. [Google Scholar]
  119. Czarnecki, L. Comparison of instantaneous reactive power p–q theory with theory of the current’s physical components. Electr. Eng. 2003, 85, 21–28. [Google Scholar] [CrossRef]
  120. Mosaad, M.I. Model reference adaptive control of STATCOM for grid integration of wind energy systems. IET Electr. Power Appl. 2018, 12, 605–613. [Google Scholar] [CrossRef]
  121. Song, Y.; Zhang, Z.; Li, P.; Wang, W.; Qin, M. Robust adaptive variable speed control of wind power systems without wind speed measurement. J. Renew. Sustain. Energy 2013, 5. [Google Scholar] [CrossRef]
  122. Zheng, C.; Dragičević, T.; Majmunović, B.; Blaabjerg, F. Constrained Modulated Model-Predictive Control of an LC-Filtered Voltage-Source Converter. IEEE Trans. Power Electron. 2020, 35, 1967–1977. [Google Scholar] [CrossRef]
  123. Kang, L.; Cheng, J.; Hu, B.; Luo, X.; Zhang, J. A simplified optimal-switching-sequence mpc with finite-control-set moving horizon optimization for grid-connected inverter. Electronics 2019, 8, 457. [Google Scholar] [CrossRef] [Green Version]
  124. Mishra, M. Power quality disturbance detection and classification using signal processing and soft computing techniques: A comprehensive review. Int. Trans. Electr. Energy Syst. 2019, 29. [Google Scholar] [CrossRef] [Green Version]
  125. Seyedmahmoudian, M.; Horan, B.; Soon, T.K.; Rahmani, R.; Oo, A.M.T.; Mekhilef, S.; Stojcevski, A. State of the art artificial intelligence-based MPPT techniques for mitigating partial shading effects on PV systems—A review. Renew. Sustain. Energy Rev. 2016, 64, 435–455. [Google Scholar] [CrossRef]
  126. Du, Z.; Tolbert, L.M.; Ozpineci, B.; Chiasson, J.N. Fundamental frequency switching strategies of a seven-level hybrid cascaded H-bridge multilevel inverter. IEEE Trans. Power Electron. 2009, 24, 25–33. [Google Scholar] [CrossRef] [Green Version]
  127. Liu, H.; Tolbert, L.M.; Ozpineci, B.; Du, Z. Comparison of fundamental frequency and PWM methods applied on a hybrid cascaded multilevel inverter. In Proceedings of the IECON Industrial Electronics Conference, Orlando, FL, USA, 10–13 November 2008; pp. 3233–3237. [Google Scholar] [CrossRef]
  128. Kumar, P.; Singh, A.K.; Kummari, N.K. P-q theory based modified control algorithm for load compensating using DSTATCOM. In Proceedings of the 16th International Conference on Harmonics and Quality of Power, Bucharest, Romania, 25–28 May 2014; pp. 591–595. [Google Scholar] [CrossRef]
  129. Kersting, S.; Buss, M. Direct and Indirect Model Reference Adaptive Control for Multivariable Piecewise Affine Systems. IEEE Trans. Autom. Control 2017, 62, 5634–5649. [Google Scholar] [CrossRef]
  130. Heydari, A. Optimal switching with minimum dwell time constraint. J. Frank. Inst. 2017, 354, 4498–4518. [Google Scholar] [CrossRef]
  131. Albea, C.; Gordillo, F.; Canudas-de-wit, C. Control Engineering Practice Adaptive control design for a boost inverter. Control Eng. Pract. 2011, 19, 32–44. [Google Scholar] [CrossRef] [Green Version]
  132. Hong, W. Adaptive Control Schemes for Three-phase Grid-Connected Inverters in Photovoltaic Power Generation Systems; University of Virginia: Charlottesville, VA, USA, 2017. [Google Scholar]
  133. Ahmed, A.A.; Koh, B.K.; Lee, Y., II. A Comparison of Finite Control Set and Continuous Control Set Model Predictive Control Schemes for Speed Control of Induction Motors. IEEE Trans. Ind. Inform. 2018, 14, 1334–1346. [Google Scholar] [CrossRef]
  134. Rohouma, W.; Balog, R.S.; Ahmad, A.; Begovic, M.M. D-STATCOM for harmonic mitigation in low voltage distribution network with high penetration of nonlinear loads. Renew. Energy 2020, 145, 1449–1464. [Google Scholar] [CrossRef]
  135. Shan, Y.; Hu, J.; Member, S.; Li, Z.; Guerrero, J.M. A Model Predictive Control for Renewable Energy Based AC Microgrids without Any PID Regulators. IEEE Trans. Power Electron. 2018, 33, 5. [Google Scholar] [CrossRef] [Green Version]
  136. Zeng, P.P.; Wu, Z.; Zhang, X.P.; Liang, C.; Zhang, Y. Model predictive control for energy storage systems in a network with high penetration of renewable energy and limited export capacity. In Proceedings of the 2014 Power Systems Computation Conference PSCC, Wroclaw, Poland, 18–22 August 2014; pp. 10–13. [Google Scholar] [CrossRef]
  137. García-Triviño, P.; Gil-Mena, A.J.; Llorens-Iborra, F.; García-Vázquez, C.A.; Fernández-Ramírez, L.M.; Jurado, F. Power control based on particle swarm optimization of grid-connected inverter for hybrid renewable energy system. Energy Convers. Manag. 2015, 91, 83–92. [Google Scholar] [CrossRef]
  138. Breban, S. Genetic Algorithm Optimization of an Energy Storage System Design and Fuzzy Logic Supervision for Battery Electric Vehicles. In Optimization Algorithms—Methods and Applications; InTechOpen: Rijeka, Croatia, 2016; Volume 10, pp. 1–15. [Google Scholar]
  139. Natsheh, E.M.; Albarbar, A. Hybrid Power Systems Energy Controller Based on Neural Network and Fuzzy Logic. Smart Grid Renew. Energy 2013, 4, 187–197. [Google Scholar] [CrossRef] [Green Version]
  140. Vadivelu, K.R.; Marutheswar, G.V. Artificial intelligence technique based Reactive Power Planning incorporating FACTS Controllers in Real Time Power Transmission System. In Proceedings of the 2014 IEEE 2nd International Conference on Electrical Energy Systems (ICEES), Chennai, India, 7–9 January 2014; IEEE: Piscataway Township, NJ, USA, 2014; pp. 26–31. [Google Scholar]
  141. Sunny, M.S.H.; Hossain, E.; Ahmed, M.; Un-Noor, F. Artificial Neural Network Based Dynamic Voltage Restorer for Improvement of Power Quality. In Proceedings of the 2018 IEEE Energy Conversion Congress and Exposition, Portland, OR, USA, 23–27 September 2018; pp. 5565–5572. [Google Scholar] [CrossRef]
  142. Ghahremani, E.; Kamwa, I. Analysing the effects of different types of FACTS devices on the steady-state performance of the Hydro-Québec network. IET Gener. Transm. Distrib. 2013, 8, 233–249. [Google Scholar] [CrossRef]
  143. Mellit, A.; Kalogirou, S.A. MPPT-based artificial intelligence techniques for photovoltaic systems and its implementation into field programmable gate array chips: Review of current status and future perspectives. Energy 2014, 70, 1–21. [Google Scholar] [CrossRef]
  144. Sivaramakrishnan, N.; Hemavathy, P.R.; Anitha, G. Design of Hybrid control for Isothermal Continuous stirred tank Reactor. Int. J. Pure Appl. Math. 2017, 117, 999–1009. [Google Scholar]
  145. Halder, A.; Pal, N.; Mondal, D. Higher order sliding mode STATCOM control for power system stability improvement. Math. Comput. Simul. 2020, 177, 244–262. [Google Scholar] [CrossRef]
  146. Chinnappan, R.; Logamani, P.; Ramasubbu, R. Fixed- and variable-frequency sliding mode controller–maximum power point tracking converter for two-stage grid-integrated photovoltaic system employing nonlinear loads with power quality improvement features. Meas. Control (U.K.) 2019, 52, 896–912. [Google Scholar] [CrossRef] [Green Version]
  147. Yasin, A.R.; Ashraf, M.; Bhatti, A.I.; Uppal, A.A. Fixed frequency sliding mode control of renewable energy resources in DC micro grid. Asian J. Control 2019, 21, 2074–2086. [Google Scholar] [CrossRef]
  148. Kassarwani, N.; Ohri, J.; Singh, A. Performance analysis of dynamic voltage restorer using modified sliding mode control. Int. J. Electron. Lett. 2018, 1–15. [Google Scholar] [CrossRef]
  149. Dash, P.K.; Sahoo, N.C.; Elangovan, S.; Liew, A.C. Sliding mode control of a static VAR controller for synchronous generator stabilization. Int. J. Electr. Power Energy Syst. 1996, 18, 55–64. [Google Scholar] [CrossRef]
  150. Dil Kumar, T.R.; Mija, S.J. Dynamic SMC control scheme with adaptively tuned PID controller for speed control of DC motor. In Proceedings of the 2015 IEEE International Conference on Industrial Technology (ICIT), Seville, Spain, 17–19 March 2015; IEEE: Piscataway Township, NJ, USA, 2015; pp. 187–191. [Google Scholar]
  151. Hashim, A.; Ahmed, O. Performance Comparison of Sliding Mode Control and Conventional PI Controller for Speed Control of Separately Excited Direct Current Motors. J. Sci. Technol. 2012, 13, 6. [Google Scholar]
  152. Taheri, B. A new general controller for DC-DC converters based on SMC methods. In Proceedings of the 2018 6th International Istanbul Smart Grids and Cities Congress and Fair (ICSG), Istanbul, Turkey, 25–26 April 2018; IEEE: Piscataway Township, NJ, USA, 2018; pp. 49–53. [Google Scholar]
  153. Acha, E.; Agelidis, V.G.; Anaya-Lara, O.; Miller, T.J.E. Power Electronic Control in Electrical Systems; Elsevier: Amsterdam, The Netherlands, 2002; ISBN 9780750651264. [Google Scholar]
  154. Isobe, T. A full-Bridge AC power flow controller with reduced capacitance operated with both FFS (Fundamental frequency switching) and PWM. In Proceedings of the IEEE Energy Conversion Congress and Exposition, Pittsburgh, PA, USA, 14–18 September 2014; pp. 1939–1945. [Google Scholar] [CrossRef]
  155. Zakaria, S.U.; Basri, S.; Kamarudin, S.K.; Majid, N.A.A. Public Awareness Analysis on Renewable Energy in Malaysia. IOP Conf. Ser. Earth Environ. Sci. 2019, 268. [Google Scholar] [CrossRef]
  156. Vakulchuk, R.; Chan, H.-Y.; Kresnawan, M.R.; Merdekawati, M.; Overland, I.; Sagbakken, H.F.; Suryadi, B.; Utama, N.A.; Yurnaidi, Z. Action plan to attract investment in renewable energy in Malaysia. In Malaysia: How to Scale up Investment in Renewable Energy Main energy body Ministry of Energy and Natural Resources Renewable Energy; Division Sustainable Energy Development Authority Smaller; ASEAN Centre for Energy (ACE): Jakarta, Indonesia, 2020. [Google Scholar] [CrossRef]
  157. AlSkaif, T.; Lampropoulos, I.; Broek, V.D.M.; Sark, V.W. Gamification-based framework for engagement of residential customers in energy applications. Energy Res. Soc. Sci. 2018, 44, 187–195. [Google Scholar] [CrossRef]
  158. Bakhtyar, B.; Saadatian, O.; Alghoul, M.A.; Ibrahim, Y.; Sopian, K. Solar electricity market in Malaysia: A review of feed-in tariff policy. Environ. Prog. Sustain. Energy 2015, 34, 600–606. [Google Scholar] [CrossRef]
  159. Chin, M.J.; Poh, P.E.; Tey, B.T.; Chan, E.S.; Chin, K.L. Biogas from palm oil mill effluent (POME): Opportunities and challenges from Malaysia’s perspective. Renew. Sustain. Energy Rev. 2013, 26, 717–726. [Google Scholar] [CrossRef]
  160. Zainuddin, H.; Yahaya, M.S.; Lazi, J.M.; Basar, M.F.M.; Ibrahim, Z. Design and development of pico-hydro generation system for energy storage using consuming water distributed to houses. World Acad. Sci. Eng. Technol. 2009, 59, 154–159. [Google Scholar]
  161. Yaakub, M.F.; Basar, M.F.; Noh, F.H.M.; Boejang, H. Pico-hydro electrification from rainwater’s gravitational force for urban area. Telkomnika 2018, 16, 997–1003. [Google Scholar] [CrossRef]
  162. Han, R.; Zhou, Q. Data-driven solutions for power system fault analysis and novelty detection. In Proceedings of the 11th International Conference on Computer Science & Education—ICCSE, Nagoya, Japan, 23–25 August 2016; pp. 86–91. [Google Scholar] [CrossRef]
  163. Alsafasfeh, H.Q. Pattern Recognition for Fault Detection, Classification, and Localization in Electrical Power System. Ph.D. Thesis, Western Michigan University, Kalamazoo, Michigan, 2010; p. 139. [Google Scholar]
  164. Manuja, S.; Patwardhan, S.; Narasimhan, S. Fault diagnosis and fault tolerant control using reduced order models. IFAC Proc. Vol. 2004, 37, 625–630. [Google Scholar] [CrossRef]
  165. Fagarasan, I.; Iliescu, S.S. Parity equations for fault detection and isolation. In Proceedings of the 2008 IEEE International Conference on Automation, Quality and Testing, Robotics, AQTR 2008, THETA 16th Edition, Cluj-Napoca, Romania, 22–25 May 2008; Volume 1, pp. 99–103. [Google Scholar]
  166. Jamil, M.; Sharma, S.K.; Singh, R. Fault detection and classification in electrical power transmission system using artificial neural network. Springerplus 2015, 4. [Google Scholar] [CrossRef] [PubMed] [Green Version]
  167. Adhikari, S.; Sinha, N.; Dorendrajit, T. Fuzzy logic based on-line fault detection and classification in transmission line. Springerplus 2016, 5. [Google Scholar] [CrossRef] [Green Version]
  168. Gururajapathy, S.S.; Mokhlis, H.; Illias, H.A. Fault location and detection techniques in power distribution systems with distributed generation: A review. Renew. Sustain. Energy Rev. 2017, 74, 949–958. [Google Scholar] [CrossRef]
  169. Van Tu, D.; Chaitusaney, S.; Yokoyama, A. Fault current calculation in distribution systems with inverter-based distributed generations. IEEJ Trans. Electr. Electron. Eng. 2013, 8, 470–477. [Google Scholar] [CrossRef]
  170. Abdelghani, B.-B.A.; Sethom, B.A.H. Modeling PV installations under partial shading conditions. SN Appl. Sci. 2020, 2, 1–9. [Google Scholar] [CrossRef] [Green Version]
  171. Hua, Y.; Shentu, X.; Xie, Q.; Ding, Y. Voltage/frequency deviations control via distributed battery energy storage system considering state of charge. Appl. Sci. 2019, 9, 1148. [Google Scholar] [CrossRef] [Green Version]
  172. Pothirasan, N.; Rajasekaran, M.P.; Muneeswaran, V. Real time reactive power compensation for battery/photovoltaic hybrid power source for internet of hybrid electric vehicle system. Cogn. Syst. Res. 2018, 52, 473–488. [Google Scholar] [CrossRef]
  173. Tran, V.T.; Islam, M.R.; Sutanto, D.; Muttaqi, K.M. Mitigation of Solar PV Intermittency Using Ramp-Rate Control of Energy Buffer Unit. IEEE Trans. Energy Convers. 2019, 34, 435–445. [Google Scholar] [CrossRef]
  174. Chan, K.; Kara, A.; Kieboom, G. Power quality improvement with solid state transfer switches. In Proceedings of the 8th International Conference on Harmonics and Quality of Power—ICHQP, Athens, Greece, 14–16 October 1998; Volume 1, pp. 210–215. [Google Scholar] [CrossRef]
  175. Kajiwara, K.; Matsui, N.; Kurokawa, F. A New MPPT Control for Solar Panel under Bus Voltage Fluctuation. In Proceedings of the 2017 IEEE 6th International Conference on Renewable Energy Research and Applications (ICRERA), San Diego, CA, USA, 5–8 November 2017; IEEE: Piscataway Township, NJ, USA, 2017; Volume 5, pp. 1047–1050. [Google Scholar]
  176. Chaibi, Y.; Allouhi, A.; Salhi, M.; El-jouni, A. Annual performance analysis of different maximum power point tracking techniques used in photovoltaic systems. Prot. Control Mod. Power Syst. 2019, 4, 1–10. [Google Scholar] [CrossRef]
  177. Tabatabaei, N.M.; Kabalci, E.; Bizon, N. Microgrid Architectures, Control and Protection Methods; Tabatabaei, N.M., Kabalci, E., Bizon, N., Eds.; Power Systems; Springer International Publishing: Cham, Switzerland, 2020; ISBN 978-3-030-23722-6. [Google Scholar]
  178. Khoukhi, A.; Khalid, M.H. Hybrid computing techniques for fault detection and isolation, a review. Comput. Electr. Eng. 2015, 43, 17–32. [Google Scholar] [CrossRef]
  179. Prakash, M.; Pradhan, S.; Roy, S. Soft computing techniques for fault detection in power distribution systems: A review. In Proceedings of the IEEE International Conference on Green Computing, Communication and Electrical Engineering, Coimbatore, India, 6–8 March 2014. [Google Scholar] [CrossRef]
  180. Srinivasan, D.; Cheu, R.L.; Poh, Y.P.; Ng, A.K.C. Automated fault detection in power distribution networks using a hybrid fuzzy-genetic algorithm approach. Eng. Appl. Artif. Intell. 2000, 13, 407–418. [Google Scholar] [CrossRef]
Figure 1. A representation of distribution grid- interconnected with renewable sources and distribution loads [21].
Energies 13 06479 g001
Figure 2. Current energy mix in Malaysia [36].
Energies 13 06479 g002
Figure 3. Hubbert’s peak prediction vs. actual production in the USA [37,39].
Energies 13 06479 g003
Figure 4. (a) Carbon emission reduction of several locations in Malaysian cities; (b) Categorization of activities/initiatives conducted according to the respective location [43].
Energies 13 06479 g004
Figure 5. Common power quality regulations and disturbances within an RE interconnected Malaysian distribution system.
Energies 13 06479 g005
Figure 6. A general representation of a Dynamic Voltage Restorer [102].
Energies 13 06479 g006
Figure 7. General representation of a (a) SVC [108] (b) Static Synchronous Compensator [110].
Energies 13 06479 g007
Figure 8. A general representation of an UPFC [99].
Energies 13 06479 g008
Figure 9. Block representation of the control scheme inside a power quality compensation device.
Energies 13 06479 g009
Figure 10. Overview of control strategies present in a PQ compensation device [87,118].
Energies 13 06479 g010
Figure 11. The basic concept modelling of a p-q theorem [128].
Energies 13 06479 g011
Figure 12. The block representation of (a) direct adaptive control [118] (b) indirect adaptive control [118].
Energies 13 06479 g012
Figure 13. Working operation of SMC [144,145].
Energies 13 06479 g013
Figure 14. Detection block in a control scheme for PQ compensation device.
Energies 13 06479 g014
Figure 15. Flow-of-work on the detection method along with a control scheme for non-linear conditions (a) data-driven [162] (b) process model [165] (c) knowledge based [168].
Energies 13 06479 g015
Figure 16. Configuration representation of a BESS model in grid support.
Energies 13 06479 g016
Figure 17. A generic representation of the power dispatch control Scheme on a grid-feeding topology.
Energies 13 06479 g017
Table 1. Initiatives by countries in promoting solar energy.
CountriesInitiativesDescription (Country)Refs
China, USA, UKPolicy
  • Mandatory connection and purchase of policies between renewable generators and grid companies (China)
  • Renewable portfolio standards on renewable source in 1978 (USA)
  • Renewable Energy certificate in ensuring SREC price stability (USA)
  • Renewable Obligation Certificate (ROC) introduced to enforce the electrical supplier in taking in more renewable source generation (UK)
  • Tamil Naidu Solar Policy in 2019 on 5000 MW LSS and 9000 MW in 2023 (India)
[53,60,68,69]
China, GermanyCorporate Social Responsibility (CSR)
  • Set up PV module to provide electricity for daily needs in rural areas that has no electric grid connection under Brightness and Township Electrification Program (China)
  • Free connection service for distributed PV that are located close to customer which its installation capacity is less than 6 MW (China)
  • Elimination on nuclear power plant and introduce renewable energies especially on solar energy (Germany)
  • Solar Home System (SHS) is introduced in 2003 to provide electricity in Bangladesh’s remote communities (Bangladesh)
  • Installation of solar street lighting, rooftop PV and solar traffic lights on main roads (India)
[53,60,70]
China, Japan, USA, GermanySubsidies, Incentives, Benefits and Tax Exemptions
  • Discount entitlement on rooftop panels and off-grid PV installation (China)
  • Subsidiaries provided to all public facilities, highway rest areas and railway in solar installation (Japan)
  • Tax credit policy to claim 30% of qualified expenditure for PV system owned by a U.S. residence and taxpayers (USA)
  • NEM scheme to sell excessive power generated back to grid (USA)
  • Cash rebates to encourage PV plant in reducing the installation costs of PV (USA)
  • Taxpayer can claim 30% of the qualified expenditure from PV installation (USA)
  • Provide low interest loans and incentive for PV installation and generation (Germany)
[18,53,68,71]
China, Japan, USA, Germany, UKFeed-in Tariff Scheme (FiT) and Net Energy metering Scheme (NEM)
  • Entitled tariff of (RMB1.15/kWh) on power generated to the grid (China)
  • FiT rates are fixed and paid to renewable generators for each kWh generated (China)
  • Introduction to FiT scheme in 2011 to encourage renewable generation support to the grid by a fixed 6% rate for 20 years (Japan)
  • NEM scheme on Residential PV System Dissemination Program to sell excess generation back to the grid (Japan)
  • Extra generation from PV will be sent to the grid with different rates according to states (USA)
  • Regulation of FiT scheme based on the installed PV capacity (Germany)
  • FiT scheme to increase the net saving by integrating with Green Deal (UK)
  • Gross metering and feed-in-tariff for rooftop solar projects and NEM rooftop solar grid-interactive system in Gujarat (India)
[50,53,58,60,70,71]
China, Japan, Germany, UKResearch and Development Program (R&D)
  • R&D Funding on different types of solar cell to increase the efficiency of the cell (China, Japan)
  • Provide investment and incentive support to the manufacturers (China)
  • Sunshine Project is established to promote research and development on clean energy technology especially on solar materials (Japan)
  • Research focusing on environmental and affordable energy supply (Germany)
  • Research on non-nuclear technology sources (Germany)
  • Initiative SCOLAR program to spread awareness on PV research and application (UK)
  • Collaboration between industries and university to make solar energy economically reasonable (UK)
[53,58,71]
Table 2. Summarization of voltage disturbance issues on voltage interruption, fluctuation, sag, and swell.
DescriptionCausesMagnitude DurationRefs.
InterruptionFault occurs at the feeder or loose connection in wiringReduction of r.m.s voltage at least 0.9 p.u.Less than a minute[84,86]
Voltage SagFault occurrence within power system network or a sudden switching of heavy load or motorReduction of r.m.s voltage from 0.1–0.9 p.u.0.5 cycle to a minute[83,84]
Voltage SwellSwitching off large load application or switching on a capacitor bankIncrease of r.m.s. voltage from 1.1–1.8 p.u.0.5 cycle to a minute
Voltage FluctuationInconsistent generation from environment-dependent RESRandom changes of voltage magnitude which varies ±10% of the nominal voltage levelIntermittent[84,87]
Table 3. Permissible Total Harmonics Distortion for current in the Malaysian distribution network.
OrderHarmonics LevelAllowable THD (Current)Ref.
Odd3–9<4%[91]
11–15<2%
17–21<1.5%
23–33<0.6%
Even2–8<1%
10–32<0.5%
Table 4. Performance analysis summarization of the non-linear control techniques (PWM and FFS).
Non-Linear Control Techniquep-qACSMPCAISMCFFS
DirectIndirectFCSCCSOpt.Class.
Robustness424335531
Simplicity in Design and Parameters343334322
Convergence Time124334521
Performance on PQ Disturbance Compensation134344333
Controller Tolerance Towards Disturbance212234424
Dealing with Uncertainties or Newer Problems113335452
Reference[119][120,121][122,123][87,124,125][118][126,127]
Note: Higher number indicates better performance index (1–5), Opt. = Optimization, Class. = Classification.
Table 5. Concept and examples of optimization and classification Artificial Intelligence control technique.
OptimizationClassification
ConceptA process to determine the best achieved value or parameter from the addressed objectiveA set of distinct features or parameter can be characterized through a classifier which is relevant to the addressed objective.
Application in grid systems interconnected with primary supply, RES or energy storage systems
  • Self-tuning of the controller by attaining the best performance of work in dealing high penetration of RES, energy storage and primary generation [137].
  • Further optimization of the classification AI control technique through hybrid approach in grid-connected applications [138].
  • Classification of different PQ disturbance in the grid system especially in grid-connected RES [124]
  • Determine the parametric operational range for controllers in a hybrid power system [139].
OutcomeOptimization method offers feasible solution in subsidizing uncertainties and able to achieve convergence in most cases of a control system. However, the computational speed varies in accordance to the type or method used for the optimization techniqueClassification technique offers robustness and simplicity for a process control design and good performance in achieving convergence of a system. On the other hand, this technique has lacks adaptability and heavy uncertainties in obtaining the parameter or values within the system.
Notable Example
  • Genetic Algorithm (GA)
  • Particle Swarm Optimization (PSO)
  • Heuristic
  • Metaheuristic
  • Artificial Neural Network (ANN/NN)
  • Fuzzy Logic (FL)
  • Support Vector Machine (SVM)
Publisher’s Note: MDPI stays neutral with regard to jurisdictional claims in published maps and institutional affiliations.

