Study of Renewable Energy Penetration on a Benchmark Generation and Transmission System


1
SPARK Laboratory, ECE Department, University of Kentucky, Lexington, KY 40506, USA
2
Louisville Gas and Electric and Kentucky Utilities, Louisville, KY 40202, USA
*
Author to whom correspondence should be addressed.
Energies 2021, 14(1), 169; https://doi.org/10.3390/en14010169
Submission received: 13 December 2020
/
Revised: 28 December 2020
/
Accepted: 28 December 2020
/
Published: 31 December 2020
(This article belongs to the Section F: Electrical Engineering)
Abstract
:Significant changes in conventional generator operation and transmission system planning will be required to accommodate increasing solar photovoltaic (PV) penetration. There is a limit to the maximum amount of solar that can be connected in a service area without the need for significant upgrades to the existing generation and transmission infrastructure. This study proposes a framework for analyzing the impact of increasing solar penetration on generation and transmission networks while considering the responses of conventional generators to changes in solar PV output power. Contrary to traditional approaches in which it is assumed that generation can always match demand, this framework employs a detailed minute-to-minute (M-M) dispatch model capable of capturing the impact of renewable intermittency and estimating the over- and under-generation dispatch scenarios due to solar volatility and surplus generation. The impact of high solar PV penetration was evaluated on a modified benchmark model, which includes generators with defined characteristics including unit ramp rates, heat rates, operation cost curves, and minimum and maximum generation limits. The PV hosting capacity, defined as the maximum solar PV penetration the system can support without substantial generation imbalances, transmission bus voltage, or thermal violation was estimated for the example transmission circuit considered. The results of the study indicate that increasing solar penetration may lead to a substantial increase in generation imbalances and the maximum solar PV system that can be connected to a transmission circuit varies based on the point of interconnection, load, and the connected generator specifications and responses.
1. Introduction
Renewable energy resources are rapidly becoming an integral part of electricity generation portfolios around the world due to declining costs, government subsidies, and corporate sustainability goals. Large renewable installations on a transmission network may have potential impacts on the delivered power quality and reliability, including voltage and frequency variations, increased system losses, and higher wear of protection equipment [1]. Estimating the maximum hosting capacity of a transmission network may be used to determine the highest renewable penetration the system can handle without significant violations to the quality of the power delivered and the reliability of the grid.
Most recent literature has been focused on analyzing the impact of intermittent renewables on either generation or transmission systems only [2,3,4,5]. In [6], a methodology for estimating the solar PV hosting capacity based on steady-state circuit violations, without a detailed economic dispatch model was proposed. Typical dispatch models in the literature assume generation can always match load or set optimization constraints that are only acceptable for hourly dispatch models with relatively low load variations [7,8,9]. These hourly dispatch models may not be suitable for capturing the impact of PV systems for practical generation service areas, which record generation imbalance violations over duration as low as 15-min.
Furthermore, a substantial portion of literature has been focused on estimating the maximum PV hosting capacity for distributions systems and proposing network configurations that do not consider the contributions of conventional generators [10,11,12,13]. However, more than 60% of PV installations in the US are utility-scale setups typically connected to the transmission network [14]. Steady-state and transient analysis of transmission networks were presented in [6,15], but none of the works considered the variability of the connected loads or present a detailed economic dispatch to capture the responses of the conventional generators.
This research presents a framework for analyzing the impact of increasing PV penetration on both generation and transmission systems. Contrary to conventional approaches dispatching units with substantial intermittent renewable resources with hourly based dispatch models [7,16], this approach employs an M-M dispatch model capable of capturing the impact of large solar PV penetration and identifying minute-based periods of generation imbalance due to PV volatility and surplus power. The presented technique is also capable of analyzing the impact of increasing PV system penetration have on transmission circuits while considering the responses of conventional generators to changes in solar PV power.
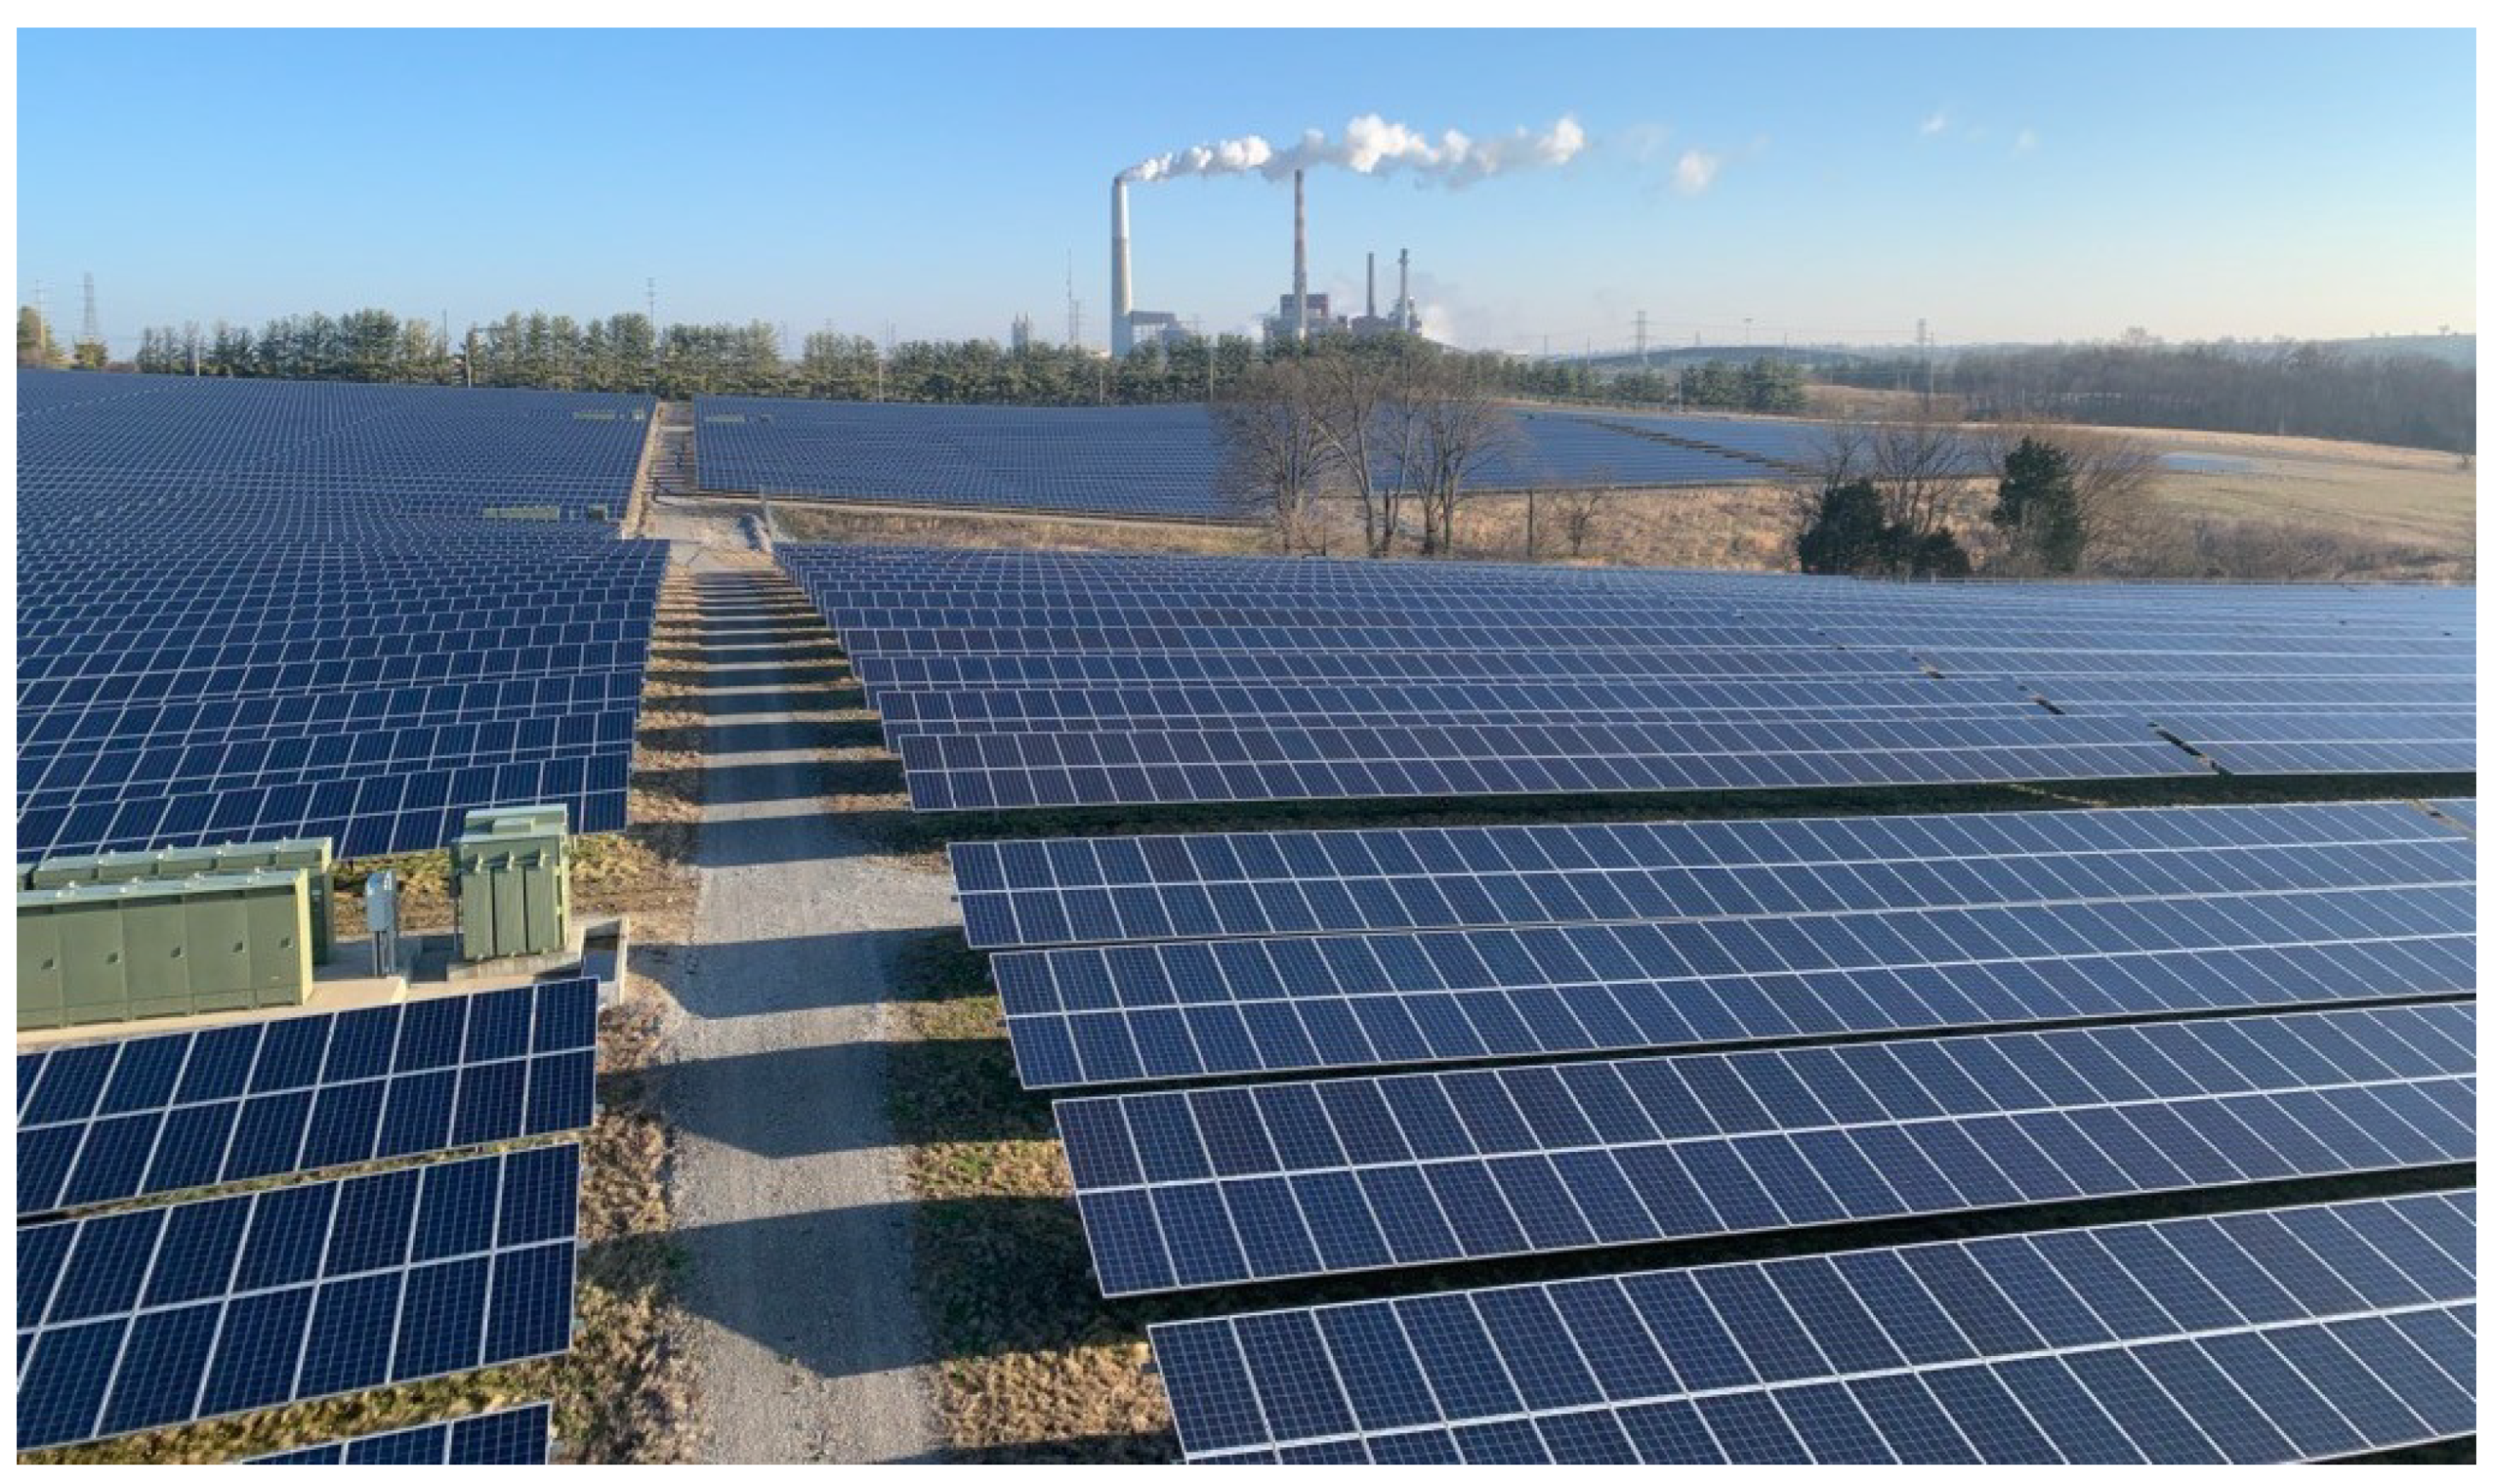
The impact of increasing solar PV penetration was analyzed on a modified IEEE 12 bus system [17] with generators, including coal, natural gas combustion turbine (NGCT), natural gas combined cycle (NGCC), and a hydropower plant with practical unit specifications. This study uses generator models developed on data provided by LG&E and KU on operational units to simulate the responses of conventional generators to increasing solar PV penetration (Figure 1). Publicly available one-minute irradiance data for the 10 MW PV farm located at the utility’s facility was used to model typical variation in solar irradiance [18]. The PV hosting capacity of the example generation and transmission network systems analyzed was estimated based on voltage, thermal, and generator dispatch violations.
2. Proposed Minute-to-Minute Economic Dispatch Model
The real-time changes in load from minute to minute are relatively minimal due to aggregation. However, the volatility of the net demand on conventional thermal generators rises significantly with the increase in intermittent renewable energy penetration. Although it is nearly impossible to always match generation with demand for a service area, utilities are penalized by regulators for generation imbalances lasting longer than acceptable minutes [19,20]. Hence, conventional hourly dispatch models are not suitable to identify the generation imbalances and effectively capture the effect of solar PV intermittency on evaluated service area.
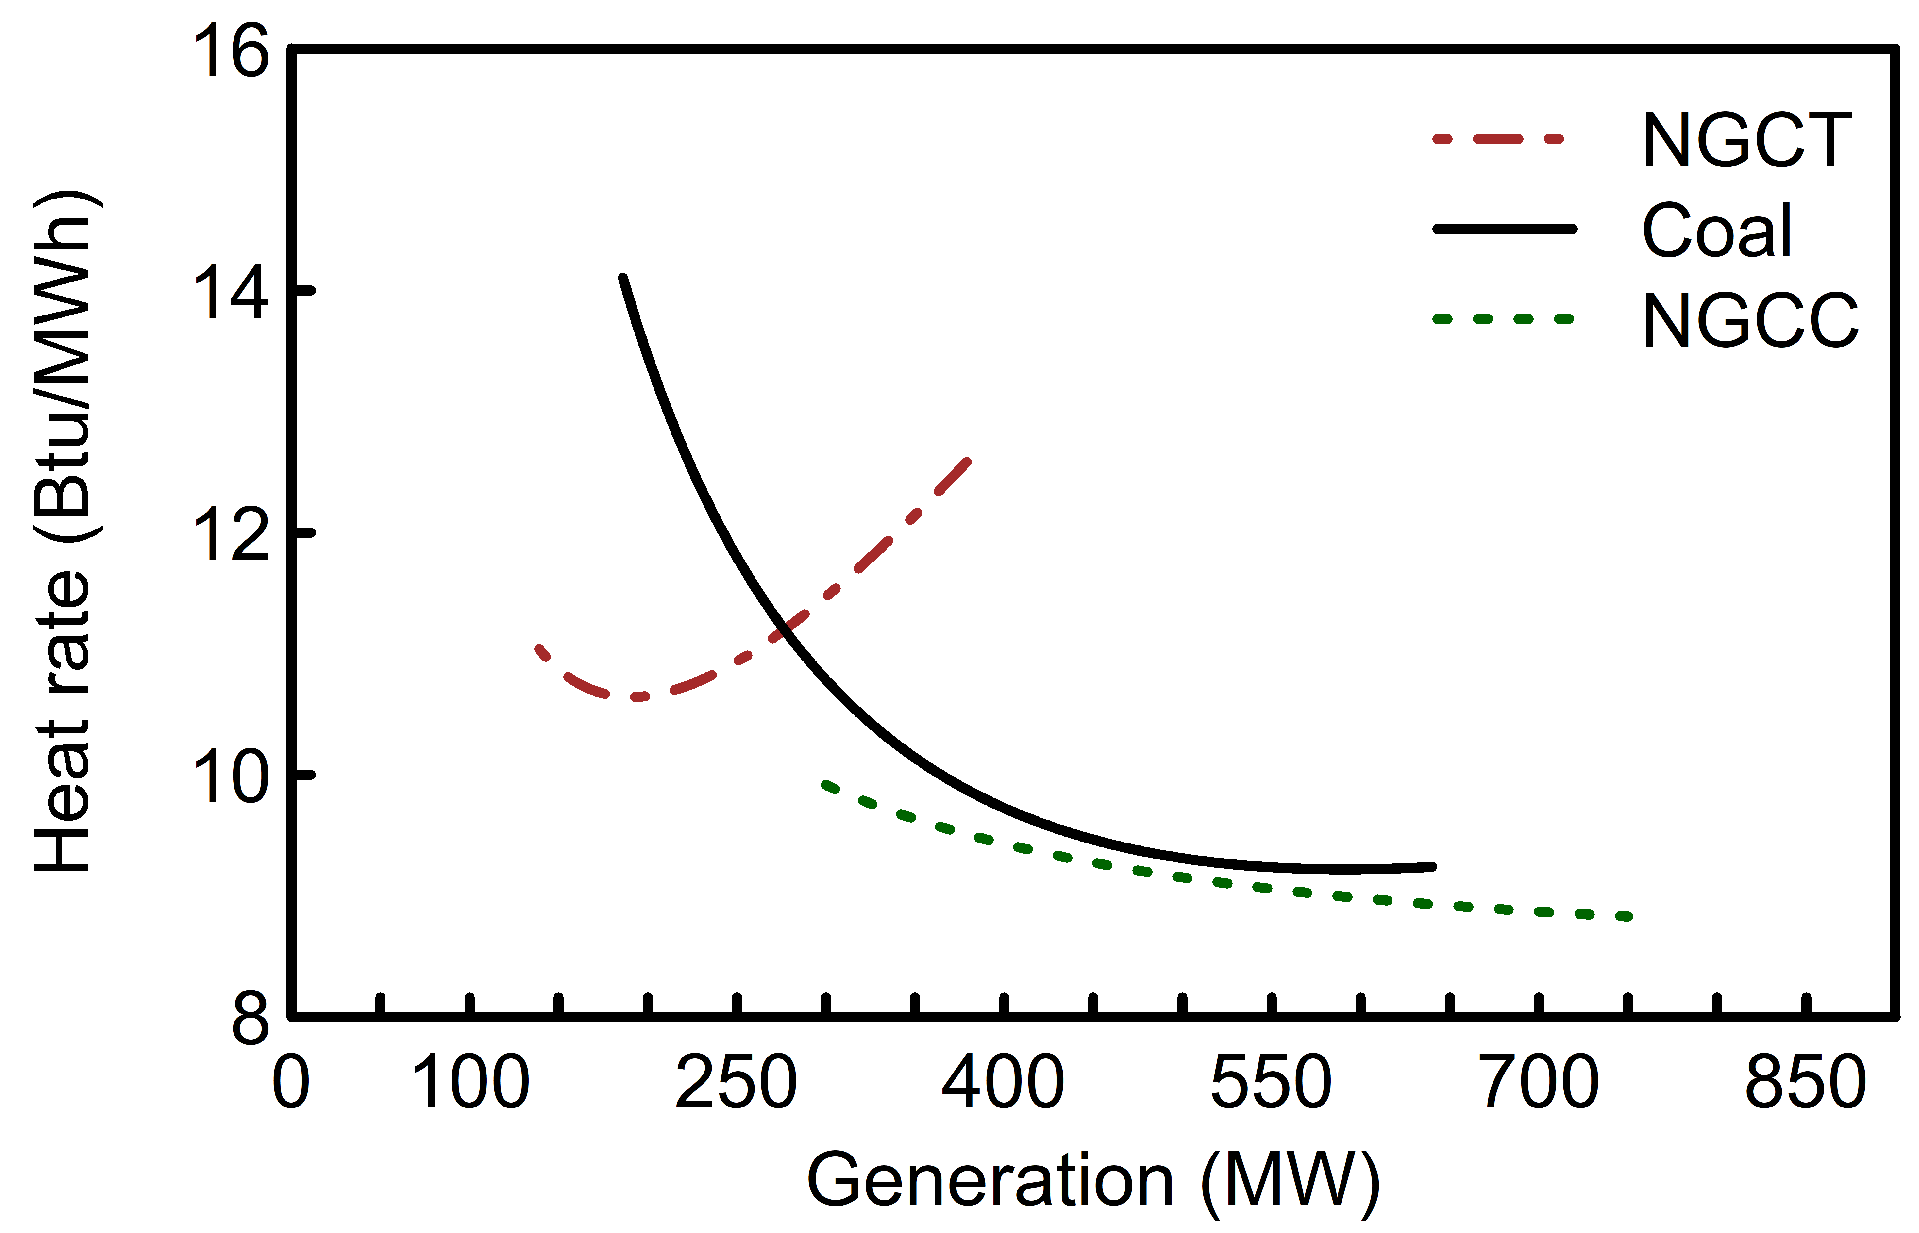
This approach employs a minute-based dispatch since the solar PV power variability due to cloud cover is expected to reduce as the plant capacity and footprint increases. The proposed minute-to-minute dispatch model in this study was developed for the IEEE 12 bus test system illustrated in Figure 2. The system which consists of four generating units was modified based on the specifications presented in Table 1 and subjected to realistic load variations for an example day in the Fall season. The efficiency of thermal generating units in terms of their heat rate vary with percentage output for different types of units (Figure 3). In this approach, the heat rates for thermal units are described as follows:
where represents the heat rate for unit g with output power ; the heat requirement; and , , are the heat rate co-efficient of the generator. Therefore, the operating cost for each unit may be expressed as:
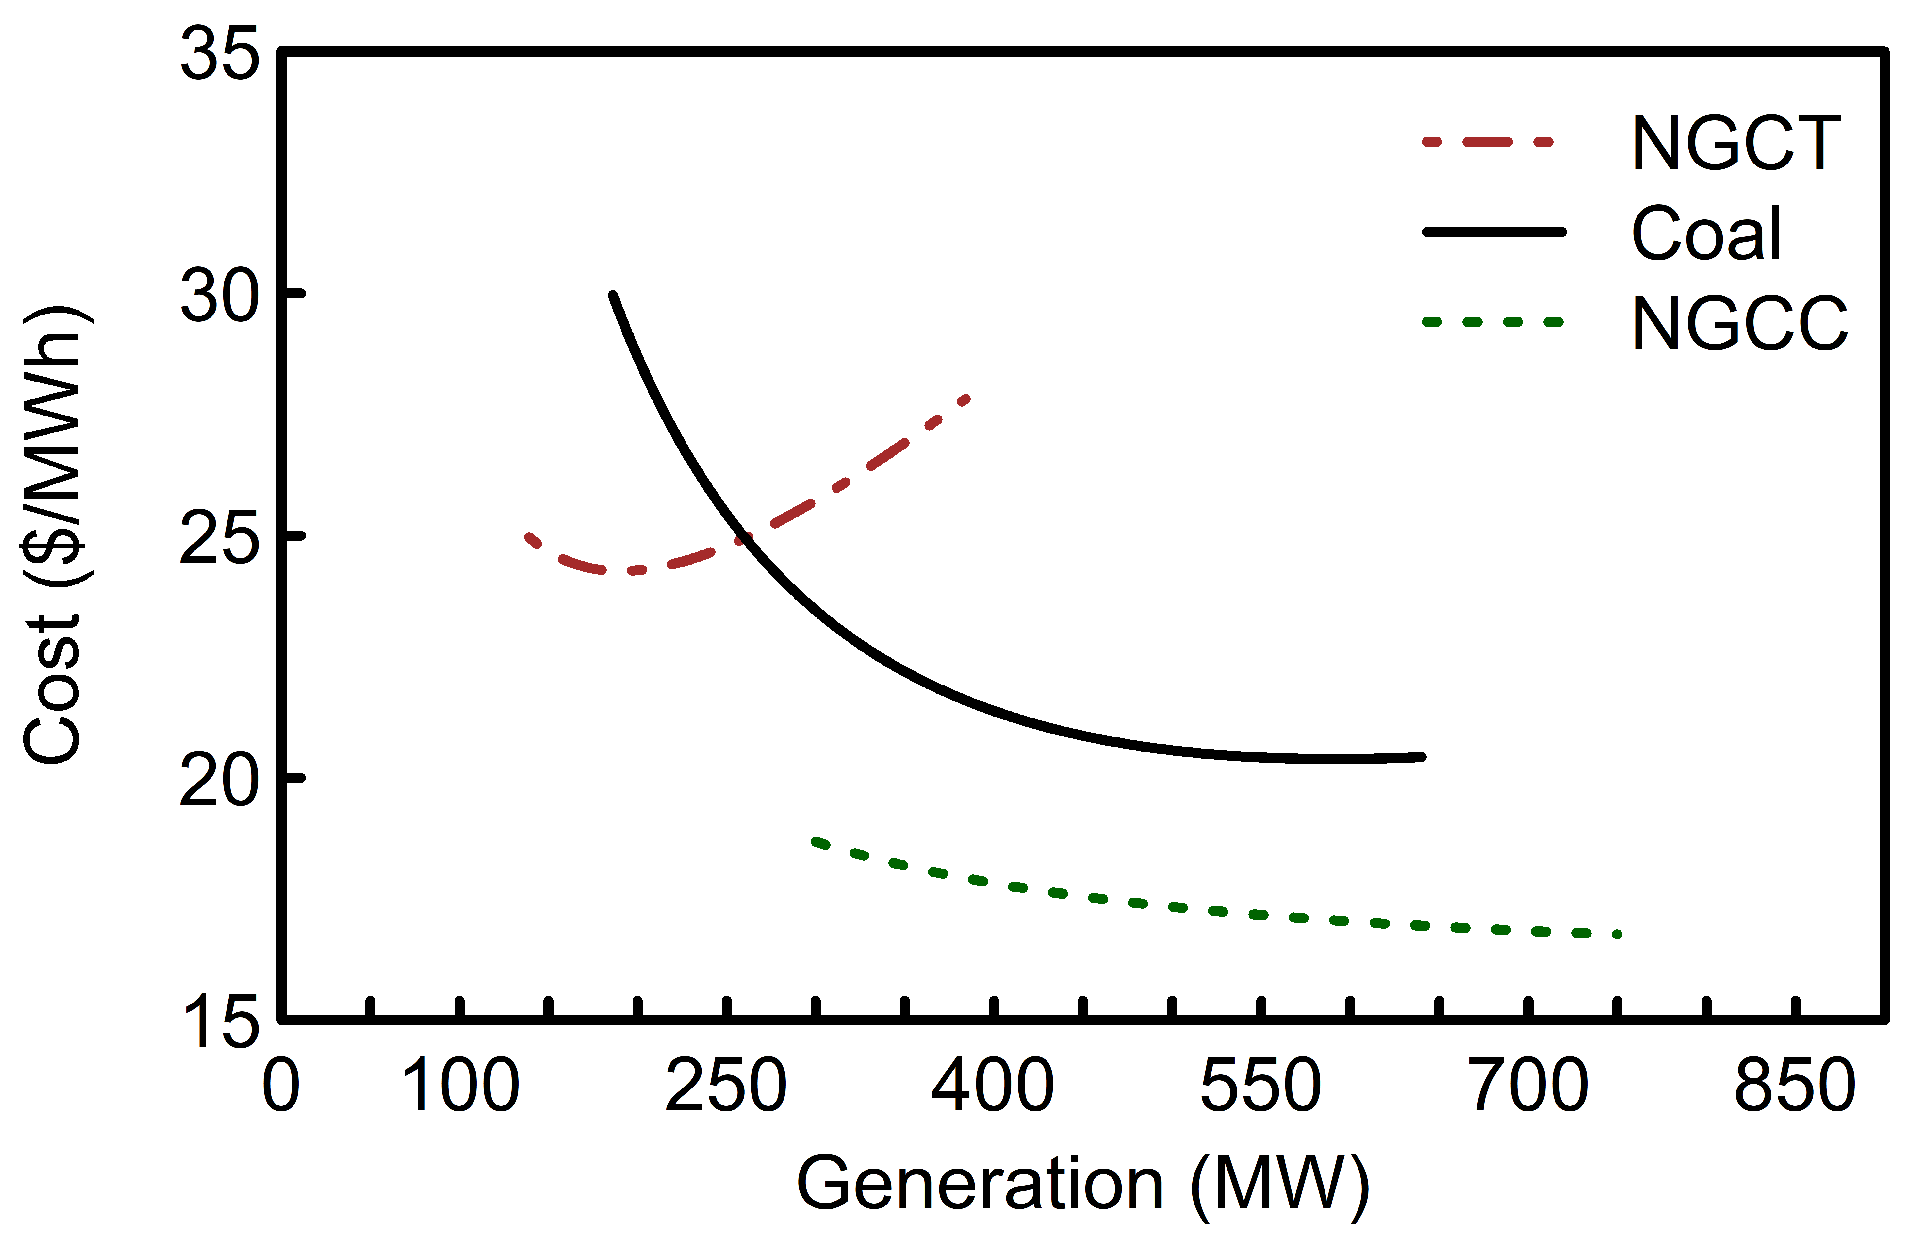
where is the running cost for generator g; , the fuel cost and , the fixed cost constant, which includes maintenance and emission reduction costs. Therefore, the proposed M-M dispatch model can estimate the running cost of the thermal units for specified output level within its limits of operation (Figure 4).
For a practical economic dispatch problem, the objective is to minimize cost and generation imbalance such that the cheapest combination of generators are regulated to meet demand. Therefore, the economic dispatch model objective can be expressed as:
where
, represents the total operating cost for all units considered; , the combined generator output; , the combined service area load; and G the total number of operational units including the PV plant. Following theoretical developments in [21], the minimum for each instance without considering generator constraints and transmission losses occurs when the total differential cost is zero and may be described as follows:
However, due to generator constraints including ramp-rate limitation of units the result from (5) may fall outside operation range.
Contrary to conventional approaches, this approach recognizes the practical limitations of generator units. The constraints for the considered thermal units are as follows:
where and are the maximum and minimum output power for unit g, respectively; and are the specified maximum and minimum generator operation limits; and , the generator rising and falling ramp rates, respectively.
This study is focused on the impact of increasing PV penetration on an example system with five generators. The proposed framework economic dispatch model employs a multi-objective genetic algorithm (GA) to minimize and for the three thermal units in the system and the “non-dispatchable” units (PV and hydro) output are set based on reference values from practical modules. The solar plant reference power module was developed based on measured irradiance data retrieved from an operational solar PV farm. The PV output power is expressed as follows:
where is the PV plant power, is solar irradiance in W/m; is the inverter efficiency, and is the rated capacity. The algorithm goes through multiple combinations of generator set points limited by and for each unit to establish a Pareto front. Since the primary objective of the utilities is to meet demand, the design with the least amount of imbalance is selected for the simulation time-step (Figure 5).
To identify periods of over- and under-generation, the proposed M-M dispatch model assumes the generators in the transmission circuit are solely responsible for meeting demand for the concerned service area without need for off system sales and electricity power trading. Factors such as unit commitment and outage are beyond the scope of this study. Therefore, all units are assumed to be available and committed throughout the example day.
3. Conventional Generators Response to Increasing PV Penetration
Increasing solar penetration can make it more challenging for grid operators to balance generation with load in real time, since generating units are committed based on load forecast and level of uncertainty. In this study, the integrated PV farms are operated in “must-take” modes, in which thermal units are turned down to accommodate solar PV penetration. The relatively high power variation of the PV plant for the example day considered leads to significant generation imbalance during periods when the operating units cannot ramp up or down fast enough for meet demand.
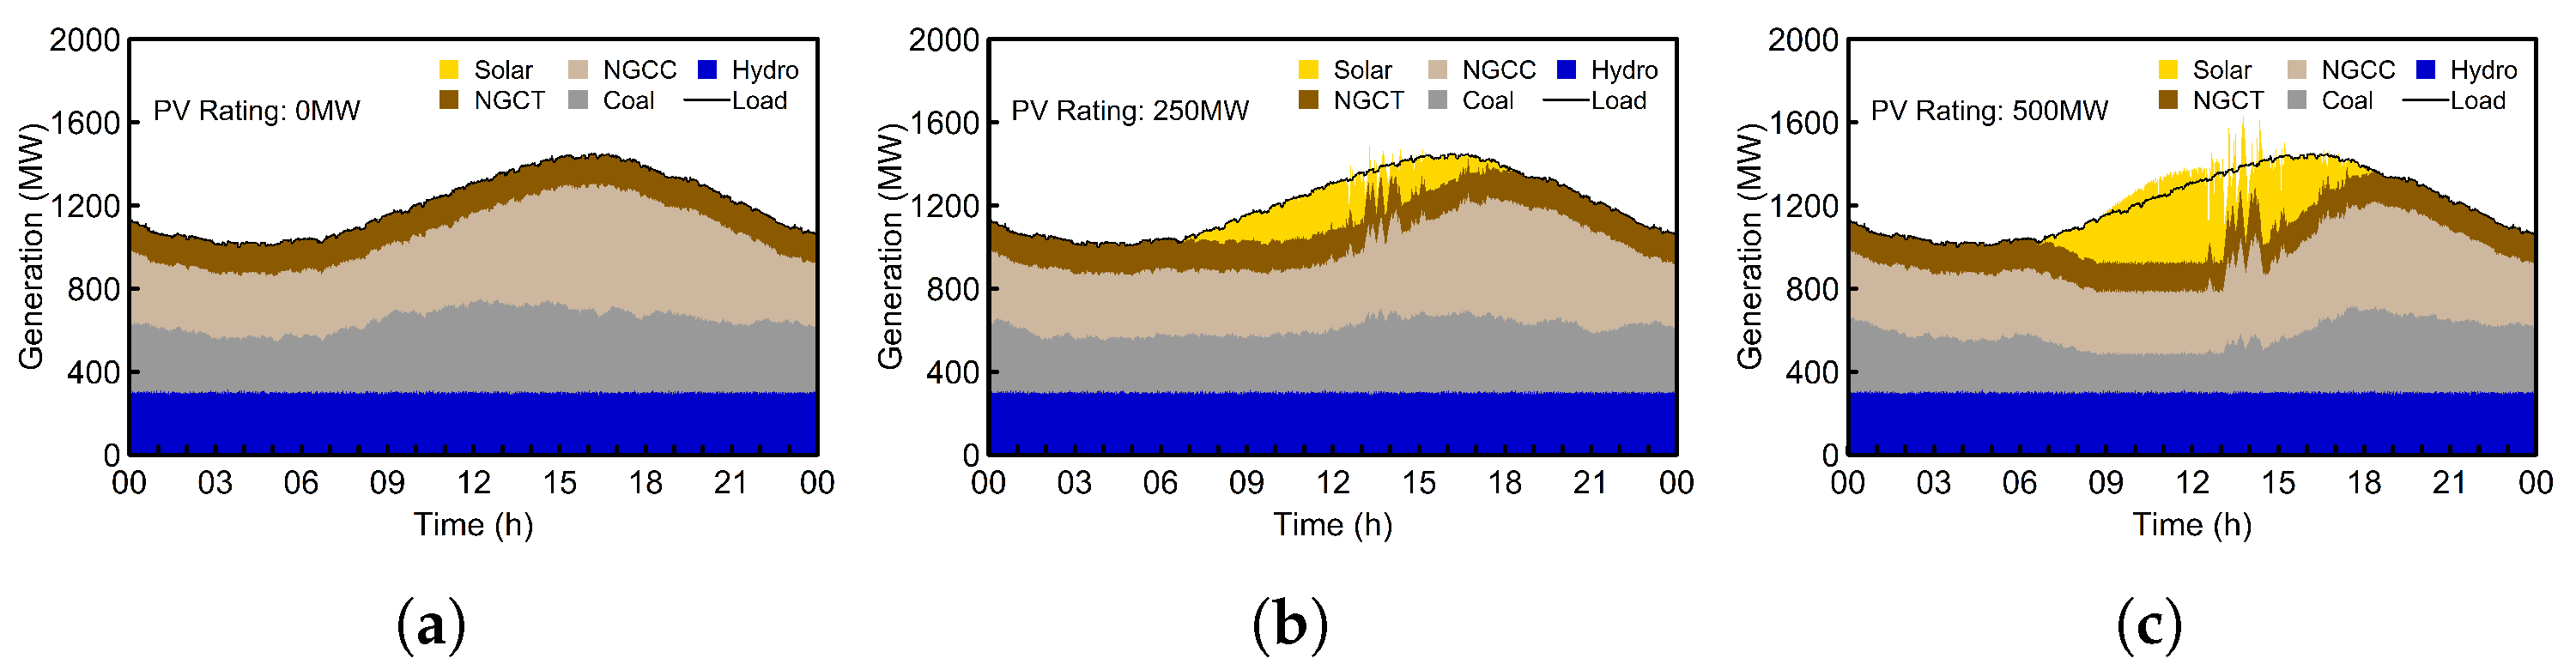
Due to the minimum generation limit of the available thermal unit, a significant level of over-generation may be observed at hours between 9:00 and 13:00, when the generators could not ramp down further to accommodate the increasing PV penetration (Figure 6). In addition to the rest time required to restart thermal units, a significant amount of time, up to 24 h for some coal units is required to restart start them which makes it extremely challenging to turn off the units at midday and restart them for evening peak [22].
The current solar PV regulatory standards may not be sufficient for managing high intermittent renewable sources penetration and new standards will be required to ensure grid stability in a future grid [23,24]. Furthermore, the penetration of distributed renewable sources such as rooftop solar will lead to substantial changes in the apparent load on the transmission network that may call for additional regulations. In this study, a generation violation or imbalance count is recorded when the area control error, ACE, exceeds ±20 MW for defined consecutive minutes. The ACE is expressed as:
where and are the measured and scheduled tie line lows, f and , the measured and scheduled frequency, and the frequency bias constant for the area. Frequency variation due to generation imbalance is beyond the scope of this study, therefore it was assumed that f = , and is always equal to zero. Hence, for this analysis (10) can be re-written as:
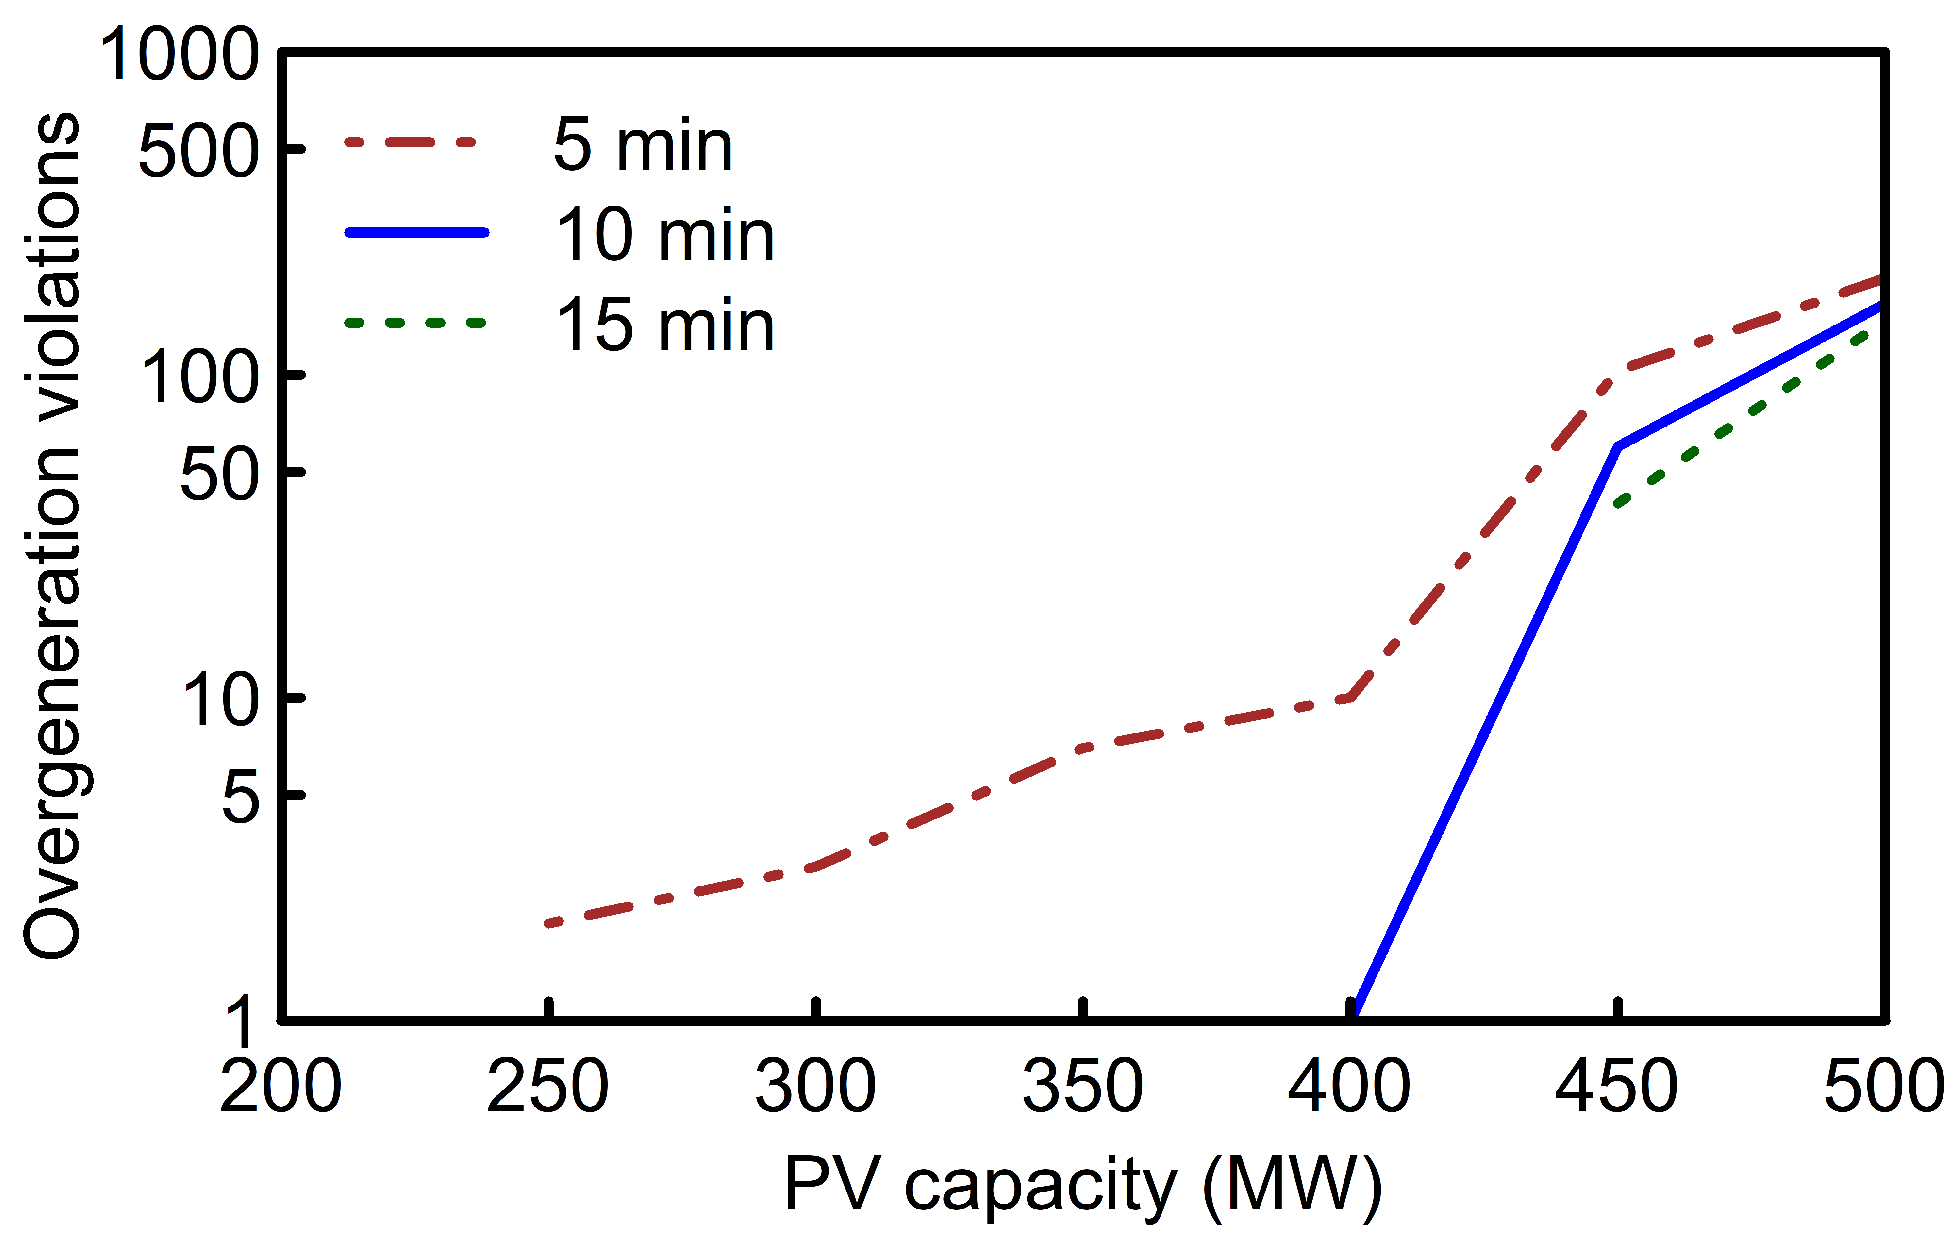
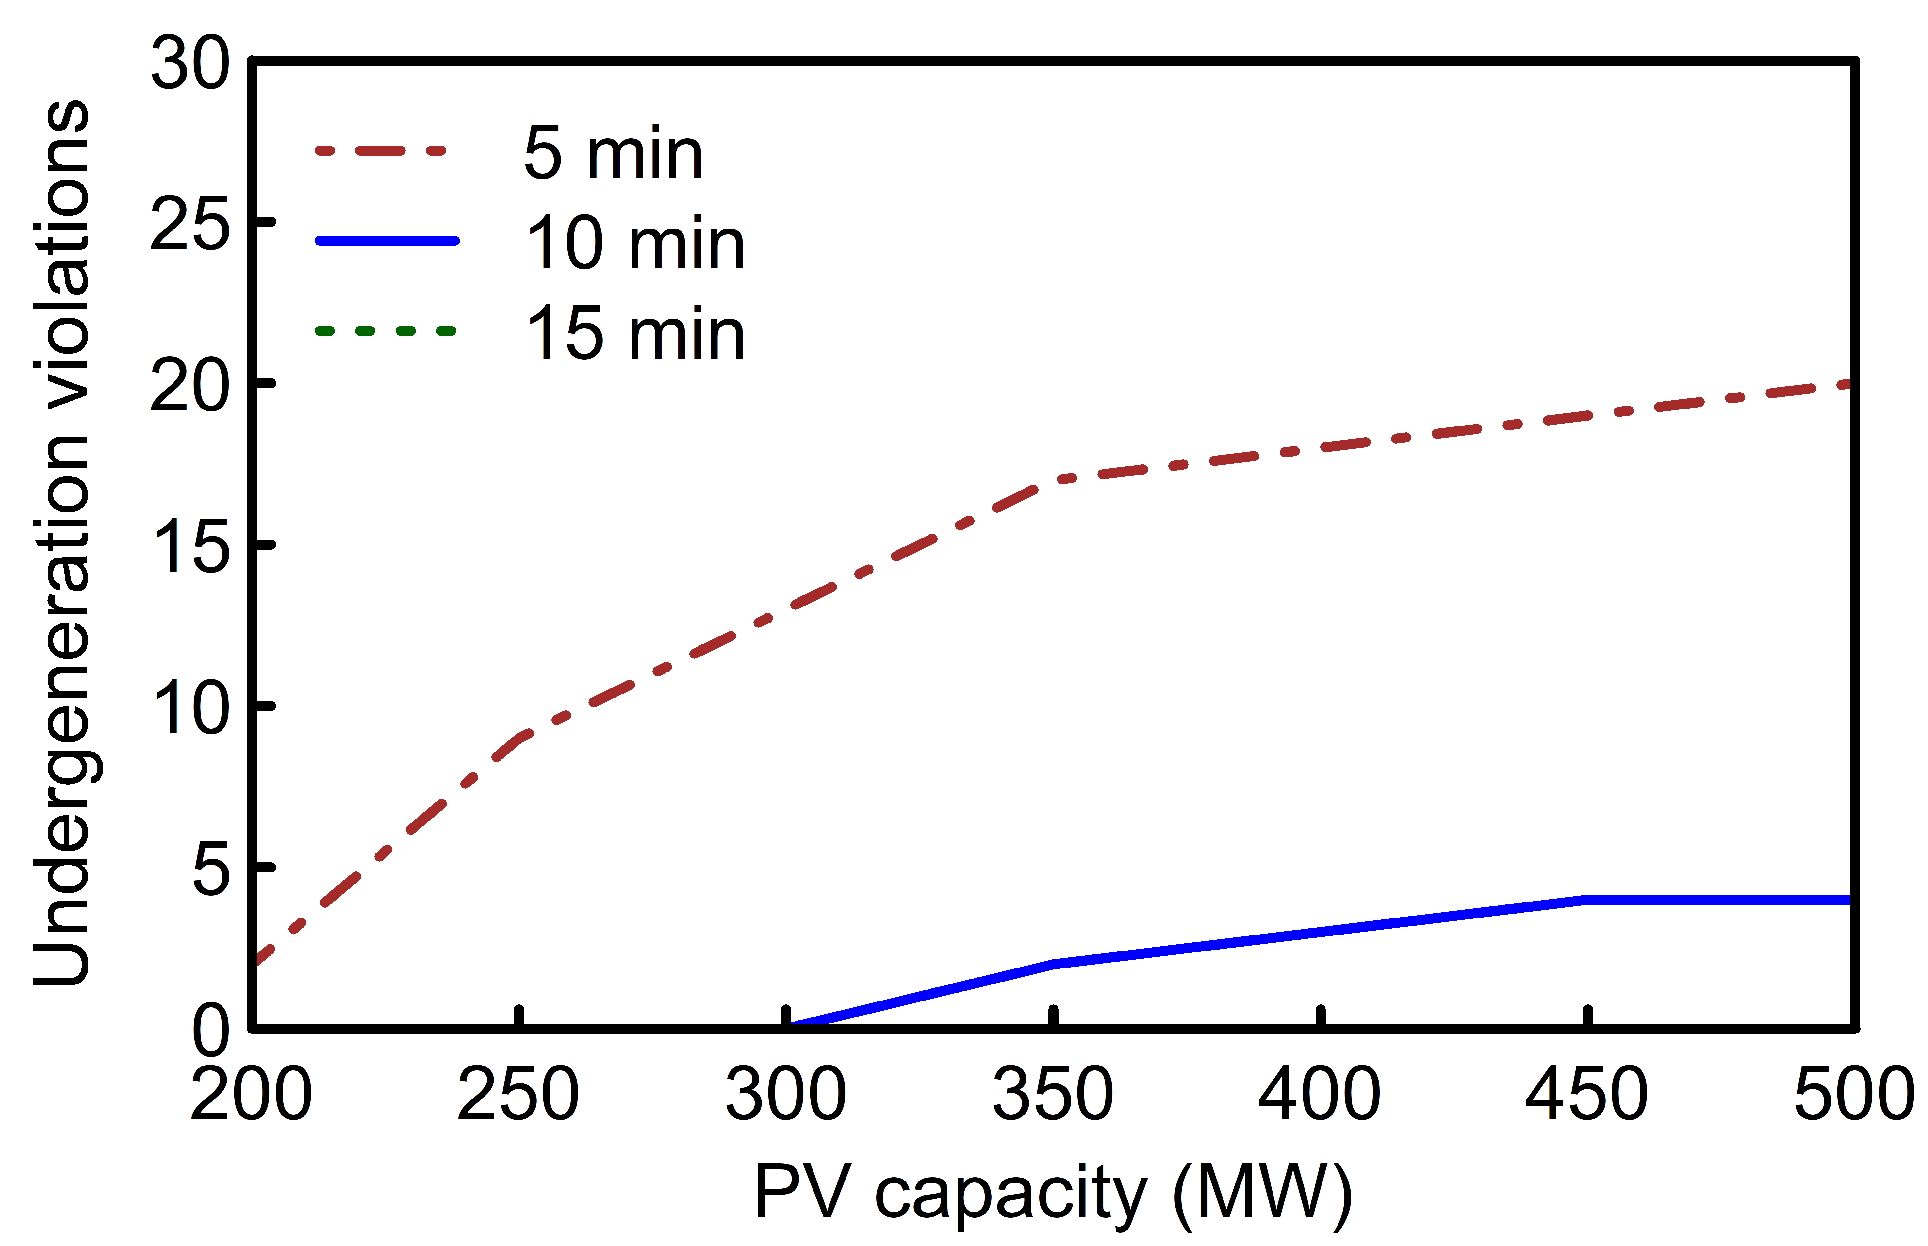
The over- and under-generation imbalance count for the example day was evaluated for increasing PV penetration. A significant level of over-generation can be observed at solar PV penetration levels exceeding 400 MW (Figure 7). This is mainly due to the inability of the available units to operate at values below their minimum generation limits during periods of surplus solar generation. For the example day analyzed, there was no under-generation violation lasting more than 15 consecutive minutes (Figure 8). However, significant under-generation violation counts for 5 and 10 consecutive minutes, which was relatively constant for PV penetration above 350 MW was recorded. These violations are primarily due to the intermittent behavior of the PV systems and generating units not being able to ramp fast enough to supply deficit power due to sudden shading of the solar panels.
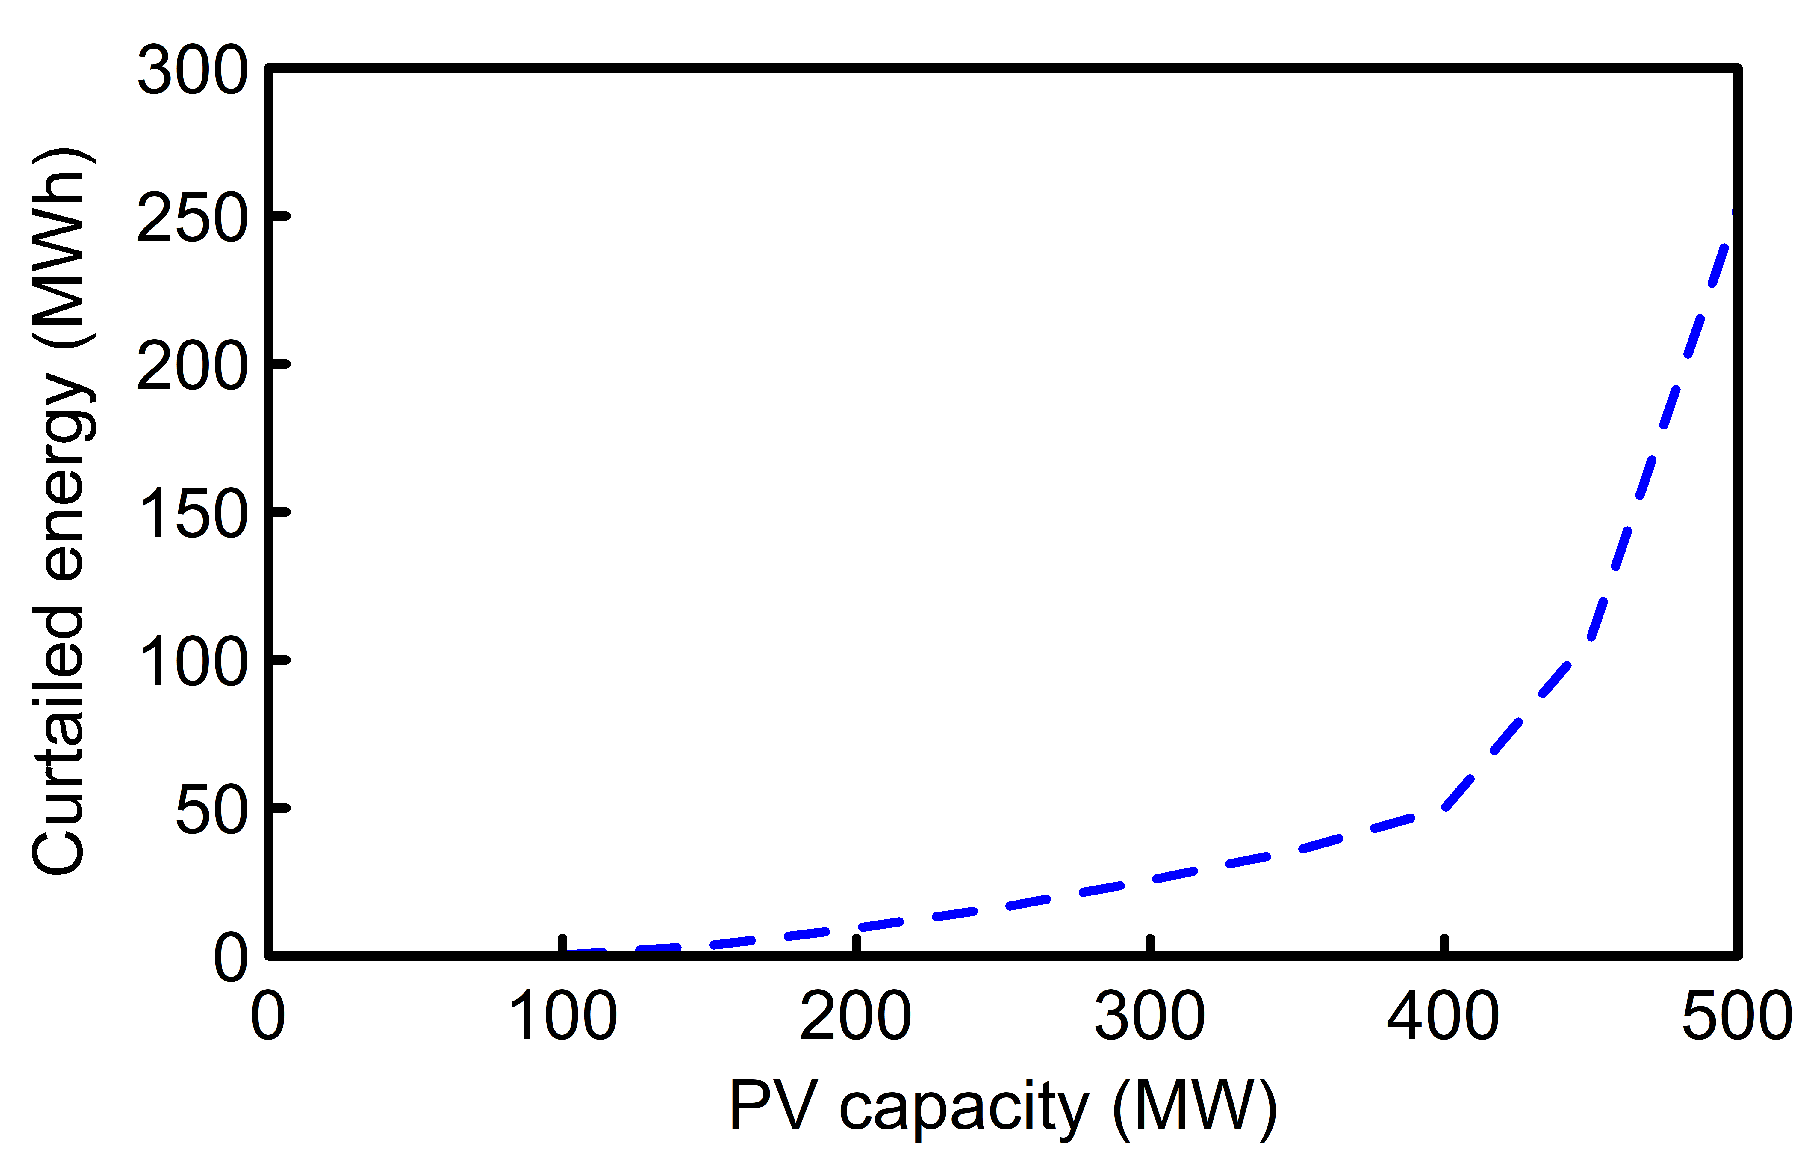
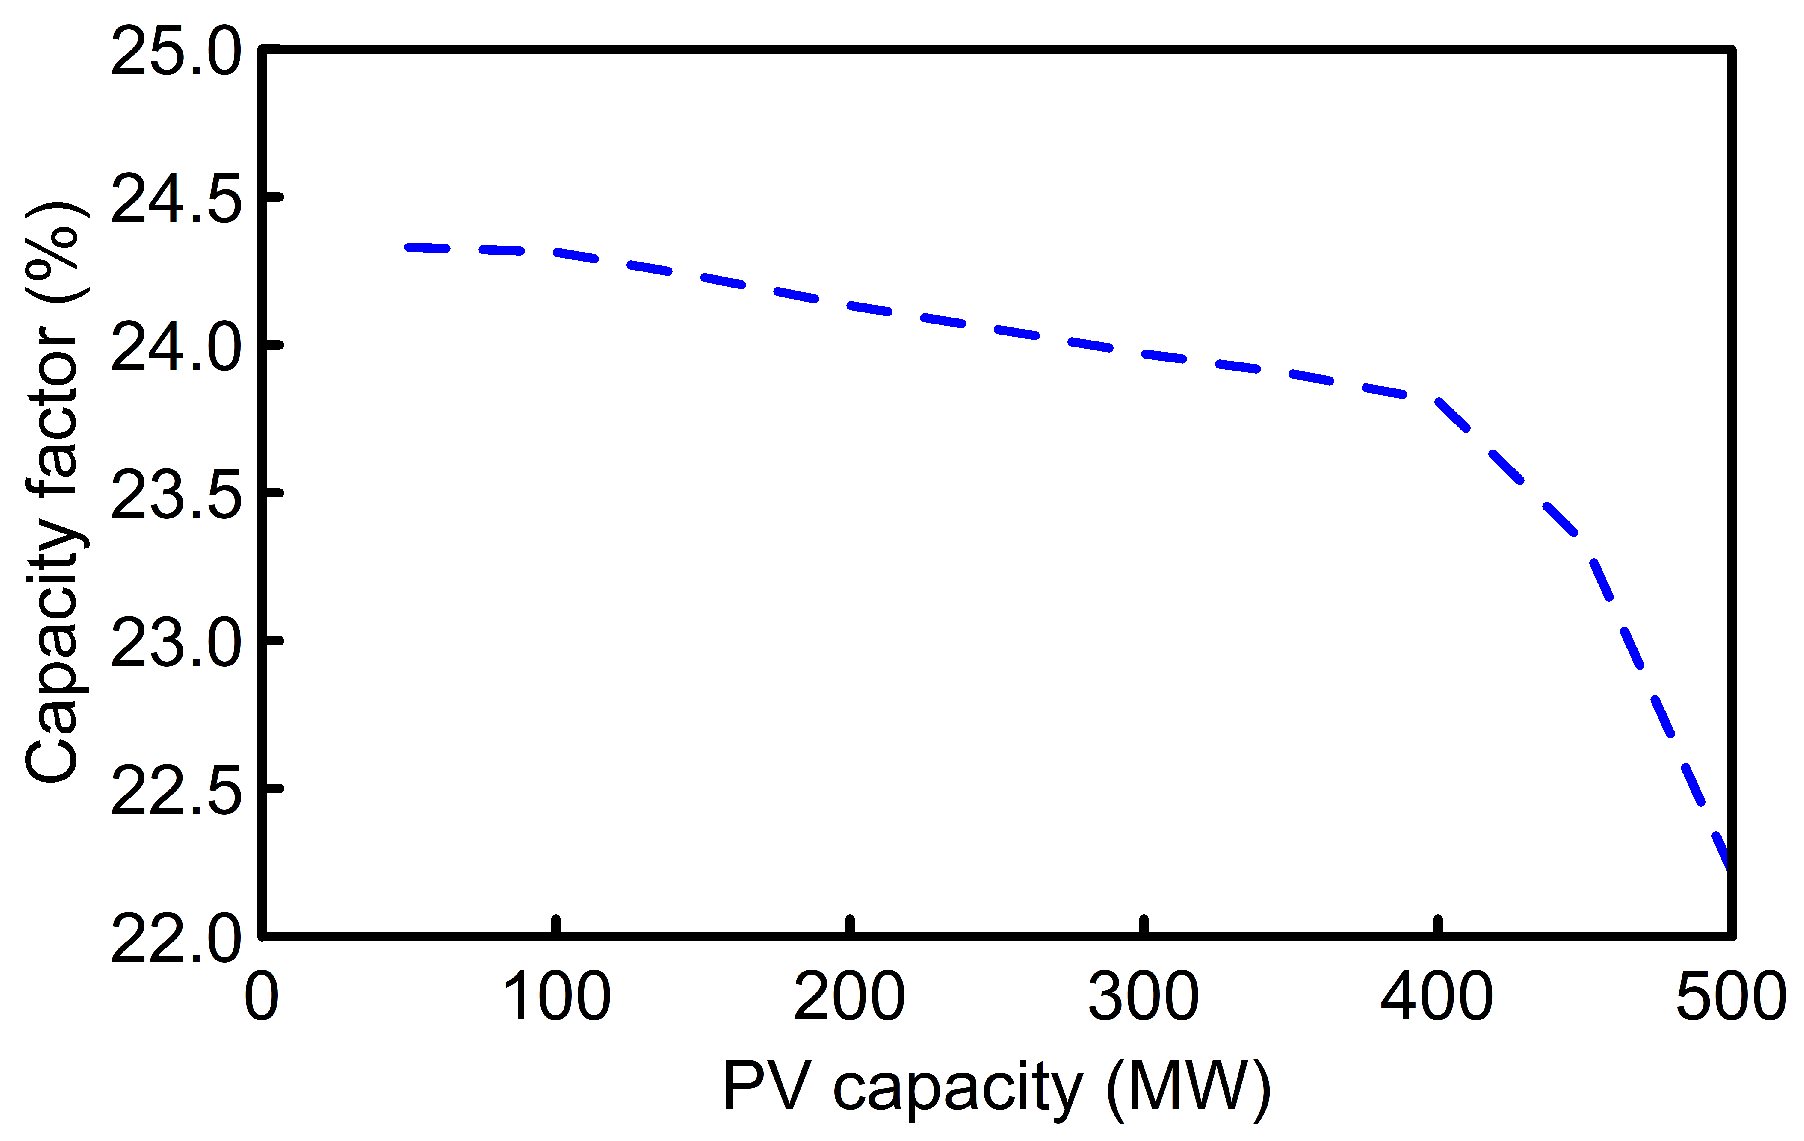
Solar power curtailment can be an effective tool for managing over-generation, in which the solar PV plant output may be held back when there is insufficient demand to consume production. This study examined how much curtailment will be required to address solar over-generation for the presented generator portfolio over the example day (Figure 9). An exponential increase in the curtailed PV energy to avoid over-generation violations was recorded, with rapid increase in curtailment for PV capacity above 400 MW. Due to the substantial PV energy curtailed, over 2% reduction in PV capacity factor was reported at 500 MW penetration level (Figure 10).
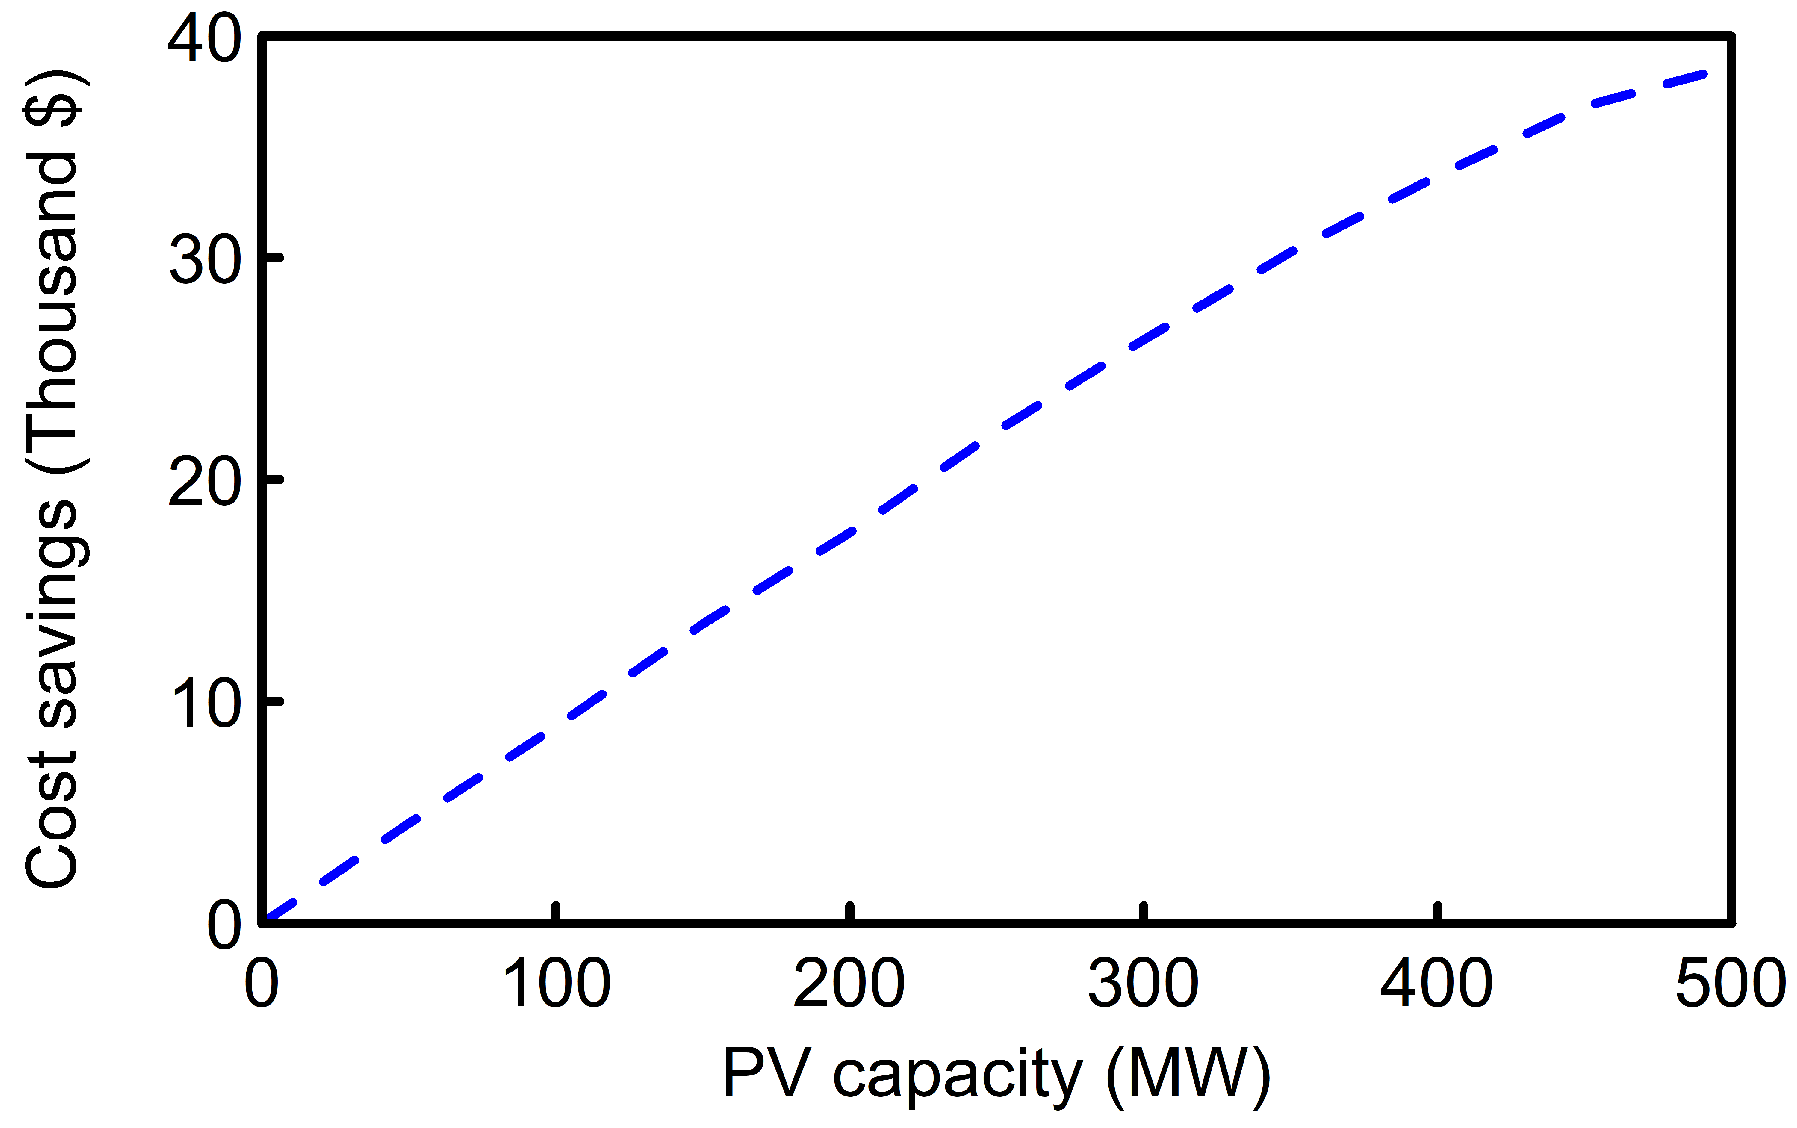
Increase in solar PV penetration is expected to lead to significant reduction in running cost without considering the capital cost for the PV system. It is, however, important to recognize that PV penetration may lead to more aggressive usage of fast ramping units such as NGCTs, which are typically the most expensive units in generation portfolios. This study evaluated the cost savings for the example day due to increase in PV penetration. A somewhat steady increase in cost savings was reported for solar PV penetration above 80 MW (Figure 11). However, due to generator commitment and increased operation of the NGCT unit for managing the solar PV variation over the example day, no cost savings was recorded for solar PV penetration below 80 MW.
4. Modified Benchmark Transmission Network
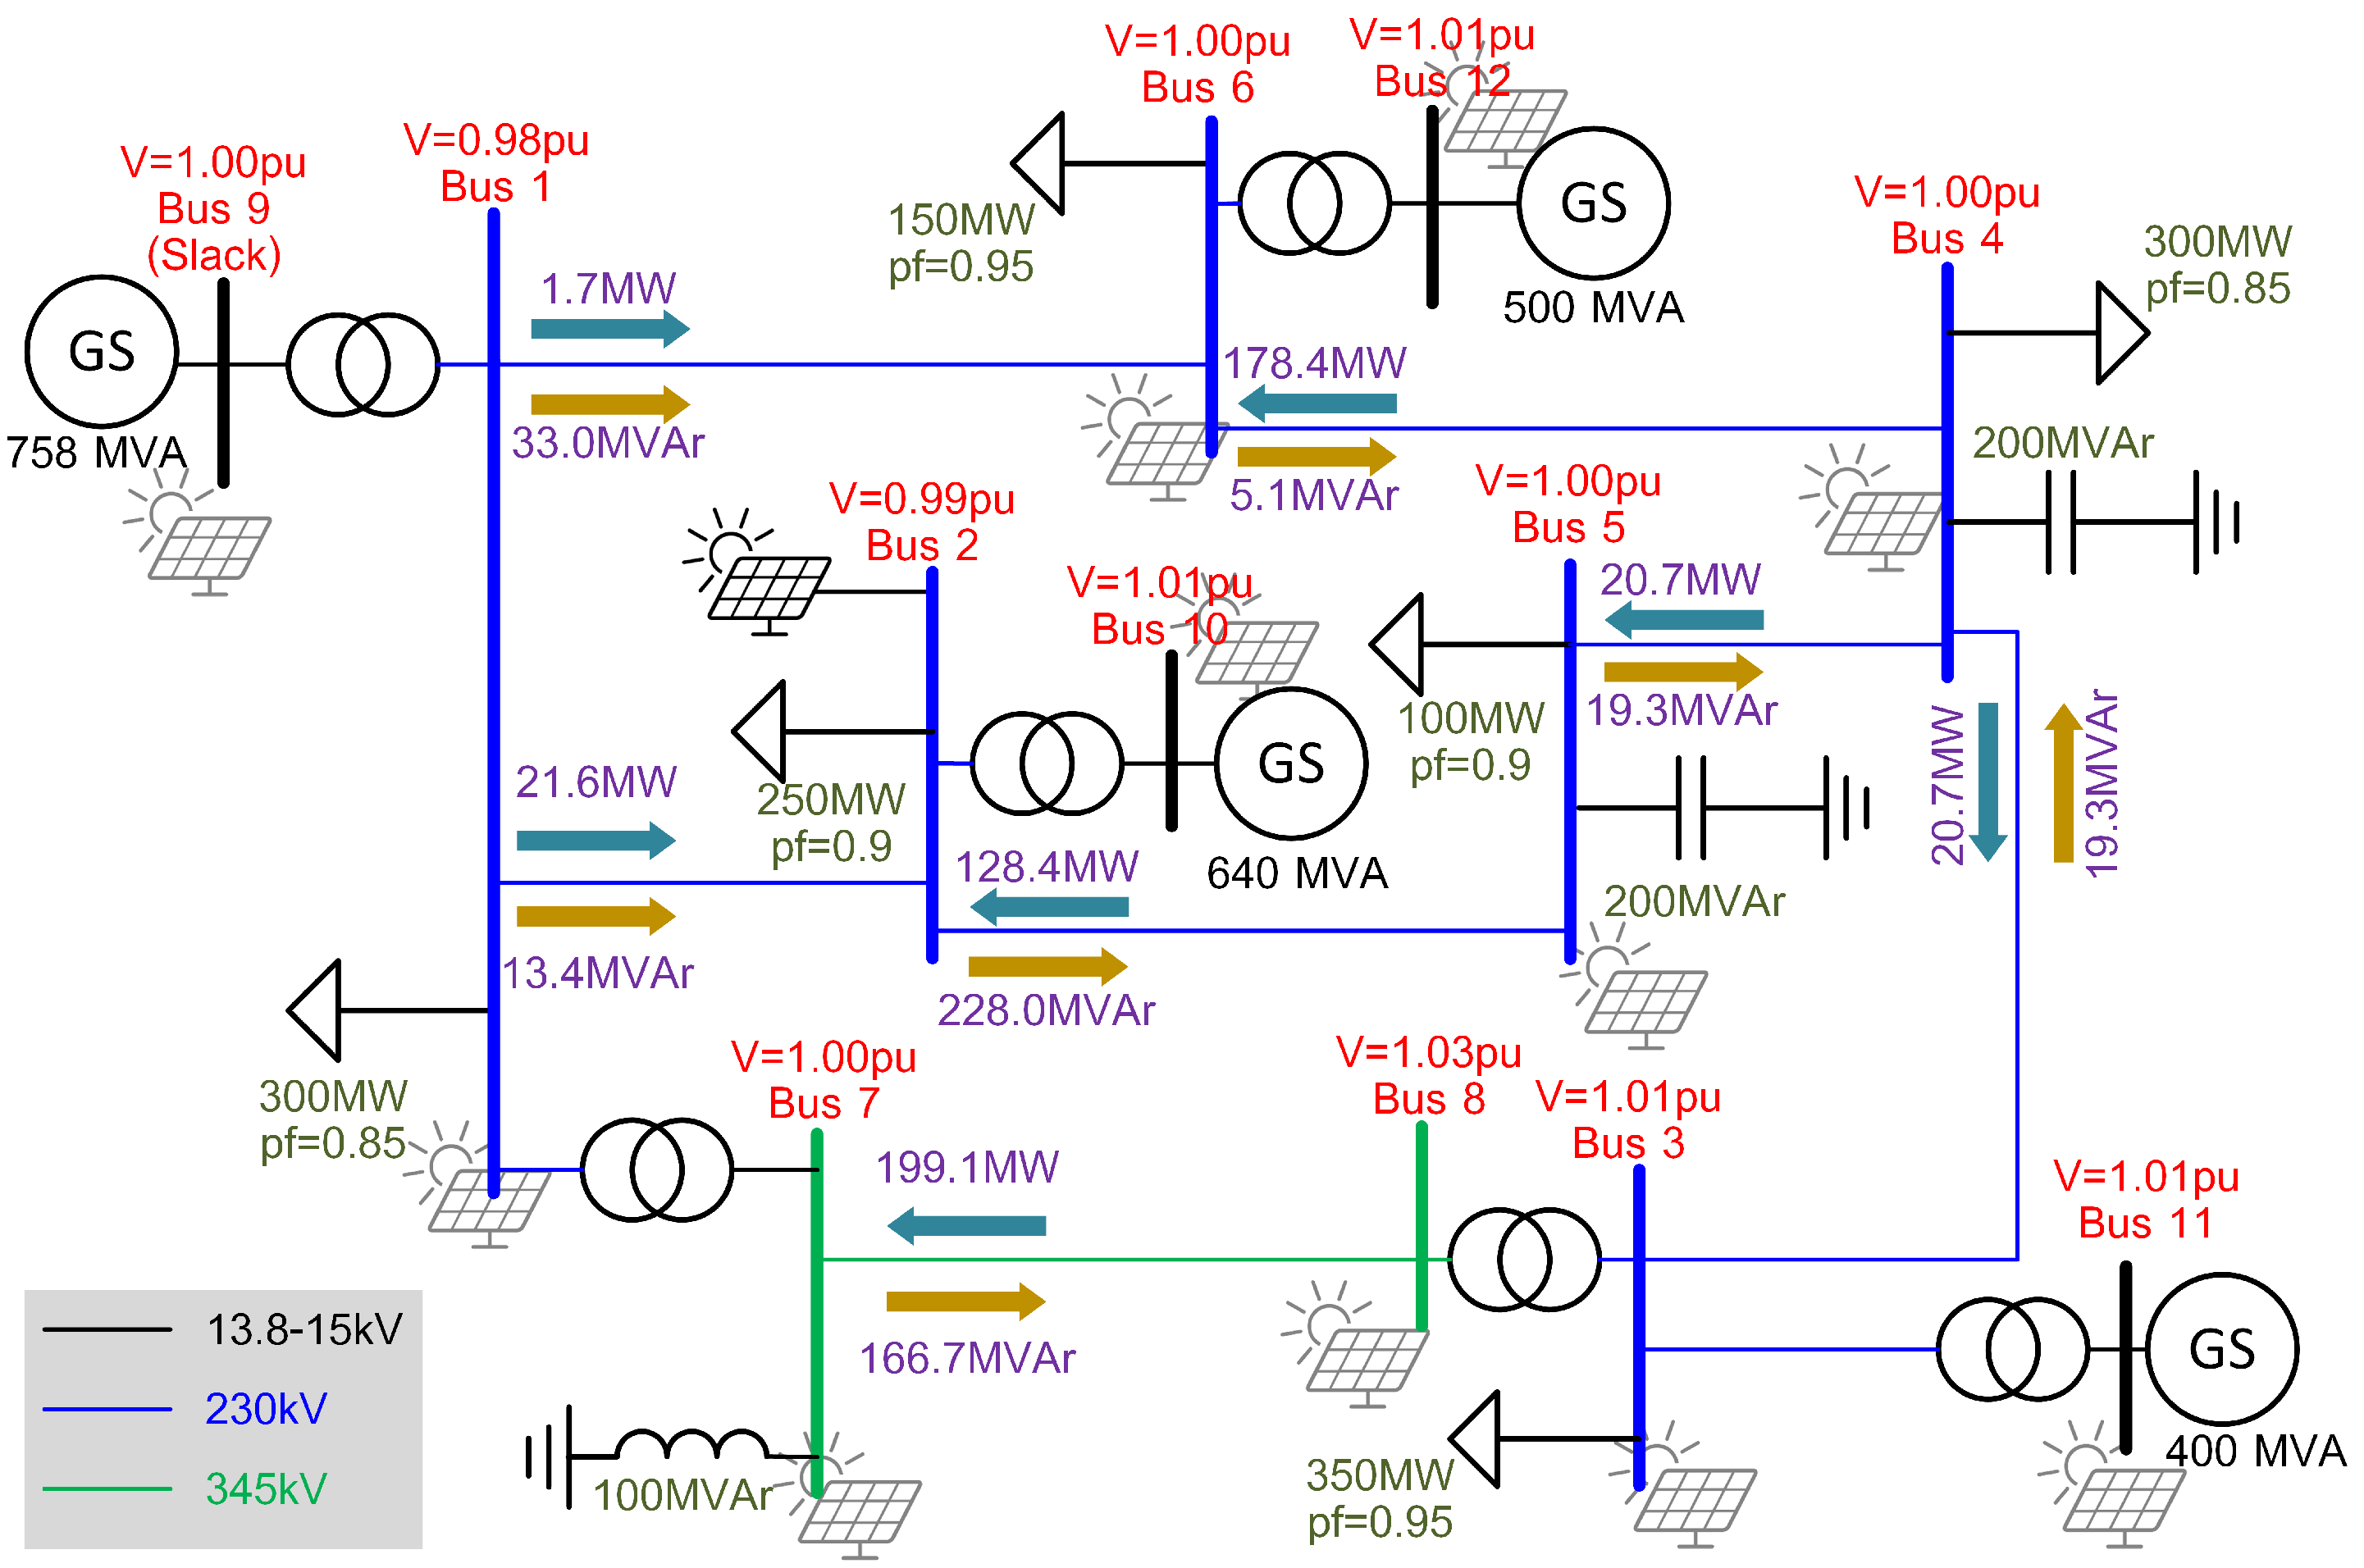
The modified benchmark transmission system analyzed in this work represents a small islanded power system network with 12 buses and four generating units (Figure 2). This modified transmission network is based on the generic 12-bus test system developed for wind power integration studies presented in [17]. The transmission network base case was developed in PSSE with a single transmission line connecting buses 3 and 4, as opposed to the parallel cables in the initial setup.
At steady-state without renewable integration, the transmission network total system load is approximately 65% of the total generation capacity. The bus voltage voltages vary between 0.98 pu to 1.03 pu. In this example, each of the transmission lines is rated for a maximum of 250 MVA power flow except for the transmission lines connecting buses 7 to 8 and 3 to 4, which are rated to 500 MVA. At 65% load level without renewable integration, the maximum loading for any of the transmission lines is 71%, which is the power flow between buses 6 and 4.
Solar PV penetration have the maximum impact on generation during periods when load is relatively low. For transmission networks, maximum PV impact is observed during peak periods, when load is rather high and transmission lines are near saturation. In this approach, the transmission network was evaluated for the analyzed example day peak demand and the generating units were dispatched accordingly with respect to minimum operating cost and solar PV penetration.
The benchmark model was further modified to enable renewable system integration, such that a solar PV farm may be connected to either of its 12 buses. In order to connect the PV plant to a selected bus, an additional transformer is introduced to connect the PV plant terminal to the corresponding bus. Based on typical regulatory requirements, the PV plant is configured to be capable of operating at 0.95 power factor to support scheduled grid voltage at the point of interconnection (POI) [25].
5. Proposed Framework for Network PV Hosting Capacity
The PV hosting capacity for a transmission network is defined as the maximum solar PV capacity that may be connected to the system without significant upgrades to its circuit to ensure steady operation. The maximum hosting capacity of a transmission circuit depends on multiple factors including the bus voltage variation, thermal limits of the transmission lines, frequency variation, fault currents as well as regulated factors such as total harmonic distortion and grid codes. This study focuses on the maximum PV capacity that may be connected to any one of the buses in the example transmission network without violating the bus voltages or the thermal limits of the circuit branches.
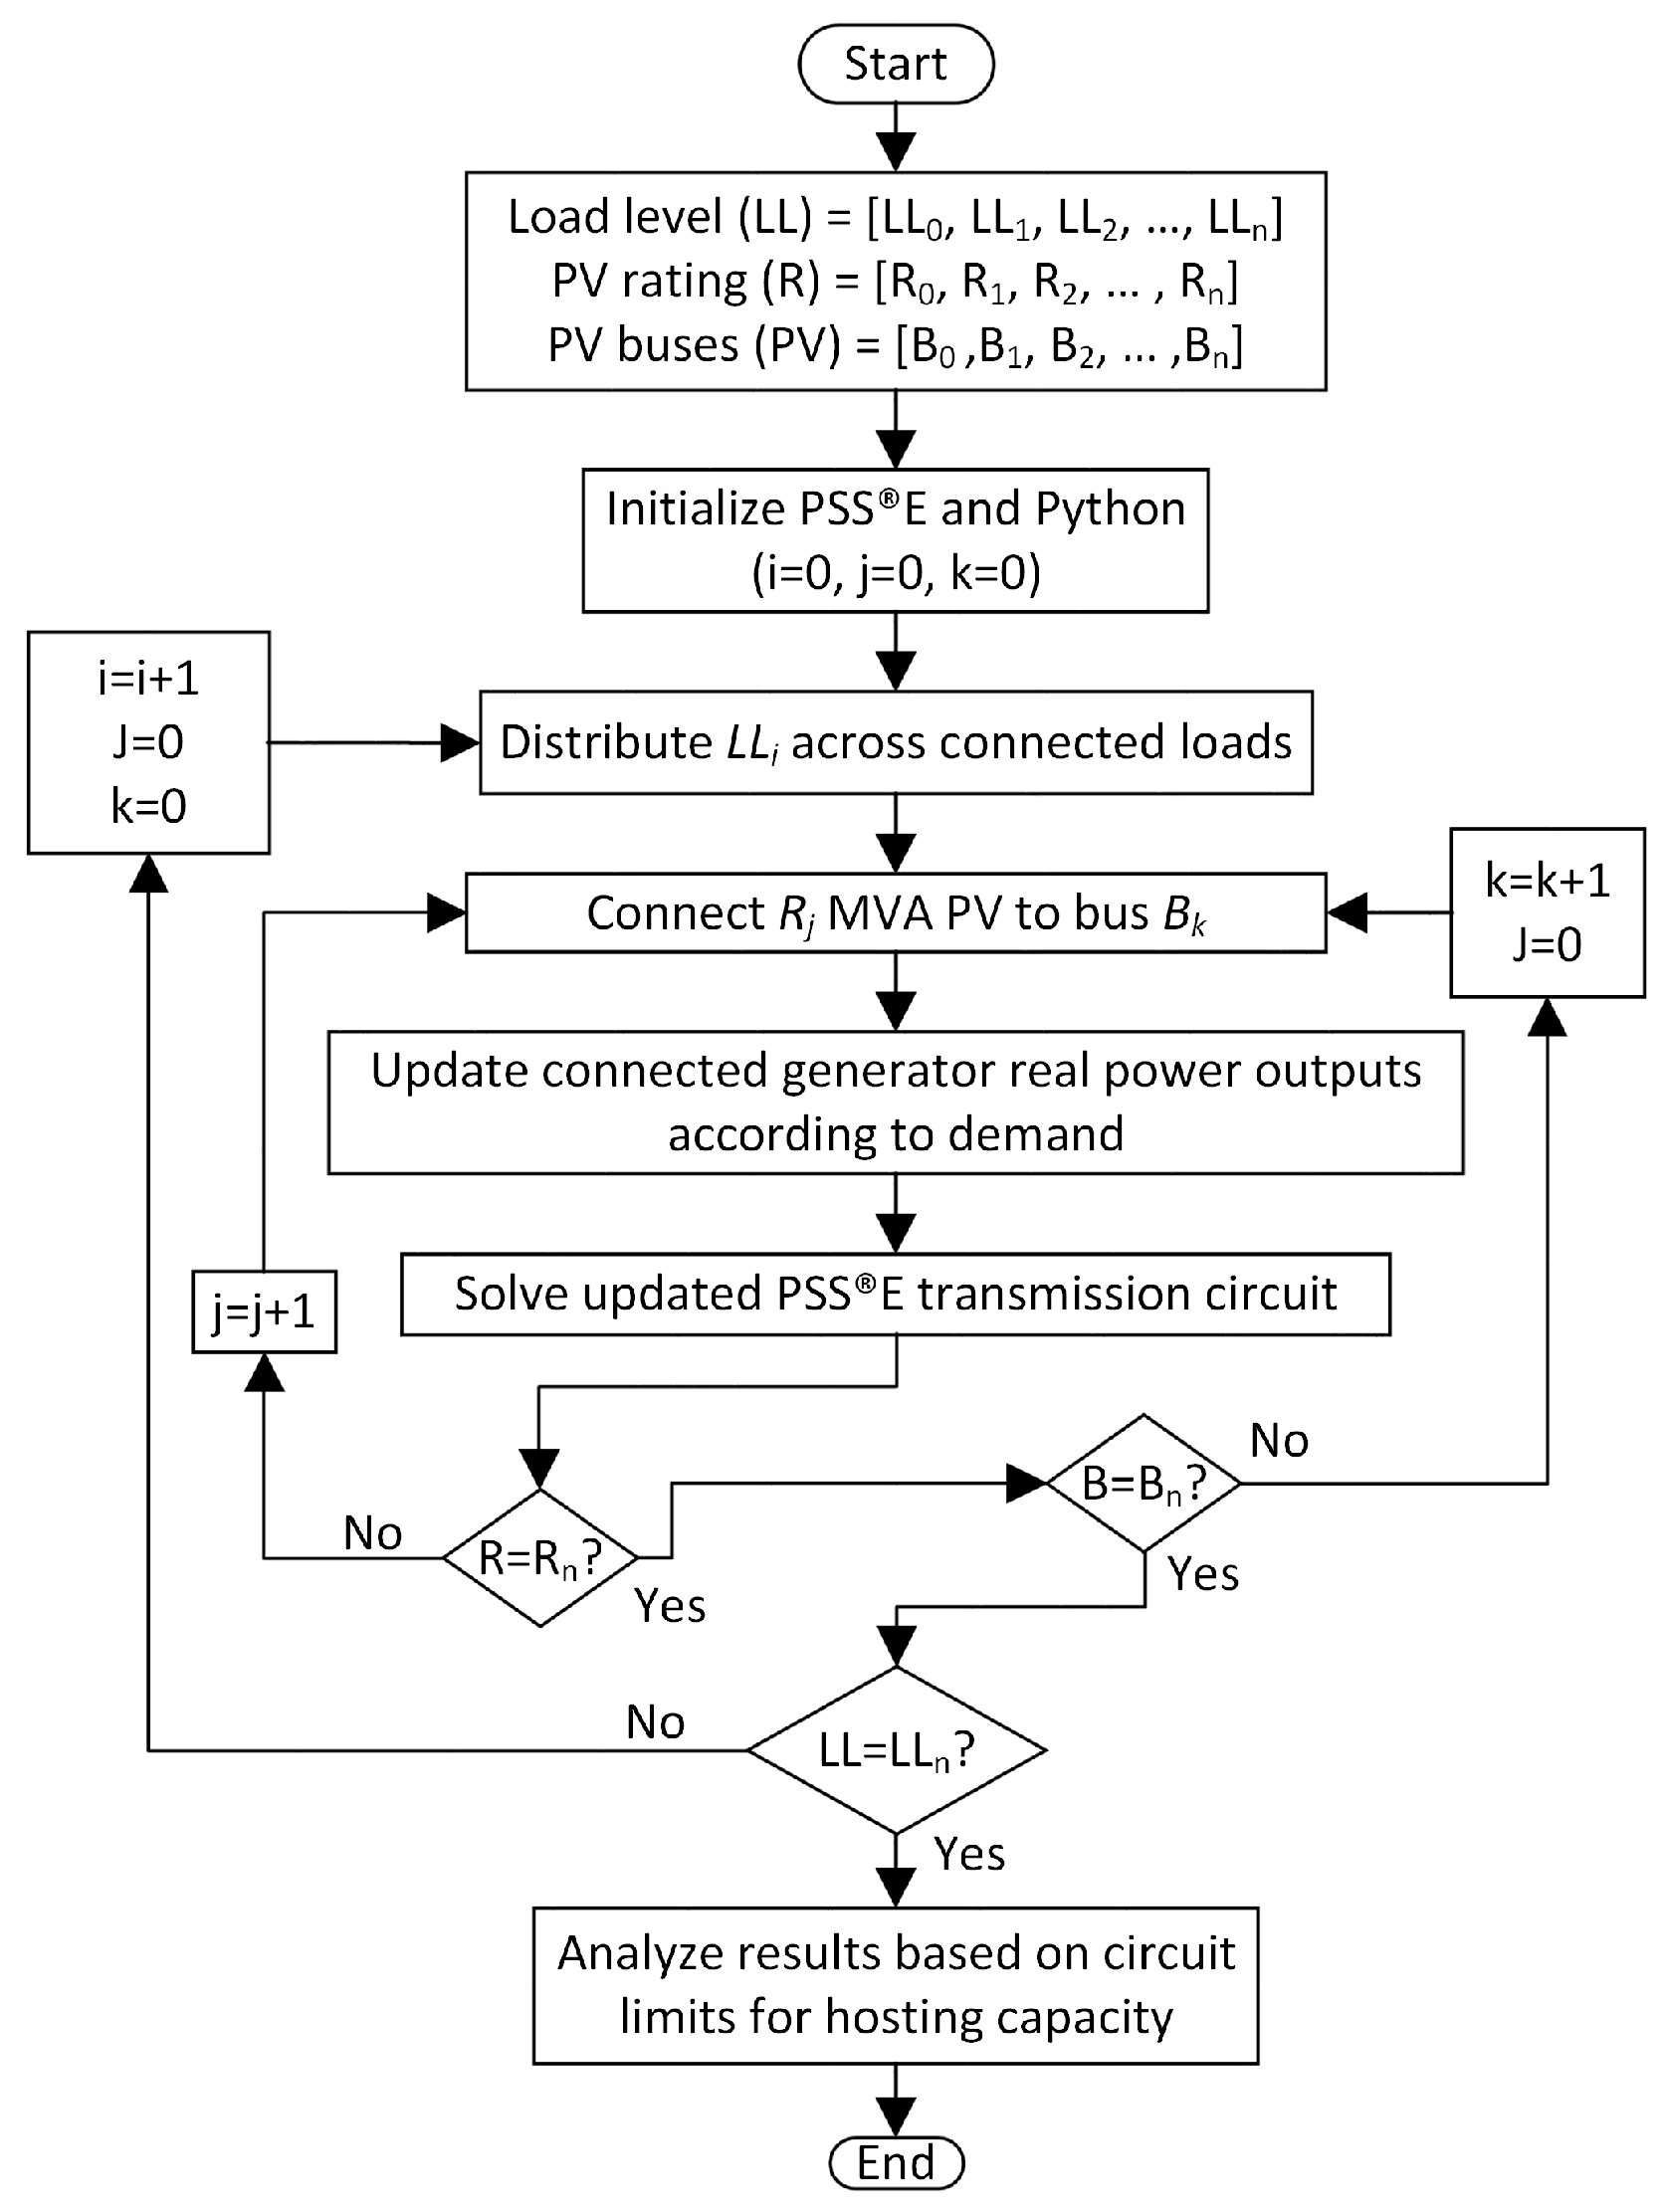
The proposed framework established as a combination of modules developed in Python and transmission case studies in PSSE, may be employed to estimate the hosting capacity for a defined transmission network. Opposed to conventional approaches, this framework employs a practical and detailed economic dispatch model, which defines the output power of all available generating units based on combined running cost. This dispatch model also respects generator minimum power limit and ensures units are set to values within their operation limits. Hence, the combination of units that meet load at the least cost are dispatched for each case study analyzed.
The framework allows the user to define the potential buses for PV connections, the range and maximum PV capacity to be analyzed, and the load levels to be considered. The simulation study is initialized with for the based case without solar PV penetration and the case study is evaluated. The combined load for the analyzed instance is then distributed to all the load buses at a ratio and power factor identical to the base case. The transmission network is then modified such that the minimum PV capacity to be evaluated is connected to the first candidate bus to be analyzed. All the available generators are re-dispatched to accommodate the increase in PV penetration.
The modified circuit is solved in PSSE, and the connected PV rating is increased if the solution converges. The framework keeps increasing the connected PV rating at predefined steps until solution failure or maximum PV rating to be analyzed, after which it resets to a minimum PV rating for the next bus or load level. The simulation comes to an end after the combinations of all PV ratings, connection buses and load levels have been exhaustively tested and results extracted (Figure 12). Based on the criteria defined for the system circuit, the collected results are therefore analyzed to determine the system’s maximum hosting capacity.
6. Transmission Network Response to Increasing PV Capacity
The proposed framework was employed to estimate the PV hosting capacity for the modified IEEE 12 transmission network. The PV hosting capacity was evaluated based on the bus voltage responses of the network, thermal loading and circuit solution convergence. The network was evaluated at 1450 MW combined load level, which represents the peak demand for the example day analyzed. Up to 500 MW PV penetration level was analyzed for the defined POI and the operational conventional generators were re-dispatch for each case to ensure the combination generator output power with the least cost is selected.
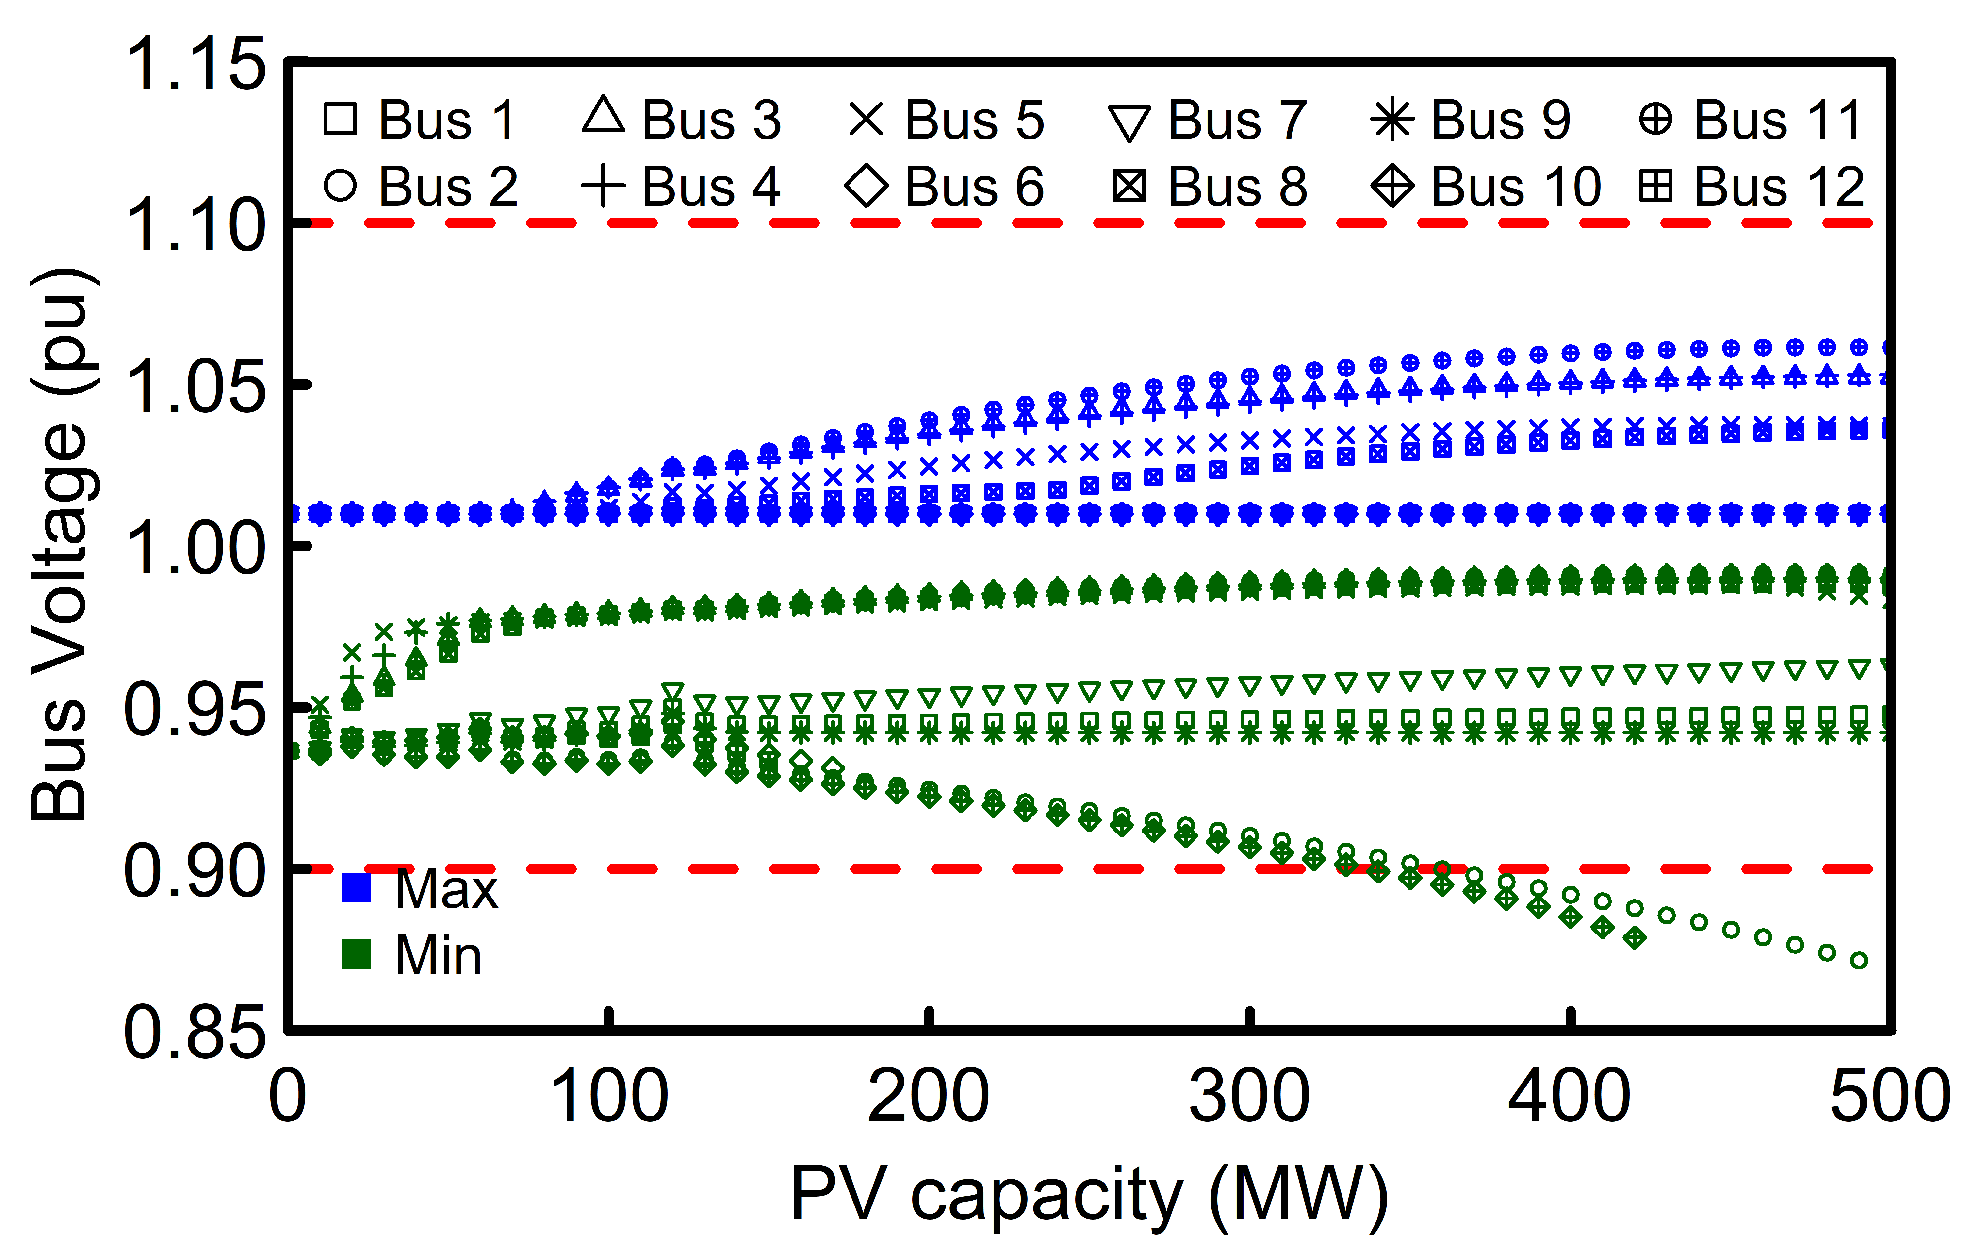
Contrary to conventional assumptions, increasing PV penetration does not only lead to increase in bus voltage. This capability for increasing solar PV capacity to lead to both increase and decrease in bus voltages was demonstrated in this study. Variations in bus voltage in some cases are due to substantial changes in power flow, hence significant changes in the voltage drop across the transmission lines. Utilities are typically regulated to maintain their bus voltages within certain limits, and this study assumes a violation when any of the bus voltages exceeds 1.1 or below 0.9 pu. Due to multiple factors including substantial circuit violations, networks solutions for PV capacity beyond certain values do not converge and such cases are only evaluated based on available solutions. The maximum and minimum bus voltages for the network varies based on the PV POI as illustrated in Figure 13. Hence, up to 320 MW PV capacity can be connected to any of the transmission circuit buses without any voltage violation.
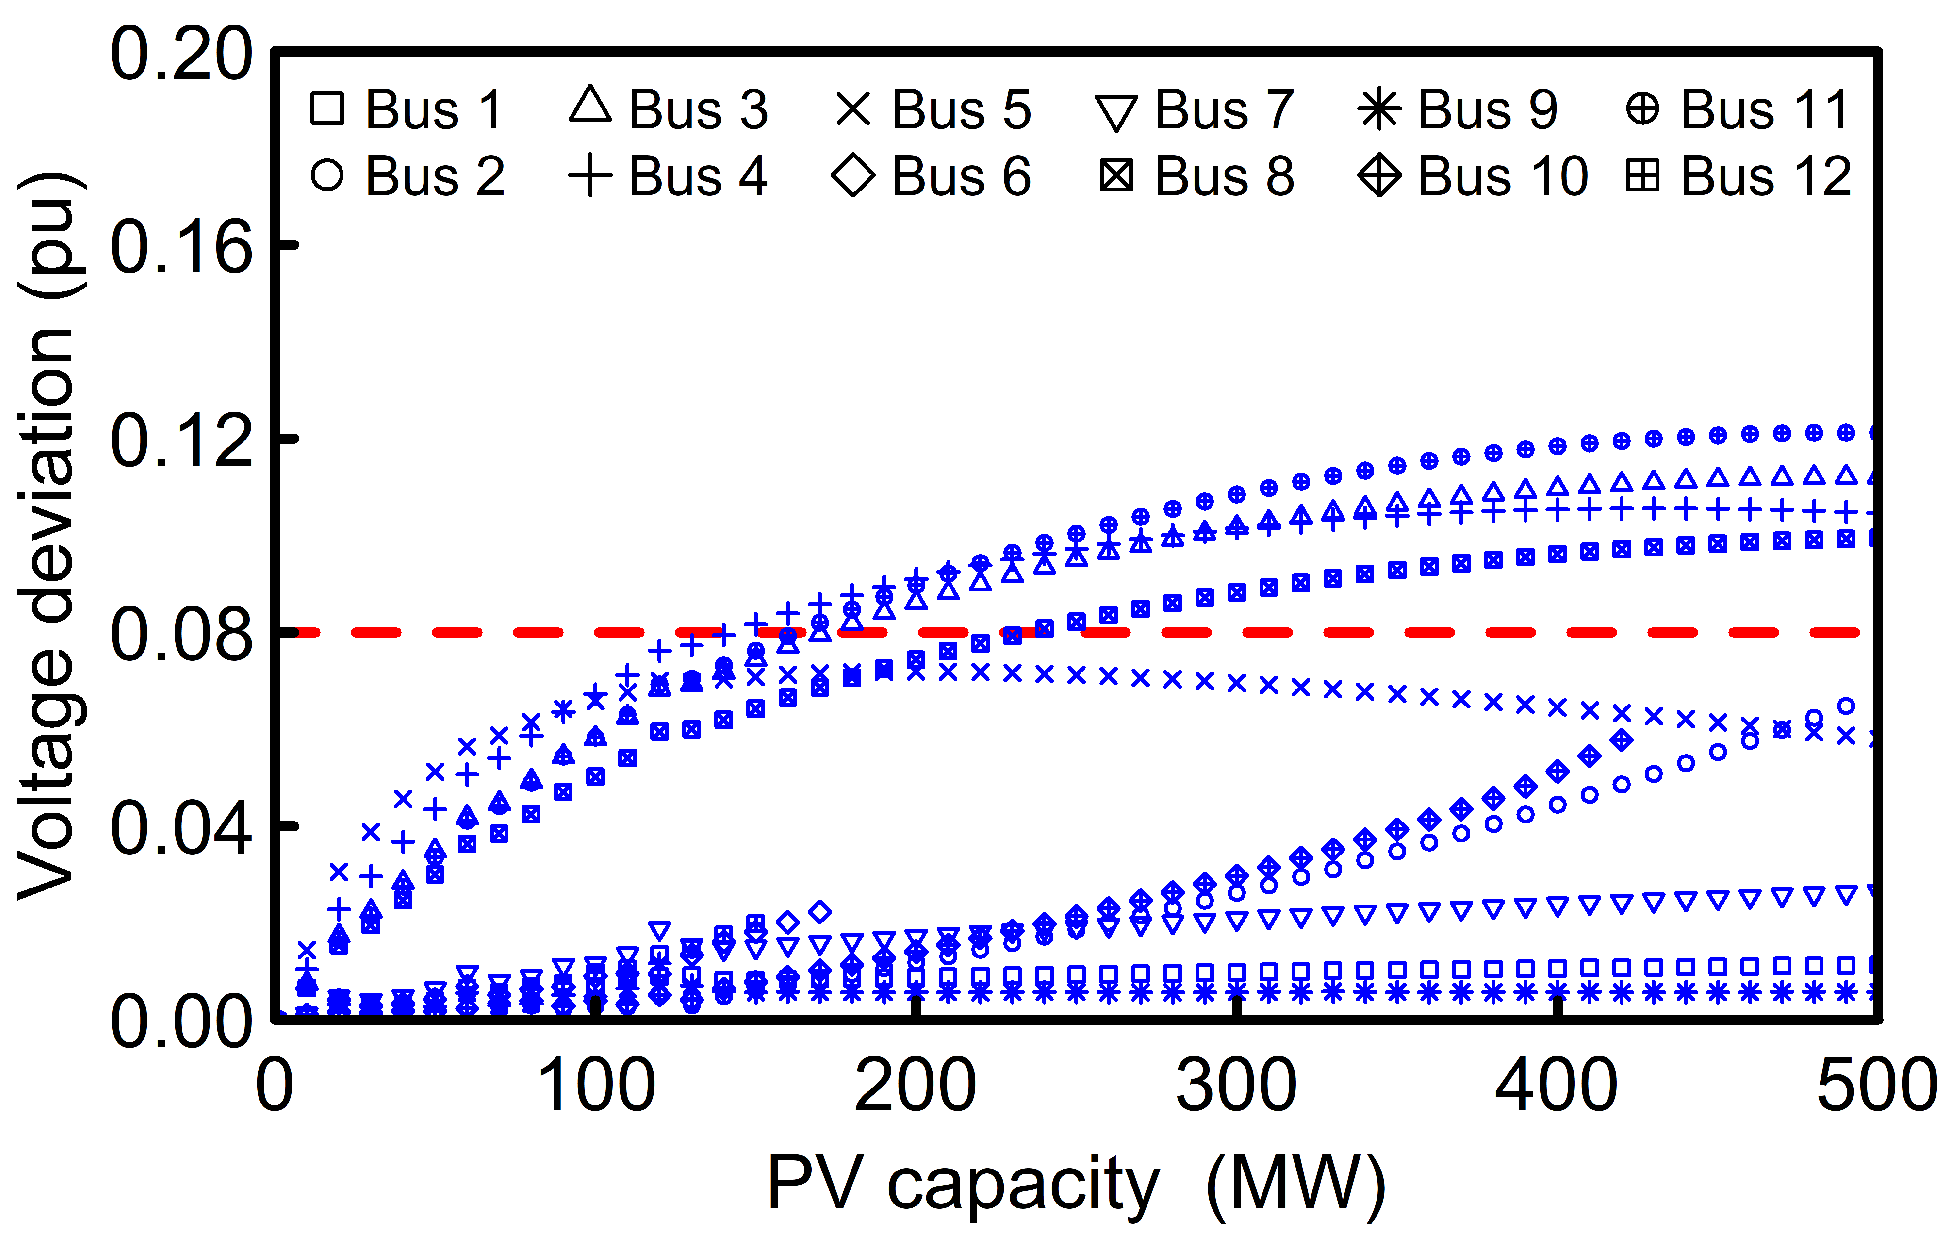
The maximum and minimum bus voltage in a transmission network is significantly influenced by the scheduled voltages of the connected generator units. Hence, a measure of the maximum and minimum bus voltages alone may not be able to capture the impact of increasing solar PV penetration. In addition to the maximum and minimum bus voltage limits, utilities are typically required to maintain bus voltage variation within certain values. This maximum voltage deviation can also be an indicator of the expected voltage variations due to the PV intermittency. For this study, a PV capacity that leads to bus voltage deviation that exceeds 0.08 pu is undesirable. The maximum voltage deviation varies based on PV capacity and POI as illustrated in Figure 14. Based on this analysis, up to 140 MW PV may be connected to any of the circuit buses with bus voltage deviations exceeding 0.08 pu.
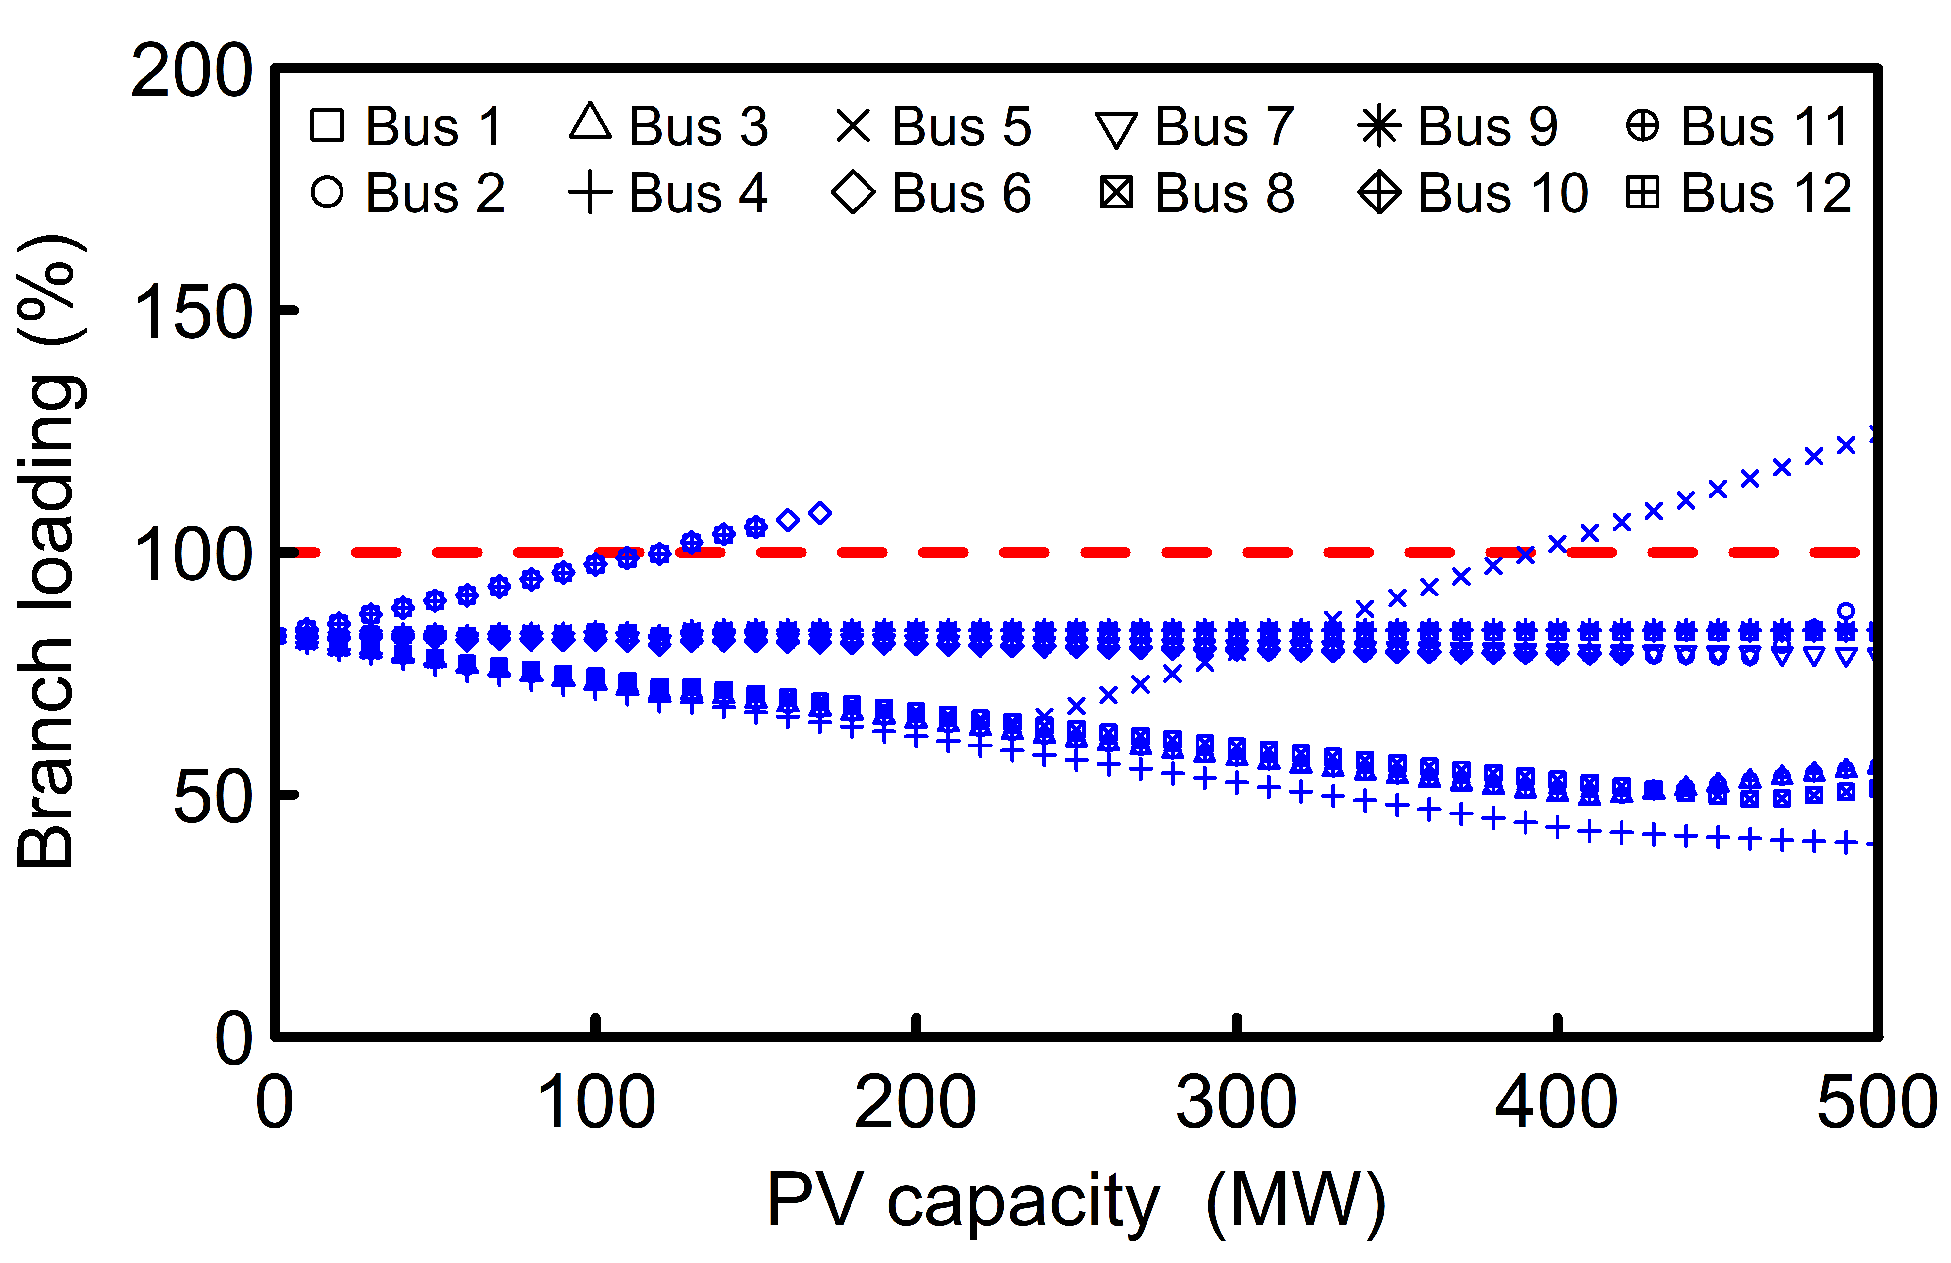
Transmission line power flow are typically limited to restrict the temperature attained by energized conductors and the resulting sag and loss of tensile strength. This study focuses on the maximum PV penetration the network can sustain at steady state of a substantial period of time. Hence, the percentage loading for on all the transmission lines were evaluated for defined solar PV capacity. A thermal violation is recorded when the maximum transmission line loading exceeds 100% of its rated capacity. For the example network considered, buses 10, 11 and 12 are the least desirable for PV connection without overloading any of the transmission lines (Figure 15). Based on this analysis, up to 110 MW PV may be connected to any of the buses without any thermal violation.
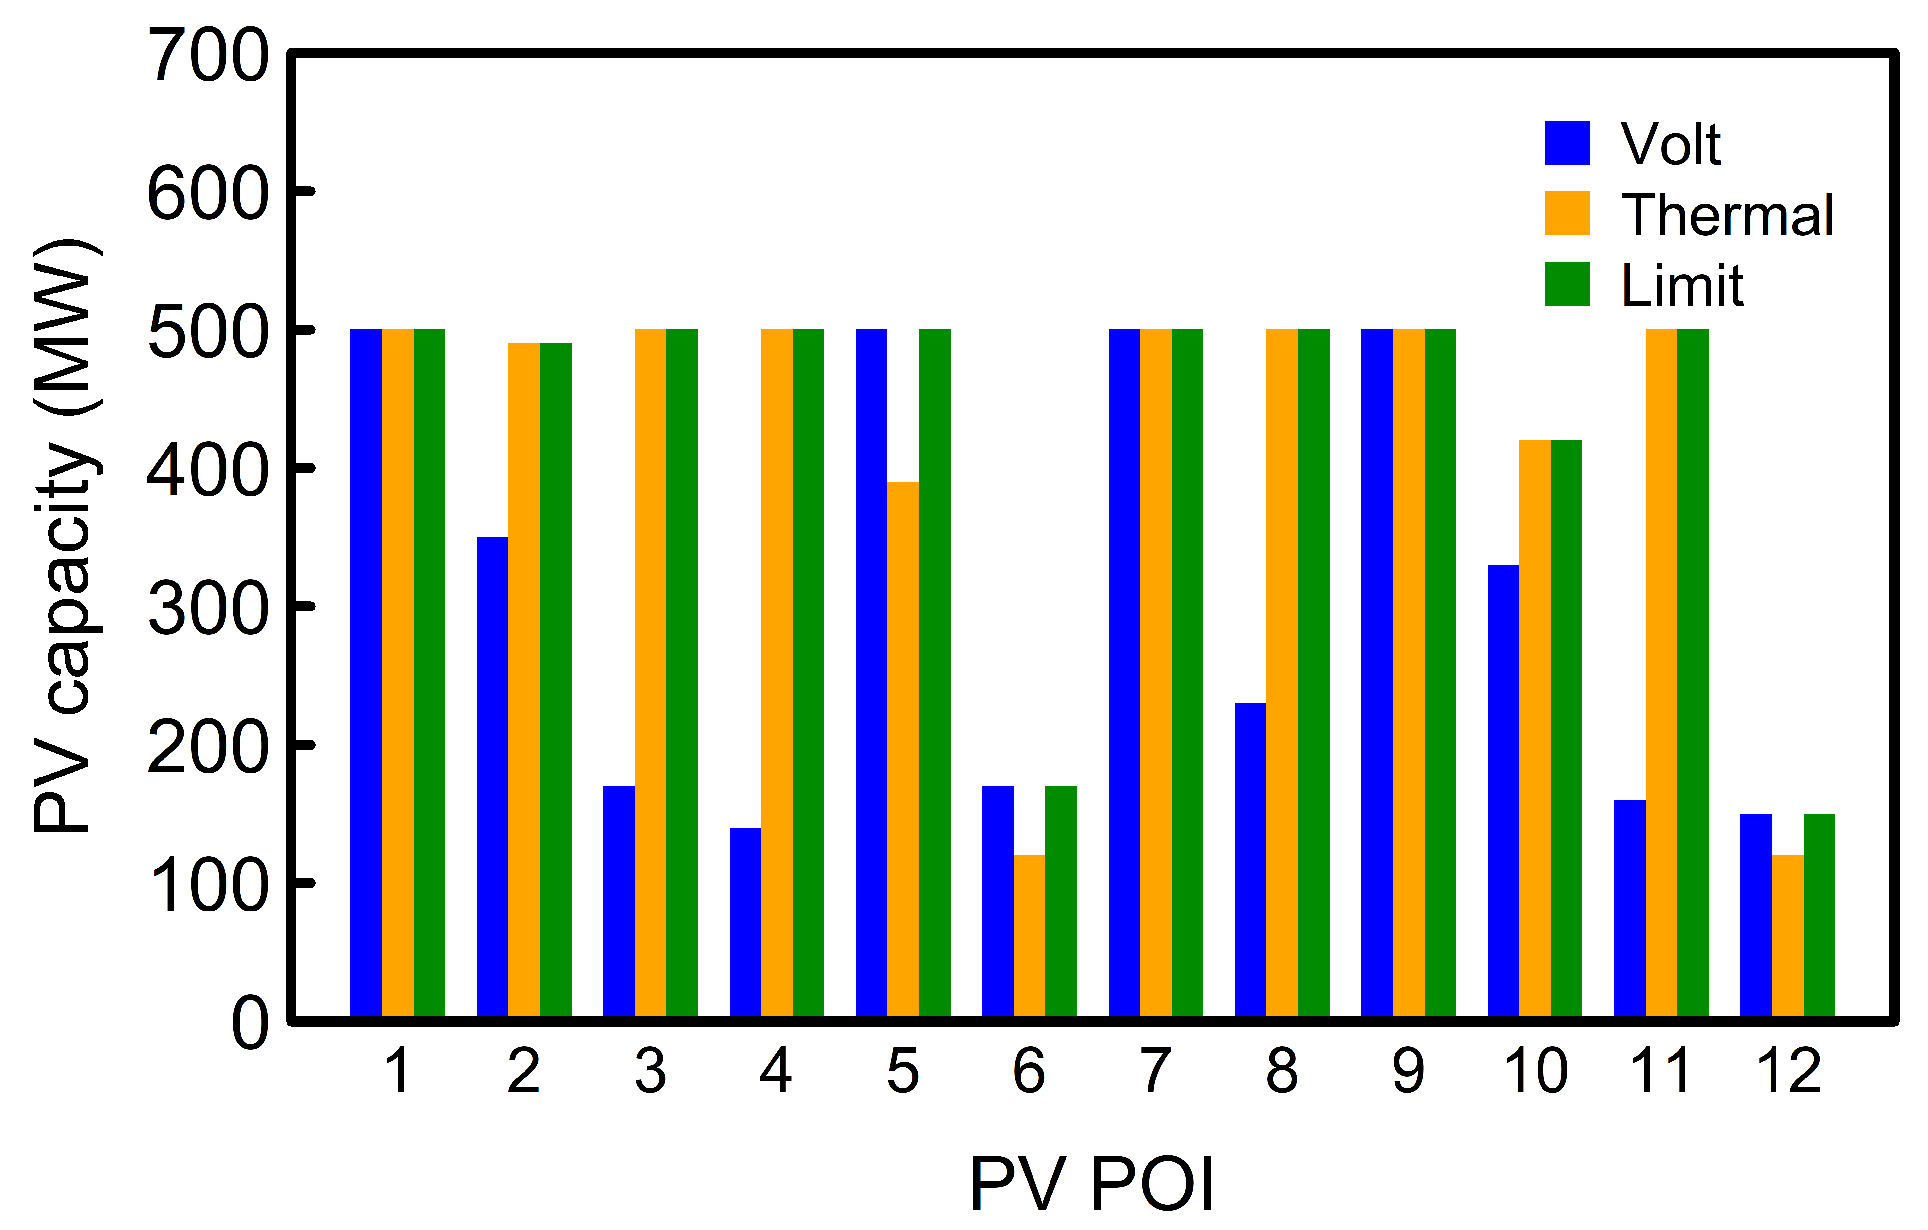
For this example study, a PV capacity is acceptable if all the bus voltages are within 0.9–1.1 pu, voltage differences with and without PV do not exceed 0.08 pu for any bus, and the thermal loading for any of the transmission lines is below 100%. Study is primarily focused on PV penetrations without significant changes to existing infrastructure, therefore, supplementary devices such as voltage regulators, capacitor banks, and other complementary tools were not considered. This study demonstrates that the maximum PV capacity without any network violation depends on the PV POI (Figure 16). Based on the maximum PV capacity for the analyzed cases without voltage or thermal violations, the preferred PV POI for the analyzed network are buses 1, 7 and 9.
7. Conclusions
This paper proposes an analytical framework, which includes a minute-to-minute economic dispatch model and a transmission network analyzing module for the evaluation of large solar PV impacts on both the generation and transmission systems. This framework can be employed for multiple applications including studies for estimating the maximum solar PV capacity a service area can support, the generation violations due to solar PV penetrations, the preferred location to connect solar PV plants, and the power system violations on the transmission network due to solar PV penetration. Furthermore, the proposed framework may be adopted for other intermittent sources such as wind power plants, and evaluate their effect on both the generation and transmission network system.
The detailed technical benefits for the proposed framework were demonstrated through the evaluation of the impact of increasing solar PV penetration on both the generation and transmission network for a modified IEEE 12 bus system with four conventional generators. Contrary to conventional approaches based on hourly dispatch models, the proposed technique employs a detailed minute-to-minute economic dispatch model to capture the impact of increasing PV penetration and identify periods of generation imbalance suitable for regulatory practices. Additionally, the framework was used to estimate the maximum PV hosting capacity for the transmission network with regards to the bus voltage and transmission line violations.
Based on the results for the example transmission circuit and generators responses for the day evaluated, the maximum capacity of the solar PV plant a service area can sustain without needing significant upgrades to the existing infrastructure depends on, the available unit specifications, the PV point of interconnections, and the voltage and thermal limits of the transmission network buses and lines, respectively. The results from the example 2248 MW system evaluated indicate that the system can sustain up to 400 MW, 17.8% of capacity, PV penetration without substantial generation violation and up to 120 MW PV plant can be connected to any of the buses in the transmission network without any voltage or thermal violation at peak load. The hosting capacity of the transmission network considering solar PV plants at multiple POI and the integration of battery energy storage systems to improve the acceptable PV capacity on the circuit are subjects of ongoing studies.
Author Contributions
Conceptualization, O.M.A., A.P. and D.M.I.; Formal analysis, O.M.A.; Funding acquisition, A.P.; Investigation, O.M.A.; Methodology, O.M.A., A.P. and D.M.I.; Supervision, D.M.I.; Writing—original draft, O.M.A.; Writing—review & editing, A.P. and D.M.I. All authors have read and agreed to the published version of the manuscript.
Funding
This research was funded by Louisville Gas and Electric and Kentucky Utilities, part of the PPL Corporation family of companies.
Informed Consent Statement
Not applicable.
Data Availability Statement
No new data were created or analyzed in this study. Data sharing is not applicable to this article.
Acknowledgments
The support of University of Kentucky, the L. Stanley Pigman endowment and of the Louisville Gas and Electric and Kentucky Utilities, part of the PPL Corporation family of companies is gratefully acknowledged.
Conflicts of Interest
The authors declare no conflict of interest.
References
- Blaabjerg, F.; Ionel, D.M. Renewable Energy Devices and Systems with Simulations in MATLAB® and ANSYS®; CRC Press: Boca Raton, FL, USA, 2017. [Google Scholar]
- Nelson, J.; Kasina, S.; Stevens, J.; Moore, J.; Olson, A.; Morjaria, M.; Smolenski, J.; Aponte, J. Investigating the Economic Value of Flexible Solar Power Plant Operation; Energy and Environmental Economics, Inc.: San Francisco, CA, USA, 2018. [Google Scholar]
- Basu, M. Multi-region dynamic economic dispatch of solar–wind–hydro–thermal power system incorporating pumped hydro energy storage. Eng. Appl. Artif. Intell. 2019, 86, 182–196. [Google Scholar] [CrossRef]
- Bai, J.; Ding, T.; Wang, Z.; Chen, J. Day-ahead robust economic dispatch considering renewable energy and concentrated solar power plants. Energies 2019, 12, 3832. [Google Scholar] [CrossRef] [Green Version]
- Tavakoli, A.; Saha, S.; Arif, M.T.; Haque, M.E.; Mendis, N.; Oo, A.M.T. Impacts of grid integration of solar PV and electric vehicle on grid stability, power quality and energy economics: A review. IET Energy Syst. Integr. 2020, 2, 243–260. [Google Scholar] [CrossRef]
- Singhvi, V.; Ramasubramanian, D. Renewable Generation Hosting Capacity Screening Tool for a Transmission Network; Technical Report; Electric Power Research Institute (EPRI): Knoxville, TN, USA, 2018. [Google Scholar]
- Jadoun, V.K.; Pandey, V.C.; Gupta, N.; Niazi, K.R.; Swarnkar, A. Integration of renewable energy sources in dynamic economic load dispatch problem using an improved fireworks algorithm. IET Renew. Power Gener. 2018, 12, 1004–1011. [Google Scholar] [CrossRef]
- Singh, S.; Gao, D.W. Noiseless consensus based algorithm for economic dispatch problem in grid-connected microgrids to enhance stability among distributed generators. In Proceedings of the 2019 North American Power Symposium (NAPS), Wichita, KS, USA, 13–15 October 2019; pp. 1–5. [Google Scholar]
- Kim, T.Y.; Won, G.H.; Chung, Y. Optimal dispatch and unit commitment strategies for multiple diesel generators in shipboard power system using dynamic programming. In Proceedings of the 2018 21st International Conference on Electrical Machines and Systems (ICEMS), Jeju, Korea, 7–10 October 2018; pp. 2754–2757. [Google Scholar]
- Divshali, P.H.; Söder, L. Improving PV dynamic hosting capacity using adaptive controller for STATCOMs. IEEE Trans. Energy Convers. 2019, 34, 415–425. [Google Scholar] [CrossRef]
- Mahroo-Bakhtiari, R.; Izadi, M.; Safdarian, A.; Lehtonen, M. Distributed load management scheme to increase PV hosting capacity in LV feeders. IET Renew. Power Gener. 2020, 14, 125–133. [Google Scholar]
- Diaz, D.; Kumar, A.; Deboever, J.; Grijalva, S.; Peppanen, J.; Rylander, M.; Smith, J. Scenario-selection for hosting capacity analysis of distribution feeders with voltage regulation equipment. In Proceedings of the 2019 IEEE Power Energy Society Innovative Smart Grid Technologies Conference (ISGT), Washington, DC, USA, 18–21 February 2019; pp. 1–5. [Google Scholar] [CrossRef]
- Le Baut, J.; Zehetbauer, P.; Kadam, S.; Bletterie, B.; Hatziargyriou, N.; Smith, J.; Rylander, M. Probabilistic evaluation of the hosting capacity in distribution networks. In Proceedings of the 2016 IEEE PES Innovative Smart Grid Technologies Conference Europe (ISGT-Europe), Ljubljana, Slovenia, 9–12 October 2016; pp. 1–6. [Google Scholar] [CrossRef]
- Feldman, D.J.; Margolis, R.M. Q4 2018/Q1 2019 Solar Industry Update; Technical Report; National Renewable Energy Lab. (NREL): Golden, CO, USA, 2019. [Google Scholar]
- Crăciun, B.; Kerekes, T.; Séra, D.; Teodorescu, R.; Timbus, A. Benchmark networks for grid integration impact studies of large PV plants. In Proceedings of the 2013 IEEE Grenoble Conference, Grenoble, France, 16–20 June 2013; pp. 1–6. [Google Scholar] [CrossRef] [Green Version]
- Khan, N.A.; Sidhu, G.A.S.; Gao, F. Optimizing combined emission economic dispatch for solar integrated power systems. IEEE Access 2016, 4, 3340–3348. [Google Scholar] [CrossRef]
- Adamczyk, A.; Altin, M.; Göksu, Ö.; Teodorescu, R.; Iov, F. Generic 12-bus test system for wind power integration studies. In Proceedings of the 2013 15th European Conference on Power Electronics and Applications (EPE), Lille, France, 2–6 September 2013; pp. 1–6. [Google Scholar] [CrossRef]
- Live Solar Generation Data | LG&E and KU. Available online: https://lge-ku.com/live-solar-generation (accessed on 10 August 2020).
- North American Electric Reliability Corporation (NERC). Standard BAL-001-1–0-Real Power Balancing Control Performance. Available online: https://www.nerc.com/pa/Stand/Reliability%20Standards/BAL-001-1.pdf (accessed on 12 August 2020).
- Standard BAL-002-1—Real Power Balancing Control Performance; North American Electric Reliability Corporation (NERC). Available online: https://www.nerc.com/pa/Stand/Reliability%20Standards/BAL-002-1.pdf (accessed on 12 August 2020).
- Glover, J.D.; Sarma, M.S.; Overbye, T. Power System Analysis & Design, SI Version; Cengage Learning: Thompson, Australia, 2012. [Google Scholar]
- Kokopeli, P.; Schreifels, J.; Forte, R. Assessment of Startup Period at Coal-Fired Electric Generating Units; Technical Report, Document ID: EPA-HQ-OAR-2009-0234-20378; US Environmental Protection Agency, Office of Air and Radiation: Washington, DC, USA, 2013. Available online: http://www.epa.gov/airquality/powerplanttoxics/pdfs/matsstartstsd.pdf (accessed on 20 November 2013).
- Olowu, T.O.; Sundararajan, A.; Moghaddami, M.; Sarwat, A.I. Future challenges and mitigation methods for high photovoltaic penetration: A survey. Energies 2018, 11, 1782. [Google Scholar] [CrossRef] [Green Version]
- IEEE. IEEE Standard Conformance Test Procedures for Equipment Interconnecting Distributed Energy Resources with Electric Power Systems and Associated Interfaces; IEEE: New York, NY, USA, 2020; pp. 1–282. [Google Scholar]
- North American Electric Reliability Corporation (NERC). On FERC NOPR [Docket No. RM16-1-000] Proposal to Revise Standard Generator Interconnection Agreements. Available online: https://cms.ferc.gov/sites/default/files/2020-06/RM16-1-000_0.pdf (accessed on 12 September 2020).
Figure 1.
The aerial view of the E.W. Brown generating station, which includes Kentucky’s largest solar farm, hydropower plant, natural gas units, and coal fired power plants.
Figure 1.
The aerial view of the E.W. Brown generating station, which includes Kentucky’s largest solar farm, hydropower plant, natural gas units, and coal fired power plants.

Figure 2.
Single line diagram for the modified benchmark network with PV plant connected to bus 2 and values corresponding to approximately 65% (1450 MW) load level. The transmission circuit was completely assessed for PV connection at any of its buses.
Figure 2.
Single line diagram for the modified benchmark network with PV plant connected to bus 2 and values corresponding to approximately 65% (1450 MW) load level. The transmission circuit was completely assessed for PV connection at any of its buses.

Figure 3.
Example heat rate curve for natural gas combustion turbine (NGCT), coal, and natural gas combined cycle (NGCC) thermal generators considered in this study.
Figure 3.
Example heat rate curve for natural gas combustion turbine (NGCT), coal, and natural gas combined cycle (NGCC) thermal generators considered in this study.

Figure 4.
The operation cost in $/MWh including the fuel and auxiliary costs for the thermal units considered. The cost rate in $/h can be calculated as a product of the operation cost and the generation.
Figure 4.
The operation cost in $/MWh including the fuel and auxiliary costs for the thermal units considered. The cost rate in $/h can be calculated as a product of the operation cost and the generation.

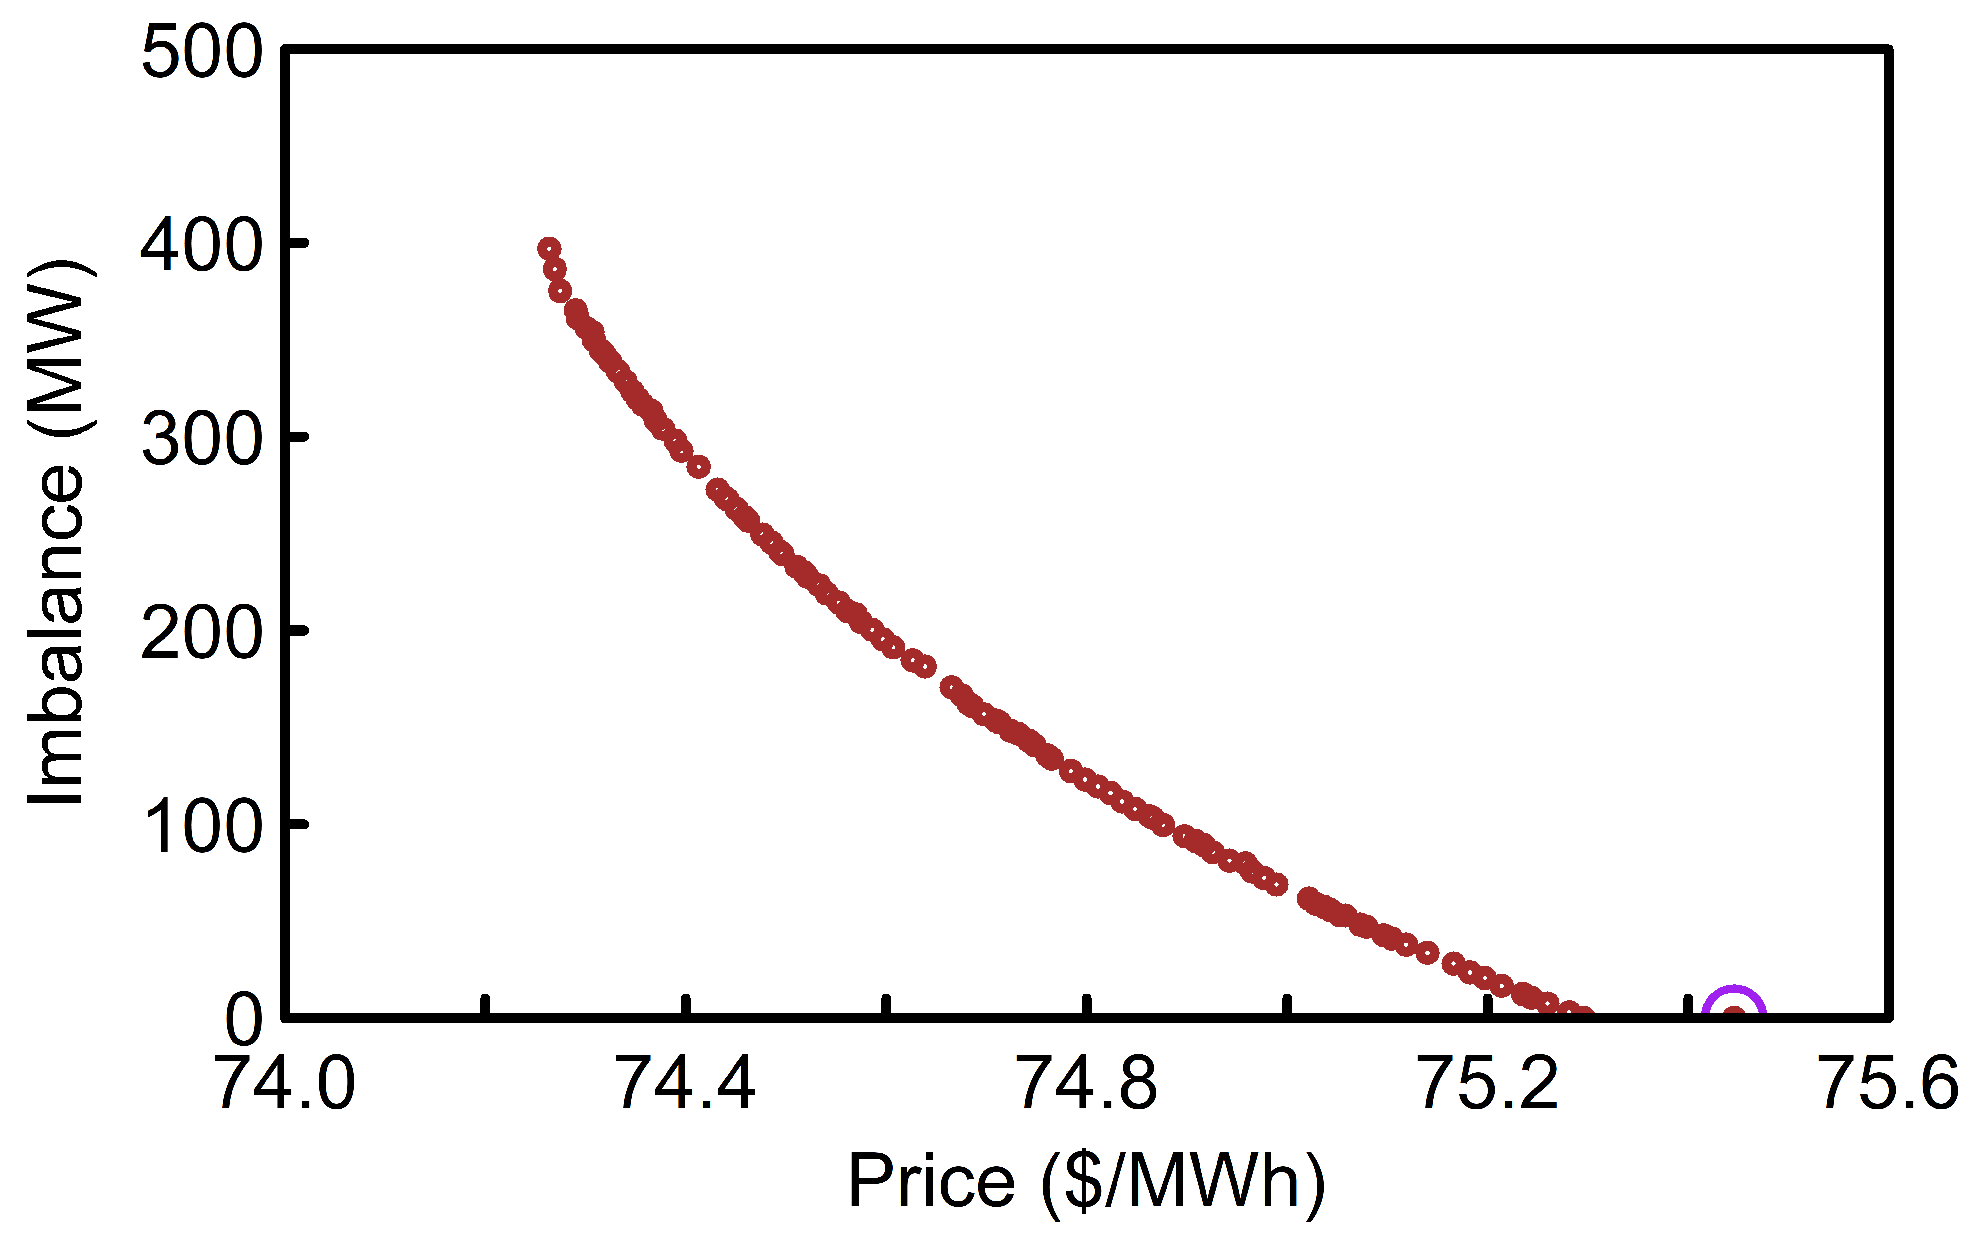
Figure 5.
The multi-objective optimization Pareto front for example minute. The selected design is the one with the minimum imbalance for every case.
Figure 5.
The multi-objective optimization Pareto front for example minute. The selected design is the one with the minimum imbalance for every case.

Figure 6.
Minute-to-minute (M-M) unit economic dispatch highlighting the impact of increasing PV penetration on an example generation portfolio. The results indicate that large PV penetrations may lead to both over- and under-generation scenarios where combined power from units cannot match demand. The presented analysis include (a) no PV, (b) 250 MW PV, and (c) 500 MW PV penetration case studies.

Figure 7.
Example day over-generation violation count. In this approach a violation count is recorded when the dispatch imbalance exceeds 20 MW over defined consecutive minutes (5, 10 and 15).
Figure 7.
Example day over-generation violation count. In this approach a violation count is recorded when the dispatch imbalance exceeds 20 MW over defined consecutive minutes (5, 10 and 15).

Figure 8.
Under-generation violation count at increasing PV penetration rate. Under-generation occurs when PV becomes suddenly shaded and thermal units cannot ramp up fast enough to supply deficit power.
Figure 8.
Under-generation violation count at increasing PV penetration rate. Under-generation occurs when PV becomes suddenly shaded and thermal units cannot ramp up fast enough to supply deficit power.

Figure 9.
Curtailed energy solar energy for example day. In order to limit over-generation, an exponential increase in the total solar PV power curtailed can be observed.
Figure 9.
Curtailed energy solar energy for example day. In order to limit over-generation, an exponential increase in the total solar PV power curtailed can be observed.

Figure 10.
PV plant capacity factor based on penetration. Capacity factor can be observed to reduce with increase in curtailed power.
Figure 10.
PV plant capacity factor based on penetration. Capacity factor can be observed to reduce with increase in curtailed power.

Figure 11.
Operation cost saving due to increase in PV penetration. For the example day considered, an increase in operation cost was observed for PV penetrations below 500 MW due to operation of inefficient units to meet demand.
Figure 11.
Operation cost saving due to increase in PV penetration. For the example day considered, an increase in operation cost was observed for PV penetrations below 500 MW due to operation of inefficient units to meet demand.

Figure 12.
Operational flow chart for the proposed framework for estimating the hosting capacity on a transmission network. The steady-state impact for increasing solar PV capacity at different POI was evaluated to estimate the maximum PV hosting capacity for the network.
Figure 12.
Operational flow chart for the proposed framework for estimating the hosting capacity on a transmission network. The steady-state impact for increasing solar PV capacity at different POI was evaluated to estimate the maximum PV hosting capacity for the network.

Figure 13.
The maximum and minimum bus voltage variation for increasing PV capacity over multiple points of interconnection (POI). A PV capacity is undesirable if it leads to bus voltage variation above 1.1 or below 0.9 pu.
Figure 13.
The maximum and minimum bus voltage variation for increasing PV capacity over multiple points of interconnection (POI). A PV capacity is undesirable if it leads to bus voltage variation above 1.1 or below 0.9 pu.

Figure 14.
Maximum bus voltage deviation for defined PV capacity. A violation is recorded if the maximum voltage deviation exceeds 0.08 pu. The maximum voltage deviation is also an indicator of the expected voltage variation due PV intermittency.
Figure 14.
Maximum bus voltage deviation for defined PV capacity. A violation is recorded if the maximum voltage deviation exceeds 0.08 pu. The maximum voltage deviation is also an indicator of the expected voltage variation due PV intermittency.

Figure 15.
Maximum transmission line loading. Depending on the POI, PV integration may lead to substantial reduction in transmission line loading.
Figure 15.
Maximum transmission line loading. Depending on the POI, PV integration may lead to substantial reduction in transmission line loading.

Figure 16.
Maximum PV hosting capacity with respect to the circuit solution limit, voltage violation and thermal limits at peak load level.
Figure 16.
Maximum PV hosting capacity with respect to the circuit solution limit, voltage violation and thermal limits at peak load level.


Table 1.
Specifications for the generating units in the modified IEEE 12 bus test case studied.
| Bus | Type | Rating | Min Gen | Ramp | Heat Rate Co-Eff. | Fuel | Aux | ||
|---|---|---|---|---|---|---|---|---|---|
| No. | (MW) | (MW) | (MW/min) | a (10) | b | c | ($/MMBtu) | ($/MWh) | |
| 9 | NGCC | 750 | 368 | 10 | 0.4 | 7.7 | 630 | 1.76 | 1.23 |
| 10 | Coal | 640 | 288 | 7 | 5.5 | 2.7 | 1935 | 1.96 | 1.79 |
| 11 | NGCT | 384 | 203 | 9 | 20.7 | 2.7 | 753 | 1.76 | 5.54 |
| 12 | Hydro | 474 | - | - | - | - | - | - | - |
Publisher’s Note: MDPI stays neutral with regard to jurisdictional claims in published maps and institutional affiliations. |
© 2020 by the authors. Licensee MDPI, Basel, Switzerland. This article is an open access article distributed under the terms and conditions of the Creative Commons Attribution (CC BY) license (http://creativecommons.org/licenses/by/4.0/).
Share and Cite
MDPI and ACS Style
Akeyo, O.M.; Patrick, A.; Ionel, D.M. Study of Renewable Energy Penetration on a Benchmark Generation and Transmission System. Energies 2021, 14, 169. https://doi.org/10.3390/en14010169
AMA Style
Akeyo OM, Patrick A, Ionel DM. Study of Renewable Energy Penetration on a Benchmark Generation and Transmission System. Energies. 2021; 14(1):169. https://doi.org/10.3390/en14010169
Chicago/Turabian StyleAkeyo, Oluwaseun M., Aron Patrick, and Dan M. Ionel. 2021. "Study of Renewable Energy Penetration on a Benchmark Generation and Transmission System" Energies 14, no. 1: 169. https://doi.org/10.3390/en14010169
Note that from the first issue of 2016, this journal uses article numbers instead of page numbers. See further details here.