Electric Mobility in a Smart City: European Overview †


1
Department of Management, Sapienza, University of Rome, Via del Castro Laurenziano 9, 00161 Rome, Italy
2
Faculty of Economics, Nicolò Cusano University (Unicusano), Via Don Carlo Gnocchi 3, 00166 Rome, Italy
*
Author to whom correspondence should be addressed.
†
This paper is an extended version of “Efficient energy and electric transport in a Smart City: evaluation of sustainability and competitiveness”, presented at EEEIC 2020—20th IEEE International Conference on Environment and Electric Engineering, Madrid, 9–12 June 2020.
Energies 2021, 14(2), 315; https://doi.org/10.3390/en14020315
Submission received: 10 December 2020
/
Revised: 3 January 2021
/
Accepted: 6 January 2021
/
Published: 8 January 2021
(This article belongs to the Section E: Electric Vehicles)
Abstract
:According to the United Nations (UN), although cities occupy only 3% of Earth’s surface, they host more than half of the global population, are responsible for 70% of energy consumption, and 75% of carbon emissions. All this is a consequence of the massive urbanization verified since the 1950s and which is expected to continue in the coming decades. A crucial issue will therefore concern the management of existing cities and the planning of future ones, and this was also emphasized by the UN Sustainable Development Goals (SDGs), especially in Goal 11 (Sustainable Cities and communities). Smart Cities are often seen as ideal urban environments in which the different dimensions of a city (economy, education, energy, environment, etc.) are managed successfully and proactively. So, one of the most important challenges cities will have to face, is to guide citizens towards a form of “clean” energy consumption, and the dimension on which decision-makers will be able to work is the decarbonization of transport. To achieve this, electric mobility could help reduce polluting emissions on the road. Within this research, the strategies that six Smart Cities (London, Hamburg, Oslo, Milan, Florence, and Bologna) have implemented to encourage the transition to this form of mobility have been studied. Through a systematic review of the literature (Scopus, Google Scholar, and Web of Science) and through the study of the main political/energy documents of the cities, their policies on electric mobility have been evaluated. Then, for each city, SDG 11.6.2 was analyzed to assess the air quality in the last four years (2016–2019) and, therefore, the effectiveness of the policies. The analysis showed, in general, that the policies have worked, inducing reductions in the pollutants of PM2.5, PM10, NO2. In particular, the cities showed the most significant reduction in pollutant (above 20%) were Hamburg (−28% PM2.5 and −2%6 NO2), Milan (−25% PM2.5 and −52% NO2), and London (−26% NO2).
Keywords:
energy; efficiency; electric mobility; smart cities; London; Oslo; Hamburg; Milan; Florence; Bologna1. Introduction
According to the United Nations, by 2030, the number of “megacities” with more than 10 million inhabitants could be 41, consuming 81% of the world’s resources, while by 2050, the urban population will reach 60% of the global one and demand of primary energy could rise to around 1.72 × 10⁵ TWh (66% of the total) [1,2]. Already today, most of the Countries of Europe and America are heavily urbanized. About 72% of the European population lives within an urban center [1], and in some countries, such as the Netherlands, the urbanization rate reaches 90%. Furthermore, despite cities occupying only 3% of the Earth’s surface, they host more than half of the global population, are responsible for two-thirds of energy consumption and 75% of carbon emissions [1].
In 2016, 55% of the world’s population lived in urban areas, and current trends predict an increase of up to 60% by 2030 [3]. Within rural areas, on the other hand, there are about three billion people, and it is expected that this number should remain so until 2050, while growth should occur almost exclusively within cities [4]. Between rural and urban areas, there are different pressures due to a highly asymmetrical distribution of economic, productive, and educational activities (such as company headquarters and workplaces, universities), which is reflected in the reduction of the supply of local services (shops, post offices, doctors, and education) leading inhabitants, especially young people, to emigrate to urban areas. The growth of urbanization, therefore, generates important environmental problems, including greenhouse gas emissions (GHGs), which affect air quality. For this reason, one of the main challenges for cities will be to decouple urban development from the deterioration of the quality of life of their citizens and environmental conditions.
For several years, global policies have been geared towards making cities sustainable through the efficient use of resources and the promotion of a low-carbon economy. This context includes global cooperation networks such as “C40 cities Climate Leadership Group” [5], the “Global Covenant of Mayors for Climate and Energy” [6] and the “Paris Agreement” [7] which commits the signatory Countries to keep the temperature rise below 2 °C. Furthermore, the key role of cities in promoting sustainability has been recognized by the UN in Goal 11 (Sustainable cities and communities) of the 17 “Sustainable Development Goals” (SDGs) (Agenda 2030) [8]. However, the revision of the SDGs shows there are other objectives that are directly and/or indirectly linked to the sustainable management of urban centers. Goal three of the SDGs aims to safeguard good health and well-being by guaranteeing access to quality services and more ways to reduce environmental pollution. Goal seven of the SDGs is aimed at affordable, reliable, and modern energy services, increased investment in energy infrastructure and clean energy technology, also relevant for goal eight and 13 of the SDGs is aimed at environmental conservation, while goal nine of the SDGs calls for building resilient infrastructure, promoting inclusive and sustainable industrialization and promoting innovation. Achieving these objectives places political pressure to identify the appropriate solutions, methods, and tools to decouple the growth of urban centers from environmental degradation. Furthermore, they provide an excellent opportunity for cities to put environmental sustainability at the forefront.
“Next cities” will therefore have to be able to face the new needs related to urbanization, and one of the main challenges will be linked to the production of “clean” energy. Currently, much of the global energy production is still largely based on the use of fossil fuels (74%) [9], and the demand for energy supply has grown over time: Compared to 1750, carbon dioxide (CO2) in the atmosphere has increased by 43%, and its concentration in March 2019 was 413 ppm (compared to 280 ppm in the pre-industrial period). In the period between 1960 and 1970, the growth rate of CO2 was 0.85 ppm per year, while between 2008 and 2017, it was 2.28 ppm per year [10]. CO2 is produced directly by human activities, mainly from industrial processes (plants to produce energy, waste incinerators) and from the exhaust pipes of petrol vehicles, which also emit so-called fine dust, including Particulate Matter (PM2.5 and PM10), Black Carbon (BC), Ultrafine Particles (UFP), Nitrogen Dioxide (NO2), and Carbon Monoxide (CO). Greenhouse Gases and fine dust contribute strongly to environmental pollution and are particularly harmful to health: It is estimated that in Europe, environmental pollution reduces life expectancy on average by 2.2 years, with an attributable annual mortality rate of 133 cases/year for 100,000 inhabitants [11]. This is no longer sustainable, and in the future, there is a serious risk of precluding the achievement of the Sustainable Development Goals. Cities will be called upon to face a series of environmental, social, and economic challenges, and it is within this context that “smart cities (SC)” are born. A SC is a broad framework of urban center evolution strategies that incorporate multiple levels of development, including the use of renewable energy, environmental care, sustainable mobility, bike and car sharing, information sharing, etc., and could become a tool in order to meet goals three, seven, eight, nine, 11, and 13. It can be understood as a place that aims to be economically sustainable, energetically self-sufficient, and attentive to the living conditions and needs of its citizens in order to guarantee social equity, economic benefits, and respect for the environment according to the “triple bottom line” (TBL) [12].
Based on this approach, it is possible to consider the “smartness” of a city depends on its ability to create a social structure in which the well-being and quality of life of citizens are put in the foreground, according to a long-term perspective, in which choices at the level of the citizen are implemented, also taking care of social and environmental variables, both for present and future generations. So, a Smart City can help overcome the limits and contradictions of the current urban development model, characterized by a poor connection between the different resources available. However, SC should not be seen only as a list of solutions, but as a multiannual holistic approach, therefore based both on the planning of projects and investments with a medium-long term time horizon and on the involvement of multiple stakeholders (citizens, private investors, and local administrations). Given that private transport within a city has a significant environmental impact, the energy efficiency of the transport system could improve the well-being, competitiveness, and sustainability of urban centers. The governance of a smart city could, therefore, consider the promotion of electric mobility. The objective of this research is to provide a deeper understanding of how this form of mobility is developing and evolving in some cities in Europe. A comparison was made between six Smart Cities (London, Hamburg, Oslo, Milan, Florence, and Bologna), three in Northern Europe and three in Italy. Through a systematic review of the literature (Scopus, Google Scholar, and Web of Science) and through the information obtained in their policy and strategic documents (official websites), we tried to obtain information on how they manage electric mobility. Then, through the analysis of SDG 11.6.2 (Annual mean levels of PM2.5, PM10, and NO2) between 2016–2019, we tried to understand whether these policies were effective or not. The six cities were chosen because they are Smart Cities that have adopted policies, strategies, and official documents (published in the last five years) specifically linked to decarbonization and sustainable transport, with the common goal of being carbon neutral by 2030–2050. Other cities with a similar reputation can be considered in a later study. The paper is organized as follows. Section 2 presents an overview of electric mobility. Section 3 presents a review of the main measures in support of electric mobility implemented in recent years by the cities considered, based on the existing literature and their main strategic and policy documents. Section 4 deals with the discussion about the effectiveness of the policies of the six cities, as well as the possible environmental problems related to electric mobility, followed by the conclusions in Section 5.
2. Efficient and Non-Polluting Transport Systems: Electric Mobility (e-Mobility)
More than 80% of the global urban population is exposed to higher levels of air pollution than those recommended by the World Health Organization (WHO) [13]. One of the main causes of global air pollution is automotive. Combustion vehicles are responsible for emissions of Particulate Matter (PM2.5 and PM10), Black Carbon (BC), Ultrafine Particles (UFP), Nitrogen Oxide (NO2), and Carbon Monoxide (CO), which are harmful to human health. Globally, road transport is responsible for 30% of NO2 emissions, 10% of total PM, 54% of CO, and urban mobility accounts for 40% of all CO2 emissions of road transport and up to 70% of other pollutants from transport [14,15,16]. To curb this trend, transport policies have been given priority in national and international Agendas, recognizing the urgent need to accelerate the transition to mobility models to ensure environmental sustainability, system efficiency, and cost-effectiveness for end-users, as well as implementing the industry’s broader modernization and technological development processes. In this regard, the European Parliament has issued Regulation (EU) 2019/1242, which sets CO2 emission standards, especially for heavy vehicles, with the aim of reducing global emissions by 2040 [17]. In particular, the will is to cut about 54 million tons of CO2 between 2020 and 2030 and 170 million tons of oil between 2020 and 2040 [18]. To achieve these objectives, the transition towards sustainable and decarbonized mobility, with the gradual replacement of traditional vehicles powered by fossil fuels, could be an effective solution, thanks also to the thrust of technological evolution linked, above all, to electric mobility. In fact, electric vehicles (EV) are particularly advantageous environmentally in the implementation of a SC; they are much less polluting because they do not emit carbon dioxide, NO2, non-methane hydrocarbons (NMHC), or PM.
In addition, they are silent and do not produce vibrations, a perfect feature in residential areas [18], although sometimes, this particularity can represent a danger to the safety of pedestrians [19]. The concept of “electric vehicles” is broad; in this study, it was considered for only electric cars.
2.1. Literature Background
Electric mobility is part of a broader framework of “sustainable mobility”, i.e., a set of modes of travel (and in general an urban mobility system) capable of reducing environmental, social, and economic impacts (atmospheric and acoustic pollution, road congestion, accidents, degradation of urban areas caused by the space occupied by vehicles at the expense of pedestrians) generated by private vehicles. Currently, the state of the art of electric mobility has about 49,500 documents (Scopus), with a growing trend over the last ten years. The articles are distributed among 60 Countries in which dominate four Countries: USA (22% of the total), China (11%), Japan (10%), Germany (9%). In general, the first studies related to e-mobility date back to the mid-1960s and mostly concern advances in electric vehicle batteries, e.g., Hender [20]. Until the end of the 1980s, research on electric mobility was quite scarce, with ~4400 articles only (10% of the total). This is most likely because technological advances in automotive brought the reliability, performance, and comfort of petrol vehicles have reached such a level that the subsequent commercial success relegated electric vehicles to very few niche sectors. Since the late 1990s, the surge in demand for laptops and cell phones (with consumer demand for larger, brighter screens and longer-lasting batteries) has led to research and development of new battery technologies. The electric vehicle market has benefited greatly from the advances made, particularly from research on lithium-based batteries. Hence, studies regarding electric mobility have increased accordingly. Currently, most of the documents regarding electric vehicles are in the engineering area (about 50% of the total), reflecting efforts to advance and improve existing technologies, such as Lee at al. [21] and Venu et al. [22] studies. However, documents regarding electric mobility also cover many other research areas. For example, environmental sciences, where Lave et al. [23], Requia et al. [24], and Batista et al. [25] investigated the implications of electric vehicles on the environment and human health. Or, social sciences, where Tanaka et al. [26] and Nur [27] evaluated the influence of sustainable transport on society and the environment, Sovacool [28] examined the relationship between plug-in hybrid electric vehicles (PHEV) and public health benefits while Formànek and Tahal [29] analyzed the socio-demographic aspects that influence the perception of EVs. But also, economy and business, and in this regard, the impacts of electric vehicles and their additional services on the business models of car manufacturers [30] and on the insurance sector [31] have been studied. And finally, computer science, where Höhne and Tiberius [32] formulated the most likely future scenarios for the use of blockchain technology within the next 5–10 years in the electricity sector, while Zeng et al. [33] have formulated algorithms for the optimization of charging infrastructures on the basis of travel data. The transversality of the research areas is, therefore, a testimony of the growing interest in electric mobility and how it can positively impact different sectors, helping to advance scientific knowledge in a multidisciplinary way. Electric mobility is usually discussed by place or city, and many authors emphasize the importance of government and financial incentives as well as a greater deployment of infrastructure as essential requirements for its full development. For example, Li [34] compares the adoption of electric vehicles (EVs) in Brazil and China, demonstrating how political incentives, including reduction or abolition of car taxes, are important for the growth of electric vehicles. Lazaroiu et al. [35] are of the same opinion and added that electric vehicles will have to achieve near-zero cost parity with combustion vehicles and provide services (such as charging comfort) so that prosumers do not consider them inferior or comparable to combustion vehicles. Other authors, including Bakker and Trip [36], Lieven [37], and Ewert et al. [38], confirm that the promotion of electric mobility is encouraged by investments in charging infrastructures. Rietman et al. [39] studied government measures promoting electric mobility in 20 Countries, concluding that states with high purchasing power have a higher share of the electric vehicle market. Furthermore, the study highlighted the need for collaboration between the public and private sectors in order to promote electric vehicles. Another study was conducted by Cansino et al. [40] in which the authors focused on measures to promote electric mobility within the EU28. According to [40], the most important policy tools for promoting electric vehicles are fiscal and infrastructure measures as well as financial incentives for the purchase and support of research and development projects. Research were then conducted on trends, policies, challenges and opportunities in the electric mobility sector in various Countries: Singapore [41], Germany [42,43], California [44,45], Qatar [46], Italy [47], Norway and Canada [48], Greece [49], Australia [50], France [51], Lithuania [52], Japan and South Korea [53], and Pakistan [54].
2.2. Electric Mobility Worldwide
From a “numerical” point of view, globally, the electric car market has grown significantly over the past four years. Considering both Battery Electric Vehicles (BEV), i.e., cars featuring an electric engine (powered by batteries) and Plug-in Hybrid Electric Vehicles (PHEV), i.e., cars featuring both electric and internal combustion propulsion, the number of electric cars in the world is over 7.5 million, of which more than 2.2 million cars were sold only in 2019. Although this still represents a limited percentage of the total number of cars in circulation globally, the fleet of electric cars on the road grew approximately 20 times between 2013 and 2019, as shown in Figure 1.
Globally, the People’s Republic of China is the largest electric car market. This is confirmed by the fact that in 2018, 45% of electric cars were circulating only here [56]. China also sold around 1.1 million cars in 2019, holding a 50% market share [18]. The United States is far behind, and with 326,640 cars registered in 2019, it held a market share of 15.5%, as shown in Figure 2. It can be seen how the largest market share of electric cars is held by countries with high purchasing power and seems to confirm the study by Rietman et al. [39]. However, a high income may not necessarily be a condition that favors the purchase of an electric vehicle.
In this regard, according to research by Sotnyk et al. [58], in fact, it is shown that in the US, the increase in family income does not positively affect sales of electric cars due to the limited information on the advantages deriving from electric mobility. Thus, income is certainly a condition that can help, but it is not the only variable that affects market share. Sales of electric cars, in fact, also strongly depend on the level of education, on the degree of countries preparation for a certain technology, on cultural factors (for example cars in some countries symbolize social status, they give pleasure to driving and mobility habits are deeply rooted in national cultures), by monetary and political incentives, but also by the choices (and research and development) of national car manufacturers. For example, China’s leadership could stem from the fact that e-mobility was seen as an opportunity to improve the underwhelming local automotive and to embark on a growth path based on knowledge and innovation as well as considerable experience in the production of lithium-ion batteries for electronic consumer goods. Therefore, the way in which electric mobility spreads and is reflected in sales also strongly depends on local specificities and not only on income.
At the European level, the most “virtuous” country is Norway. With a population of ~5.3 million people, out of a fleet of ~2.6 million vehicles, electric cars are estimated to be ~280,000 by 2019. Furthermore, in the first half of 2020, nearly 50% of all new vehicles registered were fully electric [57]. To encourage electric mobility, Norway has introduced some measures such as direct incentives (the 25% reduction in the value added tax (VAT) on the purchase of an electric vehicle), indirect (free access to parking), and the “Polluter Pays” discourages the purchase of gasoline vehicles by introducing higher annual taxes for the most polluting vehicles. Other European players particularly attentive to electric mobility are the UK (~340,000 electric cars in circulation), Germany (~167,000) [59], which share the adoption of direct purchase incentives (between €4000 and €6000), and Italy.
In the UK, the “Climate Change Act” was approved in 2008 with the aim of reducing GHG emissions by 80% (in comparison to 1990 levels) by 2050, and it is recognized that effective decarbonization of the transport sector will play a large role in achieving this goal [60]. For this reason, the UK is firmly aiming for electrified mobility. In 2016 the UK implemented a strategy for electrification called “Road to Zero” [61]. Through this strategy, which is preparatory to the stop to the sale of diesel cars by 2040 announced by the United Kingdom [62], the government intends to “make the UK the best Country in the world for those who own an electric car and for those who want to produce them“. 1.5 billion pounds have been allocated to incentivize electric vehicles, of which 400 million is intended exclusively to finance the expansion of the charging network. The goal is to bring the market share of electric vehicles to over 50% by 2030. Hence, the government will work alongside industry, business, academia, consumer groups, environmental groups, and international partners to enable synergistic development of electric mobility.
Germany, for the rise of electric mobility, has long recognized the need for collaboration between public and private sector stakeholders to promote electric cars. In this regard, the National Electric Mobility Platform (Nationale Plattform Elektromobilität) [63] was established in 2010, an advisory council of the German federal government composed of the highest representatives of industry, politics, science, associations, and trade unions. Recently, the German government coalition, as part of a package of measures worth 130 billion aimed at supporting the economy hard hit by the effects of the COVID-19 pandemic, agreed on a plan for the automotive sector with the aim of facilitating the growth in demand for electric vehicles. This plan should include more than 2.5 billion euros of public funds entirely dedicated to incentives (which will be extended until 2025) for the expansion of the charging network and to produce batteries. Besides government support, Germany, being one of the largest car manufacturers [64], is heavily dependent on the automotive and therefore the spread of electric cars is also supported by the choices of car manufacturers, including BMW, Audi, Volkswagen, and Mercedes, which in recent years have become more active in promoting electric vehicles [65] and all have plans to move further towards electric mobility [66]. In Italy, in the first nine months of 2020, although the global automotive was hit by the effects of COVID-19, registrations of electric cars continued to grow strongly. The data concerning Italian electric mobility are collected by Motus-E, a consortium founded by six partners (Ald Automotive Italia, Abb, National Collection and Recycling Consortium, Enel X, Polytechnic of Milan, Volkswagen Group) which were born to develop electric mobility to create a common platform for dialogue between all the players in the supply chain. As for the diffusion of electric vehicles in Italy, the car fleet (September 2020) is made up of about 70,000 vehicles (0.18% of the total) [59,67]. There was an important increase between September 2019 and September 2020; despite the global pandemic, which caused a global crisis and a drop in consumption, within 12 months, there has been an increase in registrations of electric cars by 156%, as shown in Figure 3.
This increase is mainly due to two factors. First, the political measures launched by the Italian government since 2019 has introduced the “Ecobonus”, a measure provides for contributions to the purchase of a maximum of €6000 and an “Ecotax” which is charged to all new registrations whose emissions exceed 160 g/km CO2 [68]. Secondly, the increase in charging infrastructure. As can be seen from Table 1, between September 2019 and September 2020, the total number of charging stations has increased from 3682 to 8467 (+130%) [59], greatly affecting the sale of electric cars, especially in the North of Italy.
However, in Italian regions, both the spread of electric cars and the spatial density of the columns are quite unbalanced, and this greatly influences the regional distribution of cars. In the first nine months of 2020, in fact, 69% of newly registered cars are in the North, where there is the largest share of charging columns (56%), as shown in Table 2. Regarding the charging columns, it is important not only their diffusion but also the power of delivery. Considering the total of charging points, 23% have a power of less than 3.7 kWh, 3% between 3.7–7.4 kWh, 71% between 21–43 kWh, and another 3% between 44–100 kWh [59]. In Italy, the high-power charging points, which ensure faster charging times, are still too few. This could be a further obstacle to the spread of electric mobility in some particularly “frenetic” cities where people cannot waste too much time charging the car, preferring the “speed” of traditional supplies.
3. E-Mobility Strategies Overview of European Smart Cities
3.1. Material and Methods
For a more in-depth understanding of electric mobility in Europe, the policies implemented by six Smart Cities were analyzed. Three SCs from Northern Europe and three Italian SCs were chosen. The cities are Oslo, London, Hamburg, Milan, Florence, and Bologna. The reasons for choosing these six cities are as follows. Oslo and Hamburg were chosen mainly because they are two of the few cities that have adopted an explicit energy strategy document (“The Climate and energy strategy” for Oslo and “Hamburg Climate Plan” for Hamburg). The peculiarity of these documents is that they are binding; that is, they legally commit the two cities to decarbonize and improve the supply of energy from renewable sources. Both strategies place a strong focus on transport and accessibility, urban form, and energy infrastructures, trying to work in a multidisciplinary way to implement a “green change”. London was chosen because it has already made efforts to drive and regulate smart and electric mobility, clearly defining the role they expect them to play in achieving their long-term sustainable transport goals, published in official documents over the past five years. Milan, Florence, and Bologna were chosen as the top three smart cities in the “ICity Rank 2019”, the Italian ranking of the most intelligent cities [69]. The research was conducted through both a systematic review of the e-mobility literature within these six smart cities and through the study of their policy and strategic documents. The literature review was conducted through the choice of seven keywords: electric, electric mobility, electric vehicles, vehicles, transport, smart city, and smart. Then, we used Scopus, Google Scholar, and Web of Science, and in the search string, these words were individually associated with each of the six cities. Literature was selected based on some inclusion criteria:
- ▪
- Publication status: In press and final
- ▪
- Only peer-reviewed items
- ▪
- Type of publication: Conference Paper, Article, Review, Book Chapter. The following were excluded: Editorial, Note, Book Short Survey, Letter, Erratum, Data Paper, Undefined.
- ▪
- Language: Publications written only in English.
- ▪
- Year: 2010 onwards
- ▪
- Documents that are only relevant to the search string.
A total of 4723 studies were evaluated, and 40 articles that met the inclusion criteria were selected. Only the articles dealing exclusively with the policies implemented by the local administrations of the cities regarding electric mobility in the last ten years (2010–2020) were considered. Policy documents, information, and data on policies to boost electric mobility were retrieved from secondary sources such as local authority websites. Finally, to determine the effectiveness or ineffectiveness of the various policies, it was assessed whether there had been an improvement in air quality for cities by monitoring indicator 11.6.2 (Annual mean levels of PM2.5, PM10, and NO2 in cities) in the last four years (2016–2019).
3.1.1. Oslo
Oslo (680,000 inhabitants and a density of 15 inhabitants/ha) over time has made significant progress towards environmental sustainability and energy efficiency. First, it is one of the few cities that, in 2016, published an explicit energy strategy document (The Climate and Energy Strategy) [70,71]. This strategy, compliant with the Paris agreement and in line with the “National Transport Plan” (2017) [72], provides the transition to an energy system powered entirely by renewable sources. The goal is to reduce greenhouse gas emissions (compared to 1991 values) by 50% by 2020, by 95% by 2030, and to zero them in 2050 [73,74]. In this regard, zero-emissions or “carbon neutrality” means the achievement of an equilibrium between emissions and carbon absorption, or the situation in which the balance of emissions released into the atmosphere is less than or equal to zero. To reduce emissions and achieve carbon neutrality, one could offset emissions in one sector by reducing them in another or simply eliminate carbon dioxide emissions altogether by investing in renewable energy, energy efficiency, or other clean technologies. Therefore, it will be necessary to create a more efficient energy supply system through an approach based both on increasing the supply of renewable energy and on the simultaneous reduction of energy demand [73]. A coherent economic policy should moreover be based on improving net energy efficiency, i.e., the energy that remains for the rest of society after spending the energy necessary to extract, refine, and deliver it. This would produce an increase in “Energy Return on Investment (EROI)” (the energy we get from a particular “investment” of a unit of energy). The higher the EROI of an energy source, the cheaper it will be both in energy and financial terms, and more energy will remain for the rest of society to use. This efficiency improvement affects all sectors, including transport. In this regard, Oslo, as a member of the C40 Cities, to reduce dependence on fuels, has decided to implement some strategies. First, starting from 2004, “Vulkan” was built, a new district was born following the transformation and revitalization of a former industrial area of 1.6 hectares west of the Akerselva river. This area, a true example of sustainable urban development, responds to the desire to create a highly energy-efficient district and is based on the idea of sharing land and resources. Inside it has a car park that can currently accommodate 102 electric vehicles, with as many columns, and it is the largest charging station in Europe [75]. Then, between 2008 and 2011, more than 400 charging points on the road (100 charging points per year) were installed in Oslo [76]. In four years, both accessibilities to charging stations on the road (in residential and commercial areas) and the popularity of electric vehicles have increased. Within a decade then, there is the will to ensure the trams and buses that will circulate will only be electric (and in this regard, an increase in the charging power of the stations is planned, thanks to which they could be recharged in eight minutes while they are stops at the terminus). Finally, in a broader framework of improving environmental sustainability, in 2016, Oslo made the decision to ban cars (of any kind) in the city center by 2019, when the decision came into force [77]. Oslo’s plans also include the implementation of a pedestrian zone within the city’s central ring road, along with other complementary proposals, such as the introduction of new cycle paths, traffic pricing at peak times, and parking restrictions [78]. Thanks to its forward-looking policies on electric mobility and more generally on environmental sustainability, in 2018, Oslo was named the world capital of electric cars by the International Council on Clean Transportation (a US non-profit organization that provides technical-scientific analysis to environmental regulatory authorities), while in 2019, was nominated as the “European Green Capital” an award given each year by the European Commission to a city in Europe that has managed to distinguish itself particularly in the field of environmental protection and economic development sustainable. These policies, however, fall within a broad framework of precise strategies pursued at a national level aimed at favoring the least polluting vehicles and penalizing the most polluting ones. These strategies have been implemented since the 1990s. In particular, the most important are the possibility of not paying road tolls (1996), the exemption from paying VAT (2001) and the registration tax (2003), access to preferential lanes, and the possibility of parking for free throughout the municipality (2004) [79,80,81]. These incentives obviously correspond to a considerable saving, so much to discourage Norwegians from using petrol or diesel cars, inducing them to buy electric vehicles. In addition, it is important to underline that a great help is given by electricity prices in Norway, which are the cheapest in Europe especially thanks to the abundant hydroelectric resources at its disposal, resources that in 2015 contributed 96% to the electricity of the whole Country [82]. Oslo aims to implement a safe transport system, which promotes economic growth and helps the transition to a low-emission society, and its horizons include the desire to ensure that newly registered vehicles (cars, commercial vans, and buses) are exclusively zero-emission by 2025, with the idea of completely banning the presence of motor vehicles within the same year. Thanks to forward-looking, ambitious, and favorable policies, both Oslo and Norway have currently achieved important results in terms of sales. Norway is the country with the highest percentage of BEVs compared to the total number of cars on the road; at the end of 2018, it had around 190,000 battery electric vehicles (BEVs) and 90,000 plug-in hybrids (PHEVs) on its roads. In 2018, the market share of all new private cars was 31% BEV and 17% PHEV, respectively [73]. Oslo, on the other hand, has the highest market share: in 2018, the share of BEVs in the car fleet was 13%.
3.1.2. London
In London (8.9 million inhabitants with a density of 57 inhabitants/ha), due to the large number of people, the transport system faces high pressures: during peak hours, public transport operates almost at capacity traffic congestion often corresponds to stationary traffic hours, with repercussions on both people and the environment [83]. In this regard, it is estimated every year in London, the number of deaths caused by NOX and PM2.5 is on average about 9400 people [84]. In addition, according to data from Transport for London (TFL), the company responsible for public transport in Greater London, in 2017 the transport sector contributed 54% of the city’s total particulate matter [85]. According to the Greater London Authority (GLA), the public body composed of the mayor and the 25 members of the City Assembly and which administers London, the capital of the United Kingdom, will be destined to become a megalopolis will host 9.84 million people by 2031 and 10.11 million by 2036 [86,87]. As a result, the increase in population will be accompanied by an increase in the number of cars, and thus by an increase in emissions. In order to avoid a further increase in mobility, the British capital administration is seeking to implement a series of commitments aimed at the decarbonization of transport, trying to convert the car fleets so that they are as clean and efficient as possible. Since his election (2008), the former mayor of London, Boris Johnson, has given a high priority to stimulating the electric vehicle market, to pave the way for their mass commercialization. Between 2009 and 2014, the mayor was involved in some initiatives. First, he launched the “New Bus for London” competition, which gave the winner the opportunity to design a new high-efficiency bus that would be part of the city fleet [88]. In 2011, he launched “Source London”, the first network of recharging points in the city, thanks to the collaboration between a consortium of public and private operators [88]. This network, 50% funded by the Department of Transportation, initially provided 150 charging points across the capital with plans to expand coverage to 1300 charging points by 2013. As of 2019, over 1000 charging points were available, with plans to install an additional 2000 by the end of 2020 [89]. Then in 2013, Boris Johnson supported the “Green Bus Fund”, a loan from the British government which in total made 87 million pounds available for the purchase of 1200 new low-emission buses in England, purchasing only 350 in London [88]. Through electric buses, there is the possibility to cut CO2 emissions by 13% compared to combustion buses [90]. However, these initiatives implemented by successive administrations were not enough to reduce polluting emissions, and unfortunately, the crisis still prevails. In 2018, the number of private cars in the capital had reached about 2.7 million vehicles [91], and currently, London’s air quality is still considered the worst among European cities [92]. The UK has been threatened with sanctions if it fails to reduce air pollution emissions by 2050 in some cities [93], which is why it is already considering banning diesel vehicles by 2040 [94]. Therefore, with the forecasts of an increase in population and urbanization, new transport policies that are even more effective and compliant with the challenges that London will have to face will be required so that the system can sustainably meet the new needs the city will have to meet. Due to the air pollution situation, the current Mayor of London, Sadiq Khan, in May 2018 published the “London Environmental Strategy (LES)”, a document whose goal is to make London a zero-carbon city by 2050 [95].
The section on climate change can be summarized in three sub-objectives: (i) reduce emissions in homes and workplaces, (ii) develop energy generation systems that are clean and smart, based on local and renewable sources, and (iii) develop a zero-emission transport network. Regarding the latter objective, the LES, in the section dedicated to mobility, aims to eliminate the emissions of the Greater London Authority’s car fleet by 2025, those of bus fleets by 2037, those of most public transport by 2040, those of all means of transport by 2050, becoming a zero-carbon city [96,97]. London also aims to be the European capital of “Ultra-Low Emission Vehicles (ULEVs)”. UK government defines ULEVs as vehicles (cars or vans) with tailpipe carbon dioxide emissions of 75 g/km or less. It means that only hybrid or fully electric vehicles can meet this standard. Consequently, London administration in April 2019 gave way to the “Ultra Low Emission Zone (ULEZ)”. This is a charging system has partially replaced the “London Congestion Charge (LCC)”, a tariff introduced in February 2003 charged on most cars and motor vehicles driven within the “Congestion Charge Zone (CCZ)” which coincides with the center of London (21 km2) [97,98,99,100]. ULEZ covers the same area, but instead of being valid between 07.00 and 22.00 as the LCC, it applies 24/7. All vehicles must meet ULEZ emissions standards, or their drivers must pay a daily fee (£12.50 for all vehicles <3.5 t, £100 for vehicles >3.5 t, including trucks, buses, and coaches). Since its introduction, between July and September 2019, it resulted in a −29% reduction in total emissions compared to the period in which the ULEZ was not active [101]. From 2021 it will be expanded to cover the entire inner-city area up to, but not including North Circular Road (A406) and South Circular Road (A205) for a total of 319 km2, affecting 3.5 million inhabitants. ULEZ joins London’s “Low Emission Bus Zone”, created in 2016. These are areas in which only buses with engines that meet the highest Euro six emission standards can circulate. Priority was given to areas where the control units reported the worst air quality outside of central London and where buses contribute significantly to road transport emissions. To drive the deployment of ULEVs by the end of 2020, the UK government is offering grants through a program called the “Office of Low Emission Vehicles (OLEV)”, thanks to which London has received £13 million in funding with the aim of installing 1000 charging points in all districts of the city [96].
3.1.3. Hamburg
In Hamburg (1.8 million inhabitants with a density of 24 inhabitants/ha) it is expected within 10–15 years there will be a 5% increase in its population (reaching 1.9 million people), with a consequence that its mobility needs and the volume of its vehicular traffic will also increase [102]. Overall, Hamburg has an integrated and participatory planning strategy coupled with a strong commitment to a sustainability vision. As a great European metropolis, in fact, Hamburg, over time, has wanted to send strong signals to show how cities can have effective strategies and measures for climate protection and adaptation. For decades, Hamburg has been pursuing progressive policies aimed at environmental issues, which is why, in 2011, it was recognized by the European Commission as the European Green Capital [102]. To facilitate the transition to a more sustainable and environmentally friendly mobility system, Hamburg’s transport sector has undergone substantial changes over time. In detail, Hamburg has a strong commitment to advance electric mobility, both public and private. First, starting from 2013, the city launched the “eco-taxi” project, which provides for environmental labeling for taxis, i.e., the possibility of using the slogan “Hamburg Eco-Taxi” and the “European Green Capital” logo [102]. Then, in 2014, it was established that all public offices in the city should only purchase electric vehicles [103]. Between 2014 and 2015, the Hamburg Senate also issued two important action plans. The first is the “Master Plan of Public Charging Infrastructure” (2014) [104], which provides for the expansion of publicly accessible charging infrastructures (of which more than 1000 are available by 2020). The second, issued in 2015 and updated in 2019, is the “Hamburg Climate Plan” [105] and includes a series of measures for the restructuring and decarbonization of the city’s activities. In detail, this climate plan describes the activities most responsible for emissions, and from this, it emerges that the transport sector is the one in which it is necessary to adopt the most urgent measures in the coming years. The goal of the city will be to reduce CO2 emissions from 1990 levels by 55% by 2030 and to reset them by 2050 so that Hamburg can become climate neutral [105]. The main areas concern the increase of environmentally friendly transport systems, the systematic correlation between renewable energy and transport engineering, and the increase in the percentage of low-emission cars on the roads compared to the total of all new vehicles. registration: 10% by 2020 and 30% by 2030 [103]. A key factor within the Hamburg Senate action plan is to consider the ecological aspect when replacing vehicles, both public and private. In this regard, the plan sets the goal of increasing, by the end of 2020, the share of private and public electric vehicles to 50%, and the number of commercial vehicles from 17% to 20% [103]. Thanks to the progress made by Hamburg in terms of sustainable mobility, in 2016, the city obtained, together with Helsinki and Nantes, the status of “lighthouse city” by the EU within the framework of the mySMARTLife project [106]. Lighthouse cities are characterized by using various intelligent solutions that aim to reduce CO2 emissions, promoting the use of sustainable energy to improve their citizens’ life quality. In Hamburg, the demonstration area of the project is located in Bergedorf, a district of about 130,000 inhabitants, and the interventions include four sectors, including the promotion of electric mobility through the purchase of electric vehicles (buses, cars, and bicycles) and the extension of the charging network [106]. Currently, the main measures to encourage electric mobility in Hamburg concern an incentive of up to €9000, the possibility of free parking within the city, and exemption from vehicle tax for ten years [105]. The focus on sustainable mobility has finally converged in the “Hamburg Climate Protection Act” [107], a law promulgated in February 2020, which recognizes the limitation of global warming as a national goal in the constitution of the state of Hamburg. Following this, as a framework for action to achieve this goal, it initiated an “electrification” of its bus fleets. In this regard, the two public transport companies of the city, Hamburger Hochbahn AG and Verkehrsbetriebe Hamburg–Holstein have already started to electrify their fleets and build the necessary charging infrastructure (the intention will be to replace 1500 buses and build eight depots by 2030) [108,109]. This is further facilitated by the fact Hamburg is structurally an industrial city that is home to many battery and electric vehicle manufacturers [110,111]. A further step forward for the development of electric mobility within the city will be to strengthen cooperation between all stakeholders (public and private). Therefore, about the city of Hamburg, the necessary measures should not only include the improvement of the charging infrastructure and incentive measures for the conversion or switch to electrically powered vehicles, but also, for example, the creation of strategic partnerships. This context includes the agreement between the Volkswagen Group and the city of Hamburg through which the parties intend to shape sustainable urban mobility by working towards the use of electric vehicles (cars and buses). As part of this partnership, the German car manufacturer has delivered to 50 citizens, entrepreneurs, and employees as many electric cars, the use of which is supported by the Federal Ministry for Transport and Digital Infrastructure, as part of the e-Drive Hamburg program. 2018. The aim will be to make them travel about 1.5 million km to demonstrate that sustainable urban mobility is possible. Thanks to the interventions implemented over the years, the CO2 emissions of the city of Hamburg (which in 1990 were about 20.7 million tons) have progressively decreased since 2012, with an annual average of over −400,000 tons of CO2.
3.1.4. Milan
Within a working day, the metropolitan area of Milan (which has 3.2 million inhabitants, 20 inhabitants/ha) is affected by 7.5 million trips (80% by inhabitants, 20% by external people, for a total of 3.8 million people), consuming a total of 719 toe/a for transport, with a preponderant share of fossil fuels (647 toe/a) and lower consumption of electricity (71 toe/a) [14]. Milan is currently the Italian city with the largest number of charging stations, and according to a study by the Dutch company LeasePlan [112], it is also the city in which most (about 25%) of the Country’s total electric vehicles circulate. These numbers are not accidental, but they are part of a broad rethinking framework of its mobility the city has been carrying out for years. In fact, according to Legambiente, Milan is one of the most polluted cities in Italy (also due to its position within the Po Valley, which due to its geographic location, is subject to the accumulation of fine dust) [113] and it is trying to develop sustainable strategies to reverse this trend. In this regard, to plan an energy-efficient, effective, and environmentally friendly urban mobility, the incentive of electric mobility is one of them. As can be read in its “Urban Plan for Sustainable Mobility (PUMS)” [114], a strategic plan with a short, medium and long-term time horizon, which develops a vision of the mobility system, first of all, as regards private transport, the first intervention was to provide for the strengthening of the number of electricity columns in the city. In addition, the Municipality has issued a detailed guideline to allow, at very favorable economic conditions, the installation of charging infrastructures within public areas [115]. Secondly, electric cars are exempt from paying the vehicle tax for five years [116]. There were also incentives for the purchase of electric cars (July 2020), up to €1800 for the purchase of electric scooters, €1500 for the purchase of electric bicycles or pedal-assisted bicycles, €9600 for electric cars, and €6000 for hybrid cars [116]. But the most useful measure for electric mobility implemented to limit private traffic in the historic center and the air quality in the city was to insert a congestion charge (similar to the London one and existing in a few European smart cities) to be paid within an area called “Area C” [117,118,119,120,121]. This area extends for about 10 km2, and within it, the circulation of Euro zero petrol vehicles and pre-Euro four diesel vehicles is prohibited, while a tariff of €5 per day is applied for diesel and petrol vehicles from €4 to €6. Electric vehicles are exempt from the daily rate for access to Area C, and in addition, they can park and park for free in the paid parking areas within it and throughout the city [115]. The limitations provided for Area C have been able to reduce the negative externalities generated by traffic, such as accidents, congestion, and emissions [118]. The intention will be to transform this area into a “Zero Emission Zone”, in which to allow circulation only to zero-emission vehicles [122]. For this condition to be met, access will be allowed only to electric vehicles.
About public transport, as can be read from the urban sustainable mobility plan, an important investment plan will be developed in the coming years to dispose of the 1335 diesel buses and completely replace them with 1200 “full electric” buses. In this way, it is possible to avoid the current consumption of 30 million liters of diesel per year [114]. In addition, the various depots of the old diesel buses will be transformed into new, fully electric hubs. This plan provides for the desire to reach 2028 with the fleet of rubber, which will be 80% full electric and 20% hybrid [114]. The goal will be to get to 2030 and ensure that the road fleet is 100% fully electric. In this regard, Brenna et al. [18] compare the energy consumption of two buses that run on two routes within the city of Milan; one electric battery (e-bus) and one diesel, showing that it is possible to obtain significant advantages in terms of harmful emissions avoided. By using an e-bus instead of a Euro five diesel, a potential CO2 saving of 524 g per kilometer traveled can be achieved. Thanks to the massive installation of high-power charging stations in Milan, the e-bus, if recharged at each terminus, allows the charging time to be halved, meaning that the e-bus only should remain stationary for about nine minutes. Ferrero et al. [123] evaluated the effect of EV scenarios on air quality in Milan, showing that replacing 50% of combustion vehicles with electric vehicles would reduce tailpipe emissions of NO2 and NOx, respectively, by 5.5% and 14.1%. The investments and policies for electric mobility are added to the development, and urban regeneration policies of the city of Milan launched starting from Expo 2015. The Lombard city is gradually becoming a virtuous and avant-garde, yet sustainable metropolis. This is evidenced by the ICity Rank 2019, which certifies it, for the sixth consecutive year, as the smartest city in Italy [69]. Thanks to its sustainable development strategies, over time, Milan has managed to become attractive and competitive, managing to create an ecosystem characterized by good economic performance: between 2014 and 2018, in fact, the Gross Domestic Product (GDP) grew by +9.7% [124]. This contributes to the creation of additional wealth, to attract more investment, as well as capital and workers, causing their reputation to grow more and more.
3.1.5. Florence
In recent years, Florence (380,000 inhabitants with a density of 37 inhabitants/ha) has made significant progress towards the implementation of an electric mobility development model, forming part of a wider framework for the decarbonization of its long-term vehicular traffic. Specifically, the municipal administration has been carrying out several initiatives for years in order to transfer to electricity a significant share of travel, to manage the vehicular traffic of a metropolitan area that counts about 1 million people (2.9 inhabitants/ha). First, those who own an electric vehicle (in 2019 the fleet circulating in Florence was about 1700 vehicles) can freely access all five restricted traffic areas of the city, i.e., sectors A (the heart of the historic center), B, O, F and G. No concessions are provided for hybrid cars [125]. As for parking in paid spaces, the municipal administration has developed a series of concessions for both electric and hybrid cars. For residents who own one of these two types of cars, there is the possibility of free parking in the “Controlled parking areas”, while non-residents can take advantage of a 50% discount on all parking rates. As in Milan, also in Florence, there are exemptions from the car tax for electric or zero impact vehicles: residents in Tuscany who own an exclusively electric car are excluded from paying the stamp duty for the five years following the first date. matriculation. At the end of this period, an annual fee equal to a quarter of the amount provided for the corresponding petrol vehicles must be paid. Also, in this case, this exemption is valid only for electric vehicles, not for hybrid ones [125]. The municipality of Florence has also modernized and increased the recharging infrastructure (to date, about 110 points, for a total availability of about 450 sockets) [126,127]. The new columns can recharge at 3.3 kWh (Slow) or 22 kWh (Quick) and allow the charging of new generation cars in about an hour. To access the columns, it is necessary to have a smart card that the Municipality issues to citizens who own electric vehicles after registering to access the service. Thanks to the interoperability characteristics of the charging infrastructure, users can choose on the market the commercial supplier from which to purchase energy, possibly in connection with their home users. On a special app, it is possible to view the map in real-time with the location of the columns and their status (available, in use, under maintenance, and booked), the type of socket of each column, and the consumption on each individual charging station. The charging stations of the Municipality supply approximately 60,000 recharges each year, for approximately 200,000 kWh of electricity. It is estimated that with this amount of energy, an electric scooter can travel more than 5 million km, with an estimated reduction of CO2 emissions compared to those of a traditional scooter of 200 tons per year [128]. The optimal size of charging stations to be installed in Florence was estimated by Talluri et al. [129]; on average, between 11 and 135 columns must be installed annually by 2030 (for an average annual cost of €25,400–€373,800). The decision to move towards sustainable mobility then led to the replacement, starting in 2014, of part of the Florentine public transport fleet with electric vehicles (about 60% of the fleet is currently electric) [127]. In 2015, the city took part in European calls concerning electric transport, winning two: “Electric City Transport (Electra)” and “Dorothy”. The first, winner of the “Green Pride for sustainable mobility”, had the objective of increasing the use of electric scooters in the city center. Within this project have been signed 22 protocols of intent between public and private bodies to spread the culture of sustainable mobility. The second had the objective of enhancing innovation and research in the urban environment in some European regions, including Tuscany [127]. In October 2015, the Municipality of Florence introduced a sharing system of 200 electric quadricycles. Then three other operators entered the market for a total of about 600 shared vehicles, 35% of which are electric [130]. In addition, in 2016, the City Council approved the granting of 100 new taxi licenses, of which 70% for fully electric vehicles (e-Taxis) [127]. Specifically, the administration launched a tender through which it selected 70 subjects who were granted a license only in exchange for the obligation to use only electric vehicles [130]. The diffusion of e-Taxis has the effect of contributing to improving urban quality and the overall sustainability of transport, but also of increasing the knowledge and acceptance of electric vehicles by citizens, a relevant aspect in Countries such as Italy, where the percentage of electric vehicle users is still low. As of February 2019, Florence comprises 724 taxis, 71 of which are electric cars [130]. Electric mobility is also widely encouraged by the University of Florence, which in recent years has defined some clear and well-structured strategies for implementing sustainable practices within the institution, being particularly attentive to the issue of environmental sustainability [131]. In this regard, it has implemented a project called “Mondo-Bike”, which is based on the transformation of any bicycle into an electric one, thanks to a special kit that can be shared with other users. Finally, a great opportunity to encourage electric mobility will be given by the “Lighthouse Renaissance of Places with Innovative Citizenship and Technology (REPLICATE)” project, launched in 2018 and to which Florence is a member [127]. The project foresees an investment of over 11 million euros, of which over 7 and a half million from the EU and almost 4 million from the seven project partners.
The planned interventions involve the areas of Novoli, Cascine, and Piagge and are of three types: energy efficiency, innovation and integrated infrastructures, and sustainable mobility. Regarding the latter, Florence intends to exploit these funds to progress even further in the implementation of electric mobility, expanding the charging network, installing about 180 super-fast charging stations, increasing the number of electric taxis in circulation, and integrating information and communication technology (ICT) tools and the infrastructure of the city [127]. The promotion of the method of sharing and the transition to electric vehicles will continue until 2050, where within the PUMS, it is written that Florence aspires to become the national capital of electric and sustainable mobility.
3.1.6. Bologna
Bologna has a population of about 390,700 inhabitants (27 inhabitants/ha), while its metropolitan area has about 1.02 million people (2.7 inhabitants/ha). According to Scopus, the literature on electric mobility is virtually non-existent, so two official sources have been consulted: the site of the Municipality of Bologna [132] and its Urban Plan of Sustainable Mobility [133], the latter approved definitively in November 2019.
PUMS shows its medium-term objective will be to reduce total CO2 emissions from the transport sector of −40% by 2030 compared to 1990 levels (28% from the reduction of vehicular traffic, 12% from the renewal of the fleet), as proposed by the European Union to ensure compliance with the Paris Agreements [133]. This means that about 440,000 car journeys (out of a total of 2.7 million journeys on average that take place every day in the metropolitan area) will have to be transformed into journeys made on sustainable means, especially by public transport, bicycle, electric mobility [133]. To achieve these results, a plan was based on a highly integrated approach between urban planning policies and territorial choices, upgrading of mobility services and infrastructures, tariff policies, and incentives/disincentives for mobility behaviors, as well as the connection of all access nodes (high-speed train station, airport, motorway exits) with the entire metropolitan area. Bologna, as early as 2015, with the aim of contributing to the improvement of energy efficiency, in particular in the transport of goods within urban centers, has collaborated with four other Mediterranean cities (Barcelona, Piraeus, Rijeka, and Valencia) taking part in the project “Smart green Innovative urban Logistics Models for Energy efficient Mediterranean cities (SMILE 2015)”. The aim was to improve the energy efficiency of Mediterranean cities through the promotion of innovative “green” and affordable solutions for the logistics of urban goods [134]. Regarding electric mobility, PUMS declares some objectives to be pursued by 2030. First, within Bologna, there is an extensive central Limited Traffic Zone, to which are added the so-called “T Zone”, “University Zone” and “San Francesco area”. Currently, within these areas, there are active restrictions on the circulation of cars at different times and days. Those who have an electric car can circulate freely within all areas and can also park for free in the areas subject to tariffs. From 1 January 2020, even more restrictive limitations have come into force: the “Environmental LTZ” has been implemented, which in the coming years will gradually exclude less ecological vehicles (liquefied petroleum gas (LPG), diesel, and petrol): From 2020, euro zero vehicles are excluded. From 2022 the Euro 2 will be excluded; from 2023, the Euro three will be excluded; from 2024, the Euro four; from 2025, the Euro five. For the LTZ of Bologna, the 2030 objective is even more ambitious; to allow internal mobility only for electric and zero-emission vehicles [132]. In addition, it is expected that starting from 2020, the new buses in Bologna will be electric, with the increase of charging points and further procedural and tax concessions for their installation. By 2030, both the fleet of vehicles of the public administration and that of public transport (Metrobus, urban and suburban buses, public bodies, taxis, and chauffeurs) will be renewed, and the will is to replace them entirely with hybrid and electric vehicles. There is also 60% of electricity for new calls regarding Sharing Mobility. Finally, at a territorial level, as for Lombardy and Tuscany, Emilia-Romagna also gives the possibility to owners of electric and hybrid cars not to pay the car tax.
4. Results and Discussion
The six cities have shown commitment and ability to implement, not isolated proposals for sharing, but far-sighted and well-structured interventions and policies. They adopted innovative and realistic strategies, calibrated over a medium-long term horizon (2030 or 2050) (Table 3).
All six strategies are in line with the Paris Agreement and Sustainable Development Goals three, seven, nine, 11, and 13, and recognize the need for a cleaner and more efficient energy system, pursuing the same goal, that is to reduce greenhouse gas emissions by promoting the use and diffusion of zero-emission vehicles. Each city does this by managing the demand for transport through different strategies and with success. London has the ambition of becoming the European capital of ultra-low-emission vehicles to meet its annual growth rate in vehicular traffic. Between 2016 and 2019, through the analysis of the indicator 11.6.2, it is noted that the levels of PM2.5 and PM10 have decreased, respectively, by 9% (Figure 4) and 11% (Figure 5) (although the presence of PM in the air is very dependent on meteorological variability) [135], remaining, in the case of PM2.5, is still above the limit established by the WHO (10 µg/m3). The PM10 limits, on the other hand, have fallen to the annual WHO limit (20 µg/m3). The greatest progress has been made in reducing the average annual NO2 concentrations by 21% (Figure 6), reaching a level close to the limit established by the WHO (that is 40 µg/m3) [135]. The greatest NO2 reductions were recorded in Putney High Street (−50%) and Oxford street (−40%), two of the areas covered by the Low Emission Zones (Low Emission Bus Zone and ULEZ).
In British law, the average annual limit values of PM2.5 and PM10 are the same as in Europe (25 µg/m3 for PM2.5 and 40 µg/m3 for PM10). However, the Mayor of London believes that these limits are not enough for the protection of human health, which is the reason why the limits of the guidelines of the WHO are considered in the capital. The NO2 and PM reductions testify how the measures introduced by the mayor and TFL are starting to bear fruit, even if high levels of pollution continue to be recorded in many areas of the city. This confirms that the choice to expand the ULEZ is particularly right. The creation of ultra-low emission zones can lead to a reduction in car travel, implying an increase in demand for public transport and other sustainable mobility systems. London could therefore exploit this to enhance electric car sharing, bike sharing, the use of bicycles and thus adapt the city to the needs of modern mobility, structuring it not only for the present but also for the future.
In Hamburg, electrification goes through the total renewal of public transport fleets (taxis and buses). These measures are paying off. From the analysis of indicators 11.6.2, it could be seen that the air quality is overall good, with the levels of PM2.5 (Figure 4) and PM10 (Figure 5) well below the limits allowed by the EU, less stringent than those of the WHO, to which however the city of Hamburg is approaching [136].
NO2 levels, although declining, remain high (Figure 6) but are strongly influenced by the intensive industrial production in the city center and the central location of the port. For this reason, it will be good to consider the total emissions. The initial Senate goal was to reduce emissions to 9 t of CO2 per capita by 2020, and this goal was already achieved in 2017 when emissions were reduced by 20.8% (around 16.4 million tons) [105]. The goal by 2030 will be to reduce them to 9.3 million tons, with a further cut of about 7 million tons. With the current measures, it is highly likely that the city will be able to surpass the targets set for 2030. As a modern metropolis and a large industrial headquarters in Germany, Hamburg is therefore making an important contribution to complying with the Paris climate agreement and with the SDGs. The electrification of taxis and buses could be a starting point for further action. As already discussed by Schatzinger et al. [102], electric vehicles at least partially replace conventional taxis, thus satisfying the growing demand for mobility. The accelerated growth of the electric vehicle market in Hamburg could help improve the economic situation of the city’s taxi industry, as well as the general use of this form of public transport if they are competitively priced. This could have knock-on effects on Hamburg’s overall urban situation, as increased use of taxis could reduce parking spaces, convert parking areas into cycle lanes or pedestrian areas, and create environmental zones.
Oslo wants to facilitate the transition to electric and sustainable mobility through concrete legislative and fiscal measures (supported by clear political choices by Norway) as well as through the progressive ban on motor vehicles. The policies implemented by Oslo over time are proving very effective. According to “Oslo’s Climate budget” [137] and the Municipality of Oslo [138], the monitoring of indicator 11.6.2 shows that, starting from 2016, PM2.5 emissions decreased by 22% (Figure 4), those of NO2 by 22% (Figure 6). Data relating to the difference in PM10 over the years are not fully reliable in the database as the control units were out of service in some areas of the city and therefore cannot be directly compared with the other points. However, in 2019 the annual average of PM10 was 10.58 µg/m3, well below the cut-off value. These data testify how the air quality has slowly improved over time (and therefore highlights the effectiveness of the measures implemented), always remaining below the threshold values recommended by the WHO. Furthermore, since one of Oslo’s future objectives will be to ban cars of all types in the historic center, this choice could turn into a further opportunity, since taking cars away from urban centers could have the possibility of transforming large areas of the city is completely pedestrian, and therefore increasing the average percentage of the urbanized area of cities that is used as public space. The increase in pedestrian traffic can, in turn, lead to savings in the use of energy and can encourage investments in cycle paths, reduction of carriageways, and an increase in sidewalks.
In Florence and Milan, the first faint results of the measures implemented are beginning to be seen, and their strategies should be the driving force so that they are also replicated in other cities with different characteristics, especially in Italy, where air pollution levels from particulates remain high and above the EU average (especially in the cities of the Po Valley) [139] and therefore, could hinder the achievement of indicators 3, 7, 8, 9, 11, 13.
In Milan, in 2019, the average annual concentration of PM2.5 and PM10 stood at the limits of the threshold values (which in Italy are 25 µg/m3 for PM2.5 and 40 µg/m3 for PM10) [140] with of 21 µg/m3 for PM2.5 (Figure 4) and 35 µg/m3 for PM10 (Figure 5) a decrease compared to the previous years (−25% for PM2.5 and −52% for PM10) but still far from the WHO limits. The NO2 values are 58 µg/m3 (Figure 6) are still widely above the permitted limits (40 µg/m3), although the downward trend (−13%). It follows the measures applied have been effective, although further measures will be required, in addition to those already implemented by the municipal administration. For example, Milan could transform Area C into a residential area with 20 km/h limits and priority for pedestrians and cyclists. Or it could devote resources to communication so that the benefits of sustainable mobility can be understood by all. Or, following the example of what was done in Hamburg, involve private partners. However, it will be interesting to understand how effective the measures already foreseen by the PUMS will be in the coming years.
In Florence, between 2015 and 2019, the levels of PM2.5, PM10, and NO2 decreased respectively by 25% (Figure 4), by 25% (Figure 5), and by 16% (Figure 6) [139,141]. The average annual concentrations of the three pollutants have always remained well below the legal values, and in the case of PM, it is slowly settling towards the levels established by the WHO. This shows that the measures put in place are working. As already discussed in Section 3.1.5, Florence has the ambition to become the European capital of electric mobility. In addition to the massive installation of columns and licenses for electric-only taxis, the decision to move towards electric mobility also led to the replacement in 2015 of part of the Municipality’s fleet with electric vehicles. As suggested by Parenti et al. [127], watching municipal employees driving green and electric cars is the best advertisement to promote new mobility. All this, in addition to the improvement of the urban aspect and a lower impact on the city, should be exploited by Florence to create its own positive reputation as an “electric city”. In turn, this could convince citizens to adopt sustainable mobility models, supported by good practices promoted at the academic level [131], almost making those who do not feel “guilty” and could cause Florence to be involved in European tenders, leading in the long term, further benefits in terms of improving the well-being and quality of life of the city.
In Bologna, as the measurements are recent, it will be necessary to wait for future data to see the results. However, in the future, the city could take advantage of the existing restrictions on car circulation in downtown areas to rethink the entire historic center for low-emission cars, following the example of London. In the long run, it could follow Oslo’s example and transform all or part of the center into a large pedestrian zone.
In general, the policies implemented by the cities are working, and this is evidenced by that air quality has improved everywhere, with reductions in pollutants in all cities for which data are available (Table 4).
Despite this, the atmospheric environment is also influenced by other factors (the spatial variability of the air pollutants concentration is very strong due to the complex air flows due to buildings or other obstacles. In addition, the movements of pedestrians may sometimes calculate reliable estimates of the concentration of pollutants to which people are exposed) so improving air pollution is a very long and demanding process.
Moreover, some aspects need to be emphasized. Firstly, the measures proposed by the six cities considered are strongly correlated and parameterized to their local conditions, such as size, morphological characteristics, population density, per capita wealth, and culture, all factors that help not only the spread of electric mobility but also the transition to sustainable mobility models. Cities with a high per capita income were considered, and except for London, where for many years the incentive measures had little success, all cities have a small to medium size. These conditions can facilitate both the purchase of electric cars and the acceptance of certain policies and restrictions, which instead may not be tolerated or understood in other urban centers, for example, in Southern Italy (historically with more unfavorable socio-economic conditions than in the North) or poorer countries that must face many other problems besides improving (where needed) air quality. It follows that the transition to electric mobility cannot always be simple, precisely because of structural conditions that go beyond any form of strategy and which can sometimes require a cultural and infrastructural change that cities and their inhabitants may not be willing to accept.
Secondly, despite the policies, strategies, and strong incentives to purchase, users continue to prefer combustion vehicles due to prices that are still not very competitive [142], slow recharging [143], scarce use of columns [144], and a phenomenon known as “range anxiety” [56], i.e., the concern that an electric vehicle may not have sufficient autonomy to reach the intended destination. To tackle these problems, it will be necessary to increase the range of electric vehicles and the spread of charging stations. The future use of electric vehicles, therefore, is also heavily dependent on technological optimization and market development.
Finally, it will also be necessary to consider the other side of the coin. Indeed, coupling mobility with renewable energy could potentially significantly reduce both greenhouse gas emissions and dependence on fossil fuel imports. However, although electric mobility has been strongly encouraged and electric cars represent an important step towards decarbonization, and therefore towards the sustainable development goals, they are not a panacea and still have some environmental problems. A study by BMVI [145] shows that the environmental impacts resulting from the production process of electric vehicles are 60% higher than those of combustion ones. This derives from the high environmental impact of the production and disposal phases of batteries.
The production of batteries involves numerous chemical treatments as well as the use of lithium, lead, nickel, cobalt, manganese, which fall into the category of “critical raw materials”, defined by the EU as they have very limited reserves and are found in a small number of areas globally, especially in developing countries [146]. Just think that 50% of the world’s cobalt is mined in Congo, 60% of lithium in Chile, and 40% of Manganese between South Africa and Gabon. Since the reserves of these raw materials are highly concentrated, they appear to be highly vulnerable to disruption, raising concerns about the security of supply.
In addition, they often come from places where human rights are not always respected, and their extraction requires large quantities of water and other resources, already scarcely present in territories that are often arid and heavily insecure from a water point of view. All this would induce a potentially contradictory situation and would counter Sustainable Development Goals, as batteries would be produced in an unsustainable way to achieve sustainability objectives. About disposal, through the melting processes currently implemented by recycling companies, if on the one hand many metals are easily recovered, on the other hand, the most important material, lithium, is not recovered. Theoretically, it could be recovered, but since the cost of recycling is often higher than the cost of extracting the virgin raw material and recycling activities often produce emissions, it would be particularly expensive and not very advantageous to do so [147]. Lithium, therefore, often remains in the waste posing significant safety risks, considering that it can easily catch fire as well as it could easily lead to soil and groundwater contamination and have a negative impact on ecosystems and hinder goal 12. Studies regarding the end of life of batteries focus on “second life applications”, i.e., extending the life of exhausted batteries in electric vehicles [147]. However, this system has some limitations related to that a recycled battery could be qualitatively lower than one produced with virgin raw materials. To date, therefore, there are no recycling methods that are the right compromise between competitiveness, efficiency, and sustainability.
Furthermore, there is another issue to underline. In the EU in 2019, 42% of the electricity consumed came from fossil fuels, while 27% came from nuclear power plants [148]. Paradoxically, therefore, electric cars could become a potential risk to the environment if the processes of production and disposal of batteries and energy supply continue to operate in a current way. For the transition to electric power to really contribute to the environment, in addition to political measures and purchase incentives, the entire car manufacturing process must be made sustainable, as it is generally recognized that at least 30–50% of the life cycle greenhouse gas (GHG) emissions of electric vehicles is related to the production of batteries and energy [145]. Some considerations are then made, and some priorities are identified.
Agenda 2030, although universally valid and recognized, is not binding. This means that energy reduction policies are left to the voluntary nature of individual administrations, and for many, sustainability is not such a significant priority. In most states, for example, there is no common framework that aligns all cities, but each urban center manages its own strategies in its own way, without a binding national reference background. Since some of the frameworks for improving the environment in cities can be limited to their application only in urban centers with certain characteristics, it will be necessary for central governments to propose solutions that can be generalized and used by several cities. In addition, each administration will need to firmly insert the SDGs within its political frameworks and take considerable steps in implementing more stringent measures and, following the example of what Oslo and Hamburg did, establish their own energy strategies, making them legally binding.
If electricity for refueling electric cars is drawn from combustion and nuclear power plants and if no innovations are found for better production and disposal of batteries, electric cars will never be truly environmentally friendly. The main advantage for the environment will, in fact, be not so much zero emissions on the road, but that each car will benefit above all from better electricity production and a better production and battery disposal process. Electric mobility will be truly “green” and the transition to a smart city will be real and concrete, only when the production and disposal of the battery and energy supply will be truly sustainable. However, this requires the interaction of planners, operators, and suppliers and, therefore, from different sectors.
From the point of view of suppliers, future research will have to focus on technologies that allow for high recycling rates and that make used batteries competitive. From the point of view of administrators, first, they will need to expand research and development budgets to advance science and engineering expertise on recycling, making them at least comparable to battery research and development funding. Secondly, in addition to policies to encourage electric mobility, incentives will also be needed to encourage the collection and recycling of batteries. Finally, a really “smart” choice could be to install charging stations powered only by renewable sources.
Therefore, sustainable development goals cannot be achieved only by increasing the share of electric battery cars. The transition to (truly) green mobility will only be possible through the sustainability of the entire life cycle of electric cars (from the extraction of raw materials to produce batteries, through the supply of energy, to the disposal of batteries. In this regard, applications of the Life Cycle Assessment (LCA) methodology through SimaPro 8.5 Software and utilizing Carbon Footprints (CFPs) have been considered in the research of Rapa et al. [149] for the assessment of the life cycle of an electric car and to indicate possible paths to a circular economy.
5. Conclusions
The transport sector, especially private mobility, is one of the main causes of polluting emissions. To try to reduce this problem, in recent years, electric mobility has been strongly encouraged by governments and municipal administrations, thanks to policies and strategies of various kinds, for example, through the creation of very low emission zones and congestion charges as in the case of London and Milan, across the electrification of the public transport fleet such as in Bologna and Oslo, or by focusing on the granting of new licenses for the taxi service to electric cars. These measures have proved particularly advantageous because within four years they have led to a general improvement in air quality in all six cities considered, notably in Hamburg and Milan. Furthermore, introducing a new mobility system within cities would also mean determining new city models. In fact, electric mobility policies could induce, in addition to an improvement in air quality, also a rethinking of the urban framework, where possible. Oslo, Hamburg, London, Milan, Florence, and Bologna are linked by a common thread, namely the electrification of public transport (both buses and taxis) as well as the creation of “environmental zones”, where access is allowed only to low-emission vehicles. All this has the ultimate goal of discouraging the use of private transport, to the point where citizens prefer public transport because they will not be able to circulate with private combustion vehicles in certain areas. The consequence could therefore be a reduction in the spaces dedicated to cars and an increase in pedestrian areas as well as investments in cycle paths, accelerating the transition towards sustainable mobility models. Electric mobility can therefore also physically modify the urban fabric of a city and give it back spaces because they could make new ones available. It is certainly important that this transition in mobility is accompanied by a change in mentality that makes room, for example, for new forms of economy, including the sharing economy. Examples are bike sharing, scooter sharing, and car sharing services that offer complementary services to urban public transport.
Although electric mobility represents an important step towards decarbonization and can guarantee owners some advantages, including free parking, exemption from paying taxes, low fuel costs, the ability to move freely in city centers, they still have some environmental problems related to the production and disposal of batteries, as well as the production of energy with which they are powered. The future spread of electric mobility can be approached from different perspectives. From a technological point of view, the first step will be to increase research funding for the development of new technologies so that academia and industry can find innovations to make batteries more efficient and, above all, more sustainable.
Secondly, from a strictly administrative point of view, the future spread of electric mobility cannot be separated from an investment system that enhances the amount of infrastructure (favoring high-power ones powered by renewable sources), substantial tax deductions and incentives to demand, but also and above all a clear vision of the future city. Therefore, optimal governance will be necessary, in which the city administration should have great capacity in bringing together the private and public sectors, but also people and communities to push everyone in the same direction, bringing the city on a direct path towards sustainable development and accompanying the technological jump in the best possible way. The six cases taken into consideration first demonstrate the feasibility of using renewable energies for mobility and can therefore be considered as a sort of “benchmarking” to influence other urban developments to adopt the same principle. Second, they show that the transition to an energy-efficient smart city is possible. However, this transition inevitably passes through effective and virtuous management by individual states and administrations, which will be called upon to develop multi-year policies based not on isolated actions but on planning, incentives, and investments.
Finally, for municipal administrations, it will also be necessary to invest in communication, creating a real “culture of sustainability”. In fact, if technology allows optimizing the efficiency of transport, trying as much as possible to limit the environmental impact in all its phases, it is also true that the habits and behaviors of citizens must also be taken into consideration, given that success of a smart city also depends on how much a technology is known and accepted by people.
Funding
This research received no external funding.
Institutional Review Board Statement
Not applicable.
Informed Consent Statement
Not applicable.
Data Availability Statement
Data generated is publicly available and cited in accordance with the journal’s guidelines. All data used to support the results, as well as publicly archived data sets, analyzed or generated during the study were cited within the text. There are no ethical, legal or privacy issues, there are no limitations in the declaration on data availability.
Conflicts of Interest
The authors declare no conflict of interest.
References
- United Nations, Department of Economic and Social Affairs, Population Division. The World’s Cities in 2018—Data Booklet (ST/ESA/ SER.A/417). 2018. Available online: https://www.un.org/en/events/citiesday/assets/pdf/the_worlds_cities_in_2018_data_booklet.pdf (accessed on 8 October 2020).
- Causone, F.; Sangalli, A.; Pagliano, L.; Carlucci, S. Assessing energy performance of smart cities. Build. Serv. Eng. Res. Technol. 2017, 39, 99–116. [Google Scholar] [CrossRef] [Green Version]
- Klecha, L.; Gianni, F. Designing for Sustainable Urban Mobility Behaviour: A Systematic Review of the Literature. In Citizen, Territory and Technologies: Smart Learning Contexts and Practices; Mealha, Ó., Divitini, M., Rehm, M., Eds.; Smart Innovation, Systems and Technologies; Springer: Cham, Switzerland, 2018; Volume 80. [Google Scholar]
- Porru, S.; Misso, F.E.; Pani, F.E.; Repetto, C. Smart mobility and public transport: Opportunities and challenges in rural and urban areas. J. Traffic Transp. Eng. 2020, 7, 88–97. [Google Scholar] [CrossRef]
- C40 Cities Climate Leadership Group. Available online: https://www.c40.org/ (accessed on 12 November 2020).
- Adami, L.; Tubino, M.; Ragazzi, M.; Conti, F.; Rada, E.C. Local Actions for Reducing Global Greenhouse Gas Footprint: 10 Years of Covenant of Mayors Initiative. Int. J. Sustain. Dev. Plann. 2020, 15, 247–252. [Google Scholar] [CrossRef]
- United Nations Framework Convention on Climate Change, The Paris Agreement. Available online: https://unfccc.int/sites/default/files/english_paris_agreement.pdf (accessed on 12 November 2020).
- United Nations. Agenda 2030: The Sustainable Development Goals. 2016. Available online: https://www.un.org/sustainabledevelopment/development-agenda/ (accessed on 8 October 2020).
- Enerdata, Global Energy Statistical Yearbook. 2018. Available online: https://www.enerdata.net/publications/world-energy-statistics-supply-and-demand.html (accessed on 8 October 2020).
- Schimel, D.; Stephens, B.B.; Fisher, J.B. Effect of increasing CO2 on the terrestrial carbon cycle. Proc. Natl. Acad. Sci. USA 2015, 112, 436–441. [Google Scholar] [CrossRef] [PubMed] [Green Version]
- Ministero Della Salute, Direzione Generale Della Prevenzione Sanitaria. Inquinamento Atmosferico e Cambiamenti Climatici, Elementi Per Una Strategia Nazionale di Prevenzione. Available online: http://www.salute.gov.it/imgs/C_17_pubblicazioni_2945_allegato.pdf (accessed on 11 December 2020).
- Alfaro-Navarro, J.L.; López-Ruiz, V.R.; Peña, D.N. A new sustainability city index based on intellectual capital approach. Sustainability 2017, 9, 860. [Google Scholar] [CrossRef] [Green Version]
- WHO. Health Effects of Transport-Related Air Pollution. 2005. Available online: https://www.euro.who.int/__data/assets/pdf_file/0006/74715/E86650.pdf (accessed on 14 October 2020).
- Businge, C.N.; Viani, S.; Pepe, N.; Borgarello, M.; Caruso, C.; Tripodi, G.; Soresinetti, S. Energy efficiency solutions for sustainable urban mobility: Case study of the Milan metropolitan area. Urban Transp. XXIV 2019, 182, 151–163. [Google Scholar]
- EEA. Air Quality in Europe. 2017. Available online: https://www.eea.europa.eu/publications/air-quality-in-europe-2017 (accessed on 12 October 2020).
- European Commission, Mobility and Transport. Available online: https://ec.europa.eu/transport/themes/urban/urban_mobility_en (accessed on 11 December 2020).
- EU Regulation 2019/1242. Available online: https://eur-lex.europa.eu/legal-content/IT/TXT/?uri=CELEX:32019R1242 (accessed on 20 October 2020).
- Brenna, M.; Foiadelli, F.; Leone, C.; Longo, M. Utilization of E-Bus Applied to Urban Lines. In Proceedings of the 2019 International Conference on Clean Electrical Power (ICCEP), Otranto, Italy, 2–4 July 2019; pp. 651–655. [Google Scholar]
- Kournoutos, N.; Cheer, J. An environmentally adaptive warning sound system for electric vehicles. In Proceedings of the INTER-NOISE 2019 MADRID-48th International Congress and Exhibition on Noise Control Engineering 2019, Madrid, Spain, 16–19 June 2019. [Google Scholar]
- Hender, B. Recent developments in battery electric vehicles. Proc. Inst. Electr. Eng. 1965, 112, 2297–2308. [Google Scholar] [CrossRef]
- Lee, J.; Park, S.; Lim, S. Improvement of multilevel dc/dc converter for e-mobility charging station. Electronics 2020, 9, 2037. [Google Scholar] [CrossRef]
- Venu, S.; Jaybhay, S.; Kadam, K.; Varma, M. High Voltage Battery (HVB) Durability Enhancement in Electric Mobility through 1D CAE. SAE Tech. Paper 2020, 28, 13. [Google Scholar]
- Lave, L.B.; Hendrickson, C.T.; McMichael, F.C. Environmental implications of electric cars. Science 1995, 268, 993–995. [Google Scholar] [CrossRef]
- Requia, W.; Moataz, M.; Higgins, C.; Altaf, A.; Ferguson, M. How clean are electric vehicles? Evidence-based review of the effects of electric mobility on air pollutants, greenhouse gas emissions and human health. Atmos. Environ. 2018, 185, 64–77. [Google Scholar] [CrossRef]
- Batista, T.; Freire, F.; Silva, C.M. Vehicle environmental rating methodologies: Overview and application to light-duty vehicles. Renew. Sustain. Energy Rev. 2015, 45, 192–206. [Google Scholar] [CrossRef]
- Tanaka, M.; Ida, T.; Murakami, K.; Friedman, L. Consumers’ willingness to pay for alternative fuel vehicles: A comparative discrete choice analysis between the US and Japan. Transp. Res. Part A Policy Pract. 2014, 70, 194–209. [Google Scholar] [CrossRef]
- Nur, B.M. A case study of socio-cultural and technical factors in automobile design: Discourses between designers and potential users on a new electric vehicle in Africa. Technol. Soc. 2020, 63, 101398. [Google Scholar] [CrossRef]
- Sovacool, B. A transition to plug-in hybrid electric vehicles (PHEVs): Why public health professionals must care. J. Epidemiol. Commun. Health 2010, 64, 185–187. [Google Scholar] [CrossRef]
- Formánek, T.; Tahal, R. Socio-demographic aspects affecting individual stances towards electric and hybrid vehicles in the Czech Republic. Cent. Eur. Bus. Rev. 2020, 9, 78–93. [Google Scholar] [CrossRef]
- Krommes, S.; Schmidt, F. Business model analysis of electric mobility products and services. Int. J. Automot. Tech. Manag. 2017, 17, 316. [Google Scholar] [CrossRef]
- Gatzert, N.; Osterrieder, K. The future of mobility and its impact on the automobile insurance industry. Risk Manag. Insur. Rev. 2020, 23, 31–51. [Google Scholar] [CrossRef] [Green Version]
- Höhne, S.; Tiberius, V. Powered by Blockchain: Forecasting Blockchain use in the electricity market. Int. J. Energy Sect. Manag. 2020, 14, 1221–1238. [Google Scholar] [CrossRef]
- Zeng, L.; Krallmann, T.; Fiege, A.; Stress, M.; Graen, T.; Nolting, M. Optimization of future charging infrastructure for commercial electric vehicles using a multi-objective genetic algorithm and real travel data. Evol. Syst. 2020, 11, 241–254. [Google Scholar] [CrossRef]
- Li, Y. Infrastructure to facilitate usage of electric vehicles and its impact. Transp. Res. Procedia 2016, 14, 2537–2543. [Google Scholar] [CrossRef]
- Lazaroiu, C.; Roscia, M.; Saatmandi, S. Blockchain strategies and policies for sustainable electric mobility into Smart City. In Proceedings of the 2020 International Symposium on Power Electronics, Electrical Drives, Automation and Motion (SPEEDAM), Sorrento, Italy, 24–26 June 2020; pp. 363–368. [Google Scholar]
- Bakker, S.; Trip, J.J. Policy options to support the adoption of electric vehicles in the urban environment. Transp. Res. Part D 2013, 25, 18–23. [Google Scholar] [CrossRef]
- Lieven, T. Policy measures to promote electric mobility—A global perspective. Transp. Res. Part A Policy Pract. 2015, 82, 78–93. [Google Scholar] [CrossRef] [Green Version]
- Ewert, A.; Brost, M.K.; Schmid, S.A. Framework Conditions and Potential Measures for Small Electric Vehicles on a Municipal Level. World Electr. Veh. J. 2020, 11, 1. [Google Scholar] [CrossRef] [Green Version]
- Rietmann, N.; Lieven, T. How policy measures succeeded to promote electric mobility—Worldwide review and outlook. J. Clean. Prod. 2019, 206, 66–75. [Google Scholar] [CrossRef]
- Cansino, J.M.; Sánchez-Braza, A.; Sanz-Díaz, T. Policy Instruments to Promote Electro-Mobility in the EU28: A Comprehensive Review. Sustainability 2018, 10, 2507. [Google Scholar] [CrossRef] [Green Version]
- Massier, T.; Recalde, D.; Sellmair, R.; Gallet, M.; Hamacher, T. Electrification of Road Transport in Singapore and its Integration into the Power System. Energy Technol. 2018, 6, 21–32. [Google Scholar] [CrossRef]
- Khan, S.; Shariff, S.; Ahmad, A.; Saad Alam, M. A Comprehensive Review on Level 2 Charging System for Electric Vehicles. Smart Sci. 2018, 6, 271–293. [Google Scholar] [CrossRef]
- Bickert, S. Financial measures for electric vehicles: Supporting the integration of renewable energy in the mobility sector in Germany. Internat. J. Rene. Ener. Devel. 2014, 3, 45–53. [Google Scholar]
- Zade, M.; You, Z.; Kumaran Nalini, B.; Tzscheutschler, P.; Wagner, U. Quantifying the Flexibility of Electric Vehicles in Germany and California—A Case Study. Energies 2020, 13, 5617. [Google Scholar] [CrossRef]
- Van Triel, F.; Lipman, T.E. Modeling the Future California Electricity Grid and Renewable Energy Integration with Electric Vehicles. Energies 2020, 13, 5277. [Google Scholar] [CrossRef]
- Al Wahedi, A.; Bicer, Y. A Case Study in Qatar for Optimal Energy Management of an Autonomous Electric Vehicle Fast Charging Station with Multiple Renewable Energy and Storage Systems. Energies 2020, 13, 5095. [Google Scholar] [CrossRef]
- Colbertaldo, P.; Cerniauskas, S.; Grube, T.; Robinius, M.; Stolten, D.; Campanari, S. Clean mobility infrastructure and sector integration in long-term energy scenarios: The case of Italy. Renew. Sustain. Energy Rev. 2020, 133, 110086. [Google Scholar] [CrossRef]
- Koasidis, K.; Karamaneas, A.; Nikas, A.; Neofytou, H.; Hermansen, E.A.T.; Vaillancourt, K. Many miles to Paris: A sectoral innovation system analysis of the transport sector in Norway and Canada in light of the Paris agreement. Sustainability 2020, 12, 5832. [Google Scholar] [CrossRef]
- Lioutas, V.; Adamos, G.; Nathanail, E. How Ready Are Greek Consumers to Use Electric Vehicles? Adv. Intell. Sys. Comput. 2021, 1278, 760–769. [Google Scholar]
- Wager, G.; Whale, J.; Braunl, T. Driving electric vehicles at highway speeds: The effect of higher driving speeds on energy consumption and driving range for electric vehicles in Australia. Renew. Sustain. Energy Rev. 2016, 63, 158–165. [Google Scholar] [CrossRef]
- Duigou, A.L.; Guan, Y.; Amalric, Y. On the competitiveness of electric driving in France: Impact of driving patterns. Renew. Sustain. Energy Rev. 2014, 37, 348–359. [Google Scholar] [CrossRef]
- Raslavičius, L.; Azzopardi, B.; Keršys, A.; Starevičius, M.; Bazaras, Z.; Makaras, R. Electric vehicles challenges and opportunities: Lithuanian review. Renew. Sustain. Energy Rev. 2015, 42, 786–792. [Google Scholar] [CrossRef]
- Masiero, G.; Ogasavara, M.H.; Jussani, A.C.; Risso, M.L. The global value chain of electric vehicles: A review of the Japanese, South Korean and Brazilian cases. Renew. Sustain. Energy Rev. 2017, 80, 290–296. [Google Scholar] [CrossRef]
- Asghar, R.; Rehman, F.; Ullah, Z.; Qamar, A.; Ullah, K.; Iqbal, K.; Aman, A.; Nawaz, A.A. Electric vehicles and key adaptation challenges and prospects in Pakistan: A comprehensive review. J. Clean. Prod. 2020, 278, 123375. [Google Scholar] [CrossRef]
- IEA. Global EV Outlook 2019. Available online: https://www.iea.org/reports/global-ev-outlook-2019 (accessed on 10 October 2020).
- Brenna, M.; Lazaroiu, G.C.; Roscia, M.; Saadatmandi, S. Dynamic Model for the EV’s Charging Infrastructure Planning through Finite Element Method. IEEE Access 2020, 8, 102399–102408. [Google Scholar] [CrossRef]
- Metha, D.; Hamke, A.K.; Senn, L. In Depth: eMobility 2020. Statista Mobility Market Outlook; 2020. [Google Scholar]
- Sotnyk, I.; Hulak, D.; Yakushev, O.; Yakusheva, O.; Prokopenko, O.V.; Yevdokymov, A. Development of the US electric car market: Macroeconomic determinants and forecasts. Polityka Energetyczna 2020, 23, 147–164. [Google Scholar] [CrossRef]
- Poggio, A. (Motus-E). Rapporto città. MEZ, Mobilità Emissioni Zero. 2020. Available online: https://www.motus-e.org/wp-content/uploads/2020/07/rapporto-cittaMEZ_2020–4.pdf (accessed on 10 October 2020).
- Vallack, H.; Haq, G.; Whitelegg, J.; Cambridge, H. Policy pathways towards achieving a zero-carbon transport sector in the UK in 2050. World Transp. Policy Pract. 2014, 20, 28–42. [Google Scholar]
- HM Governments. The Road to Zero Next Steps Towards Cleaner Road Transport and Delivering Our Lndustrial Strategy. Available online: https://assets.publishing.service.gov.uk/government/uploads/system/uploads/attachment_data/file/739460/road-to-zero.pdf (accessed on 3 December 2020).
- Loustric, I.; Matyas, M. Exploring city propensity for the market success of micro-electric vehicles. Eur. Transp. Res. Rev. 2020, 12, 42. [Google Scholar] [CrossRef]
- Nationale Plattform Elektromobilität. Available online: http://nationale-plattform-elektromobilitaet.de/ (accessed on 10 December 2020).
- Organ. Int. des Constr. d’Automobiles (OICA). Product. Stat. 2017. Available online: http://www.oica.net/category/production-statistics/2016-statistics/ (accessed on 10 December 2020).
- IEA IA—HEV. Annual Report 2016: Hybrid and Electric Vehicles: The Electric Drive Chauffeurs; International Energy Agency. 2017. Available online: http://www.ieahev.org/news/annual-reports/ (accessed on 10 December 2020).
- Tietge, U.; Lutsey, N. Germany, Sleeping Giant of Electric Vehicles, Awakes. Int. Counc. Clean Transp. 2016. Available online: https://www.theicct.org/blog/staff/germany-sleeping-giant-electric-vehicles-awakes (accessed on 10 December 2020).
- ISTAT. Available online: http://dati.istat.it/Index.aspx?DataSetCode=DCIS_VEICOLIPRA (accessed on 21 October 2020).
- LEGGE 30 Dicembre 2018, n. 145. Bilancio di Previsione Dello Stato per L’anno Finanziario 2019 e Bilancio Pluriennale per Il Triennio 2019–2021. Available online: https://www.gazzettaufficiale.it/eli/gu/2018/12/31/302/so/62/sg/pdf (accessed on 21 October 2020).
- ICity Rank 2019. Available online: https://www.forumpa.it/citta-territori/icity-rank-2019-milano-firenze-e-bologna-sono-le-citta-piu-smart-ditalia/ (accessed on 4 October 2020).
- Climate and Energy Strategy for Oslo. 2016. Available online: https://www.klimaoslo.no/wp-content/uploads/sites/88/2018/06/Climate-and-Energy-Strategy-2016-English.pdf (accessed on 21 October 2020).
- Oslo Council, Climate Authority. Klima- og Energistrategi for Oslo: Behandlet av Oslo Bystyre; 22.06.2016 (sak 195/16); Oslo, Norway, 2016. [Google Scholar]
- Nasjonal Transportplan—NTP. Available online: https://www.regjeringen.no/no/tema/transport-og-kommunikasjon/nasjonal-transportplan/id2475111/ (accessed on 22 October 2020).
- Asarpota, K.; Nadin, V. Energy Strategies, the Urban Dimension, and Spatial Planning. Energies 2020, 13, 3642. [Google Scholar] [CrossRef]
- Rydningen, U.; Høynes, R.C.; Kolltveit, L.W. Oslo 2019: A car-free city centre WIT. Trans. Ecol. Environ. 2017, 226, 3–16. [Google Scholar]
- Vulkan Oslo. Available online: https://vulkanoslo.no/en/about-vulkan/ (accessed on 7 November 2020).
- Molmen, M. EV charging points in Oslo—400 in 4 years 2008–2011: A city’s strategy to support the use of electric vehicles and become the world’s EV capital. In Proceedings of the 26th Electric Vehicle Symposium, Los Angeles, CA, USA, 6–9 May 2012; Volume 1, pp. 727–731. [Google Scholar]
- Glazener, A.; Khreis, H. Transforming Our Cities: Best Practices towards Clean Air and Active Transportation. Curr. Envir. Health Rep. 2019, 6, 22–37. [Google Scholar] [CrossRef]
- Nieuwenhuijsen, M.J.; Khreisd, H. Car free cities: Pathway to healthy urban living. Environ. Int. 2016, 94, 251–262. [Google Scholar] [CrossRef]
- Wangsness, P.B.; Proost, S.; Rødseth, K.L. Vehicle choices and urban transport externalities. Are Norwegian policy makers getting it right? Transp. Res. D 2020, 86, 102384. [Google Scholar] [CrossRef]
- Aasness, M.A.; Odeck, J. The increase of electric vehicle usage in Norway—Incentives and adverse effects. Eur. Transp. Res. Rev. 2015, 7, 34. [Google Scholar] [CrossRef] [Green Version]
- Myklebust, B. EVs in bus lanes—Controversial incentive. In Proceedings of the 2013 World Electric Vehicles Symposium and Exhibition, EVS 20141, Barcelona, Spain, 17–20 November 2014. [Google Scholar]
- IEA. Energy Policies of IEA Countries: Norway 2017 Review; IEA: Paris, France, 2017; Available online: https://www.iea.org/reports/energy-policies-of-iea-countries-norway-2017-review (accessed on 10 October 2020).
- Analitis, A.; Barratt, B.; Green, D.; Beddows, A.; Samoli, E.; Schwartz, J.; Katsouyanni, K. Prediction of PM2.5 concentrations at the locations of monitoring sites measuring PM10 and NOx, using generalized additive models and machine learning methods: A case study in London. Atmos. Environ. 2020, 240, 117757. [Google Scholar] [CrossRef]
- Walton, H.; Dajnak, D.; Beevers, S.; Williams, M.; Watkiss, P.; Hunt, A. Understanding the Health Impacts of Air Pollution in London. 2015. Available online: https://www.london.gov.uk/WHAT-WE-DO/environment/environment-publications/understanding-health-impacts-air-pollution-london (accessed on 3 December 2020).
- Ultra-Low Emission Zone. Further Proposals. Transport for London, Integrated Impact Assessment. 2017. Available online: https://consultations.tfl.gov.uk/environment/air-quality-consultation-phase-3b/user_uploads/integrated-impact-assessment.pdf (accessed on 10 December 2020).
- The Mayor’s Transport Strategy; Greater London Authority: London, UK, 2018. Available online: https://www.london.gov.uk/what-we-do/transport/our-vision-transport/mayors-transport-strategy-2018 (accessed on 23 October 2020).
- Greater London Authority. A Growing Population. Available online: https://www.london.gov.uk//what-we-do/planning/london-plan/current-london-plan/london-plan-chapter-one-context-and-strategy-0 (accessed on 23 October 2020).
- Shaw, S.; Bunce, L. Electrifying London: Connecting with Mainstream Markets. In E-Mobility in Europe 2015 Green Energy and Technology; Leal Filho, W., Kotter, R., Eds.; Springer: Cham, Switzerland, 2015. [Google Scholar]
- Source London. 2018. Available online: https://www.sourcelondon.net/stations (accessed on 10 December 2020).
- Chong, U.; Yim, S.H.L.; Barrett, S.R.H.; Boies, A.M. Air Quality and Climate Impacts of Alternative Bus Technologies in Greater London. Environ. Sci. Technol. 2014, 48, 4613–4622. [Google Scholar] [CrossRef] [PubMed]
- Statista. Licensed Cars in London, England 1995–2018. Available online: https://www.statista.com/statistics/314980/licensed-cars-in-london-england-united-kingdom/ (accessed on 22 October 2020).
- Greater London Authority. Comparison of Air Quality in London with a Number of World and European Cities; Greater London Authority: London, UK, 2014. Available online: https://www.london.gov.uk/sites/default/files/comparison_of_air_quality_in_world_cities_study_final.pdf (accessed on 22 October 2020).
- European Commission. Air Quality: Commission Sends Final Warning to the UK over Levels of Fine Particle Pollution; European Commission: Brussels, Belgium, 2010; Available online: https://europa.eu/rapid/press-release_IP-10–687_en.htm (accessed on 22 October 2020).
- Shammut, M.; Cao, M.; Zhang, Y.; Papaix, C.; Liu, Y.; Gao, X. Banning Diesel Vehicles in London: Is 2040 Too Late? Energies 2019, 12, 3495. [Google Scholar] [CrossRef] [Green Version]
- London Environment Strategy. Available online: https://www.london.gov.uk/sites/default/files/london_environment_strategy-_draft_for_public_consultation.pdf (accessed on 4 November 2020).
- Clancy, L.; Palmer, S.S.; Blake, J. Developing and procuring London’s highway infrastructure to enable an electric future. Proc. Inst. Civ. Eng. Civ. Eng. 2018, 171, 45–50. [Google Scholar] [CrossRef]
- Contreras, G.; Platania, F. Economic and policy uncertainty in climate change mitigation: The London Smart City case scenario. Technol. Forecast. Soc. Chang. 2019, 142, 384–393. [Google Scholar] [CrossRef]
- Green, C.P.; Heywood, J.; Paniagua, M.N. Did the London congestion charge reduce pollution? Reg. Sci. Urban Econ. 2020, 84, 103573. [Google Scholar] [CrossRef]
- Font, A.; Guiseppin, L.; Blangiardo, M.; Ghersi, V.; Fuller, G.W. A tale of two cities: Is air pollution improving in Paris and London? Environ. Pollut. 2019, 249, 1–12. [Google Scholar] [CrossRef]
- Morton, C.; Lovelace, R.; Anable, J. Exploring the effect of local transport policies on the adoption of low emission vehicles: Evidence from the London Congestion Charge and Hybrid Electric Vehicles. Transp. Policy 2017, 60, 34–46. [Google Scholar] [CrossRef]
- Central London Ultra Low Emission Zone-Six Month Report October 2019. Available online: https://www.london.gov.uk/sites/default/files/ulez_six_month_evaluation_report_oct19.pdf (accessed on 5 November 2020).
- Schatzinger, S.; Lim, C.Y.R.; Braun, S. Rethinking the Taxi: Case Study of Hamburg on the Prospects of Urban Fleets for Enhancing Sustainable Mobility. In Smart and Sustainable Planning for Cities and Regions; Bisello, A., Vettorato, D., Laconte, P., Costa, S., Eds.; Green Energy and Technology; Springer: Cham, Switzerland, 2018. [Google Scholar]
- Flämig, H.; Lunkeit, S.; Rosenberger, K.; Wolff, J. Enlarging the scale of BEVs through environmental zoning to reduce GHG emissions: A case study for the city of Hamburg. RTBM 2019, 36, 100418. [Google Scholar] [CrossRef]
- Masterplan Ladeinfrastruktur Hamburg. Available online: https://www.hamburg.de/contentblob/4479262/dcabd1a0157d6ac7c2ab1bfb06b22dc7/data/masterplan-ladeinfrastruktur.pdf (accessed on 23 October 2020).
- Bürgerschaft der Freien und Hansestadt Hamburg. Available online: https://www.hamburg.de/pressearchiv-fhh/13278828/2019–12–03-sk-bue-hamburger-klimaplan2019/ (accessed on 23 October 2020).
- Lange, K.; Knieling, J. EU Smart City Lighthouse Projects between Top-Down Strategies and Local Legitimation: The Case of Hamburg. Urban Plan. 2020, 5, 107–115. [Google Scholar] [CrossRef] [Green Version]
- Hamburg Climate Protection Act. Available online: https://www.hamburg.de/contentblob/13287266/41fec80dbc0bcdc06aa42f937f2bfaf7/data/d-gesetzesvorlage-hamburgs-neues-klimaschutzgesetz.pdf (accessed on 4 November 2020).
- Jahic, A.; Eskander, M.; Schulz, D. Preemptive vs. non-preemptive charging schedule for large-scale electric bus depots. In Proceedings of the 2019 IEEE PES Innovative Smart Grid Technologies Europe (ISGT-Europe), Bucharest, Romania, 2 October 2019; pp. 1–5. [Google Scholar]
- Jahic, A.; Eskander, M.; Schulz, D. Charging Schedule for Load Peak Minimization on Large-Scale Electric Bus Depots. Appl. Sci. 2019, 9, 1748. [Google Scholar] [CrossRef] [Green Version]
- Li, S.; Liu, Y.; Wang, J. Factors affecting the electric vehicle demonstration: 14 international cities/regions cases. In Proceedings of the 2015 International Conference on Logistics, Informatics and Service Sciences (LISS), Barcelona, Spain, 27–29 July 2015; pp. 1–7. [Google Scholar]
- Wang, J.Y.; Liu, Y.Q.; Kokko, A. The Electric Vehicle Development: Experiences Aboard and Enlightenment to China. Appl. Mech. Mater. 2014, 541–542, 1549–1555. [Google Scholar] [CrossRef]
- EV Readiness Index, LeasePlan Report. 2020. Available online: https://www.leaseplan.com/corporate/~/media/Files/L/Leaseplan/documents/news-articles/2020/14–01–2020-document-a.pdf (accessed on 23 October 2020).
- Poggio, A.; Laurenti, M.; De Santis, S.; Izzi, A. Mal’Aria di Città; Legambiente, 2020; Available online: https://www.legambiente.it/wp-content/uploads/2020/01/Malaria-di-citta-2020.pdf (accessed on 4 December 2020).
- Città metropolitana di Milano, Piano Urbano della Mobilità Sostenibile (PUMS); 2018; Available online: https://www.cittametropolitana.mi.it/export/sites/default/PUMS/doc/PUMS-CmMi_Documento-di-Piano.pdf (accessed on 18 October 2020).
- Menga, P.; Buccianti, R.; Bedogni, M.; Moroni, S. Promotion of freight mobility in Milan: Environmental, energy and economical aspects. In Proceedings of the 2013 World Electric Vehicle Symposium and Exhibition (EVS27), Barcelona, Spain, 17–20 November 2013; pp. 1–7. [Google Scholar]
- Comune di Milano. 2020. Available online: https://www.comune.milano.it/aree-tematiche/mobilita (accessed on 18 October 2020).
- Boggio, M.; Beria, P. The role of transport supply in the acceptability of pollution charge extension. The case of Milan. Transp. Res. Part A Policy Pract. 2019, 129, 92–106. [Google Scholar] [CrossRef]
- Mussone, L. Analysis of entering flows in the congestion pricing area C of Milan. In Proceedings of the 2017 IEEE International Conference on Environment and Electrical Engineering and 2017 IEEE Industrial and Commercial Power Systems Europe (EEEIC/I&CPS Europe), Milan, Italy, 6–9 June 2017; pp. 1–6. [Google Scholar]
- Beria, P. Effectiveness and monetary impact of Milan’s road charge, one year after implementation. Int. J. Sustain. Transp. 2016, 10, 657–669. [Google Scholar] [CrossRef] [Green Version]
- Croci, E. Urban Road Pricing: A Comparative Study on the Experiences of London, Stockholm and Milan. Transp. Res. Rec. 2016, 14, 253–262. [Google Scholar]
- Galluppi, O.; Colzi, F.; Formentin, S.; Savaresi, S.M. A vehicle-user matching tool to encourage electric mobility. In Proceedings of the 2017 IEEE Intelligent Vehicles Symposium (IV), Los Angeles, CA, USA, 11–14 June 2017; pp. 1625–1630, IVS.2017.7995942. [Google Scholar]
- Piano Aria e Clima del Comune di Milano. Documento Preliminare di Piano, Luglio 2020. Available online: https://www.comune.milano.it/documents/20126/126287263/VAS_PAC_Documento+preliminare+di+piano.pdf/85e34bb6–3b38-fae3–225a-6534e950a6b0?t=1593788559259 (accessed on 23 November 2020).
- Ferrero, E.; Alessandrini, S.; Balanzino, A. Impact of the electric vehicles on the air pollution from a highway. Appl. Energy 2016, 169, 450–459. [Google Scholar] [CrossRef]
- Assolombarda, Osservatorio Milano, 3 Edizione. 2019. Available online: https://www.assolombarda.it/centro-studi/osservatorio-milano (accessed on 11 December 2020).
- Comune di Firenze. 2020. Available online: http://mobilita.comune.fi.it/mobilita_sostenibile/mobilita_sostenibile/mobilita_elettrica.html (accessed on 23 November 2020).
- Berzi, L.; Delogu, M.; Pierini, M. Development of driving cycles for electric vehicles in the context of the city of Florence. Transp. Res. D Trans. Environ. 2016, 47, 299–322. [Google Scholar] [CrossRef]
- Parenti, G. Fostering electric mobility in Florence. In Proceedings of the 16th International Conference on Environment and Electrical Engineering, EEEIC 2016, Florence, Italy, 7–10 June 2016. Category numberCFP1651I-CDR; Code 123530. [Google Scholar]
- Città Metropolitana di Firenze, Piano Urbano della Mobilità Sostenibile (PUMS). 2018. Available online: http://www.cittametropolitana.fi.it/wp-content/uploads/PUMS_CM_FI_Quadro_Conoscitivo_FOCUS-FIRENZE-SAL-26–03–2019.pdf (accessed on 4 December 2020).
- Talluri, G.; Grasso, F.; Chiaramonti, D. Is Deployment of Charging Station the Barrier to Electric Vehicle Fleet Development in EU Urban Areas? An Analytical Assessment Model for Large-Scale Municipality-Level EV Charging Infrastructures. Appl. Sci. 2019, 9, 4704. [Google Scholar] [CrossRef] [Green Version]
- Scorrano, M.; Danielis, R.; Giansoldati, M. Mandating the use of the electric taxis: The case of Florence. Transp. Res. Part. A Policy Pract. 2020, 132, 402–414. [Google Scholar] [CrossRef]
- Fissi, S.; Romolini, A.; Gori, E.; Contri, M. The path toward a sustainable green university: The case of the University of Florence. J. Clean. Prod. 2021, 279, 123655. [Google Scholar] [CrossRef]
- Comune di Bologna. 2020. Available online: http://www.comune.bologna.it/trasporti/servizi/2:4321/41986/ (accessed on 22 October 2020).
- Città Metropolitana di Bologna. Piano Urbano della Mobilità Sostenibile (PUMS). 2018. Available online: https://pumsbologna.it/consulta_il_piano/Documenti (accessed on 22 October 2020).
- Navarro, C.; Roca-Riu, M.; Furió, S.; Estrada, M. Designing new models for energy efficiency in urban freight transport for smart cities and its application to the Spanish case. Transp. Res. Rec. 2016, 12, 314–324. [Google Scholar] [CrossRef] [Green Version]
- Air Pollution Monitoring Data in London: 2016 to 2020. Available online: https://www.london.gov.uk/sites/default/files/air_pollution_monitoring_data_in_london_2016_to_2020_feb2020.pdf (accessed on 6 November 2020).
- Hamburg Air Monitoring Network (Hamburger Luftmessnetz). Available online: https://luft.hamburg.de/datenarchiv-und-stationsinfos/4369176/jahresergebnisse/ (accessed on 6 November 2020).
- Climate Budget 2020, Chapter 2. Oslo City Government’s Budget Proposal 2020 with Appendices. Available online: https://www.klimaoslo.no/wp-content/uploads/sites/88/2019/12/Climate-Budget-2020-Oslo.pdf (accessed on 6 November 2020).
- Oslo Municipality’s Statistics Bank. Available online: http://statistikkbanken.oslo.kommune.no/webview/ (accessed on 6 November 2020).
- SDGS REPORT. Statistical Information for the 2030 Agenda in Italy (Rapporto SDGS 2020. Informazioni Statistiche per l’agenda 2030 in Italia). ISTAT. 2020. Available online: https://www.istat.it/it/archivio/242819 (accessed on 8 November 2020).
- Arpa Lombardia. Available online: https://www.arpalombardia.it/Pages/Aria/qualita-aria.aspx (accessed on 10 December 2020).
- ARPAT (Agenzia Regionale per la Protezione Ambientale della Toscana), Indicatori Annuali. Available online: http://www.arpat.toscana.it/temi-ambientali/aria/qualita-aria/indicatori_annuali/index/AGGLOMERATO-DI-FIRENZE/NO2/TUTTE/TUTTE (accessed on 21 November 2020).
- Dong, X.; Zhang, B.; Wang, B.; Wang, Z. Urban households’ purchase intentions for pure electric vehicles under subsidy contexts in China: Do cost factors matter? Transp. Res. Part A Policy Pract. 2020, 135, 183–197. [Google Scholar] [CrossRef]
- Danielis, R.; Rotaris, L.; Giansoldati, M.; Scorrano, M. Drivers’ preferences for electric cars in Italy. Evidence from a country with limited but growing electric car uptake. Transp. Res. Part A Policy Pract. 2020, 137, 79–94. [Google Scholar] [CrossRef]
- Pevec, D.; Babic, J.; Carvalho, A.; Ghiassi-Farrokhfal, Y.; Ketter, W.; Podobnik, V. A survey-based assessment of how existing and potential electric vehicle owners perceive range anxiety. J. Clean. Prod. 2020, 276, 122779. [Google Scholar] [CrossRef]
- BMVI, Bundesministerium für Verkehr und Digitale InfrastrukturAbschlussbericht: Bewertung der Praxistauglichkeit und Umweltwirkungen von Elektrofahrzeugen 2016, Berlin. Available online: https://www.xn--starterset-elektromobilitt-4hc.de/content/3-Infothek/2-Publikationen/29-abschlussbericht-bewertung-der-praxistauglichkeit-und-umweltwirkungen-von-elektrofahrzeugen/now_handbuch_elektrofahrzeuge_web.pdf (accessed on 1 December 2020).
- United Nations Conference on Trade and Development (UNCTAD). Commodities at a Glance. Special Issue on Strategic Battery Raw Materials, N.13. Available online: https://unctad.org/system/files/official-document/ditccom2019d5_en.pdf (accessed on 1 December 2020).
- Beaudet, A.; Larouche, F.; Amouzegar, K.; Bouchard, P.; Zaghib, K. Key Challenges and Opportunities for Recycling Electric Vehicle Battery Materials. Sustainability 2020, 12, 5837. [Google Scholar] [CrossRef]
- Eurostat, Database. 2020. Available online: https://ec.europa.eu/eurostat/data/database (accessed on 9 December 2020).
- Rapa, M.; Gobbi, L.; Ruggieri, R. Environmental and Economic Sustainability of Electric Vehicles: Life Cycle Assessment and Life Cycle Costing Evaluation of Electricity Sources. Energies 2020, 13, 6292. [Google Scholar] [CrossRef]
Figure 1.
Growth of the electric car fleet (battery electric vehicles (BEV) + plug-in electric vehicles (PHEV)) circulating on the road worldwide, 2013–2019 [55].
Figure 1.
Growth of the electric car fleet (battery electric vehicles (BEV) + plug-in electric vehicles (PHEV)) circulating on the road worldwide, 2013–2019 [55].

Figure 2.
Electric cars Worldwide: market shares by Country, 2019 [57].
Figure 2.
Electric cars Worldwide: market shares by Country, 2019 [57].

Figure 3.
Electric car registrations in Italy (September 2019–September 2020) [59].
Figure 3.
Electric car registrations in Italy (September 2019–September 2020) [59].

Figure 4.
SDG 11.6.2. Cities annual average of particulate matter (PM2.5) (µg/m3) (2016–2019) [135,136,137,138,139,140,141].

Figure 5.
SDG 11.6.2. Cities annual average of PM10 (µg/m3) (2016–2019) [135,136,137,138,139,140,141].

Figure 6.
SDG 11.6.2. Cities annual average of NO2 (µg/m3) (2016–2019) [135,136,137,138,139,140,141].


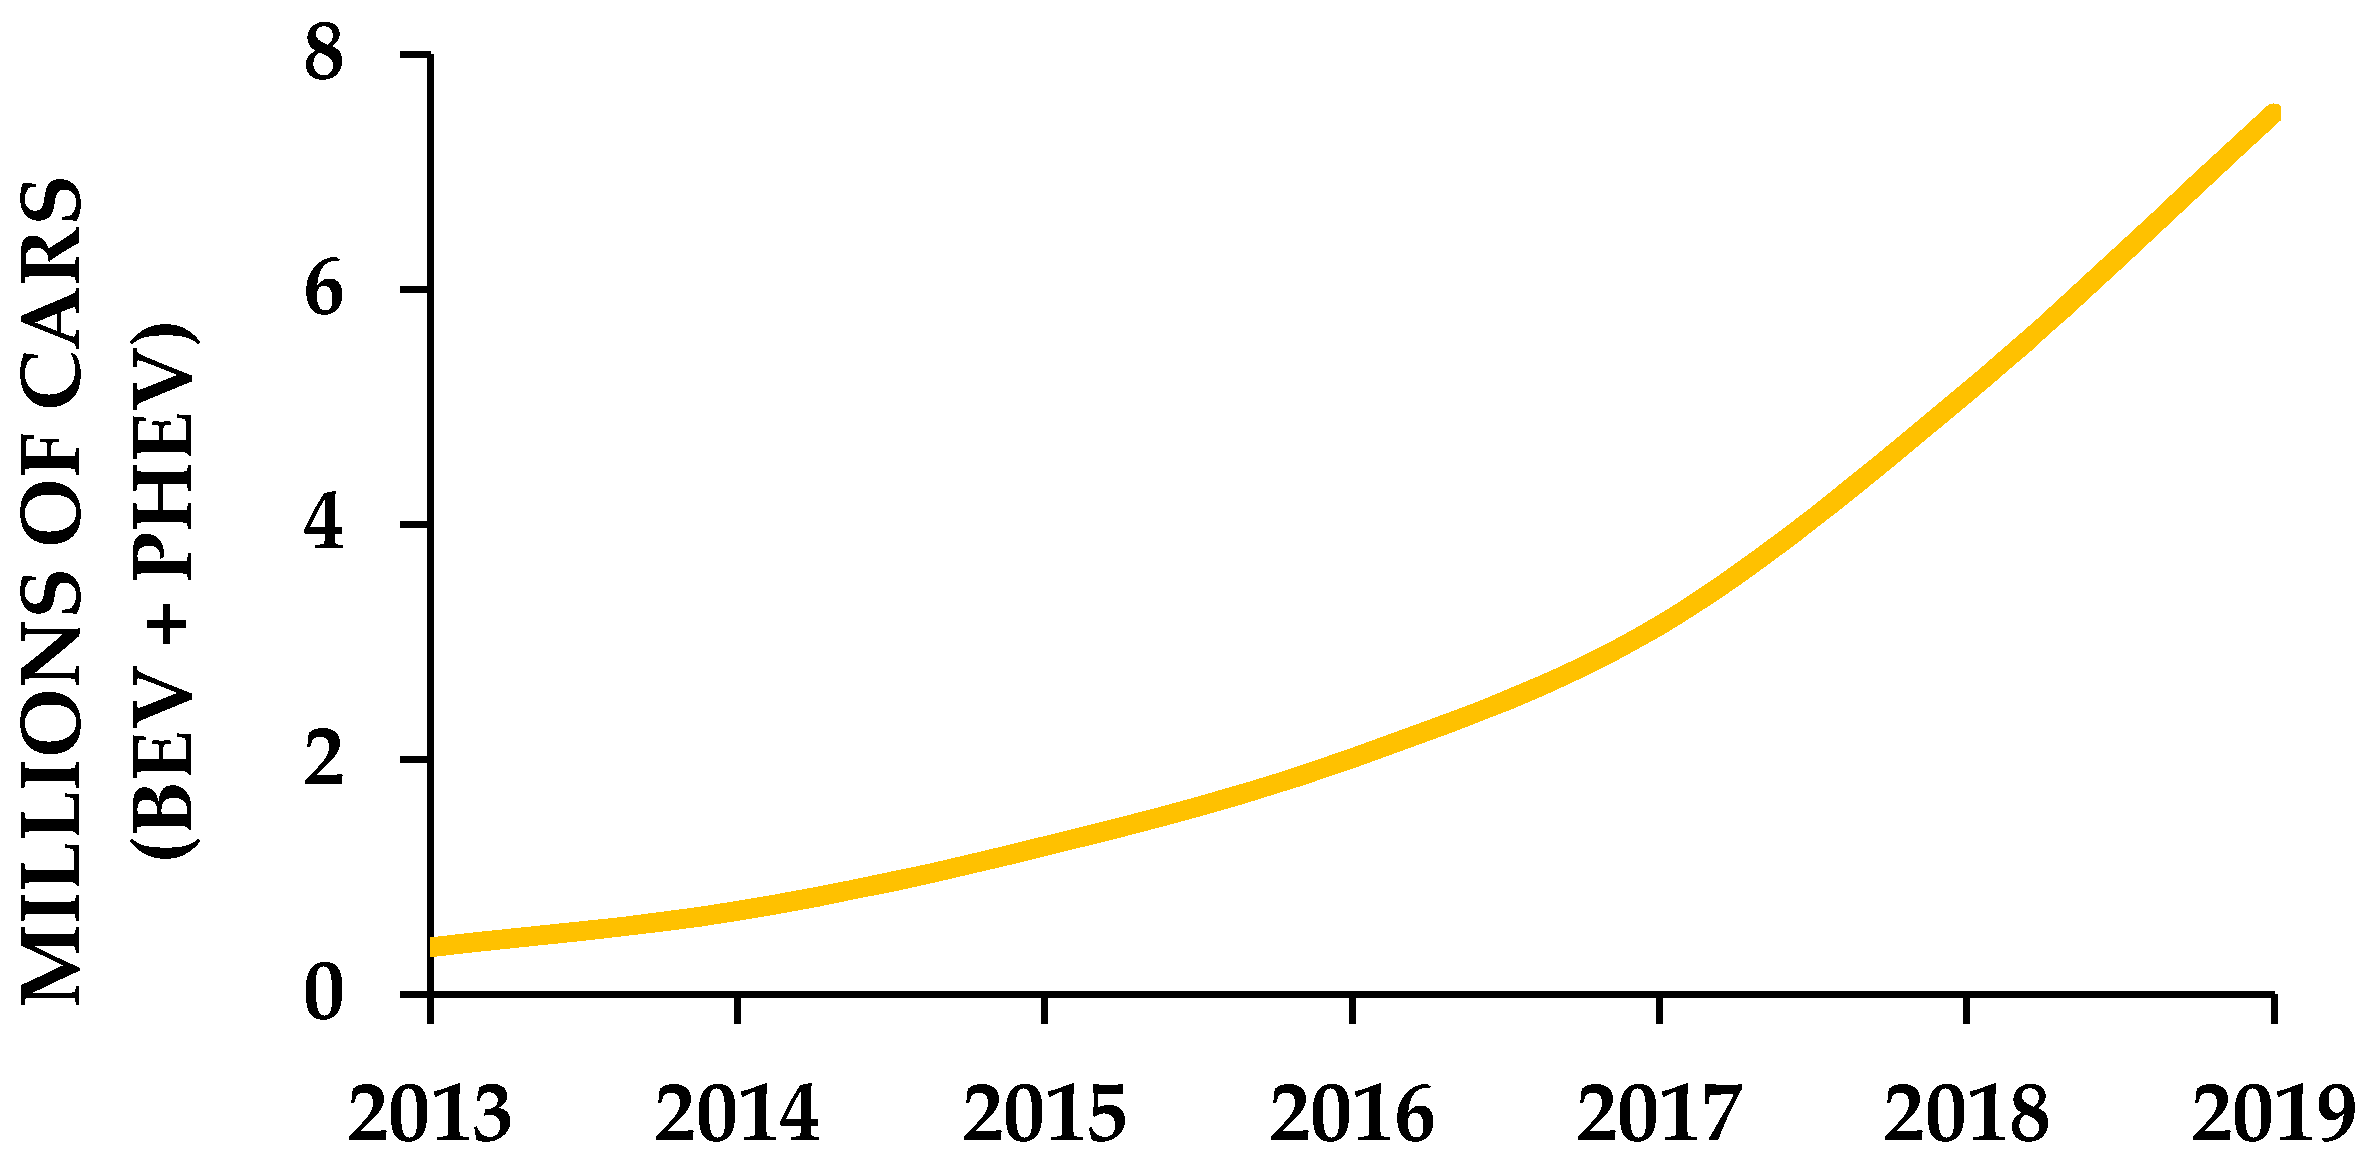
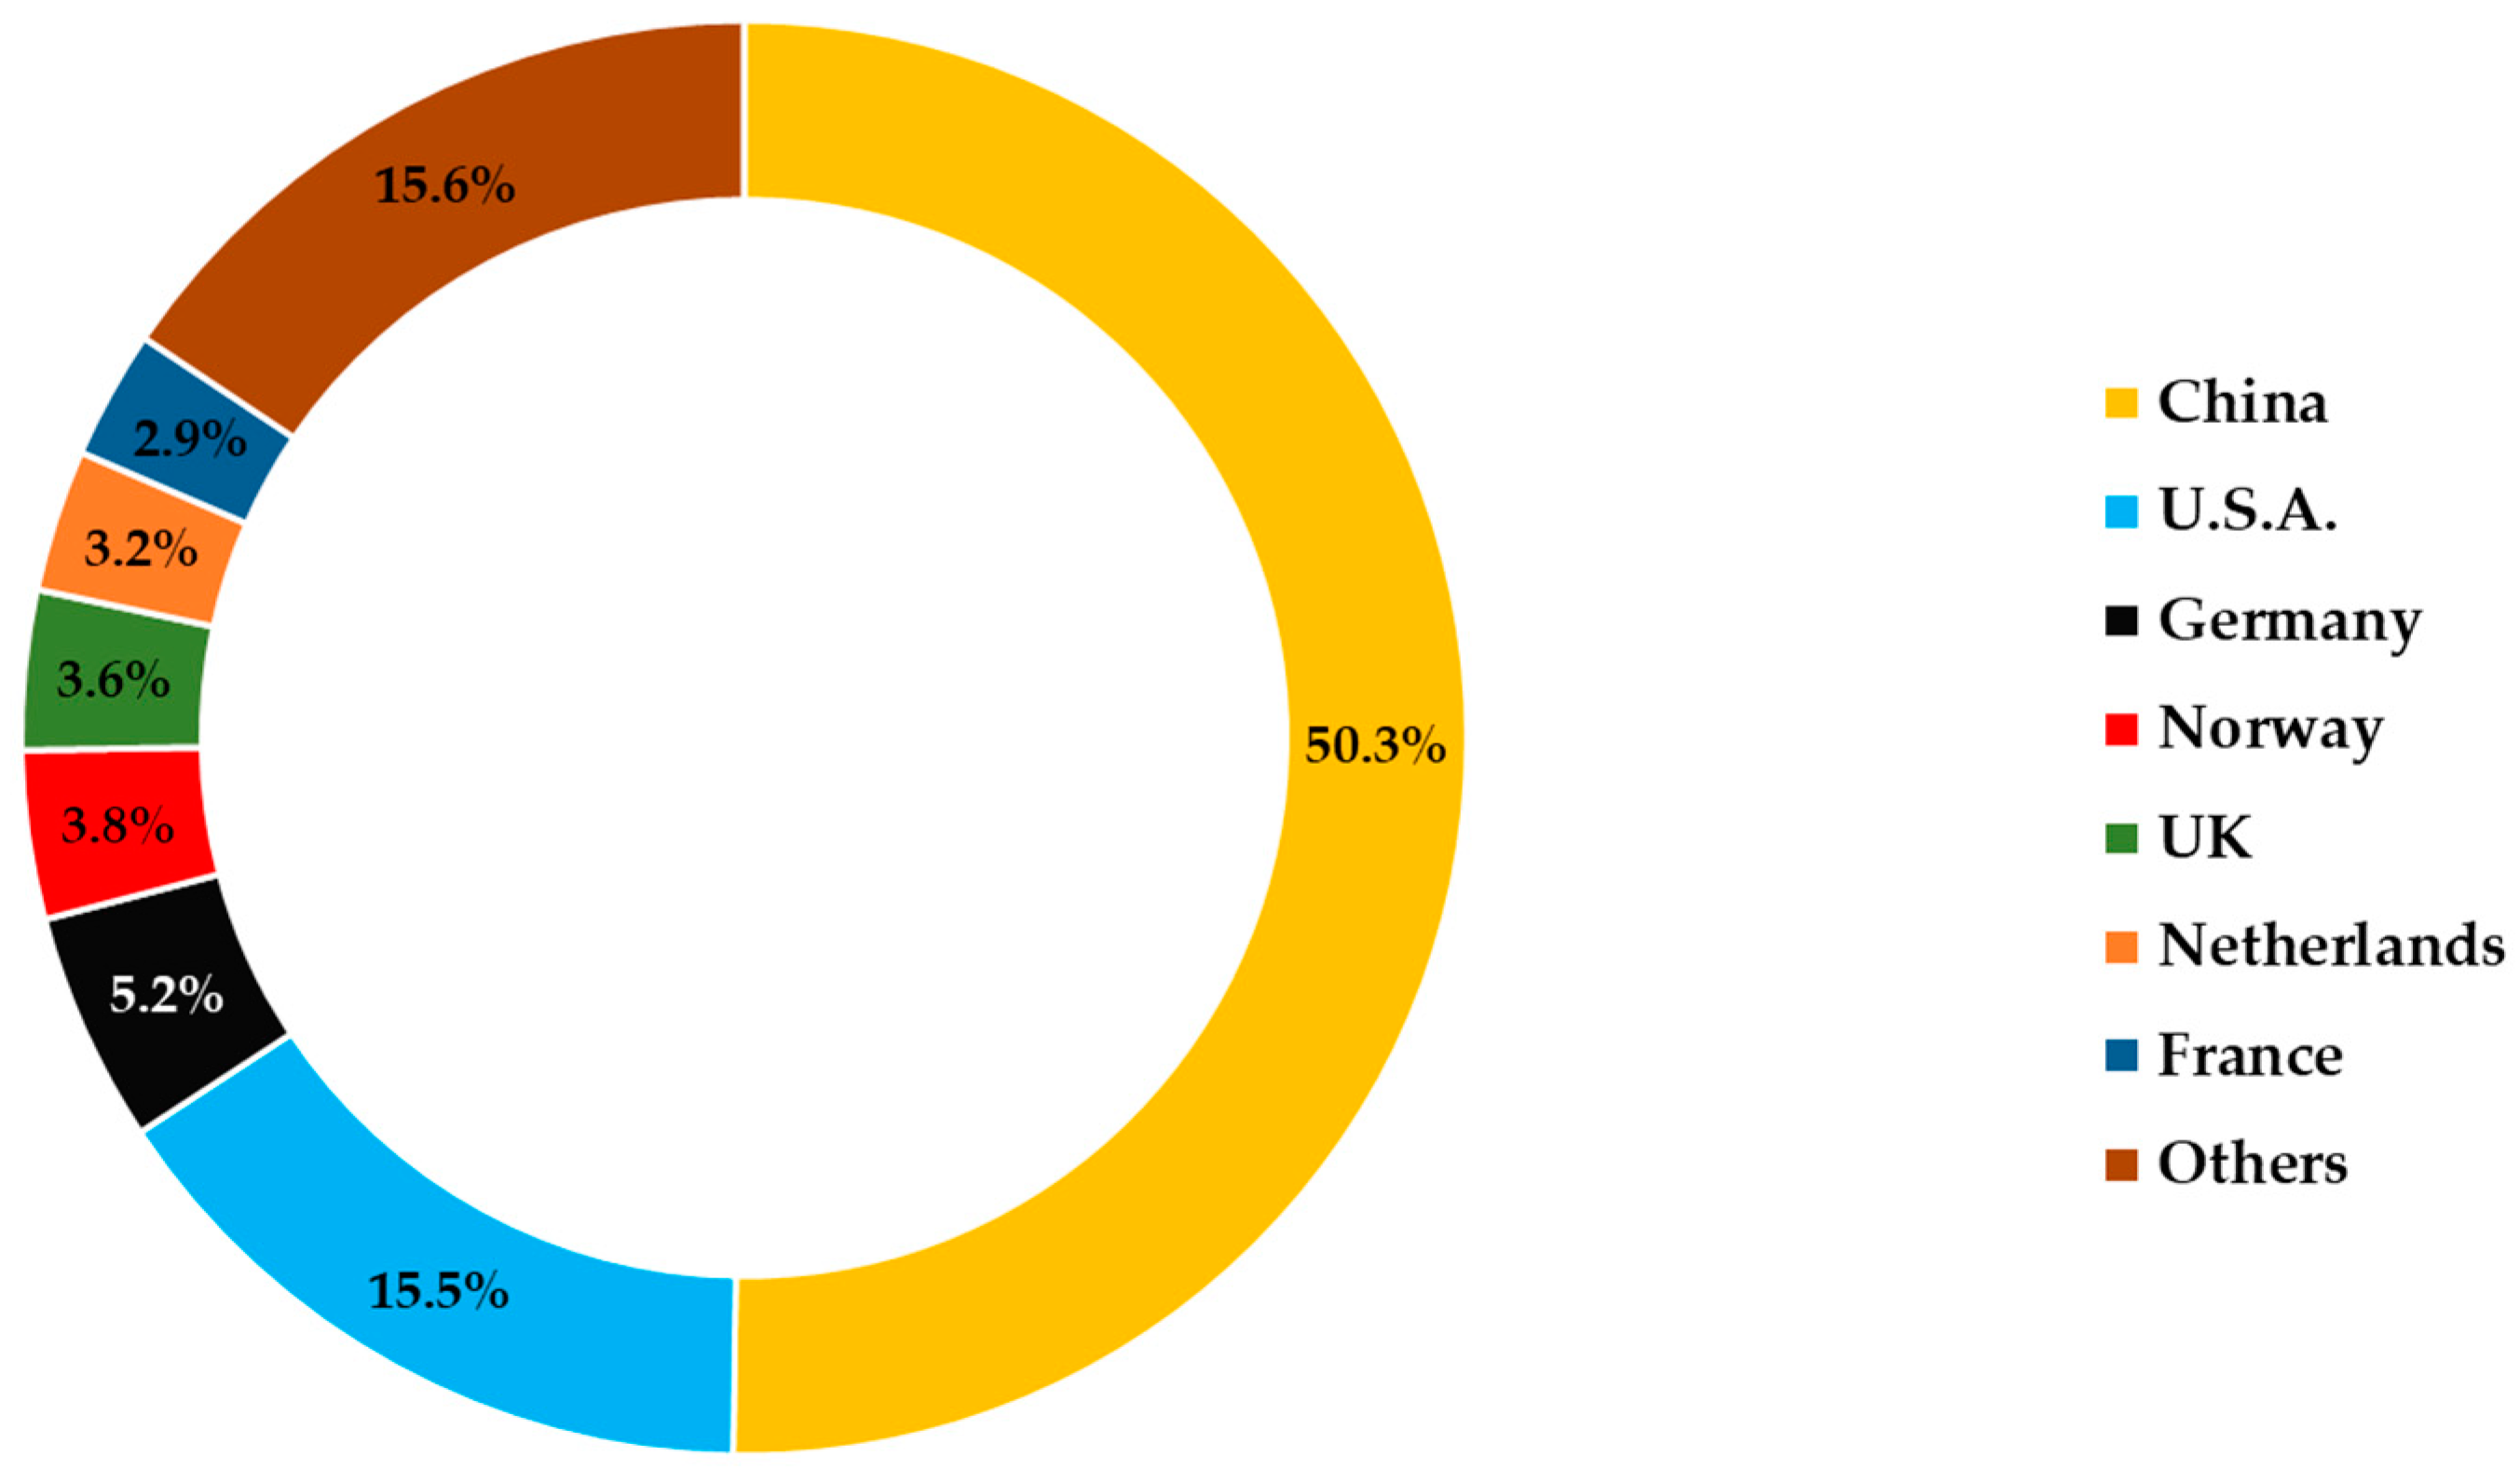
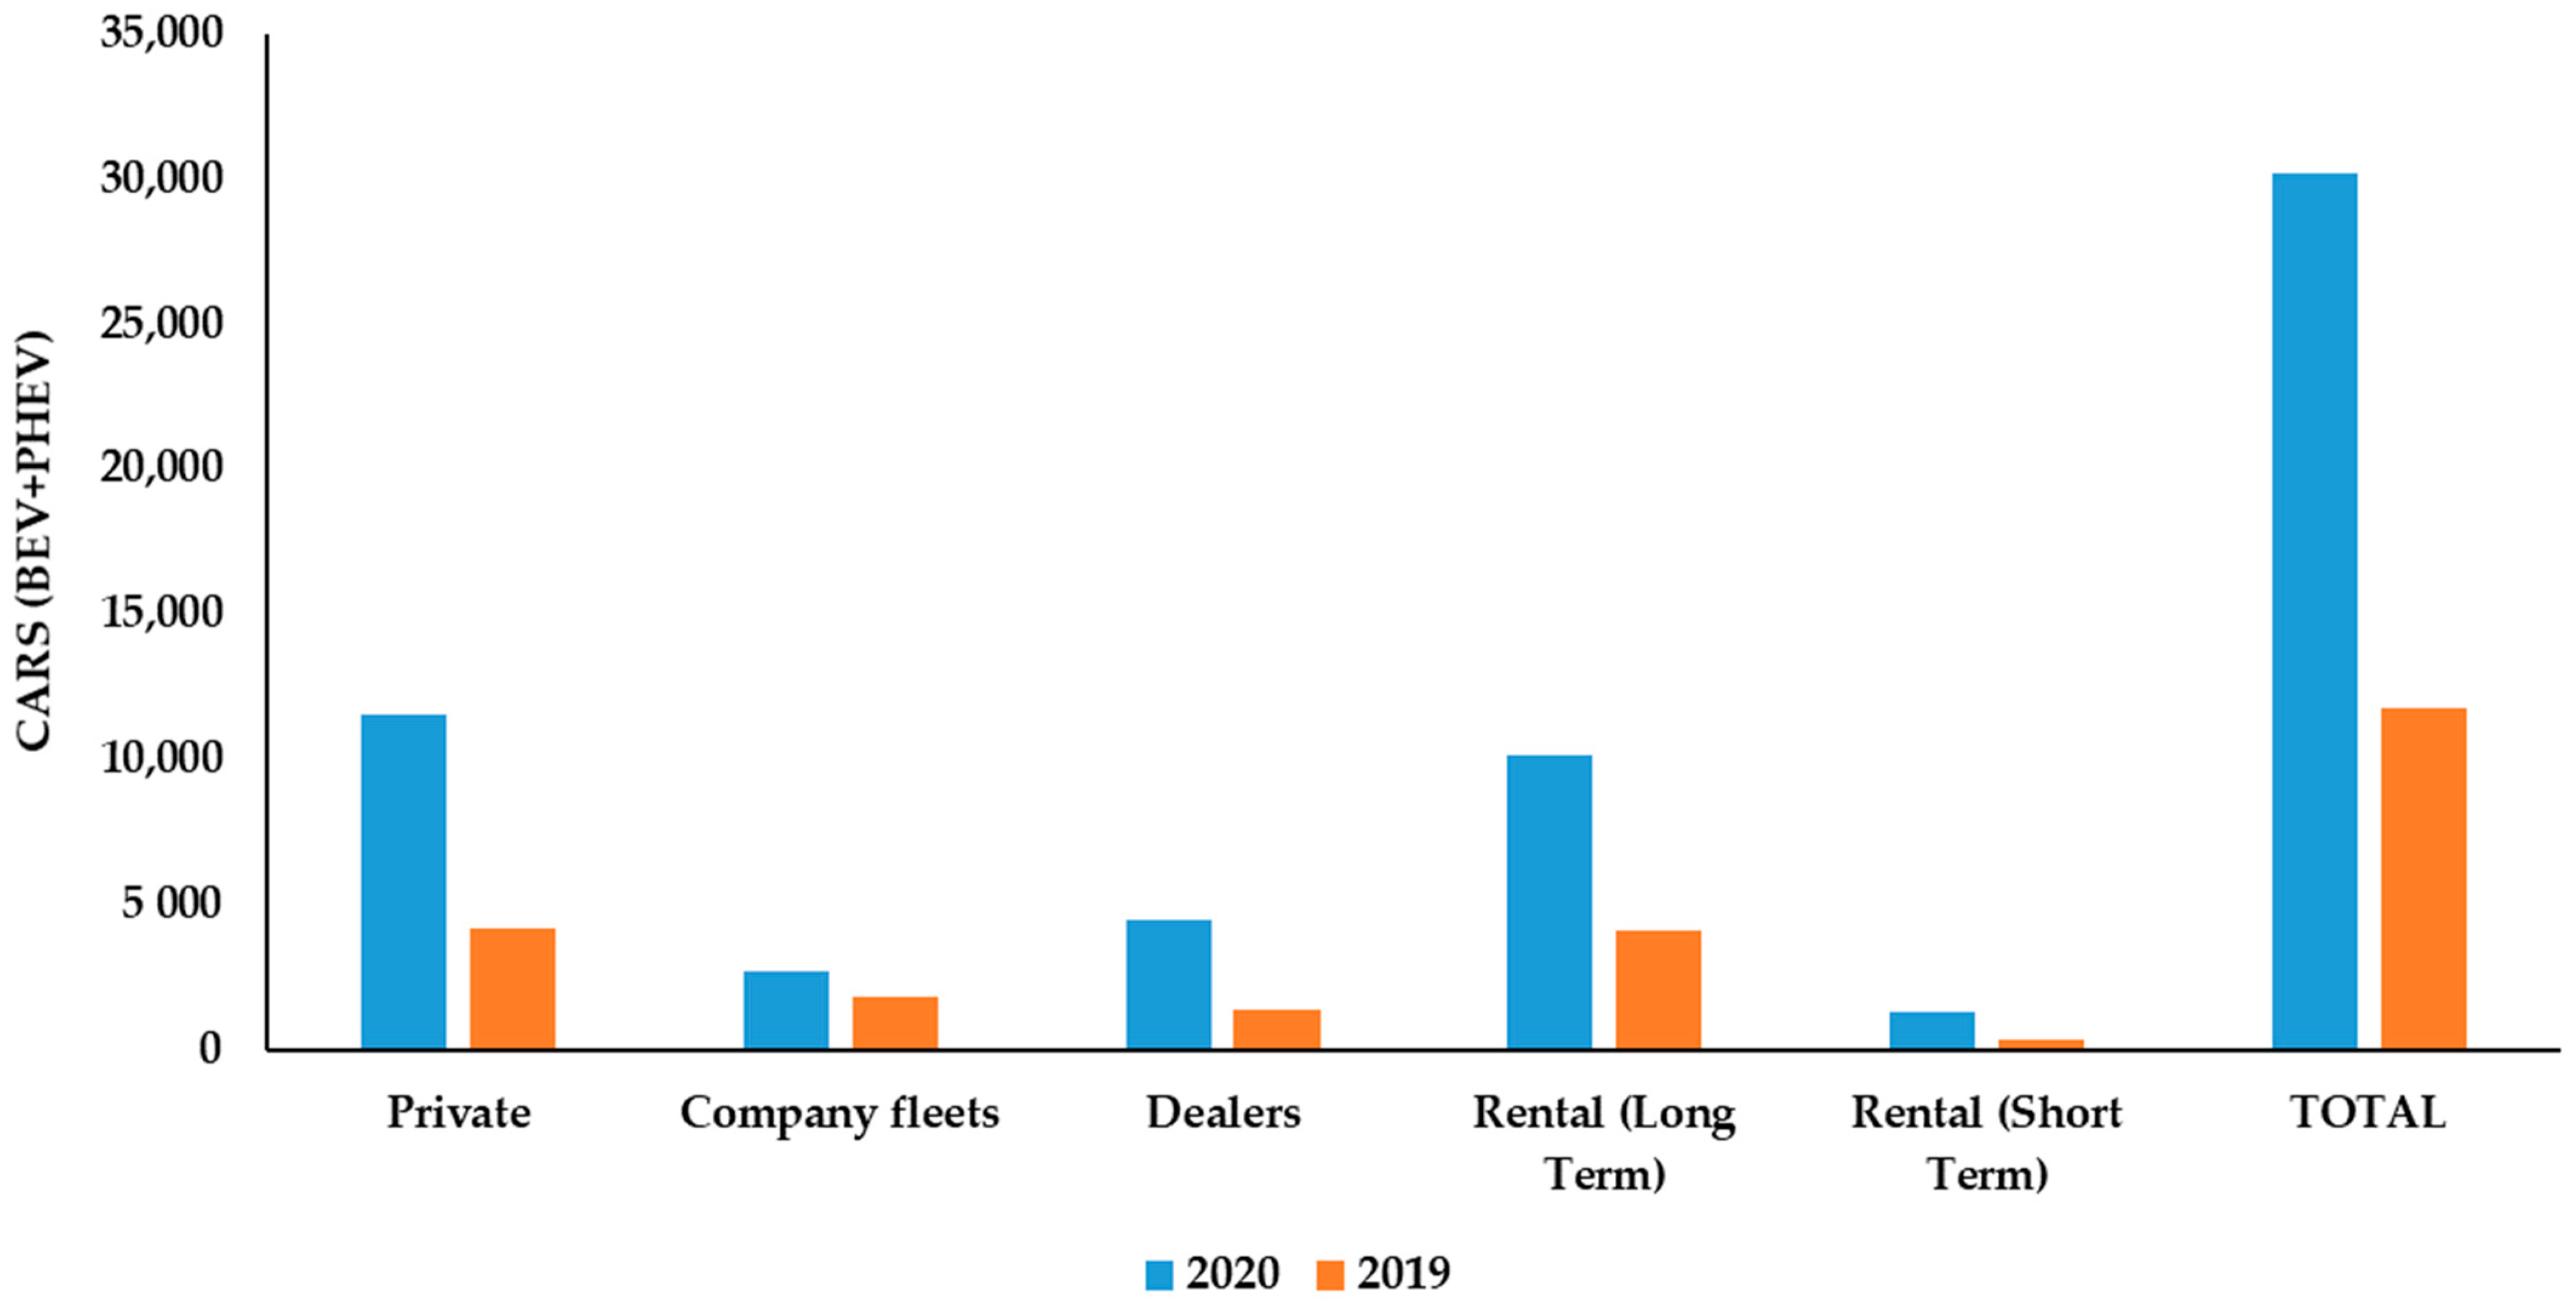
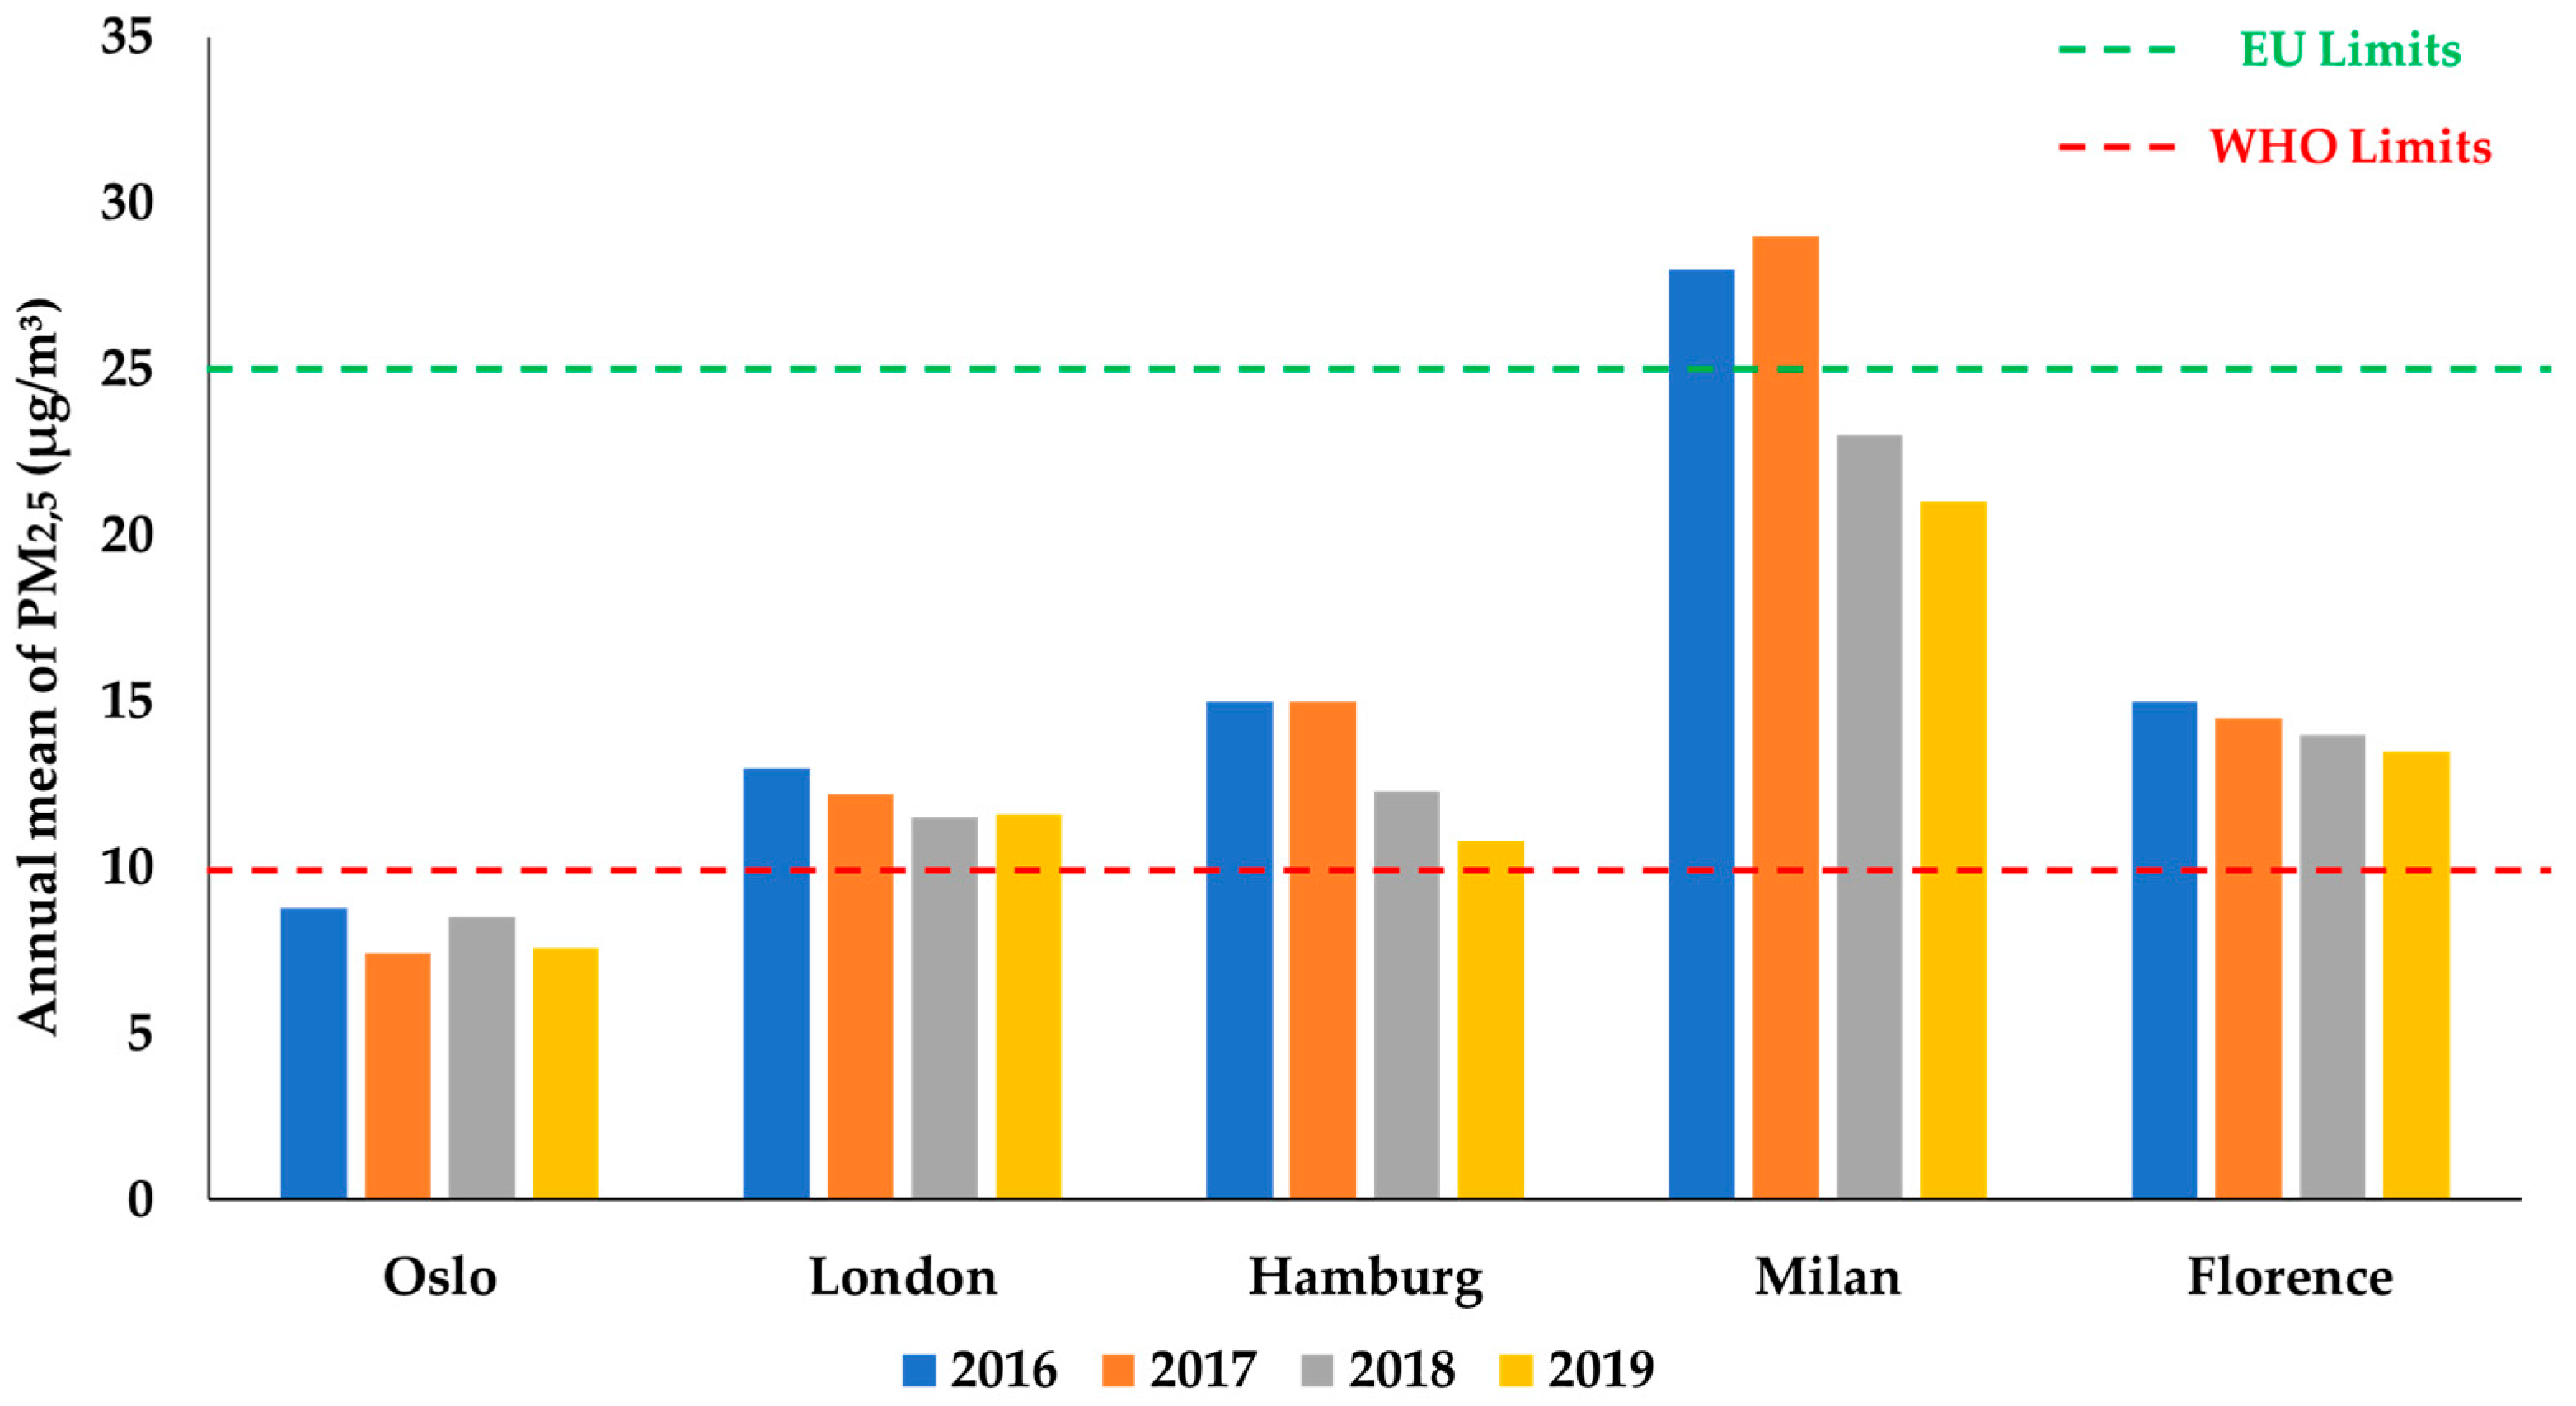
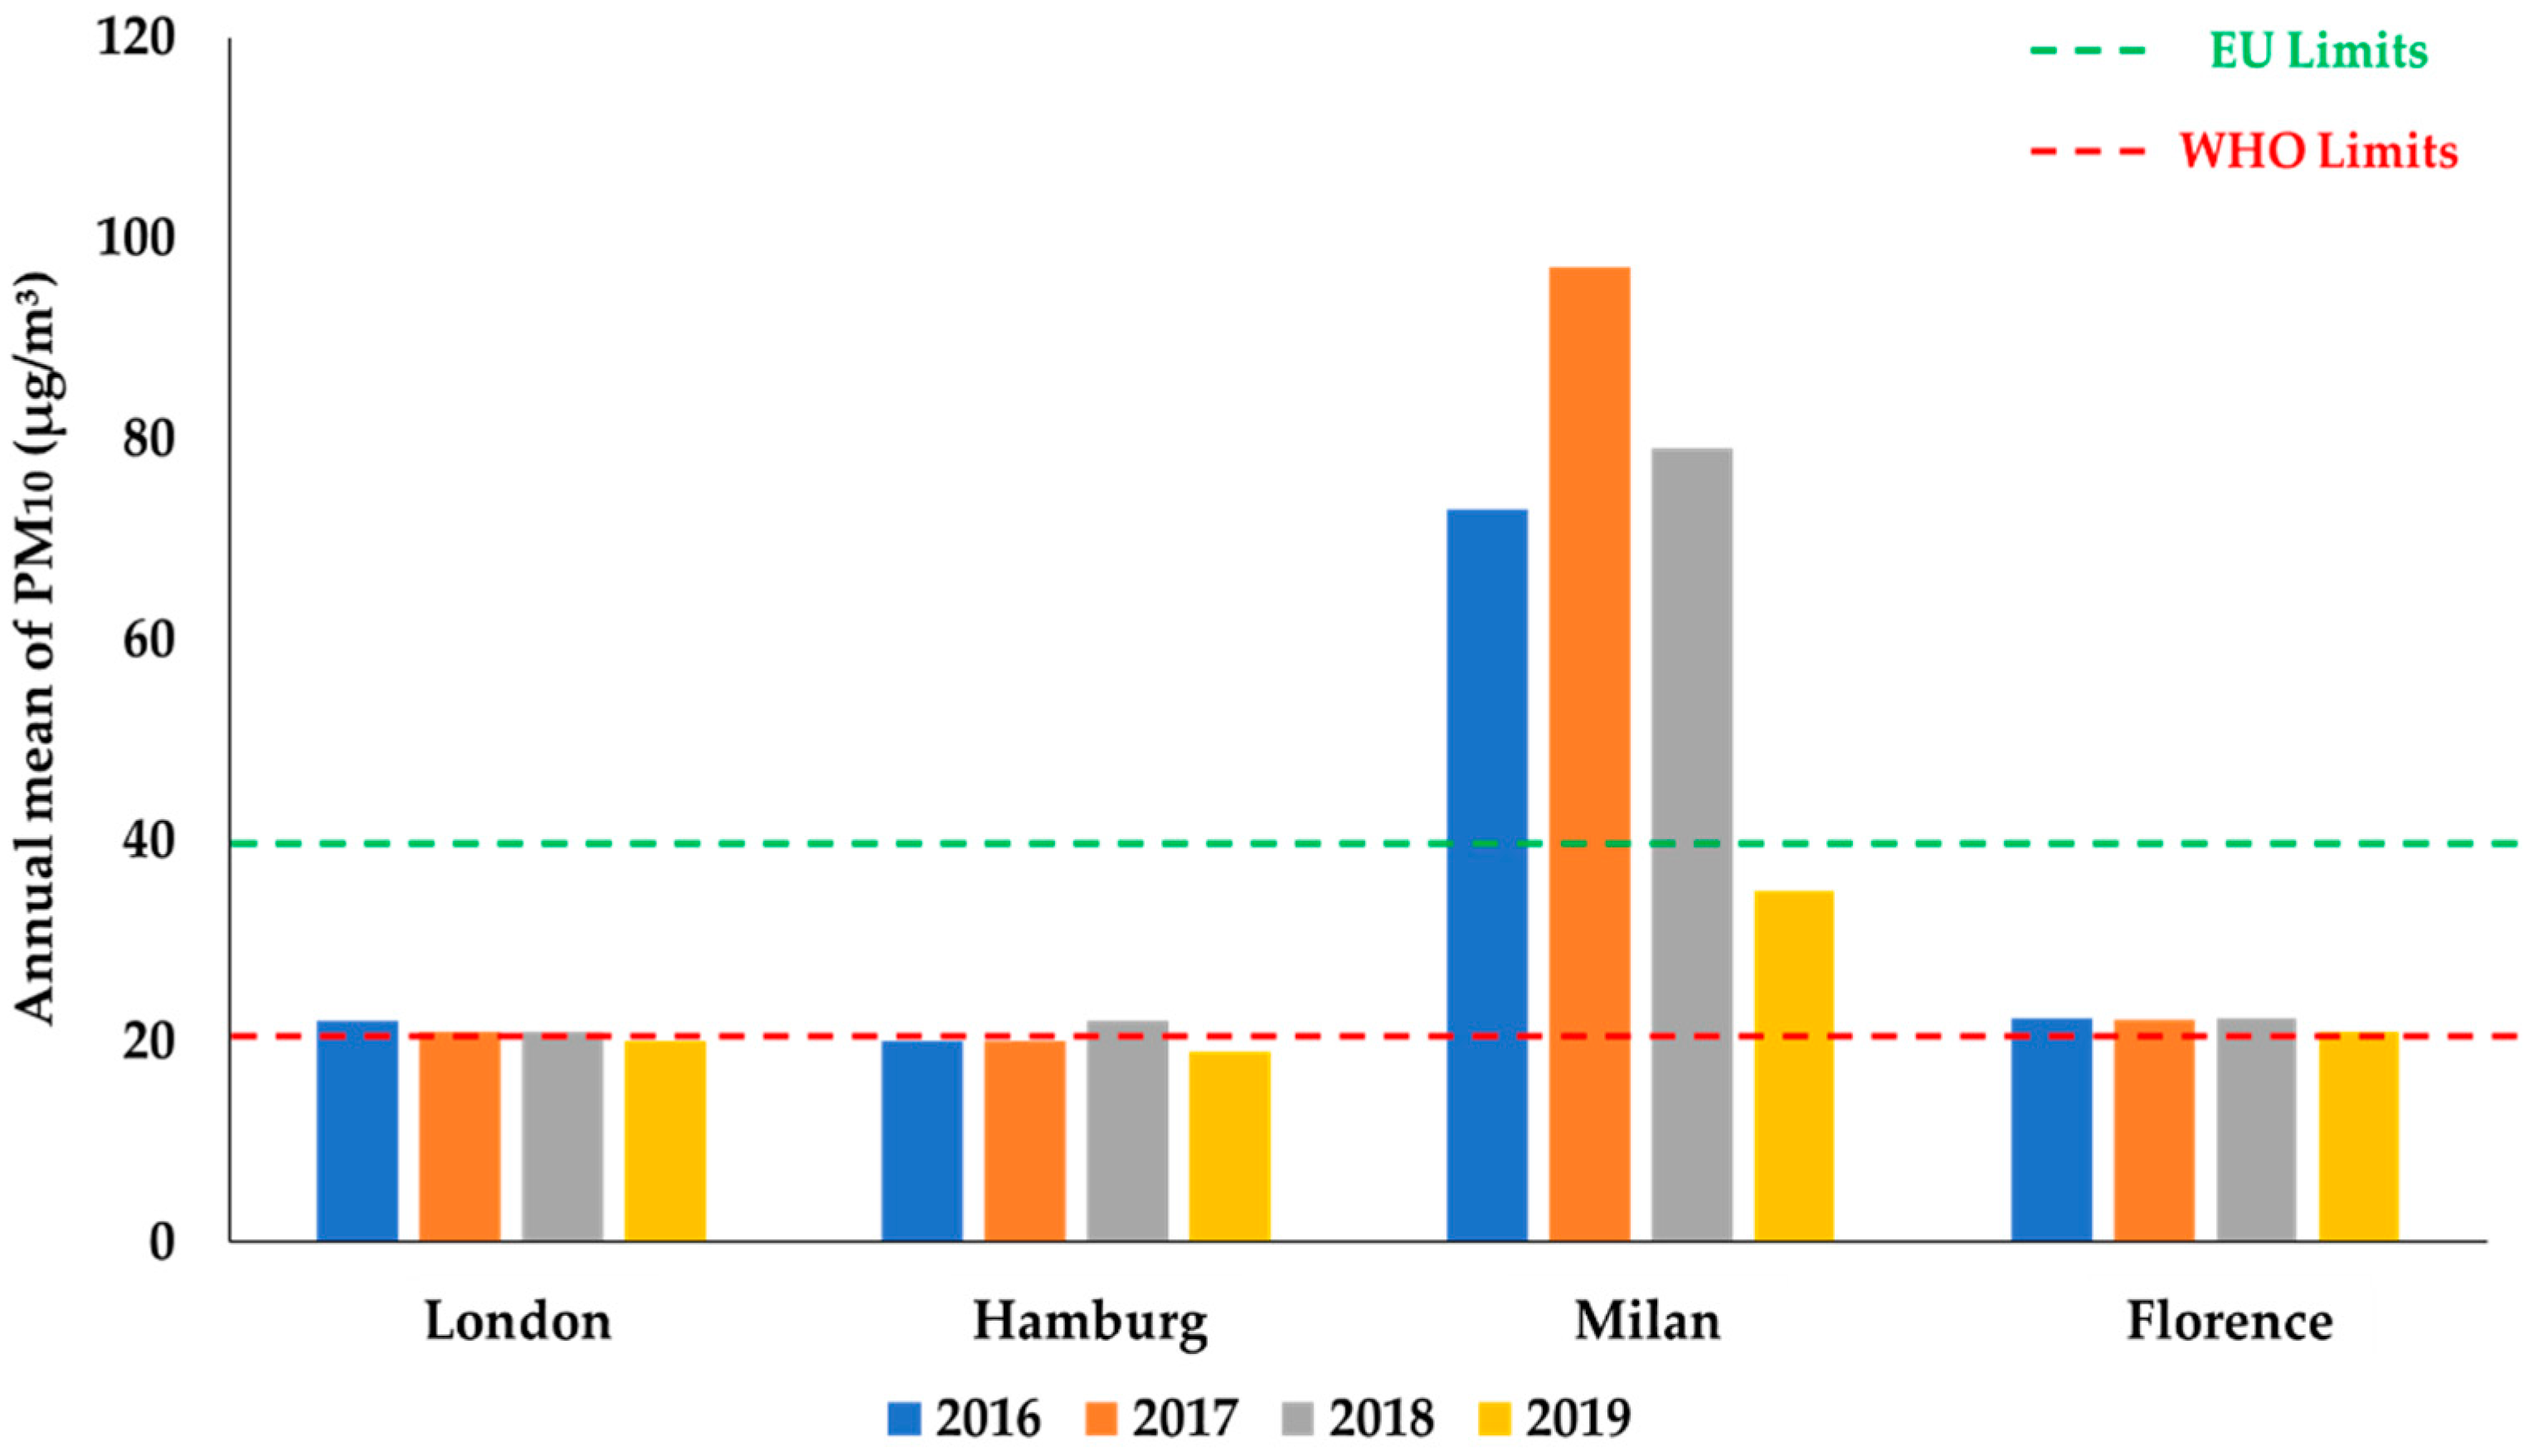
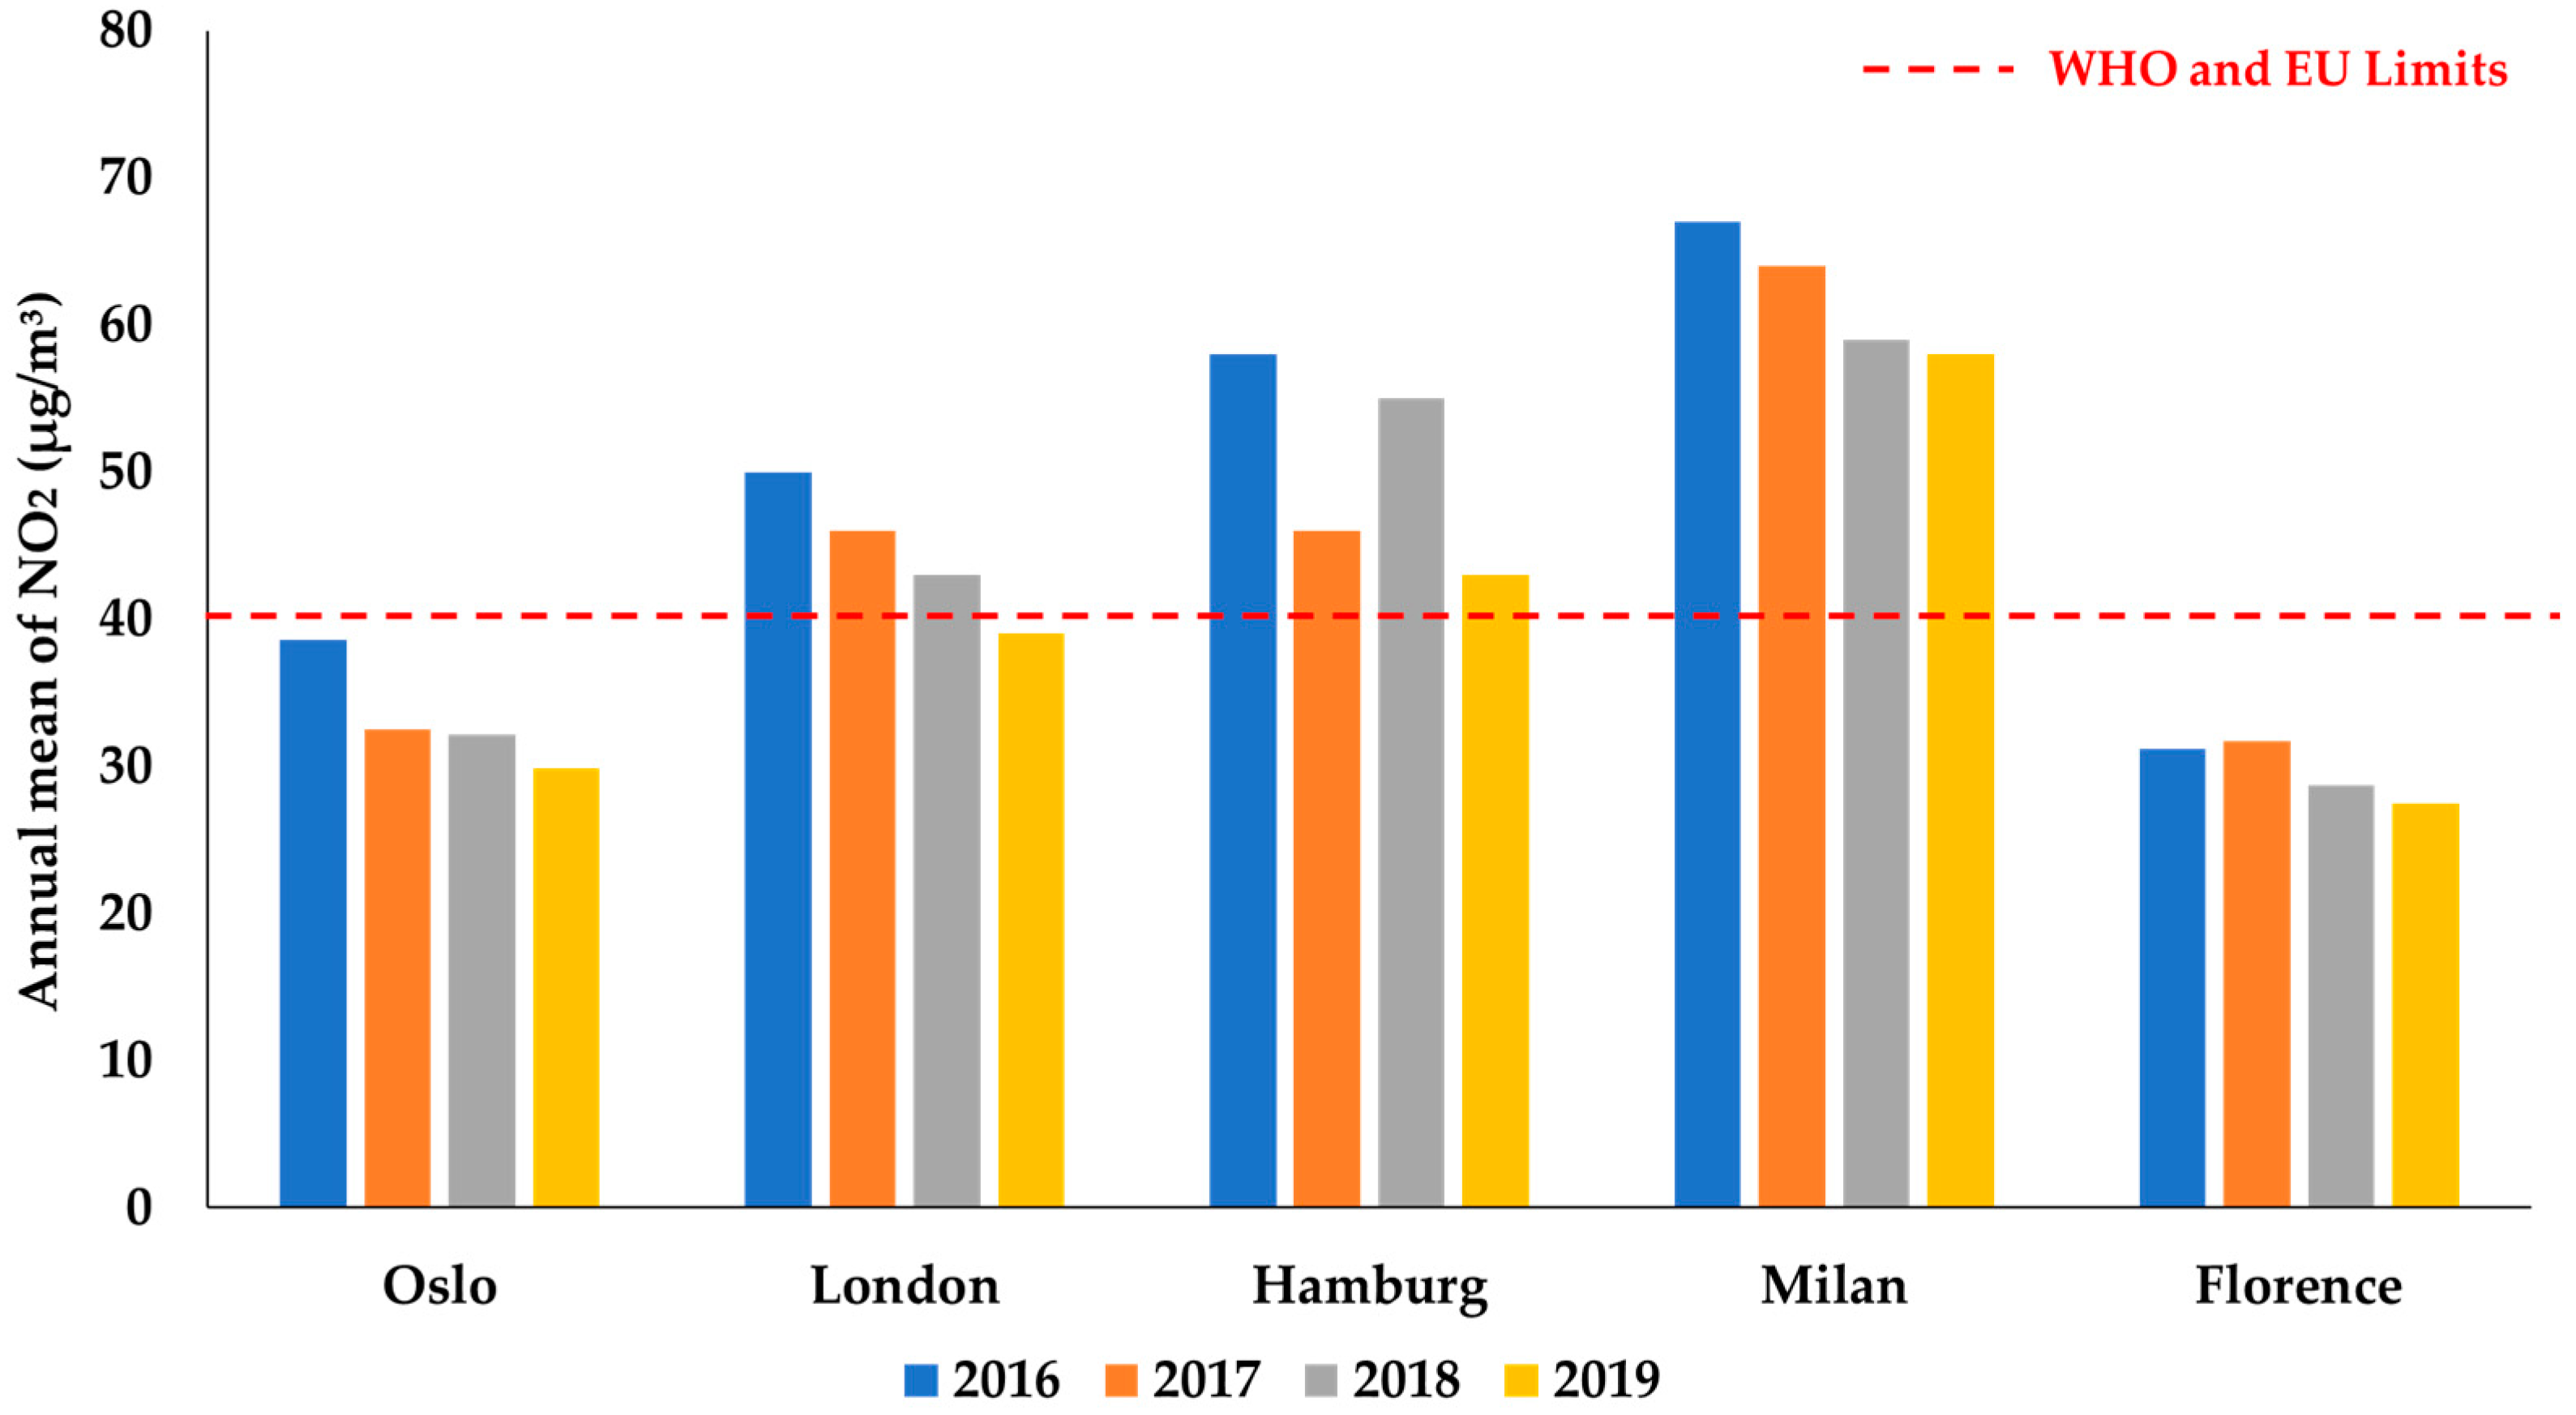
Table 1.
Percentage change in charging stations and electric cars in Italy, September 2019–September 2020 [59].
Table 1.
Percentage change in charging stations and electric cars in Italy, September 2019–September 2020 [59].
| Δ Charging Station | Δ Electric Cars | |
|---|---|---|
| Northwest | +66% | +182% |
| North East | +118% | +151% |
| Centre | +42% | +132% |
| South | +29% | +188% |
| Islands | +44% | +259% |
| Total | +130% | +157% |
Table 2.
Regional distribution of charging stations and electric cars in Italy, September 2020 [67].
Table 2.
Regional distribution of charging stations and electric cars in Italy, September 2020 [67].
| Total Charging Columns (Data at 30 September 2020) | Electric Cars Registered in 2020 (Data at 30 September 2020) | |
|---|---|---|
| Northwest | 30% | 28% |
| North East | 26% | 41% |
| Centre | 26% | 24% |
| South | 10% | 4% |
| Islands | 8% | 3% |
Table 3.
Summary of the objectives, approaches and strategies of the six cities considered.
| Oslo | London | Hamburg | Milan | Florence | Bologna |
|---|---|---|---|---|---|
| Planning and Action Documents | |||||
| The Climate and Energy Strategy (2016) [70,71] | London Environmental Strategy (2018) [95] | Master Plan of Public Charging Infrastructure (2014) [104] | Urban Plan of Sustainable Mobility (PUMS) (2018) [114] | Urban Plan of Sustainable Mobility (PUMS) (2019) [128] | Urban Plan of Sustainable Mobility (PUMS) (2019) [133] |
| National Transport Plan (2017) [72] | Hamburg Climate Plan (2015, 2019 updated) [105] | ||||
| Hamburg Climate Protection Act (2020) [107] | |||||
| Goals | |||||
| GHG emissions reduction of 50% by 2020, 95% by 2030, zero by 2050 | Zero emissions from the GLA car fleet by 2025, those of bus fleets by 2037, those of most public transport by 2040, those of all means of transport by 2050 | CO2 emissions reduction of 55% by 2030, zero by 2050 | CO2 emissions reduction of 45% by 2030, become carbon neutral by 2050 | CO2 emissions reduction of 40% by 2030, 70% by 2050 | CO2 emissions reduction of 40% by 2030 |
| Become climate neutral | Become the European ULEVs capital | Become climate neutral | Become the European e-mobility capital | ||
| Approaches | |||||
| Ban any type of car in the city centre from 2019 | Creation of an ULEZ which from 2021 will be expanded (from 21 km2 current to 319 km2) | Electrification of the public transport fleet (buses and taxis) | Congestion charge, Area C (which will be transformed into a zero-emission zone) | Increase in public charging points | “Environmental LTZ” by 2030 will allow access to electric vehicles only |
| Ban on motor vehicles by 2025 | Recognition of limiting global warming as a national goal within the Hamburg state constitution | Replacement of diesel and petrol buses with fully electric buses (80% by 2028, 100% by 2030) | Granting of new licences to electric taxis | Electrification of PA fleet and public transport by 2030 | |
| Full electric public transport by 2030 | Strenghtening public-private partnership | Replacement of diesel/petrol bus fleet with electric buses | 60% of the new tenders sharing reserved to electric mobility | ||
| Impacts | |||||
| Increased walkability | Reduction in private car travel | Complementarity between electric and combustion taxis | Incentive in the use of public transport | Creation of an electric mobility culture | Incentive in the use of public transport |
| Savings in energy use | Increased demand for public transport | Improvement of taxi usage habits | Improving the image of the city | ||
| Possible Opportunities | |||||
| Invest in cycle paths, reduction of carriageways, extension of sidewalks | Invest in car sharing, bike sharing, cycle paths | Reduction of parking spaces that could be transformed into cycle paths, leading to the creation of environmental and pedestrian zones | Transform area C into a residential area | Involvement in European calls | Rethink the entire historic centre with a view to very low-emission cars |
| Investment of resources in communication | In the long run, transform the historic centre into a large pedestrian area | ||||
| Involvement of private partners | |||||
Publisher’s Note: MDPI stays neutral with regard to jurisdictional claims in published maps and institutional affiliations. |
© 2021 by the authors. Licensee MDPI, Basel, Switzerland. This article is an open access article distributed under the terms and conditions of the Creative Commons Attribution (CC BY) license (http://creativecommons.org/licenses/by/4.0/).
Share and Cite
MDPI and ACS Style
Ruggieri, R.; Ruggeri, M.; Vinci, G.; Poponi, S. Electric Mobility in a Smart City: European Overview. Energies 2021, 14, 315. https://doi.org/10.3390/en14020315
AMA Style
Ruggieri R, Ruggeri M, Vinci G, Poponi S. Electric Mobility in a Smart City: European Overview. Energies. 2021; 14(2):315. https://doi.org/10.3390/en14020315
Chicago/Turabian StyleRuggieri, Roberto, Marco Ruggeri, Giuliana Vinci, and Stefano Poponi. 2021. "Electric Mobility in a Smart City: European Overview" Energies 14, no. 2: 315. https://doi.org/10.3390/en14020315
Note that from the first issue of 2016, this journal uses article numbers instead of page numbers. See further details here.