
The Economic Effects of Electromobility in Sustainable Urban Public Transport


Faculty of Engineering and Economics of Transport, Maritime University of Szczecin, 1-2 Wały Chrobrego St., 70-500 Szczecin, Poland
*
Authors to whom correspondence should be addressed.
Energies 2021, 14(4), 878; https://doi.org/10.3390/en14040878
Submission received: 5 January 2021
/
Revised: 2 February 2021
/
Accepted: 4 February 2021
/
Published: 8 February 2021
(This article belongs to the Special Issue New Perspectives and Challenges in Traffic and Transportation Engineering Supporting Energy Saving in Smart Cities)
Abstract
:This paper focuses on effects of implementing zero-emission buses in public transport fleets in urban areas in the context of electromobility assumptions. It fills the literature gap in the area of research on the impact of the energy mix of a given country on the issues raised in this article. The main purpose of this paper is to identify and analyse economic effects of implementing zero-emission buses in public transport in cities. The research area was the city of Szczecin, Poland. The research study was completed using the following research methods: literature review, document analysis (legal acts and internal documents), case study, ratio analysis, and comparative analysis of selected variants (investment variant and base variant). The conducted research study has shown that economic benefits resulting from implementing zero-emission buses in an urban transport fleet are limited by the current energy mix structure of the given country. An unfavourable energy mix may lead to increased emissions of SO2 and CO2 resulting from operation of this kind of vehicle. Therefore, achieving full effects in the field of electromobility in the given country depends on taking concurrent actions in order to diversify the power generation sources, and in particular on increasing the share of Renewable Energy Sources (RES).
1. Introduction
Electromobility is a vital area addressed in the economic and environmental context by individual countries worldwide. In recent years, it has gradually been gaining importance also in the area of transport, in particular road transport. The issues addressed in relation to road transport pertain to climate change mitigation, local air pollution reduction, and decreasing the dependence on foreign oil [1]. This results from the fact that the transport system is one of the biggest sources of global greenhouse gas (GHG) emissions [2,3] as well as ensuing climate changes and illnesses [4]. Transport stands for nearly 25% of Europe’s GHG emissions and is the main source of air pollution in urban areas [5]. What is important is that, out of all modes of transport, road carriage is the biggest emitter of pollutants, accounting for over 70% of all GHG emissions generated by transportation systems in Europe [6].
In connection with the negative impacts of air pollution on human life and health as well as the whole ecosystem, emissions of air pollutants from transport need to be drastically reduced without delay [5]. In answer to the challenge, Europe has proposed a shift to low-emission mobility. Pursuant to “A European Strategy for Low-Emission Mobility” (ESLEM) of 2016, three areas of actions have been distinguished in relation to transport: optimising and improving efficiency of the transportation system, increasing the use of low-emission energy, and the share of zero-emission vehicles in the total number of vehicles [5]. It should be noted that important elements of those measures include adoption of zero-emission technologies in relation to city buses. The document also underlines that public procurement undertaken by local authorities constitutes an important tool to create markets for innovative solutions, and it should be applied to create the demand for zero-emission vehicles [5].
Cities are still the places of the increasing concentration of the global population [7], rising numbers of road vehicles, and consequently increased air pollution and ensuing negative impacts on inhabitants’ health [8]. In view of such risks, urban public transport—in particular urban public bus transport—constitutes an important area for implementing and developing electromobility in transport. According to the data provided in the literature, an electric bus reduces petroleum consumption by 85–87% compared to a diesel bus and achieves a 32–46% reduction in fossil fuel use as well as a 19–35% reduction in CO2 emissions, from a life-cycle perspective. A cleaner power grid and an increase in system charging efficiency would enhance the future benefits resulting from implementation of electric buses [9] in urban fleets. It is also important that urban buses are identified as a prioritised group of vehicles for electrification, as they have regular routes, so they can utilise smaller batteries and it is easier to plan charging infrastructures for them [10].
In order to promote a wider use of electric vehicles, not only by private, but to a large extent also by public users, various kinds of programmes and legal regulations are adopted on both international and national level. In Poland, the key legal act in that respect is the Electromobility Development Program [11] and the resulting Act of 11 January 2018 on Electromobility and Alternative Fuels (AEAF) [12]. The main goal of the Act is to set up a legal framework for development of electromobility and making use of other alternative fuels in national transport systems. Moreover, and particularly important for the purpose of this paper, AEAF identifies the detailed obligations of local governments and conditions (type, time horizon, quantity) for implementing zero-emission buses to any urban public transport fleet.
In view of the above, the topic addressed in this paper is both current and important. The main purpose assumed for this paper was to identify and analyse economic effects of implementing zero-emission buses in urban public transport, based on the example of the city of Szczecin, Poland. The study assumed the number and type of zero-emission vehicles in accordance with the provisions specified in AEAF [12]. The area of research was the city of Szczecin, Poland. The research was conducted based on the source data as of the end of 2018, projected up to 2035.
In view of the purpose of the study, three research hypotheses were adopted:
Hypothesis 1 (H1).
Implementation of zero-emission buses is an important tool to reduce external costs generated by urban public transport fleets.
Hypothesis 2 (H2).
Economic benefits resulting from implementing zero-emission buses in urban public transport in Szczecin are limited by the current energy mix structure in Poland.
Hypothesis 3 (H3).
Achieving full effects of electromobility in Poland as a result of implementing zero-emission buses in urban transport fleets depends on taking concurrent actions aimed at diversifying the sources of power generation in Poland (changing the energy mix), including in particular a wider use of Renewable Energy Sources (RES).
The rest of this article is divided in a specific order. Section 2 focuses on the literature review, addressing issues of sustainable urban transport, pollution, electromobility in transport, and transport solutions aimed at shifting to low-emission mobility. Section 3 presents the individual stages of the research process; it also specifies the applied methods and data sources. Section 4 contains characteristics of the research area—the city of Szczecin, with a particular focus on its public transport system. Section 5 presents the research results regarding the financial and economic effects of implementing zero-emission vehicles in the public bus fleet in Szczecin. The calculations were made taking into account the legal requirements imposed on Polish cities by AEAF, assumptions presented in “Blue Book. Public transport sector in cities, agglomerations and regions” of 2015 (BB2015) [13], the current energy mix in Poland, the data regarding the public bus fleet structure in Szczecin, and the results of research studies completed by Pietrzak and Pietrzak [14] regarding volumes of pollutant emissions generated by the public transport in Szczecin. Section 6 presents a discussion of the findings obtained in the research process. The last section contains conclusions that summarise the findings.
The research results presented in this paper are part of a wider scope of research studies carried out by the authors with regard to effects of implementing electromobility in urban public transport in Polish cities. The calculations of the projected emissions of NHMC/NMVOC, NOx, PM, SO2, and CO2 in Szczecin in the years 2021–2035, being relevant information for the research process carried out for the purposes of this paper, were made by Pietrzak and Pietrzak [14].
2. Literature Review
Urbanisation is one of the most significant global change processes [15]. The number of people living in urban areas has been rising, and the urban population is forecast to continue growing. It is estimated that in 2018 over 55% of the world population lived in cities, and the percentage is expected to rise to 60% by 2030 [16]. The phenomenon results in increased traffic flows in urban areas, generated by both passenger and freight transport. The increase in the number of vehicles in urban areas leads to negatives impacts for both people and the environment.
According to Tang et al. [17], traffic is one of the most important air pollution sources in urban areas. Traffic congestion, along with its harmful impacts on people’s health, the economy, and the environment, constitutes a major problem faced by metropolitan areas [18]. Provision of transport services is connected with considerable emissions of harmful substances which include NOx, CO, CO2, PM10, PM2.5, SO2 [19,20,21,22,23]. Numerous studies point to a relationship between traffic air pollution and various diseases, such as asthma, COPD/chronic bronchitis, cardiovascular disease, and acute changes in blood pressure [24,25,26,27].
Moreover, the fast growth of demand for transport services, in terms of both passenger and cargo flows, has a direct effect on the number of road accidents and their outcomes [28,29,30], increased noise and vibrations [31,32], uncontrolled land consumption [33,34], and residents’ life quality. A major problem in that respect is that internal combustion engine vehicles (ICEVs) still dominate the transport services market, and transport remains very dependent on oil—oil-derived fuels account for 95% of energy consumption in transport [35].
Therefore, policy makers must develop feasible strategies to reduce GHG emissions [2], and it is not surprising that development of electromobility is a priority in transport policies of many European countries [36]. Electromobility, as a viable alternative for conventional vehicles, has been gaining importance throughout the EU [37]. According to Sarigiannis et al. [38] promoting “green transport” in cities via, inter alia, making use of electric vehicles, may provide considerable monetary savings resulting from decreased exposure to pollutants such as PM10, PM2.5, NO2. In its broad sense, electromobility becomes an important element in building sustainable transport systems in urban areas. It may be considered one of the vital tools to be used in measures taken in order to reduce the negative impacts of transport on the environment [39]. The significance of electromobility is shown by the EU documents. These include: ESLEM, the White Paper 2011 “Roadmap to a Single European Transport Area—Towards a competitive and resource efficient transport system” (WP2011), and the Green Paper—Towards a new culture for urban mobility of 2007 (GP2007).
The document that specifies the principles of implementing electromobility in Poland is AEAF. AEAF is a national legislative instrument regulating the area of changes proposed by the EU, aimed at reducing the negative environmental impacts of road transport. It is aimed at stimulating the development of electromobility and wider use of alternative fuels in the Polish transport sector. AEAF specifies, inter alia, the principles of development and functioning of the infrastructure for making use of alternative fuels in transport, indicates the duties of public entities with regard to developing alternative fuel infrastructures or clean transport area functioning.
AEAF specifically addresses services connected with public transport. The document stipulates that Local Government Units (LGUs) are obliged to provide public transport services or outsource them to an entity with a fleet where the share of zero-emission buses operated within the given LGU is at least 30%. As the process of purchasing zero-emission vehicles may be costly and time-consuming, the provisions of AEAF stipulate that increasing the share of zero-emission vehicles in the fleet will be phased. The percentage of such vehicles in the fleet of individual LGUs should be [12]:
- 5% from the beginning of the year 2021,
- 10% from the beginning of the year 2023,
- 20% from the beginning of the year 2025,
- 30% from the beginning of the year 2028.
In the context of the studies completed as part of the research project, it is important that AEAF explicitly defines the concept of “zero-emission bus”. Pursuant to its provisions, a zero-emission bus is a vehicle powered exclusively by electric power produced in hydrogen fuel cells installed in the vehicle or exclusively by an engine whose operating cycle does not lead to emissions of any greenhouse gases or any other substances covered by the GHG emissions management system. Pursuant to AEAF, the definition of “zero-emission bus” excludes CNG/LNG and hybrid vehicles.
According to Melkonyan et al. [40], urbanisation trends and the increasing demands of urban mobility create new challenges for urban planners. Therefore, it is necessary to develop integrated and sustainable urban mobility policies. Transportation management strategies aimed at reduction of air pollution, according to Pinto et al. [41], may contribute to building sustainable cities in the future.
Environmental sustainability is a requirement for modern urban freight transport systems [42], as well as modern urban public transport systems. In view of the above, in urban areas it is possible to notice that numerous, innovative solutions are introduced successively, which are aimed at providing mobility while accounting for the economy, environment, and human life. The solutions may also pertain to vehicles, infrastructure, or changes in habits of transport system users.
In the case of Sustainable Urban Freight Transport (SUFT), the main idea is to reduce freight traffic in the city centre. A popular solution in that respect is organising local Urban Consolidation Centres (UCCs) [43,44,45], located outside city centres, from which deliveries may be made via, among other things: Electric Freight Vehicles (EFVs), Light Electric Freight Vehicles (LEFVs) [46,47,48,49,50], Small Sized Electric Vehicles (SEVs) [51], or e-cargo bikes [52]. The tasks completed by these vehicles may also be supported by a vehicle category called Non-Motorised Transport (NMT), including cargo bikes/cargo cycles [53,54], cycle rickshaws, or handcarts [55]. Even though in the literature there are studies analysing the possibility of using rail transport to handle cargo flows [56,57,58], in practice its use is still significantly limited. This results mainly from the specific features of this mode of transport. The use of trams in serving urban cargo flows is also limited [59,60].
As for Sustainable Urban Public Transport (SUPT), it is also necessary to mention all the organisational and infrastructural measures aimed at limiting individual mobility in favour of public transport. Such solutions include, e.g., Park&Ride car parks [61,62,63,64,65] or Bike&Ride facilities [66,67,68]. The Bike&Ride solution is very often supported by municipalities that set up a public system of bike rentals as part of a Bike-Sharing System (BSS) [69,70,71,72]; it is more and more often also supplemented by an Electric Scooter Sharing system [73,74]. Municipalities also actively engage in promoting public transport, e.g., via providing Free Fare Public Transport (FFPT) [75,76] and taking organisational measures to favour public transport, such as e.g., dedicated lanes for buses, trams, or light rail [77,78] or designating Low Emission Zones (LEZs) [79,80] and Zero Emission Zones (ZEZs) in city centres [81]. Research studies show that significant positive changes regarding environmental protection in urbanised areas may also be provided by ecodriving [82,83,84,85] as well as appropriate organisation and multimodal integration of passenger transport, including the special role to be played by rail transport [86,87].
The European transport policy assumes that transport systems that are organised should respect the sustainability principles. Shifting to a more sustainable mobility system is perceived as the main challenge for the decades to come, if we want to avoid or at least mitigate the harm done by transport [88]. According to Dyr et al. [89], applying alternative fuels on a wider scale may be the fundamental instrument of that policy.
In the case of passenger transport, an important measure aimed at mitigating negative effects of transport and reducing the consumption of fossil fuels is replacing the currently used public transport diesel buses with alternative vehicles. These include hybrid buses, Compressed Natural Gas (CNG) and Liquefied Natural Gas (LNG) buses, Fuel Cell Vehicles (FCV), and electric buses.
Hybrid vehicles may be classified as ICEVs which in order to reduce pollutant emissions are additionally equipped with a supporting electric engine. As shown in the studies carried out by Tzeng et al. [90], vehicles of this type may constitute a significant alternative to conventional buses, particularly for the time of improving the electric vehicle technologies. It is worth noting some research studies regarding the potential possibilities of reducing harmful substances emissions via providing fleets with this type of vehicles. The results of such studies are presented, e.g., in Xu et al. [91], Lijewski et al. [92], Hallmark et al. [93], and Pawełczyk & Szumska [94].
Other types of vehicles that form an alternative to diesel buses are CNG and LNG vehicles. The benefits and limitations of using CNG buses are shown in the studies completed by, inter alia, Milojevic et al. [95], Ivković et al. [96], Merkisz et al. [97], Yue et al. [98], and Tica et al. [99]. The study done by Dyr et al. [100] shows interesting results of the analysis of costs and benefits of using CNG buses in public transport, whereas Jurkovič et al. [101] analysed the possibility of decreasing the chosen environmental indicators by introducing LNG buses into bus transport.
Promising results with regard to reducing negative effects of transport may also be provided by using FCVs. In this case, it is worth consulting the studies performed by Zhang et al. [102], Hua et al. [103], Lee et al. [104], or Langford & Cherry [105]. Relevant data for studying this issue may also be found in the results of technical reports published by Eudy and Post [106,107,108].
From the point of view of the main subject of this paper, its goals and the variants being the object of detailed analysis, it is electric buses that may be an exceptionally important solution and a viable alternative to diesel buses. The literature provides a number of studies related to application of electric buses to handle passenger transport in cities. The issues related to electric vehicle operation were addressed by, inter alia, Mahmoud et al. [109], Quarles et al. [110], Kivekas et al. [111], or Logan et al. [112].
Based on the studies completed in several Swedish cities, Borén [113] estimated the social costs savings resulting from operating electric buses in the cities. In view of the limited driving range of electric buses, Kunith et al. [114] analysed various ways of battery charging, indicating advantages and disadvantages of each of the described solutions. In relation to the problem, Csiszár et al. [115] pointed out that convenient locations for EV charging were P&R areas, whereas Chao and Xiaohong [116] presented a model to optimise the electric bus scheduling. Problems related to optimal charging of bus batteries were also studied by Czerepicki et al. [117]. With regard to electric buses operation, it is also important to analyse battery longevity and battery use optimisation. The ones worth mentioning include papers published by Astaneh et al. [118] or Logan et al. [119].
In the context of analysing how zero-emission buses operate, it is also worth considering trolleybuses which have long been functioning in urban areas. Studies focusing on this type of buses were completed by, inter alia, Zavada et al. [120], Wołek et al. [121,122], or Bartłomiejczyk & Połom [123]. Interesting research results pertaining to operation of this type of vehicle were also obtained by Dziubinski et al. [124], Grygar et al. [125], and Jakubas et al. [126].
Other valuable studies include comparative analyses of effects of operating various types of buses. These include studies carried out by Correa et al. [127,128], Stempien and Chan [129], Misanovic et al. [130], Imam et al. [131], and Tzeng et al. [90]. The last of the studies is also a very valuable, concise description of each type of city bus available on the market.
Even though there are numerous studies regarding operation of buses being an alternative to diesel buses, they often ignore the impact of the current energy mix of a given country on the assumed financial and economic results of implementing the alternative solution. The studies completed as part of the research project described in this paper have shown that the energy mix of a given country may significantly limit the economic benefits resulting from purchasing and operation of electric buses. Moreover, full achievement of assumed electromobility goals depends on taking concurrent actions to diversify the sources of power generation in Poland (changing the current energy mix), including in particular increasing the share of Renewable Energy Sources (RES). Therefore, this article fills the existing literature gap.
3. Methods and Study Stages
The research process was carried out in several subsequent stages, where each of them took into account the results of the previous ones. The graphical presentation of the research process completed for the purposes of this paper is presented in Figure 1.
Stage 1 consisted in analysing the literature and legal acts specifying the research background in the electromobility area and the assumptions of the electromobility policy implemented on the international and national level. On completion of this stage, we specified the goals and assumptions of the electromobility policy in relation to the public transport in Poland.
Stage 2 included the analysis of the public transport system in the city of Szczecin, and the analysis of alternative solutions available on the market, which could be used instead of diesel buses: hybrid buses, CNG/LPG buses, hydrogen buses, electric buses. The outcome of this stage was defining the fleet renewing variant (V0) and investment variant (V1), as well as a partial urban bus fleet replacement schedule in Szczecin.
Taking into account the outcomes of stages 1 and 2 as well as the study results obtained by Pietrzak and Pietrzak [14] with regard to the forecast pollution and noise levels in Szczecin for the years 2020–2035, Stage 3 focused on the financial and economic study of the effects of replacing the urban bus fleet with electric vehicles in the research area—the city of Szczecin. The analysis was completed in two steps. First, based on the costs of purchase and operation of urban buses in Szczecin calculated for variant V0 and variant V1 respectively as well as the difference (V1 − V0), we computed the financial flows and then the Financial Net Present Value (FNPV) ratio. Next, based on the costs of pollution and noise emissions generated by urban buses in Szczecin calculated for variant V0 and variant V1 respectively as well as the difference (V1 − V0), we calculated the economic flows and then the Economic Net Present Value (ENPV) ratio. The last part of the research carried out as part of Stage 3 covered the discussion of the results and the formulation of the conclusions.
The case study, for the purposes of the research carried out to prepare this paper, covered the city of Szczecin, Poland. The materials obtained from the following sources constituted the source data for the study:
- Szczecin City Hall (SCH),
- Roads and Public Transport Authority in Szczecin (RPTAS),
- Bus transport operators providing public transport in Szczecin: Szczecińskie Przedsiębiorstwo Autobusowe “Klonowica” Sp. z o.o. (SPAK), Szczecińskie Przedsiębiorstwo Autobusowe ”Dąbie” Sp. z o.o. (SPAD), Szczecińsko-Polickie Przedsiębiorstwo Komunikacyjne Sp. z o.o. (SPPK) and Przedsiębiorstwo Komunikacji Samochodowej w Szczecinie Sp. z o.o. (PKS)
- Tram transport operator providing public transport in Szczecin Tramwaje Szczecińskie Sp. z o.o. (TS).
The study was conducted based on the source data as of the end of 2018, projected up to the year 2035.
Moreover, conducting the research for the purposes of this paper required some knowledge about the EU electromobility policy and legal regulations on implementing electromobility in Poland. The legal regulations pertain in particular to: the kind of zero-emission vehicles, the share of zero-emission vehicles in the public transport fleet, and deadlines for meeting the individual objectives of electromobility. The sources of data in this respect were: AEAF, Electromobility Development Plan for Poland: “Energy for the Future” of 2017, BB2015, ESLEM, WP2011, and GP2007.
In view of the provisions of AEAF, in Section 5 of this paper we specify the number (prescribed by the law) of zero-emission buses that must be purchased by a LGU (i.e., the city of Szczecin), the time limits for purchasing the specific number of zero-emission vehicles by the city of Szczecin, and we select the purchase options.
Moreover, it should be noted that AEAF also stipulates how any LGU should justify the need for replacing a part of the public transport fleet with zero-emission vehicles. AEAF indicates the need for LGUs to carry out a financial analysis, estimation of environmental effects in connection with emissions harmful for the natural environment and human health, and an economic analysis that includes estimation of costs related to harmful substances emissions [12]. The computations made by the Authors for the research area in Section 5 of this paper comply with the AEAF requirements in that respect. Additionally, the volumes of pollutants emitted by internal combustion and zero-emission buses were calculated using the tool “Calculator of pollutant emissions and climate costs for public means of transport—Excel spreadsheet”, unified for transport projects, developed and made available by the Centre for EU Transport Projects (CEUTP). The detailed results were published by Pietrzak and Pietrzak [14]. The results also constituted the source of data for the purposes of the financial and economic study of the effects of replacing the urban bus fleet with electric vehicles in the city of Szczecin, performed as part of this research project.
4. Characteristics of the Research Area
The area of research for the purposes of this paper was the city of Szczecin, Poland. Szczecin is located in the north-west of Poland. It is the biggest city in the West Pomerania region both in terms of the surface area and the population size. Szczecin is also the capital city of the West Pomerania Voivodeship and the centre of the Szczecin Metropolitan Area (SMA). According to the statistical data as at 31 December 2019, Szczecin took up a surface area of 301 km2, and its population amounted to 401,907 [132].
In the context of the issues addressed in this paper, the object of the analysis was the urban public transport system in Szczecin, with a particular focus on bus transport. Public transport service within the city area (which falls within the municipality’s scope of duties) is provided on the basis of the provisions of the Act of 16 December 2010 on Public Collective Transport (APCT) [133] and of the Act of 8 March 1990 on Local Self-Government (ALSG) [134]. Pursuant to APCT, a municipality is responsible for organising its public collective transport and to this end it performs the three basic tasks: planning the transport development, organising the public collective transport, and managing the public collective transport [133]. On behalf of the Municipality of Szczecin, RPTAS (as an entity established for this purpose) acts in the capacity of the public transport organiser. Within the area of the city of Szczecin, public transport uses two kinds of vehicles: trams and buses. Public transport services within the city of Szczecin are provided on the basis of agreements concluded with RPTAS by the following five operators: TS, SPAK, SPAD, SPPK and PKS.
Moreover, rail connections are planned to be commissioned in 2022 as part of the Szczecin Metropolitan Railway (SMR) system [135]. Due to the well-developed rail network infrastructure within the city of Szczecin, in addition to connections between Szczecin and the adjacent localities being part of the SMA, SMR will also be used as an urban rail service that makes it possible for the city residents to move between individual districts of Szczecin. Thus, the public transport services in the SMA and the city of Szczecin itself will be extended to offer passengers the possibility of using rail to move about the city.
In view of the purpose of this paper, the public bus fleet operated in Szczecin was analysed. According to the 2018 data, the total number of vehicles operated by bus operators within the city of Szczecin was 296, of which 104 buses were used by SPAD, 102—by SPAK, 58—by SPPK and 32—by PKS. All the vehicles were internal combustion, compression-ignition engine vehicles using diesel fuel. An important aspect in the context of obtaining the research purpose was the analysis of the bus fleet structure in terms of the EURO pollution standards which define the permissible exhaust emissions limits for new vehicles. The detailed data in this respect are presented in Figure 2.
As shown by the data presented in Figure 2, the breakdown of public transport bus fleet operated in Szczecin is unfavourable in view of the EURO pollution standard. The analysed fleet consists of vehicles of all emission standard groups: from EURO 1 to EURO 6. Whereas the vehicles with the highest standard (i.e., EURO 6) accounted for merely ca. 16.5% of the fleet, the ones with the lowest emission standards (EURO 1, 2 and 3) constituted nearly 33% of all the bus fleet.
In the context of the purpose of this paper, it is also important to analyse the age structure of the bus fleet used in the public transport in Szczecin. The detailed data in this respect are presented in Figure 3. Based on the obtained data, the most numerous group (more than 32%) was the one where the buses were manufactured in the years 2009–2011, so they were aged 7–9 years in 2018. The buses from the two youngest groups—manufactured in the years 2012–2018, and thus aged 0–6 in 2018—constituted 24% of the fleet, the buses produced in 2003–2008 (aged 10–15 in 2018) accounted for slightly over 30% of the fleet, the buses dating back to 2000–2002 (16–18 years old)—ca. 10.5%, whereas the oldest vehicles which in 2018 were 19 and more years old accounted for 2.70% of the total fleet. The mean age of the buses used in public transport in Szczecin in 2018 was 10.11 years.
Taking into account the assumptions of the BB2015 [13] that the expected operation period of diesel buses is 10 years, the Szczecin bus fleet age structure indicates that it will be necessary to gradually replace some of the vehicles used in the city’s public transport system.
The structure of the bus fleet in question has a direct impact on the volume of pollutant emissions generated by the vehicles. Based on the data regarding the structure of the analysed bus fleet (type, EURO standard, age, size) and also the actual kilometrage data of each of the buses, the amount of pollutant emissions generated by the buses used in the public transport in Szczecin in 2018 was computed. The calculations were made using the tool “Calculator of pollutant emissions and climate costs for public means of transport—Excel spreadsheet”, unified for transport projects, developed, and made available by the CEUTP. The results are presented in Table 1.
5. Financial and Economic Study of the Effects of Replacing the Bus Fleet with Electric Vehicles in the City of Szczecin—Research Results
In view of the characteristics of the bus fleet operated in Szczecin (age and EURO standard), described in Section 4 of this paper, implementation of the investment process must be completed in stages so as to replace some of the vehicles with new ones. The need for partial replacement of the bus fleet in Szczecin is therefore compliant with the assumptions of AEAF which imposes an obligation to phase in zero-emission buses in public transport fleets.
In view of the purpose of this paper, the comparative analysis method was applied in order to compare effects of implementing two variants. The base (fleet renewing) variant of fleet replacement consisted in purchasing new diesel buses meeting the EURO 6 standard. For the purposes of the comparative analysis, the second variant was the investment variant which assumed making investments pursuant to the AEAF requirements. The application of the difference-based method made it possible to compare the financial and economic effects of both (fleet renewing and investment) variants. According to the Authors, comparing the two variants makes it possible to properly evaluate the economic effects resulting from implementing zero-emission buses in urban public transport in the research area.
When choosing the investment variant, four alternative solutions to diesel buses were considered: hybrid buses, CNG/LPG buses, hydrogen buses, electric buses. The choice was made based on the features of the particular solution (Table 2):
- technology—market experience (presence and prevalence of the technology on the national market),
- meeting the AEAF requirements (a particularly important feature as the legal act defines which vehicles are considered zero-emission vehicles in Poland).
When choosing the investment variant (V1), the following options were rejected:
- Hydrogen buses—as this technology is still not very wide-spread, this is connected with a risk that the fleet replacement will not be completed by the time limits specified in AEAF,
- CNG/LPG buses—as AEAF does not list this type of vehicles in the zero-emission vehicle group,
- Hybrid buses—as AEAF does not list this type of vehicles in the zero-emission vehicle group.
- In view of the above, the following two variants were the objects of further comparative studies:
- fleet renewing variant (V0)—it assumed that some of the diesel buses operated in the city would be replaced with new diesel buses meeting the strictest standards for ICEVs, namely EURO 6,
- investment variant (V1)—it assumed that some of the diesel buses operated in the city would be replaced with new zero-emission buses.
Pursuant to the provisions of AEAF, the authors computed the required share of zero-emission buses in the public transport fleet in Szczecin. Based on the quantity of vehicles (296 as at the end of 2018) it was assumed that the target share of the zero-emission vehicles (in 2028) should be no less than 30% of that quantity, i.e., minimum 89 vehicles. As already described in Section 3 of this paper, pursuant to the schedule specified in AEAF, the zero-emission vehicles may be phased in. For the purposes of the study, it was therefore assumed that the 89 vehicles would be purchased in tranches as described below, so that in each of the years specified by AEAF the city of Szczecin could put into operation a specific number of zero-emission vehicles:
- in 2021: 15 zero-emission buses will be commissioned,
- in 2023: 15 zero-emission buses will be commissioned,
- in 2025: 30 zero-emission buses will be commissioned,
- in 2028: 29 zero-emission buses will be commissioned.
Moreover, for the purposes of the research study it was assumed that the purchase of the buses as well as any indispensable supporting infrastructure (plug-in chargers and pantograph chargers) would each time be completed in the years directly preceding the years of commissioning the respective tranches of buses. Thus, the purchase items: “purchase of vehicles” and “purchase of supporting infrastructure” were planned for 2020, 2022, 2024 and 2027.
The other assumptions made for the purposes of the research study were:
- The vehicles to be replaced will come from only two bus operators: SPAK and SPAD. This is mainly connected with the routes of the specific bus lines. The point was to enable zero-emission buses to serve the routes that run through the city centre and districts characterised by considerable population density and building coverage ratio.
- The two categories of vehicles will be subject to replacement: MAXI buses—which are 10.5–13 m long and MEGA buses—exceeding 13 m in length.
- Based on the actual mean annual kilometrage of buses operated by the two bus operators: SPAK and SPAD (as at 2018), the estimated annual kilometrage for each new bus was: 59,994 km for SPAK and 69,491 km for SPAD.
- Based on the declarations made by manufacturers of the vehicles and infrastructure, data and experience of the operators, governmental, scientific and advisory bodies, as well as based on the observations of tender proceedings results in Poland, the estimated costs of purchasing new vehicles and infrastructure were as follows:
- ◦
- diesel bus MAXI (12 m)—PLN 1100 k,
- ◦
- diesel bus MEGA (18 m)—PLN 1400 k,
- ◦
- electric bus MAXI (12 m)—PLN 2200 k,
- ◦
- electric bus MEGA (18 m)—PLN 3000 k,
- ◦
- plug-in charger—PLN 100 k,
- ◦
- pantograph charger—PLN 500 k,
- ◦
- battery—PLN 500 k.
- Based on the declarations made by the vehicle manufacturers, the operators’ data and experience, also with regard to Polish cities already operating zero-emission buses (Warsaw, Krakow, Jaworzyna, Tarnów), the demand for energy was estimated as follows:
- ◦
- diesel bus MAXI (12 m)—37.5 L/100 km,
- ◦
- diesel bus MEGA (18 m)—47.2 L/100 km,
- ◦
- electric bus MAXI (12 m)—125 kWh/100 km,
- ◦
- electric bus MEGA (18 m)—150 kWh/100 km.
- The costs of purchase were estimated as follows: 1 litre of diesel fuel: PLN 4.24 net, 1 kWh of electric power: PLN 0.40 net.
As the research study was carried out for a selected Polish city, the calculations were made in the local currency, i.e., the Polish zloty (PLN). In the context of applying the research results to other European countries, it can be assumed that 1 PLN ≈ 0.22 euro.
Additionally, for the purposes of performing the financial and economic analysis, the following assumptions were made to account for the provisions of the BB2015 [13]:
- the analysis covers the 2020–2035 period,
- the analysis was based on fixed prices, without taking into account any inflation,
- the analysis was made in net prices, without taking into account any VAT,
- the analysis was carried out using the difference-based method, whereby the difference between the variant required pursuant to AEAF (V1—investment variant) and the base variant (V0—fleet renewing variant) was calculated.
As for the variable items of the operation costs, the differentiating costs were the costs of diesel fuel (for variant V0) and of electric power (for variant V1), whereas any other costs including tyre exchange, insurance or after-sale service were considered as ceteris paribus.
5.1. Financial Analysis
The first step taken as part of the financial study of effects of replacing the bus fleet with electric vehicles in the city of Szczecin was a comparative analysis of vehicle and supporting infrastructure purchase costs for variants V0 and V1 (Table 3). Based on the long-standing experience of bus operators as well as the assumptions resulting from the BB2015, it was assumed that the mean operation period of diesel buses was 10 years. Therefore, the analysis made for the years 2020–2035 for variant V0 also took into account the subsequent replacement purchases, namely in the years: 2030, 2032 and 2034. Due to lack of analogous data regarding the operation period of electric buses, the study was based on the data provided by the electric buses manufacturers and assumptions provided in the BB2015. It was assumed that the operation period of electric buses would be longer than in the case of diesel buses, and it may be similar to the assumed operation period for trolleybuses, i.e., up to 20 years. Therefore, in the analysis made for the years 2020–2035, in the case of variant V1 it was not necessary to take into account any subsequent replacement purchases of electric vehicles. However, other costs had to be taken into account; namely, it was necessary to consider the cost of plug-in and pantograph chargers. In the course of the operation period of the electric buses (after ca. 10 years) it is also necessary to purchase new batteries, which was included in the computations. This assumption was made on the basis of the first tender proceedings held in Poland with regard to a delivery of electric buses, where manufacturers offered a maximum 10-year guarantee for this piece of equipment.
While interpreting the results presented in the last column in Table 3, marked “V1 − V0”, it must be noted that a negative value in a given year means that the investment costs incurred for variant V1 were lower than the costs incurred for variant V0. A positive value, in turn, means that the investment costs incurred for variant V1 exceeded the analogous costs incurred for variant V0.
The second step taken as part of the financial study of effects of replacing the bus fleet with electric vehicles in the city of Szczecin was a comparative analysis of the new vehicles operation costs for variants V0 and V1 (Table 4).
As per the adopted time schedule resulting from the AEAF provisions, operation of the vehicles would start in 2021 (following the purchase of the first tranche in 2020). The planned phased commissioning of subsequent vehicles in the following years was accounted for in the accruing amount of vehicle kilometres covered by the new vehicles. The computations also accounted for the different amounts of vehicle-kilometres for the bus operators: SPAK and SPAD.
While interpreting the results presented in the last column in Table 4, marked “V1 − V0”, it must be noted that a negative value in a given year means that the vehicles operation costs incurred for variant V1 were lower than the costs incurred for variant V0. There was no instance of a positive value.
The comparative analysis of the purchase costs of the vehicles and the supporting infrastructure (Table 3) has shown that variant V1 requires more expenditure than the V0 (fleet renewing) variant. Should the city of Szczecin decide to implement variant V1, apart from purchasing the electric buses (whose market prices are much higher than those of diesel buses) it would also be required to purchase the infrastructure which is necessary for their operation. A different situation takes place in the case of the vehicle operation costs (Table 4); where variant V1 may bring specific financial benefits.
Comparing the rationale for purchasing the vehicles by the city of Szczecin as per the individual variants (V0 and V1), financial flows were calculated, which took into account the indicated investment costs (Table 3) and operation costs (Table 4) related to the vehicles. The annual financial flows for the years 2020–2035 are presented in Table 5.
While interpreting the results shown in the last column of Table 5, marked “financial flows”, it should be noted that the result for each year was computed on the basis of the cost difference (V1 − V0). A negative value in a given year means that the costs (investment + operation) incurred for variant V1 exceeded the analogous costs for variant V0. A positive value, in turn, means that the costs (investment + operation) incurred for variant V1 were lower than the costs incurred for variant V0.
The results presented in Table 5 show that in the analysed period the annual financial flows in most years are more favourable for the V1 investment variant. This is due to the considerably lower operation costs of electric vehicles compared to diesel buses. However, from the perspective of the full analysed period (2020–2035), it is possible to notice that variant V1 is less cost-effective compared to variant V0. This is due to the need to incur considerable investment costs connected with the higher unit prices of electric buses and the need to purchase the supporting infrastructure.
Based on the financial flows shown in Table 5, the Financial Net Present Value (FNPV) was calculated. Pursuant to the assumptions of the BB2015 [13], the discount rate of 4% was adopted in the calculations. The calculations were made using the following formula:
where:
- Ct—cash flow in period t;
- r—discount rate;
- C0—initial outlay.
It should be noted that a negative value of the FNPV, computed with the difference-based method using the financial flows, means that variant V1 is less cost-effective in comparison with variant V0. In accordance with the adopted methodology, a positive value of the FNPV means, in turn, that variant V1 is more cost-effective compared to variant V0. Thus, when interpreting the obtained FNPV value (−30,764.58 k PLN), it is possible to conclude that implementation of the investment according to variant V1, covering purchase and operation of electric buses in the city of Szczecin, will be less favourable in financial terms compared to variant V0 which covers purchase and operation of diesel buses meeting the EURO 6 standard.
It is possible to notice that as a result of electromobility implementation, in the future the difference in price between an electric bus and a diesel bus may decrease, which may be reflected in FNPV values. Such a situation may arise as a result of reduced production costs of electric buses as well as of increased diesel bus prices, due to e.g., the need to pay environmental fees by manufacturers of diesel buses. In the future it may also be possible that production of diesel buses will be limited or totally abandoned. Therefore, it would be necessary to conduct further studies in that respect.
Below, this article continues to describe an economic analysis which was performed to additionally take into account the social cost and benefit resulting from implementation of the analysed variants (V1 and V0).
5.2. Economic Analysis
Preparing an economic analysis as well as a financial analysis is required under AEAF. Economic effects of an investment in practice are not connected with any cash flows for the investor; they pertain to expected effects of the investment, which have not been accounted for in the financial analysis but may have an impact on the society, economy, and natural environment. The monetised nonmarket effects included in the analysis took into account emissions of: NHMC/NMVOC, NOx, PM, SO2, and CO2 and also noise.
The calculation of the pollutant emissions costs (PEC) generated by the individual substances (NHMC/NMVOC, NOx, PM, SO2 and CO2) for each of the analysed years was carried out as per the formula:
where:
- UC—unit cost (PLN/tonne);
- E—emissions volume (tonne).
The following data were used in the computations:
- unit costs of individual substances (NHMC/NMVOC, NOx, PM, SO2, and CO2) for each examined year were calculated according to CEUTP [136];
- volumes of emissions of the individual substances (NHMC/NMVOC, NOx, PM, SO2, and CO2) for each examined year were based on Pietrzak and Pietrzak [14], where the volumes of the individual substances’ emissions were estimated for the analysed variants V0 and V1.
The noise emissions costs (NEC) for each of the examined years were computed as per the following formula:
where:
- UC—unit cost (PLN/vkm);
- QVK—quantity of vehicle kilometres (vkm).
The following data were used in the computations:
The calculation results regarding the projected emissions costs of NHMC/NMVOC, NOx, PM, SO2, CO2, and noise for the two variants (V1 and V0) are presented in Table 6 and Figure 4, Figure 5, Figure 6, Figure 7, Figure 8 and Figure 9. The calculations have accounted for the commissioning of subsequent buses as required by AEAF, and thus for the rising quantity of vehicle kilometres in the subsequent years.
While interpreting the results presented in Table 6 in columns marked “V1 − V0”, it must be noted that a negative value in a given year means that the costs of emissions of individual substances incurred for variant V1 were lower than the costs incurred in the case of variant V0. A positive value, in turn, means that the costs of emissions of individual substances incurred for variant V1 exceeded the analogous costs incurred for variant V0.
In view of the obtained results, it should be stressed that choosing the V1 investment variant may bring measurable benefits—namely reduction of NMHC/NMVOC, NOx, PM, and noise emissions—and thus decrease the costs of emissions generated by the said substances, which confirms Hypothesis H1. Importantly, choosing variant V1 for the city of Szczecin may concurrently lead to increased emissions of other harmful substances, i.e., CO2 and SO2, and consequently to increased costs of emissions of the said substances. According to the results of the research carried out for the city of Szczecin by Pietrzak and Pietrzak [14], purchase and operation of electric buses (variant V1) may be connected with:
- Increased emissions of CO2 in variant V1 by more than 200 tonnes a year compared to variant V0 (starting from 2028, when—pursuant to the AEAF assumptions—the last tranche of zero-emission buses is to be phased in),
- Appearance of SO2 emissions in variant V1, estimated to amount to nearly 20 tonnes a year (as from 2028).
- Increased emissions of CO2 and appearance of SO2 as a new harmful substance considerably decrease the assumed economic effects expected for investments in the area of electromobility. The reason for this phenomenon, which is unexpected in the context of a shift to zero-emission vehicles, may be the current balance of the energy mix in Poland, where electric power generation is dominated by coal-fired power stations. The structure of electric power generation in Poland in the years 2018 and 2019 is presented in Figure 10.
As shown in Figure 10, the share of coal in electric power generation in Poland was respectively: 78.2% in 2018 and 73.6% in 2019. In the same period, the share of RES in electric power production was as small as 12.70% and 15.40% respectively. These data unambiguously show that the energy mix in Poland is unfavourable.
In order to compute the ENPV for the analysed case study, the economic flows were calculated—the results are presented in Table 7. Similarly as in the case of the previous computations, the difference-based method was applied. The economic analysis was based on the data resulting from the financial analysis and the economic costs generated by NMHC/ NMVOC, NOx, PM, SO2, CO2 and noise emissions. As for the financial analysis, market prices constitute an appropriate frame of reference for the purposes of evaluating the project financial results for both private and public investors. However, they are not appropriate when the goal is evaluation of the project’s contribution to the benefit of the society. To that end, all market prices should be converted into shadow prices, which better reflect the benefit for the society. Market prices are converted into shadow prices by using Conversion Factors (CF). Pursuant to the BB2015 recommendations, adjustments were made and the following CFs were applied [13]:
- 0.83 for investment costs connected with purchasing the infrastructure,
- 0.87 for investment costs connected with purchasing the vehicles,
- 0.78 for investment costs connected with the vehicles’ operation.
While interpreting the results shown in the last column of Table 7, marked “economic flows”, it should be noted that the result for each year was calculated on the basis of the costs computed with the difference-based method (V1 − V0). A negative value in a given year means that the economic costs incurred for variant V1 exceeded the analogous costs incurred for variant V0. A positive value, in turn, means that the economic costs incurred for variant V1 were lower than the costs incurred for variant V0.
Based on the economic flows shown in Table 7, the Economic Net Present Value (ENPV) was calculated. Pursuant to the assumptions of the BB2015 [13], the social discount rate (SDR) of 4.5% was adopted in the calculations. The calculations were made using the following formula:
where:
- Ct—economic cash flow in period t;
- r—social discount rate;
- C0—initial outlay.
It should be noted that a negative value of the ENPV, computed with the difference-based method using the economic flows, means that variant V1 is economically less cost-effective in comparison with variant V0. In accordance with the adopted methodology, a positive value of the ENPV means, in turn, that variant V1 in economic terms is more cost-effective compared to variant V0. Thus, when interpreting the obtained ENPV value (−27,727.67 k PLN), it is possible to conclude that implementation of the investment according to variant V1, covering purchase and operation of electric buses in the city of Szczecin, will be less favourable in economic terms compared to variant V0 which covers purchase and operation of diesel buses meeting the EURO 6 standard.
However, it should be noted that ENPV > FNPV, which means that the economic costs included in the calculations and resulting from NHMC/NMVOC, NOx, PM, SO2, CO2 as well as noise emissions have improved the cost-effectiveness of variant V1 in comparison with variant V0.
Putting electric buses into operation in a given city may reduce NMHC, NOx, PM, and noise emissions, so it may have a positive impact on the society, economy, and natural environment. However, due to the unfavourable energy mix in Poland (Figure 10) and the prevailing share of coal, the assumed full effects of variant V1 implementation are in fact difficult to achieve. The computed higher economic costs resulting directly from increased emissions of SO2 and CO2 may decrease the effectiveness of implementing electromobility in the transport sector. This in turn may have a negative impact on the decarbonisation process defined as reduction in (total and transport) carbon intensity of the whole economy [139]. The results have confirmed Hypothesis H2.
The results of the studies completed for the purposes of this research paper have shown that purchasing electric buses in specific conditions (the current energy mix in Poland) may be insufficient for full and effective achievement of electromobility objectives. The authors’ observations in this respect are compliant with the results of the studies completed by Dillman et al. [140], where it was shown that the probability that EVs will lead to lower life-cycle GHG emissions compared to a diesel vehicle is much lower in Poland than in most other European countries. Therefore, it must be concluded that it is necessary for the process of replacing the bus fleet with electric buses to be combined with other supplementary measures, in particular with diversification of energy sources in Poland and increasing the share of RES, which confirms Hypothesis H3. Without such supplementary measures, the “zero-emission” feature of electric buses commissioned and operated in public transport systems in Polish cities may be deemed a substantial simplification. Even though operation of such vehicles may bring measurable benefits on a local scale (local zero emission mobility in a given city), in terms of the whole country this may merely be called “geographical shift of emission”, which is not the main goal of electromobility.
6. Discussion
The main purpose of this paper was to identify and analyse economic effects derived from implementing zero-emission buses in urban public transport, based on the example of the city of Szczecin, Poland. In view of the purpose of this paper, the authors carried out a comparative analysis of effects of implementing the two variants:
- Fleet renewing variant (V0) which assumed that some of the diesel buses operated in Szczecin would be replaced with new diesel buses meeting the strictest standards for ICEVs, namely EURO 6,
- Investment variant (V1) which assumed that some of the diesel buses operated in Szczecin would be replaced with new, zero-emission buses.
In addition, FNPV and ENPV ratios were calculated. In order to compare the financial and economic effects of both variants, the difference-based method was applied. The computed ratios made it possible to conclude that investment implementation according to variant V1, covering purchase and operation of electric buses in the city of Szczecin, would be less cost-effective than variant V0 covering purchase and operation of diesel buses meeting the EURO 6 standard. The obtained result is substantially due to the two phenomena attributable to the current energy mix in Poland (Figure 10): the increased emissions of CO2 in relation to electric buses (Figure 8) and appearance of SO2 emission (Figure 7).
The research study focusing on estimation of economic effects of electromobility in sustainable urban public transport in Polish cities made it possible to demonstrate that:
- Implementation of zero-emission buses is an important tool to reduce external costs generated by urban public transport fleets.
- Economic benefits resulting from implementing zero-emission buses in urban public transport in Szczecin are limited by the current energy mix structure in Poland.
- Achieving full effects of electromobility in Poland as a result of implementing zero-emission buses in urban transport fleets depends on taking concurrent actions aimed at diversifying the sources of power generation in Poland (changing the energy mix), including in particular a wider use of Renewable Energy Sources (RES).
However, it is worth discussing the results in the aspect of the impact of the energy mix in a given country (in this case in Poland) on economic effects resulting from implementation of zero-emission buses in urban public transport (in this case in the city of Szczecin). As already mentioned, when calculating the emissions costs for each of the environmental pollutants (NHMC/NMVOC, NOx, PM, SO2 and CO2) and noise, unit costs were applied, which were calculated according to CEUTP. In order to demonstrate the role of the energy mix in effective achievement of electromobility goals, further, alternative computations of ENPV were made for the analysed case study. Similarly as in the case of the previous computations, the difference-based method was applied for this purpose. Taking into account the fact that it is CO2 and SO2 that are responsible for the result that is unfavourable for electric buses, the subsequent calculations took into account reductions in the costs of the two substances (CO2 and SO2) emissions. ENPV was calculated based on the assumption that the current unit costs of CO2 and SO2 emissions would be reduced by, respectively: 25%, 50%, 75% up to a hypothetical situation when the costs are totally reduced. The results were as follows:
- a decrease in unit costs of CO2 and SO2 emissions by 25%:
- a decrease in unit costs of CO2 and SO2 emissions by 50%:
- a decrease in unit costs of CO2 and SO2 emissions by 75%:
- a decrease in unit costs of CO2 and SO2 emissions by 100%:
As shown by the ENPV calculation results for the analysed situations, the reduction of unit costs of CO2 and SO2 emissions may effectively level out the difference between variant V1 and variant V0. Thus, it may have a significant impact on the increased cost-effectiveness of variant V1, and thus the possibility of achieving the full assumed effects of electromobility in transport.
7. Conclusions
In the context of the research problem handled in this paper, it is important to point out that the condition for success of electromobility development is not only providing the basis for the electromobility ecosystem but also coordination of activities in the area of electromobility industry development and stimulation of demand for electric vehicles. The analyses completed in the course of the research project made it possible to formulate the following conclusions:
- An important role in the process of electromobility development in urban transport is played by the government and the local authorities. The former is responsible for an appropriate energy policy (striving for a large share of RES in the energy mix) and fiscal policy (a system of subsidies and incentives for purchase and operation of zero-emission vehicles). The latter may create appropriate local infrastructural and organisational conditions to support and privilege zero-emission vehicle users, e.g., via: organisation of an EV charging system, providing free-of-charge car parks in the city centre, or designating LEZs and ZEZs. The task for local authorities is also propagation of using zero-emission buses as a vital element of Sustainable Urban Public Transport.
- Achieving the assumed electromobility effects is predicated not only on purchasing appropriate vehicles or organising a charging system for them but also on a big share of RES in the country’s energy mix. A small share of RES may result in limited benefits of zero-emission vehicle operation.
- Purchase and operation of electric buses in urban public transport may contribute to improving life quality in cities via reduction of local emissions of pollutants to the environment. Thus, as opposed to diesel buses, vehicles of this type contribute to meeting the electromobility goals in local terms.
- Purchase and operation of electric buses in urban public transport may also contribute to meeting the electromobility goals and transport decarbonisation in supralocal terms; however, this depends on an appropriate share of RES in the country’s energy mix. Failure to provide electric power derived from renewable energy sources may only result in a geographical shift of emissions.
Analysing the world trends in the area of production and operation of zero-emission vehicles, we can conclude that over the next years the demand for electric power will be rising intensively. This trend may have an adverse effect on economies characterised by a big share of fossil fuels in the energy mix (this may also be the case in Poland). If the power engineering industry in any given country is unable to quickly adapt to the growing demand (via diversification of energy generation sources), this may lead to insufficiency of the given country’s system or the need to meet the demand via increased electric power production in the existing coal-fired power plants. This situation may paradoxically lead to further growth of the share of fossil fuels in the country’s energy mix, and thus further growth of unit costs of emissions of substances that are harmful to people and the environment. The research study described in this paper is of practical value, as it indicates the need to adapt the energy market to the changes resulting from electromobility.
The changes observed on the transport market, which result from the electromobility policy assumptions, require further studies, in particular with regard to external effects of zero-emission vehicles operation.
Author Contributions
Conceptualization, O.P. and K.P.; data curation, O.P. and K.P.; formal analysis, O.P. and K.P.; investigation, O.P. and K.P.; methodology, O.P. and K.P.; visualization, K.P.; writing—original draft, O.P. and K.P.; writing—review and editing, O.P. All authors have read and agreed to the published version of the manuscript.
Funding
The research presented in this article was carried out in the Maritime University of Szczecin under the Grant 1/S/KGMiST/2021 "Transport 4.0”.
Institutional Review Board Statement
Not applicable.
Informed Consent Statement
Not applicable.
Conflicts of Interest
The authors declare no conflict of interest.
References
- Nordelöf, A.; Romare, M.; Tivander, J. Life Cycle Assessment of City Buses Powered by Electricity, Hydrogenated Vegetable Oil or Diesel. Transp. Res. D Transp. Environ. 2019, 75, 211–222. [Google Scholar] [CrossRef]
- Chang, C.-C.; Liao, Y.-T.; Chang, Y.-W. Life Cycle Assessment of Alternative Energy Types—Including Hydrogen—For Public City Buses in Taiwan. Int. J. Hydrogen Energy 2019, 44, 18472–18482. [Google Scholar] [CrossRef]
- Ivković, I.; Čokorilo, O.; Kaplanović, S. The Estimation of GHG Emission Costs in Road and Air Transport Sector: Case Study of Serbia. Transport 2016, 33, 260–267. [Google Scholar] [CrossRef] [Green Version]
- Liimatainen, H. Measures for Energy Efficient and Low Emission Private Mobility. In Encyclopedia of the UN Sustainable Development Goals; Springer International Publishing: Cham, Switzerland, 2020; pp. 1–12. [Google Scholar] [CrossRef]
- European Commission. A European Strategy for Low-Emission Mobility; European Commission: Brussels, Belgium, 2016. [Google Scholar]
- European Commission. Available online: https://ec.europa.eu/clima/policies/transport_en (accessed on 30 November 2020).
- Foltyński, M. Sustainable Urban Logistics Plan—Current Situation of the City of Poznań. Transp. Res. Procedia 2019, 39, 42–53. [Google Scholar] [CrossRef]
- Kumar, P.; Morawska, L.; Martani, C.; Biskos, G.; Neophytou, M.; Di Sabatino, S.; Bell, M.; Norford, L.; Britter, R. The Rise of Low-Cost Sensing for Managing Air Pollution in Cities. Environ. Int. 2015, 75, 199–205. [Google Scholar] [CrossRef] [PubMed] [Green Version]
- Zhou, B.; Wu, Y.; Zhou, B.; Wang, R.; Ke, W.; Zhang, S.; Hao, J. Real-World Performance of Battery Electric Buses and Their Life-Cycle Benefits with Respect to Energy Consumption and Carbon Dioxide Emissions. Energy 2016, 96, 603–613. [Google Scholar] [CrossRef]
- Mutter, A. Obduracy and Change in Urban Transport—Understanding Competition Between Sustainable Fuels in Swedish Municipalities. Sustainability 2019, 11, 6092. [Google Scholar] [CrossRef] [Green Version]
- Poland’s State Assets Ministry. Available online: https://www.gov.pl/web/aktywa-panstwowe/elektromobilnosc-w-polsce (accessed on 30 November 2020).
- Act of 11 January 2018 on Electromobility and Alternative Fuels (Ustawa z Dnia 11 Stycznia 2018 r. o Elektromobilności i Paliwach Alternatywnych, Dz. U. 2018, poz. 317). Available online: https://isap.sejm.gov.pl (accessed on 30 November 2020).
- Blue Book. Public Transport Sector in Cities, Agglomerations and Regions, Jaspers. 2015. Available online: https://www.cupt.gov.pl/ (accessed on 30 November 2020).
- Pietrzak, K.; Pietrzak, O. Environmental Effects of Electromobility in a Sustainable Urban Public Transport. Sustainability 2020, 12, 1052. [Google Scholar] [CrossRef] [Green Version]
- Haase, D.; Güneralp, B.; Dahiya, B.; Bai, X.; Elmqvist, T. Global Urbanization. In Urban Planet: Knowledge towards Sustainable Cities; Cambridge University Press: Cambridge, UK, 2018; pp. 19–44. [Google Scholar]
- United Nations Department of Economic and Social Affairs. The World’s Cities in 2018—Data Booklet; (ST/ESA/ SER.A/417); United Nations: New York, NY, USA, 2018. [Google Scholar]
- Tang, J.; McNabola, A.; Misstear, B. The Potential Impacts of Different Traffic Management Strategies on Air Pollution and Public Health for a More Sustainable City: A Modelling Case Study from Dublin, Ireland. Sustain. Cities Soc. 2020, 60, 102229. [Google Scholar] [CrossRef]
- Abbasi, M.; Hadji Hosseinlou, M.; JafarzadehFadaki, S. An Investigation of Bus Rapid Transit System (BRT) Based on Economic and Air Pollution Analysis (Tehran, Iran). Case Stud. Transp. Policy 2020, 8, 553–563. [Google Scholar] [CrossRef]
- Talla, A.; Ngohe-Ekam, P.S.; Nkeumaleu, A.T. Evaluation of the Impact of Motorcycles in Urban Transport on Air Pollution: A Case of Douala City in Cameroon. J. Sci. Res. Rep. 2018, 20, 1–11. [Google Scholar] [CrossRef] [PubMed]
- Titos, G.; Lyamani, H.; Drinovec, L.; Olmo, F.J.; Močnik, G.; Alados-Arboledas, L. Evaluation of the Impact of Transportation Changes on Air Quality. Atmos. Environ. 2015, 114, 19–31. [Google Scholar] [CrossRef]
- Wang, Y.; Yang, D. Impacts of Freight Transport on PM2.5 Concentrations in China: A Spatial Dynamic Panel Analysis. Sustainability 2018, 10, 2865. [Google Scholar] [CrossRef] [Green Version]
- Gao, J.; Chen, H.; Dave, K.; Chen, J.; Jia, D. Fuel Economy and Exhaust Emissions of a Diesel Vehicle under Real Traffic Conditions. Energy Sci. Eng. 2020, 8, 1781–1792. [Google Scholar] [CrossRef]
- Delgado, J.; Moura, P.; de Almeida, A.T. Electric Mobility: Key Technology to Decarbonize the Economy and Improve Air Quality. In Encyclopedia of the UN Sustainable Development Goals; Springer International Publishing: Cham, Switzerland, 2020; pp. 1–18. [Google Scholar] [CrossRef]
- Migliaretti, G.; Cadum, E.; Migliore, E.; Cavallo, F. Traffic Air Pollution and Hospital Admission for Asthma: A Case-Control Approach in a Turin (Italy) Population. Int. Arch. Occup. Environ. Health 2005, 78, 164–169. [Google Scholar] [CrossRef]
- Lindgren, A.; Stroh, E.; Montnémery, P.; Nihlén, U.; Jakobsson, K.; Axmon, A. Traffic-Related Air Pollution Associated with Prevalence of Asthma and COPD/Chronic Bronchitis. A Cross-Sectional Study in Southern Sweden. Int. J. Health Geogr. 2009, 8, 2. [Google Scholar] [CrossRef] [PubMed] [Green Version]
- Raaschou-Nielsen, O.; Andersen, Z.J.; Jensen, S.S.; Ketzel, M.; Sørensen, M.; Hansen, J.; Loft, S.; Tjønneland, A.; Overvad, K. Traffic Air Pollution and Mortality from Cardiovascular Disease and All Causes: A Danish Cohort Study. Environ. Health 2012, 11, 60. [Google Scholar] [CrossRef] [Green Version]
- Weichenthal, S.; Hatzopoulou, M.; Goldberg, M.S. Exposure to Traffic-Related Air Pollution during Physical Activity and Acute Changes in Blood Pressure, Autonomic and Micro-Vascular Function in Women: A Cross-over Study. Part. Fibre Toxicol. 2014, 11. [Google Scholar] [CrossRef] [Green Version]
- Soehodho, S. Motorization in Indonesia and Its Impact to Traffic Accidents. IATSS Res. 2007, 31, 27–33. [Google Scholar] [CrossRef] [Green Version]
- Sun, L.-L.; Liu, D.; Chen, T.; He, M.-T. Road Traffic Safety: An Analysis of the Cross-Effects of Economic, Road and Population Factors. Chin. J. Traumatol. 2019, 22, 290–295. [Google Scholar] [CrossRef]
- Retallack, A.E.; Ostendorf, B. Current Understanding of the Effects of Congestion on Traffic Accidents. Int. J. Environ. Res. Public Health 2019, 16, 3400. [Google Scholar] [CrossRef] [Green Version]
- Jacyna, M.; Wasiak, M.; Lewczuk, K.; Karoń, G. Noise and Environmental Pollution from Transport: Decisive Problems in Developing Ecologically Efficient Transport Systems. J. Vibroengineering 2017, 19, 5639–5655. [Google Scholar] [CrossRef]
- Jeon, J.; Hong, J.; Kim, S.; Kim, K.-H. Noise Indicators for Size Distributions of Airborne Particles and Traffic Activities in Urban Areas. Sustainability 2018, 10, 4599. [Google Scholar] [CrossRef] [Green Version]
- McCahill, C.; Garrick, N. Automobile Use and Land Consumption: Empirical Evidence from 12 Cities. URBAN Des. Int. 2012, 17, 221–227. [Google Scholar] [CrossRef]
- Shin, Y.E.; Vuchic, V.R.; Bruun, E.C. Land Consumption Impacts of a Transportation System on a City: An Analysis. Transp. Res. Rec. 2009, 2110, 69–77. [Google Scholar] [CrossRef]
- Available online: https://www.eea.europa.eu/themes/transport/term/increasing-oil-consumption-and-ghg (accessed on 30 November 2020).
- Skrúcaný, T.; Kendra, M.; Stopka, O.; Milojević, S.; Figlus, T.; Csiszár, C. Impact of the Electric Mobility Implementation on the Greenhouse Gases Production in Central European Countries. Sustainability 2019, 11, 4948. [Google Scholar] [CrossRef] [Green Version]
- Milojević, S.; Skrucany, T.; Milošević, H.; Stanojević, D.; Pantić, M.; Stojanović, B. Alternative Drive Systems and Environmentaly Friendly Public Passengers Transport. Appl. Eng. Lett. J. Eng. Appl. Sci. 2018, 3, 105–113. [Google Scholar] [CrossRef]
- Sarigiannis, D.A.; Kontoroupis, P.; Nikolaki, S.; Gotti, A.; Chapizanis, D.; Karakitsios, S. Benefits on Public Health from Transport-Related Greenhouse Gas Mitigation Policies in Southeastern European Cities. Sci. Total Environ. 2017, 579, 1427–1438. [Google Scholar] [CrossRef] [PubMed]
- Auvinen, H.; Järvi, T.; Kloetzke, M.; Kugler, U.; Bühne, J.-A.; Heinl, F.; Kurte, J.; Esser, K. Electromobility Scenarios: Research Findings to Inform Policy. Transp. Res. Procedia 2016, 14, 2564–2573. [Google Scholar] [CrossRef] [Green Version]
- Melkonyan, A.; Koch, J.; Lohmar, F.; Kamath, V.; Munteanu, V.; Alexander Schmidt, J.; Bleischwitz, R. Integrated Urban Mobility Policies in Metropolitan Areas: A System Dynamics Approach for the Rhine-Ruhr Metropolitan Region in Germany. Sustain. Cities Soc. 2020, 102358. [Google Scholar] [CrossRef]
- Pinto, J.A.; Kumar, P.; Alonso, M.F.; Andreão, W.L.; Pedruzzi, R.; Espinosa, S.I.; de Almeida Albuquerque, T.T. Kriging Method Application and Traffic Behavior Profiles from Local Radar Network Database: A Proposal to Support Traffic Solutions and Air Pollution Control Strategies. Sustain. Cities Soc. 2020, 56, 102062. [Google Scholar] [CrossRef]
- Muñoz-Villamizar, A.; Santos, J.; Montoya-Torres, J.R.; Velázquez-Martínez, J.C. Measuring Environmental Performance of Urban Freight Transport Systems: A Case Study. Sustain. Cities Soc. 2020, 52, 101844. [Google Scholar] [CrossRef]
- Chwesiuk, K.; Kijewska, K.; Iwan, S. Urban Consolidation Centres for Medium-Size Touristic Cities in the Westpomeranian Region of Poland. Procedia Soc. Behav. Sci. 2010, 2, 6264–6273. [Google Scholar] [CrossRef] [Green Version]
- Van Rooijen, T.; Quak, H. Local Impacts of a New Urban Consolidation Centre—The Case of Binnenstadservice.Nl. Procedia Soc. Behav. Sci. 2010, 2, 5967–5979. [Google Scholar] [CrossRef] [Green Version]
- Quak, H.; van Duin, R.; Hendriks, B. Running an Urban Consolidation Centre: Binnenstadservice 10 Years Back and Forth. Transp. Res. Procedia 2020, 46, 45–52. [Google Scholar] [CrossRef]
- Taefi, T.T.; Kreutzfeldt, J.; Held, T.; Konings, R.; Kotter, R.; Lilley, S.; Baster, H.; Green, N.; Laugesen, M.S.; Jacobsson, S.; et al. Comparative Analysis of European Examples of Freight Electric Vehicles Schemes—A Systematic Case Study Approach with Examples from Denmark, Germany, The Netherlands, Sweden and the UK. In Dynamics in Logistics; Springer International Publishing: Cham, Switzerland, 2016; pp. 495–504. [Google Scholar] [CrossRef] [Green Version]
- Teoh, T.; Kunze, O.; Teo, C.-C.; Wong, Y. Decarbonisation of Urban Freight Transport Using Electric Vehicles and Opportunity Charging. Sustainability 2018, 10, 3258. [Google Scholar] [CrossRef] [Green Version]
- Fiori, C.; Marzano, V. Modelling Energy Consumption of Electric Freight Vehicles in Urban Pickup/Delivery Operations: Analysis and Estimation on a Real-World Dataset. Transp. Res. D Transp. Environ. 2018, 65, 658–673. [Google Scholar] [CrossRef]
- Lambas, M.E.L.; Ricci, S. The Environmental and Economic Effects of Innovative Measures in Urban Parcels Delivery. In Urban Transport XX; WIT Press: Southampton, UK, 2014. [Google Scholar] [CrossRef] [Green Version]
- Moolenburgh, E.A.; van Duin, J.H.R.; Balm, S.; van Altenburg, M.; van Amstel, W.P. Logistics Concepts for Light Electric Freight Vehicles: A Multiple Case Study from the Netherlands. Transp. Res. Procedia 2020, 46, 301–308. [Google Scholar] [CrossRef]
- Melo, S.; Baptista, P.; Costa, Á. Comparing the Use of Small Sized Electric Vehicles with Diesel Vans on City Logistics. Procedia Soc. Behav. Sci. 2014, 111, 350–359. [Google Scholar] [CrossRef] [Green Version]
- Gruber, J.; Kihm, A. Reject or Embrace? Messengers and Electric Cargo Bikes. Transp. Res. Procedia 2016, 12, 900–910. [Google Scholar] [CrossRef] [Green Version]
- Niels, T.; Hof, M.T.; Bogenberger, K. Design and Operation of an Urban Electric Courier Cargo Bike System. In Proceedings of the 21st International Conference on Intelligent Transportation Systems (ITSC), Maui, HI, USA, 4–7 November 2018. [Google Scholar] [CrossRef]
- Zhang, L.; Matteis, T.; Thaller, C.; Liedtke, G. Simulation-Based Assessment of Cargo Bicycle and Pick-up Point in Urban Parcel Delivery. Procedia Comput. Sci. 2018, 130, 18–25. [Google Scholar] [CrossRef]
- Gupta, S. Role of Non -Motorized Transport in Distribution of Goods in the Metropolitan City of Delhi. Transp. Res. Procedia 2017, 25, 978–984. [Google Scholar] [CrossRef]
- Kelly, J.; Marinov, M. Innovative Interior Designs for Urban Freight Distribution Using Light Rail Systems. Urban Rail Transit 2017, 3, 238–254. [Google Scholar] [CrossRef] [Green Version]
- Gonzalez-Feliu, J. A Joint Freight Catchment and Cost Benefit Analysis to Assess Rail Urban Logistics Scenarios. In Lecture Notes in Business Information Processing; Springer International Publishing: Cham, Switzerland, 2018; pp. 14–27. [Google Scholar] [CrossRef]
- Pietrzak, O.; Pietrzak, K. The Role of Railway in Handling Transport Services of Cities and Agglomerations. Transp. Res. Procedia 2019, 39, 405–416. [Google Scholar] [CrossRef]
- Zych, M. Identification of Potential Implementation of the Cargo Tram in Warsaw: A First Overview. Procedia Soc. Behav. Sci. 2014, 151, 360–369. [Google Scholar] [CrossRef] [Green Version]
- Orczyk, M.; Tomaszewski, F. Freight Tram Concept for the City of Poznań. Transp. Econ. Logist. 2018, 80, 169–178. [Google Scholar] [CrossRef]
- Ortega, J.; Tóth, J.; Péter, T. Mapping the Catchment Area of Park and Ride Facilities within Urban Environments. ISPRS Int. J. Geoinf. 2020, 9, 501. [Google Scholar] [CrossRef]
- Macioszek, E.; Kurek, A. The Use of a Park and Ride System—A Case Study Based on the City of Cracow (Poland). Energies 2020, 13, 3473. [Google Scholar] [CrossRef]
- Kimpton, A.; Pojani, D.; Sipe, N.; Corcoran, J. Parking Behavior: Park ‘n’ Ride (PnR) to Encourage Multimodalism in Brisbane. Land Use Policy 2020, 91, 104304. [Google Scholar] [CrossRef]
- Buchari, E. Transportation Demand Management: A Park and Ride System to Reduce Congestion in Palembang City Indonesia. Procedia Eng. 2015, 125, 512–518. [Google Scholar] [CrossRef] [Green Version]
- Fierek, S.; Bieńczak, M.; Zmuda-Trzebiatowski, P. Multiple Criteria Evaluation of P&R Lots Location. Transp. Res. Procedia 2020, 47, 489–496. [Google Scholar] [CrossRef]
- Hamidi, Z.; Camporeale, R.; Caggiani, L. Inequalities in Access to Bike-and-Ride Opportunities: Findings for the City of Malmö. Transp. Res. Part A Policy Pract. 2019, 130, 673–688. [Google Scholar] [CrossRef]
- Pritchard, J.P.; Stępniak, M.; Geurs, K.T. Equity Analysis of Dynamic Bike-and-Ride Accessibility in The Netherlands. In Measuring Transport Equity; Elsevier: Amsterdam, The Netherlands, 2019; pp. 73–83. [Google Scholar] [CrossRef]
- Martens, K. Promoting Bike-and-Ride: The Dutch Experience. Transp. Res. Part A Policy Pract. 2007, 41, 326–338. [Google Scholar] [CrossRef]
- Bieliński, T.; Kwapisz, A.; Ważna, A. Bike-Sharing Systems in Poland. Sustainability 2019, 11, 2458. [Google Scholar] [CrossRef] [Green Version]
- Macioszek, E.; Świerk, P.; Kurek, A. The Bike-Sharing System as an Element of Enhancing Sustainable Mobility—A Case Study Based on a City in Poland. Sustainability 2020, 12, 3285. [Google Scholar] [CrossRef] [Green Version]
- Ricci, M. Bike Sharing: A Review of Evidence on Impacts and Processes of Implementation and Operation. Res. Transp. Bus. Manag. 2015, 15, 28–38. [Google Scholar] [CrossRef]
- Chang, S.; Song, R.; He, S.; Qiu, G. Innovative Bike-Sharing in China: Solving Faulty Bike-Sharing Recycling Problem. J. Adv. Transp. 2018, 2018, 1–10. [Google Scholar] [CrossRef]
- Bieliński, T.; Ważna, A. Electric Scooter Sharing and Bike Sharing User Behaviour and Characteristics. Sustainability 2020, 12, 9640. [Google Scholar] [CrossRef]
- Ilkevich, S.V. The Sources of Competitive Advantages of Electric Scooter Sharing Services. Стратегические Решения и Риск-Менеджмент 2019, 10, 238–251. [Google Scholar] [CrossRef]
- Tomanek, R. Free-Fare Public Transport in the Concept of Sustainable Urban Mobility. Transp. Probl. 2018, 12, 95–105. [Google Scholar] [CrossRef] [Green Version]
- Štraub, D.; Jaroš, V. Free Fare Policy as a Tool for Sustainable Development of Public Transport Services. Hum. Geogr. 2019, 13, 45–59. [Google Scholar] [CrossRef] [Green Version]
- Tsao, H.-S.J.; Wei, W.; Pratama, A. Operational Feasibility of One-Dedicated-Lane Bus Rapid Transit/Light Rail Systems. Transp. Plan. Technol. 2009, 32, 239–260. [Google Scholar] [CrossRef]
- Li, J.-Q.; Song, M.K.; Li, M.; Zhang, W.-B. Planning for Bus Rapid Transit in Single Dedicated Bus Lane. Transp. Res. Rec. 2009, 2111, 76–82. [Google Scholar] [CrossRef]
- Ku, D.; Bencekri, M.; Kim, J.; Leec, S.; Leed, S. Review of European Low Emission Zone Policy. Chem. Eng. 2020, 78. [Google Scholar] [CrossRef]
- Da Silva, F.N.; Custódio, R.A.L.; Martins, H. Low Emission Zone: Lisbon’s Experience. J. Traffic Logist. Eng. 2014, 2, 133–139. [Google Scholar] [CrossRef] [Green Version]
- Biswas, D.; Ghosh, S.; Sengupta, S.; Mukhopadhyay, S. A Predictive Supervisory Controller for an HEV Operating in a Zero Emission Zone. In Proceedings of the IEEE Transportation Electrification Conference and Expo, Detroit, MI, USA, 19–21 June 2019. [Google Scholar] [CrossRef]
- Savković, T.; Gladović, P.; Miličić, M.; Pitka, P.; Ilić, S. Effects of Eco-Driving Training: A Pilot Program in Belgrade Public Transport. Tehnicki Vjesnik 2019, 26, 1031–1037. [Google Scholar] [CrossRef]
- Strömberg, H.K.; Karlsson, I.C.M. Comparative Effects of Eco-Driving Initiatives Aimed at Urban Bus Drivers—Results from a Field Trial. Transp. Res. D Transp. Environ. 2013, 22, 28–33. [Google Scholar] [CrossRef]
- Barla, P.; Gilbert-Gonthier, M.; Lopez Castro, M.A.; Miranda-Moreno, L. Eco-Driving Training and Fuel Consumption: Impact, Heterogeneity and Sustainability. Energy Econ. 2017, 62, 187–194. [Google Scholar] [CrossRef]
- Ho, S.-H.; Wong, Y.-D.; Chang, V.W.-C. What Can Eco-Driving Do for Sustainable Road Transport? Perspectives from a City (Singapore) Eco-Driving Programme. Sustain. Cities Soc. 2015, 14, 82–88. [Google Scholar] [CrossRef]
- Mankowski, C.; Weiland, D.; Abramović, B. Impact of Railway Investment on Regional Development—Case Study of Pomeranian Metropolitan Railway. PROMET Traffic Transp. 2019, 31, 669–679. [Google Scholar] [CrossRef] [Green Version]
- Abramović, B.; Šipuš, D.; Jurešić, D. Organisation of Integrated Passenger Transport on the Zagreb—Velika Gorica Route. Transp. Res. Procedia 2020, 44, 342–347. [Google Scholar] [CrossRef]
- Reichenbach, M. The Multimodal Transport User—A Challenge for Public Transport? Transp. Res. Procedia 2019, 41, 357–359. [Google Scholar] [CrossRef]
- Dyr, T.; Ziółkowska, K.; Misiurski, P.; Kozłowska, M. Effectiveness of Application Alternative Drive Vehicles in Public Transport. MATEC Web Conf. 2018, 180, 01002. [Google Scholar] [CrossRef] [Green Version]
- Tzeng, G.-H.; Lin, C.-W.; Opricovic, S. Multi-Criteria Analysis of Alternative-Fuel Buses for Public Transportation. Energy Policy 2005, 33, 1373–1383. [Google Scholar] [CrossRef]
- Xu, G.; Li, M.; Zhao, Y.; Chen, Q. Study on Emission Characteristics of Hybrid Buses under Driving Cycles in a Typical Chinese City. Adv. Mech. Eng. 2017, 9, 168781401772823. [Google Scholar] [CrossRef]
- Lijewski, P.; Ziolkowski, A.; Daszkiewicz, P.; Andrzejewski, M.; Gallas, D. Comparison of CO2 Emissions and Fuel Consumption of a Hybrid Vehicle and a Vehicle with a Direct Gasoline Injection Engine. IOP Conf. Ser. Mater. Sci. Eng. 2018, 421, 042046. [Google Scholar] [CrossRef]
- Hallmark, S.L.; Wang, B.; Sperry, R. Comparison of On-Road Emissions for Hybrid and Regular Transit Buses. J. Air Waste Manag. Assoc. 2013, 63, 1212–1220. [Google Scholar] [CrossRef] [Green Version]
- Pawełczyk, M.; Szumska, E. Evaluation of the Efficiency of Hybrid Drive Applications in Urban Transport System on the Example of a Medium Size City. MATEC Web Conf. 2018, 180, 03004. [Google Scholar] [CrossRef]
- Milojevic, S.; Grocic, D.; Dragojlovic, D. CNG Propulsion System for Reducing Noise of Existing City Buses. J. Appl. Eng. Sci. 2016, 14, 377–382. [Google Scholar] [CrossRef] [Green Version]
- Ivković, I.; Kaplanović, S.; Sekulić, D. Analysis of External Costs of Co2 Emissions for Cng Buses in Intercity Bus Service. Transport 2019, 34, 529–538. [Google Scholar] [CrossRef] [Green Version]
- Merkisz, J.; Fuć, P.; Lijewski, P.; Pielecha, J. Actual Emissions from Urban Buses Powered with Diesel and Gas Engines. Transp. Res. Procedia 2016, 14, 3070–3078. [Google Scholar] [CrossRef] [Green Version]
- Yue, T.; Chai, F.; Hu, J.; Jia, M.; Bao, X.; Li, Z.; He, L.; Zu, L. Gaseous Emissions from Compressed Natural Gas Buses in Urban Road and Highway Tests in China. J. Environ. Sci. 2016, 48, 193–199. [Google Scholar] [CrossRef] [PubMed]
- Tica, S.; Živanović, P.; Bajčetić, S.; Milovanović, B.; Nađ, A. Study of the Fuel Efficiency and Ecological Aspects of CNG Buses in Urban Public Transport in Belgrade. J. Appl. Eng. Sci. 2019, 17, 65–73. [Google Scholar] [CrossRef]
- Dyr, T.; Misiurski, P.; Ziółkowska, K. Costs and Benefits of Using Buses Fuelled by Natural Gas in Public Transport. J. Clean. Prod. 2019, 225, 1134–1146. [Google Scholar] [CrossRef]
- Jurkovič, M.; Kalina, T.; Skrúcaný, T.; Gorzelanczyk, P.; Ľupták, V. Environmental Impacts of Introducing LNG as Alternative Fuel for Urban Buses—Case Study in Slovakia. PROMET Traffic Transp. 2020, 32, 837–847. [Google Scholar] [CrossRef]
- Zhang, G.; Zhang, J.; Xie, T. A Solution to Renewable Hydrogen Economy for Fuel Cell Buses—A Case Study for Zhangjiakou in North China. Int. J. Hydrogen Energy 2020, 45, 14603–14613. [Google Scholar] [CrossRef]
- Hua, T.; Ahluwalia, R.; Eudy, L.; Singer, G.; Jermer, B.; Asselin-Miller, N.; Wessel, S.; Patterson, T.; Marcinkoski, J. Status of Hydrogen Fuel Cell Electric Buses Worldwide. J. Power Source 2014, 269, 975–993. [Google Scholar] [CrossRef] [Green Version]
- Lee, D.-Y.; Elgowainy, A.; Vijayagopal, R. Well-to-Wheel Environmental Implications of Fuel Economy Targets for Hydrogen Fuel Cell Electric Buses in the United States. Energy Policy 2019, 128, 565–583. [Google Scholar] [CrossRef]
- Langford, B.C.; Cherry, C. Transitioning a Bus Transit Fleet to Hydrogen Fuel: A Case Study of Knoxville Area Transit. Int. J. Hydrogen Energy 2012, 37, 2635–2643. [Google Scholar] [CrossRef]
- Eudy, L.; Post, M. BC Transit Fuel Cell Bus Project: Evaluation Results Report; Office of Scientific and Technical Information: Oak Ridge, TN, USA, 2014. [CrossRef]
- Eudy, L.; Post, M. BC Transit Fuel Cell Bus Project Evaluation Results: Second Report; Office of Scientific and Technical Information: Oak Ridge, TN, USA, 2014. [CrossRef] [Green Version]
- Eudy, L.; Post, M.; Jeffers, M. American Fuel Cell Bus Project Evaluation: Third Report; Office of Scientific and Technical Information: Oak Ridge, TN, USA, 2017. [CrossRef]
- Mahmoud, M.; Garnett, R.; Ferguson, M.; Kanaroglou, P. Electric Buses: A Review of Alternative Powertrains. Renew. Sustain. Energy Rev. 2016, 62, 673–684. [Google Scholar] [CrossRef]
- Quarles, N.; Kockelman, K.M.; Mohamed, M. Costs and Benefits of Electrifying and Automating Bus Transit Fleets. Sustainability 2020, 12, 3977. [Google Scholar] [CrossRef]
- Kivekas, K.; Vepsalainen, J.; Tammi, K. Stochastic Driving Cycle Synthesis for Analyzing the Energy Consumption of a Battery Electric Bus. IEEE Access 2018, 6, 55586–55598. [Google Scholar] [CrossRef]
- Logan, K.G.; Nelson, J.D.; Hastings, A. Electric and Hydrogen Buses: Shifting from Conventionally Fuelled Cars in the UK. Transp. Res. D Transp. Environ. 2020, 85, 102350. [Google Scholar] [CrossRef]
- Borén, S. Electric Buses’ Sustainability Effects, Noise, Energy Use, and Costs. Int. J. Sustain. Transp. 2019, 1–16. [Google Scholar] [CrossRef] [Green Version]
- Kunith, A.; Mendelevitch, R.; Goehlich, D. Electrification of a City Bus Network—An Optimization Model for Cost-Effective Placing of Charging Infrastructure and Battery Sizing of Fast-Charging Electric Bus Systems. Int. J. Sustain. Transp. 2017, 11, 707–720. [Google Scholar] [CrossRef] [Green Version]
- Csiszár, C.; Csonka, B.; Földes, D.; Wirth, E.; Lovas, T. Urban Public Charging Station Locating Method for Electric Vehicles Based on Land Use Approach. J. Transp. Geogr. 2019, 74, 173–180. [Google Scholar] [CrossRef]
- Chao, Z.; Xiaohong, C. Optimizing Battery Electric Bus Transit Vehicle Scheduling with Battery Exchanging: Model and Case Study. Procedia Soc. Behav. Sci. 2013, 96, 2725–2736. [Google Scholar] [CrossRef] [Green Version]
- Czerepicki, A.; Choromański, W.; Kozłowski, M.; Kazinski, A. Analysis of the Problem of Electric Buses Charging in Urban Transport. Sci. Technol. 2020, 19, 349–355. [Google Scholar] [CrossRef]
- Astaneh, M.; Andric, J.; Löfdahl, L.; Maggiolo, D.; Stopp, P.; Moghaddam, M.; Chapuis, M.; Ström, H. Calibration Optimization Methodology for Lithium-Ion Battery Pack Model for Electric Vehicles in Mining Applications. Energies 2020, 13, 3532. [Google Scholar] [CrossRef]
- Ahmeid, M.; Muhammad, M.; Milojevic, Z.; Lambert, S.; Attidekou, P. The Energy Loss Due to Interconnections in Paralleled Cell Configurations of Lithium-Ion Batteries in Electric Vehicles. In Proceedings of the IEEE 4th International Future Energy Electronics Conference, Singapore, 25–28 November 2019. [Google Scholar] [CrossRef] [Green Version]
- Zavada, J.; Blašković Zavada, J.; Miloš, K. Conditions for Implementing Trolleybuses in Public Urban Transport. PROMET Traffic Transp. 2012, 22, 467–474. [Google Scholar] [CrossRef]
- Wołek, M.; Wolański, M.; Bartłomiejczyk, M.; Wyszomirski, O.; Grzelec, K.; Hebel, K. Ensuring Sustainable Development of Urban Public Transport: A Case Study of the Trolleybus System in Gdynia and Sopot (Poland). J. Clean. Prod. 2021, 279, 123807. [Google Scholar] [CrossRef]
- Wołek, M.; Szmelter-Jarosz, A.; Koniak, M.; Golejewska, A. Transformation of Trolleybus Transport in Poland. Does in-Motion Charging (Technology) Matter? Sustainability 2020, 12, 9744. [Google Scholar] [CrossRef]
- Bartłomiejczyk, M.; Połom, M. The Road to the Development of Electromobility in the Czech’s Prague: From Electric Buses to... Trolleybuses? AUTOBUSY Tech. Eksploat. Syst. Transp. 2019, 24, 22–28. [Google Scholar] [CrossRef]
- Dziubinski, M.; Siemionek, E.; Adamiec, M.; Drozd, A.; Kolodziej, S. Energy Consumption of the Trolleybuses. In Proceedings of the International Conference on Electromagnetic Devices and Processes in Environment Protection with Seminar Applications of Superconductors, Naleczow, Poland, 3–6 December 2017. [Google Scholar] [CrossRef]
- Grygar, D.; Koháni, M.; Štefún, R.; Drgoňa, P. Analysis of Limiting Factors of Battery Assisted Trolleybuses. Transp. Res. Procedia 2019, 40, 229–235. [Google Scholar] [CrossRef]
- Jakubas, A.; Chwastek, K.; Cywiński, A.; Gnatowski, A.; Suchecki, Ł. An Analysis of the Performance of Trolleybus Brushes Developed from Recycled Materials. Appl. Sci. 2020, 10, 7929. [Google Scholar] [CrossRef]
- Correa, G.; Muñoz, P.M.; Rodriguez, C.R. A Comparative Energy and Environmental Analysis of a Diesel, Hybrid, Hydrogen and Electric Urban Bus. Energy 2019, 187, 115906. [Google Scholar] [CrossRef]
- Correa, G.; Muñoz, P.; Falaguerra, T.; Rodriguez, C.R. Performance Comparison of Conventional, Hybrid, Hydrogen and Electric Urban Buses Using Well to Wheel Analysis. Energy 2017, 141, 537–549. [Google Scholar] [CrossRef]
- Stempien, J.P.; Chan, S.H. Comparative Study of Fuel Cell, Battery and Hybrid Buses for Renewable Energy Constrained Areas. J. Power Source 2017, 340, 347–355. [Google Scholar] [CrossRef]
- Misanovic, S.M.; Zivanovic, Z.M.; Tica, S.M. Energy Efficiency of Different Bus Subsystems in Belgrade Public Transport. Therm. Sci. 2015, 19, 2233–2244. [Google Scholar] [CrossRef]
- Imam, R.; Kang, S.-C.; Quezada, D. Exploring Low-Carbon Bus Options for Urban BRT Systems: The Case of Amman. J. Public Trans. 2020, 22. [Google Scholar] [CrossRef]
- Local Data Bank. Available online: https://bdl.stat.gov.pl/BDL/start (accessed on 30 November 2020).
- Act of 16 December 2010 on Public Collective Transport (Journal of Laws of 2011, No. 5, item 13). Available online: https://isap.sejm.gov.pl/isap.nsf/DocDetails.xsp?id=WDU20110050013 (accessed on 30 November 2020).
- Act of 8 March 1990 r. on Local Self-Government (Journal of Laws of 1990, No. 16, item 95). Available online: https://isap.sejm.gov.pl/isap.nsf/DocDetails.xsp?id=WDU19900160095 (accessed on 30 November 2020).
- Szczecin Metropolitan Railway. Available online: http://skm.szczecin.pl/index.php (accessed on 30 November 2020).
- Center for EU Transport Projects. Tablice Kosztów Jednostkowych do Wykorzystania w Analizach Kosztów i Korzyści. Available online: https://www.cupt.gov.pl/wdrazanie-projektow/analiza-kosztow-i-korzysci/narzedzia/tablice-kosztow-jednostkowych-do-wykorzystania-w-analizach-kosztow-i-korzysci (accessed on 30 November 2020).
- Energy Forum. Energy Transition in Poland. Edition 2019. Available online: https://forum-energii.eu/en/analizy/transformacja-2019 (accessed on 30 November 2020).
- Energy Forum. Energy Transition in Poland. Edition 2020. Available online: https://forum-energii.eu/en/analizy/transformacja-2020 (accessed on 30 November 2020).
- Tapio, P.; Banister, D.; Luukkanen, J.; Vehmas, J.; Willamo, R. Energy and Transport in Comparison: Immaterialisation, Dematerialisation and Decarbonisation in the EU15 between 1970 and 2000. Energy Policy 2007, 35, 433–451. [Google Scholar] [CrossRef]
- Dillman, K.J.; Árnadóttir, Á.; Heinonen, J.; Czepkiewicz, M.; Davíðsdóttir, B. Review and Meta-Analysis of EVs: Embodied Emissions and Environmental Breakeven. Sustainability 2020, 12, 9390. [Google Scholar] [CrossRef]
Figure 1.
Stages of the research study.

Figure 2.
Breakdown of the public bus fleet in Szczecin in 2018 by European exhaust emission standard [%].
Figure 2.
Breakdown of the public bus fleet in Szczecin in 2018 by European exhaust emission standard [%].

Figure 3.
Breakdown of the public bus fleet in Szczecin in 2018 by year of manufacture [%].

Figure 4.
Projected amounts of NHMC/NMVOC emissions costs of the public bus fleet in Szczecin in the 2021–2035 period for variants V0 and V1.
Figure 4.
Projected amounts of NHMC/NMVOC emissions costs of the public bus fleet in Szczecin in the 2021–2035 period for variants V0 and V1.

Figure 5.
Projected amounts of NOx emissions costs of the public bus fleet in Szczecin in the 2021–2035 period for variants V0 and V1.
Figure 5.
Projected amounts of NOx emissions costs of the public bus fleet in Szczecin in the 2021–2035 period for variants V0 and V1.

Figure 6.
Projected amounts of PM emissions costs of the public bus fleet in Szczecin in the 2021–2035 period for variants V0 and V1.
Figure 6.
Projected amounts of PM emissions costs of the public bus fleet in Szczecin in the 2021–2035 period for variants V0 and V1.

Figure 7.
Projected amounts of SO2 emissions costs of the public bus fleet in Szczecin in the 2021–2035 period for variants V0 and V1.
Figure 7.
Projected amounts of SO2 emissions costs of the public bus fleet in Szczecin in the 2021–2035 period for variants V0 and V1.

Figure 8.
Projected amounts of CO2 emissions costs of the public bus fleet in Szczecin in the 2021–2035 period for variants V0 and V1.
Figure 8.
Projected amounts of CO2 emissions costs of the public bus fleet in Szczecin in the 2021–2035 period for variants V0 and V1.

Figure 9.
Projected amounts of noise emissions costs of the public bus fleet in Szczecin in the 2021–2035 period for variants V0 and V1.
Figure 9.
Projected amounts of noise emissions costs of the public bus fleet in Szczecin in the 2021–2035 period for variants V0 and V1.

Figure 10.
Breakdown of electricity production in Poland in the years 2018–2019 [%] (data from references [137,138]).


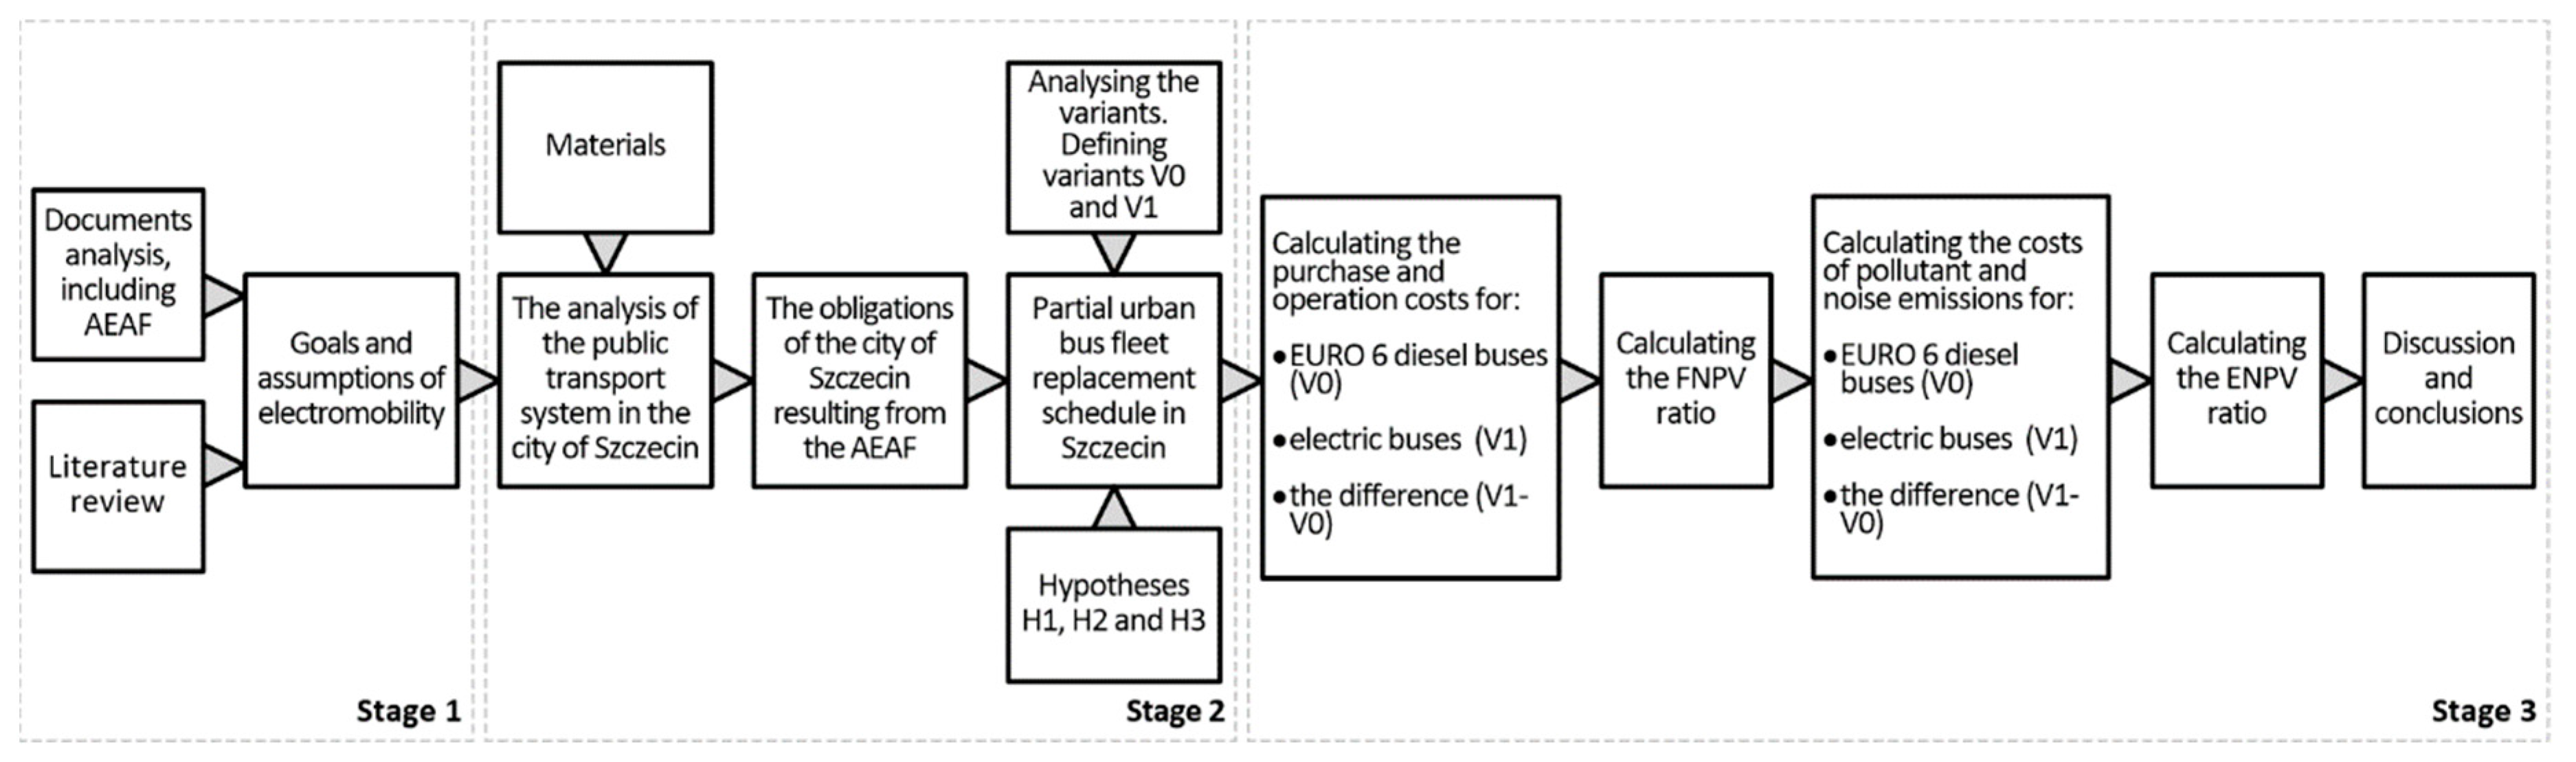
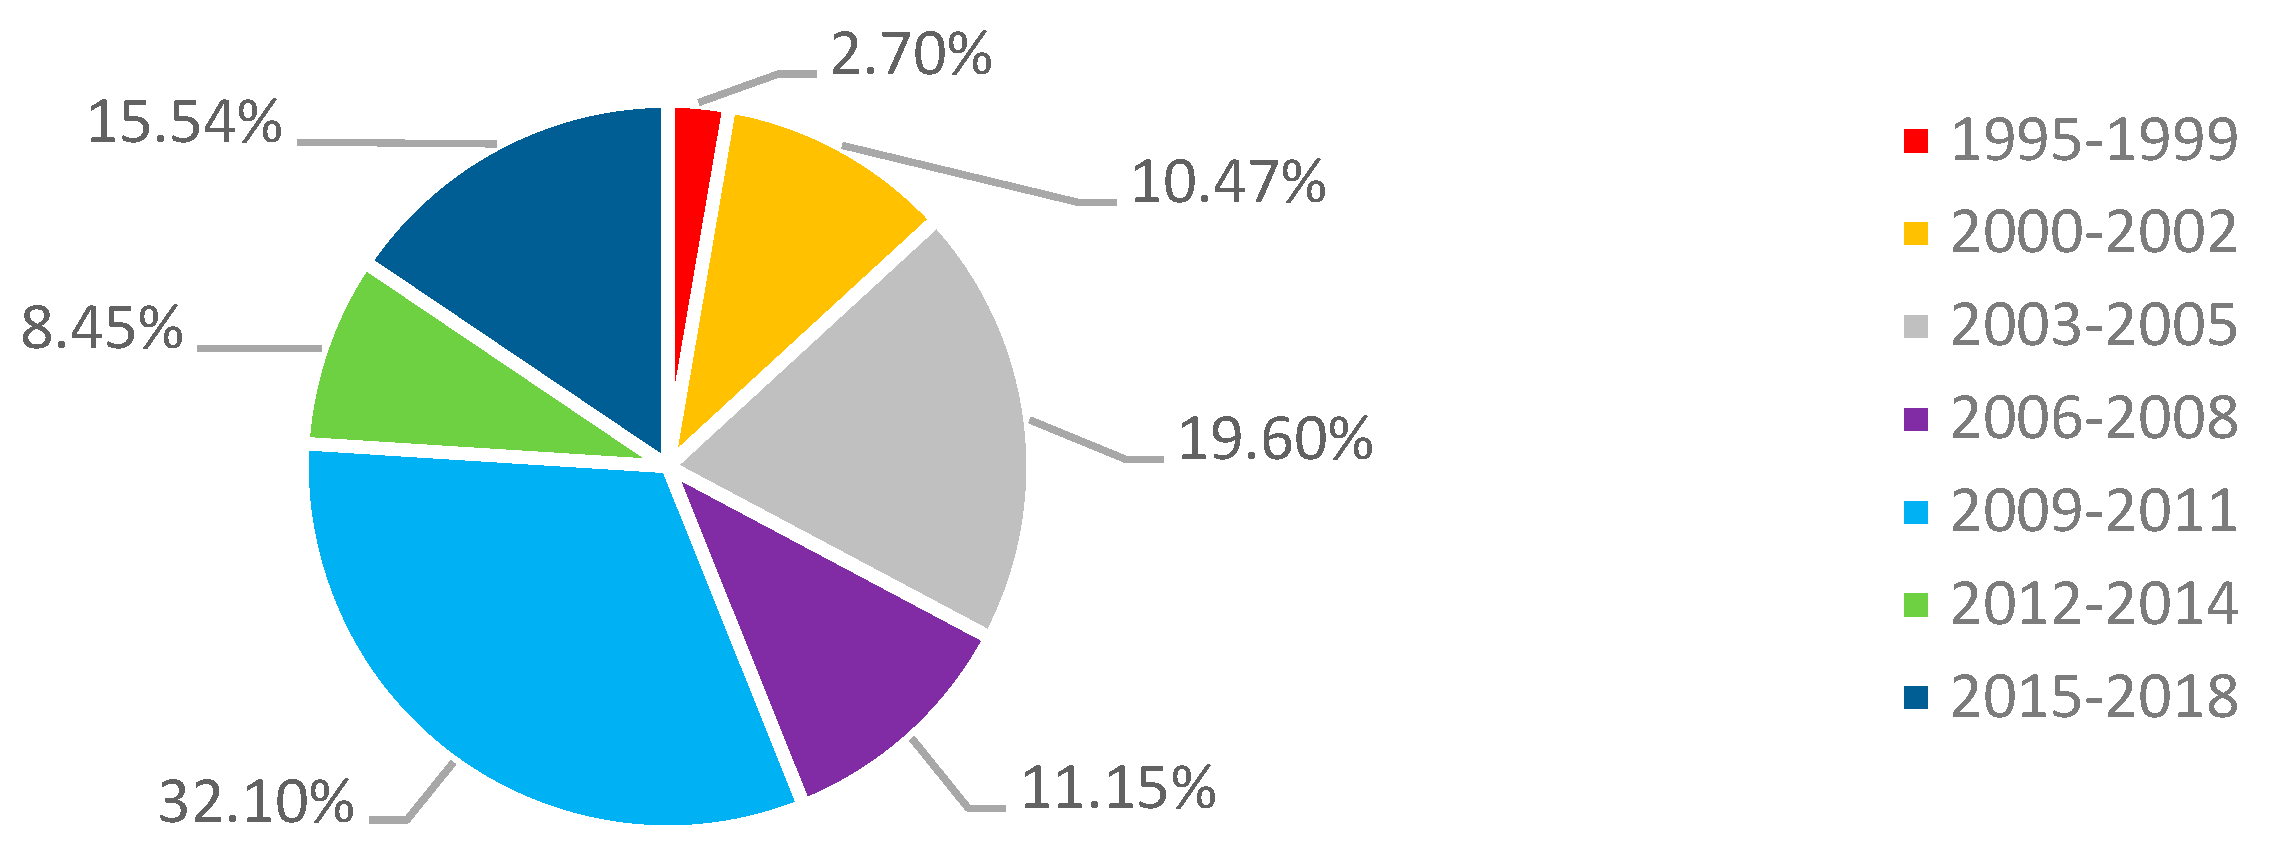
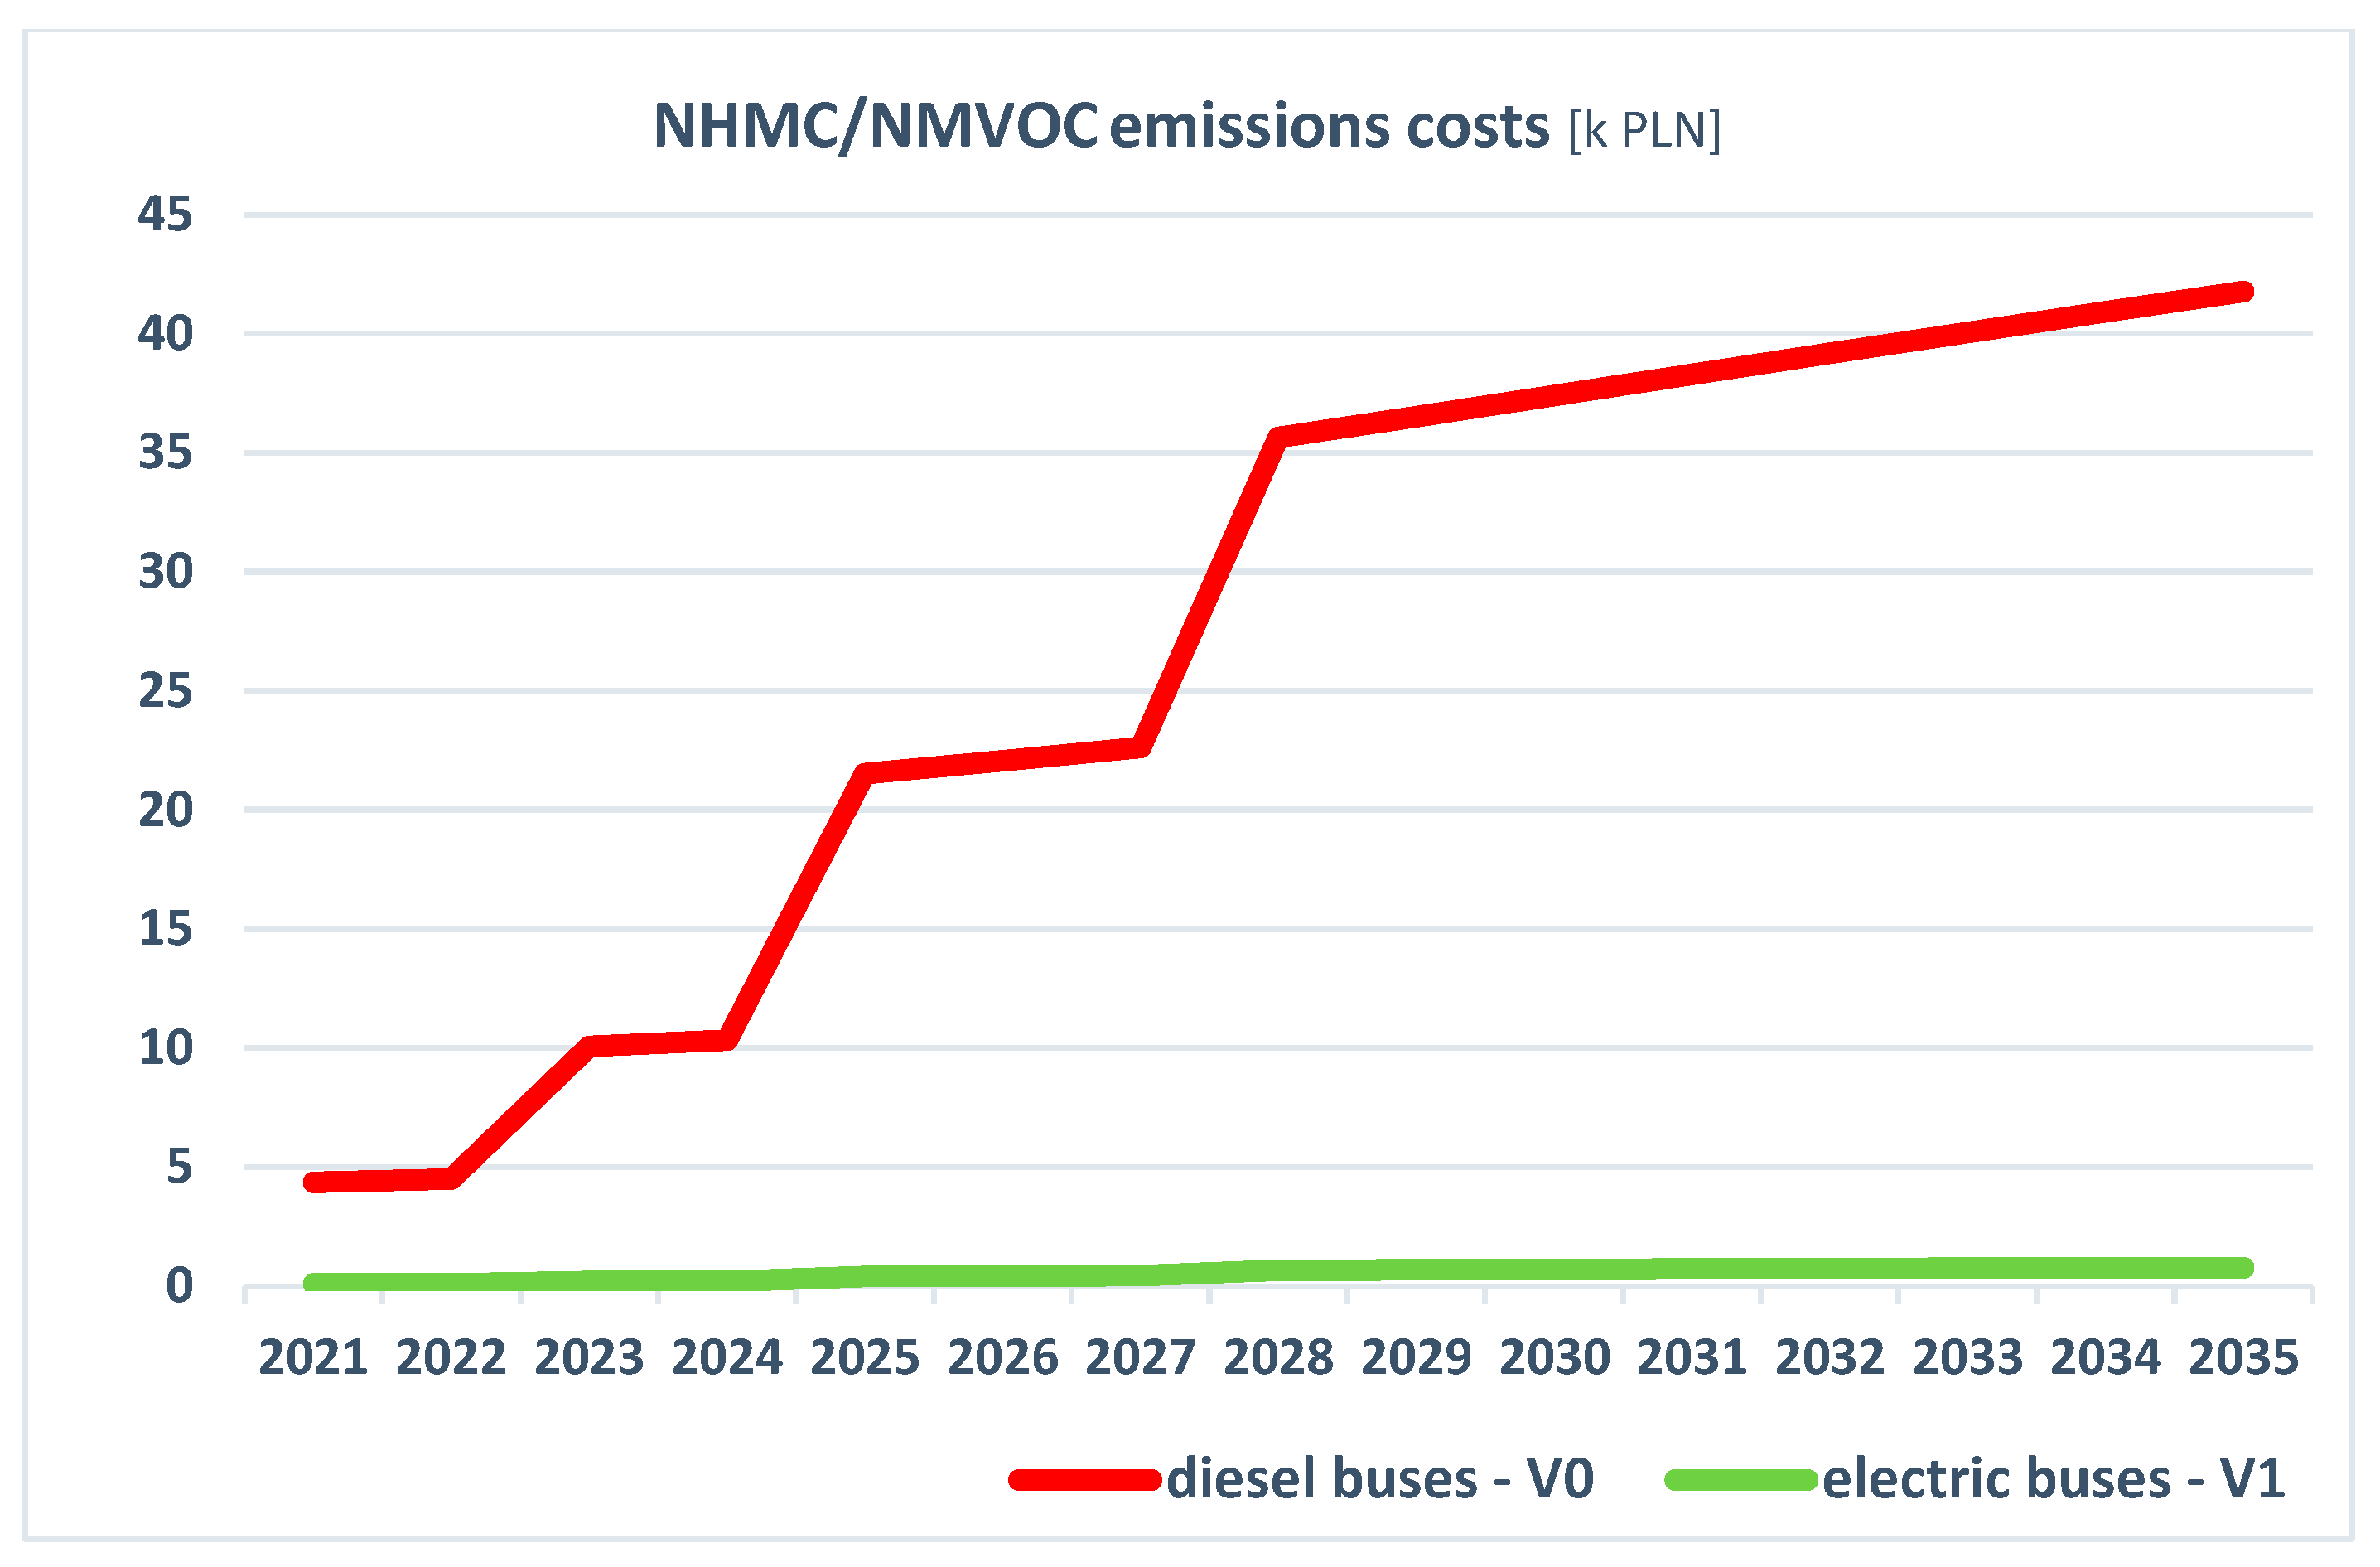
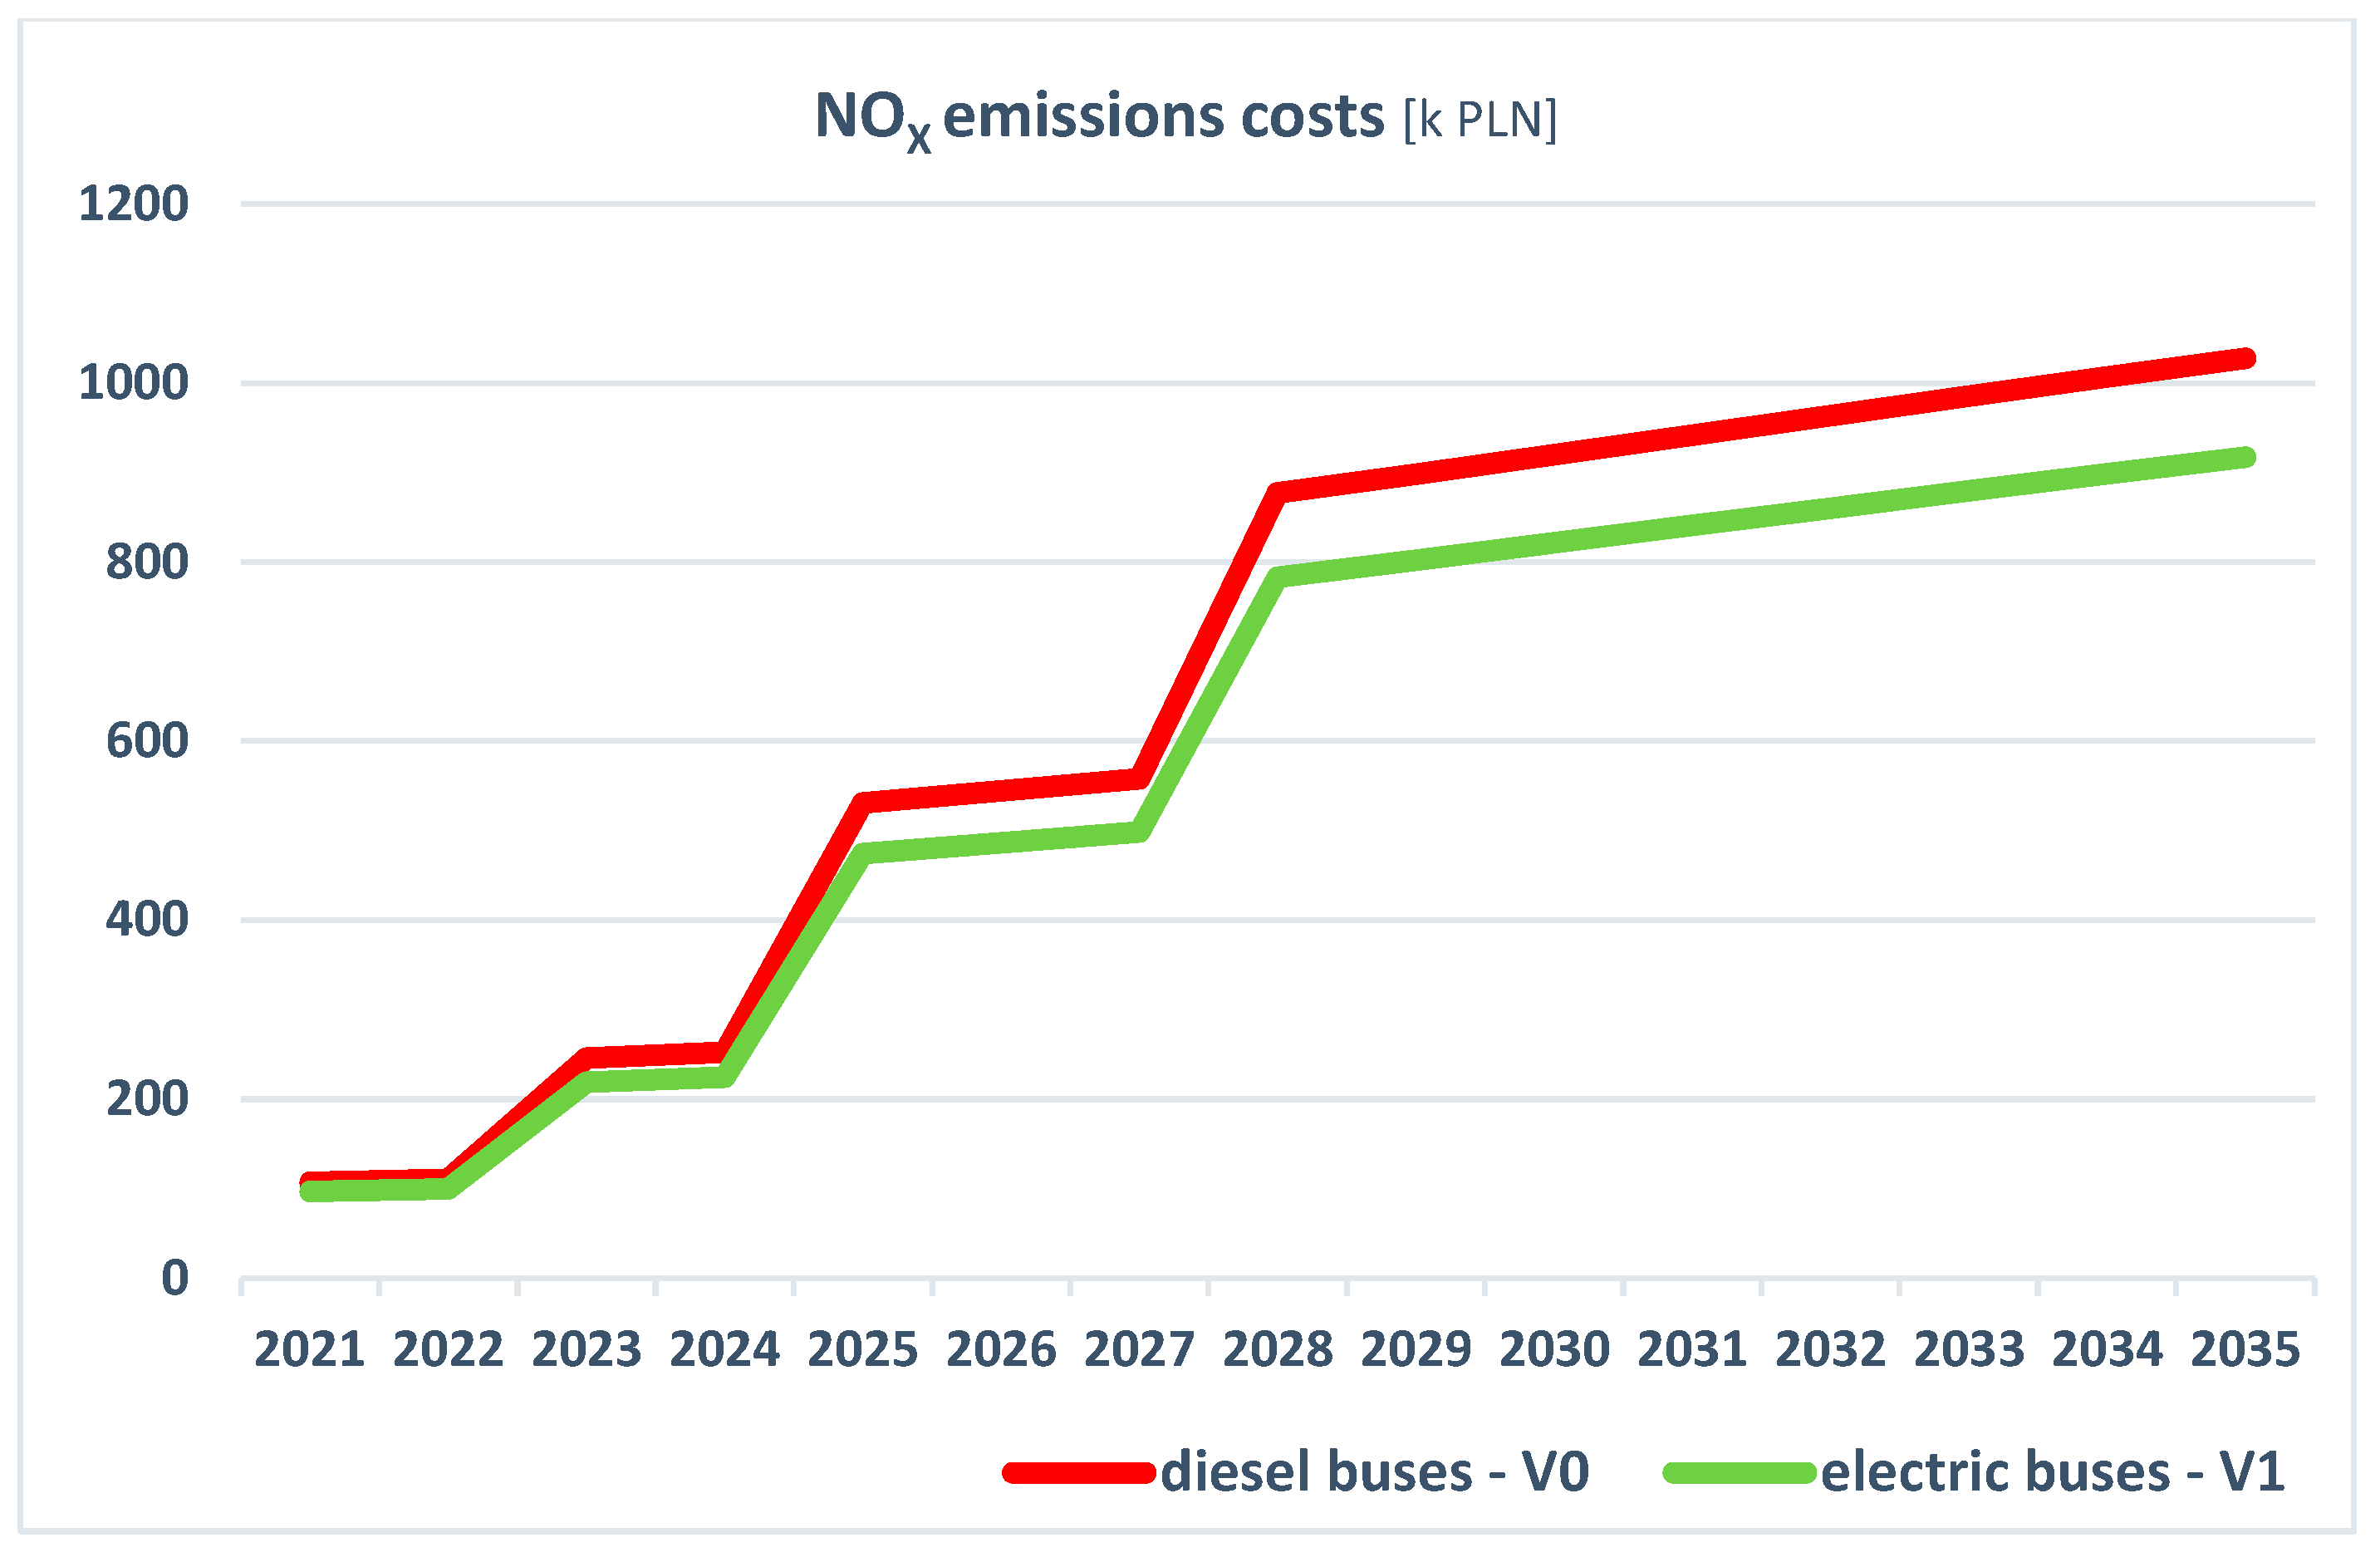
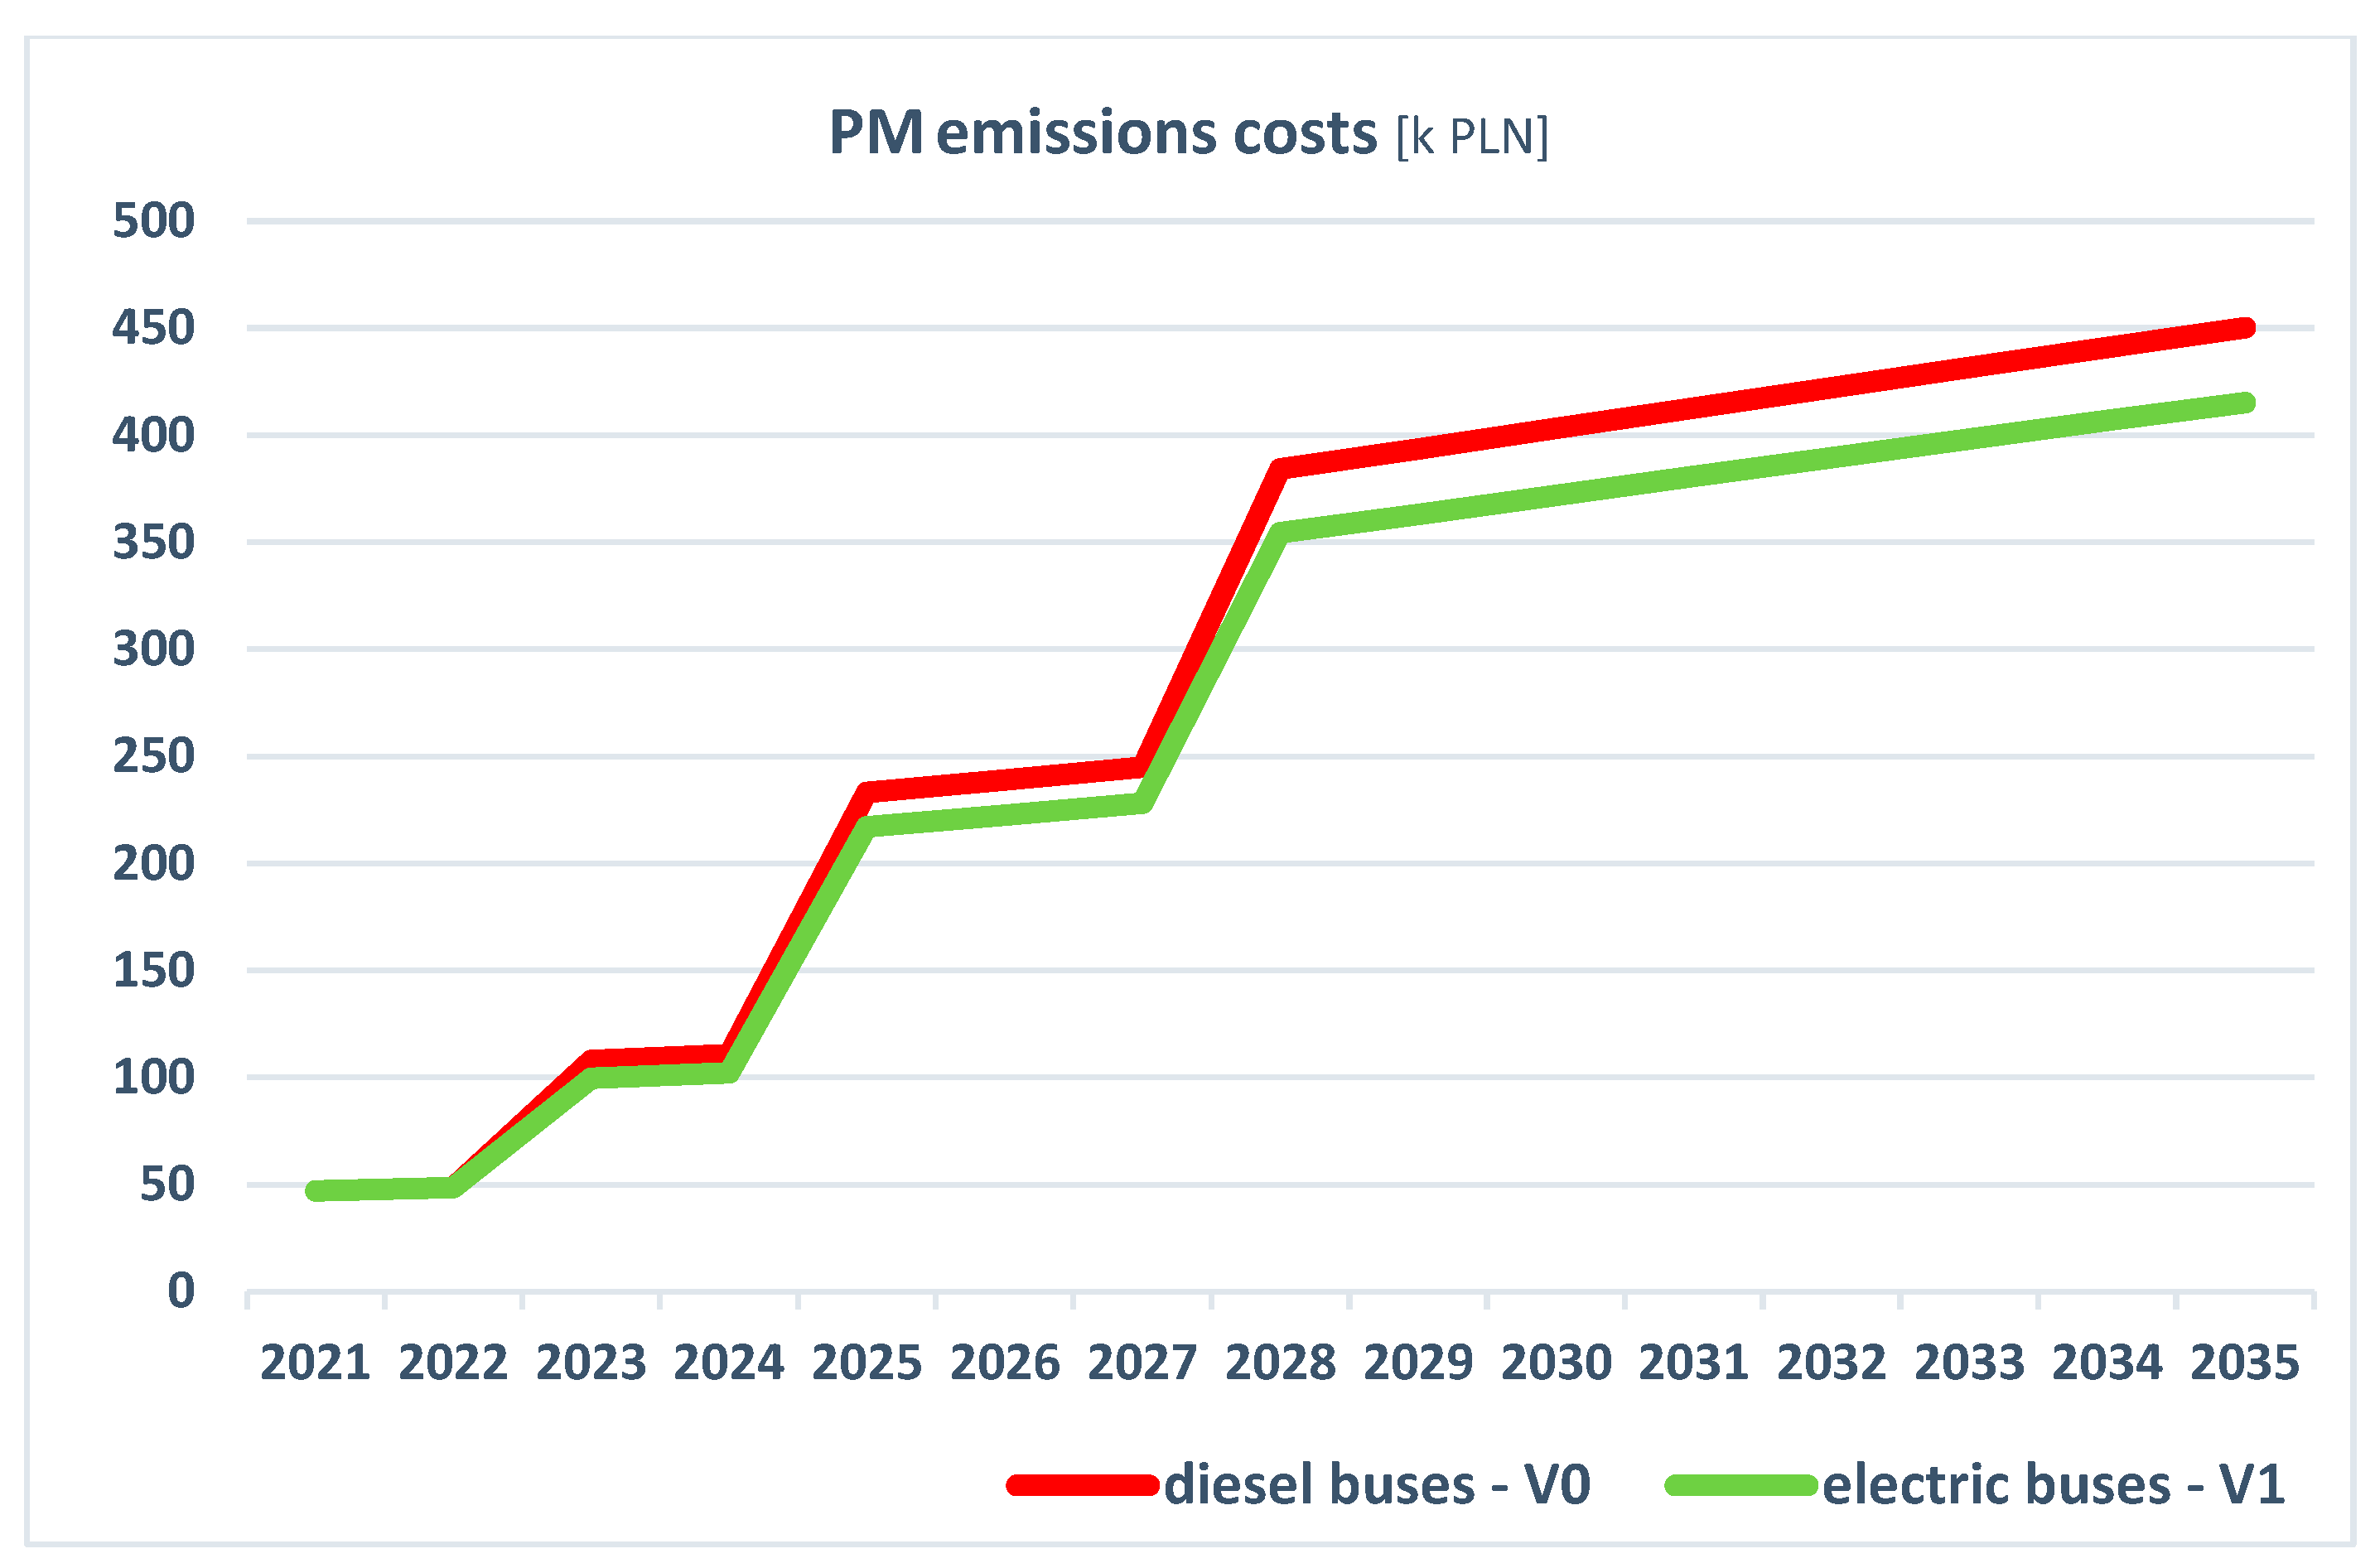
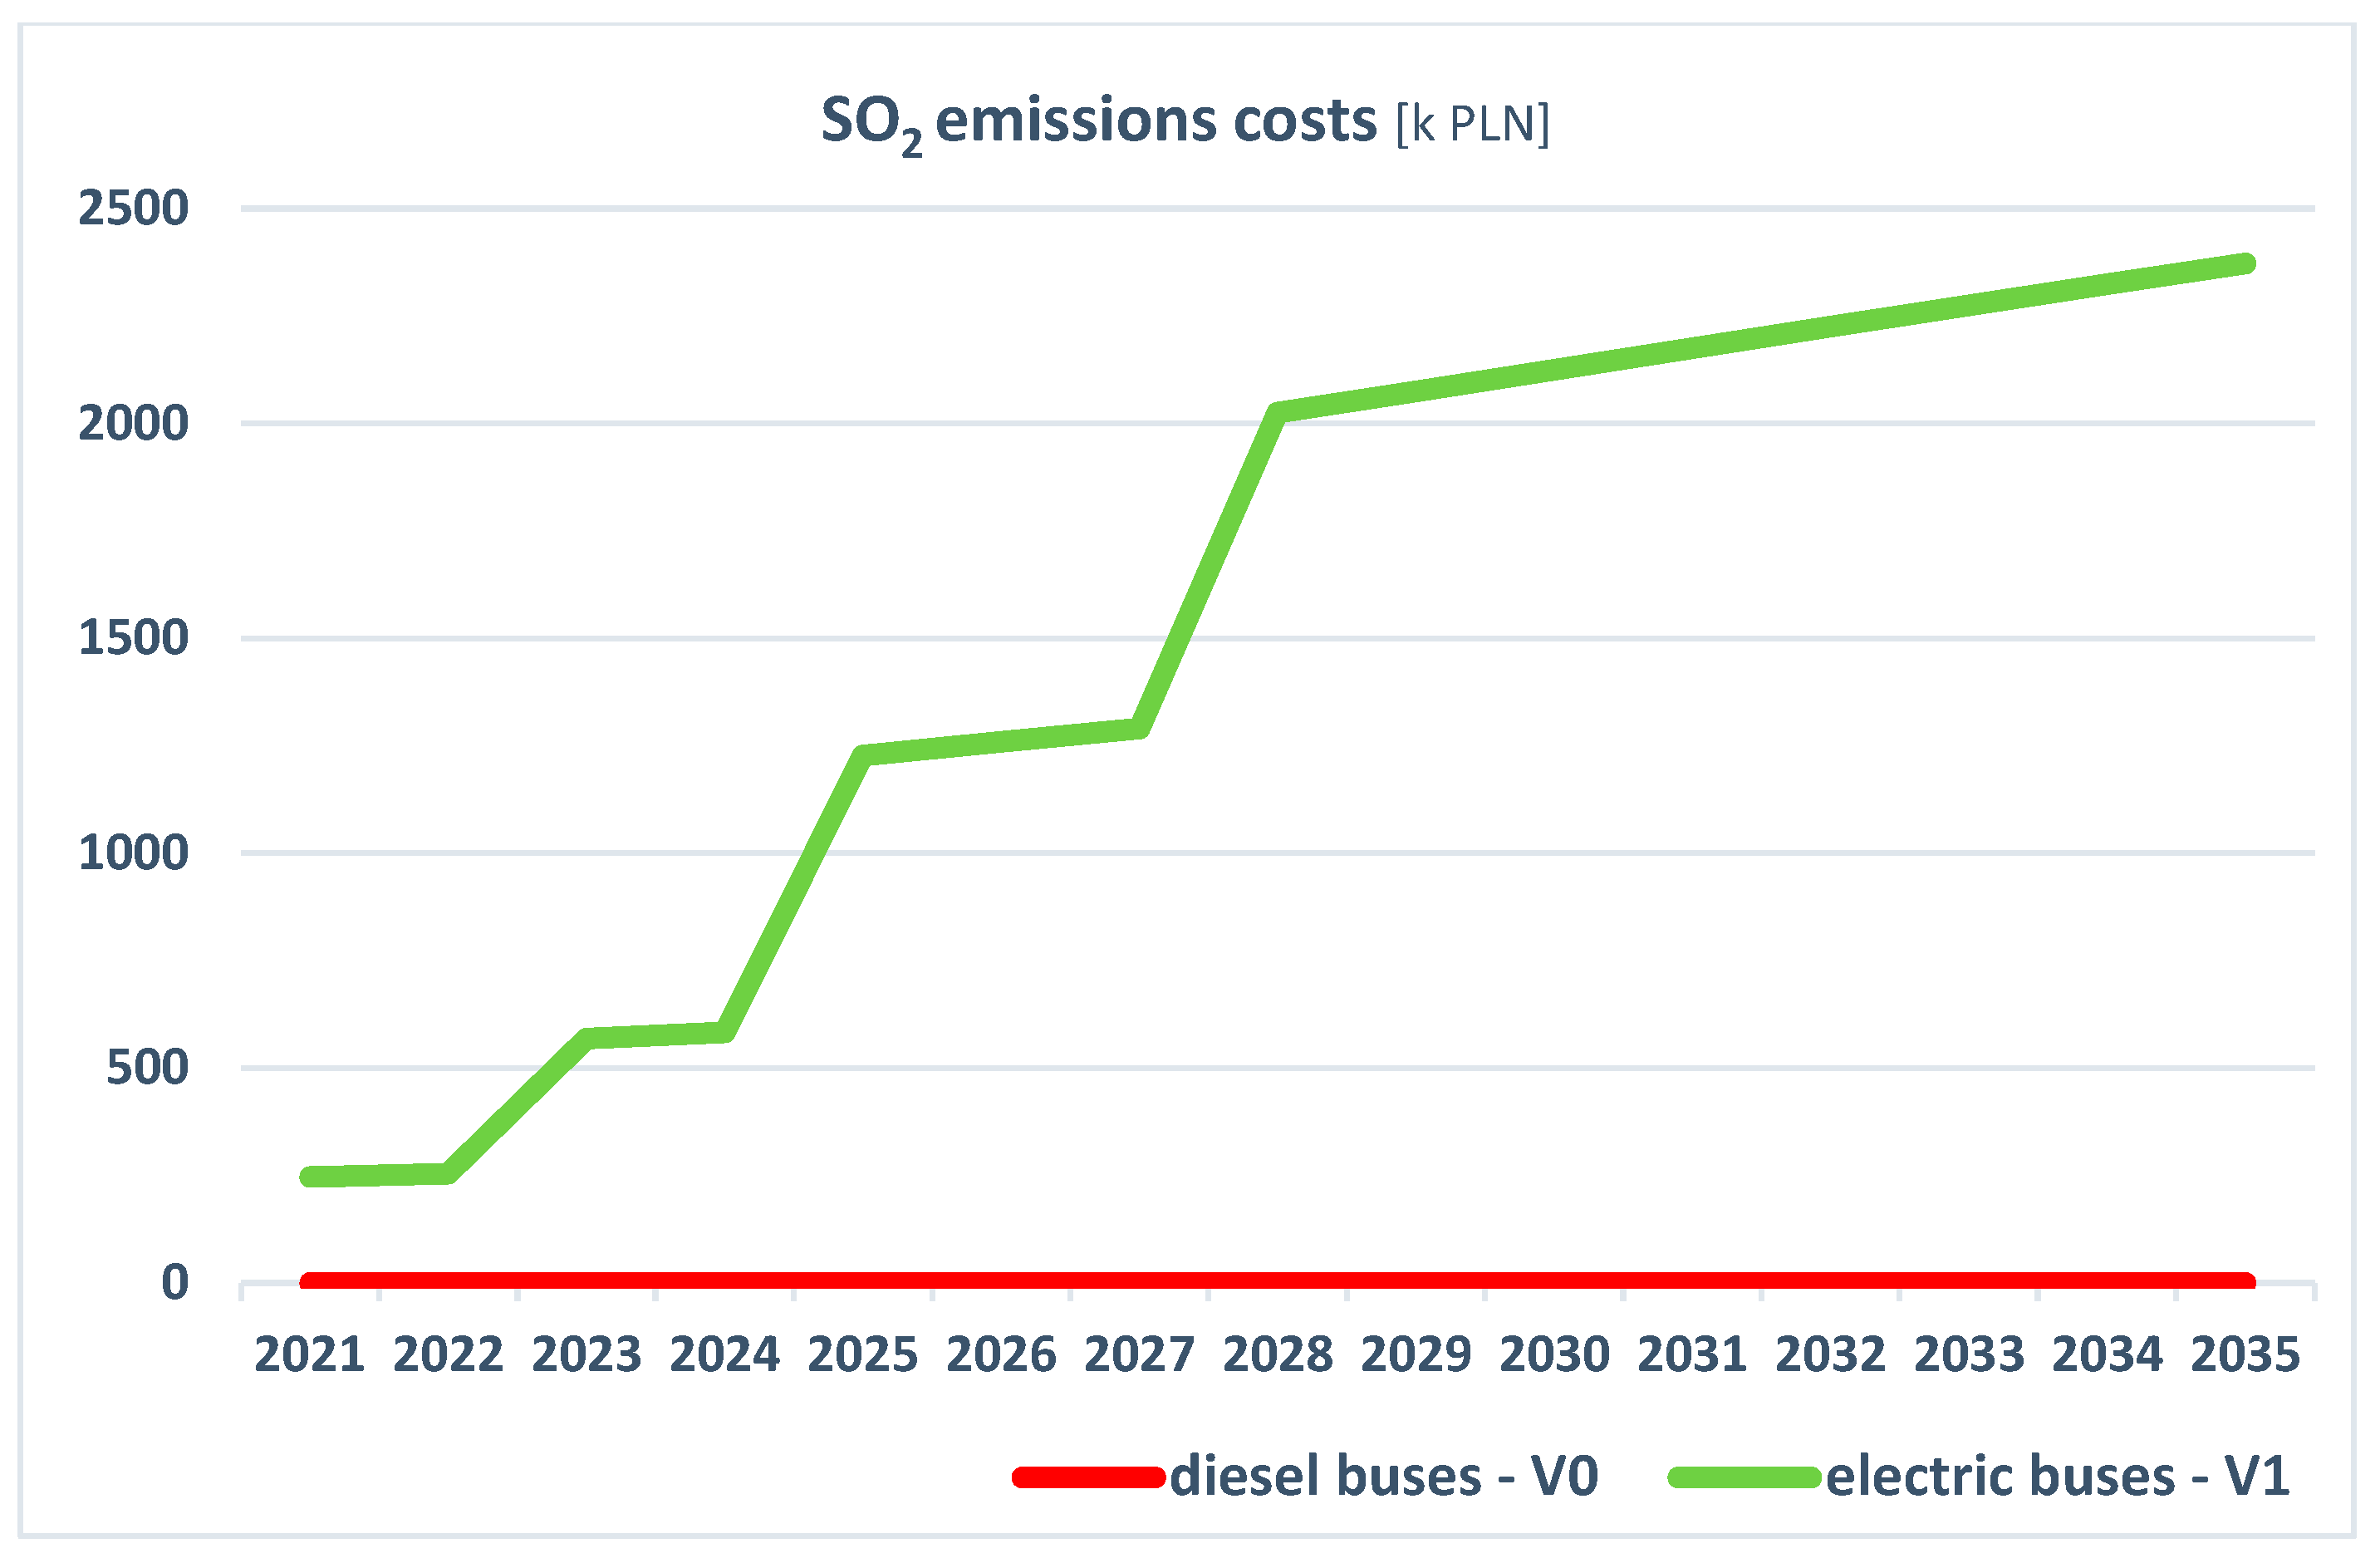
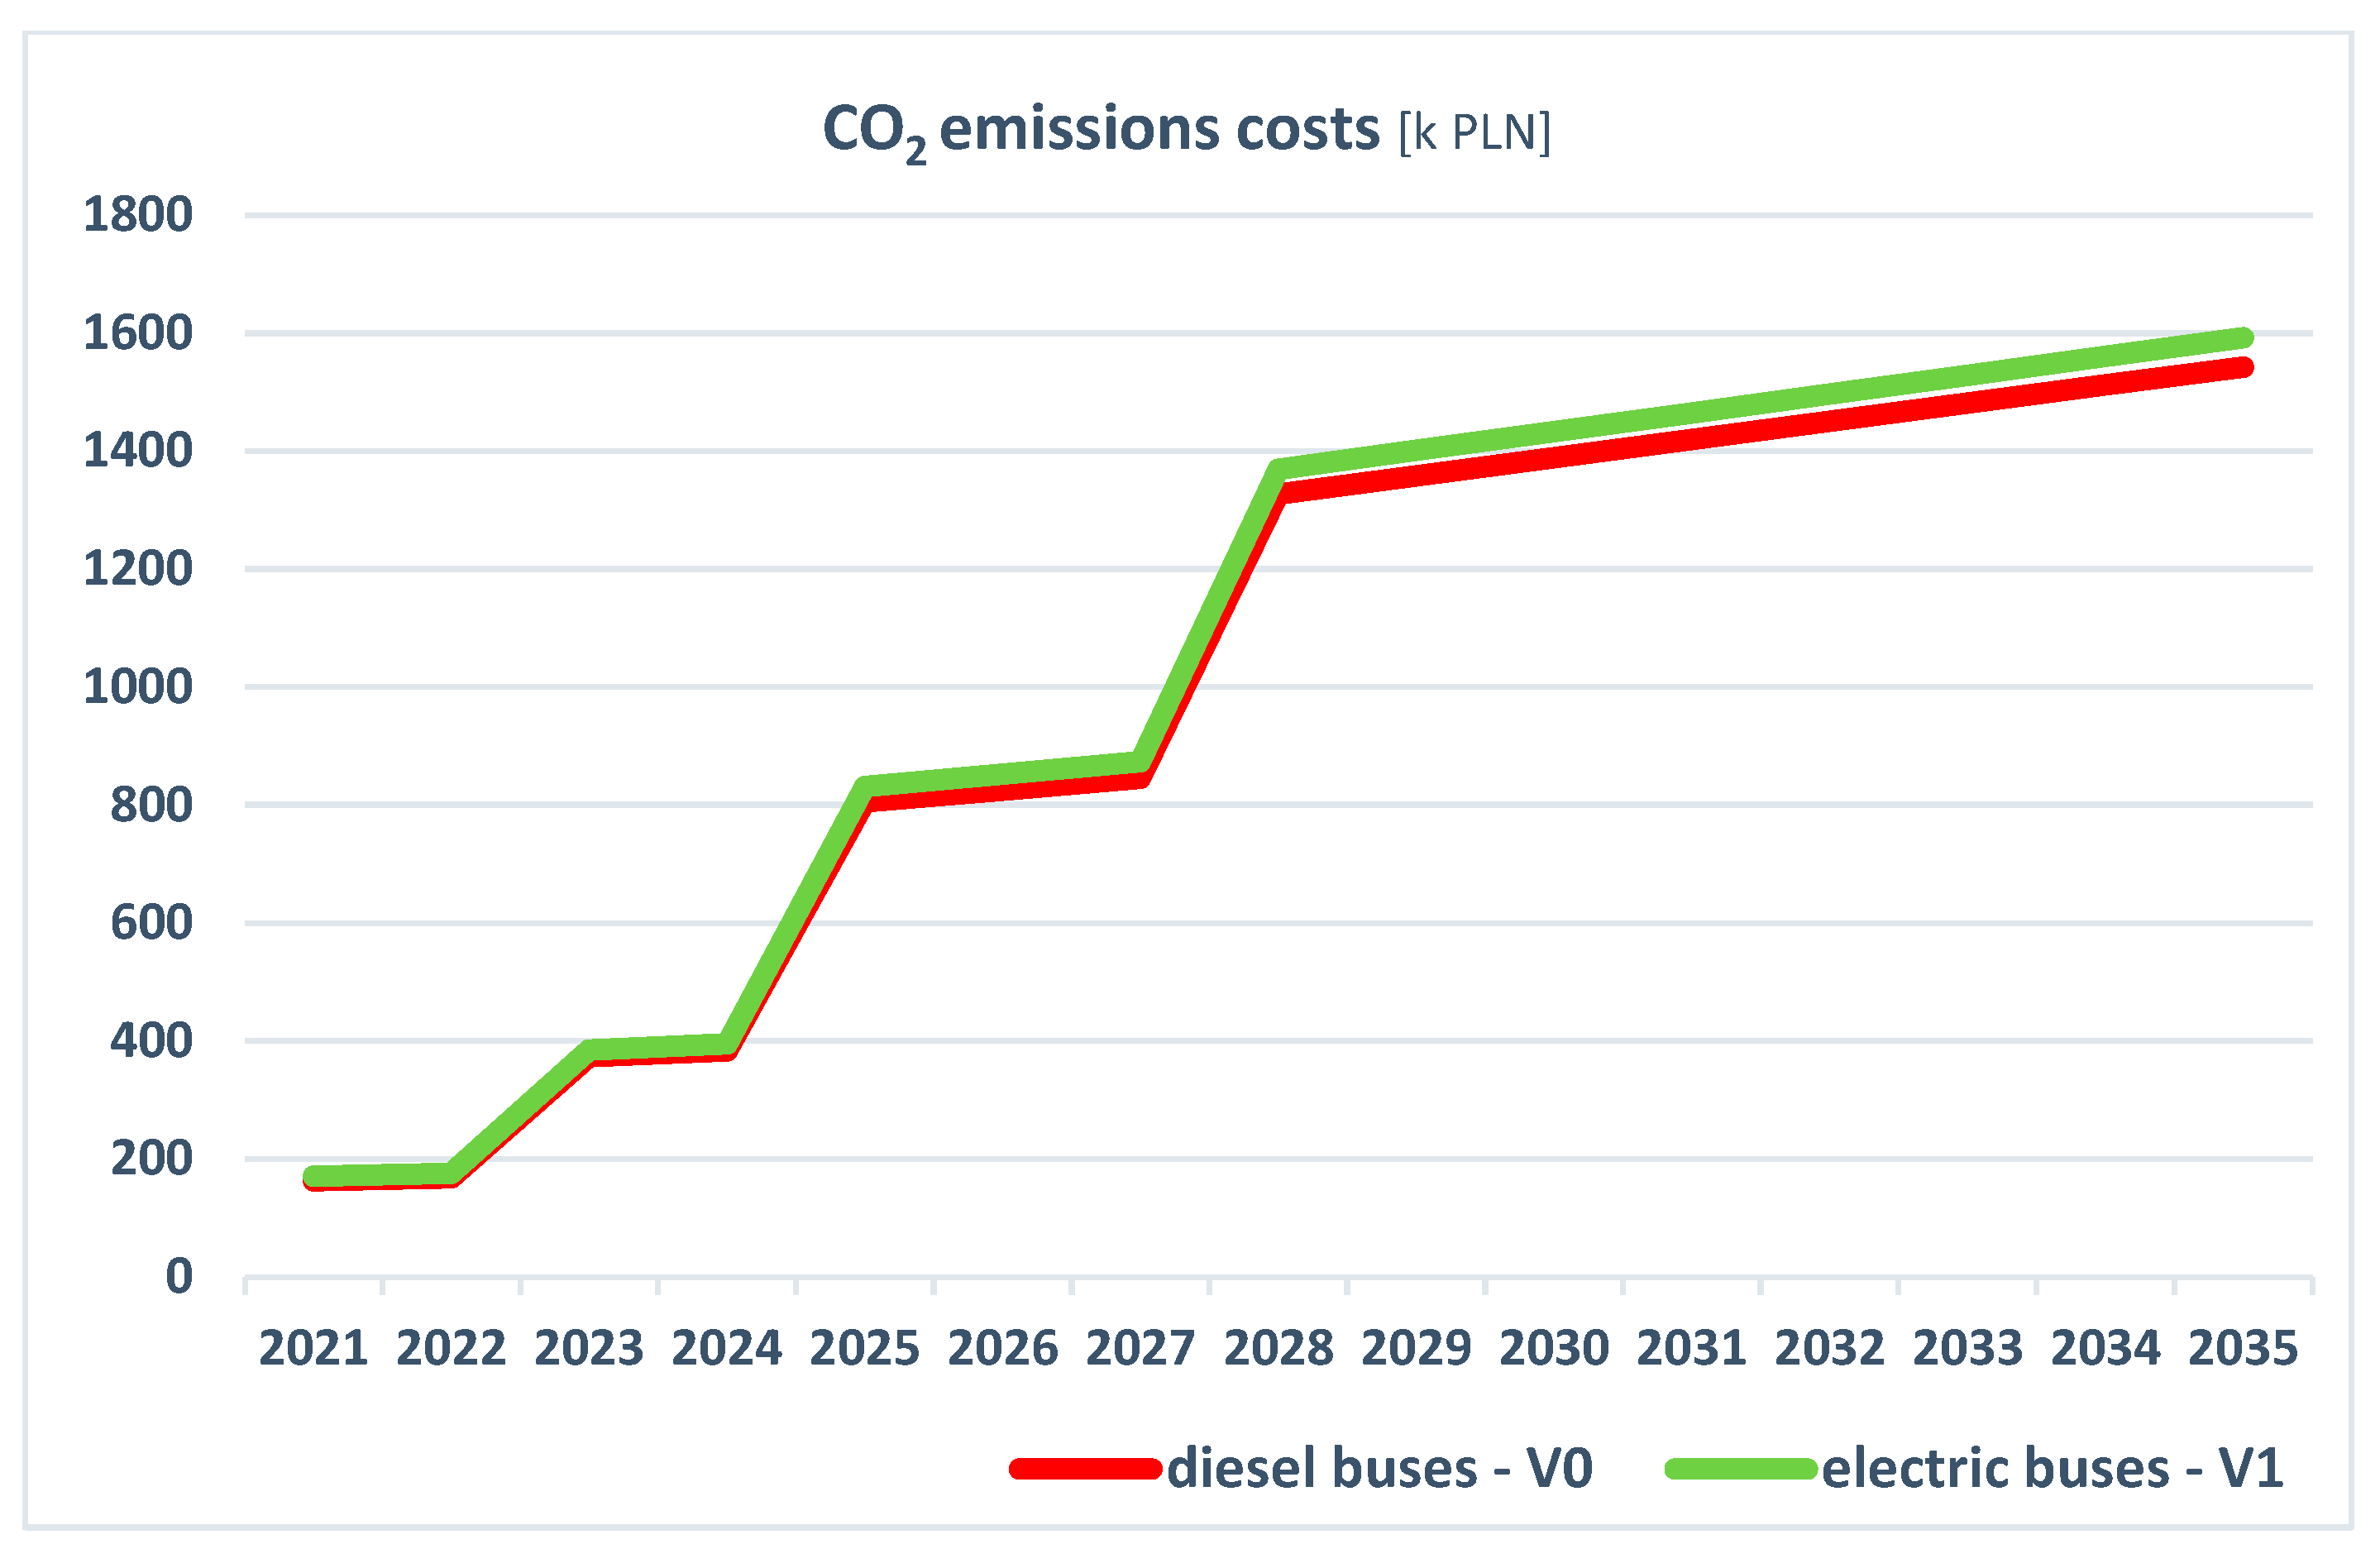
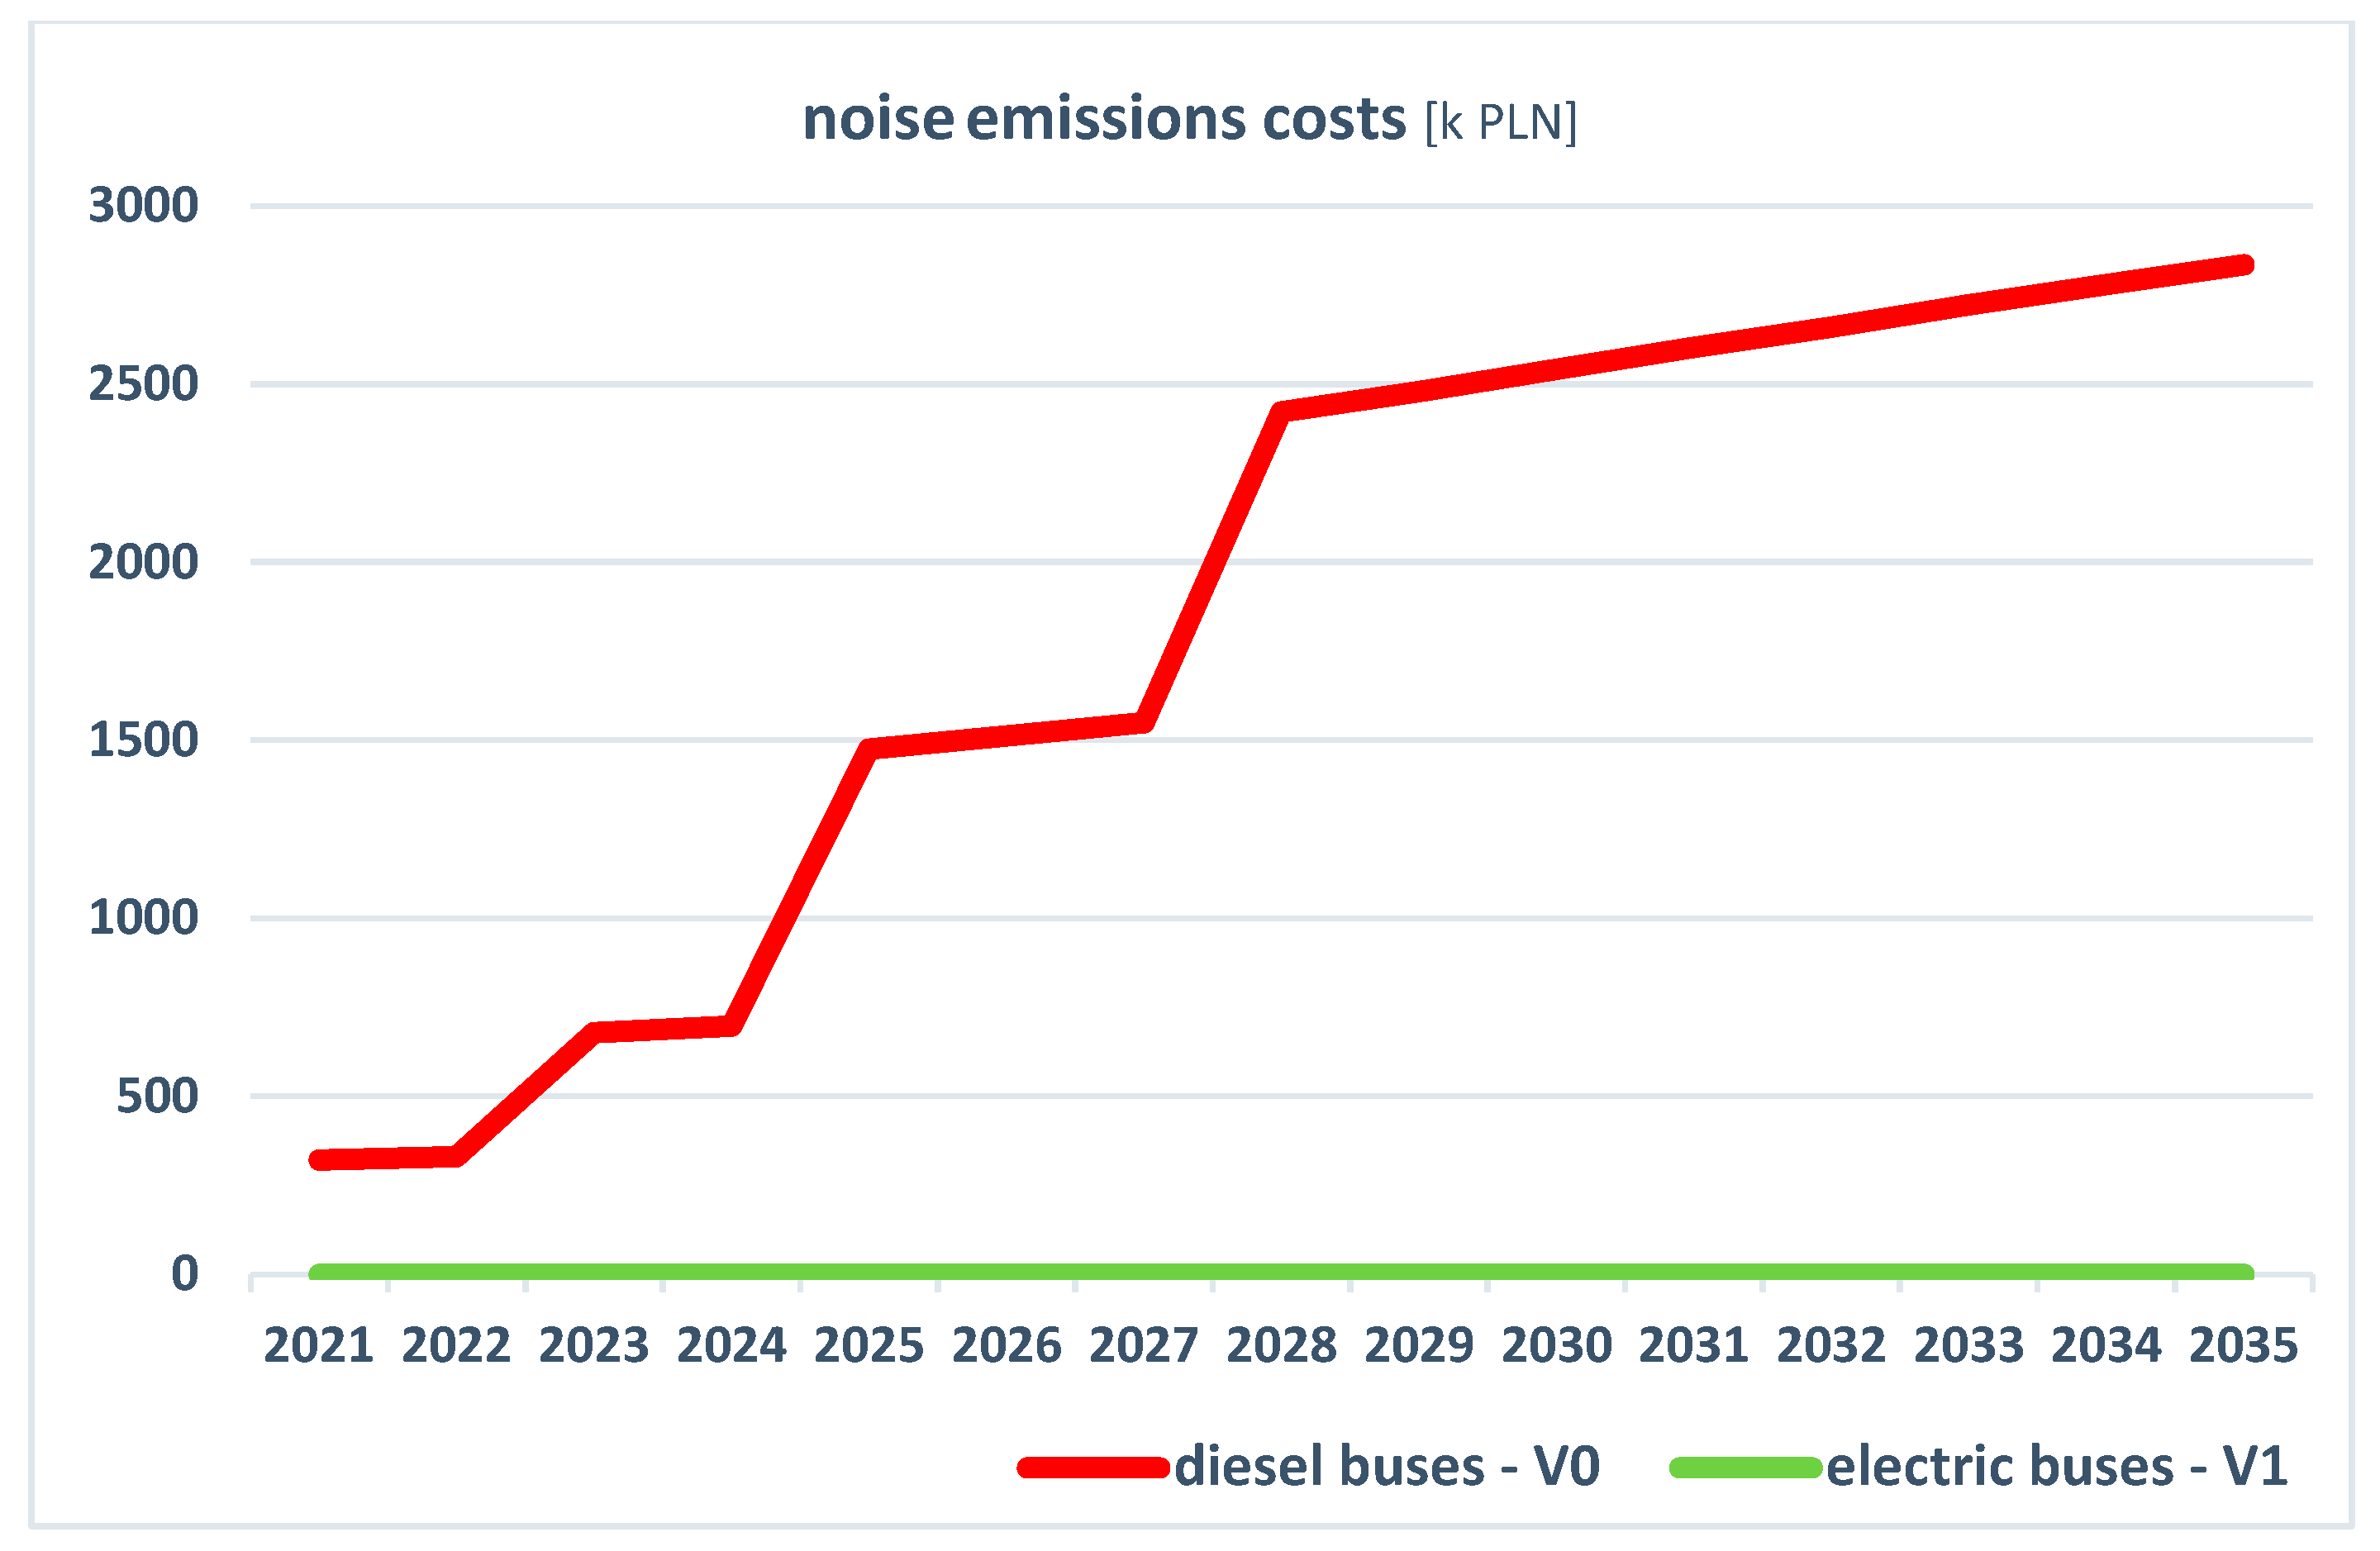
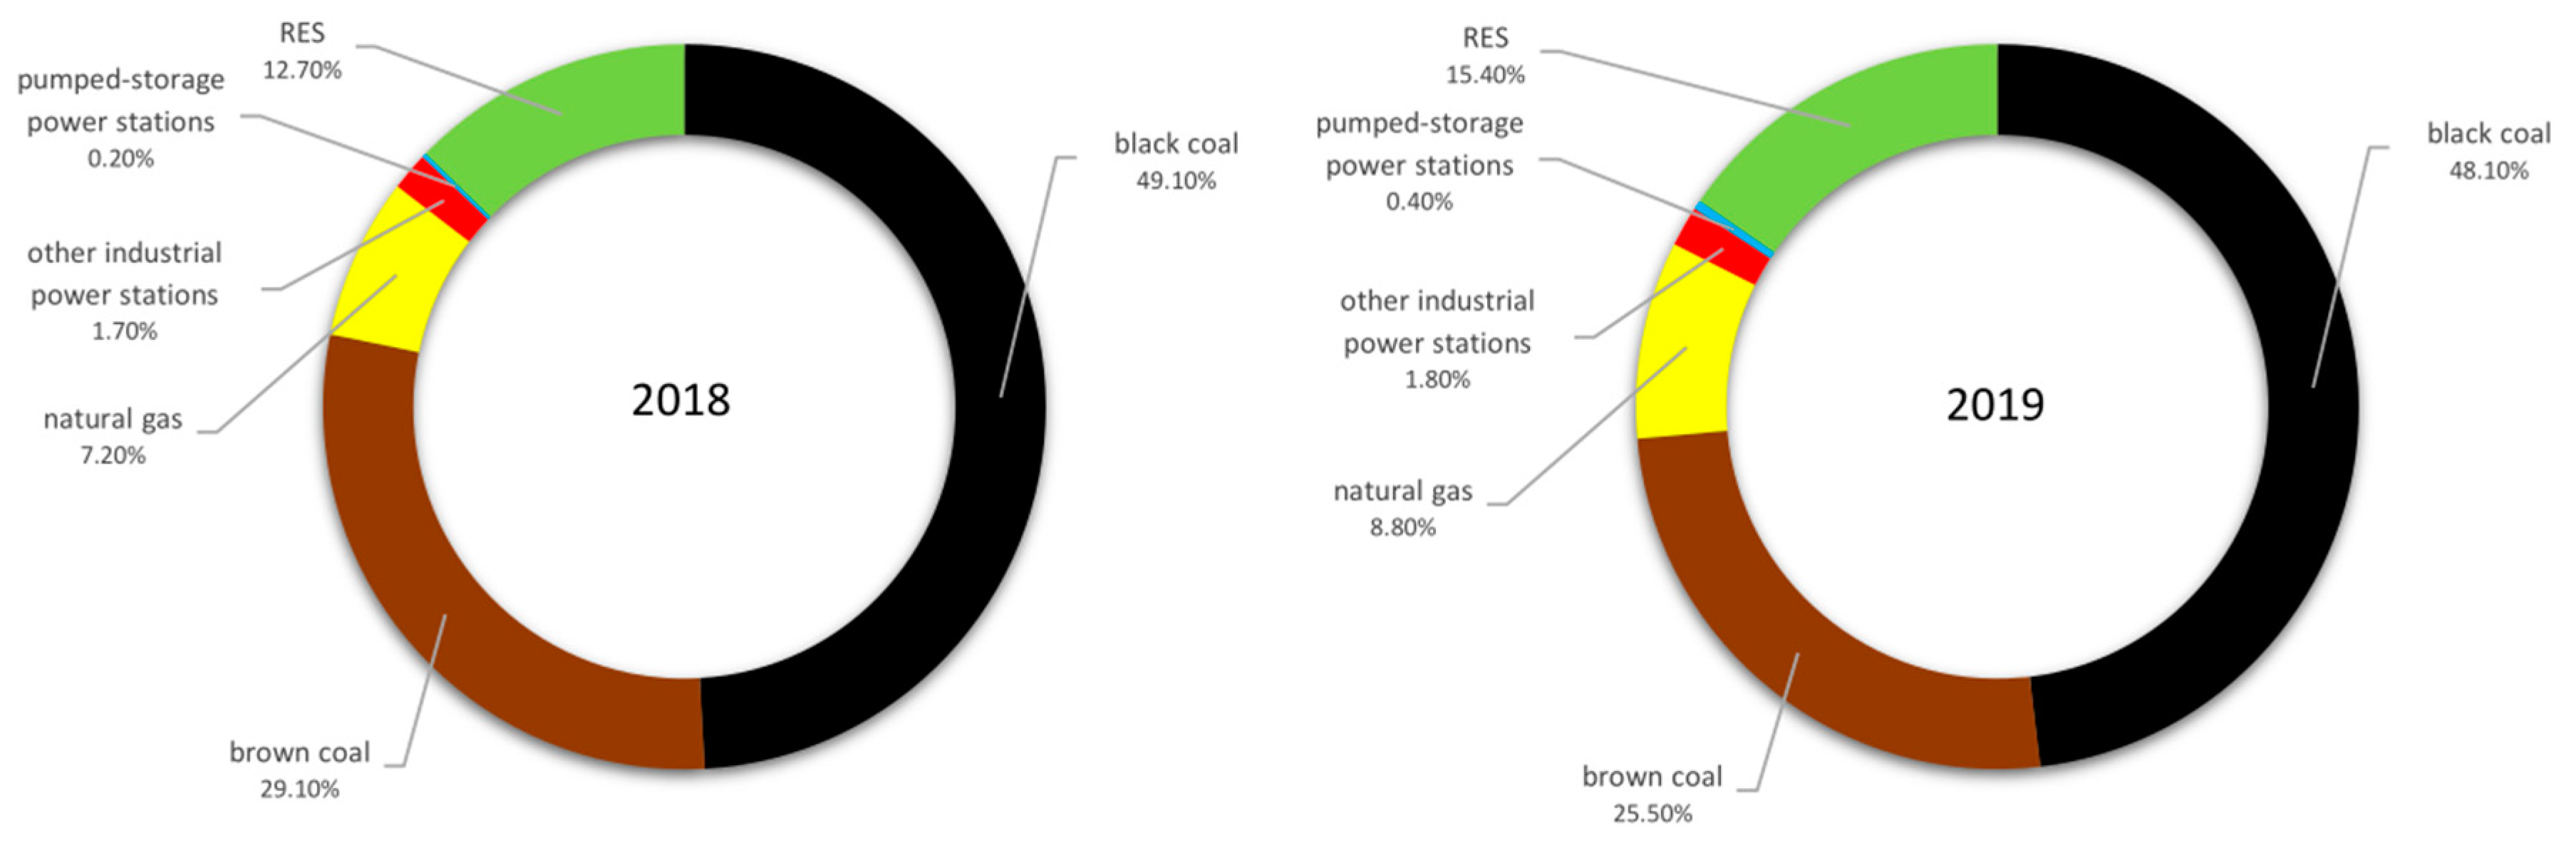
Table 1.
Amounts of pollutant emissions generated by public bus fleet in Szczecin in 2018.
| Number of Vehicles (pcs.) | Transport Activity in 2018 (Vehicle Kilometres Travelled) | Amounts of Pollutant Emissions in 2018 (Tonnes) | ||||
|---|---|---|---|---|---|---|
| NMHC/NMVOC | NOx | PM | SO2 | CO2 | ||
| 296 | 17,420,335 | 37.76 | 215.19 | 3.269 | 0 | 21,214.37 |
Table 2.
Selection of the investment variant.
| Prevalence of the Technology | Meeting AEAF Requirements | Recommendations—Variant | |
|---|---|---|---|
| Hydrogen buses | in development | + | rejected |
| CNG/LPG buses | present on the market | − | rejected |
| Hybrid buses | present on the market | − | rejected |
| Electric buses | present on the market | + | investment (V1) |
Table 3.
Comparing the costs of purchasing the vehicles and supporting infrastructure for variants V0 and V1.
Table 3.
Comparing the costs of purchasing the vehicles and supporting infrastructure for variants V0 and V1.
| V0 | V1 | V1 − V0 (k PLN) | ||||||||
|---|---|---|---|---|---|---|---|---|---|---|
| BUSES | Total Purchase Costs (k PLN) | BUSES | INFRASTRUCTURE | Total Purchase Costs (k PLN) | ||||||
| MAXI (pc) | MEGA (pc) | MAXI (pc) | MEGA (pc) | Batteries (pc) | Plug-in Chargers (pc) | Pantograph Chargers (pc) | ||||
| 2020 | 15 | 0 | 16,500 | 15 | 0 | 8 | 3 | 35,300 | 18,800 | |
| 2021 | 0 | 0 | 0 | |||||||
| 2022 | 5 | 10 | 19,500 | 5 | 10 | 7 | 3 | 43,200 | 23,700 | |
| 2023 | 0 | 0 | 0 | |||||||
| 2024 | 21 | 9 | 35,700 | 21 | 9 | 15 | 5 | 77,200 | 41,500 | |
| 2025 | 0 | 0 | 0 | |||||||
| 2026 | 0 | 0 | 0 | |||||||
| 2027 | 19 | 10 | 34,900 | 19 | 10 | 15 | 4 | 75,300 | 40,400 | |
| 2028 | 0 | 0 | 0 | |||||||
| 2029 | 0 | 0 | 0 | |||||||
| 2030 | 15 | 0 | 16,500 | 15 | 7500 | −9000 | ||||
| 2031 | 0 | 0 | 0 | |||||||
| 2032 | 5 | 10 | 19,500 | 15 | 7500 | −12,000 | ||||
| 2033 | 0 | 0 | 0 | |||||||
| 2034 | 21 | 9 | 35,700 | 30 | 15,000 | −20,700 | ||||
| 2035 | 0 | 0 | 0 | |||||||
Table 4.
Comparing the vehicle operation costs for variants V0 and V1.
| q-ty of Vehicle Kilometres (vkm) | V0 | V1 | V1 − V0 (k PLN) | ||
|---|---|---|---|---|---|
| MAXI Buses (vkm) | MEGA Buses (vkm) | Operation Costs—Purchase of Fuel (k PLN) | Operation Costs—Purchase of Electric Power (k PLN) | ||
| 2020 | 0 | 0 | 0.00 | 0.00 | 0.00 |
| 2021 | 899,910 | 0 | 1430.86 | 449.96 | −980.90 |
| 2022 | 899,910 | 0 | 1430.86 | 449.96 | −980.90 |
| 2023 | 1,199,880 | 599,940 | 3108.46 | 959.90 | −2148.55 |
| 2024 | 1,199,880 | 599,940 | 3108.46 | 959.90 | −2148.55 |
| 2025 | 2,573,718 | 1,139,886 | 6373.44 | 1970.79 | −4402.65 |
| 2026 | 2,573,718 | 1,139,886 | 6373.44 | 1970.79 | −4402.65 |
| 2027 | 2,573,718 | 1,139,886 | 6373.44 | 1970.79 | −4402.65 |
| 2028 | 3,837,065 | 1,834,796 | 9772.87 | 3019.41 | −6753.46 |
| 2029 | 3,837,065 | 1,834,796 | 9772.87 | 3019.41 | −6753.46 |
| 2030 | 3,837,065 | 1,834,796 | 9772.87 | 3019.41 | −6753.46 |
| 2031 | 3,837,065 | 1,834,796 | 9772.87 | 3019.41 | −6753.46 |
| 2032 | 3,837,065 | 1,834,796 | 9772.87 | 3019.41 | −6753.46 |
| 2033 | 3,837,065 | 1,834,796 | 9772.87 | 3019.41 | −6753.46 |
| 2034 | 3,837,065 | 1,834,796 | 9772.87 | 3019.41 | −6753.46 |
| 2035 | 3,837,065 | 1,834,796 | 9772.87 | 3019.41 | −6753.46 |
Table 5.
Annual financial flows for the years 2020–2035.
| Investment Costs V1 − V0 (k PLN) | Operation Costs V1 − V0 (k PLN) | Financial Flows (k PLN) | |
|---|---|---|---|
| 2020 | 18,800 | 0.00 | −18,800.00 |
| 2021 | 0 | −980.90 | 980.90 |
| 2022 | 23,700 | −980.90 | −22,719.10 |
| 2023 | 0 | −2148.55 | 2148.55 |
| 2024 | 41,500 | −2148.55 | −39,351.45 |
| 2025 | 0 | −4402.65 | 4402.65 |
| 2026 | 0 | −4402.65 | 4402.65 |
| 2027 | 40,400 | −4402.65 | −35,997.35 |
| 2028 | 0 | −6753.46 | 6753.46 |
| 2029 | 0 | −6753.46 | 6753.46 |
| 2030 | −9000 | −6753.46 | 15,753.46 |
| 2031 | 0 | −6753.46 | 6753.46 |
| 2032 | −12,000 | −6753.46 | 18,753.46 |
| 2033 | 0 | −6753.46 | 6753.46 |
| 2034 | −20,700 | −6753.46 | 27,453.46 |
| 2035 | 0 | −6753.46 | 6753.46 |
Table 6.
Costs of NHMC/NMVOC, NOx, PM, SO2, CO2 and noise emissions for: V0, V1 and V1 − V0.
| NMHC/NMVOC | NOx | PM | |||||||
| Costs of Emissions (k PLN) | Costs of Emissions (k PLN) | Costs of Emissions (k PLN) | |||||||
| V0 | V1 | V1 − V0 | V0 | V1 | V1 − V0 | V0 | V1 | V1 − V0 | |
| 2020 | 0.00 | 0.00 | 0.00 | 0.00 | 0.00 | 0.00 | 0.00 | 0.00 | 0.00 |
| 2021 | 4.36 | 0.09 | −4.28 | 107.22 | 96.90 | −10.32 | 47.13 | 47.13 | 0.00 |
| 2022 | 4.49 | 0.09 | −4.40 | 110.39 | 99.76 | −10.63 | 48.53 | 48.53 | 0.00 |
| 2023 | 10.07 | 0.19 | −9.88 | 245.95 | 219.08 | −26.86 | 107.93 | 99.63 | −8.30 |
| 2024 | 10.33 | 0.19 | −10.13 | 252.31 | 224.75 | −27.56 | 110.72 | 102.20 | −8.52 |
| 2025 | 21.52 | 0.41 | −21.11 | 530.99 | 474.44 | −56.54 | 233.03 | 217.01 | −16.02 |
| 2026 | 22.06 | 0.42 | −21.65 | 544.45 | 486.47 | −57.98 | 238.94 | 222.51 | −16.43 |
| 2027 | 22.61 | 0.43 | −22.18 | 557.90 | 498.49 | −59.41 | 244.84 | 228.01 | −16.83 |
| 2028 | 35.65 | 0.67 | −34.98 | 877.14 | 782.96 | −94.18 | 384.22 | 354.43 | −29.80 |
| 2029 | 36.51 | 0.68 | −35.83 | 898.36 | 801.90 | −96.46 | 393.52 | 363.00 | −30.52 |
| 2030 | 37.40 | 0.70 | −36.70 | 920.22 | 821.41 | −98.81 | 403.10 | 371.83 | −31.26 |
| 2031 | 38.29 | 0.71 | −37.57 | 942.02 | 840.87 | −101.15 | 412.64 | 380.64 | −32.00 |
| 2032 | 39.17 | 0.73 | −38.44 | 963.72 | 860.24 | −103.48 | 422.15 | 389.41 | −32.74 |
| 2033 | 40.04 | 0.75 | −39.30 | 985.28 | 879.48 | −105.79 | 431.59 | 398.12 | −33.47 |
| 2034 | 40.91 | 0.76 | −40.15 | 1006.65 | 898.56 | −108.09 | 440.96 | 406.76 | −34.20 |
| 2035 | 41.77 | 0.78 | −40.99 | 1027.79 | 917.43 | −110.36 | 450.21 | 415.30 | −34.91 |
| SO2 | CO2 | Noise | |||||||
| Costs of Emissions (k PLN) | Costs of Emissions (k PLN) | Costs of Emissions (k PLN) | |||||||
| V0 | V1 | V1 − V0 | V0 | V1 | V1 − V0 | V0 | V1 | V1 − V0 | |
| 2020 | 0.00 | 0.00 | 0.00 | 0.00 | 0.00 | 0.00 | 0.00 | 0.00 | 0.00 |
| 2021 | 0.00 | 246.63 | 246.63 | 163.18 | 170.72 | 7.54 | 321.27 | 0.00 | −321.27 |
| 2022 | 0.00 | 253.93 | 253.93 | 167.72 | 175.47 | 7.75 | 330.27 | 0.00 | −330.27 |
| 2023 | 0.00 | 568.23 | 568.23 | 372.94 | 384.69 | 11.75 | 678.53 | 0.00 | −678.53 |
| 2024 | 0.00 | 582.92 | 582.92 | 382.74 | 394.79 | 12.06 | 696.53 | 0.00 | −696.53 |
| 2025 | 0.00 | 1227.49 | 1227.49 | 804.86 | 831.39 | 26.53 | 1474.30 | 0.00 | −1474.30 |
| 2026 | 0.00 | 1258.61 | 1258.61 | 825.00 | 852.19 | 27.19 | 1511.44 | 0.00 | −1511.44 |
| 2027 | 0.00 | 1289.70 | 1289.70 | 845.13 | 872.99 | 27.86 | 1548.57 | 0.00 | −1548.57 |
| 2028 | 0.00 | 2025.04 | 2025.04 | 1326.68 | 1369.14 | 42.46 | 2421.88 | 0.00 | −2421.88 |
| 2029 | 0.00 | 2074.03 | 2074.03 | 1357.55 | 1401.00 | 43.45 | 2478.60 | 0.00 | −2478.60 |
| 2030 | 0.00 | 2124.50 | 2124.50 | 1388.42 | 1432.86 | 44.43 | 2540.99 | 0.00 | −2540.99 |
| 2031 | 0.00 | 2174.83 | 2174.83 | 1419.24 | 1464.66 | 45.42 | 2603.38 | 0.00 | −2603.38 |
| 2032 | 0.00 | 2224.93 | 2224.93 | 1450.11 | 1496.52 | 46.41 | 2660.10 | 0.00 | −2660.10 |
| 2033 | 0.00 | 2274.70 | 2274.70 | 1480.98 | 1528.38 | 47.40 | 2722.49 | 0.00 | −2722.49 |
| 2034 | 0.00 | 2324.04 | 2324.04 | 1511.79 | 1560.17 | 48.38 | 2779.21 | 0.00 | −2779.21 |
| 2035 | 0.00 | 2372.84 | 2372.84 | 1542.67 | 1592.04 | 49.37 | 2835.93 | 0.00 | −2835.93 |
Table 7.
Annual economic flows for the years 2020–2035.
| Adjusted Financial Costs (V1 − V0) (k PLN) | Costs of Emissions (V1 − V0) (k PLN) | Economic Flows (k PLN) | ||||||
|---|---|---|---|---|---|---|---|---|
| NHMC | NOx | PM | SO2 | CO2 | Noise | |||
| 2020 | 16,264.00 | 0.00 | 0.00 | 0.00 | 0.00 | 0.00 | 0.00 | −16,264.00 |
| 2021 | −765.10 | −4.28 | −10.32 | 0.00 | 246.63 | 7.81 | −321.27 | 846.53 |
| 2022 | 19,765.90 | −4.40 | −10.63 | 0.00 | 253.93 | 8.86 | −330.27 | −19,683.38 |
| 2023 | −1675.87 | −9.88 | −26.86 | −8.30 | 568.23 | 11.75 | −678.53 | 1819.47 |
| 2024 | 34,269.13 | −10.13 | −27.56 | −8.52 | 582.92 | 12.06 | −696.53 | −34,121.37 |
| 2025 | −3434.07 | −21.11 | −56.54 | −16.02 | 1227.49 | 26.53 | −1474.30 | 3748.03 |
| 2026 | −3434.07 | −21.65 | −57.98 | −16.43 | 1258.61 | 27.19 | −1511.44 | 3755.75 |
| 2027 | 31,573.93 | −22.18 | −59.41 | −16.83 | 1289.70 | 27.86 | −1548.57 | −31,244.49 |
| 2028 | −5267.70 | −34.98 | −94.18 | −29.80 | 2025.04 | 42.46 | −2421.88 | 5781.05 |
| 2029 | −5267.70 | −35.83 | −96.46 | −30.52 | 2074.03 | 43.45 | −2478.60 | 5791.63 |
| 2030 | −13,397.70 | −36.70 | −98.81 | −31.26 | 2124.50 | 44.43 | −2540.99 | 13,936.53 |
| 2031 | −5267.70 | −37.57 | −101.15 | −32.00 | 2174.83 | 45.42 | −2603.38 | 5821.56 |
| 2032 | −16,007.70 | −38.44 | −103.48 | −32.74 | 2224.93 | 46.41 | −2660.10 | 16,571.12 |
| 2033 | −5267.70 | −39.30 | −105.79 | −33.47 | 2274.70 | 47.40 | −2722.49 | 5846.66 |
| 2034 | −23,876.70 | −40.15 | −108.09 | −34.20 | 2324.04 | 48.38 | −2779.21 | 24,465.92 |
| 2035 | −5267.70 | −40.99 | −110.36 | −34.91 | 2372.84 | 49.37 | −2835.93 | 5867.69 |
Publisher’s Note: MDPI stays neutral with regard to jurisdictional claims in published maps and institutional affiliations. |
© 2021 by the authors. Licensee MDPI, Basel, Switzerland. This article is an open access article distributed under the terms and conditions of the Creative Commons Attribution (CC BY) license (http://creativecommons.org/licenses/by/4.0/).
Share and Cite
MDPI and ACS Style
Pietrzak, O.; Pietrzak, K. The Economic Effects of Electromobility in Sustainable Urban Public Transport. Energies 2021, 14, 878. https://doi.org/10.3390/en14040878
AMA Style
Pietrzak O, Pietrzak K. The Economic Effects of Electromobility in Sustainable Urban Public Transport. Energies. 2021; 14(4):878. https://doi.org/10.3390/en14040878
Chicago/Turabian StylePietrzak, Oliwia, and Krystian Pietrzak. 2021. "The Economic Effects of Electromobility in Sustainable Urban Public Transport" Energies 14, no. 4: 878. https://doi.org/10.3390/en14040878
Note that from the first issue of 2016, this journal uses article numbers instead of page numbers. See further details here.