
Green Energy in Central and Eastern European (CEE) Countries: New Challenges on the Path to Sustainable Development


Warsaw School of Economics, 02-554 Warszawa, Poland
Energies 2021, 14(4), 884; https://doi.org/10.3390/en14040884
Submission received: 8 January 2021
/
Revised: 3 February 2021
/
Accepted: 4 February 2021
/
Published: 8 February 2021
(This article belongs to the Special Issue Economic and Policy Challenges of the Energy Transition in CEE Countries)
Abstract
:In the conditions of climate change and the scarcity of natural resources, the future of energy is increasingly associated with the development of the so-called green energy. Its development is reflected in the European Commission strategic vision to transition to a climate-neutral economy. This is a challenge that the Central and Eastern European (CEE) countries, members of the EU, are also trying to meet. In recent years, these countries have seen an increase in the share of renewable energy and a reduction in greenhouse gas emissions (GGE). On the other hand, basing the energy sector on unstable energy sources (photovoltaics and wind technologies) may imply new challenges on the way to sustainable development. These are old problems in a new version (ecology, diversification of supplies) and new ones related to the features of renewable energy sources (RES; instability, dispersion). The aim of the article was to classify, on the basis of taxonomic methods, the CEE countries from the point of view of green energy transformation (original indicator) and to predict new threats to Romania, Poland, and Bulgaria, the countries representing different groups according to the applied classification. The issues presented are part of a holistic view of RES and can be useful in energy policy.
1. Introduction
Given the conditions of climate change [1] and the scarcity of natural resources, the future of power engineering is increasingly associated with the development of the so–called green, renewable energy. However, the concept of green energy does not always refer only to the renewable energy sources (RES). Its key feature is the lack of negative impact on the environment. This is what characterizes not only renewable energy, namely, solar, wind, hydro, geothermal, biomass, and biofuels, but also nuclear energy [2]. Nevertheless, in most research studies, green energy is perceived as renewable green energy [3]. It constitutes a strategic direction for the EU on its path towards sustainable development [4]. In 2009, the EU adopted a broad package of 2020 commitments: a 20% increase in energy efficiency, a 20% reduction in greenhouse gas emissions (GGE) (compared to 1990 levels), and a 20% increase in renewable energy [5,6]. The assumption is that in 2050 more than 80% of electricity will come from RES [7]. For some member states, these ambitious targets may be difficult to meet [8].
Transition to a climate-neutral economy by 2050 is a major challenge overall, but especially for Central and Eastern European (CEE) countries that show a certain “delay” in relation to the more developed countries of Western Europe. It has roots in their former economic system—their energy was largely based on solid fuels, and little importance was given to the economy’s energy intensity and negative environmental effects. Political transformation and accession of these CEE states to the EU have brought about some significant changes in their energy structure and energy intensity. Consequently, they have been developing solar and wind energy dynamically. This trend has led to a significant GGE reduction. On the other hand, basing the energy sector on unstable energy sources (such as the sun and wind) may imply new challenges on the path to sustainable development. These are old problems in a new form (i.e., ecology and diversification of supplies) and new problems related to the very features of RES (such as their instability or dispersion).
This article aims to classify CEE countries by their transformation towards green energy and to predict new threats (if any) to Romania, Poland, and Bulgaria, countries representing different groups, according to the applied classification. The issues presented are part of a holistic view of RES and can be useful in energy policy.
2. Methodology
The research methodology consists of 4 stages. The first stage is the literature review presenting (1) the specificity of the process of energy transformation in CEE countries; (2) features of solar and wind energy, i.e., the most dynamically developing sectors of green renewable energy in CEE countries; (3) new (old) challenges of the energy transformation of the CEE countries on the way to sustainable development.
Stage 2 presents the energy structure of select CEE countries. The empirical analysis was limited to the following socio-economically homogeneous countries: Bulgaria, Estonia, Lithuania, Latvia, Poland, the Czech Republic, Romania, Slovakia, Slovenia, and Hungary. Having undergone through the process of transformation of their economic and political systems, these countries are classified, nowadays, as highly developed [9], and have similar challenges with regards to green energy transformation. The calculations in stage 2 were carried out on the basis of the International Renewable Energy Agency [10].
Stage 3 is the classification of CEE countries according to the green energy transformation index. For the classification of countries, we used the distance from the pattern method and the Ward’s method (cluster analysis). They are included in the group of clustering methods [11] recognized as important data mining techniques. They are applicable (also in social sciences) in assessing the similarities and differences between the studied objects (countries) [12,13]. In both methods used, the classification is based on the Euclidean distance matrices (EDMs) [14,15]. These methods lead to the determination of clusters of objects (countries), i.e., obtaining homogeneous classes of objects due to the objects’ features [16]. On this basis, we were able to assess the level of participation of each country in the studied group, the internal homogeneity of the group, and its cohesion and stability of development [17]. The method of distance from the pattern, included in the taxonomic methods of linear ordering, allows us to define the hierarchy of objects. On the other hand, the Ward’s method (non-linear ordering) allows us to determine the similarity of objects without establishing their hierarchy [18].
In the construction of the synthetic index of energy transformation (STEP A), we used an algorithm of the taxonomic method of distance from the pattern [19,20], which provided the basis for the classification of countries with different levels of energy transformation. The research algorithm included
- Selection of partial indicators describing the manifestations of key importance for this transformation. In the authors’ approach, the partial indicators were (1) energy productivity (being the reciprocal of the economy’s energy consumption), expressed in purchasing power standard (PPS) per kilogram of oil equivalent (kgoe); (2) share of renewable energy in gross final energy consumption; and (3) growth index of GGE in relation to the year 2000. The selection of indicators was dictated by the policy pursued in the EU. In the field of energy transformation, great emphasis is also placed on reduction of GGE [21], energy from renewable sources [22], and improvement of energy efficiency [23]. This approach is in line with the ambitious goals of the European Green Deal [24]. The adopted partial indicators reflect only the basic directions of changes characteristic of the energy transformation of the CEE countries.
An incomplete database (e.g., Eurostat), especially in the long term, constituted a major limitation in selecting a larger number of indicators for this group of countries. Using different databases (e.g., national) limited the possibility of full comparisons due to inconsistent methodology. There are no linear relationships between the partial indicators. The increase in energy productivity is not synonymous with the increase in the green transformation. However, from the point of view of the EU’s priorities, the achievement of both goals, i.e., both an increase in energy productivity and an increase in the share of RES in energy consumption, is a desired effect. Increasing the share of RES without improving energy productivity would be contrary to the EU directive and the European Green Deal’s assumptions.
The assessment of the level of energy transformation in CEE countries was carried out at 2 time points, i.e., in 2008 and 2018, and included data averaged over 5 years (2004–2008 and 2014–2018). The aim of such a procedure was to eliminate the impact of random events [3]. Determination of the degree of independence of selected partial measures was performed using the Pearson linear correlation coefficient (r) [25,26]. This coefficient ranges from −1 to +1, where 0 means no relationship between the variables, and the closer the absolute value of the coefficient is to 1, the greater the relationship. A level below 0.7 was adopted as a determinant of the independence of factors. Coefficient r (greater than or equal to 0.7) was considered a criterion for the correlation of variables [27,28]. The correlations of partial indicators are shown in Figure 1.
- 2.
- Standardization [29] of variables in order to obtain their comparability, which was done according to the formulawherew—number of units (countries) ;, n—number of features;—value of the k-th variable in the i-th unit;—arithmetic mean of the kth variable;—standard deviation of kth variable;—standardized value of k-th variable in i-th unit.
- 3.
- Separating the stimulant and destimulant subsets from the set of standardized features (s) in order to determine the development pattern P0 (units combining the best features of the studied units). Among the partial indicators adopted in the study, 2 indices, PPS/kgoe and RES, are stimulants. The third indicator, GGE, has a negative impact on the energy transition. The pattern was constructed on the basis of the normalized feature matrix (Z) and the vector P0 was used, whereI—stimulant subset;—the best value of s-th variable;—standardized value of s-th variable in i-th unit.
- 4.
- Calculation of taxonomic distances, using the Euclidean method, between the studied units and the development pattern ():
- 5.
- Determining the measure of development () on the basis of taxonomic distances:
The synthetic indicator (di) is within the range 0–1. The more a given unit is at a higher level of development, the more the measure value approaches zero. The development pattern method thus enables ranking CEE countries according to the degree of green energy transformation, on the basis of the calculated taxonomic indicators/synthetic values of development indicators (di).
STEP B—Classification of CEE countries in terms of energy transformation according to Ward’s minimum variance clustering method.
Ward’s method belongs to the agglomeration grouping methods. It is considered one of the most effective in creating homogeneous clusters [30]. The group consists of units (countries) for which the variance of the studied variable, which is a measure of cluster diversity, is the smallest. The method minimizes the sum of the squared distances inside the clusters after the group is created in a given step.
—the value of the variable being the segmentation criterion for the i-th object;
k—number of objects in a cluster.
The procedure is repeated many times until the group includes all the elements of the set subject to the cluster analysis. The results of grouping units using the Ward method (CEE countries according to the level of energy transformation) are presented in the form of a dendrogram. Cluster groups of the analyzed countries were determined using the ward2 procedure of R.
The calculations in stage 3 were performed using the Eurostat statistical database [31] and IRENA [10].
Stage 4 is an attempt to assess the challenges related to the development of renewable sources for Bulgaria, Poland, and Romania on selected examples that include (a) an increase in the use of solar panels, (b) import of components for the development of solar and wind energy, and (c) connections between Information and Communication Technology (ICT) and the development of green renewable energy.
First of all, the basis for this assessment was the impact of solar energy development on the environment through (a) forecasting the amount of waste generated by exhausted solar photovoltaic (PV) panels and (b) prediction of the surface of non–recycled waste from solar photovoltaics panels. Both the forecasting and prediction were carried out in the examined CEE countries on the basis of (a) trends in the development of solar energy net generation capacity (electricity production capacities for renewables and wastes) expressed in MW, (b) e-waste recycling rate [32], (c) technical data of PV cells (used to convert energy production capacity to the surface of PV panels) [33,34,35], and (d) forecasted 20-year service life.
The prediction was performed in two cases. The first case is less favorable to the environment as it assumes the level of PV utilization to be maintained at the level of the current e-waste disposal capacity of the CEE countries. The year 2018 was the baseline [31]. In the second case, it was assumed that the utilization of e-waste would increase to 68% (growth case)—the level of the best performers in e-waste recycling from Western Europe [31]. The increase in energy efficiency may contribute to the reduction of waste generated. However, it does not change the very mechanism of their formation. Due to the lack of predictions in the literature regarding new technological solutions that bring about an increase in energy efficiency, we did not address this issue in the study.
The study of the relationship between the increase in solar and wind energy production capacity and the import of components necessary for their development constitutes another cross-section of the assessment of the challenges accompanying the development of energy from RES. The study used data from Trade Map International Trade Statistics concerning products used to a large extent in the installation of green energy production facilities (products classified to group 84, i.e., machines, mechanical devices, nuclear reactors, boilers; their parts) [36].
The assessment of the challenges resulting from the development of green energy also includes the search for dependencies between the dynamics of its development and technological needs. The verification of the relationships between the indicated phenomena was carried out on the basis of the dynamics of changes in their development, i.e., total renewable energy, solar energy, and wind energy in relation to the expenditure on ICT. It was only an attempt to capture the dependencies between these phenomena or lack thereof. The Eurostat data were used in this analysis [31].
3. Results
3.1. Literature Review
3.1.1. Energy Transformation of CEE Countries
Energy is an important part of the life of every person, every country, and the planet, but the way energy is perceived changes with the development of civilization. In the industrial era, the focus was on meeting the needs of rapidly industrialized economies and societies [37]. Little importance was given to social development or public goods such as environment, security, equality, or sovereignty [38]; in the new paradigm of development, equated with sustainable development, these goods have been playing a key role [39]. The UN Conference in Stockholm in 1972 confirmed the aforementioned transformations. Sustainable development was defined then as development that meets the needs of the present without diminishing the chances of future generations to meet their own needs.
While significant changes in the economic development paradigm were taking place in the world, the CEE countries pursued a policy of energy-intensive industrialization, and then underwent political transformation. Historical conditions contributed to a certain “delay” in the process of energy transformation of the CEE countries compared to the Western European states. The systemic transformation/liberalization of the economy, privatization, restructuring of enterprises, and the resulting changes in the structure of the economy did not proceed in the same way in individual CEE countries and in the same period [40]. It resulted in a strong decline in the energy intensity of CEE economies (even higher than the EU average [40]), but it was due to slightly different reasons. For example, in the years 1992–1998, Bulgaria and Romania experienced a decrease in the energy intensity of the economy in the conditions of increasing energy intensity of industry. In the Baltic states, the decrease in energy intensity of industry was responsible in as much as 50% for the decrease in energy intensity of their economies in general [41].
Central and Eastern European countries have different potentials for the development of green energy. These varied conditions determined a different business climate for the development of renewable energy during the systemic transformation. Bulgaria, Romania, and Slovakia were considered the most attractive countries for its development [42]. Romania is especially noteworthy, as it is characterized by high hydropower [43]. Although it invests in solar and wind energy, water is still the most important resource in Romania’s group of renewable resources [44]. In Slovakia, Hungary, Bulgaria, and the Czech Republic, investments in nuclear energy made in the past had an impact on the course of the energy transformation. It is not a renewable energy, but an energy with a low environmental impact, enabling the achievement of the assumed climate goals much faster than in Poland (traditionally dependent on cheap coal).
The membership in the EU structures, in whose policy sustainable and green development has had a strategic place [45,46] for many years, has proven to be a factor intensifying the energy transformation of the CEE countries. In 2019, the European Green Deal was adopted to deal with numerous climate and social problems [47]. It assumes that high and growing energy efficiency should be accompanied by energy transformation (increasing the share of renewable energy in total energy consumption [48,49]. In CEE countries, government programs actively support the development of green energy and these actions have already brought some tangible results. Experts predict an above-average and long-term growth of new investments in RES in this region, mainly in terms of the sun [50] and wind [51].
3.1.2. Solar and Wind Energy—Pros and Cons
The increase in the share of RES in the production of primary energy leads to a decrease in the energy consumption of the economy [52,53] and an increase in their use in electricity production. In the case of CEE countries, this is the result of applying relatively newer technologies in comparison with those used in traditional power engineering. It is estimated that as early as 2025, RES will be the largest source of electricity generation in the world. From this point of view, solar energy has the greatest development potential [54,55,56]. It can be used in two ways. The first is obtaining heat with the use of solar collectors, the second is electricity production [57,58]. Solar energy is developing in four sectors: commercial, utilities, industrial, and residential. Apart from solar energy, the popularity of wind energy is also growing. Wind farms capture the energy of the wind flow with the help of turbines and convert it into electricity. The windmills are located on and off land. Due to the varying power, they can be used in both households and for industrial purposes [59].
Solar and wind energy, which are clean, inexhaustible, and environmentally friendly, are perceived as excellent sources of energy production [60]. Photovoltaics, together with new solutions in the field of wind technologies [61], are characterized by a radical reduction of costs [62] thanks to more efficient technologies and better materials [63]. Moreover, thanks to R&D investments [64] and new patents, the costs of these technologies are expected to drop even further [65].
Some authors argue that the producers of photovoltaics and wind technologies can even compete in terms of costs with those who generate power from fossil fuels [66]. Dissemination of solar energy, apart from the decrease in costs, is additionally favored by its high social acceptance [67,68], which is reflected in loyal initiatives promoting the use of this energy source [69]. Contrary to solar energy, wind energy is sometimes negatively perceived from the environmental point of view, in terms of disturbance of ecosystems, noise, and unfavorable landscape. Wind energy also poses some technological challenges aimed at eliminating the limitations of the technology used thus far, e.g., the emission of harmonic currents [70].
Solar and wind energy as energy sources are not faultless. First, they are heavily dependent on weather and climate change. However, as technology advances, their limitations can be minimized. An example is the forecasting of sun exposure using satellite data [71]. Second, unlike fossil fuel power generation, most renewable energies (except hydro, geothermal, concentrated solar, and biomass) are intermittent. This means that technologies such as PV and wind turbines cannot generate electricity on demand [72].
The above features of unstable energy sources are new challenges in the field of energy storage [73,74,75] and in the integration of green renewable energy with shaped energy systems [76,77,78]. Energy systems need to be more flexible. This applies in the first place to systems where the combined share of wind and photovoltaic energy accounts for over 30% of total energy, and the share of PV in the mix of RES is between 20 and 30% [79]. Integration problems (technical and political [80]) are noticed in the EU. The way to meet them is to adopt a green energy strategy based on a concentrated intelligent energy network, enabling the flow of information and the use of various energy sources [81,82]. High expectations in solving the above problems are associated with technological progress and digital solutions [83,84]. Digital energy platforms that coordinate and manage energy demand and supply in real time are rapidly developing in the European energy system. In the group of CEE countries, two platforms are located in Lithuania and single platforms are in Bulgaria, Estonia, and Hungary [85].
3.1.3. New (Old) Challenges of the Energy Transformation
The development of green renewable energy means climate benefits and greater productivity in energy and other economic sectors, especially construction, industry, and transport [86]. From the perspective of achieving the goals of green energy transformation, a relatively new research approach has emerged recently—its aim is to identify the threats resulting from a rapid transition to RES [87]. In the conditions of climate change and scarcity of natural resources, the international community undertakes numerous activities aimed at limiting energy consumption and reduction of GGE [88,89,90]. The aim of the new EU growth strategy is to transform the European Union (EU) into a modern, resource-efficient, and competitive economy [89,91].
However, new environmental challenges emerge with the dynamic development of green renewable energy. One of them is a dynamic increase in waste from PV cells expected in the coming years [92]. There is a need for supervision over the course of the management of used PV [93]. Technological and institutional support in the recovery of used raw materials is also necessary [94,95].
The development of renewable energy is associated with the independence of individual national economies from external supplies, which is part of a wider issue of energy security [96,97,98]. Political factors have always played an important role in the geographical diversification of energy supplies [99,100,101,102]. It is reflected in CEE countries by their striving to become independent of raw materials from Russia [78].
In 2019, the global production of solar panels was estimated at approximately EUR 57.8 billion, of which only 12.8% was in the EU. Among the 10 largest producers of photovoltaic cells and modules, the vast majority are located in Asia. Among the wind technology producers, it gets better—while there are no large companies from CEE countries among them, there are three from Germany (Siemens, Senvion, Gamesa Renewable Energy—with Spanish participation) [87]. In light of the above facts, there is a risk of replacing the dependence on oil and natural gas from Russia with products from China and highly developed European countries.
Green energy transformation, in line with the European Green Deal, is supposed to generate an increase in the competitiveness of EU countries in the future [103]. The digitization of the energy sector and the dissemination of digital technologies and communications will help with this goal’s realization [104]. It brings about new challenges in terms of supporting the development of green energy. They are expressed in the transition in energy policy from focusing on the energy sector in the strict sense to approaching it broadly, taking into account universal digital connectivity and the development of new digital tools. Digital energy systems also need digital security [105,106]. Big new opportunities are related to Internet of Things (IoT) and blockchain technology. However, the market of equipment for sensors and IoT monitoring devices is dominated by global companies (e.g., Hitachi ABB 193, IBM) [79], and there are no CEE companies in this group.
3.2. Energy Structure of CEE Countries
Central and Eastern European countries, due to the large differentiation of their socio-economic potential, show significant differences in terms of the size and structure of energy production. The leaders in terms of the volume of total primary energy supply include Poland, the Czech Republic, Romania, and Hungary (respectively, from 4374.3 thousand TJ to 1115.6 thousand TJ in 2017). The lowest values have been recorded in the Baltic states and Slovenia (below 300.1 thousand TJ). These states also have the lowest economic and demographic potential among the CEE countries.
Non-RES still play an important role in the energy structure of many CEE countries, especially Poland, Slovakia, the Czech Republic, Bulgaria, and Hungary. Latvia and Lithuania have been found to be the countries with the highest share of renewable energy.
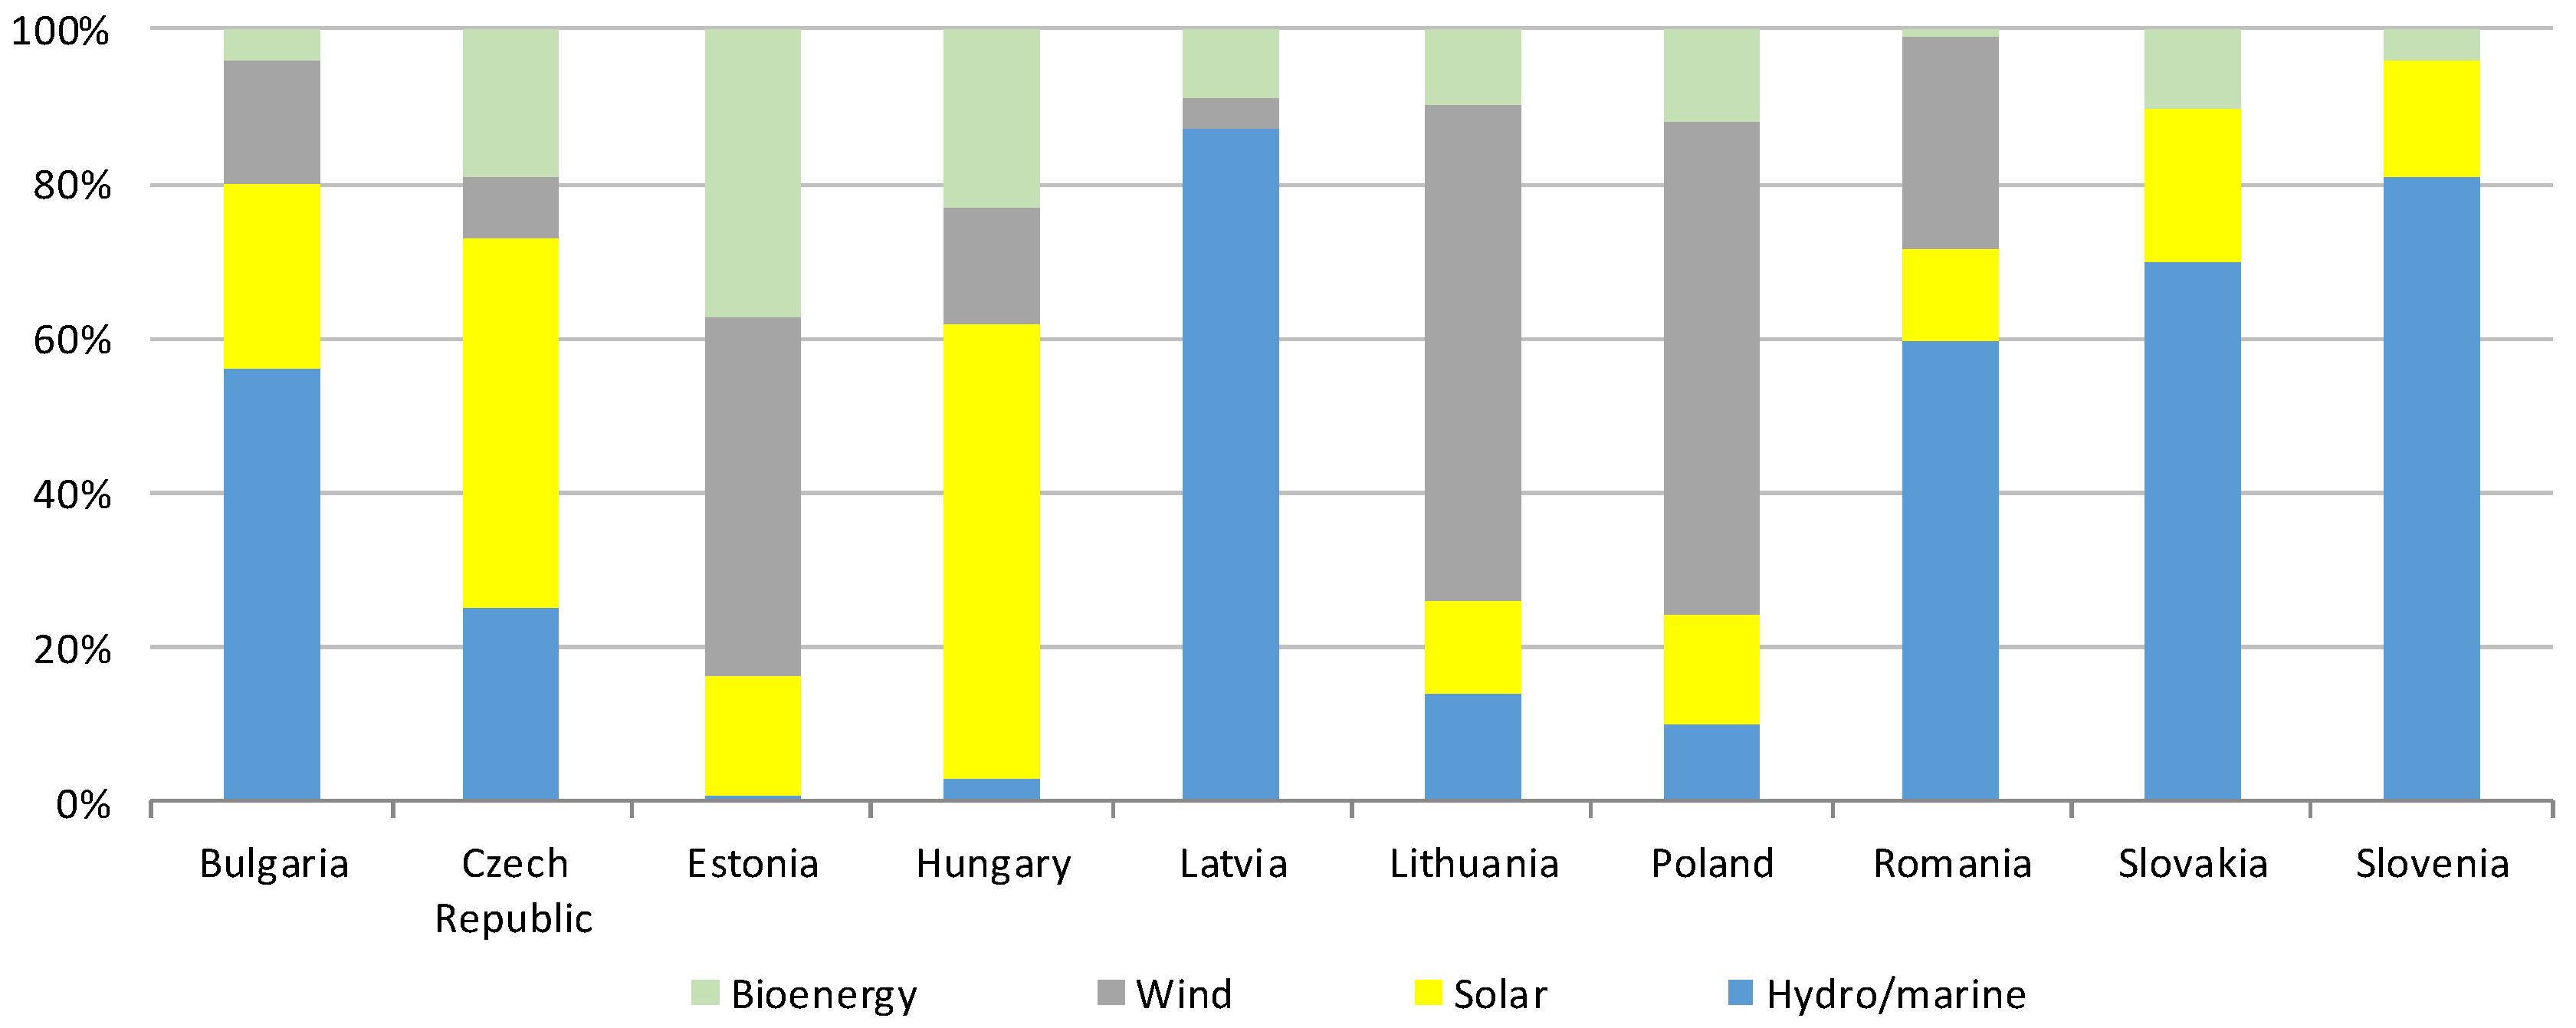
The use of RES for the production of electricity is of great importance in the EU and its CEE member states. In 2019, the RES had the largest share in the total electricity capacity in Latvia (approximately 62% of the total), Romania (48.5%) and Bulgaria (39.4%) [107,108,109]. It is worth noting that the highest potential of electricity obtained from RES is characteristic of Romania (11.2 thousand MW), Poland, and Bulgaria (approximately 4.5 thousand MW) 10]. There is some kind of specialization among CEE countries in the structure of electricity generated from RES. In Latvia, Slovenia, Slovakia, Romania, and Bulgaria, hydropower is of great importance (from 87% to 56%) [10]. In the case of wind energy, such an observation can be applied to Lithuania and Poland (64 and 63%). Hungary and the Czech Republic stand out in terms of the power generated from solar energy (59% and 48%, respectively; Figure 2).
3.3. Classification of CEE Countries According to the Green Energy Transformation Index
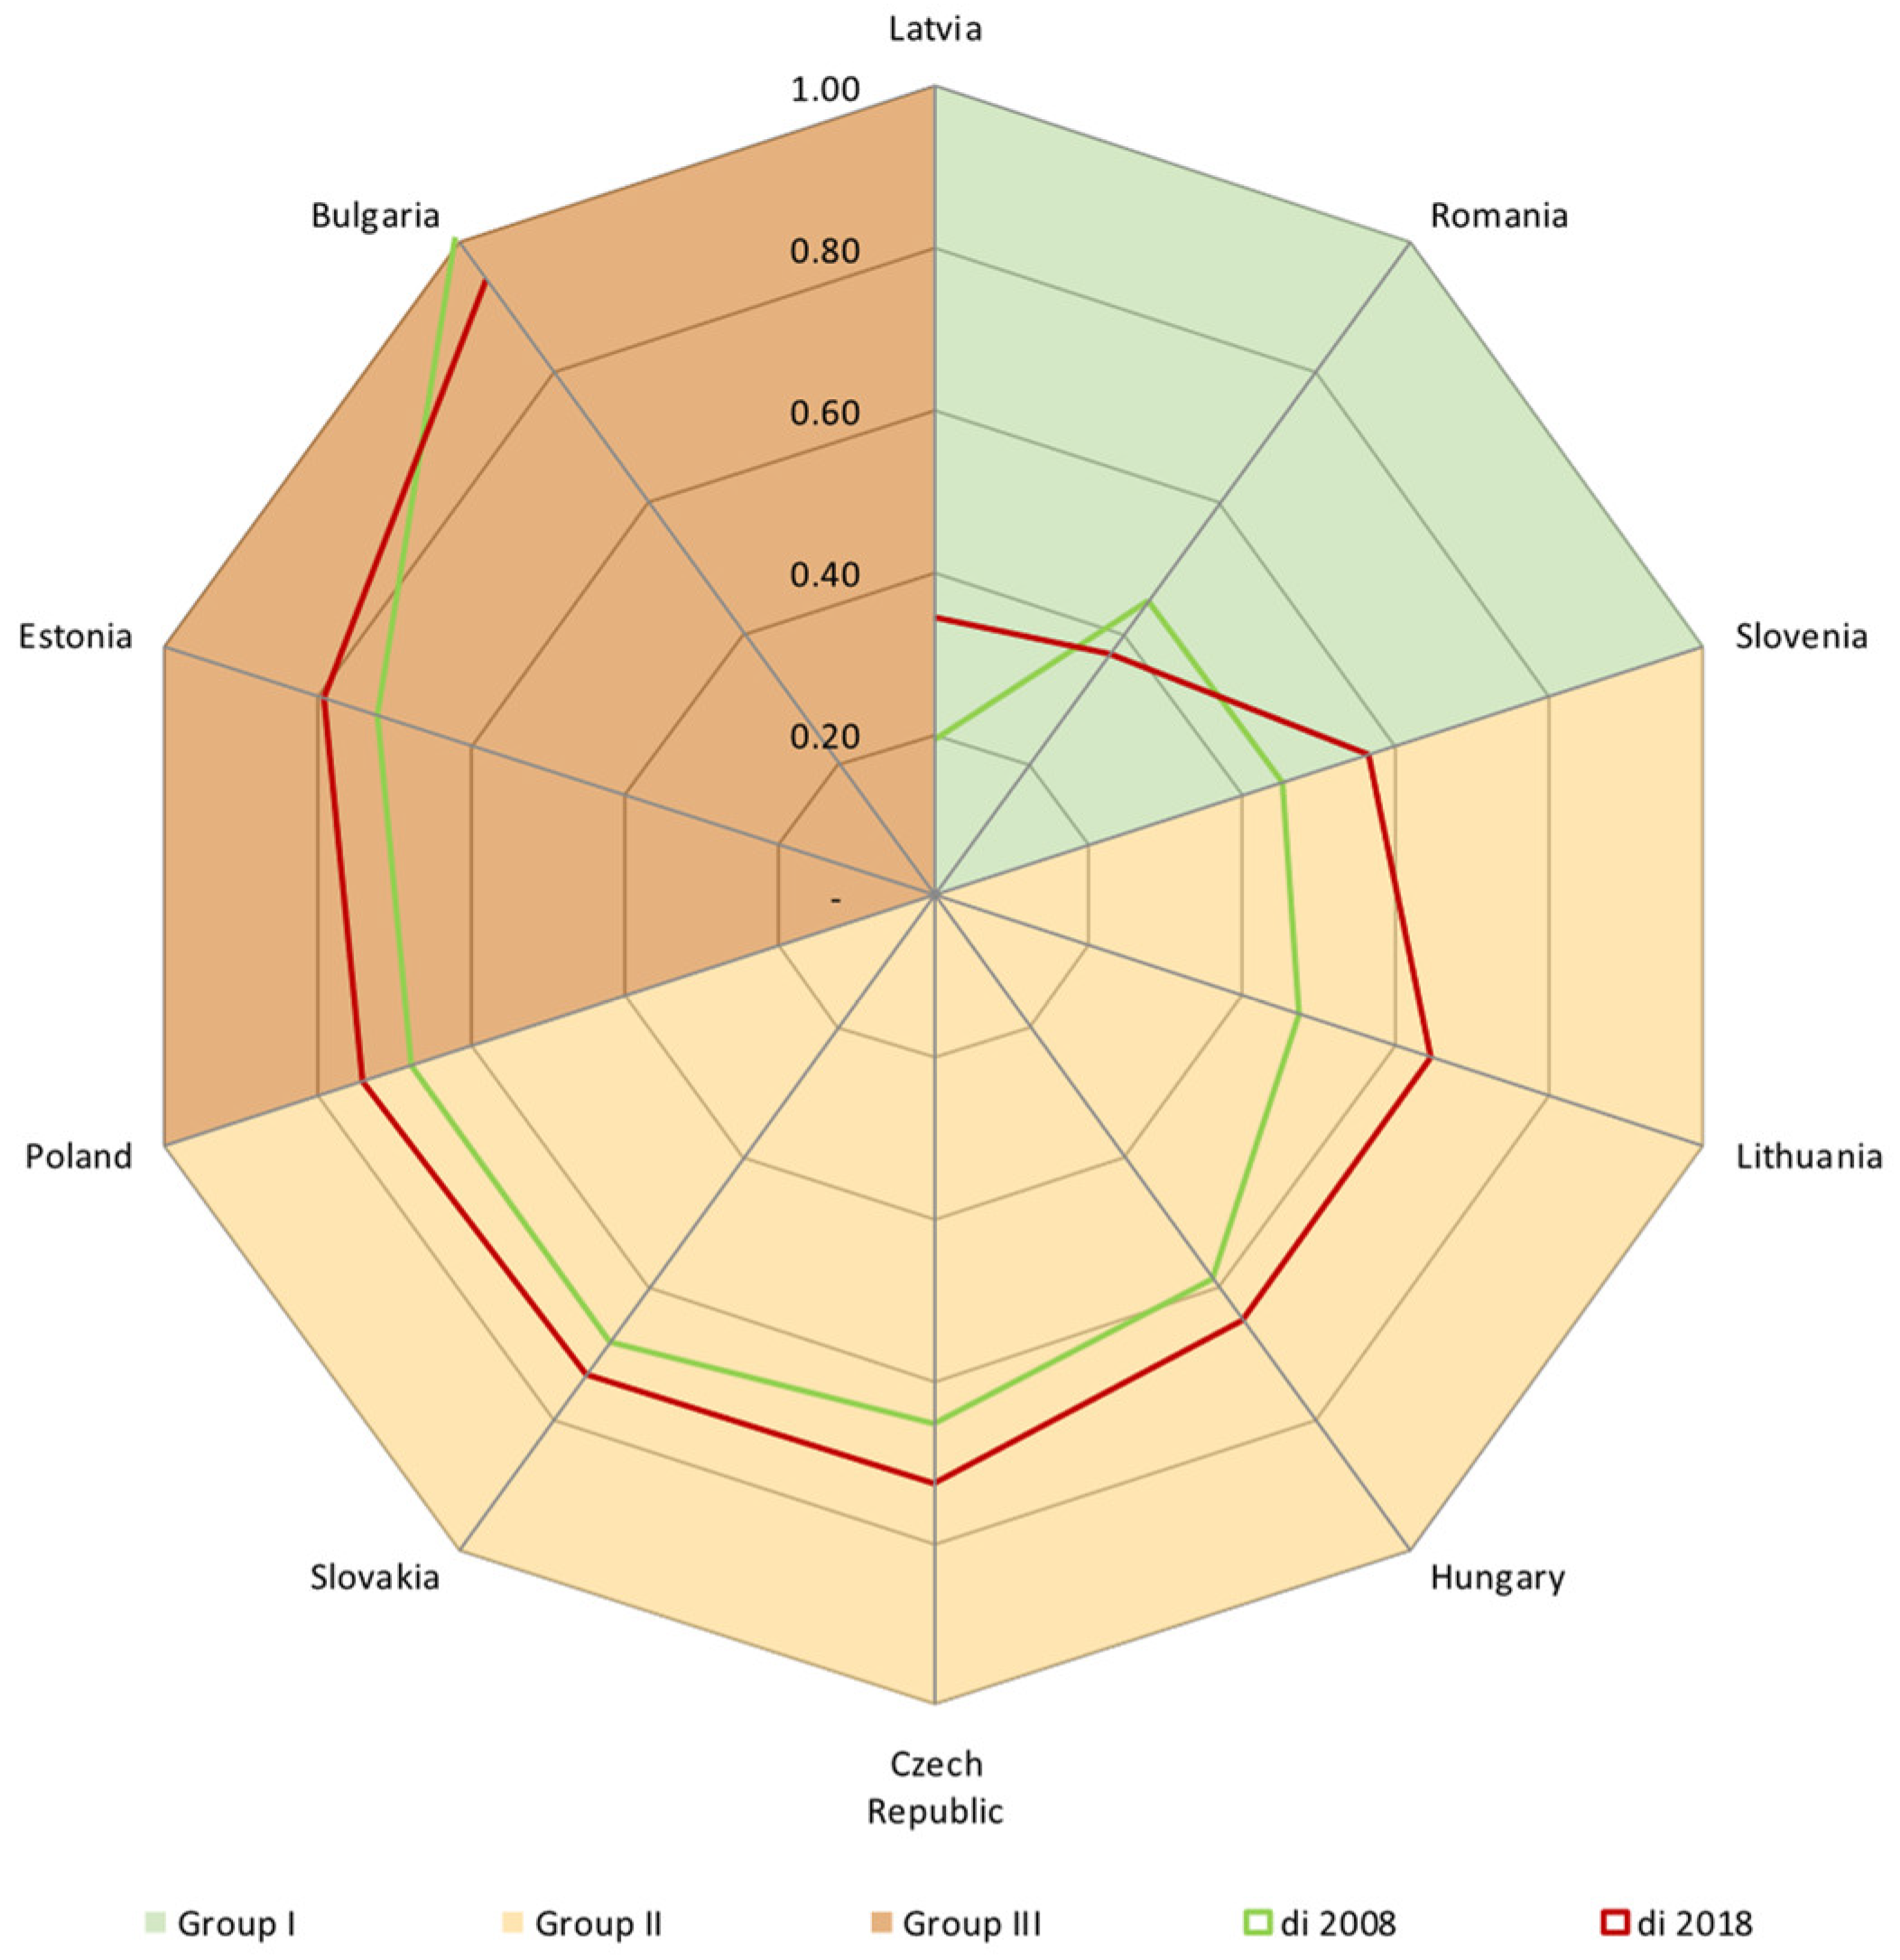
In 2018, according to the taxonomic method of linear ordering (distance from the pattern), Latvia and Romania achieved the highest level of energy transformation (Figure 3). These countries, including Slovenia, are included to the first group in terms of the level of the energy transformation index in 2008. However, the level of energy transformation in these countries, except Romania, has slightly deteriorated in the studied period (there is a slightly greater distance from the pattern).
The most numerous group—group II—was formed by countries with an average level of energy transformation. In 2018, it included Lithuania, Hungary, the Czech Republic, Slovakia, and Slovenia.
On the other hand, Bulgaria showed the lowest advancement of the energy transformation in 2018, while Estonia and Poland performed slightly better than Bulgaria.
In 2008–2018, there was a decrease in the distance from the development pattern in Romania and Bulgaria, i.e., countries belonging to different groups in terms of energy transformation. On the other hand, the greatest increase took place in Lithuania, Latvia, and Slovenia, i.e., countries with relatively high advancement in energy transformation. The processes related to the introduction of new solutions in the energy sector are not yet fully stable.
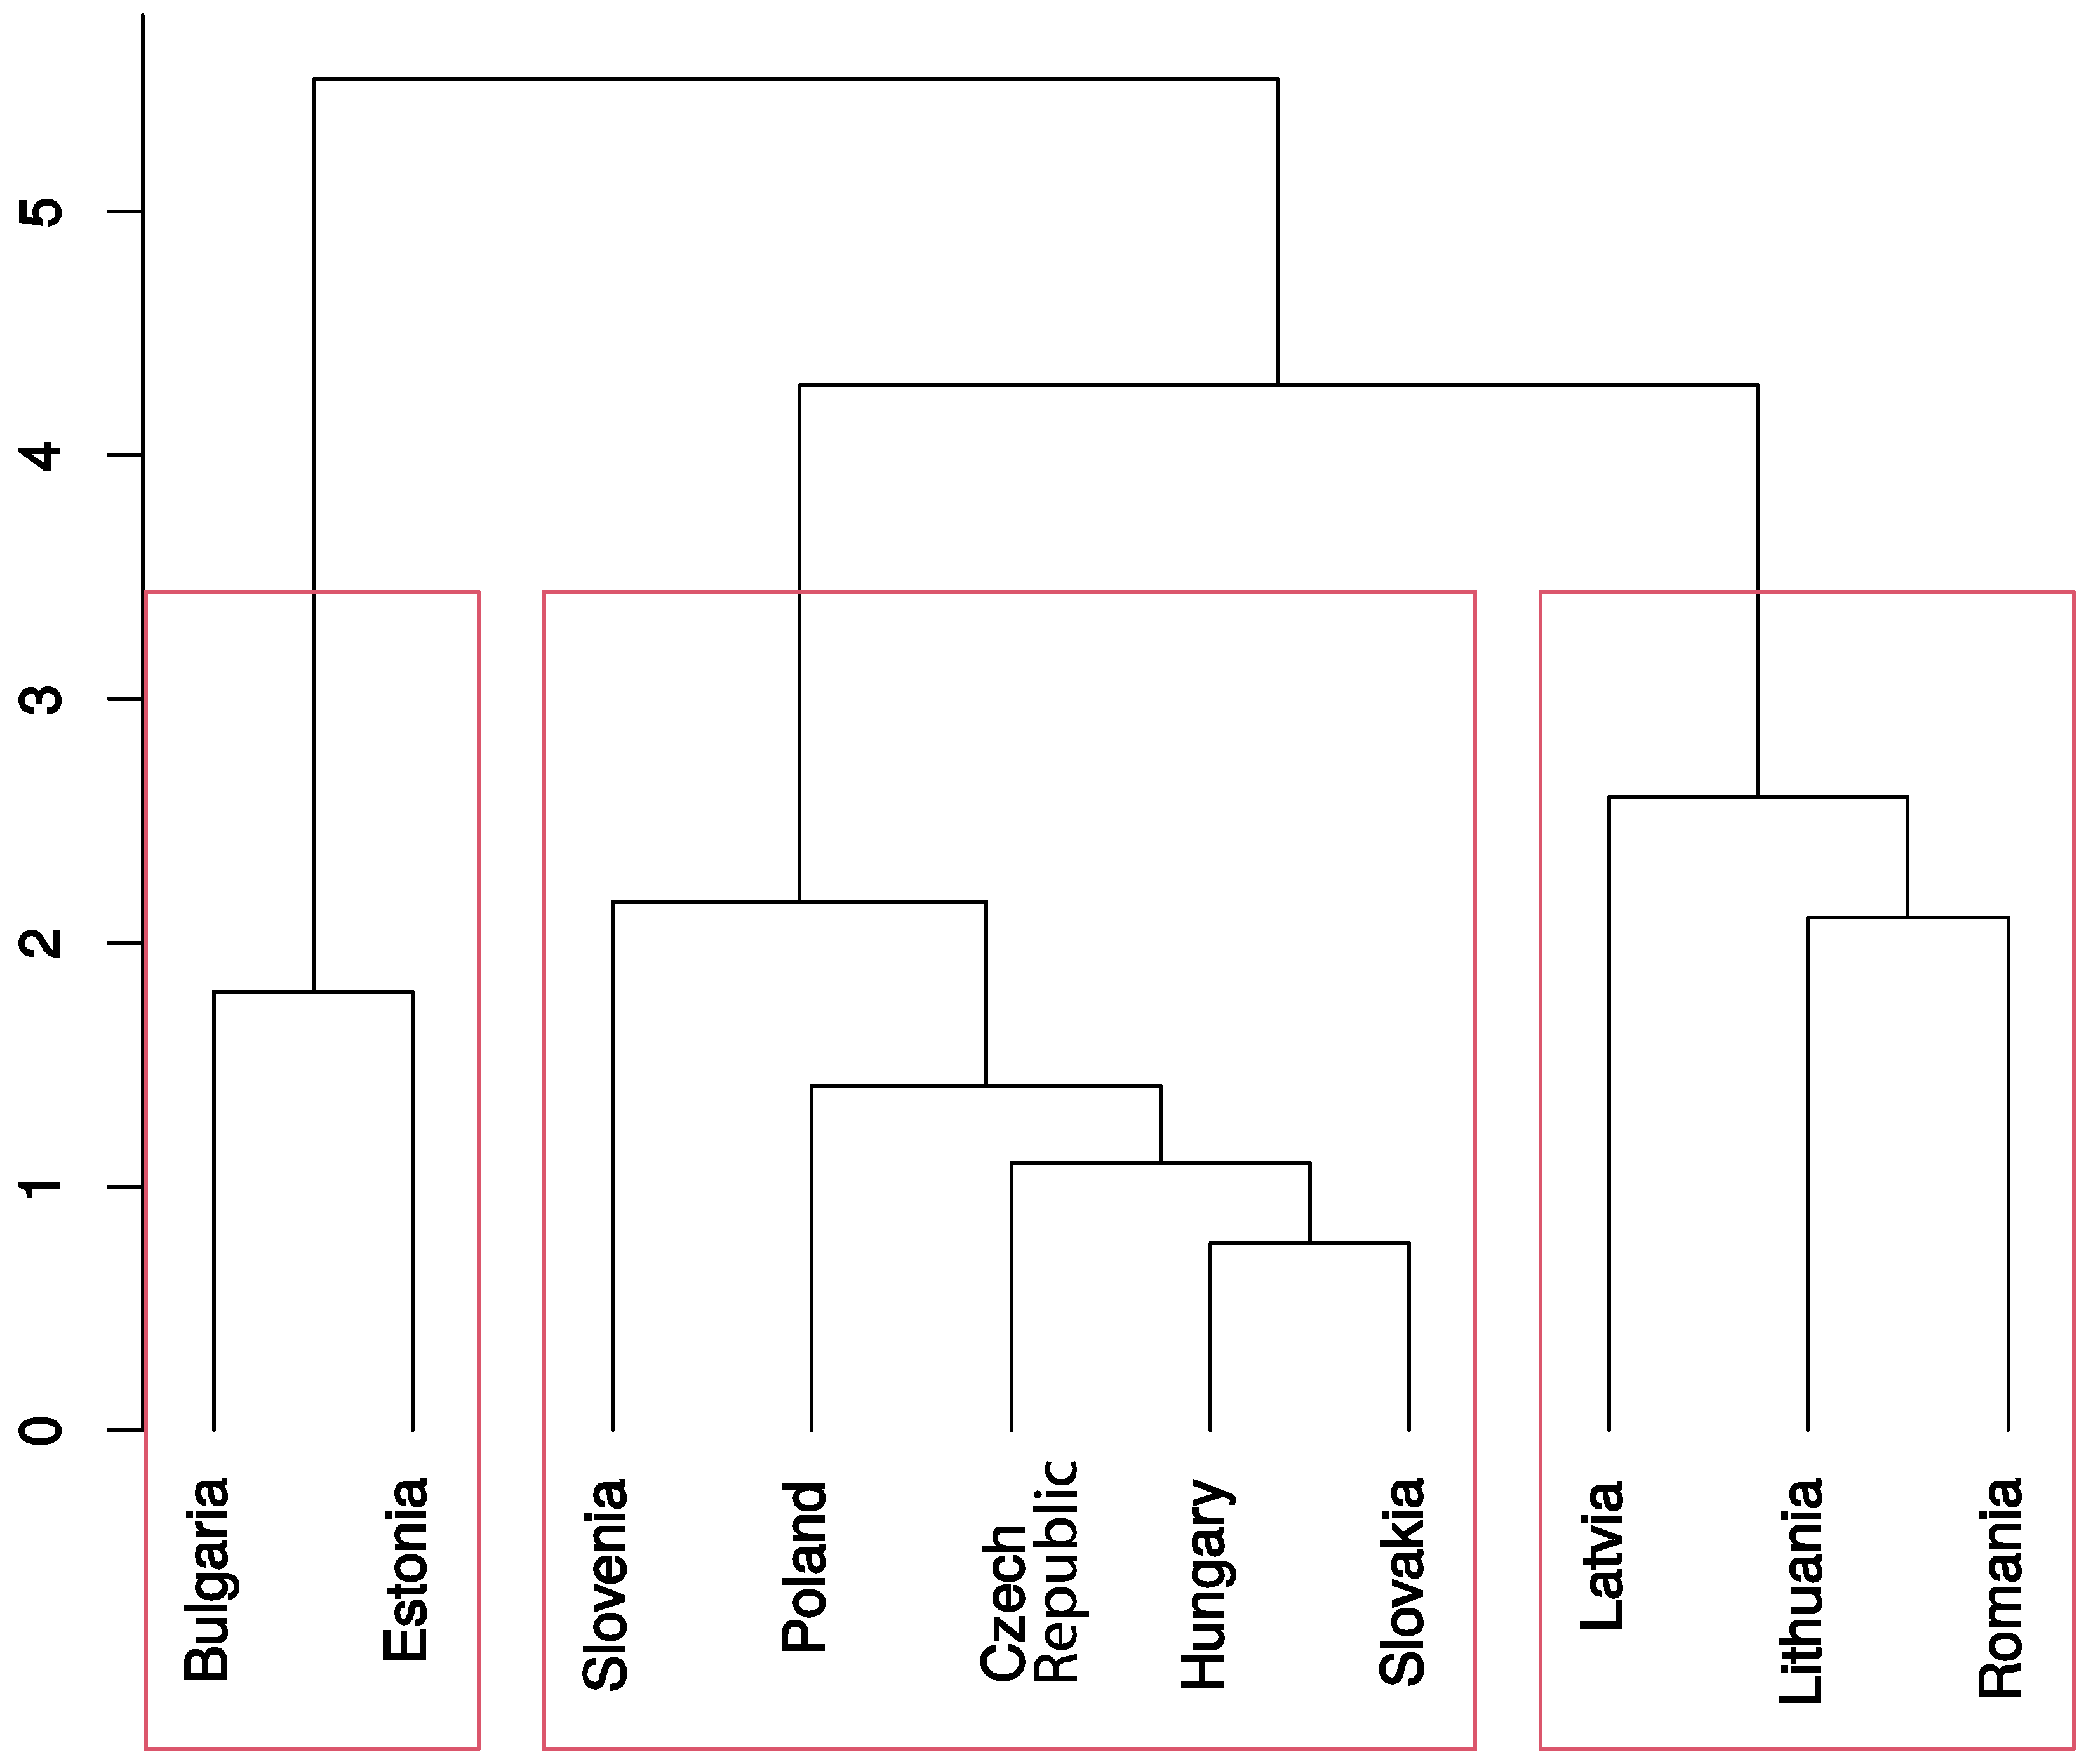
Using Ward’s method, these countries can be divided into three groups (of two, five, and three countries) from the point of view of energy transformation (Figure 4). The two-element group is made up of Bulgaria and Estonia, classified in terms of the green transformation, measured by the distance from the pattern to the third group—the lowest group (variant II).
The three-element group is composed of Lithuania and Romania and joined in the next iteration by Latvia. Finally, the five-element group comprises Hungary and Slovakia, joined next by the Czech Republic, and then Poland and Slovenia. It is noteworthy that the clusters at the lowest iteration level were made up of countries that were included in the same group in terms of energy transformation measured by the distance from the pattern method, regardless of the adopted variant of the synthetic indicator (variants I and II).
From the point of view of energy transformation, the CEE countries showed both certain similarities and differences. They resulted from different trends in the development of green energy that were visible in the size of the partial indicators adopted for the construction of the synthetic indicator of energy transformation, i.e.,
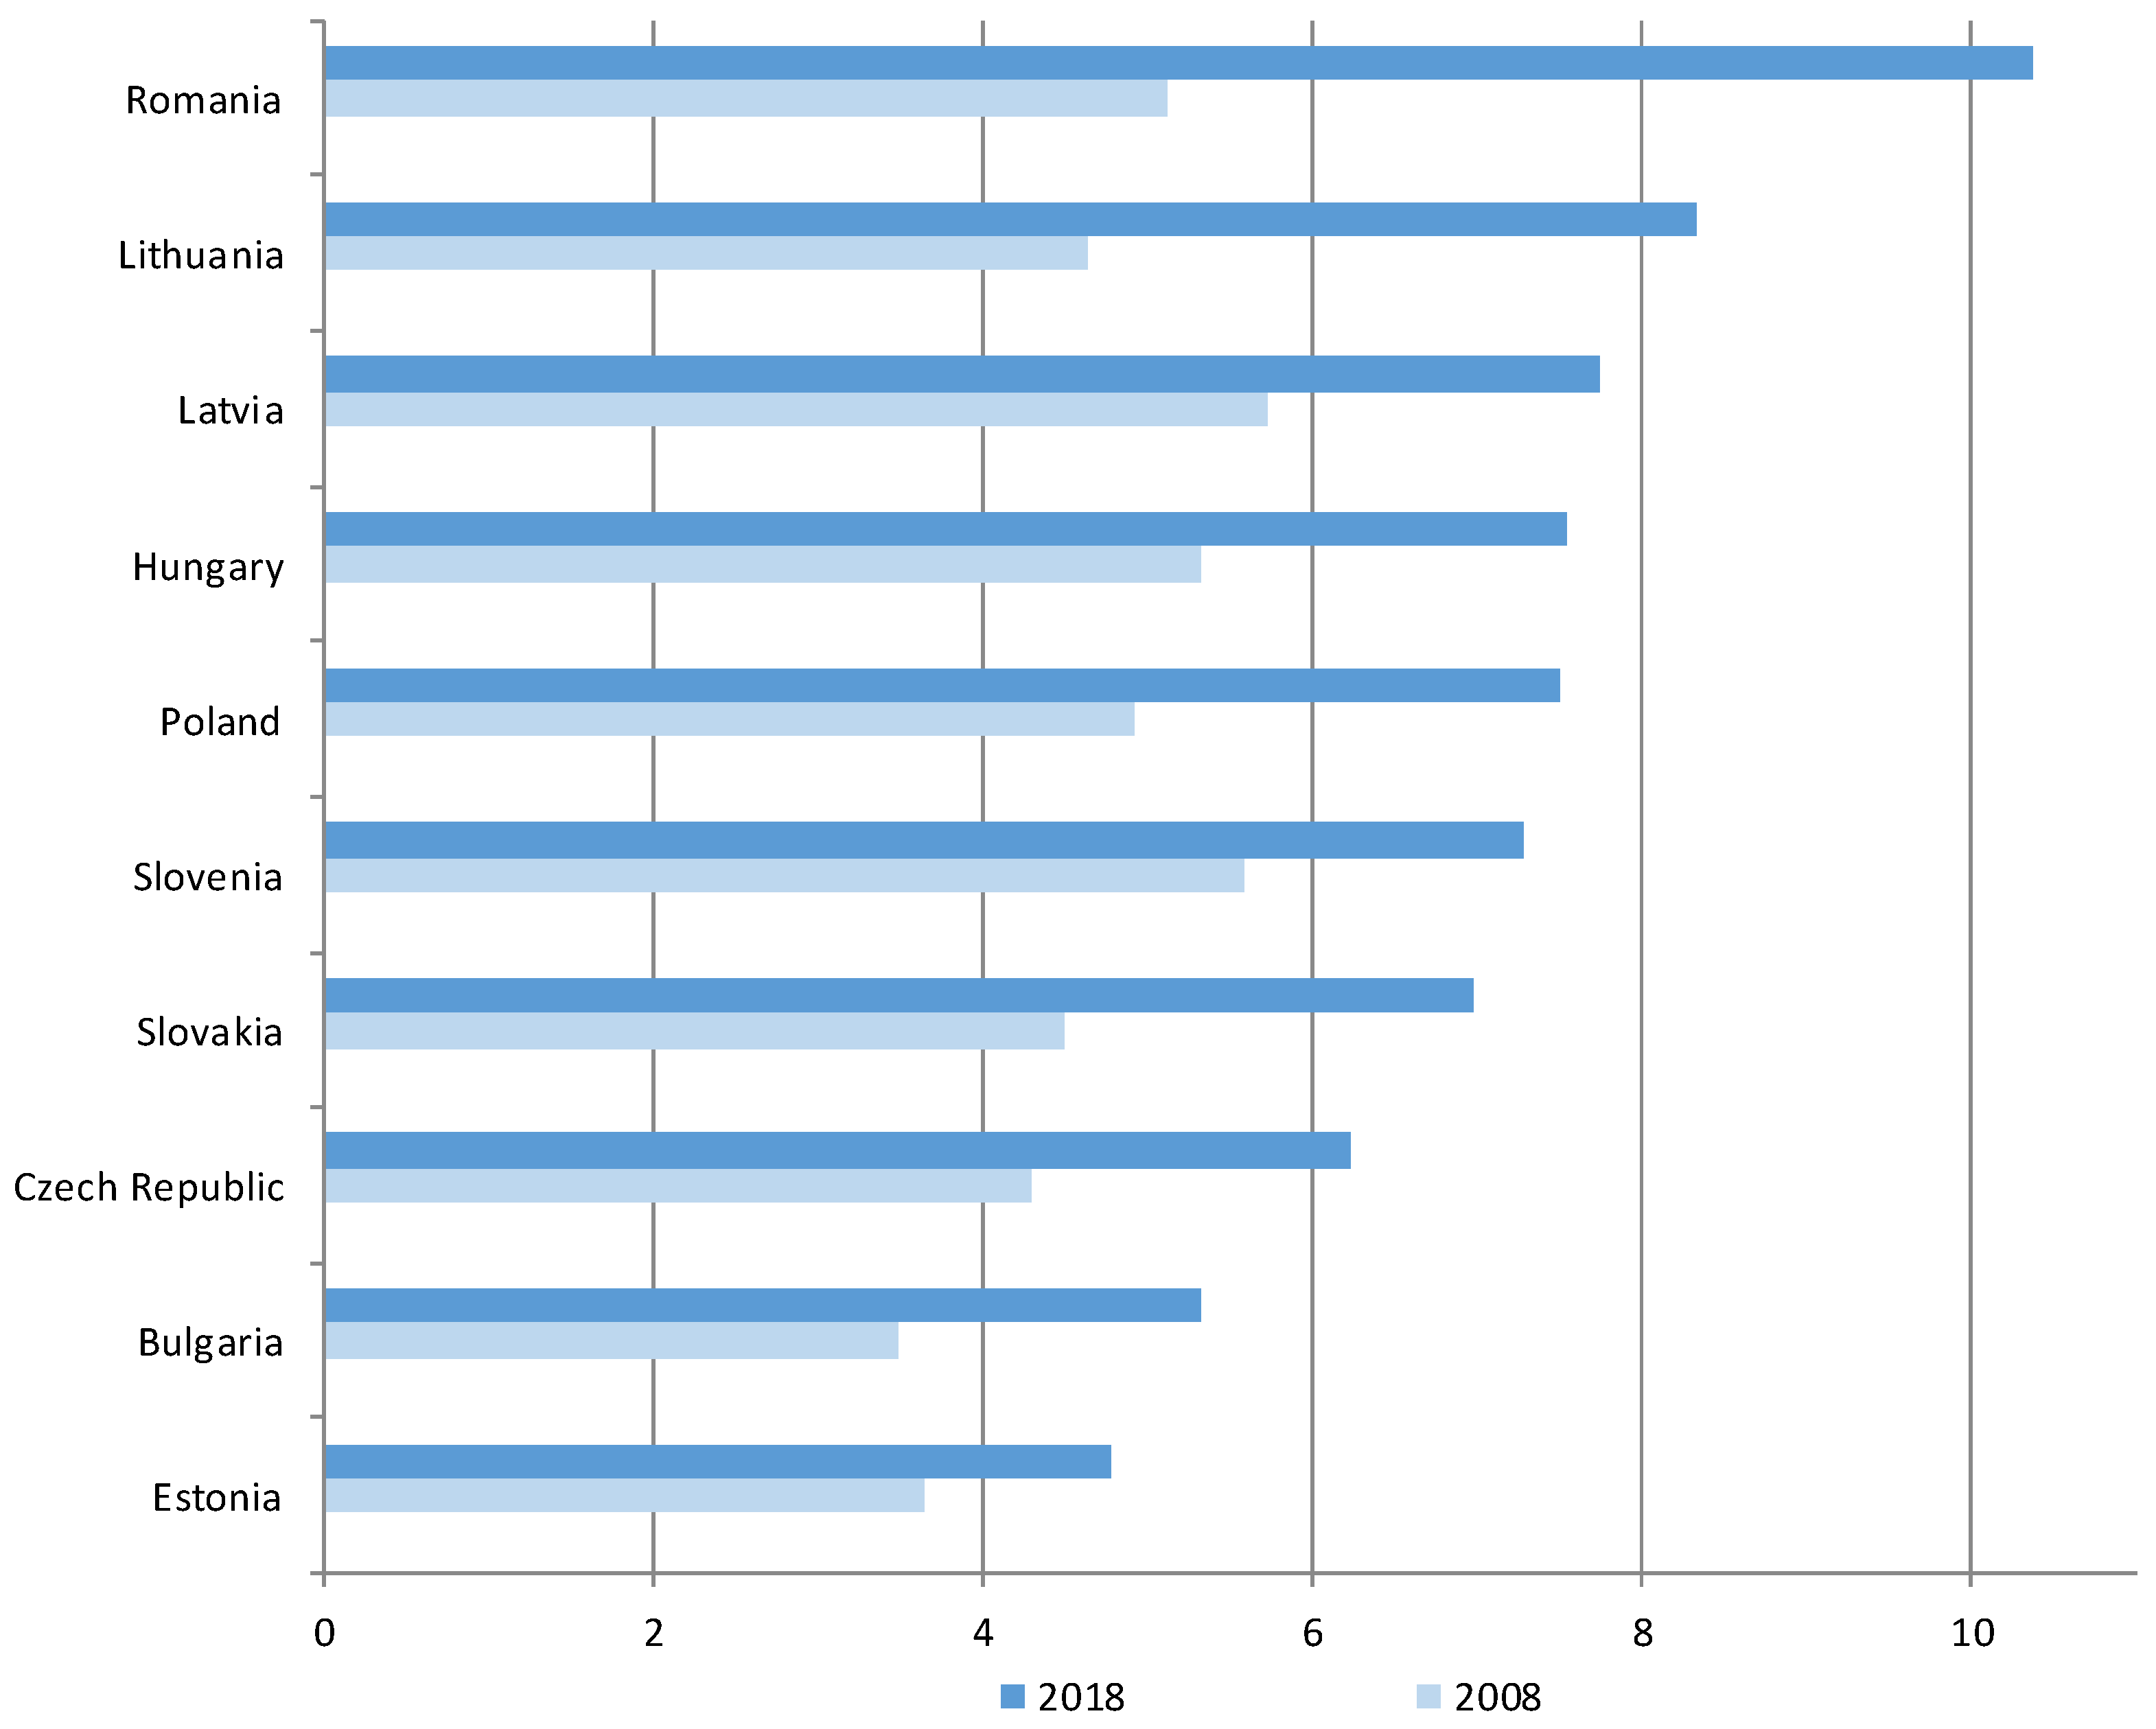
- Energy productivity, which increased in 2008–2018 in all countries. The undisputed leaders in 2018 included Romania (10.4 PPS/kgoe) and Lithuania (8.3).The lowest level of productivity was characteristic of Bulgaria and Estonia, i.e., countries representing a relatively low level of energy transformation (Figure 5).
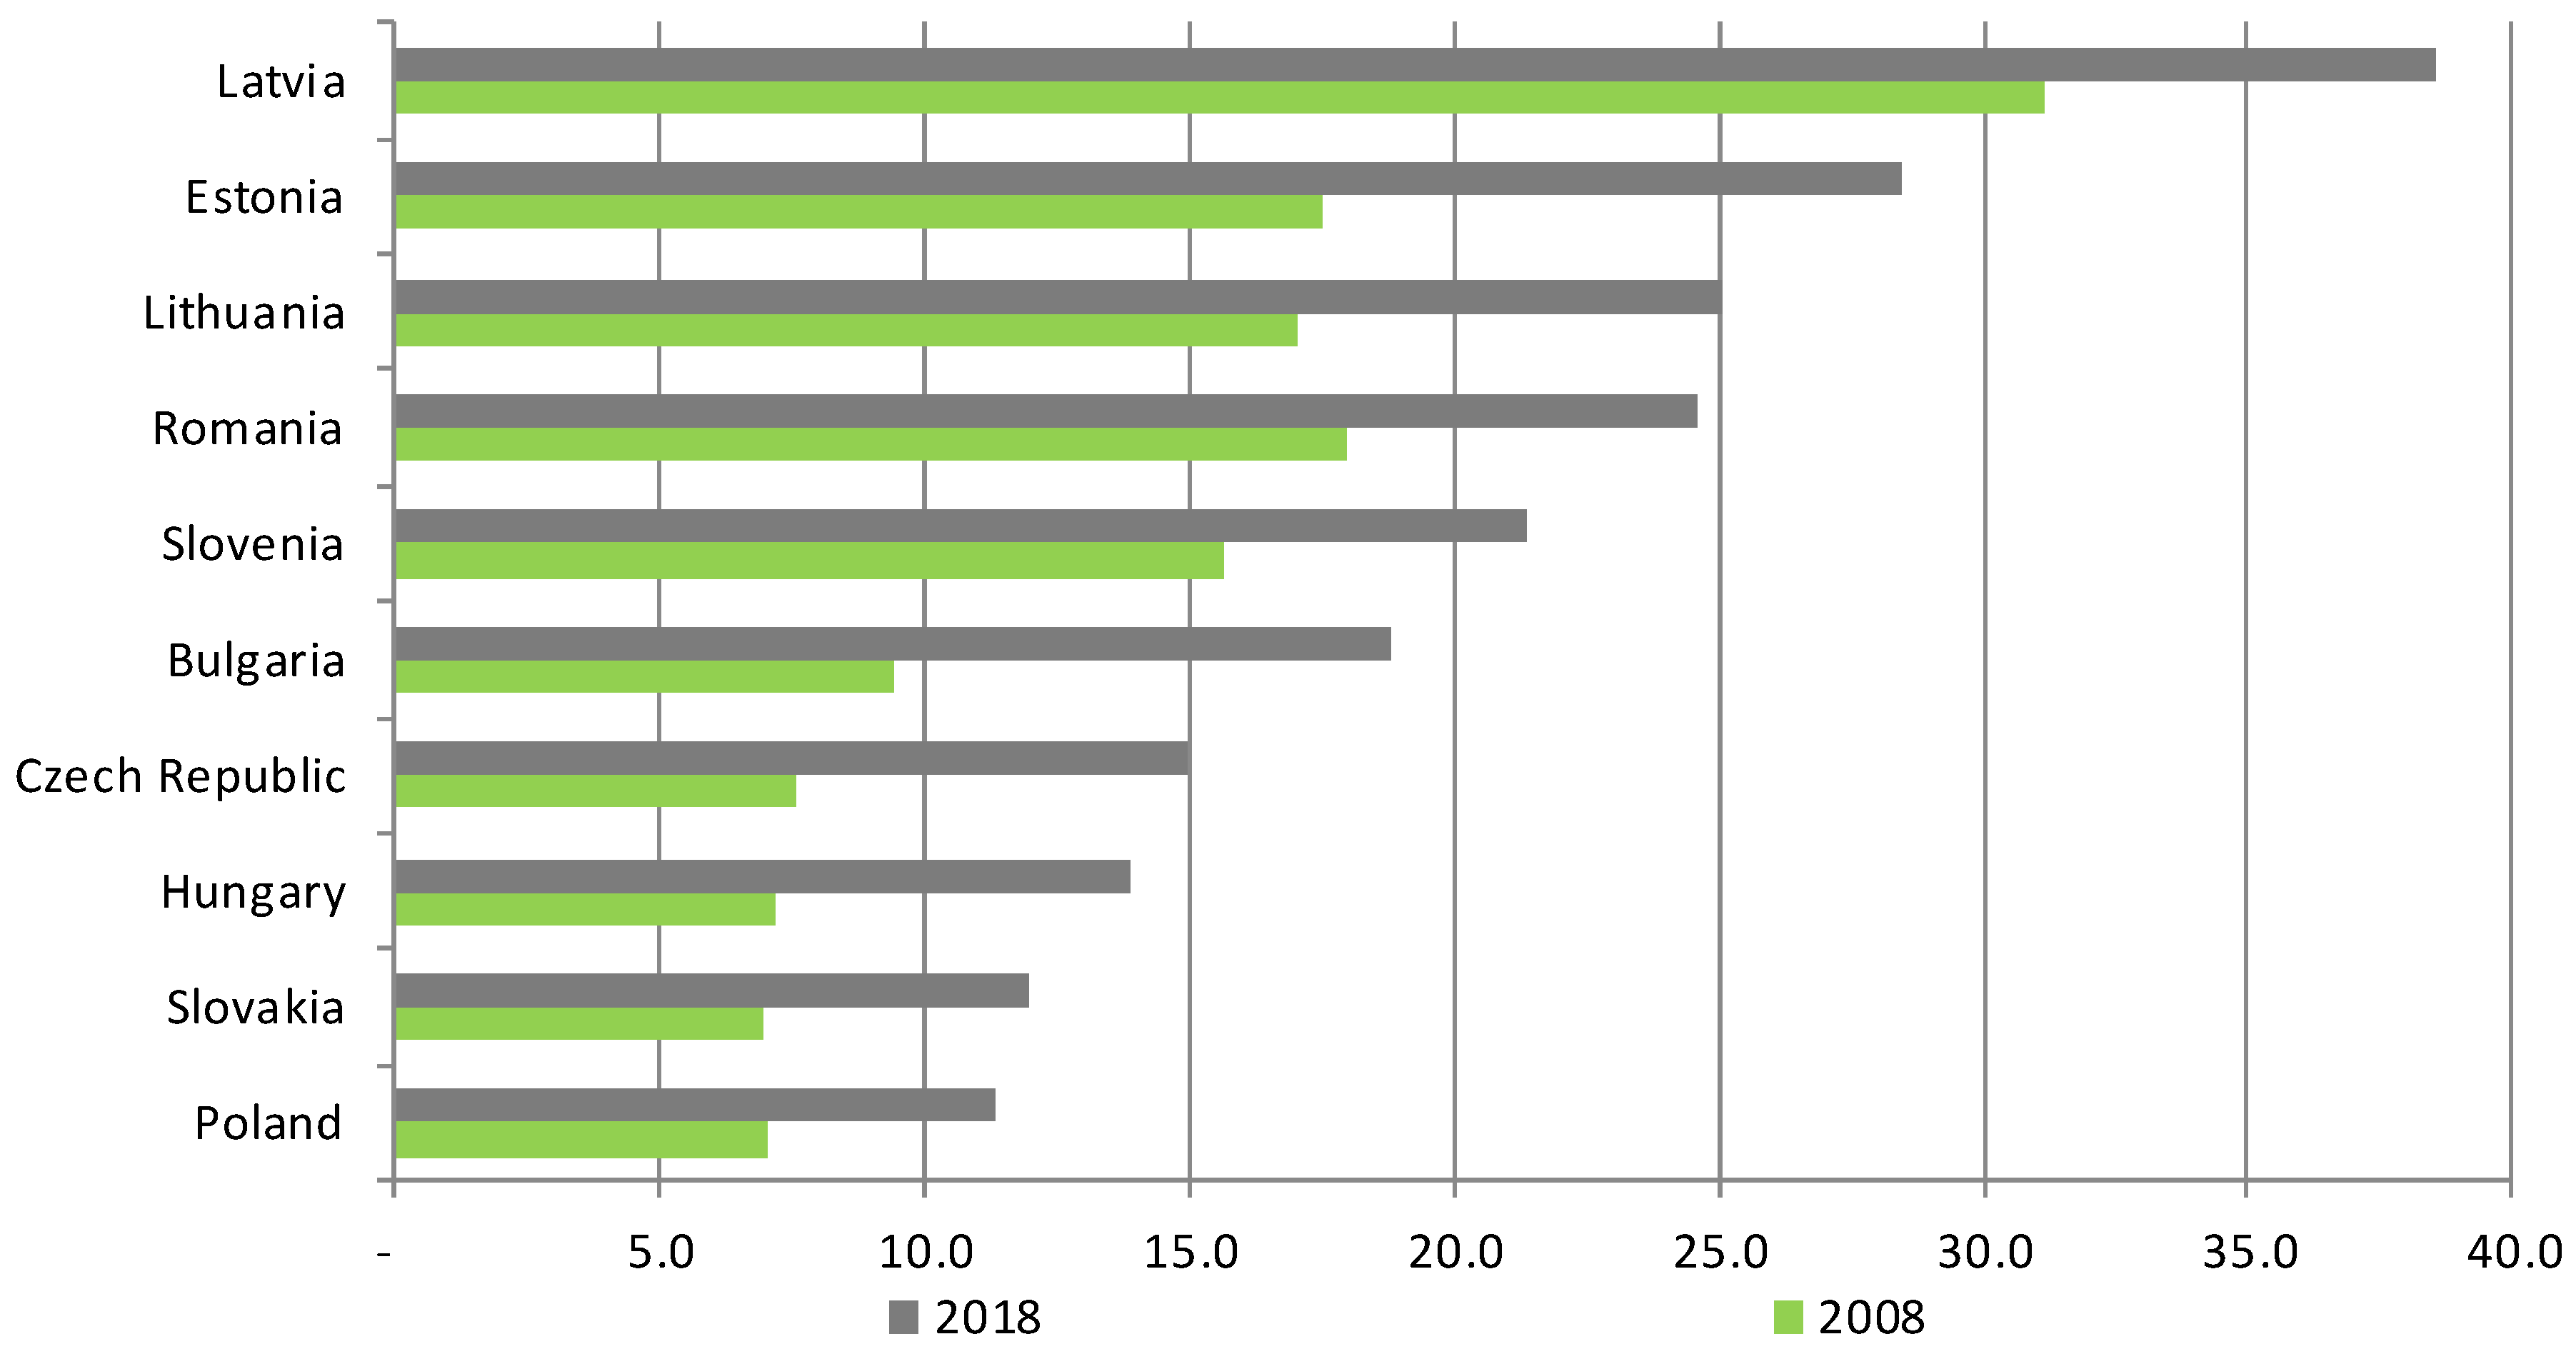
- Percentage share of RES in total energy consumption (the increase of RES in the total energy consumption was recorded in all countries). The group with the greatest importance of green energy in consumption included both the countries that represent the most and the least advanced energy transformation (Latvia at 38.5% and Estonia at 28.4%) (Figure 6). Renewable energy consumption was found to still play a minor role in Poland, Slovakia, and Hungary (from 11.4 to 13.9%).
- GGE intensity from energy consumption (100 = emissions in the year 2000). The worst situation in this respect in 2018 was recorded in Bulgaria and Lithuania, where GGE exceeded the level recorded in the year 2000 (107 and 105, respectively) (Figure 7). In Lithuania, an increase in emissions was also recorded in comparison to 2008. In 2009, the last reactor of the Ignalina Nuclear Power Plant was closed in Lithuania. This resulted in an increase in the energy sector based on solid fuels (natural gas and oil) and the accompanying increase in CO2 emissions. In addition, taxes on transport are among the lowest in the EU, which is not conducive to reducing CO2 emissions [110].
In other CEE countries, a positive, downward trend in GGE was recorded. It was significant, exceeding 10 percentage points, in the Czech Republic, Slovakia, and Hungary.
3.4. RES and New Challenges on the Path to Sustainable Development—Examples of Bulgaria, Poland, and Romania
Countries representing various groups of energy transformation are Romania (I), Poland (II), and Bulgaria (III). This is connected with slightly different challenges of the energy transformation and the intensions to achieve the goals of energy policy.
3.4.1. Environmental Challenges
The dynamic development of solar energy prompts reflection on PV panels’ utilization and reuse (the principles of closed economy). According to the prediction of the growth of PV panels (on the basis of the dynamics of the increase in solar energy production capacity), it is possible to attempt to measure their impact on the environment and the degree of their utilization, and, consequently, to assess the environmental impact after their use is completed [111,112,113,114,115,116].
In accordance with the method adopted in the forecast, their surface area in 2020–2030 will be the highest in Poland (15,980,000 to 17,954,000 m2), lower in Romania (6580–7,393,000 m2), and the lowest in Bulgaria (5,170,000 to 5,919,000 m2) [115]. The 20-year average lifetime of PV cells means that the disposal of panels from 2010 will start in 2030.
In each subsequent year (in the study below in the next 5-year period), this will cover collectors that will have completed their 20-year life cycle (e.g., the expected number of panels installed Poland by 2025 will amount to 16,779,000 m2, and disposal in 2045 will cover 799,000 m2, according to power gained from PV s installed in 2025). This means that the largest number of panels for disposal in Poland will be in 2040 (15,472,000 m2), and in Bulgaria and Romania in 2035 (4,705,000 and 6,228,000 m2, respectively). Maintaining the existing production capacity requires the expenditure on panels at a level that compensates for those intended for disposal, or even a higher expenditure depending on the policy for the development of photovoltaic energy.
The following observations result from the scenarios of solar energy development and utilization of PV panels adopted in the study:
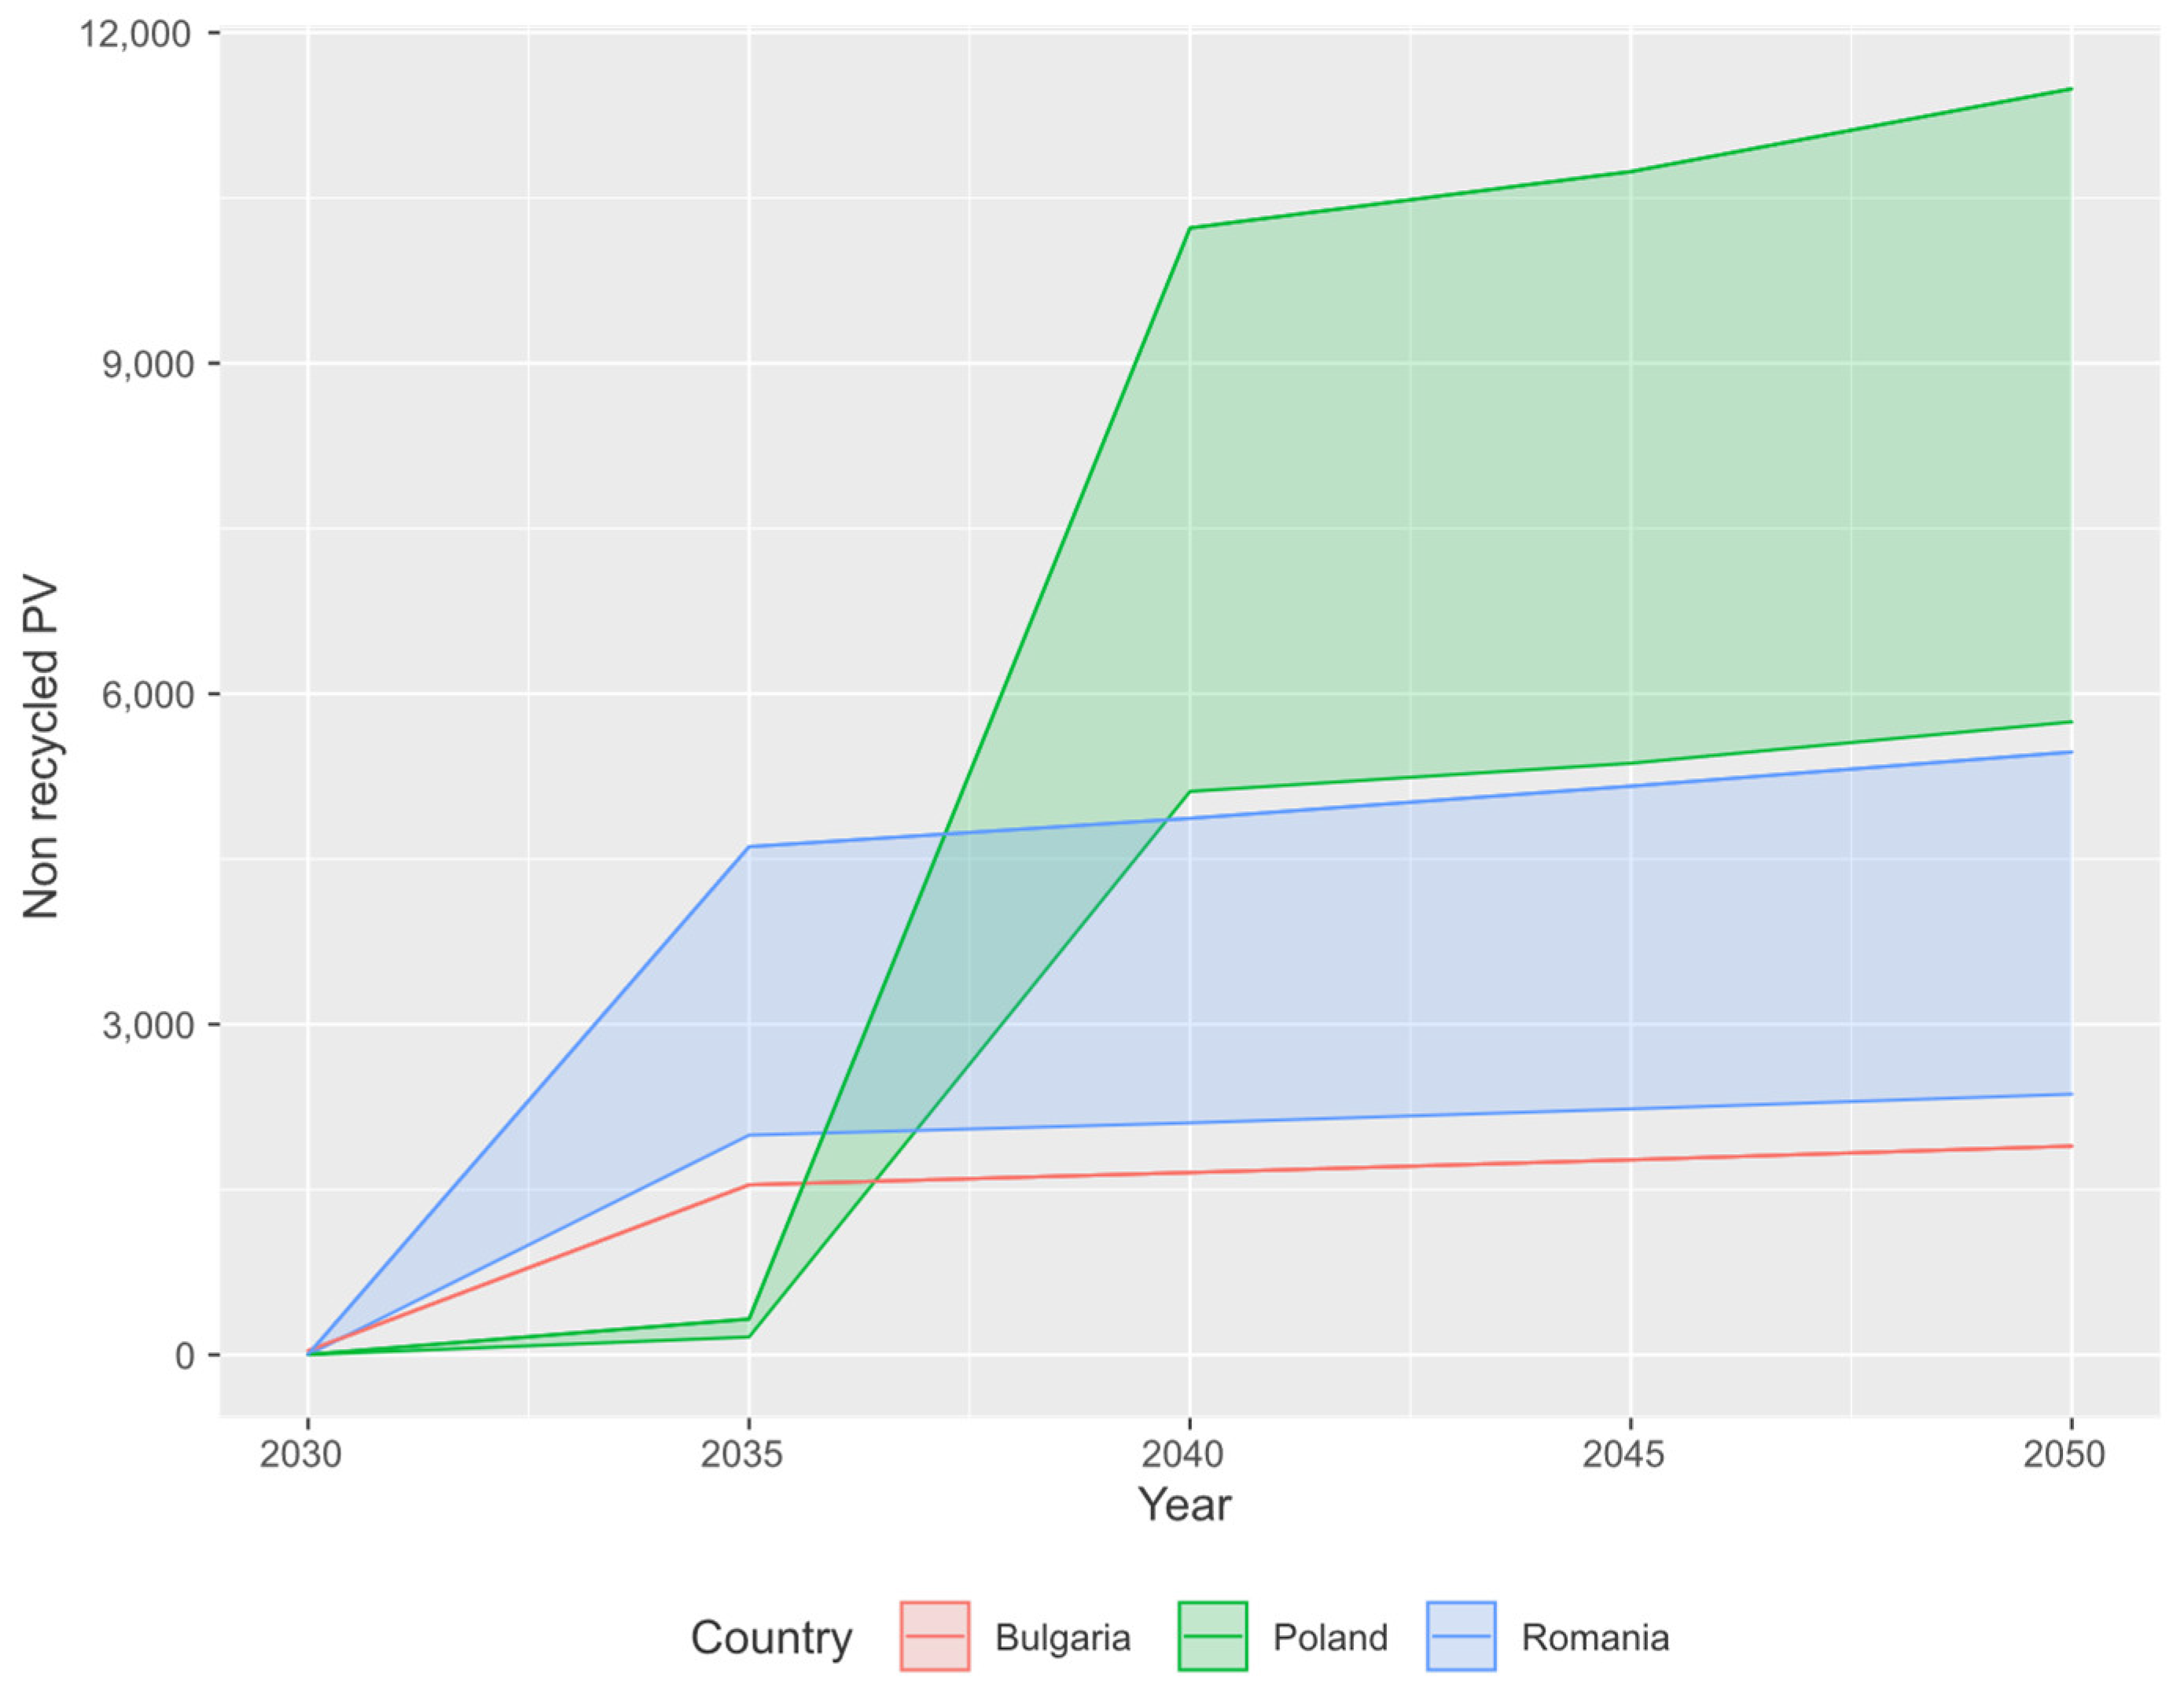
- The baseline scenario assumes that recycling in the countries in the study will be maintained at the 2018 level, i.e., 68% for Bulgaria, 36% for Poland, and 26% for Romania (Eurostat online data code: CEI_WM050) [116]. The assumptions made (an increase in production capacity and the related prediction of an increase in the PV surface area, the life cycle of PV panels) lead to a conclusion that the area of recycled panels in the period 2030–2050 will be the highest in Bulgaria and Romania in 2035 (approximately 3,200,000 and 1,620,000 m2 respectively) and in Poland in 2040 (5,570,000 m2). As a consequence, the area of non-recycled panels in cumulative terms will reach the highest level in Poland in 2050 (approximately 11,500,000 m2). A twofold lower level of non-recycled waste is expected in Romania (approximately 5,470,000 m2), and the lowest level will be achieved in Bulgaria (less than 1,900,000 m2).
- Growth scenario in which it was assumed that recycling would reach the level typical in this regard for the best Western European countries (at 68%, which also means no change in Bulgaria’s case). In this scenario, the largest panel area will be utilized in Poland in 2040 (approximately 10,520,000 m2), Bulgaria (approximately 3,200,000 m2), and Romania in 2035 (4,235,000 m2). The negative impact of PV on the environment will decrease significantly if a higher recycling level was adopted and is related to the base case. The area of non-recycled panels by 2050 (increasing approach) in Poland will decrease to approximately 5,750,000 m2 (the highest among the countries in the study), and in Romania to approximately 2,370,000 m2 (Figure 8).
3.4.2. Supply Diversification
Among the countries studied, Poland is the largest recipient of the components necessary for the development of green energy; its imports amounted to approximately USD 33.1 million in 2018 [36]. The main supplier of these components to Poland is Germany, which, in 2018, was responsible for approximately 28% of Poland’s total imports (and in 2015–2018, more than a quarter of the total, with an upward trend). China is also a large supplier (18.2% of total supplies). Together, these two countries account for almost half of Poland’s supplies of components for green energy production. Significantly lower than in Poland (approximately three times), the supply of components for green energy production was recorded in Romania (in 2018, approximately USD 11.6 million), and even lower in Bulgaria (USD 3.9 million). The different degrees of dependence on suppliers in these countries is a symptom of differences in the structure of renewable energy production and the directions of its development. It is reflected in the different dynamics of growth of solar and wind energy production capacity.
In the case of solar energy growth, it is very high in Poland (in 2015–2018 by 421%) compared to a slight growth rate in Romania (approximately 4.5%), and even more marginal rate in Bulgaria (by 0.4%). This very dynamic growth in Poland is undoubtedly the effect of its lower level in the base year of 2015 (approximately 10 times lower production capacity than in Bulgaria and approximately 12 times less than in Romania). A similarly high growth dynamics was recorded in wind energy in Poland—it amounted to approximately 420% in 2010–2018.
A higher growth was recorded in Romania (approximately 680%), while in Bulgaria it amounted to approximately 43%. It is worth noting that this high increase in wind energy in Poland took place despite the high level of production capacity in the base year 2010. At the same time, the growth dynamics of the import of components necessary for green energy production is similar in the countries in the study, i.e., it reached about 33% in Poland and Bulgaria and about 32% in Romania between 2015 and 2018.
3.4.3. Technology in Energy Transformation
New digital solutions offer great opportunities for the integration of energy from renewable sources with other energy sources. Their development determines the development of the ICT sector. ICT expenditure in Poland in 2010–2018 increased from approximately EUR 11.5 billion to approximately EUR 17.8 billion, reaching the highest level among the CEE countries in this study (Eurostat –TIN00074) [31]. In 2018, in Romania, these expenditures amounted to approximately EUR 7.65 billion and in Bulgaria they were more than twice as low (approximately 3.4 billion EUR). Their particularly high growth dynamics were recorded in Romania (approximately 95% increase), while the lowest growth happened in Poland (approximately 55%). When the changes in the volume of expenditures were compared to the dynamics of the development of renewable energy production capacities (including solar and wind), we found that in each of the analyzed countries there were positive relationships between them (confirmed by Pearson’s correlation), ranging from 0.81 (Romania) to 0.86 (in Poland) to 0.89 (Bulgaria). At the same time, the growth rate of ICT expenditure was found to be disproportionately low in relation to the dynamic growth of solar and wind energy, especially in Poland and Romania.
4. Conclusions and Perspectives for Further Research
The energy structure formed in the past, country’s own energy resources, political decisions, and technological possibilities lead to different paths of CEE countries, moving towards the assumed climate goals. Non-RES still play an important role in many of the countries, namely, Poland, Slovakia, the Czech Republic, Bulgaria, and Hungary. However, all of these countries are undergoing a green energy transition. Its most visible manifestation is the increase in the use of RES for the production of electricity. In 2019, electricity capacity from RES in Latvia, for example, exceeded 60%. There are different models in the structure of power generated by RES in the CEE group of countries. In Latvia, Slovenia, Slovakia, Romania, and Bulgaria, hydropower plays a dominant role, while wind energy is dominant in Lithuania and Poland. In Hungary and the Czech Republic, on the other hand, it is the solar energy that makes them stand out in terms of the power generated from RES.
The constructed energy transformation indicator shows the analyzed phenomenon in a slightly wider perspective than that of the energy structure or electricity production. Its three main components, i.e., energy productivity, the share of RES in total energy consumption, and the intensity of GGE, fit in with the answer to the following question: Does the increase in energy consumption from RES lead to an increase in total energy productivity in the conditions of lower GGE?
From this point of view, the synthetic index of energy transformation allows us to divide the CEE countries into three groups of different sizes. The first group includes leaders—Latvia and Romania. Bulgaria is an unequivocal outsider creating the third group, and to a lesser extent Estonia and Poland. The remaining countries form the second group.
The energy transition to a zero-emission economy is not a simple transition, both from social and technical point of view. It is a challenge in terms of social costs and risk. The latter can be seen through the characteristics of RES. In this case, the greatest risk of changes is associated with unstable sources, i.e., solar and wind energy. Countries with an advanced energy transformation process, in which the sun and wind play a very important role, will have to face them first of all. These problems concern technology, finances, and integration with energy distribution networks.
The second group of issues regards the goals of green transformation, i.e., the environmental benefits of raw material independence as well as the improvement of the competitiveness of the energy sector and the economy related to it. There is e–waste instead of GGE and dependence on imports of solar and wind energy components in lieu of oil and gas imports. The perception of energy efficiency and the competitiveness of the economy is also changing. The relations between them must be supported by digital solutions, i.e., Artificial Intelligence (AI), IoT, and big data. Unfortunately, the growth rate of ICT expenditure is disproportionately low in relation to the dynamic growth of solar and wind energy, especially in Poland and Romania.
A European Green Deal strategy requires a new, holistic view. Limiting the economy to strictly technological conditions may lead to economic disturbances in the long run. It is a challenge to the economic policy of the CEE countries—energy policy is its integral part. New investments are necessary for creating national energy technologies, building production lines for renewable energy, and development of ICT. They should be accompanied by investments in e-waste disposal, in line with the increase in the share of RES in the energy structure. These tasks are particularly important for the CEE countries, which develop their renewable energy based on imported products, and in terms of e-waste, they rank at the bottom of the EU.
Funding
This research received no external funding.
Institutional Review Board Statement
Not applicable.
Informed Consent Statement
Not applicable.
Data Availability Statement
Publicly available datasets were analyzed in this study. This data can be found here: https://ec.europa.eu/eurostat/data/database (accessed on 12 December 2020); https://www.irena.org/Statistics/Statistical-Profiles (accessed on 12 December 2020); https://www.importgenius.com (accessed on 12 December 2020).
Conflicts of Interest
The authors declare no conflict of interest.
References
- Gonzalez-Perez, M.; Neuerburg, K. Climate Change as Critical Security Threat. Int. J. Clim. Change 2019, 11, 1–14. [Google Scholar] [CrossRef]
- WTI. What Is Green Energy? (Definition, Types and Examples). Available online: https://www.twi-global.com/technical-knowledge/faqs/what-is-green-energy (accessed on 11 January 2020).
- Herrero, C.; Pineda, J.; Villar, A.; Zambrano, E. Tracking progress towards accessible, green and efficient energy: The Inclusive Green Energy index. Appl. Energy 2020, 279, 115691. [Google Scholar] [CrossRef]
- European Commission. The EU Approach Towards Implementing the UN’s 2030 Agenda for Sustainable Development Together with Its Member Countries. Available online: https://ec.europa.eu/info/strategy/international-strategies/sustainable-development-goals/eu-approach-sustainable-development_en (accessed on 11 November 2020).
- European Commission. Communication from the Commission. Clean Energy for All Europeans. Available online: https://eur-lex.europa.eu/legal-content/EN/TXT/?uri=CELEX:52016DC0860 (accessed on 11 November 2020).
- Hatzigeorgiou, E.; Polatidis, H.; Haralambopoulos, D. Energy CO2 Emissions for 1990–2020: Decomposition Analysis for EU25 and Greece. Energy Source Part A 2010, 32, 1908–1917. [Google Scholar] [CrossRef]
- European Commission. Communication from the Commission. A Clean Planet for All. A European Strategic Long-Term Vision for a Prosperous, Modern, Competitive and Climate Neutral Economy. Available online: https://eur-lex.europa.eu/legal-content/EN/ALL/?uri=COM%3A2018%3A773%3AFIN (accessed on 15 October 2020).
- Kemfert, C. Green Deal for Europe: More Climate Protection and Fewer Fossil Fuel Wars. Intereconomics 2019, 54, 353–358. [Google Scholar] [CrossRef] [Green Version]
- Unctad. Development Status Groups and Composition 2017. Available online: https://unctadstat.unctad.org/EN/Classifications/DimCountries_DevelopmentStatus_Hierarchy.pdf (accessed on 19 November 2020).
- IRENA. Available online: https://www.irena.org/Statistics/Statistical-Profiles (accessed on 19 December 2020).
- Thevenon, O. Family Policies in OECD Countries: A Comparative Analysis. Pop. Dev. Rev. 2011, 37, 57–87. [Google Scholar] [CrossRef]
- Munandar, T.A.; Azhari, S.N. Analysis of Regional Development Disparity with Clustering Technique Based Perspective. Int. J. Adv. Res. Comp. Sci. 2015, 6, 137–141. [Google Scholar]
- Joopudi, S.; Rathi, S.S.; Narasimhana, S.; Rengaswamyb, R. A New Cluster Validity Index for Fuzzy Clustering. IFAC Proc. 2013, 46, 325–330. [Google Scholar] [CrossRef]
- De Souto, M.; De Araujo, D.; Costa, I.; Soares, R.; Ludermir, T.; Schliep, A. Comparative study on normalization procedures for cluster analysis of gene expression datasets. In Proceedings of the 2008 IEEE International Joint Conference on Neural Networks (IJCNN 2008), Hong Kong, China, 1–8 June 2008; pp. 2792–2798. [Google Scholar]
- Řezanková, H. Cluster Analisys of Economic Data. Staistika 2014, 94, 73–86. [Google Scholar]
- Kopczewska, K.; Kopczewski, T.; Wójcik, P. Quantitative Methods in R, Economic and Financial Applications; CeDeWu: Warszawa, Poland, 2009. [Google Scholar]
- Młodak, A. Taxonomic Analysis in Regional Statistics; Difin: Warszawa, Poland, 2006. [Google Scholar]
- Mischke, M. Types of Public Family Support: A Cluster Analysis of 15 European Countries. J. Comp. Policy Anal. 2011, 13, 443–456. [Google Scholar] [CrossRef]
- Hellwig, Z. Zastosowanie metody taksonomicznej do typologicznego podziału krajów ze względu na poziom ich rozwoju oraz zasoby i strukturę wykwalifikowanych kadr. Przegląd Stat. 1968, 4, 307–326. [Google Scholar]
- Suchecki, B. Ekonometria Przestrzenna: Metody i Modele Analizy Danych Przestrzennych; C.H. Beck: Warszawa, Poland, 2010. [Google Scholar]
- European Parliament. Regulation (Eu) 2018/842 of the European Parliament and of The Council. On Binding Annual Greenhouse Gas Emission Reductions by Member States from 2021 to 2030 Contributing to Climate Action to Meet Commitments Under the Paris Agreement and Amending Regulation (EU) No 525/2013. Available online: https://eur-lex.europa.eu/legal-content/EN/TXT/?uri=celex%3A32018R0842 (accessed on 10 November 2020).
- European Parliament. Directive 2018/2001 of the European Parliament and of the Council on the Promotion of the Use of Energy from Renewable Sources. Available online: https://eur-lex.europa.eu/legal-content/EN/TXT/PDF/?uri=CELEX:32018L2001&from=fr (accessed on 10 November 2020).
- European Parliament. Directive (EU) 2018/2002 of the European Parliament and of the Council Amending Directive 2012/27/EU on Energy Efficiency. Available online: https://eur-lex.europa.eu/legal-content/EN/TXT/?uri=uriserv:OJ.L_.2018.328.01.0210.01.ENG&toc=OJ:L:2018:328:TOC (accessed on 10 November 2020).
- Kulovesi, K.; Oberthür, S. Assessing the EU’s 2030 Climate and Energy Policy Framework: Incremental change toward radical transformation? Rev. Eur. Community Int. Environ. Law 2020, 151–166. [Google Scholar] [CrossRef]
- Kuzma, J.W. Basic Statistics for the Health Sciences, 3rd ed.; Mayfield Publishing Company: Mountain View, CA, USA, 1998. [Google Scholar]
- Milligan, G.; Cooper, M. An examination of procedures for determining the number of clusters in a data set. Psychometrika 1985, 50, 159–179. [Google Scholar] [CrossRef]
- Taylor, R. Interpretation of the Correlation Coefficient: A Basic Review. J. Diagn. Med. Sonogr. 1990, 6, 35–39. [Google Scholar] [CrossRef]
- Schober, P.; Boer, C.; Schwarte, L.A. Correlation Coefficients: Appropriate Use and Interpretation. Anesth. Analg. 2018, 1763–1768. [Google Scholar] [CrossRef] [PubMed]
- Milligan, G.W.; Cooper, M.C. A study of standardization of variables in cluster analysis. J. Classif. 1998, 5, 181–204. [Google Scholar] [CrossRef]
- Grabiński, T. Analiza Taksonomiczna Krajów EUROPY w Ujęciu Regionalnym; Akademii Ekonomicznej w Krakowie: Kraków, Poland, 2003. [Google Scholar]
- Eurostat. Available online: https://ec.europa.eu/eurostat/data/database (accessed on 17 November 2020).
- European Commission. EU Energy Trends to 2030—Update 2009. Available online: https://ec.europa.eu/energy/sites/ener/files/documents/trends_to_2030_update_2009.pdf (accessed on 17 December 2020).
- Sunpower. Technical Specifications. Available online: https://us.sunpower.com/solar-resources/products/datasheets (accessed on 17 December 2020).
- QCells. Q Cells Q.Antum Duo Solar Panels. Available online: https://www.q-cells.co.uk/products/solar-panels.html (accessed on 17 December 2020).
- Solaria. Technical Documents & Literature Library. Available online: https://www.solaria.com/additional-product-information (accessed on 17 December 2020).
- International Trade Statistics. Available online: https://www.importgenius.com/?utm_source=google&utm_medium=9061067&utm_campaign=&utm_term=international%20trade%20statistics&utm_content=107111299575&gclid=Cj0KCQiAw_H-BRD-ARIsALQE_2MrQHBN-VpeGFXKFAepycRvBZJo6Dg-xwENMXMUbF_TDWLMzdRNTr0aAkNCEALw_wcB (accessed on 18 December 2020).
- Helm, D. Energy, the State, and the Market: British Energy Policy Since 1979; Oxford University Press Inc.: Oxford, UK, 2004. [Google Scholar]
- Clapp, J. Development as Freedom. Int. J. 1999, 55, 160–162. [Google Scholar] [CrossRef]
- Dunning, J.H. Towards a new paradigm of development: Implications for determinants of international business. Transnatl. Corp. 2006, 15, 173–227. [Google Scholar]
- Markandya, P.-G.S.; Streimikiene, D. Energy intensity in transition economies: Is there convergence towards the EU average? Energy Econ. 2006, 28, 121–145. [Google Scholar] [CrossRef]
- Cornillie, J.; Fankhauser, S. The energy intensity of transition countries. Energy Econ. 2004, 26, 283–295. [Google Scholar] [CrossRef]
- Fankhauser, S.; Lavric, L. The investment climate for climate investment: Joint Implementation in transition countries. Clim. Policy 2003, 3, 417–434. [Google Scholar] [CrossRef]
- European Commission. Renewable Energy Directive. Available online: https://ec.europa.eu/energy/en/topics/renewable-energy/renewable-energy-directive (accessed on 14 November 2020).
- Oncioiu, I.; Petrescu, A.; Grecu, E.; Petrescu, M. Optimizing the Renewable Energy Potential: Myth or Future Trend in Romania. Energies 2017, 10, 759. [Google Scholar] [CrossRef]
- Ossewaarde, M.; Ossewaarde-Lowtoo, R. The EU’s Green Deal: A Third Alternative to Green Growth and Degrowth? Sustainability 2020, 12, 9825. [Google Scholar] [CrossRef]
- Markus, R. Checking In: Renewable Energy in CEE. Available online: https://ceelegalmatters.com/analysis/14539-checking-in-renewable-energy-in-cee (accessed on 7 December 2020).
- European Commission. The European Green Deal. Available online: https://ec.europa.eu/info/sites/info/files/european-green-deal-communication_en.pdf (accessed on 14 October 2020).
- Simionescu, M.; Păuna, C.B.; Diaconescu, T. Renewable Energy and Economic Performance in the Context of the European Green Deal. Energies 2020, 13, 6440. [Google Scholar] [CrossRef]
- Child, C.; Breyer, C. Transition and transformation: A review of the concept of change in the progress towards future sustainable energy systems. Energy Policy 2017, 107, 11–26. [Google Scholar] [CrossRef]
- UE Market Outlook. For Solar Power 2019–2023. Available online: https://www.solarpowereurope.org/eu-market-outlook-for-solar-power-2019-2023/ (accessed on 14 October 2010).
- Prospects for the Renewable Energy Development in CEE. Available online: http://www.forum-ekonomiczne.pl/prospects-for-the-renewable-energy-development-in-cee/?lang=en (accessed on 7 November 2020).
- Sun, J.W. Three types of decline in energy intensity—An explanation for the decline of energy intensity in some developing countries. Energy Policy 2003, 31, 519–526. [Google Scholar] [CrossRef]
- Samargandi, N. Energy intensity and its determinants in OPEC countries. Energy 2019, 186, 115803. [Google Scholar] [CrossRef]
- Rourke, F.O.; Boyle, F.; Reynolds, A. Renewable energy resources and technologies applicable to Ireland. Renew. Sustain. Energy Rev. 2009, 13, 1975–1984. [Google Scholar] [CrossRef] [Green Version]
- West, L. Top Renewable Energy Sources. Available online: https://www.treehugger.com/top-renewable-energy-sources-1204190 (accessed on 7 December 2020).
- Global Energy Statistical Yearbook 2020. Share of Wind and Solar in Electricity Production. Available online: https://yearbook.enerdata.net/renewables/wind-solar-share-electricity-production.html#:~:text=In%202019%2C%20the%20share%20of,%2Dfired%20%E2%80%93%20power%20generation%20declined (accessed on 15 March 2020).
- Good, C.; Andresen, I.; Hestnes, A.G. Solar energy for net zero energy buildings—A comparison between solar thermal, PV and photovoltaic–thermal (PV/T) systems. Sol. Energy 2015, 122, 986–996. [Google Scholar] [CrossRef] [Green Version]
- Urban, F.; Geall, S.; Wang, Y. Solar PV and solar water heaters in China: Different pathways to low carbon energy. Renew. Sustain. Energy Rev. 2016, 64, 531–542. [Google Scholar] [CrossRef] [Green Version]
- Letcher, T.M. Wind Energy Engineering: A Handbook for Onshore and Offshore Wind Turbines; Academic Press: Cambridge, MA, USA, 2013. [Google Scholar]
- Yang, H.; Wei, Z.; Chengzhi, L. Optimal design and techno-economic analysis of a hybrid solar–wind power generation system. Appl. Energy 2009, 86, 163–169. [Google Scholar] [CrossRef]
- Lindman, Å.; Söderholm, P. Wind energy and green economy in Europe: Measuring policy-induced innovation using patent data. Appl. Energy 2016, 179, 1351–1359. [Google Scholar] [CrossRef]
- Trancik, J.E.; Cross-Call, D. Energy technologies evaluated against climate targets using a cost and carbon trade-off curve. Environ. Sci. Technol. 2013, 47, 6673–6680. [Google Scholar] [CrossRef] [PubMed]
- Kavlak, G.; McNerney, J.; Trancik, J.E. Evaluating the causes of cost reduction in photovoltaic modules. Energy Policy 2018, 123, 700–710. [Google Scholar] [CrossRef] [Green Version]
- Breyer, C.; Birkner, C.; Meiss, J.; Goldschmidt, J.C.; Riede, M. A top-down analysis: Determining photovoltaics R&D investments from patent analysis and R&D headcount. Energy Policy 2013, 62, 1570–1580. [Google Scholar] [CrossRef]
- Comello, S.; Reichelstein, S.; Sahoo, A. The road ahead for solar PV power. Renew. Sustain. Energy Rev. 2018, 92, 744–756. [Google Scholar] [CrossRef]
- Hansen, K.; Breyer, C.; Lund, H. Status and perspectives on 100% renewable energy systems. Energy 2019, 75, 471–480. [Google Scholar] [CrossRef]
- Kim, J.; Park, S.-Y.; Lee, J. Do people really want renewable energy? Who wants renewable energy? Discrete choice model of reference-dependent preference in South Korea. Energy Policy 2018, 120, 761–770. [Google Scholar] [CrossRef]
- Cavallaro, F.; Ciraolo, L. A multicriteria approach to evaluate wind energy plants on an Italian island. Energy Policy 2005, 33, 235–244. [Google Scholar] [CrossRef]
- Dóci, G.; Vasileiadou, E.; Petersen, A.C. Exploring the transition potential of renewable energy communities. Futures 2015, 66, 85–95. [Google Scholar] [CrossRef] [Green Version]
- Bollen, M.H.J.; Yang, K. Harmonic aspects of wind power integration. J. Mod. Power Syst. Clean Energy 2013, 1, 14–21. [Google Scholar] [CrossRef] [Green Version]
- Mazorra Aguiar, L.; Pereira, B.; David, M.; Díaz, F.; Lauret, P. Use of satellite data to improve solar radiation forecasting with Bayesian Artificial Neural Networks. Sol. Energy 2015, 122, 1309–1324. [Google Scholar] [CrossRef]
- Dowds, J.; Hines, P.; Ryan, T.; Buchanan, W.; Kirby, E.; Apt, J.; Jaramillo, P. A review of large-scale wind integration studies. Renew. Sustain. Energy Rev. 2015, 49, 768–794. [Google Scholar] [CrossRef]
- Blarke, M.B.; Lund, H. The effectiveness of storage and relocation options in renewable energy systems. Renew. Energy 2008, 33, 1499–1507. [Google Scholar] [CrossRef]
- Mourant, A. Energy storage research advances. Renew. Energy Focus 2015, 16, 28–29. [Google Scholar] [CrossRef]
- Denholm, P.; Mai, T. Timescales of energy storage needed for reducing renewable energy curtailment. Renew. Energy 2019, 130, 388–399. [Google Scholar] [CrossRef]
- Oprea, S.-V.; Bâra, A.; Majstrović, G. Aspects Referring Wind Energy Integration from the Power System Point of View in the Region of Southeast Europe. Study Case of Romania. Energies 2018, 11, 251. [Google Scholar] [CrossRef] [Green Version]
- Hirth, L.; Ueckerdt, F.; Edenhofer, O. Integration costs revisited—An economic framework for wind and solar variability. Renew. Energy 2015, 74, 925–939. [Google Scholar] [CrossRef]
- Akhmatov, V. System stability of large wind power networks: A Danish study case. Int. J. Electr. Power Energy Syst. 2006, 28, 48–57. [Google Scholar] [CrossRef]
- Huber, M.; Dimkova, D.; Hamacher, T. Integration of wind and solar power in Europe: Assessment of flexibility requirements. Energy 2014, 69, 236–246. [Google Scholar] [CrossRef] [Green Version]
- International Electrotechnical Commission. Grid Integration of Large-Capacity Renewable Energy Sources and Use of Large-Capacity Electrical Energy Storage. Available online: http://www.iec.ch/whitepaper/pdf/iecWP-gridintegrationlargecapacity-LR-en.pdf (accessed on 7 February 2020).
- Kulatilaka, N. Green Revolution 2.0: Opportunities and Challenges in the Green Economy. SSRN Electron. J. 2013. [Google Scholar] [CrossRef]
- Boie, I.; Fernandes, C.; Frías, P.; Klobasa, M. Efficient strategies for the integration of renewable energy into future energy infrastructures in Europe—An analysis based on transnational modeling and case studies for nine European regions. Energy Policy 2014, 67, 170–185. [Google Scholar] [CrossRef]
- Franki, V.; Višković, A. Energy security, policy and technology in South East Europe: Presenting and applying an energy security index to Croatia. Energy 2015, 90, 494–507. [Google Scholar] [CrossRef]
- Shum, K.L. Renewable Energy Technology—Is it a Manufactured Technology or an Information Technology? Sustainability 2010, 2, 2382–2402. [Google Scholar] [CrossRef] [Green Version]
- Duch-Brown, N.; Rossetti, F. Digital platforms across the European regional energy markets. Energy Policy 2020, 144, 111612. [Google Scholar] [CrossRef]
- Kaygusuz, K. Renewable Energy Sources: The Key to a Better Future. Energy Sources 2002, 24, 787–799. [Google Scholar] [CrossRef]
- European Parliament. Report from The Commission to The European Parliament and The Council on Progress of Clean Energy Competitiveness. Available online: https://eur-lex.europa.eu/legal-content/EN/TXT/?qid=1602695747015&uri=COM:2020:953:FIN (accessed on 10 January 2021).
- Ulli-Beer, S.; Bosshardt, M.; Dietrich, P.; Wokaun, A. What Alternative Drive-train Technologies and Policies are Needed to Meet a 50% CO2 Reduction Target? The Case of the EU-Fleet. SAE Tech. Pap. 2009. [Google Scholar] [CrossRef]
- Niederhafner, S.; Chan Song, L. Different Paths Towards the Same Goal? Comparing the Implementation and Performance of CO2 Emissions Reduction Regulations in the EU and South Korea. SSRN Electron. J. 2013. [Google Scholar] [CrossRef]
- European Commission. A New Industrial Strategy for Europe. Available online: https://eur-lex.europa.eu/legal-content/EN/TXT/?uri=CELEX:52020DC0102 (accessed on 24 November 2020).
- Asafu-Adjaye, J.; Mahadevan, R. Implications of CO2 reduction policies for a high carbon emitting economy. Energy Econ. 2013, 38, 32–41. [Google Scholar] [CrossRef]
- Bogacka, M.; Pikoń, K.; Landrat, M. Environmental impact of PV cell waste scenario. Waste Manag. 2017, 70, 198–203. [Google Scholar] [CrossRef]
- Hocine, L.; Mounia Samira, K. Optimal PV panel’s end-life assessment based on the supervision of their own aging evolution and waste management forecasting. Sol. Energy 2019, 191, 227–234. [Google Scholar] [CrossRef]
- Fiandra, V.; Sannino, L.; Andreozzi, C.; Graditi, G. End-of-life of silicon PV panels: A sustainable materials recovery process. Waste Manag. 2019, 84, 91–101. [Google Scholar] [CrossRef]
- Ardente, F.; Latunussa, C.E.L.; Blengini, G.A. Resource efficient recovery of critical and precious metals from waste silicon PV panel recycling. Waste Manag. 2019, 91, 156–167. [Google Scholar] [CrossRef]
- Kruyt, B.; van Vuuren, D.P.; de Vries, H.J.M.; Groenenberg, H. Indicators for energy security. Energy Policy 2009, 37, 2166–2181. [Google Scholar] [CrossRef]
- Winzer, C. Conceptualizing energy security. Energy Policy 2012, 46, 36–48. [Google Scholar] [CrossRef] [Green Version]
- Kamble, S.P. Editorial: Sustainability for Energy and Environment. Curr. Environ. Eng. 2018, 5, 2–3. [Google Scholar] [CrossRef]
- Deese, D.A. Energy: Economics, Politics, and Security. Int. Secur. 1979, 4, 140. [Google Scholar] [CrossRef]
- Cohen, G.; Joutz, F.; Loungani, P. Measuring energy security: Trends in the diversification of oil and natural gas supplies. Energy Policy 2011, 39, 4860–4869. [Google Scholar] [CrossRef] [Green Version]
- Weiner, C. Security of Energy Supply and Gas Diversification in Poland. SSRN Electron. J. 2018. [Google Scholar] [CrossRef] [Green Version]
- Pawluszko, T. Energy Security and the Problem of Peripherality: Case study of the CEE region between Russia and the EU. Can. J. Polit. Sci. 2018, 2, 61–82. [Google Scholar] [CrossRef]
- European Commission. The Green Deal and Competition Policy. Available online: https://ec.europa.eu/commission/commissioners/2019-2024/vestager/announcements/green-deal-and-competition-policy_en (accessed on 10 December 2020).
- IEA. Digitalisation and Energy. Technology Report—November 2017. Available online: https://www.iea.org/reports/digitalisation-and-energy (accessed on 12 December 2020).
- Brouthers, K.D.; Geisser, K.D.; Rothlauf, F. Explaining the internationalization of ibusiness firms. J. Int. Bus. Stud. 2015, 47, 513–534. [Google Scholar] [CrossRef]
- Hazarbassanova, D.B. The value creation logic and the internationalisation of internet firms. Rev. Int. Bus. Strategy 2016, 26, 349–370. [Google Scholar] [CrossRef]
- International Renewable Energy Agency. Energy Profile Latvia. Available online: https://www.irena.org/IRENADocuments/Statistical_Profiles/Europe/Latvia_Europe_RE_SP.pdf (accessed on 12 December 2020).
- International Renewable Energy Agency. Energy Profile Romania. Available online: https://www.irena.org/IRENADocuments/Statistical_Profiles/Europe/Romania_Europe_RE_SP.pdf (accessed on 12 December 2020).
- International Renewable Energy Agency. Energy Profile Bulgaria. Available online: https://www.irena.org/IRENADocuments/Statistical_Profiles/Europe/Bulgaria_Europe_RE_SP.pdf (accessed on 12 December 2020).
- Smith, L.; Velten, E.K.; Donat, L.; Duwe, M. Assessment of Climate Change Policies in the Context of the European Semester: Country Report: Lithuania; Ecologic Institute Eclareon: Berlin, Germany, 2013. [Google Scholar]
- IEA. Renewables 2019. Market Analysis and Forecast from 2019 to 2024. Available online: https://www.iea.org/reports/renewables-2019 (accessed on 10 November 2020).
- European Commission. European Energy and Transport Trends to 2030. Directorate-General for Energy. Available online: http://bookshop.europa.eu (accessed on 11 November 2020).
- Shivakumara, A.; Dobbinsb, A.; Fahlb, U.; Singh, A. Drivers of renewable energy deployment in the EU: An analysis of past trends and projections. Energy Strategy Rev. 2019, 26, 100402. [Google Scholar] [CrossRef]
- Eurostat Database. Electricity Production Capacities by Main Fuel Groups and Operator. Available online: https://ec.europa.eu/eurostat/databrowser/view/nrg_inf_epc/default/table?lang=en (accessed on 2 December 2020).
- Eurostat Database. Electricity Production Capacities for Renewables and Wastes. Available online: https://ec.europa.eu/eurostat/databrowser/view/nrg_inf_epcrw/default/table?lang=en (accessed on 2 December 2020).
- Eurostat Database. Recycling Rate of e-Waste %. Available online: https://ec.europa.eu/eurostat/databrowser/view/cei_wm050/default/table?lang=en (accessed on 12 December 2020).
Figure 1.
Pearson correlation coefficients between partial indicators purchasing power standard (PPS)/kgoe, renewable energy sources (RES), and greenhouse gas emissions (GGE) in 2018.
Figure 1.
Pearson correlation coefficients between partial indicators purchasing power standard (PPS)/kgoe, renewable energy sources (RES), and greenhouse gas emissions (GGE) in 2018.

Figure 2.
Electricity capacity structure obtained from RES (in %) in 2019.

Figure 3.
Classification of Central and Eastern European (CEE) countries according to energy transformation based on the synthetic index (di) in 2008 and 2018.
Figure 3.
Classification of Central and Eastern European (CEE) countries according to energy transformation based on the synthetic index (di) in 2008 and 2018.

Figure 4.
Classification of CEE countries in 2018 in terms of the level of energy transformation according to Ward’s method.
Figure 4.
Classification of CEE countries in 2018 in terms of the level of energy transformation according to Ward’s method.

Figure 5.
Energy productivity in CEE countries in 2008 and 2018 in PPS/kgoe.

Figure 6.
The share of RES in energy consumption in CEE countries in 2008 and 2018 as percentages.

Figure 7.
GGE from energy consumption (100 = emissions in 2000) in CEE countries in 2008 and 2018.

Figure 8.
Prediction of non-recycled panels (area in thousand m2)—cumulatively in the years 2030–2050.
Figure 8.
Prediction of non-recycled panels (area in thousand m2)—cumulatively in the years 2030–2050.

Publisher’s Note: MDPI stays neutral with regard to jurisdictional claims in published maps and institutional affiliations. |
© 2021 by the author. Licensee MDPI, Basel, Switzerland. This article is an open access article distributed under the terms and conditions of the Creative Commons Attribution (CC BY) license (http://creativecommons.org/licenses/by/4.0/).
Share and Cite
MDPI and ACS Style
Pakulska, T. Green Energy in Central and Eastern European (CEE) Countries: New Challenges on the Path to Sustainable Development. Energies 2021, 14, 884. https://doi.org/10.3390/en14040884
AMA Style
Pakulska T. Green Energy in Central and Eastern European (CEE) Countries: New Challenges on the Path to Sustainable Development. Energies. 2021; 14(4):884. https://doi.org/10.3390/en14040884
Chicago/Turabian StylePakulska, Teresa. 2021. "Green Energy in Central and Eastern European (CEE) Countries: New Challenges on the Path to Sustainable Development" Energies 14, no. 4: 884. https://doi.org/10.3390/en14040884
Note that from the first issue of 2016, this journal uses article numbers instead of page numbers. See further details here.