An Improved Cuckoo Search Algorithm for Maximum Power Point Tracking of Photovoltaic Systems under Partial Shading Conditions


1
Sustainable Energy Technologies Center, King Saud University, Riyadh 11421, Saudi Arabia
2
Electrical Engineering Department, Mansoura University, Mansoura 35516, Egypt
3
K.A. CARE Energy Research and Innovation Center, Riyadh 11451, Saudi Arabia
Energies 2021, 14(4), 953; https://doi.org/10.3390/en14040953
Submission received: 20 December 2020
/
Revised: 4 February 2021
/
Accepted: 8 February 2021
/
Published: 11 February 2021
(This article belongs to the Section A2: Solar Energy and Photovoltaic Systems)
Abstract
:The problem of partial shading has serious effects on the performance of photovoltaic (PV) systems. Adding a bypass diode in shunt to each PV module avoids hot-spot phenomena, but causes multi-peaks in the power–voltage (P–V) characteristics of the PV array, which cause traditional maximum power point tracking (MPPT) techniques to become trapped in local peaks. This problem has forced researchers to search for smart techniques to track global peaks and prevent the possibility of convergence at local peaks. Swarm optimization techniques have been used to fill this shortcoming; unfortunately, however, these techniques suffer from unacceptably long convergence time. Cuckoo search (CS) is one of the fastest and most reliable optimization techniques, making it an ideal option to be used as an MPPT of PV systems under dynamic partial shading conditions. The standard CS algorithm has a long conversion time, high failure rate, and high oscillations at steady state; this paper aims to overcome these problems and to fill this research gap by improving the performance of the CS. The results obtained from this technique are compared to five swarm optimization techniques. The comparison study shows the superiority of the improved CS strategy introduced in this paper over the other swarm optimization techniques.
1. Introduction
Renewable energy systems, especially PV, are attracting more interest in recent decades due to their abundant and environmentally-friendly nature. Reducing the cost of energy generated from PV systems is an especially hot topic of research. Cost reduction efforts are generally done in one of two ways. The first one is improving the physical structure and materials of the PV cells, which is outside the scope of this paper. The second is improving the efficiency of the PV system through the power electronics circuits used with the PV array–this is the main focus of the paper. Due to the nonlinear relation between the P–V characteristics, a circuit is required to force the PV array to work at the terminal voltage associated with the maximum power. This can be accomplished using a DC-DC converter operated according to a control technique called maximum power point tracking (MPPT). Traditional MPPT techniques such as incremental conductance, perturb and observe (P & O), etc. [1] were efficiently used for this purpose in the case of uniform irradiance on all modules of the PV array–that is, where the P–V characteristic of the PV array contains only one peak. Partial shading conditions (PSC) may occur due to any physical object preventing solar irradiance from falling on some parts of the PV array. A bypass diode should be connected in shunt with each module in the PV array to prevent the hot-spot effect, which can damage the shaded modules. Meanwhile, PSC creates more than one peak in the P–V characteristics of the PV array. The traditional MPPT techniques may become trapped in one of the local peaks (LPs) and miss the tracking of the global peak (GP). Many efforts have been introduced in the literature to overcome this problem–one of the most important being the use of swarm optimization techniques (SOT) in tracking the GP and avoiding the LPs. SOT like particle swarm optimization (PSO) [2], bat algorithm (BA) [3], gray wolf optimization (GWO) [4], cuckoo search (CS) [5], etc. have been used for this purpose. These techniques are very effective in capturing the GP and avoiding the LPs; unfortunately, however, all these techniques suffer from long convergence time and high oscillation around the GP. All the challenges and efforts introduced in the literature are toward either reducing convergence time, failure rate, steady-state voltage, and power oscillations, or maintaining the simplicity of the code and the calculations required to reduce the cost of the hardware controller. For this reason, many improvements have been introduced to the standard SOT to reduce these issues–this is the main motivation of the present study. The outstanding characteristics of the CS algorithm make it a good candidate to be used as an MPPT of PV systems; for this reason, it is studied in detail in this paper. The CS is characterized by very fast convergence time and has only one parameter that needs to be tuned, making it easy to implementation. The main shortcoming of this technique is the high oscillations in the voltage and power from the PV array, as these may cause many disturbances of the PV system, greatly reducing the amount of energy generated.
The CS algorithm was developed in 2009 [6]; it imitates the behavior of cuckoo birds in their reproduction parasitism. The first use of CS in the tracking of the maximum power point (MPP) of a PV system took place in 2013 [7]. In that study, the authors used the standard or original CS (OCS) algorithm introduced in [6] and compared its results with those of the P&O MPPT technique. The results showed fast convergence compared to the P&O method. They did not, however, discuss the behavior of the proposed technique with several peaks and with swarm-size, which is covered in this paper.
In 2014, a modified CS algorithm was introduced in [5] using three searching agents to search for the GP using the Lévy flight multiplied by the distance between each searching agent and the best one. At the beginning of the searching journey, the distance between the searching agents’ best position and the current searching agent is large, and with the help of Lévy flight, it can make a large step that allows the CS to search the vicinity of the GP very easily. As the searching agents get closer to the best searching agent, the distance becomes smaller and the step tends to zero; this reduces the oscillations at steady-state conditions. In that study [5], a buck-boost converter was used and the optimization variable was the terminal voltage of the PV array. The CS parameters were as follows: the probability of abundant or destroying the nest (pa) was 0.25, and the step size (α) was 0.05. This study demonstrated fast convergence but did not investigate its performance with a higher number of peaks.
In 2015, a hybrid algorithm between the CS and fuzzy logic controller (FLC) was introduced in [8] to combine the benefits of the CS in quickly capturing the GP with the FLC’s accurate and robust tracking of the GP. In that study, the standard CS–which is characterized by very fast and reliable convergence and high oscillations at steady-state conditions–is used in the initialization. It then transfers control to the FLC to gain its accurate tracking and lower oscillations at steady state. This technique reduced the convergence time and oscillations around the steady-state condition at the expense of increasing the cost of the hardware used for the control system. The other technique used in [5], however, can remove the need for the FLC.
In 2016, another modified CS strategy was introduced by [9]. By eliminating any random movement in the OCS optimization technique, this technique proposes adaptive movement based on large movement for lower-power nests and small movement for high-power nests. This strategy improved the searching mechanism of CS. The problem of high oscillations at the steady state was solved at the expense of higher convergence time and increased complexity of the controller (increasing installation cost).
In the CS strategy introduced in [10], the structure of OCS is modified to reduce its random nature in the case of a steady-state condition. In this technique, the random nature generated from Lévy flight is eliminated with constant step size; for this reason, it may be called deterministic CS MPPT. This technique uses only three searching agents and always aligns the highest power value in the middle between the positions of the other searching agents. This technique is very fast in convergence and performs very well with uniform irradiance conditions and a low number of peaks in the P–V curve; with a higher number of peaks (greater than 4), however, this technique showed a high failure rate.
Another study was undertaken in 2017 [11] to improve the performance of the CS–to have fast convergence at initialization and lower oscillations at steady-state conditions. They used the standard CS [6], which creates high oscillations at steady-state conditions. This strategy was used to track the maximum power for the PV system used to pump the water for the water pump system.
Yet another strategy was proposed in 2017 [12] for improving the CS, this one using the static penalty function (SPF) [12]. In this technique, a constant penalty is used with the infeasible solutions.
Another method was introduced in 2018 to reduce the convergence time and the oscillations around the GP by hybridizing the CS and golden section search (GSS) algorithms [13]. In this strategy, the CS algorithm is used to capture the area containing the GP. After this is accomplished, the logic is switching the control to the GSS to finely track the GP and to reduce the oscillations around it [13]. This reduced the failure rate and convergence time, as well as oscillations, at the expense of increased cost and complexity of the controller hardware; this can be easily avoided, however, as shown in [5], and this is the approach taken by this paper.
The CS improvement strategy introduced in this paper is done by replacing the worst duty ratio to another one very near to the global optimal duty ratio, which reduces the convergence time, failure rate, and oscillations at steady-state conditions while maintaining simple logic and structure. The proposed strategy studies the performance of the improved CS (ICS) with the standard CS [6] to show the improvements gained from the modified technique. The fast and reliable convergence is additionally compared with the improved PSO strategy, BA, GWO, and the artificial bee colony (ABC) optimization. The simulation and experimental work introduced in this paper shows the performance of these techniques across different numbers of peaks in the P–V curve and swarm sizes. The ICS showed that its performance did not considerably affect the value of swarm-size as the case inherent in the other optimization techniques. The results obtained from the simulation and experimental work of this paper showed the superiority of the ICS strategy compared to the other optimization strategies in terms of failure rate, convergence time, and the steady-state oscillations.
The remaining parts of this paper are organized as follows: In Section 2, the modeling of the PV systems and the partial shading condition with evaluating coefficients of performance is shown. The MPPT SOT used in this study and are introduced in Section 3, along with their evaluation. Section 4 presents the simulation work its results. The experimental setup and results are shown in Section 5, with conclusions being drawn in Section 6.
2. Modeling of the PV System
The characteristic of the output power generated from a PV array depends on its output voltage. Extracting the highest power available from the PV array can be accomplished by forcing the PV array to work at the voltage that can generate this maximum power. To control the output voltage of the PV array, a DC-DC converter should be used. The output of the DC-DC converter should be maintained as constant by adjusting the voltage of the DC-link using the pulse width modulation (PWM) as shown in Figure 1. The PV system introduced in Figure 1 shows the connection of the PV array with a boost converter to control its terminal voltage. The output of the boost converter is connected to the input of a single-phase PWM inverter to interface between the PV system and the utility grid. The MPPT is used to control the duty ratio of the boost converter to force the PV array to always work at the GP. The MPPT and its logic is implemented in MATLAB code, and the output of the code is piped to a Simulink circuit, fed to the Dspace DS1104 interface circuit, and finally to the boost converter with the duty ratio as shown in Figure 1. The single-phase PWM is controlled to maintain constant DC-link voltage.
In the case of uniform irradiance over the PV array, the relation between the output power and voltage has only one peak at about 0.8 Voc, as shown in Figure 2. Meanwhile, the P–V curve contains more than one peak in the case of PSC, also shown in Figure 2. The characteristics of shading determine the number of peaks in the P–V curve of the PV array. The relation between the input and output voltage to the boost converter is shown in Equation (1). In the case of constant DC-link voltage, the terminal voltage of the PV array is a function in the duty ratio of the boost converter; for this reason, the relation between the generated power and duty ratio can be obtained as shown in Figure 3. It is clear from the curves shown in Figure 2 and Figure 3 that there is only one GP and multiple LPs.
The MPPT should ideally be able to capture the GP and avoid being trapped in any one of the LPs. This can be achieved using the SOT introduced in this paper, and is discussed in later sections:
where V is the terminal voltage of the PV array, VDC is the DC-link voltage, and d is the duty ratio of the boost converter.
2.1. The Partial Shading Condition
Partial shading occurs in PV arrays due to the shadows of static or moving objects such as trees, buildings, etc. This is called the PSC. Due to different irradiances on series modules, the same current should follow through all series modules, which makes some modules work as a load on the unshaded modules. The current of the shaded modules may generate a negative drop voltage, increasing the temperature of the shaded module. This high temperature may destroy the shaded modules based on a phenomenon called hot-spot [14]. For this reason, a parallel diode should be attached to each module to bypass the shaded modules when their voltage tends to be reversed, in order to protect these modules from the hot-spot phenomenon. PSC causes a PV array’s P–V curve to show multiple peaks; the one having the highest power is called the global peak (GP), and all others are called LPs.
2.2. Mismatch Power Loss
Two different kinds of mismatch occur in PV arrays: static and dynamic mismatches. The static mismatch can be caused by many reasons, including different tolerance in a module, different aging effects, and different tilt angles of modules. Losses due to static mismatch fall in the range of 0.3% to 2.5% [15]. The dynamic mismatch occurs mainly from dynamic partial shading, when static or moving objects prevent direct solar irradiance from falling on some of the PV modules. Due to the PSC, the generated power is the same in all parts of the PV array; it is lower than the sum of the available power that can be generated from separate PV modules even if the PV array works at the GP. The relationship between the generated power from the PV system and the sum of individual peaks from each module is called mismatch loss (MML). The formula used to determine this relationship is shown in Equation (2). This relation is sometimes called MPPT power efficiency (MPE) [4]. In the case of uniform irradiance and the system working at the MPP, the MML value is 100%:
where N is the total number of PV modules in the PV array.
Another parameter used to evaluate the MPPT technique is called MPPT power efficiency (MPE). This parameter is used to measure the percentage of PV output energy to the maximum energy available during a certain period, as shown in Equation (3) [4]:
where T is the period.
3. MPPT Swarm Optimization Techniques
3.1. MPPT Optimization Technique Evaluation
In the presence of multiple P–V peaks, most of the traditional MPPT techniques are unable to capture the GP and may stick at one of the LPs. This was the primary motivation to search for a smart technique that can capture the GP in every case. SOT like CS, PSO, BA, ABC, etc. have been used in the literature to tackle this shortcoming of traditional MPPT techniques; four main requirements from any optimization technique to be used as an MPPT of PV systems are shown in the following points. These points are ordered from most to least importance, as discussed in this section.
- (1)
- Low failure rate
- (2)
- Short convergence time
- (3)
- Low oscillations at the steady-state conditions
- (4)
- Simple or lower calculations burden
A proposed optimization technique can be evaluated based on these four requirements. The failure rate (FR), sometimes called premature convergence rate [16], is the ratio of the number of attempts which converged at a local peak to the total number of attempts, as shown in Equation (4). This requirement is ranked the first because it has the potential to substantially reduce the amount of energy generated–especially when the PSC persists for a long time. For this reason, the SOT should have a near-zero failure rate as a first requirement:
where NF is the total number of attempts converged to one of the LPs, NT is the total number of attempts.
The second requirement is the short convergence time. This is a very important factor in evaluating the MPPT technique because the optimization technique is working online during the normal operation of the PV system, making convergence time a crucial issue. The convergence time is proportional to the sampling time and the number of times the controllers hit the DC-DC converter with new duty ratios. The convergence time can be determined based on the difference in position between the maximum and minimum values that are lower than a certain value (in this paper, 0.001), as shown in Equation (5). The convergence time can be also determined based on the power value of each searching agent in each iteration, as shown in Equation (6). To avoid the random nature inherent in the SOT techniques, the convergence time should be calculated several times (NT) and the average value of convergence time should be determined:
The third evaluation issue is the oscillations at steady-state conditions, which can be determined as shown in Equation (7). In this equation, the standard deviation of the power after the convergence time has elapsed is measured; it should be lower than the predefined tolerance value to ensure that the system is working out of oscillation in steady-state conditions:
The fourth and final evaluation issue is the complexity of the optimization technique. This calculation should be performed during the online operation of the PV system. Long and complex calculations of the MPPT forces designers to increase the sampling time to offer enough time to the controller to determine the new duty ratio, greatly increasing convergence time. To reduce the convergence time, a very fast hardware controller is required, which increases cost and should be avoided in the design of the MPPT of PV systems.
3.2. MPPT Reinitialization
At steady-state conditions, the searching agents are concentrated at the GP. They are not having the ability to look for other places in the P–V curve, and may not capture the GP if it changes its position. For this reason, a detection technique should be used to detect any change in the shading pattern, represented by an acute change in generated power, and to reinitialize the searching agents of the SOT to search again along the whole area. This detection process can be implemented using the equation shown in Equation (8):
where Pj and Pj−1 are the generated power at iteration j and j-1, respectively, and ε1 is a predefined tolerance used to detect the acute change in generated power. The value of ε1 is used equally to 5% [3] and some other researchers used it like 10% [5].
It is recommended in most of studies in the literature to have random initialization within the searching area. Meanwhile, many studies in the use of SOT have shown that random initialization may prolong the convergence time and increase the failure rate [17]. For this reason, many predefined reinitialization strategies have been reported in the literature. One of these strategies involves initializing the searching agents at the positions of the anticipated peaks, as shown in Equation (9). This technique showed good results, but it sets the number of searching agents equal to the number of peaks, which is not suitable for the present study:
where n is the total number of peaks and k is peak order (k = 1, 2, …. n). The constant kV has a value between 0.76 and 0.82 [2], and is taken equal to 0.8 in this paper.
Another initialization strategy divides the searching area equally between searching agents, as shown in Equation (10) [17]; this is the method that is used in the present study:
where is the initial positions of bats (duty ratio) with order k in the swarm and SS is the swarm-size. As an example, if SS = 4, then the initial bat positions (duty ratios) are (0.2, 0.4, 0.6, 0.8).
3.3. Original Cuckoo Search Optimization MPPT
The CS algorithm is one of the fastest-converging SOT. It was first introduced in 2009 [6]. The algorithm is inspired by the parasitic behavior of the reproduction process of the cuckoo bird. The bird lays its eggs in other birds’ nests, instead of building its own nest. It uses a technique to search for a suitable host nest wherein it flies randomly from one nest to another, searching for the best nest – chosen as the one with the highest chance of eggs being hatched safely. The cuckoos sometimes drop the eggs of the host bird out of the nest to increase the chances of their eggs hatching successfully. Some species of cuckoos can adapt the shape of their eggs to be similar to those of the host bird, in order to decrease the chance of discovery. If the host bird discovers the cuckoo’s trick, it may throw out the cuckoo’s eggs or abandon the nest [6].
The searching behavior of the cuckoos is used in the CS algorithm. Random steps using the characteristics of Lévy flight allow CS a long jump during its search which enhances the global search and may reduce convergence time. The original CS (OCS) algorithm was introduced to solve multi-variable problems with multiple objectives, making it unsuitable for MPPT of PV system due to long convergence time and high oscillations at steady-state conditions. This is solved in the next section with the introduction of the improved CS (ICS) algorithm. The OCS, however, randomly initializes several searching agents with starting values within the boundaries of the searching area and uses the Lévy flight in its movement to update their values. When the OCS generates a new generation, it imposes a step to the previous position as shown in Equation (11):
where i is the generation number (i = , 1,2, ……it), k is the order of searching agent in the swarm (k = 1,2,….ss), ss is the swarm-size, α is the step size (which can be determined based on the problem, though it is recommended in much research that α =1 [6]), and u and v are matrices having uniform distribution – their values can be determined as shown in Equation (12):
where the variance of u and v can be obtained from (13):
The logic of OCS algorithm is shown in the pseudo-code in Figure 4.
3.4. Improved Cuckoo Search MPPT
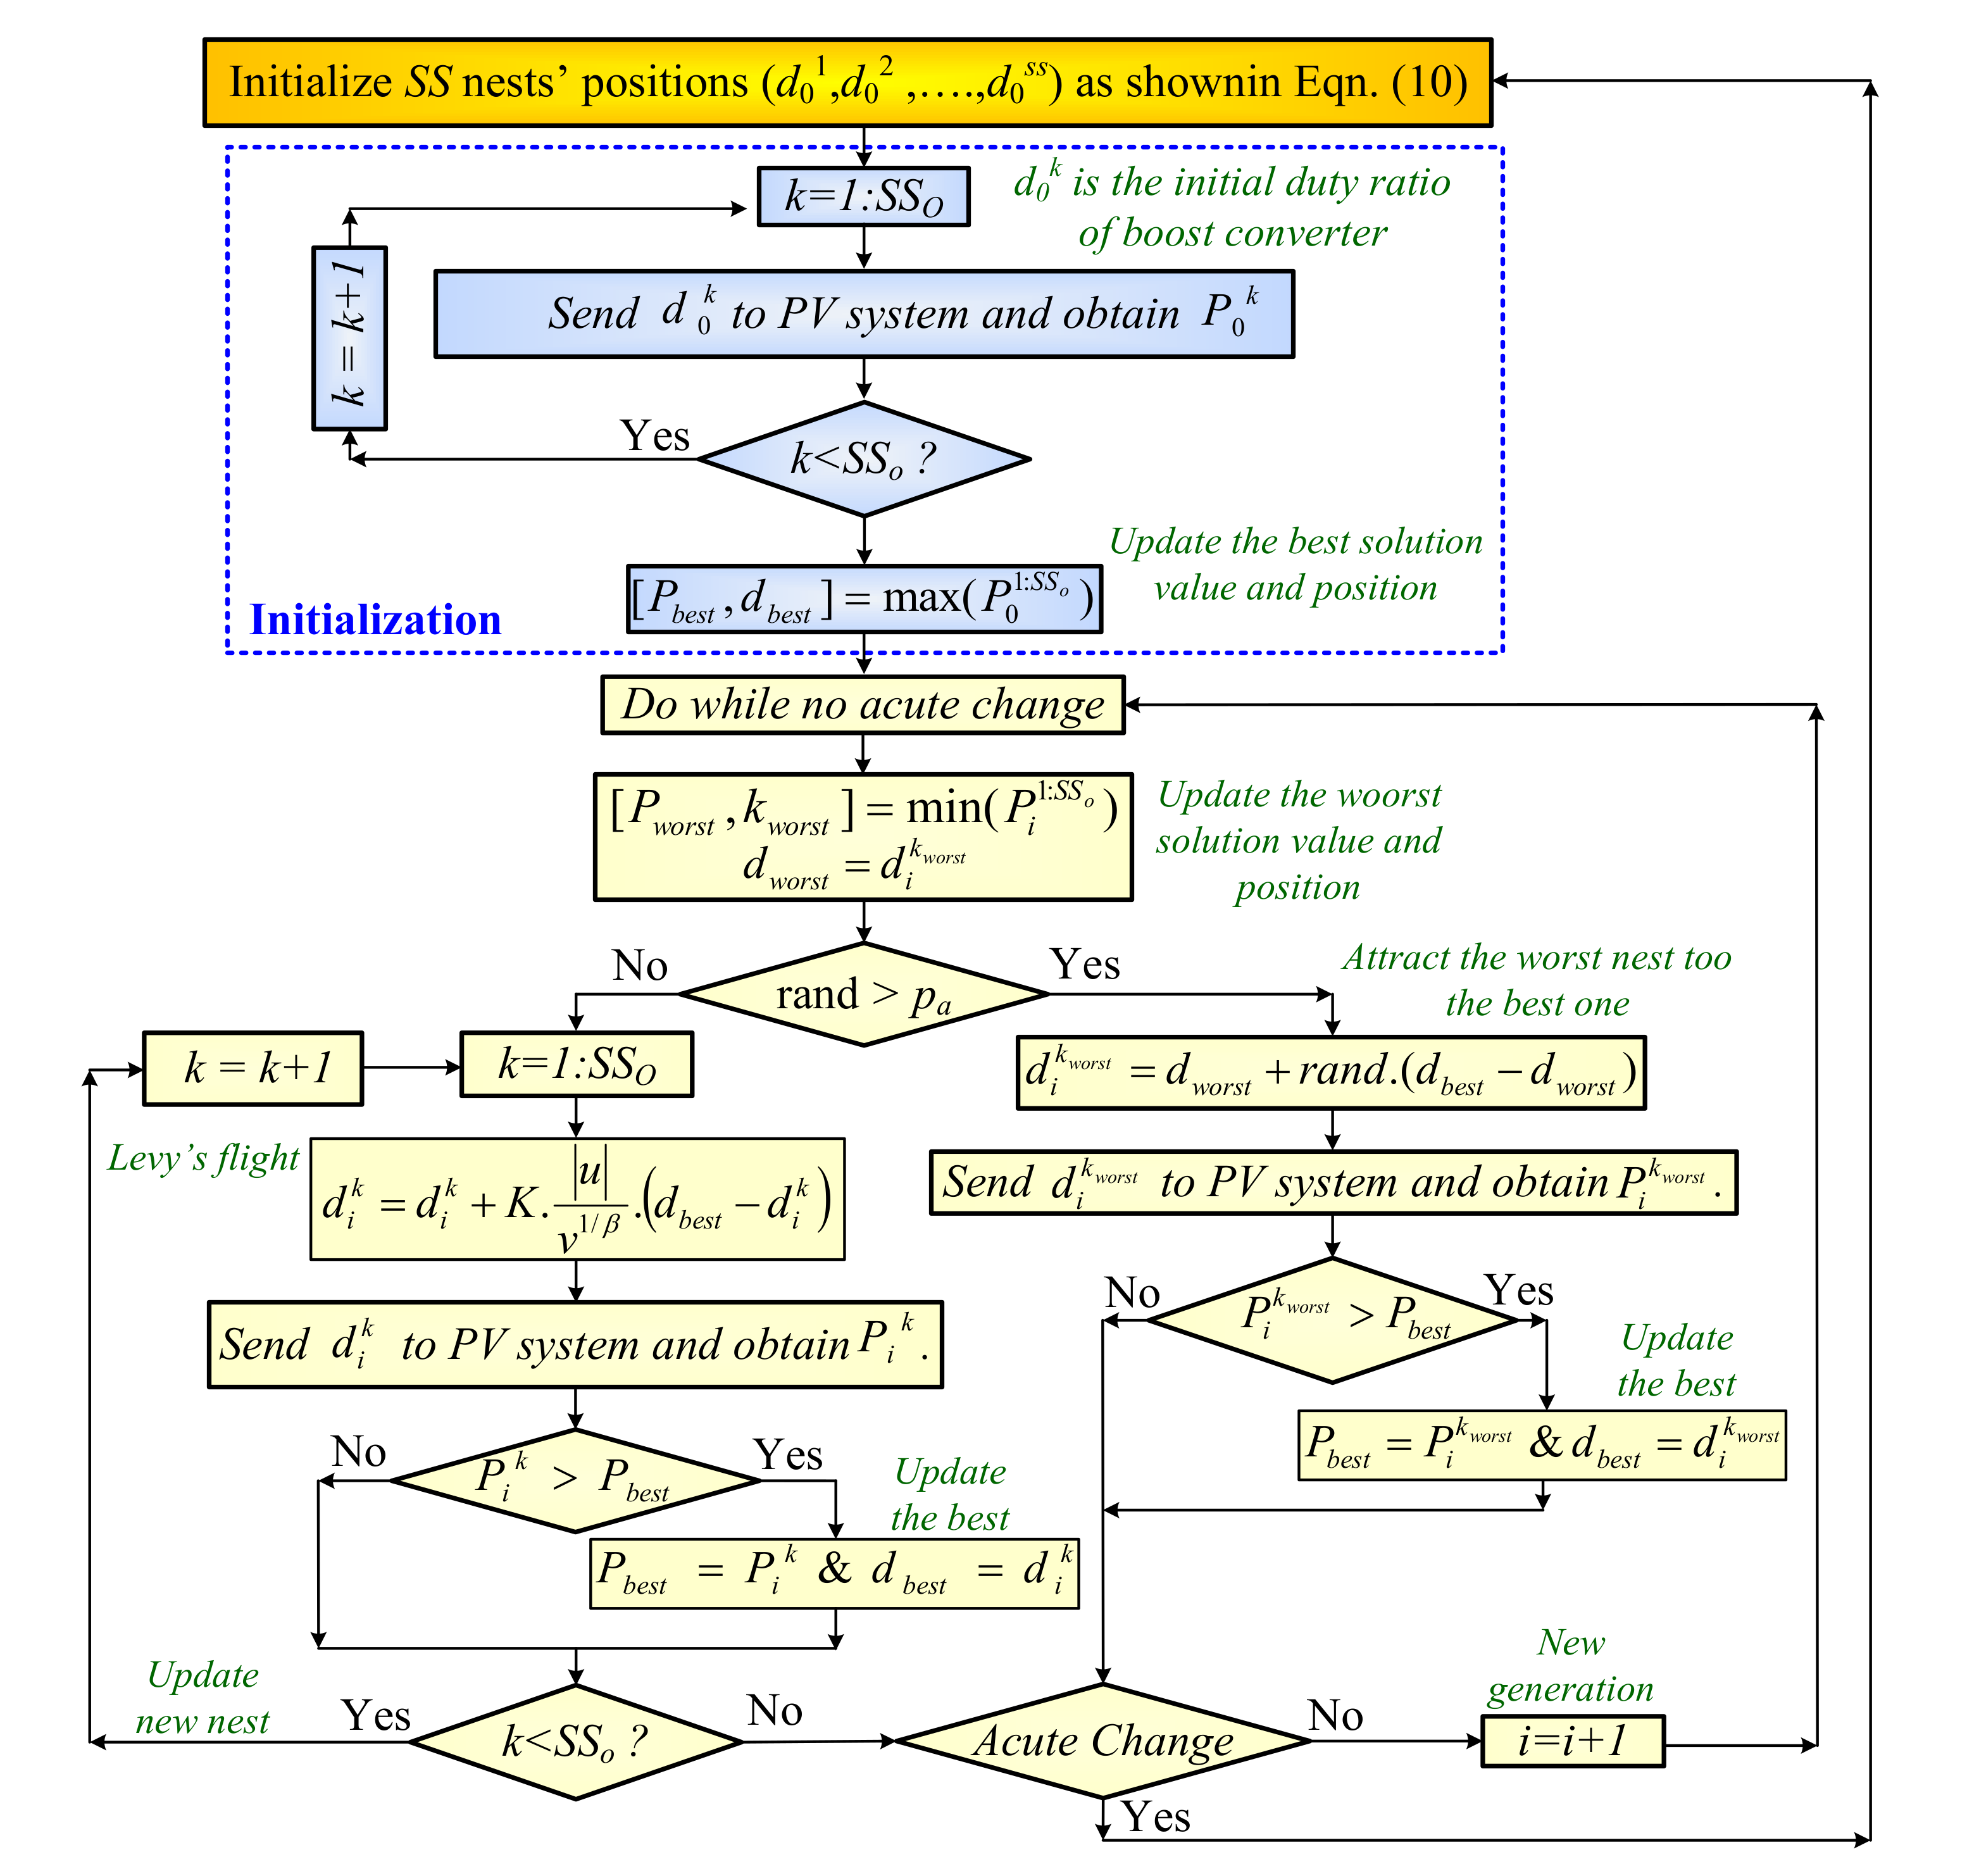
The improved CS (ICS) proposed in this paper improves the tracking mechanism of the OCS to effectively track the GP of PV systems for uniform irradiance and PSC with the lowest failure rate, shortest convergence time, and minimal steady-state oscillations achievable without increasing complexity. As has been shown in Figure 5 and the steps shown below the ICS proposed in this paper attracting the worst particle with a values near to the global best. This improved strategy enabled the program to replace the worst cuckoo with the one near to the best one by adding the difference between the worst cuckoo position and the best cuckoo position after multiplying this value with random to the worst cuckoo position. The results shown in simulation and experimental work sections showed a great reduction in the convergence time and oscillations at steady state which proved the superiority of the ICS compared to the original cuckoo search strategy and other optimization techniques under study. This logic is explained in the following steps (and in Figure 5):
- Step 1: Initialize the particles’ positions from Equation (10) and send it to the PV system to determine the corresponding power , then determine the maximum power Pbest and its corresponding duty ratio, dbest.
- Step 2: Determine the worst particle power, Pworst, its order, kworst, and its corresponding duty ratio, dworst.
- Step 3: Check if rand > pa. If so, go to Step 4; otherwise, go to Step 7.
- Step 4: Attract the worst nest to the best nest using , then check if > dmax, then = dmax; otherwise, if < dmin, then = dmin.
- Step 5: Send the new value of to the PV system to determine the corresponding power , then check if > Pbest, then Pbest = and dbest = .
- Step 6: Check the stopping criteria as shown in Equation (8). If it is valid, go to Step 1; otherwise, go to Step 2.
- Step 7: Add a step to each nest using Lévy flight by using this equation , then check if > dmax, = dmax, otherwise, if < dmin, = dmin
- Step 8: Send the duty ratio to the PV system to determine the corresponding power , then check if > Pbest, then Pbest = and dbest =
- Step 9: Check if k < SS. If so, go to Step 7; otherwise, go to Step 6.
3.5. Bat Algorithm MPPT
The bat algorithm (BA) is inspired by bats’ behavior in searching for their food. The bats emit pulses with different frequencies and amplitudes and receive their echoes to get complete information about their prey in terms of its location and size. When the bats become very near to the prey, they emit pulses with higher frequencies and lower amplitudes for better information about the prey. The bat measures the distance between its current location and the prey’s location by the time elapsed between sending the pulse and receiving its echo. Meanwhile, the distance of the echo pulse gives the bat useful information about the prey’s size. In nature, the bats emit short-duration sound pulses around 10–100 times per second [18]. The bats’ behavior is used to formulate the logic of the mathematical steps shown in the BA to search for the optimal solution in many engineering problems–among them, the MPPT of PV systems. The BA shows a very effective tracking speed with a low failure rate when high swarm-size is used [3,19]. The flowchart showing the MPPT of PV systems using the BA is shown in Figure 6. The frequency emitted by the bat k in iteration i () is random and can be obtained as shown in Equation (14). The bats’ velocity can be obtained from the frequency obtained from Equation (14) and the difference between the previous position and the best position as shown in Equation (15). The new position of bat k at iteration i can be obtained as shown in Equation (16):
where the values of fmin and fmax are the minimum and maximum frequency range, respectively (chose in many studies as between 0 and 2) [3]; β is a random value, β has a value between 0 and 1 and ω is the inertia weight value, which is used to enhance the searching stability of bats [18].
A random walk around this position should be performed to get the new position of the bat. If the rate of pulse emission ri that can be obtained from Equation (17) is less than the random number, then the new position djk should be updated with the new position shown in Equation (18) [3,19]. The value of ri is called the pulse transmission, and can be determined from Equation (17):
where γ is an exponential constant–its value is about 0.9 in many kinds of research [3,19].
where ε is a random number, ε has a value between -1 and 1 [3,19]; ϕ is used to enhance the stability or limitations of the number walk around the best solution; and is the average loudness of the bats, equal to the average of A in the current iteration. The loudness (Ai) of the impulse should start from high-value A0 and should be decreased by α of its previous value, as shown in Equation (19):
3.6. Particle Swarm Optimization MPPT
The PSO is the most frequently used swarm technique in the MPPT of PV systems. The PSO is inspired by the behavior of flocks of fish, birds, swarms, and shoals searching for food; it is used to determine the optimal solutions for multi-dimensional problems. This technique was introduced by Kennedy and Eberhart in 1995 [20]. The operating principle of this technique is to use several particles to search for the optimal solution in the search space of the optimization problem through consecutive movements of particles. In each new iteration, the particles get their movement from their previous experience and from the swarm’s experience, which are called self-experience and social-experience, respectively. The PSO searching performance is done using Equation (20) and Equation (21) [21]:
where ω is the inertia weight; is the personal best solution of particle k, varied between 1 and the value of swarm-size, SS; Gbest is the global best position; rl and rg are random values i has a random value between 0 and 1 and i represents the generation [22].
The values of accelerated parameters cl and cg should be compromised to balance between the self and social searches. The velocity of each particle is added to its previous position to obtain the new position [21]. The flowchart showing the logic of PSO when used as an MPPT of PV systems is shown in Figure 7
3.7. Gray Wolf Optimization MPPT
GWO algorithm is introduced in 2014 [23]. This optimization technique is inspired by the natural behavior of gray wolves in hunting prey. Gray wolves always live in a group having five to 10 members [4]. They have four levels of leadership. The leaders are called alpha (α), and subleaders are called beta (β)), delta (δ), and omega (ω), respective to their position in the leadership pyramid [4], in which the dominance of wolves increases from top to bottom [23]. The mathematical representation of the wolves’ hunting techniques are shown as follows [23]:
where i is the current generation, d is a vector representing the position of the gray wolf, and dp is a vector representing the position of the prey. The two coefficient vectors A and C are used to maintain the balance between exploration and exploitation, and their values can be obtained as shown in Equations (24) and (25):
where the coefficient a is decreasing linearly from 2 to 0 and r1, r2 are random vectors with value between 1 and 0.
The gray wolves encircle the prey. Group members should obey the orders of the leader (Alpha wolf) as their highest priority, then those of the beta wolves, then delta, with decreasing priority. This leadership mechanism of the gray wolves can be represented mathematically as shown in the following equations [4,23]:
The coefficient when the wolves tend to exploit (converge to prey) and when the wolves tend to explore. The flowchart explaining the GWO when used as an MPPT of a PV system is shown in Figure 8.
3.8. Artificial Bee Colony Algorithm (ABC) MPPT
The ABC algorithm was proposed in 2005 by Karaboga [24] and is inspired by the foraging behavior of honey bees. Artificial bees are divided into three types: worker bees, unemployed or onlooker bees, and scout bees. The worker bees’ function is to search for the food and determine its location; they share this information with other bees in the colony. The unemployed or onlooker bees watch the employed bees and help to find the food’s location. The scout bees’ function is to search randomly for a new source of food; they communicate and coordinate with each other to obtain the optimal solution in a short time. In the algorithm, the location of the food source and the quantity of nectar denote a solution of the optimization problem and the fitness value of the related solution, respectively. The algorithm starts with a parameter initialization and generates an arbitrarily initial population (d) of SS solutions, which is the population size. The initialization of bees’ positions can be selected randomly or as predefined values obtained from Equation (10). The onlooker bees move closer to the position of the employed bees where the nectar quantity is the highest [25]. This movement is given as shown in Equation (29):
where SS is the number of bees, r is a random number between -1 and 1, and dmax and dmin represent the food source positions with highest and lowest nectar amounts, respectively.
The onlooker bees select the food source of the employed bees based on probability of connection to the food source, as shown in Equation (30) [25]:
where P(dk) is the fitness function of dk.
The new value of power is chosen as the greatest of the previous and newly obtained values. The logic shown for ABC has been used for MPPT of a PV system in [25], where it was compared to other SOT and it is found that the ABC has the best performance. The flowchart of the ABC algorithm is shown in Figure 9.
4. Simulation Results
The proposed PV system shown in Figure 1 is used in the following simulation studies. The simulation model consists of a series of 10 PV modules, able to generate P–V curves with up to 10 peaks; the number of peaks is controlled by the number of different irradiances fallen on these modules. The evaluation of the optimization technique is performed on random values of irradiances, leading to random shapes and peak positions, in order to prevent the biasing of the results to a certain shape of P-d curve. Moreover, the simulation is performed 100 times (NT = 100) to counteract the random nature of these optimization techniques. The sampling time used in the simulation and experimental studies is 0.01 s.
The circuit parameters used in the simulation are as follows. All 10 PV modules are (Advanced Renewable Energy Module AREi-210W-M6-G units [26,27]) rated for 210 W, with 36.3 V open-circuit voltage and 7.74 A short circuit current. The boost converter parameters are L = 0.5 mH and C = 200 μF. A single-phase H-bridge PWM converter is used to transfer the power from DC-link to the electric utility.
To assess the performance of the proposed ICS optimization technique, we compared it against five other SOT. The parameters used in these optimization techniques, shown in Table 1, were chosen from previous studies as having the best performance when used in the MPPT of PV system applications.
The first simulation study is the evaluation of each SOT with different peak numbers and different values of swarm-size. The best technique is the one that does not need to change the swarm-size for different values of peaks. The second simulation study shows the performance of these techniques over time for different shading patterns. These two studies are detailed in the following.
The SOT techniques were evaluated under different operating conditions as shown in Table 2. The simulation results in this table were collected using six SOTs: OCS, ICS, BA, PSO, GWO, and ABC. These optimization techniques were studied under conditions of uniform irradiance (one peak), five peaks, and 10 peaks, with swarm-size values of 3, 4, 6, 8, and 10. The results shown in this table are the convergence time (tc) and failure rate (FR). The failure rate is calculated based on Equation (4) and the convergence time is calculated based on Equations (5) and (6) and get the average value of the 100 runs.
In the case of uniform irradiance (one peak), Table 2 shows that all SOT captured the GP with zero FR. The convergence time of OCS is the longest, due to the random nature of the Lévy flight inherent in this technique; it took approximately 3.51, 5.17, 8.42, 14.36, and 20.5 s to capture the GP with 3, 4, 6, 8, and 10 searching agents, respectively, making it the worst SOT to be used as an MPPT of a PV system. In contrast, the proposed ICS technique demonstrated its supremacy by capturing the GP in 0.17, 0.30, 0.45, 0.52, and 0.72 s with 3, 4, 6, 8, and 10 searching agents, respectively–a reduction of more than 95% over OCS, and less than half the time taken by all other SOT.
In the case of five peaks and three searching agents, OCS captured the GP after 3.91 s with a 15% failure rate when using three searching agents. ICS spent only 0.18 s, but with a 26% failure rate; the remaining SOT took more than 0.42 s with a 20% to 49% failure rate. It is worth noting that the high failure rate associated with the BA is due to its fast convergence characteristics and high failure rate with a lower number of agents. With four searching agents, ICS captured the GP very fast, with 0% FR; all other SOT showed both a longer convergence time and a higher failure rate (except for OCS, which also showed 0% FR). With six searching agents, all SOT had 0% FR. ICS captured the GP in 0.47 s, compared to 10.1 s for OCS; all other SOT took longer than 1.29 s. Increasing the number of searching agents to eight and 10 maintained 0% FR for all SOT, but increased their convergence time; still, ICS was the fastest. It is therefore recommended to use at least four searching agents with ICS and six searching agents with other SOT when the P-d curve has five peaks or less. Moreover, the convergence time for ICS was lower than 0.74 s for swarm-size up to 10.
The case of 10 peaks in the P–V curve rarely occurs in the normal operation of PV systems. With fewer than six searching agents, FR was greater than 0% for all SOT used–with the shortest convergence time associated with ICS. With six searching agents, ICS was the only technique to capture the GP with a 0% FR, as well as the shortest conversion time. With eight, OCS, ICS, and GWO captured the GP at 0% FR, with the shortest convergence time again being associated with ICS. With 10 agents, all SOT attained 0% FR; ICS captured the GP in 0.75 s, compared with 45.1 s for OCS and more than 2.26 s for the rest of the SOT. This, again, demonstrates the superiority of the ICS to the other SOT used in this study.
Table 2 additionally shows the average results over all tested numbers of peaks. It can be seen that the average failure rates of all SOT for three and four searching agents are greater than 0%. With six searching agents, ICS becomes the first technique to achieve 0% FR, with other SOT ranging from 2% to 9%. Moreover, the average convergence time associated with ICS is considerably shorter than that of all other SOT for all numbers of searching agents. This proves the superiority of the ICS optimization technique, when used as an MPPT of PV systems, compared to the other SOT techniques used in this study.
Based on the results shown in Table 2 and the above discussion of these results, ICS has the shortest conversion time and lowest failure rate. Moreover, it is better to use four searching agents if the number of peaks in the P–V curve is sure not to exceed five due to the configuration of the array; otherwise, it is recommended to use six searching agents. The longest convergence time recorded for ICS was less than 0.75 s, which is substantially lower than the other SOT. It is worth noting that the convergence time and failure rate of ICS and all other SOT except OCS are almost constant for all numbers of peaks; for example, with six searching agents, the convergence times are 0.45, 0.47, and 0.48 s for one, five, and 10 peaks, respectively. This means that there is no need to change the number of agents with the number of peaks in the P–V curve of the PV array. This feature is not shown by the other SOT; with six searching agents, the convergence time for OCS ranged from 8.42 s to 14.5 s, for one peak and 10 peaks, respectively. Similarly, for the BA, the convergence time with six searching agents ranged 1.13 s to 1.42 s.
Figure 10 shows the variation of failure rate and convergence time with swarm-size and number of peaks for all analyzed SOT; the superiority of ICS is again apparent in this figure.
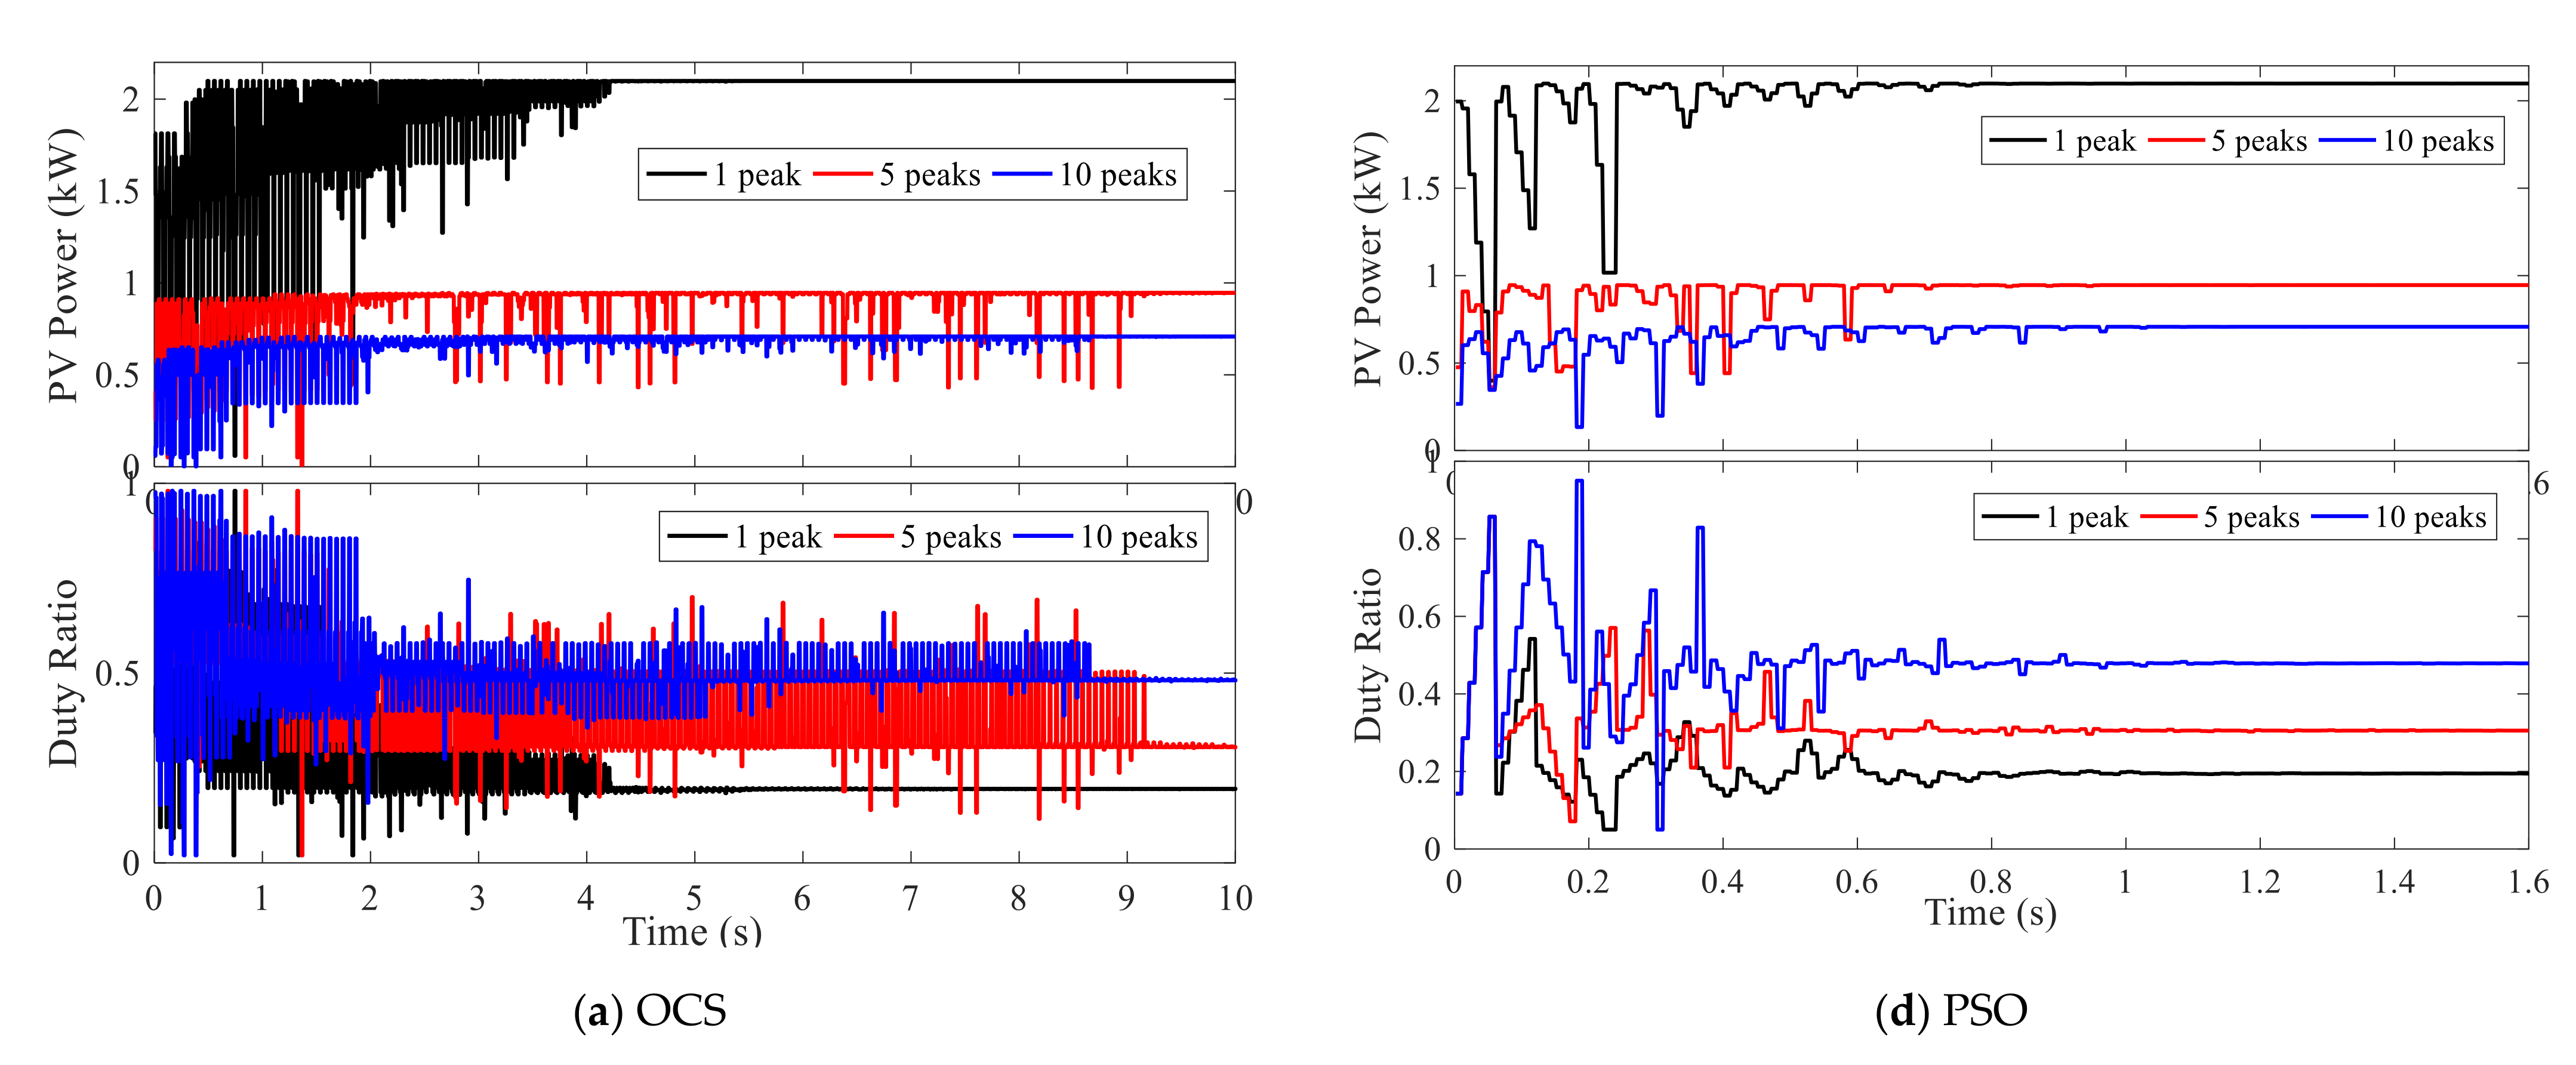
The time variation of generated power and duty ratio of boost converter for all SOT at different numbers of peaks is shown in Figure 11. The number of searching agents used in this study is six. The results shown in this figure represent one run of the MPPT, not the average of 100 runs as shown in Table 2 and Figure 10. It is clear from this figure that all SOT captured the GP with a 0% FR. OCS was the slowest in capturing the GP and ICS is the fastest for all numbers of peaks. The outstanding results of ICS compared to the other SOTs in terms of failure rate, convergence time, and steady-state oscillations proves the superiority of ICS when used for MPPT of PV energy systems.
To check the stability at continuous changes in conditions as in real operation of the optimization techniques understudy, a gradually change radiation is introduced as shown in Figure 12. The simulation has been carried out for 10 s continuous change condition. In the OCS, it takes more then 9 s to capture the MPP which shows the poor performance of the OCS compared to the other optimization technique, but it is noteworthy that at t = 5.8 s the optimal duty ratio is increased from 0.4 to 0.415 and the OCS was capable to capture this new MPP after more than 9 s. Regarding to the improved CS (ICS) technique, it captured the MPP after 0.4 s which is the fastest convergence technique. Besides that, the ICS captured the new MPP when it changed at time t = 5.8 s, meanwhile the other optimization techniques could not capture the change in duty ratio at 5.8 s which shows the superiority of the ICS compared to the other optimization techniques under study. The main reason of success of the ICS when it changes slowly at t = 5.8 is due to the random nature of the Levy flight which is not available for other optimization techniques. These results proved the superiority of the ICS in case of sudden change or gradual change in radiation compared to the other optimization techniques under study.
5. Experimental Results
The experimental setup prototype is shown in Figure 13. It consists of a series of five PV modules matching the detailed parameters shown in the simulation section. Different sizes of sheets were used to cover parts of the PV modules to achieve different numbers of peaks. The PV array was connected to a boost converter with L = 0.5 mH and C = 200 μF. The switch used in the boost converter was an STB18NF30 MOSFET [32], and had an 18 A drain current and 330 V drain to source voltage. The switch driver used with this switch was an MC34152PG [33]. The current sensor used in this hardware circuit was LTS 25-NP, and the voltage sensor was LV 25-P [34]. The switching frequency used was 10 kHz. The control of the boost converter and the MPPT were implemented in Simulink and MATLAB, and the logic interfaced with the hardware circuit by the dSPACE (DS1104 hardware card) and the connector panel of the DS1104 as shown in Figure 13. The DC-link was connected to a single-phase inverter to interface with the electric utility.
The experiments introduced in this study were done using five peaks in the PV array using sheets with different sizes; after steady-state conditions were achieved, the sheets were removed to allow reinitialization of the MPPT techniques for a different number of peaks.
Figure 14 shows the performance of the PV system with OCS MPPT under the five peaks operating conditions for the first 18 s, followed by its performance in the case of a single peak (uniform irradiance) after removing the sheets from the top of the modules. It is clear from this figure that the PV system spent about 8 s to capture the GP in the case of five peaks. Once the cover sheets were removed from the top of the modules, the control system detected the change in the shading pattern due to the acute change in power as indicated in Equation (8) and forced the searching agents to spread again and search for the new position of the GP. It is clear from these results that OCS captured the GP after a very long convergence time with high oscillations around the GP, demonstrating the unsuitability of OCS for tracking the MPP of a partially shaded PV system.
The proposed ICS technique was used to track the MPP with the same conditions used in the previous technique, where the different size sheets are placed for the first 1 s and then removed for another 1 s. It can be seen that ICS captured the GP in less than 0.5 s, and that after reinitializing when the transparent sheets were removed it again captured the GP within 0.5 s.
The other MPPT used in the simulation section were also used in the experimental work; they are shown in Figure 14c–f. The convergence times associated with these techniques ranged from 0.75 s to 2.5 s, proving the superiority of ICS when used as an MPPT of PV systems.
The convergence time, failure rate, and the oscillations at the output power can highly affects the the maximum power efficiency (MPE) as defined in Equation (3). To compare between these different techniques based on MPE, the experimental work is performed for 15 s for five peaks and one peak, respectively. The results obtained from this study is shown in Table 3. It is clear from this table that the ICS is having the highest MPE value (99.97%) compared to 83.17, 99.33, 99.18, 98.93, and 97.54 for the OCS, BA, PSO, GWO, and ABC, respectively.
6. Conclusions
Swarm optimization techniques have been used as an MPPT technique of partially shaded PV systems to avoid the limitations of traditional techniques. The main requirements of MPPT are a low failure rate, short convergence time, low oscillations at the steady-state condition, and simple calculations to reduce the cost of the controller. All these requirements are found in the improved cuckoo search (ICS) method proposed in this paper. ICS displays a zero failure rate, convergence time lower than 0.75 s for any partial shading conditions, and zero oscillations around the steady-state conditions. Moreover, the proposed technique has very simple logic and low calculation requirements. It is recommended from the simulation and experimental results to have 4 searching agents with the ICS in case of the number of peaks in the P–V curve is exceeding 5, or 6 agents. The simulation results shown in this paper prove the superiority of ICS in all performance evaluation parameters over other swarm optimization techniques.
Funding
This research was funded by College of Engineering Research Center and Deanship of Scientific Research at King Saud University in Riyadh, Saudi Arabia.
Institutional Review Board Statement
Not applicable.
Informed Consent Statement
Not applicable.
Data Availability Statement
Not applicable.
Acknowledgments
The author thanks the College of Engineering Research Center and Deanship of Scientific Research at King Saud University in Riyadh, Saudi Arabia, for the financial support to carry out the research work reported in this paper.
Conflicts of Interest
The author declares no conflict of interest.
References
- Kermadi, M.; Salam, Z.; Eltamaly, A.M.; Ahmed, J.; Mekhilef, S.; Larbes, C.; Berkouk, M. Recent Developments of MPPT Techniques for PV Systems under Partial Shading Conditions: A Critical Review and Performance Evaluation; IET: London, UK, 2020. [Google Scholar]
- Eltamaly, A.M.; Al-Saud, M.S.; Abokhalil, A.G.; Farh, H.M. Photovoltaic maximum power point tracking under dynamic partial shading changes by novel adaptive particle swarm optimization strategy. Trans. Inst. Meas. Control. 2019, 42, 104–115. [Google Scholar] [CrossRef]
- Eltamaly, A.M.; Al-Saud, M.; Abokhalil, A.G. A novel scanning bat algorithm strategy for maximum power point tracker of partially shaded photovoltaic energy systems. Ain Shams Eng. J. 2020, 11, 1093–1103. [Google Scholar] [CrossRef]
- Eltamaly, A.M.; Farh, H.M.H. Dynamic global maximum power point tracking of the PV systems under variant partial shading using hybrid GWO-FLC. Sol. Energy 2019, 177, 306–316. [Google Scholar] [CrossRef]
- Ahmed, J.; Salam, Z. A Maximum Power Point Tracking (MPPT) for PV system using Cuckoo Search with partial shading capability. Appl. Energy 2014, 119, 118–130. [Google Scholar] [CrossRef]
- Yang, X.S.; Deb, S. Cuckoo Search via Lévy flights. In Proceedings of the 2009 World Congress on Nature & Biologically Inspired Computing (NaBIC), Coimbatore, India, 9–11 December 2009; pp. 210–214. [Google Scholar]
- Ahmed, J.; Salam, Z. A soft computing MPPT for PV system based on Cuckoo Search algorithm. In Proceedings of the 4th International Conference on Power Engineering, Energy and Electrical Drives, Istanbul, Turkey, 13–17 May 2013; pp. 558–562. [Google Scholar]
- Ling, C.; Honghua, W.; Wei, H. Simulation study of photovoltaic power generation in maximum power point track-ing based on CSA-FPI algorithm. Electr. Meas. Instrum. 2015, 8, 39–44. [Google Scholar]
- Shi, J.-Y.; Xue, F.; Qin, Z.-J.; Zhang, W.; Ling, L.-T.; Yang, T. Improved Global Maximum Power Point Tracking for Photovoltaic System via Cuckoo Search under Partial Shaded Conditions. J. Power Electron. 2016, 16, 287–296. [Google Scholar] [CrossRef] [Green Version]
- Peng, B.-R.; Ho, K.-C.; Liu, Y.-H. A Novel and Fast MPPT Method Suitable for Both Fast Changing and Partially Shaded Conditions. IEEE Trans. Ind. Electron. 2017, 65, 3240–3251. [Google Scholar] [CrossRef]
- Enany, M.A. Cuckoo search–based maximum power point tracking controller for PV water pumping system. J. Renew. Sustain. Energy 2017, 9, 063501. [Google Scholar] [CrossRef]
- Kalaam, R.N.; Muyeen, S.; Al-Durra, A.; Hasanien, H.M.; Al-Wahedi, K. Optimisation of controller parameters for grid-tied photovoltaic system at faulty network using artificial neural network-based cuckoo search algorithm. IET Renew. Power Gener. 2017, 11, 1517–1526. [Google Scholar] [CrossRef]
- Nugraha, D.A.; Lian, K.-L. A novel MPPT method based on cuckoo search algorithm and golden section search algorithm for partially shaded PV system. Can. J. Electr. Comput. Eng. 2019, 42, 173–182. [Google Scholar] [CrossRef]
- Eltamaly, A.M. Performance of smart maximum power point tracker under partial shading conditions of PV systems. In Proceedings of the 2015 IEEE International Conference on Smart Energy Grid Engineering (SEGE), Oshawa, ON, Canada, 17–19 August 2015; pp. 1–8. [Google Scholar]
- Agarwal, N.; Agarwal, A. Mismatch losses in solar photovoltaic array and reduction techniques. MIT Int. J. Electr. Instrum. Eng. 2014, 4, 16–19. [Google Scholar]
- Eltamaly, A.; Farh, H.M.H.; Al-Saud, M.S. Impact of PSO Reinitialization on the Accuracy of Dynamic Global Maximum Power Detection of Variant Partially Shaded PV Systems. Sustainability 2019, 11, 2091. [Google Scholar] [CrossRef] [Green Version]
- Eltamaly, A.M.; Farh, M.H.; Al-Saud, M.S. Grade point average assessment for metaheuristic GMPP techniques of partial shaded PV systems. IET Renew. Power Generat. 2019, 13, 1215–1231. [Google Scholar] [CrossRef]
- Yang, X.-S. A New Metaheuristic Bat-Inspired Algorithm. In Nature Inspired Cooperative Strategies for Optimization (NICSO 2010); Springer: Berlin/Heidelberg, Germany, 2010; pp. 65–74. [Google Scholar]
- Eltamaly, A.M.; Al-Saud, M.S.; Abo-Khalil, A.G. A Novel Bat Algorithm Strategy for Maximum Power Point Tracker of Photovoltaic Energy Systems under Dynamic Partial Shading. IEEE Access 2020, 8, 10048–10060. [Google Scholar] [CrossRef]
- Kennedy, J.; Eberhart, R. Particle swarm optimization. In Proceedings of the ICNN’95-International Conference on Neural Networks, Perth, WA, Australia, 27 November–1 December 1995; Volume 4, pp. 1942–1948. [Google Scholar] [CrossRef]
- Eltamaly, A.M.; Al-Saud, M.S.; Abo-Khalil, A.G. Performance Improvement of PV Systems’ Maximum Power Point Tracker Based on a Scanning PSO Particle Strategy. Sustain. 2020, 12, 1185. [Google Scholar] [CrossRef] [Green Version]
- Farh, H.M.; Eltamaly, A.M.; Ibrahim, A.B.; Othman, M.F.; Al-Saud, M.S. Dynamic global power extraction from partially shaded photovoltaic using deep recurrent neural network and improved PSO tech-niques. Int. Trans. Electr. Energy Syst. 2019, 29, e12061. [Google Scholar] [CrossRef]
- Mirjalili, S.; Mirjalili, S.M.; Lewis, A. Grey wolf optimizer. Adv. Eng. Softw. 2014, 69, 46–61. [Google Scholar] [CrossRef] [Green Version]
- Karaboga, D. An Idea Based on Honey Bee Swarm for Numerical Optimization; Technical Report-TR06; Erciyes University: Talas, Turkey, 2005. [Google Scholar]
- Sundareswaran, K.; Sankar, P.; Nayak, P.S.R.; Simon, S.P.; Palani, S. Enhanced Energy Output From a PV System Under Partial Shaded Conditions Through Artificial Bee Colony. IEEE Trans. Sustain. Energy 2015, 6, 198–209. [Google Scholar] [CrossRef]
- Solar Panel Talk. Available online: https://www.solarpaneltalk.com/forum/solar/the-pros-and-cons-of-solar-energy/861-modules-preferred-in-california (accessed on 1 November 2020).
- Eltamaly, A.M.; Farh, H.M.; Abokhalil, A.G. A novel PSO strategy for improving dynamic change partial shading photovoltaic maximum power point tracker. Energy Sources A 2020, 1–15. [Google Scholar] [CrossRef]
- Chaudhary, R.; Banati, H. Swarm bat algorithm with improved search (SBAIS). Soft Comput. 2018, 23, 11461–11491. [Google Scholar] [CrossRef]
- Eltamaly, A.M. A Novel Strategy for Optimal PSO Control Parameters Determination for PV Energy Systems. Sustainability 2021, 13, 1008. [Google Scholar] [CrossRef]
- Mohanty, S.; Subudhi, B.; Ray, P.K. A New MPPT Design Using Grey Wolf Optimization Technique for Photovoltaic System Under Partial Shading Conditions. IEEE Trans. Sustain. Energy 2016, 7, 181–188. [Google Scholar] [CrossRef]
- Pilakkat, D.; Kanthalakshmi, S. An improved P&O algorithm integrated with artificial bee colony for photovoltaic systems under partial shading conditions. Sol. Energy 2019, 178, 37–47. [Google Scholar] [CrossRef]
- MOSFET Switch. Available online: https://www.st.com/content/st_com/en/products/power-transistors/power-mosfets/stpower-n-channel-mosfets-gt-30-v-to-350-v/stb18nf30.html (accessed on 1 November 2020).
- Switch Driver. Available online: https://www.digikey.com/product-detail/en/ON+Semiconductor/MC34152PG/MC34152PGOS-ND/919083 (accessed on 1 November 2020).
- Eltamaly, A.; Al-Saud, M.; Abokhalil, A.G.; Farh, H.M. Simulation and experimental validation of fast adaptive particle swarm optimization strategy for photovoltaic global peak tracker under dynamic partial shading. Renew. Sustain. Energy Rev. 2020, 124, 109719. [Google Scholar] [CrossRef]
Figure 1.
The PV system with MPPT is connected with the utility grid.

Figure 2.
The I-V and P–V characteristics of 5 PV modules in series.

Figure 3.
The I-d and P-d characteristics of 5 PV modules in series when boost converter is used.

Figure 4.
The pseudo code of classical cuckoo search (CCS) algorithm [6].
Figure 4.
The pseudo code of classical cuckoo search (CCS) algorithm [6].

Figure 5.
Improved Cuckoo search algorithm in MPPT of PV systems.

Figure 6.
The flowchart of Bat Algorithm in MPPT of PV systems.

Figure 7.
Flow chart of MPPT of PV system using the PSO.

Figure 8.
Flowchart of GWO based on MPPT of PV systems.

Figure 9.
The flowchart of the artificial bee colony algorithm.

Figure 10.
The variation of failure rate and convergence time along with swarm-size for a different number of peaks of all SOTs under study.
Figure 10.
The variation of failure rate and convergence time along with swarm-size for a different number of peaks of all SOTs under study.


Figure 11.
The time variation of generated power and duty ratio of boost converter for all SOTs at a different number of peaks.
Figure 11.
The time variation of generated power and duty ratio of boost converter for all SOTs at a different number of peaks.


Figure 12.
The performance of optimization techniques under study with continuous change of radiations.
Figure 12.
The performance of optimization techniques under study with continuous change of radiations.

Figure 13.
The picture of the experimental setup.

Figure 14.
The experimental results showing the time variation of generated power and duty ratio of boost converter for all SOTs at 1 peak and 5 peaks, respectively.
Figure 14.
The experimental results showing the time variation of generated power and duty ratio of boost converter for all SOTs at 1 peak and 5 peaks, respectively.


Table 1.
The Control Parameters of the Optimization Techniques Used in This Study.
| Technique | Initialization | Parameters |
|---|---|---|
| OCS [5] | Random | pa = 0.25, β = 1.5, α = 0.8 |
| ICS | Equation (10) | pa = 0.05, β = 1.5, α = 0.1 |
| BA [28] | Equation (10) | fmin = 0, fmax = 1, ω = 0.5, A0 = 0.85, r0 = 0.85, α = 0.75, γ = 0.6 |
| PSO [29] | Equation (10) | ω = 0.42, cl = 1.55, cg = 1.55 |
| GWO [30] | Equation (10) | a from 2 to 0 and r1, r2 = random [0, 1] |
| ABC [31] | Equation (10) | 50% employed bees and 50% onlooker bees |
Table 2.
Simulation results for all SOT under review with varying swarm-size and number of peaks.
| Strategy | Swarm-Size | One Peak | 5 Peaks | 10 Peaks | Average | ||||
|---|---|---|---|---|---|---|---|---|---|
| tc | FR | tc | FR | tc | FR | tc | FR | ||
| OCS | 3 | 3.51 | 0 | 3.91 | 15 | 5.14 | 29 | 4.19 | 14.7 |
| ICS | 0.17 | 0 | 0.18 | 26 | 0.19 | 28.2 | 0.18 | 18.1 | |
| BA | 0.33 | 0 | 0.42 | 49 | 0.53 | 53 | 0.43 | 34.0 | |
| PSO | 0.51 | 0 | 0.51 | 20 | 0.57 | 23 | 0.53 | 14.3 | |
| GWO | 0.42 | 0 | 0.72 | 21 | 0.83 | 26 | 0.66 | 15.7 | |
| ABC | 0.58 | 0 | 0.96 | 29 | 1.12 | 43 | 0.89 | 24.0 | |
| OCS | 4 | 5.17 | 0 | 6.75 | 0 | 7.38 | 13 | 6.43 | 4.3 |
| ICS | 0.30 | 0 | 0.28 | 0 | 0.29 | 15 | 0.29 | 5.0 | |
| BA | 0.71 | 0 | 0.78 | 13 | 0.89 | 35 | 0.79 | 16.0 | |
| PSO | 0.77 | 0 | 0.81 | 6 | 0.82 | 12 | 0.80 | 6.0 | |
| GWO | 0.81 | 0 | 0.89 | 5 | 1.07 | 15 | 0.92 | 6.7 | |
| ABC | 0.94 | 0 | 1.18 | 7 | 1.21 | 20 | 1.11 | 9.0 | |
| OCS | 6 | 8.42 | 0 | 10.1 | 0 | 14.5 | 9 | 11.1 | 3.0 |
| ICS | 0.45 | 0 | 0.47 | 0 | 0.48 | 0 | 0.47 | 0.0 | |
| BA | 1.13 | 0 | 1.29 | 0 | 1.42 | 21 | 1.28 | 7.0 | |
| PSO | 1.25 | 0 | 1.31 | 0 | 1.43 | 6 | 1.33 | 2.0 | |
| GWO | 1.31 | 0 | 1.48 | 0 | 1.52 | 9 | 1.44 | 3.0 | |
| ABC | 1.45 | 0 | 1.54 | 0 | 1.64 | 10 | 1.54 | 3.3 | |
| OCS | 8 | 14.36 | 0 | 25.7 | 0 | 37.2 | 0 | 25.7 | 0.0 |
| ICS | 0.52 | 0 | 0.54 | 0 | 0.55 | 0 | 0.54 | 0.0 | |
| BA | 1.63 | 0 | 1.73 | 0 | 1.82 | 7 | 1.73 | 2.3 | |
| PSO | 1.72 | 0 | 1.81 | 0 | 1.91 | 3 | 1.81 | 1.0 | |
| GWO | 1.78 | 1.82 | 0 | 1.95 | 0 | 1.85 | 0.0 | ||
| ABC | 1.98 | 0 | 2.03 | 0 | 2.14 | 4 | 2.05 | 1.3 | |
| OCS | 10 | 20.5 | 0 | 34.1 | 0 | 39.8 | 0 | 31.4 | 0.0 |
| ICS | 0.72 | 0 | 0.74 | 0 | 0.75 | 0 | 0.74 | 0.0 | |
| BA | 2.01 | 0 | 2.2 | 0 | 2.26 | 0 | 2.16 | 0.0 | |
| PSO | 2.13 | 0 | 2.25 | 0 | 2.27 | 0 | 2.22 | 0.0 | |
| GWO | 2.21 | 0 | 2.27 | 0 | 2.35 | 0 | 2.28 | 0.0 | |
| ABC | 2.33 | 0 | 2.41 | 0 | 2.49 | 0 | 2.41 | 0.0 | |
Table 3.
The maximum power efficiency for different optimization techniques for 30 s period.
| MPPT Technique | MPE % |
|---|---|
| OCS | 83.17% |
| ICS | 99.97 |
| BA | 99.33 |
| PSO | 99.18 |
| GWO | 98.93 |
| ABC | 97.54 |
Publisher’s Note: MDPI stays neutral with regard to jurisdictional claims in published maps and institutional affiliations. |
© 2021 by the author. Licensee MDPI, Basel, Switzerland. This article is an open access article distributed under the terms and conditions of the Creative Commons Attribution (CC BY) license (http://creativecommons.org/licenses/by/4.0/).
Share and Cite
MDPI and ACS Style
Eltamaly, A.M. An Improved Cuckoo Search Algorithm for Maximum Power Point Tracking of Photovoltaic Systems under Partial Shading Conditions. Energies 2021, 14, 953. https://doi.org/10.3390/en14040953
AMA Style
Eltamaly AM. An Improved Cuckoo Search Algorithm for Maximum Power Point Tracking of Photovoltaic Systems under Partial Shading Conditions. Energies. 2021; 14(4):953. https://doi.org/10.3390/en14040953
Chicago/Turabian StyleEltamaly, Ali M. 2021. "An Improved Cuckoo Search Algorithm for Maximum Power Point Tracking of Photovoltaic Systems under Partial Shading Conditions" Energies 14, no. 4: 953. https://doi.org/10.3390/en14040953
Note that from the first issue of 2016, this journal uses article numbers instead of page numbers. See further details here.