Article

The Development of Strategies to Reduce Exhaust Emissions from Passenger Cars in Rzeszow City—Poland. A Preliminary Assessment of the Results Produced by the Increase of E-Fleet

by
Maksymilian Mądziel
1,*,
Tiziana Campisi
2,*,
Artur Jaworski
1 and
Giovanni Tesoriere
2
1
Faculty of Mechanical Engineering and Aeronautics, Rzeszow University of Technology, 35-959 Rzeszow, Poland
2
Faculty of Engineering and Architecture, Kore University of Enna, Cittadella Universitaria, 94100 Enna, Italy
*
Authors to whom correspondence should be addressed.
Energies 2021, 14(4), 1046; https://doi.org/10.3390/en14041046
Submission received: 31 December 2020 / Revised: 14 February 2021 / Accepted: 15 February 2021 / Published: 17 February 2021
(This article belongs to the Special Issue Exhaust Emissions from Passenger Cars)

Abstract

:
Urban agglomerations close to road infrastructure are particularly exposed to harmful exhaust emissions from motor vehicles and this problem is exacerbated at road intersections. Roundabouts are one of the most popular intersection designs in recent years, making traffic flow smoother and safer, but especially at peak times they are subject to numerous stop-and-go operations by vehicles, which increase the dispersion of emissions with high particulate matter rates. The study focused on a specific area of the city of Rzeszow in Poland. This country is characterized by the current composition of vehicle fleets connected to combustion engine vehicles. The measurement of the concentration of particulate matter (PM2.5 and PM10) by means of a preliminary survey campaign in the vicinity of the intersection made it possible to assess the impact of vehicle traffic on the dispersion of pollutants in the air. The present report presents some strategies to be implemented in the examined area considering a comparison of current and project scenarios characterized both by a modification of the road geometry (through the introduction of a turbo roundabout) and the composition of the vehicular flow with the forthcoming diffusion of electric vehicles. The study presents an exemplified methodology for comparing scenarios aimed at optimizing strategic choices for the local administration and also shows the benefits of an increased electric fleet. By processing the data with specific tools and comparing the scenarios, it was found that a conversion of 25% of the motor vehicles to electric vehicles in the current fleet has reduced the concentration of PM10 by about 30% along the ring road, has led to a significant reduction in the length of particulate concentration of the motorway, and it has also led to a significant reduction in the length of the particulate concentration for the access roads to the intersection.

1. Introduction

Currently, most of the methods and discussions on reducing emissions from motor vehicles are focused on research related to: the search for alternative fuels [1], catalytic systems [2], and type approval procedures related to the cold start [3,4], vehicle characteristics [5] and operating conditions [6,7,8,9]. This is undoubtedly a limited approach to the existing problem of air pollutant emissions.
Air quality in Polish cities is among the poorest in the EU. In 2017, Poland ranked penultimate among the EU-28 countries, exceeding the particulate matter (PM2.5) concentration limit of 20 μg/m3. Although the main cause of poor air quality is a large number of small home heating units that burn coal, wood, or waste appliances, motor vehicles also contribute significantly to pollution. The country has one of the oldest vehicle fleets in Europe. In order to meet EU carbon dioxide (CO2) emission targets, improve local air quality, and boost the economy, the Polish government is committed to promoting the electrification of its vehicle fleet. The present work focuses on the problem related to the emissions generated by vehicular traffic with particular reference to an area of the city of Rzeszow in Poland [10,11].
In particular this work is a proposal for an analysis of the emission problem and, as a consequence, gas concentration for the areas of roundabouts. The proposed approach determines not only the estimation of the emissions from vehicles, but extends it to the analysis of the solution of the intersection itself, the traffic conditions of vehicles and, consequently, the concentration of harmful gases in the surrounding area. The issue of exhaust emissions is all the more important because it leads to climate change, which makes it, at present, the second most important problem faced by the global community [12,13,14]. The greenhouse effect is a natural process that plays a key role in shaping the planet’s climate, while human activity through, for example, burning fossil fuels accelerates this process. This causes an unnaturally rapid accumulation of greenhouse gases in the atmosphere [15,16]. The main greenhouse gases emitted by human activities are carbon dioxide, methane, nitric oxide, hydrofluorocarbons, perfluorocarbons, and sulfur hexafluoride [17,18,19]. Apart from greenhouse gases, emissions of particulate matter, especially those with the dimensions PM2.5 and 10 [20,21,22], are extremely dangerous to health and the environment.
Due to the fact that the permissible emission limits of pollutants with regard to air quality standards are increasingly often exceeded, there is a need to develop new models for assessing emissions from road transport to properly estimate the impact of vehicle traffic on the overall emission of harmful exhaust components. In order to estimate the impact of, for example, intelligent traffic control systems, dynamic speed limits or various types of intersections (roundabouts) on pollutant emissions, the calculations should be sufficiently sensitive to the characteristics of vehicle traffic under real operating conditions [23,24,25].
One of the crucial points where the greatest accumulation of vehicle traffic occurs in cities are intersections. In recent years, there has been a significant increase in the construction of roundabouts. The advantage of using this type of road solution is the increase in road traffic safety compared to other types of intersections [26,27,28,29].
Considering the entrance and exit areas of the roundabouts, stop-and-go maneuvers generated by acceleration and deceleration are prevalent, and the speed remains mostly constant along the circulatory carriageway.
The congestion conditions at the roundabout inlets generally result in time loss, long queues and changes in vehicle speed cycles. The occurrence of these phenomena has a large impact on the air quality in the surrounding area around the roundabouts. The comparison was made through modeling on micro simulation software and then through the use of a tool dedicated to the evaluation of pollutant emissions from vehicular traffic.
According to the above issues, the authors conducted research on the measurement of actual PM10 concentrations in the area of the chosen roundabout, as well as conducting simulation study research. The conducted analyses were divided into two parts. In the first part, the actual measurement of PM10 concentration for the analyzed area of the two-lane roundabout was undertaken and the obtained results were related to the VERSIT + simulation model. The VERSIT+ is an emission model which based on multiple regression model where the driving cycle of a given vehicle is a variable [30]. The actual measurements also concerned the PM2.5. All the emission results obtained were compared both to the Polish air quality index and the European Common Air Quality Index (CAQI). The Polish air quality index was developed in 2012; it classifies the air quality on the basis of 1-hour results from measurements of gas concentrations in the air [31]. The CAQI index has been used since 2006; similar to the Polish air quality index, the results of air quality classification can be related to their one-hour average gas concentrations [32]. The analyses carried out in this way allowed development, on the basis of the researched roundabout, its counterpart in the Vissim traffic microsimulation program [33]. The Vissim software enables vehicle movement simulation based on discrete time steps; its stochastic microscopic model includes a Wiedemann car following psycho-physical driver behavior. In this way, it was possible to create a PM10 concentration map for the studied area in the VERSIT+ calculation model. The obtained results indicate in which areas there are high concentrations of PM10, which has a negative impact on the health of passers-by and the natural environment. In the next part of the work, the authors indicate possible examples of solving the PM10 concentration problem for roundabout areas. The PM10 concentration maps for an alternative turbo roundabout solution and the concept of using an increased share of electric vehicles are presented.
The comparison also considered the possibility that the flow of vehicles will change in the coming years, increasing the percentage of electric vehicles due to incentives and policies on environmental sustainability, an increasing number of charging stations in the urban context and also a growing acceptance of users to the use of electric vehicles.
There are more and more car models on the automotive market that are powered exclusively by an electric engine. Such a solution may undoubtedly be of great importance for use in inner city areas, where there is the highest density of vehicles, especially in the areas of intersections.
Therefore, the conducted analyses concern the simulation of vehicle traffic, including the 25% share of vehicles powered by an electric motor, which emit zero exhaust emissions.
The research steps are represented in the flow-chart in Figure 1.
This study is preparatory to the evaluation of different actions to be implemented by the local administration for a reduction of environmental impacts generated by vehicular traffic in the examined area. In particular, two different strategies were evaluated:
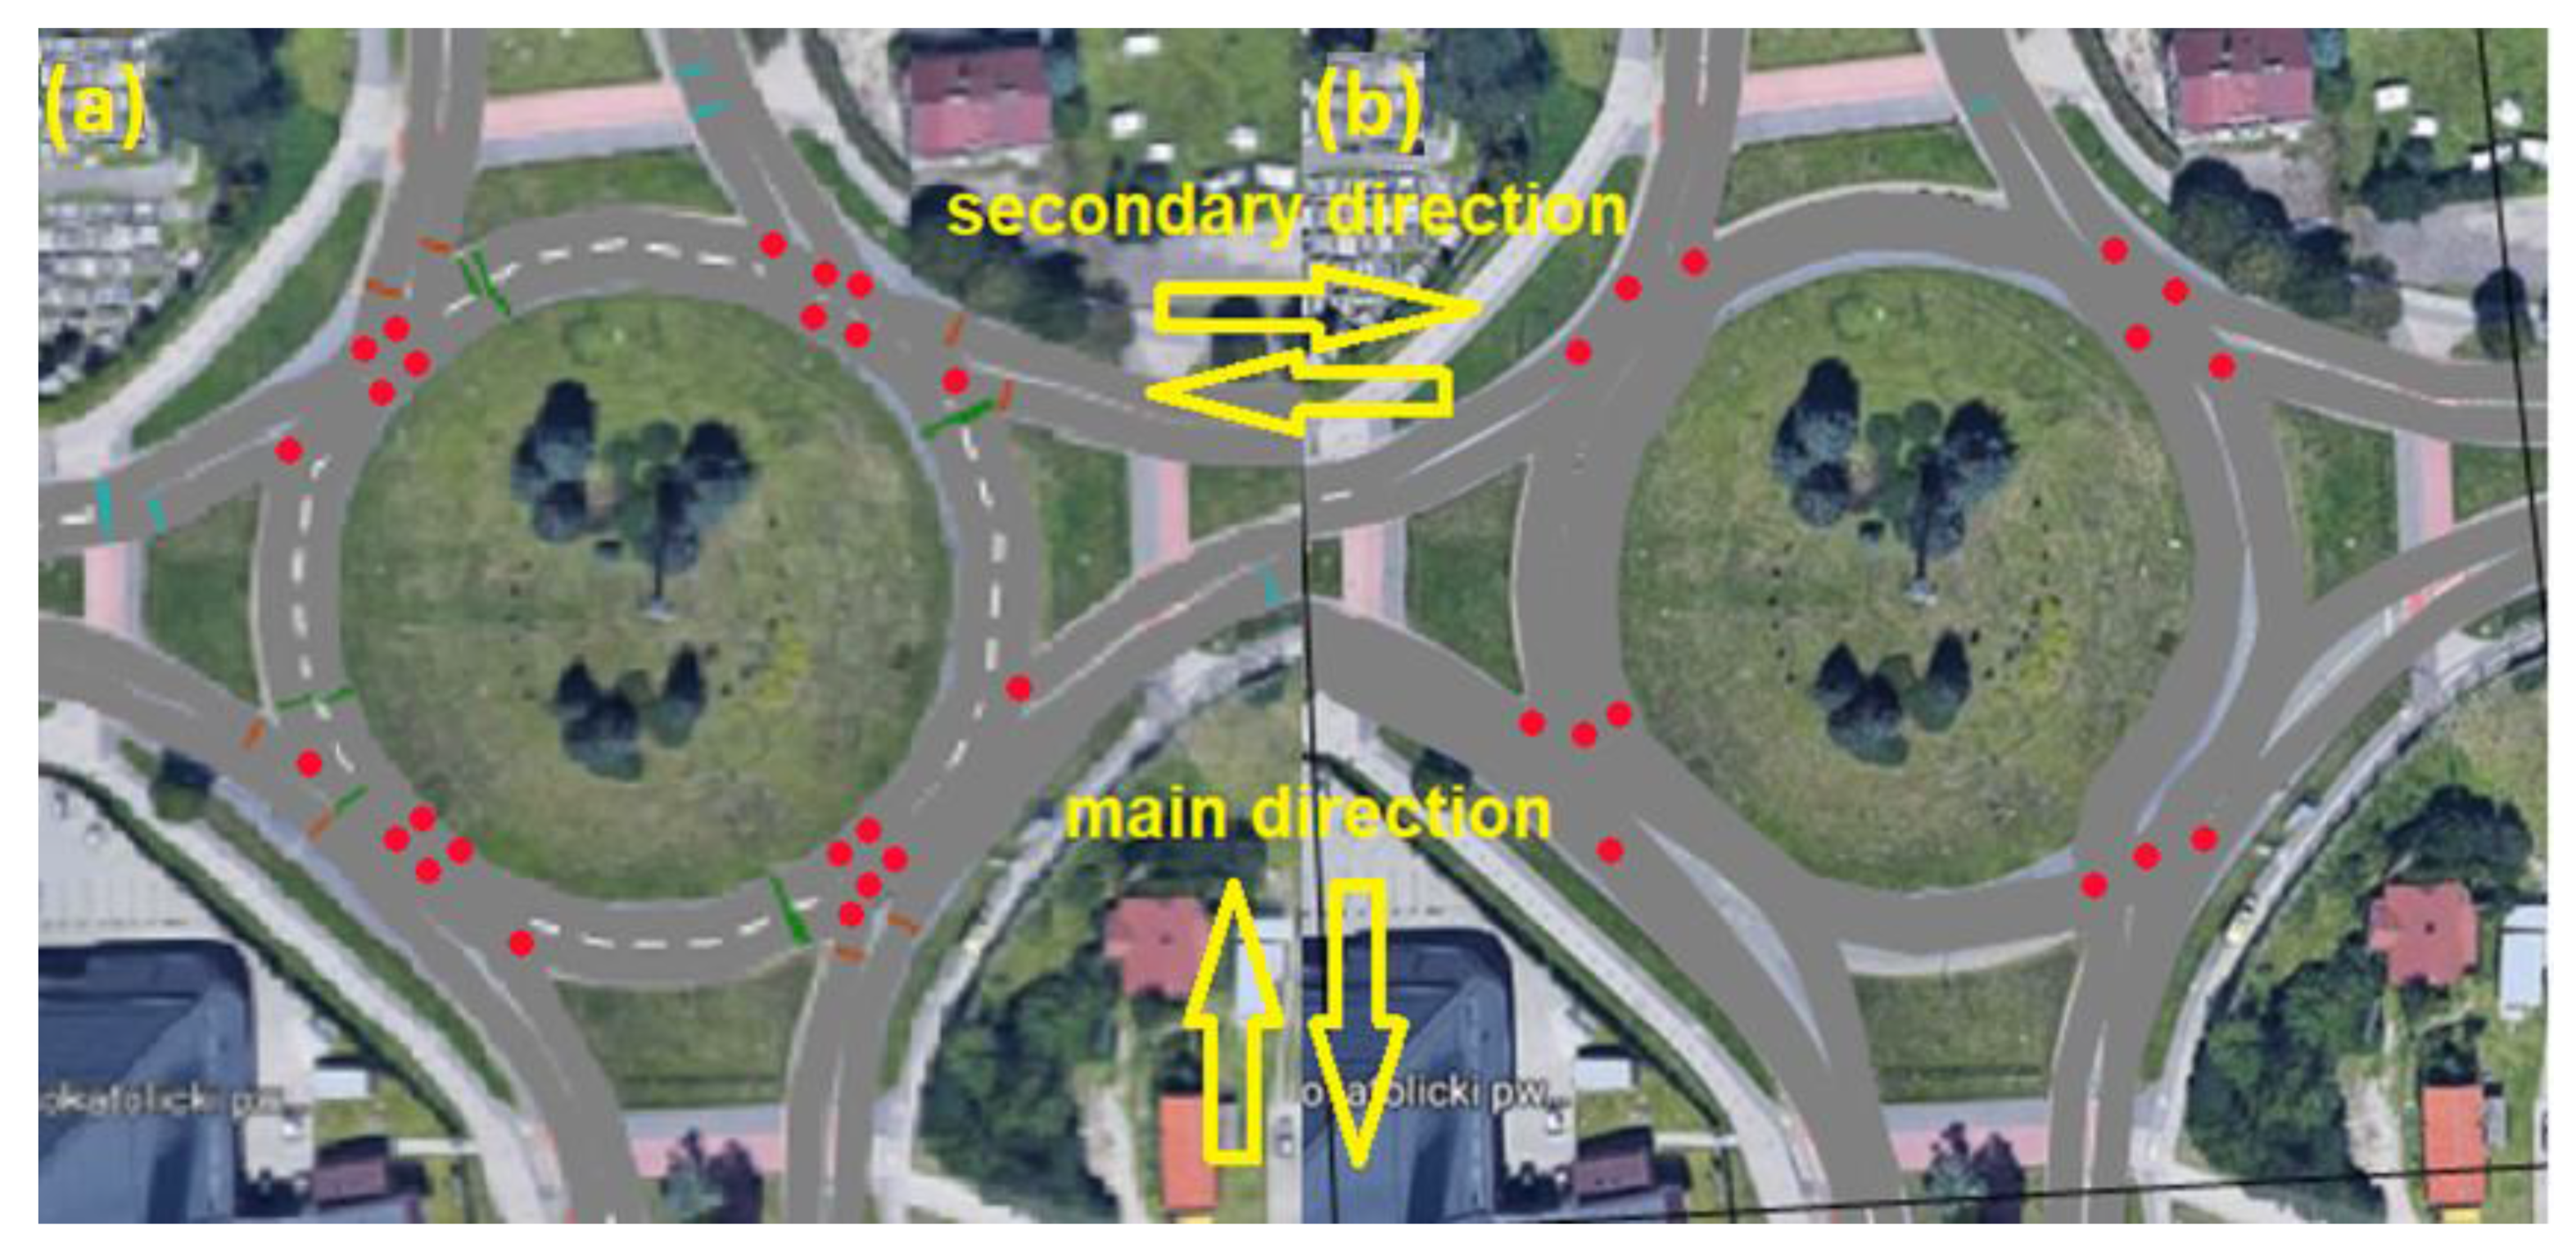
  • variation of the functional geometric scheme with the proposed implementation of a turbo-roundabout.
  • evaluation of a scenario with an increase in electric vehicle traffic with the same current geometry.
The results lay the foundations for future research steps related to an increase in comparative scenarios for the two strategies examined.

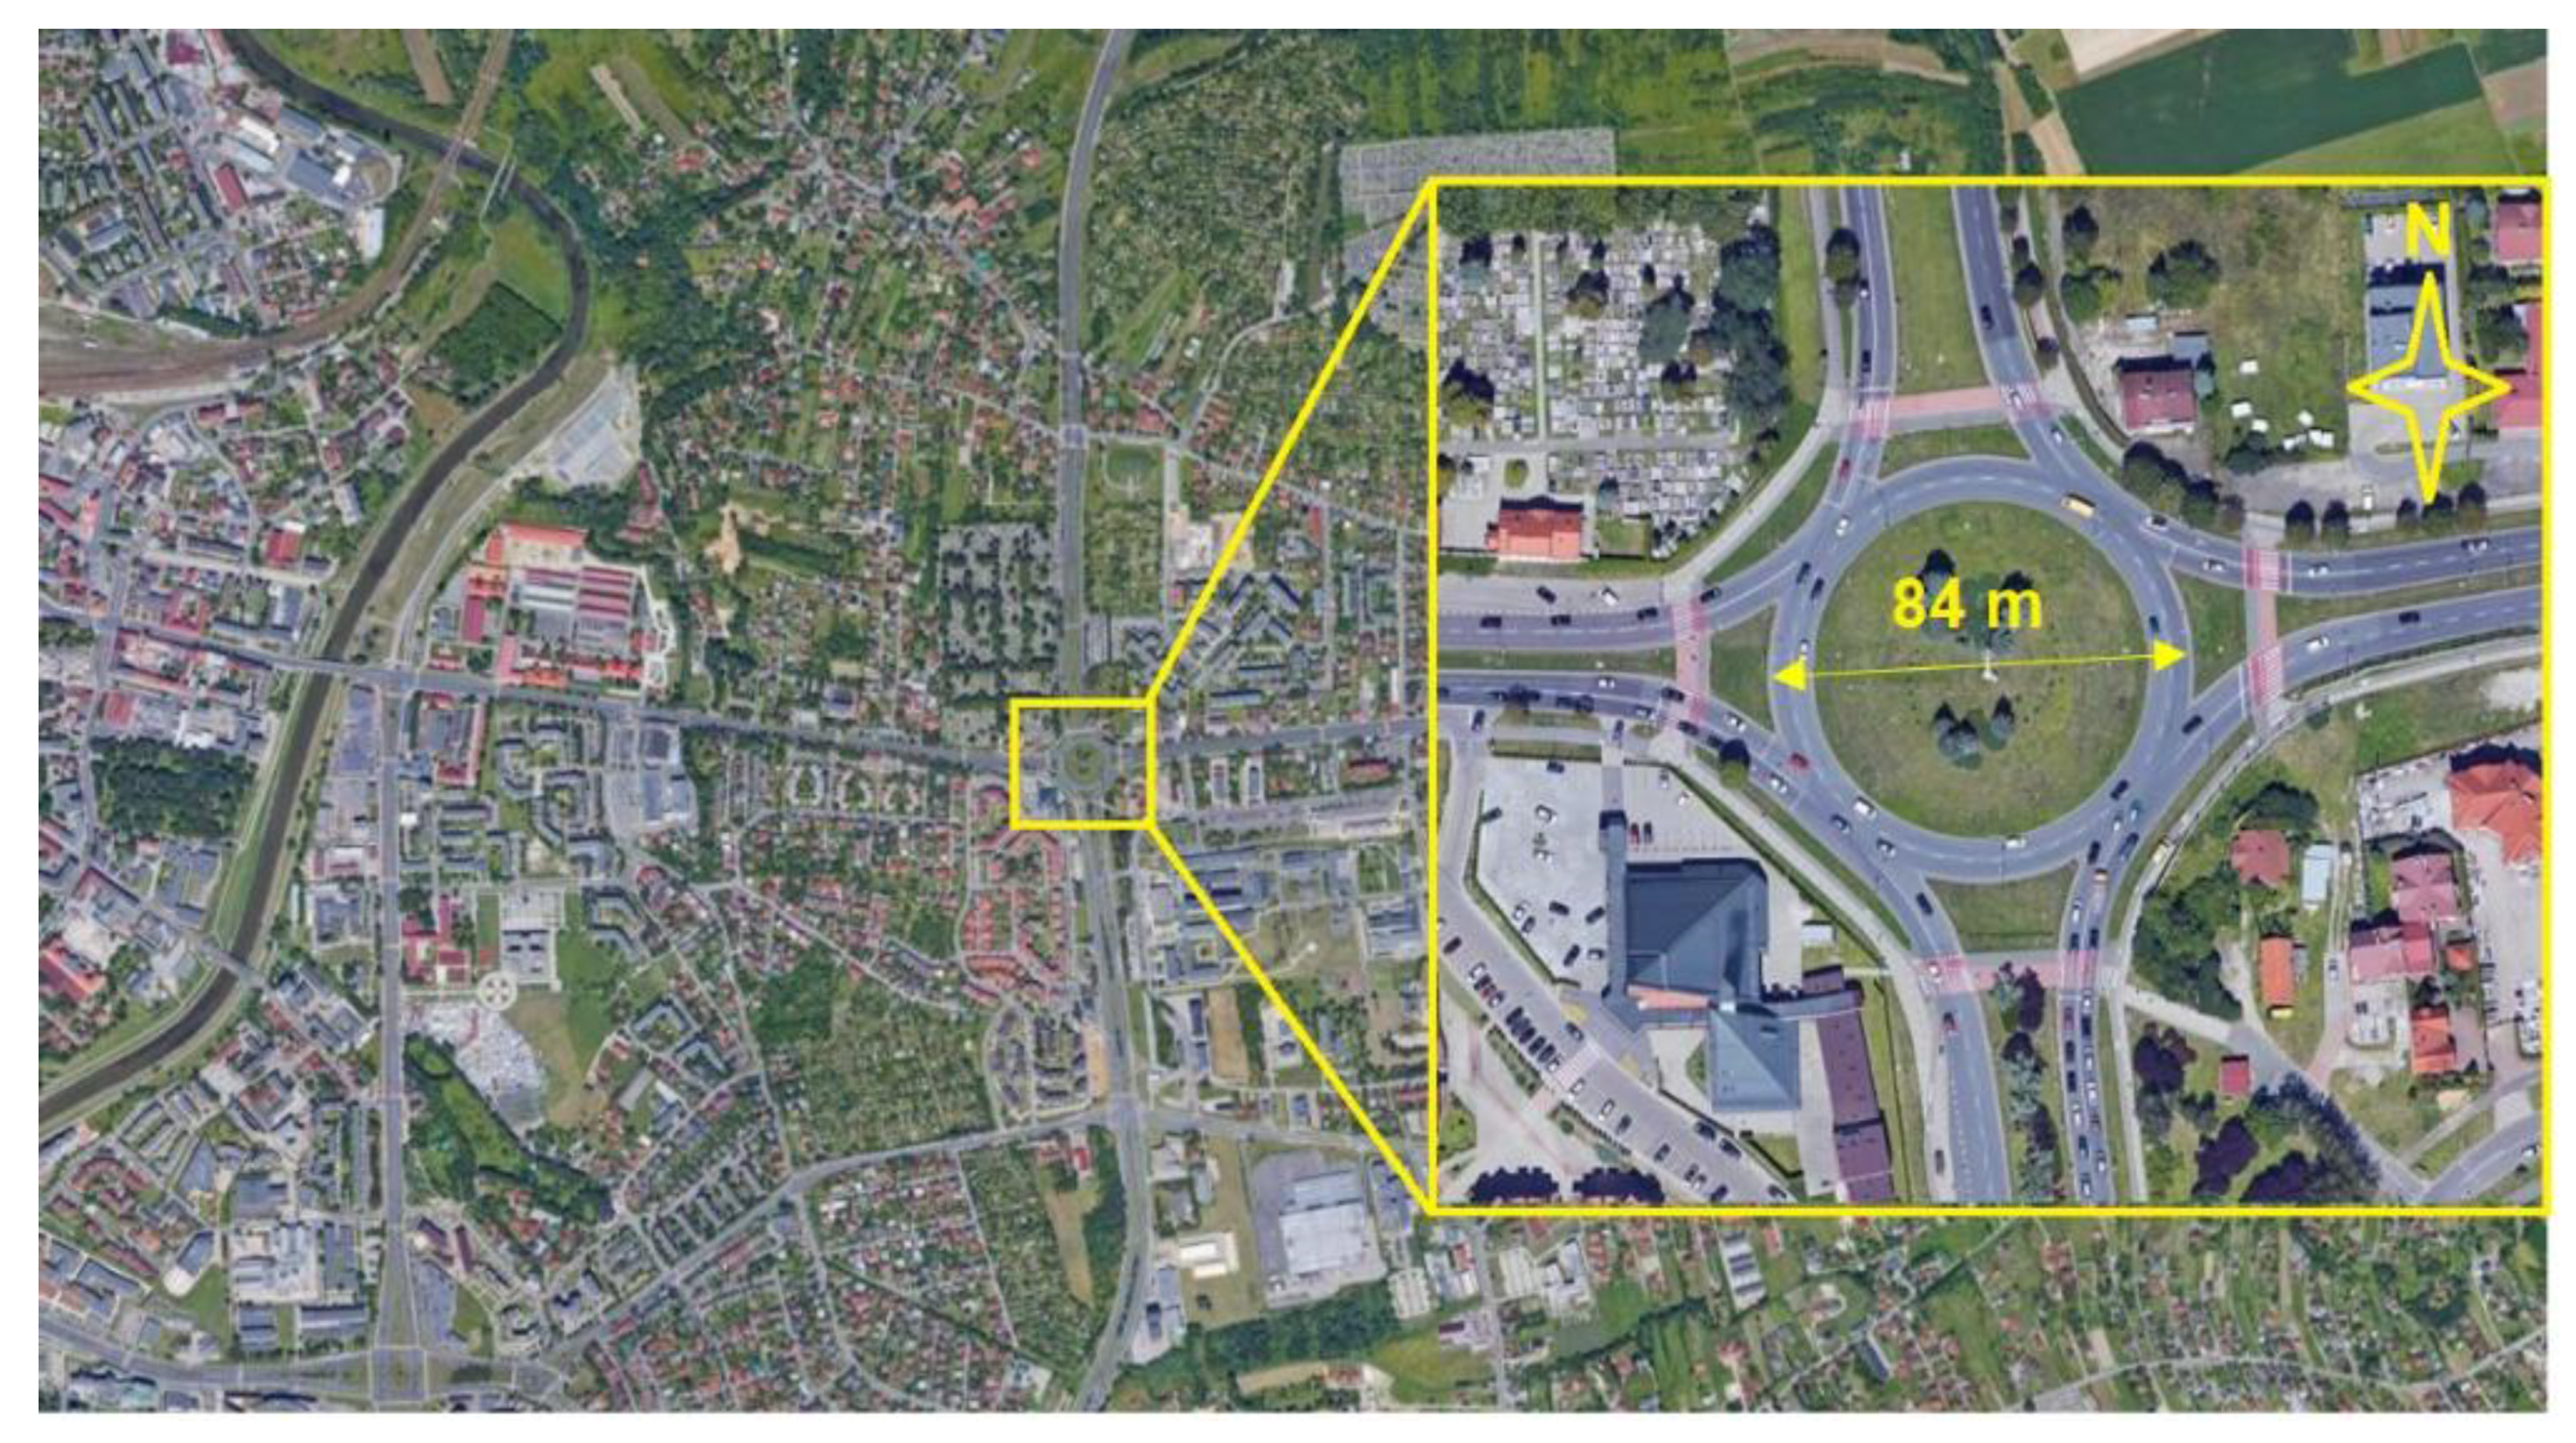
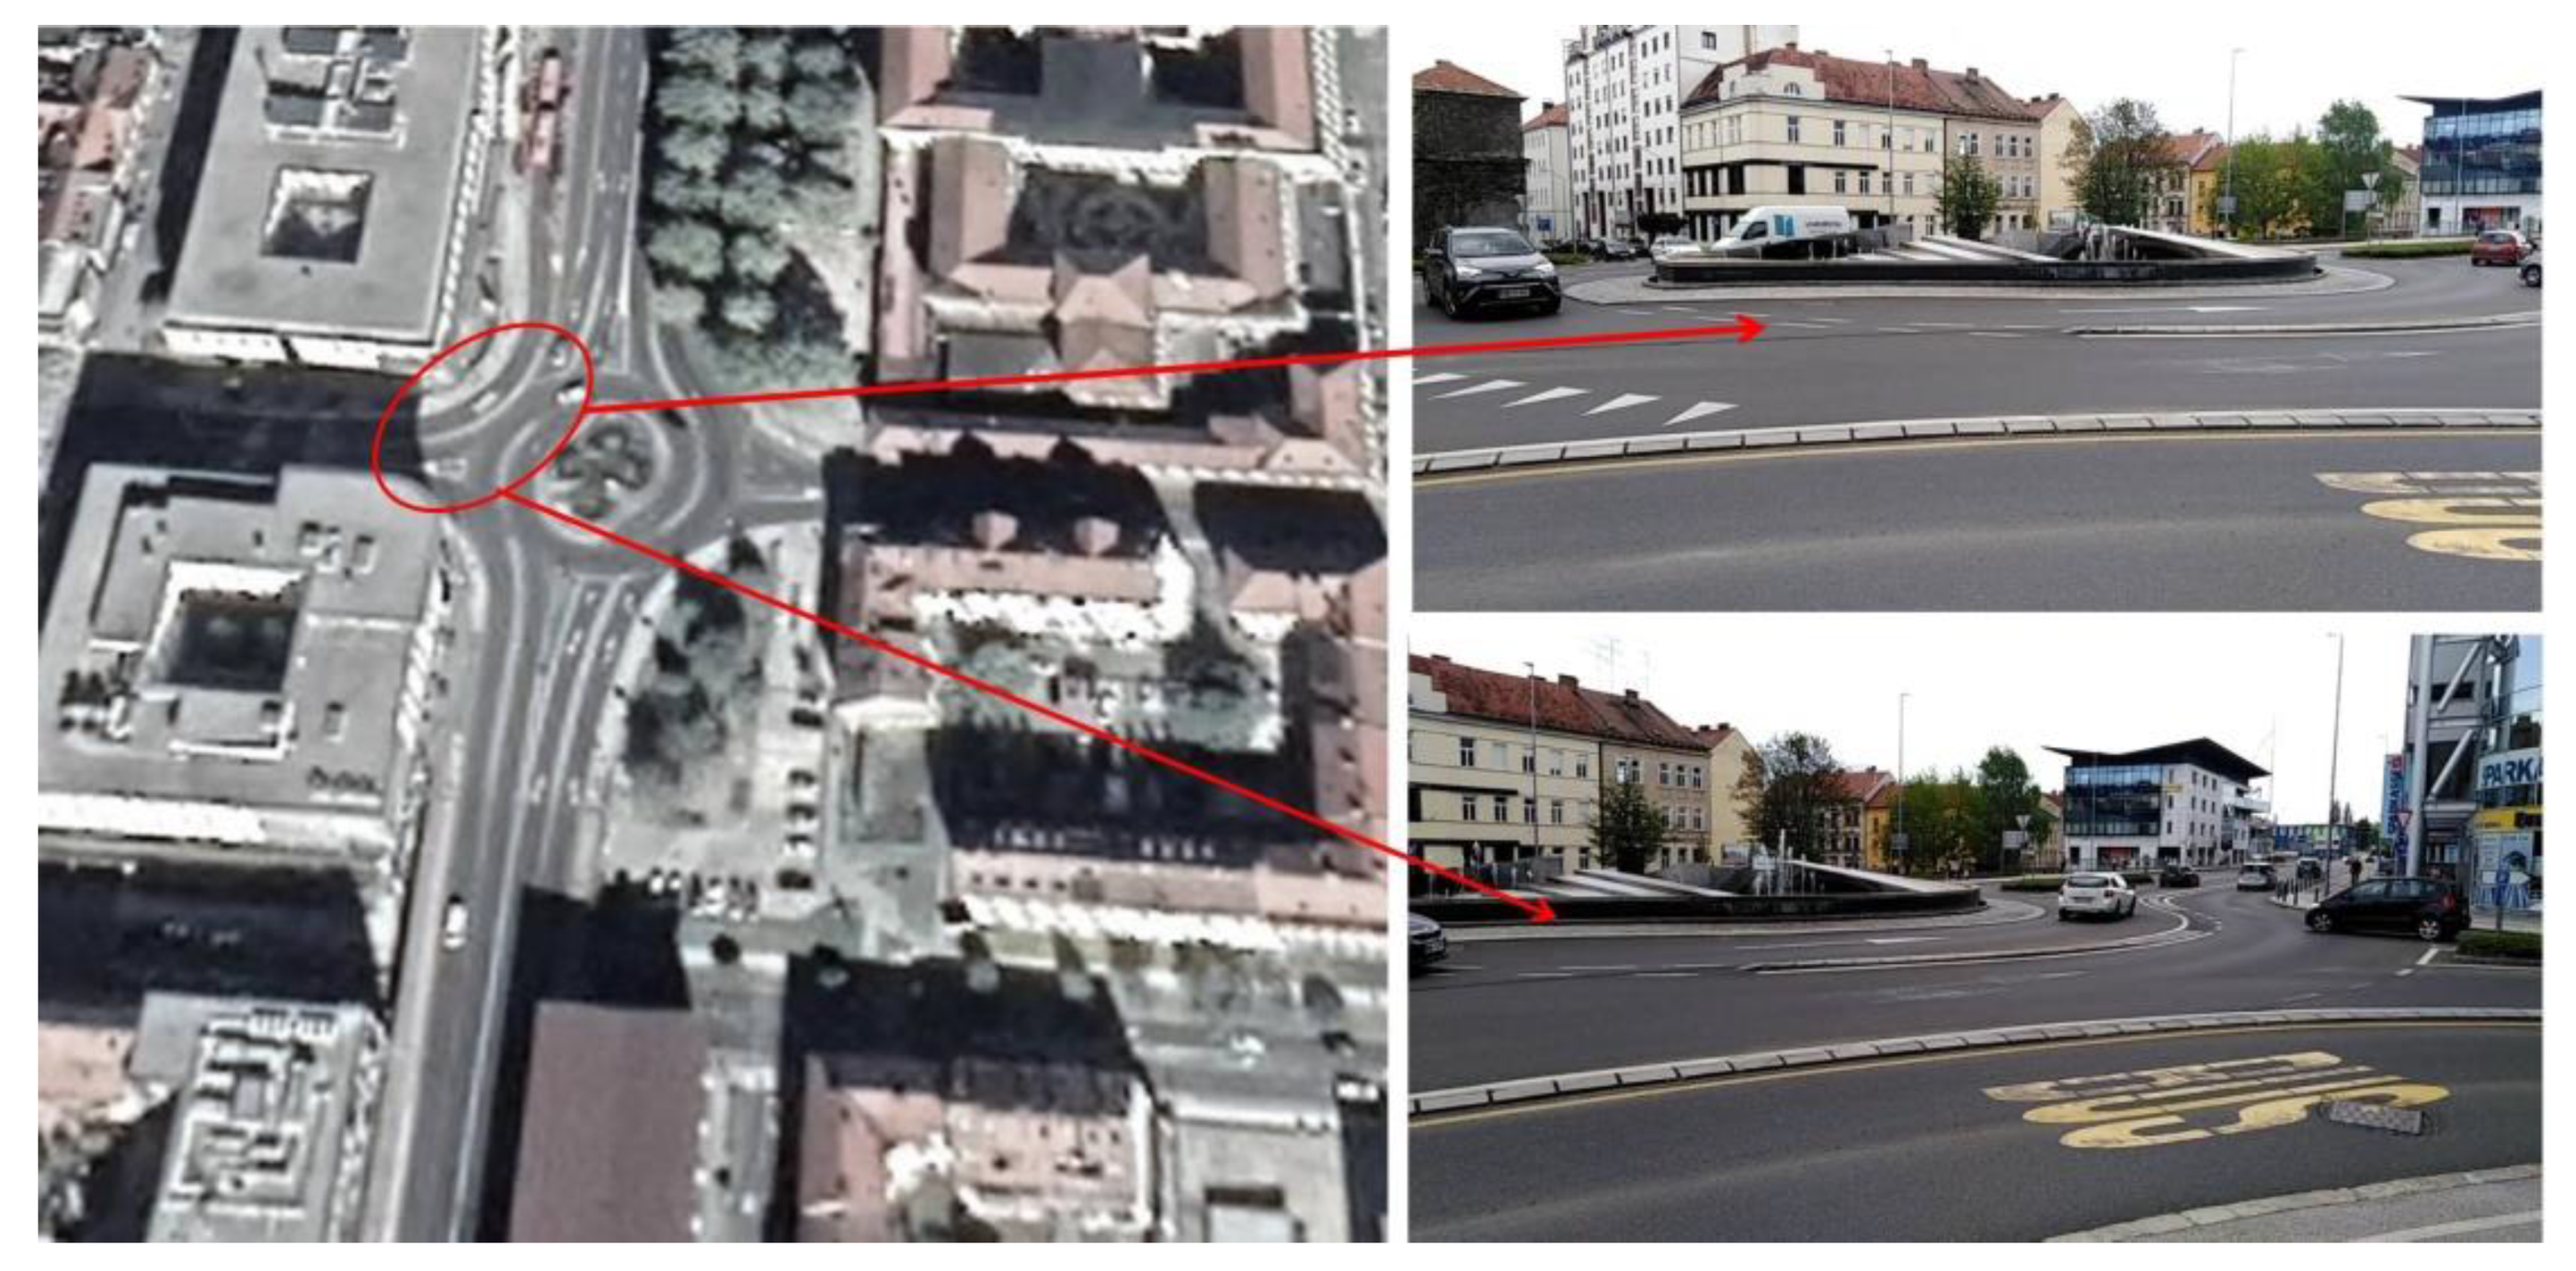
2. Case Study Description: Basic Characteristics and Design Elements

The research started with the selection of a high-flow roundabout intersection in Rzeszow city (Poland), characterized by about 200,000 habitants.
Rzeszow has a visibly formed zone of intercity development, with a radial-concentric layout, with the industrial and residential districts being visibly separated. The city is divided into 30 districts. The population density is one of the lowest among medium-sized cities in Poland. There are many recreational and green areas within the city.
The city of Rzeszow bears witness to practically all unfavorable effects of urban development related to the functioning of transport. The increase in the number of vehicles and traffic intensity contributes to road congestion and higher journey times [34].
In particular, a functioning roundabout with four arms and double lanes was selected (Figure 2). It is located in the east part of the city and the daily traffic is about 1000 veh/h during the peak hour 08:00–09:00 in the weekday mornings.
The outer diameter of the roundabout is 84 m, while the dimensions of the road width for inlets and outlets are 4.15 m, and for roads at the roundabout, 4.28 m. Main flow direction is in the relation of north-south, when for secondary flow is west-east.
The roundabout is located next to the supermarkets, a hospital and it actually enables vehicles to enter the city from suburban areas. This intersection is also a crossing of national roads. Because of this, the selected roundabout was chosen for research because congestion occurs on its access roads during rush hours, which impedes traffic in the city, causes long traffic delays and has strong impact on the surrounding environmental conditions.
In the following paragraphs the project scenarios have been described taking into consideration the innovative intervention on two aspects of mobility, one connected to the geometry of the infrastructure with the hypothesis of implementing an unconventional roundabout called turbo roundabout and development of electric vehicles and the consequent change in the composition of the vehicle fleet. Table 1 summarizes the characteristics of the compared scenarios.
The monitored area was characterized by 4 cameras and induction loop detectors localized at the intersection and on access and exit roads of the roundabout, so the presented data is based on real road values.
The traffic data and its composition refer to an average value obtained from 15 days of monitoring with a peak value observed during weekdays (during the hours 08:00-09:00 in the morning).

2.1. Turbo Roundabout Scheme Proposal

A turbo roundabout is a recent development and only a few countries in Europe have regulations that allow its implementation in urban and non-urban areas.
This scheme originates from a standard traffic circle with two lanes on the ring and allows, thanks to its particular geometry, separating the currents that will have to travel the ring from those that will have to make a turning maneuver.
The first turbo roundabout was built in the Netherlands in 2000 [35]. The advantages related to this geometric scheme are related to the reduction of points of conflict and the overall reduction of speed of travel and therefore greater safety is achieved compared to standard two-lane traffic circles [36]. The literature shows that the turbo roundabout geometric scheme is optimal for safety and the level of service levels (LOS) in the presence of bus raid transit BRT [37,38] but not in some conditions with cyclist traffic components [39].
Several turbo schemes have become popular in the last decade in several European countries such as Slovenia and in the USA as shown in the Figure 3.
For the purpose of a comparative analysis of the emissions and concentration of PM, which arises at the current two-lane roundabout, a turbo roundabout will also be modeled in the Vissim traffic microsimulation program (Figure 4).
One of the major differences of these solutions is the reduction of the number of conflict points from 24 to 14, which may affect traffic flow, reduce stop and go operations of vehicles and, consequently, decrease the PM concentration in the air.

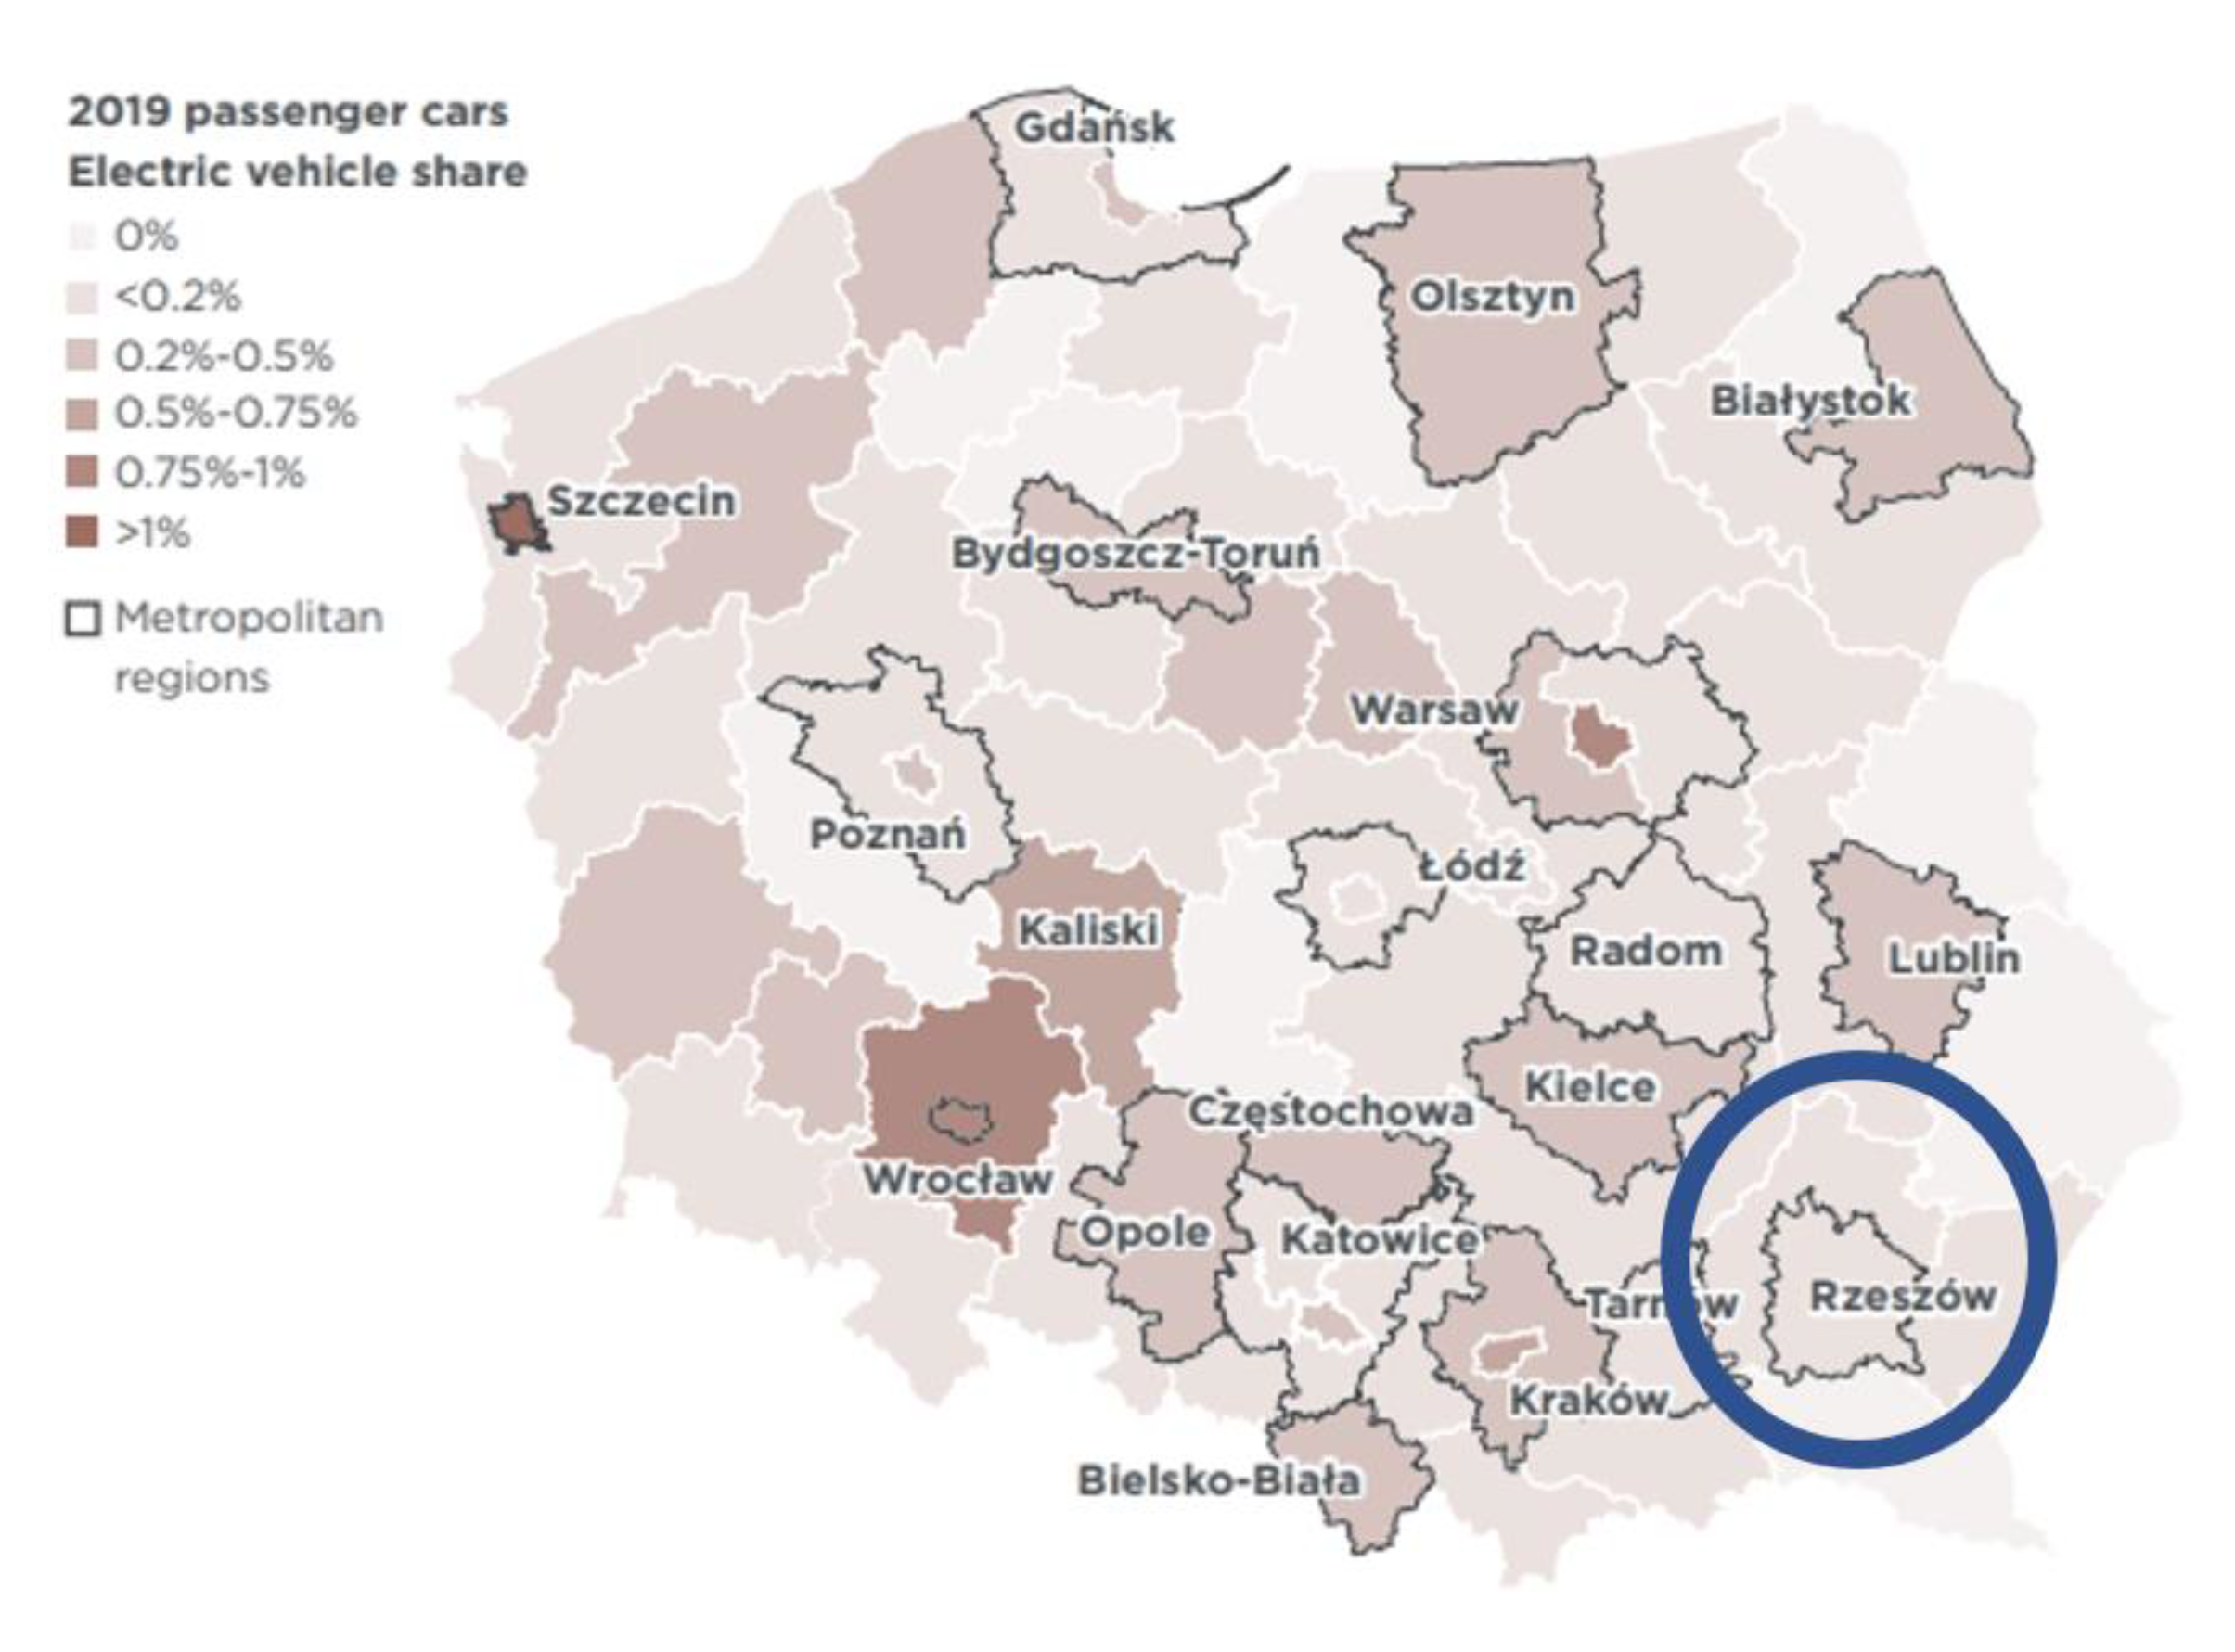
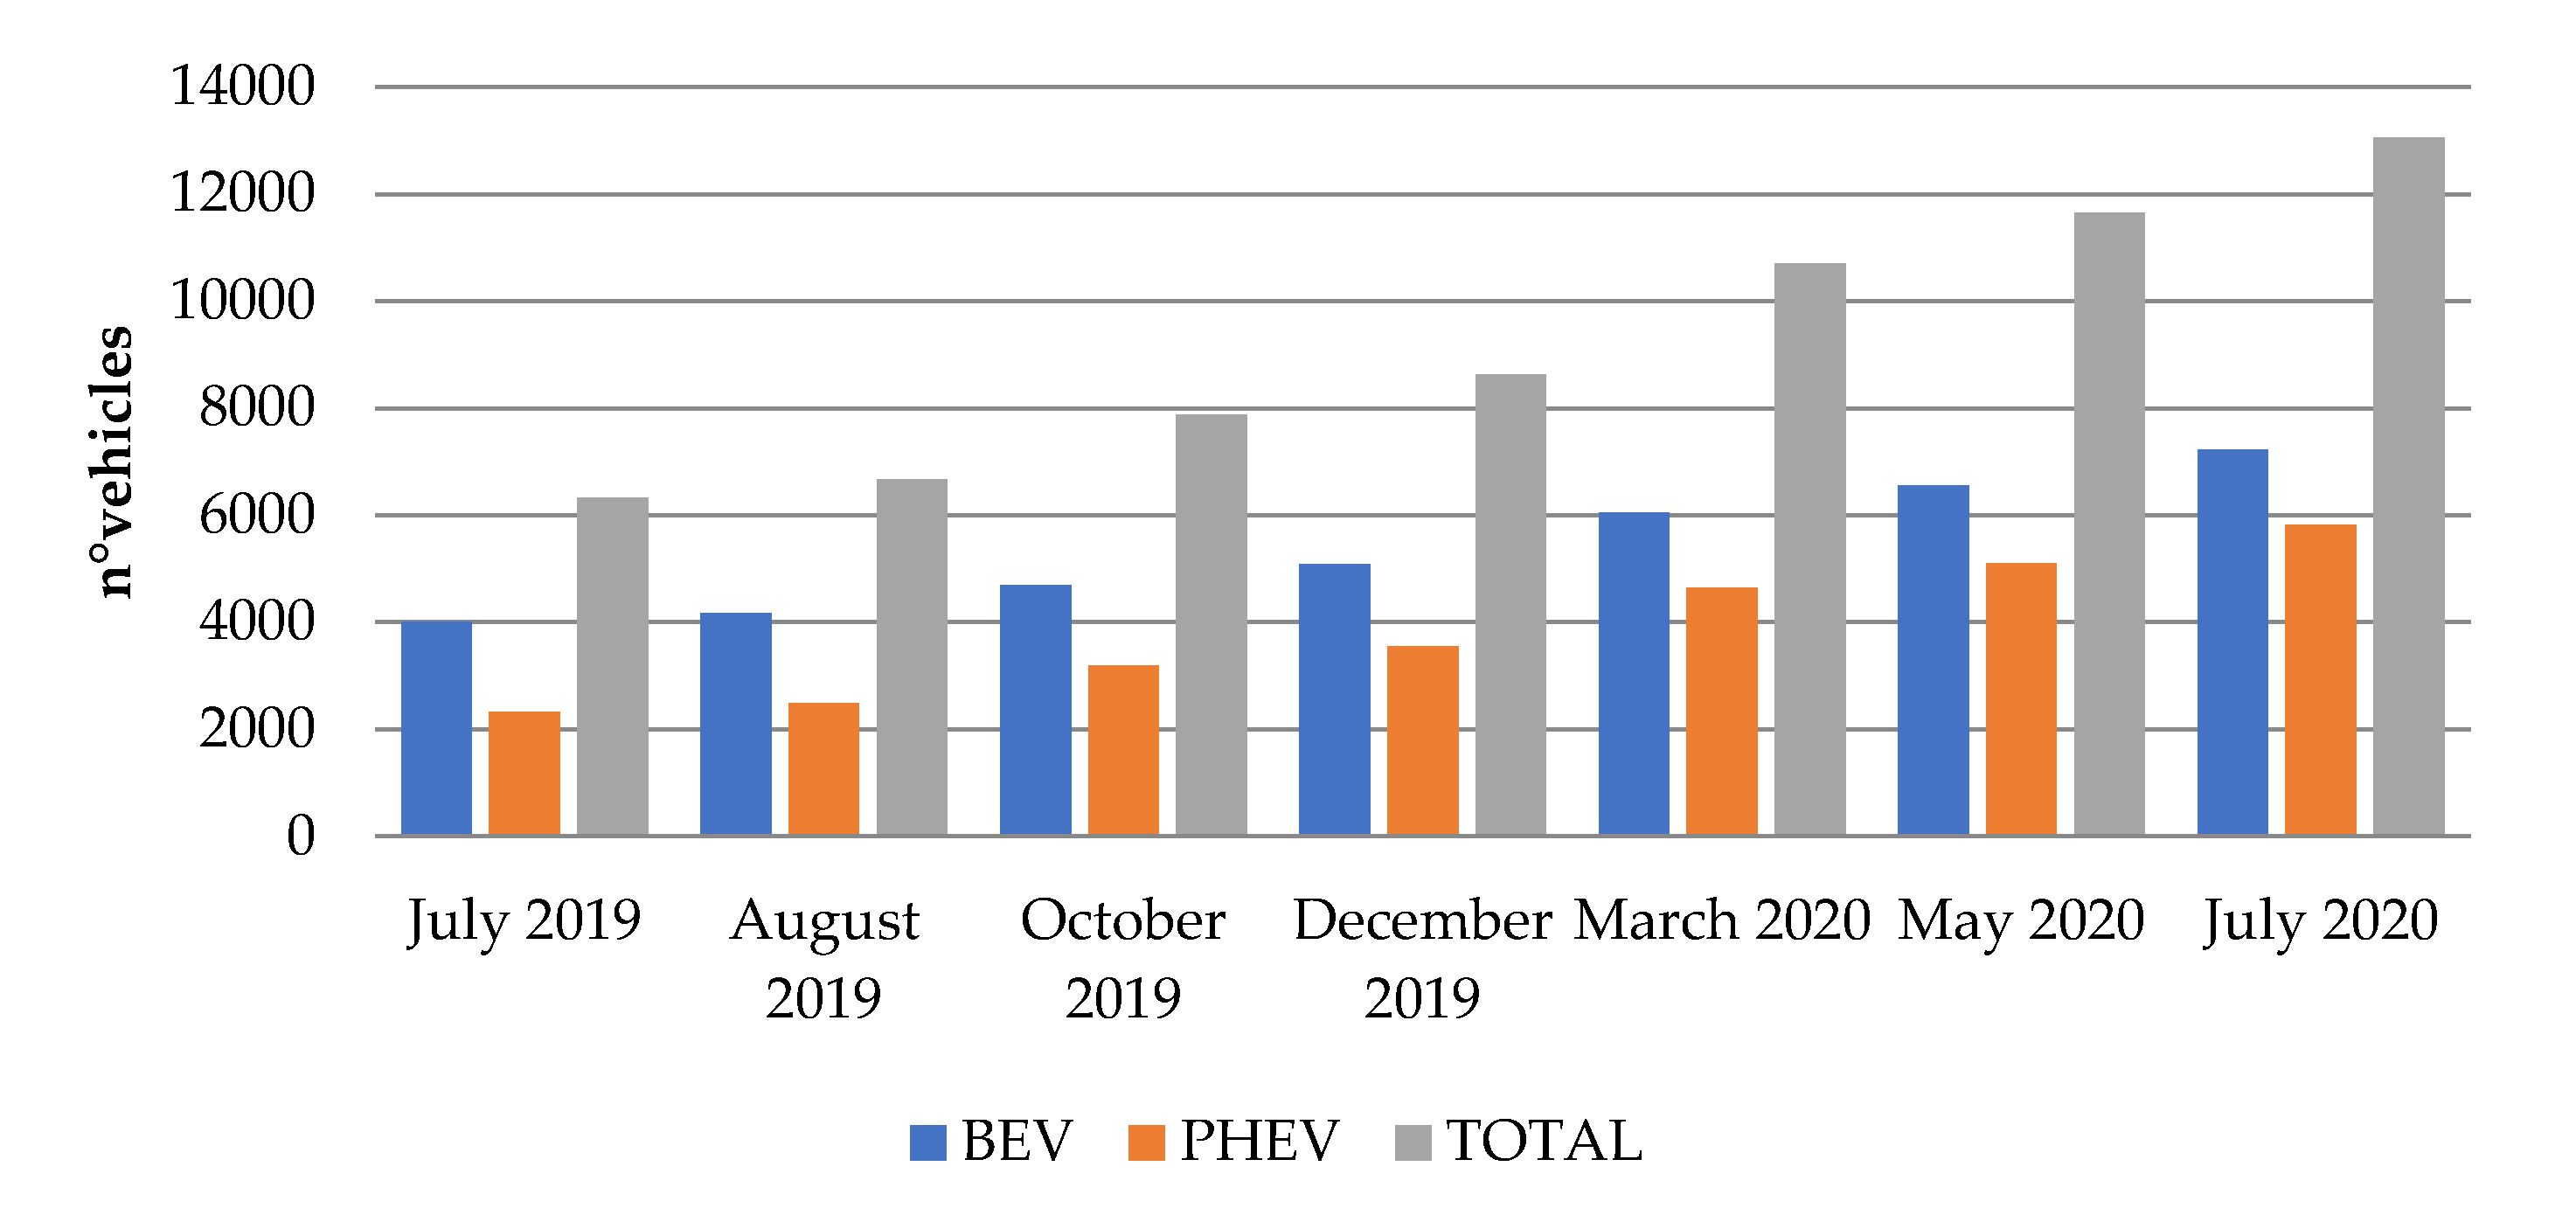
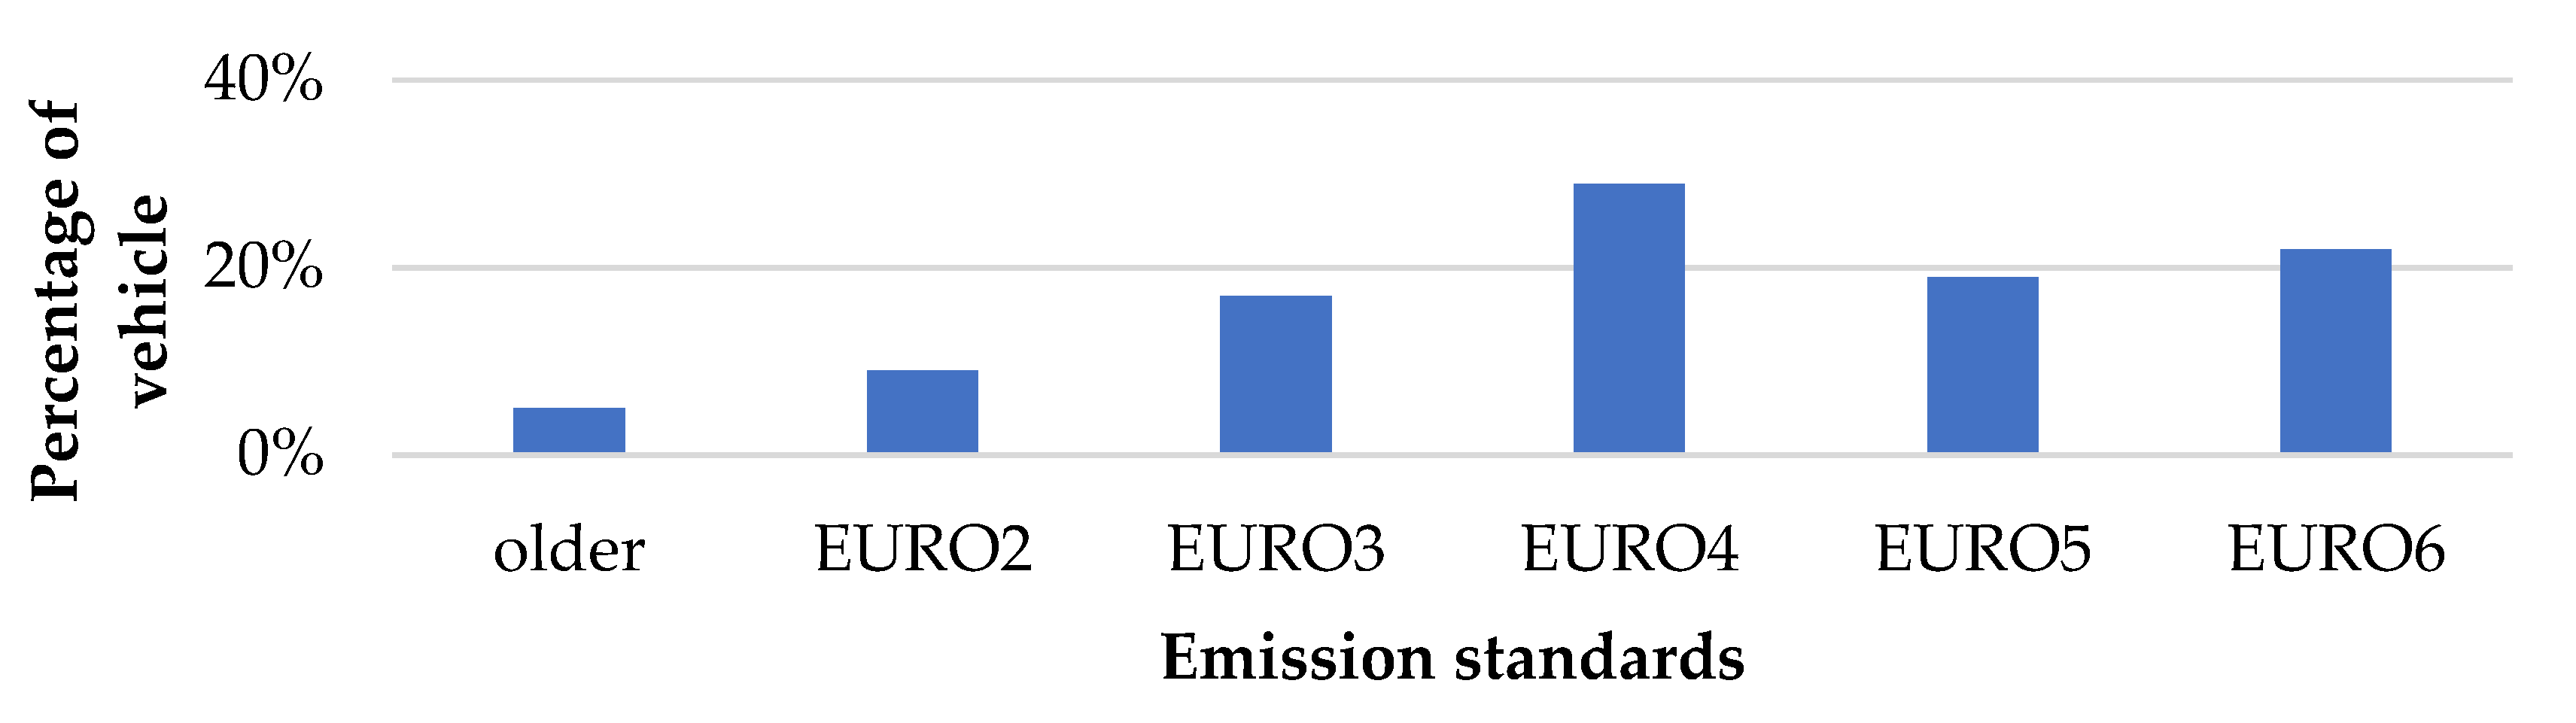
2.2. Actual and Future E-Traffic Composition in Poland
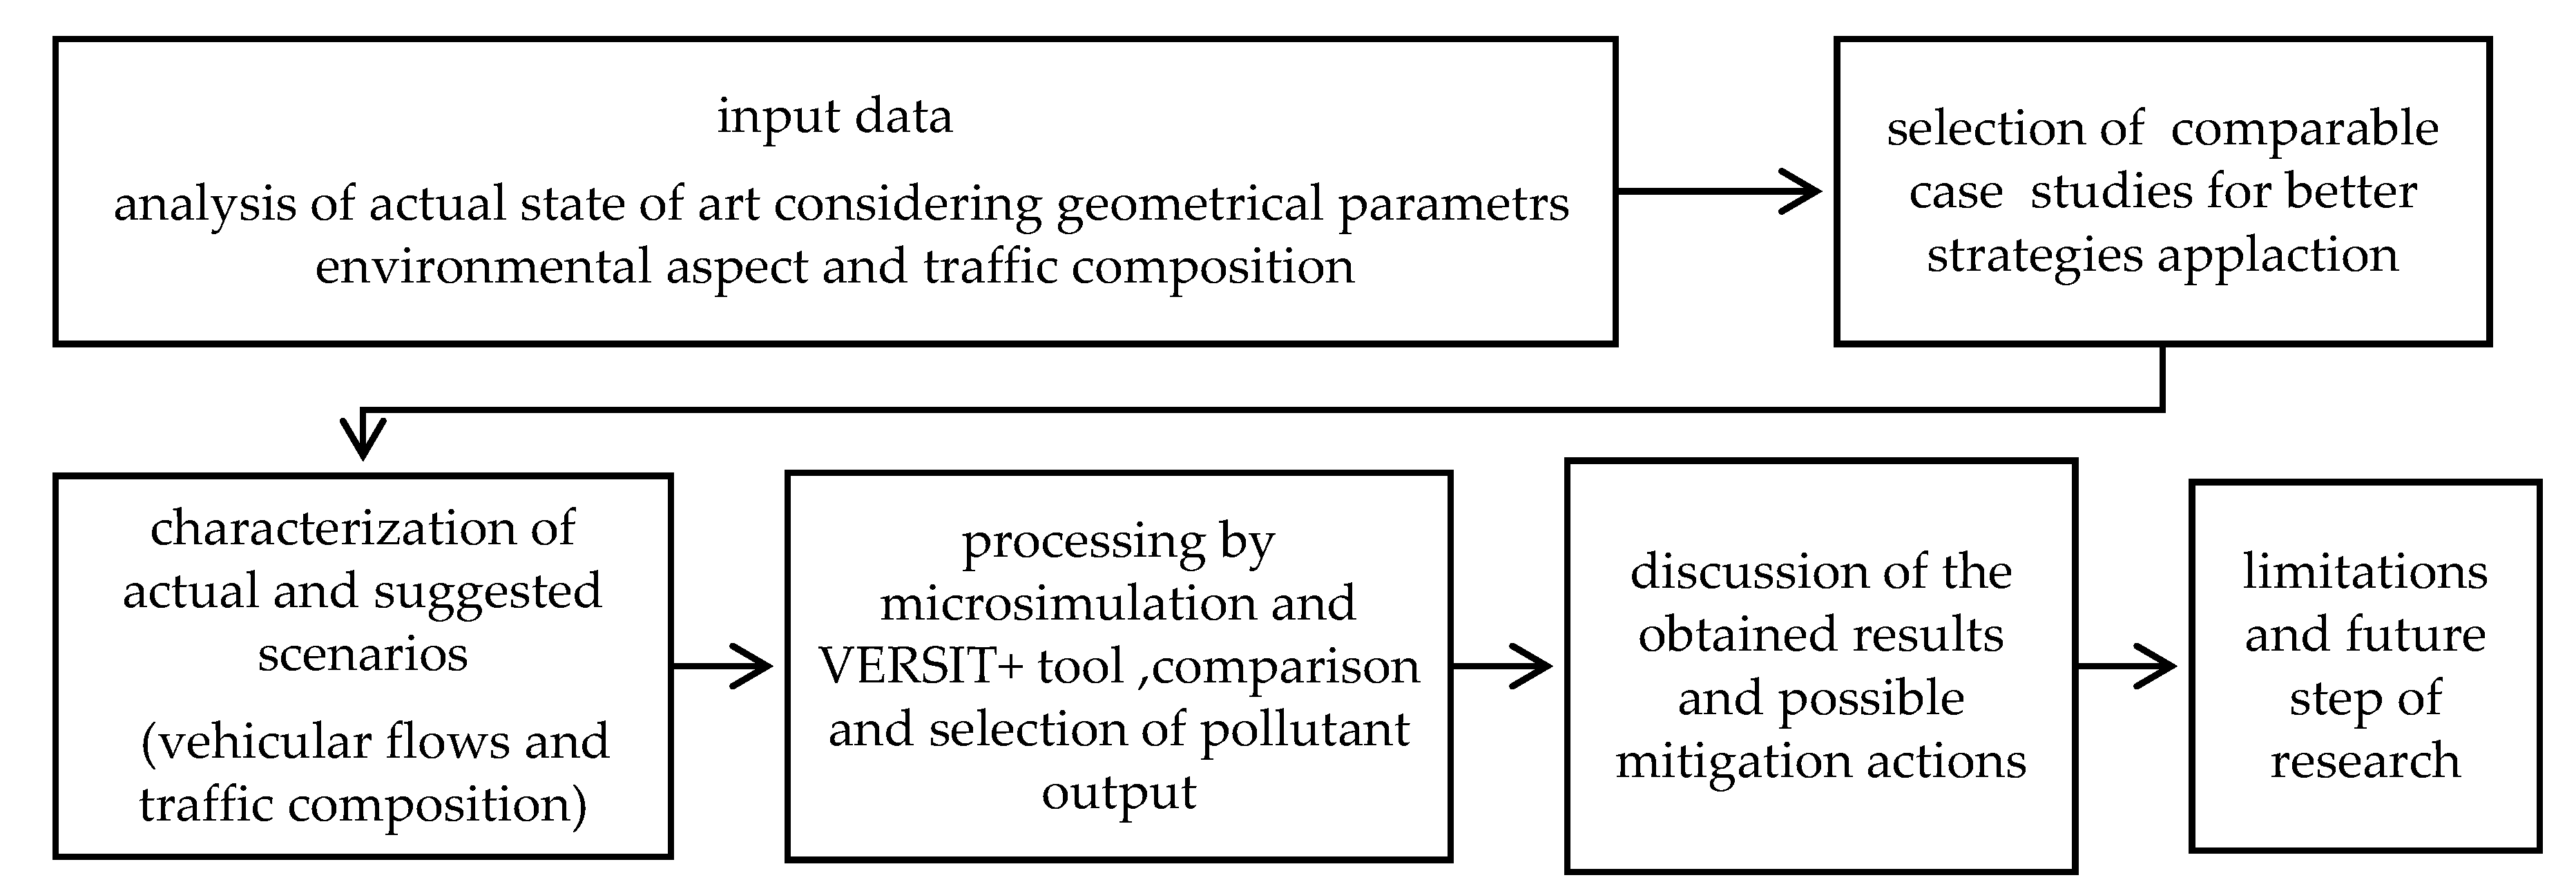
Poland is one of the largest passenger car sales markets in Europe. Poland’s car fleet is currently dominated by cars with combustion engines. In 2019, 71% of newly registered cars in Poland ran on gasoline, followed by diesel cars with a 20% share. Hybrid electric vehicles (HEVs) accounted for 7% of the fleet, and vehicles powered by liquefied petroleum gas (LPG) and compressed natural gas (CNG) vehicles had a combined share of 1.5%. Only a small percentage of new passenger cars were electric vehicles (0.5%), of which 0.3% were battery electric vehicles (BEVs) and 0.2% were plug-in hybrid electric vehicles (PHEVs). In the first six months of 2020, new electric car registrations accounted for 1.5%, with first-time registrations of BEVs and used BEVs [10,40].
Although the main cause of poor air quality is a large number of small domestic heating units that burn coal, wood, or household waste, motorized vehicles also contribute significantly to pollution. The country has one of the oldest vehicle fleets in Europe, with an average vehicle age of 14 years in 2018 compared to 11 years in the EU, which is partly due to the large number of imported used vehicles.
In order to meet the EU’s carbon dioxide (CO2) emission targets, improve local air quality and boost the economy, the Polish government is committed to promoting the electrification of its vehicle fleet like described on Figure 5 about Poland area.
In July 2020, the number of electric passenger cars in Poland amounted to over 13 thousand, an increase of 12 percent since May 2020. The battery electric vehicles (BEVs) accounted for 55.4 % of the electric cars market as of July 2020 [42], as described in Figure 6.
The research was conducted in order to highlight some strategies for environmental improvement, showing the results of two project scenarios, one related to a new geometry and the other related to a new traffic composition in accordance with the imminent diffusion of electric vehicles.
The spread of electric cars means a reduction in direct emissions. In the absence of combustion, in fact, electric vehicles do not emit nitrogen oxides (NOx), carbon monoxide (CO), particulate matter (PM10 and PM2.5), unburnt hydrocarbons and volatile organic compounds (essentially HC). Consequently, the spread of electric cars is certainly beneficial to air quality in built-up areas and on the road network [43].
The project scenario (scenario 2) relating to the modification of the vehicle composition was defined through a preliminary hypothesis of 25% increase of electric vehicles considering that Poland is targeting one million electric vehicles by 2025.

3. Methodology

The research methodology was characterized by two different steps. The first part concerned the measurements of the actual concentration of particulate matter concentrations generated from motor vehicles in the area of the two-lane roundabout. In the work, the CEM DT-9881M analyzer was used to measure the concentration, the specification of which is presented in Table 2. The device also makes it possible to take photos during the measurements; an exemplary photograph from the research is shown in Figure 7, which, in addition to the survey area, presents exemplary results of the PM concentrations. The CEM DT-9881M is the product of China’s CEM instruments company and has the ability to measure suspended particle mass concentration [44]. This device is mobile and allows measuring the concentrations and relate them to the air quality index.
The measurements from the CEM device were collected in November 2020 for two consecutive days with comparable road traffic conditions.
In Poland, air quality measurements are carried out in accordance with the Regulation of the Minister of the Environment of August 24, 2012 on the levels of certain substances in the air. The current air pollution measurement system in Poland is equipped with automatic measuring stations where a given type of pollution is measured continuously with a separate analyzer [45]. At the time when the measurements were made in accordance with the data from the city quality of air station located 2 km from the roundabout, the PM10 concentrations were 21 and 48.6 µg/m3, respectively. In relation to the Polish Air Quality Index for 1-h concentrations, it indicated good air quality in relation to this pollutant component.
The average wind speed on the studied days was respectively 3.3 m/s (east direction) and 8.3 m/s (southeast direction).
Measurements were performed every 50 m, starting at a distance of 300 m from the roundabout, while at each examined point 3 measurements of PM concentrations were made (Figure 8). The CEM device detects the concentration in real time and for measurement one of the arms of the roundabout was chosen. This inlet where the measurements were made can be considered as a representative, because on it there is the highest volume of vehicles.
The average background measurements of PM10 concentrations carried out 50 m from the center of the roundabout and access roads showed the following values: 15 µg/m3 and 75 µg/m3, which classifies them into a very good and moderate air quality index, respectively (Polish air quality index). In addition to the measurement of PM10, the value of PM2.5 concentrations was also measured, which on the measurement days was: 6 µg/m3 and 47 µg/m3, which is equivalent to very good and moderate air quality (Polish air quality index).
Higher values of PM10 and PM2.5 concentrations in the air relate to increased emissions from households located in the area of the studied roundabout. The ranges of PM10 and PM2.5 concentrations in relation to the Polish Air Quality Index are presented in Table 3.
For comparison, Table 4 contains the concentration ranges for the European Common Air Quality Index (CAQI). The research carried out in the first part of the paper made it possible to initially determine the amount of concentration that arises around the roundabout.
The research data were also used to verify the exhaust concentration model used in the second part.
The second part of the work concerned the use of the VERSIT + computational model, thanks to which it is possible to calculate the emission and concentration of harmful exhaust components on a micro scale. The calculated parameter from this model was PM10. It would be difficult to carry out the simultaneous concentration measurement for all roundabout inlets and outlets, as well as for the roundabout at different distances from the road, therefore simulation models [46] are often used for this type of calculation. To perform this type of analysis, it was necessary to create a simulation model of the researched roundabout and to calibrate it properly.
Roundabouts, as infrastructure objects of road intersections, are a place where many stop-start operations (acceleration, braking) take place, which contributes to the increase in exhaust emissions [47]. Such a specific traffic condition at the intersection requires the use of accurate and adequate exhaust emission models [48]. Simulating queues of vehicles presents a number of challenges, such as developing a new acceleration profile for the leader’s vehicle and determining the spacing between vehicles. In order to simulate the emissions calculation in the VERSIT + model, it is necessary to create the roundabout model in Vissim software beforehand.
Vissim is one of the most advanced and flexible traffic simulation software which allows simulating the movement of vehicles on a micro scale [49,50,51]. The VERSIT+ emission model is a multiple regression model in which the driving cycle of a given vehicle is a variable. This means that for emission calculation it requires obtaining speed profiles from Vissim [52]. The model of the roundabout made in the Vissim traffic microsimulation program was created based on a satellite image. Calibration of the model was carried out on the basis of real data and was divided into two parts. In the first part, the acceleration parameters and the desired speed were calibrated so that the speed profiles that occur during the real runs coincide with the simulated ones. This calibration was performed based on several dozen real driving tests on the roundabout and registration of speed profiles with the use of GPS technology. In the VISSIM program, the desired speed is defined as a distribution, not as a specific unit value. For each type of vehicle, the desired speed distribution is a key parameter that affects the capacity of the road and the travel speed achieved. The standard value of the desired speed distribution is defined by the minimum and maximum speed range. Figure 9 shows the cumulative probability of the desired speed distribution from real and simulation data. Based on the road data of cumulative probability obtained in the analyzed speed range, the obtained distribution for the desired speed parameter from the Vissim program was mapped. The speeds shown in Figure 9 relate to the ranges above 30 km/h, that is, the speed that has been defined as desired at roundabouts and exits.
The second stage of calibration consisted in overlapping traffic data and turning operation for all inlets and outlets of the roundabout. This calibration was carried out based on real data from induction loops and cameras located at the inlets and outlets to the researched roundabout; those data were obtained from the municipal road authority [53]. The traffic volume data for the concerned case for inlets was as follows: east—1414 V/h (Vehicles/hour), south—1103 V/h, west—932 V/h, north—1448 V/h. The age structure and fuel type of the vehicles was adopted based on statistical data [44]. According to them, the following values were set in the model: 56% of vehicles are fueled with petrol, 31% with diesel and 13% with LPG.
Based on statistical data [54] of the structure of vehicles, and taking into account the compliance with specific exhaust emission standards for the tested case, Figure 10 shows the relationship between vehicles and EURO emission standards.
Cars that have been registered for more than 24 years (such as EURO1) were omitted in the emission calculation due to their marginal share in the vehicle structure.
In order to check the quality of matching distribution data, road and simulation data, the G test was used. It is recommended to use this kind of test to see whether the number of observations in each category fits a theoretical expectation, and to confirm that the sample size is large. The G test is calculated based on Equation (1) (check the match between observed and simulated distributions) [55]:
G = 2   i f i , o b s e r v e d · ln ( f i , o b s e r v e d f i , s i m u l a t e d )
where fi,observed indicates road data, while fi,simulated indicates data obtained from the simulation model.
After the last calibration stage, the G test value was 0.00612 for the speed distribution and 0.0589 for the acceleration distribution. Figure 11 and Figure 12 show a comparison of speed distribution and acceleration of empirical and model data before and after calibration.
Based on Figure 11 and Figure 12 it can be seen that the calibration process of the model improved the mapping of the speed distribution and acceleration from the simulation to the real values. Therefore, the prepared models should be perceived as close to reality in terms of the researched parameters that have the greatest impact on the emission of harmful exhaust components from vehicles.

4. Results and Discussion

Taking into consideration the database created by the TNO company relating to the measurements of the emission levels of over 3000 types of cars in a variety of conditions, the tool VERSIT + is able to evaluate the concentrations for the scenarios examined with particular reference to the emissions of particulate matter [56].
Versit+ is a statistical emission model able to calculate real-world emissions of road vehicles. The EnViVer tool [57] allowed the connection between the emission model of the VERSIT + tool and the scenarios simulated by the VISSIM software. It is a postprocessor that reads VISSIM output in the form of a vehicle protocol form.
The EnViVer output showed the impact of a traffic measurement on exhaust emissions in an “emissions” map.
The results are presented in Figure 13. The results are divided into 2 groups, the first one pertaining to days when the air quality in the area was classified as very good (according to the Polish Air Quality Index) (green dots), while the second group (red dots) covers measurements classified as moderate.
Looking at Figure 13, it is possible to state that the measurements of concentrations recorded in the vicinity of the traffic circle intersection on days when the air presented optimal characteristics were comparable to the results produced by the VERSIT+ model. Specifically, the deviations amounted to a maximum of about 20%, while on average about 10%.
For measurements at a distance of 200 m and more, the obtained differences in measurements from the model and actual tests increase and amount to approximately 40% on average.
There were large discrepancies between the results provided by the stations and those obtained from the tool. This was undoubtedly influenced by the meteorological conditions on the monitoring day in question, which were characterized by poor air movement. This led to a reduced dispersion of vehicle exhaust gases, so that pollutant concentrations remained close to the source of emission.
The smallest differences in the actual results in relation to the model results concern the distance of 100 to 150 m from the roundabout and amount to an average of 7 to 10% for moderate air.
Figure 14 shows the results of PM2.5 concentration for data from real trials for the roundabout area. They are not compared with the model results because it does not contain algorithms for calculating the concentrations of this size of particulate matter. All values for the ambient air of very good quality are within the limits of very good or good quality according to the Polish Air Quality Index. However, when there is a deterioration of the ambient air quality, for example, moderate, then while approaching the roundabout, an increase in PM2.5 concentration can be noticed, from the value of approximately 50 µg/m3, which corresponds to moderate quality, to the value of approximately 200 µg/m3, which is already a very bad quality and is particularly dangerous for human health.
The results of PM10 concentration from the VERSIT + calculation model for the developed roundabout model is shown in Figure 15. The maximum values of PM10 concentration for the two-lane roundabout model, according to the Polish Air Quality Index, are within the limits of sufficient quality. However, when referring these results to the CAQI index, both solutions rank in terms of a high-class index, that is, high environmental pollution.

Pollutant Impact Mitigation

PM concentration limits for air quality in Poland were determined on the basis of the Regulation of the Minister of the Environment of 24 August 2012 on the levels of certain substances in the air [45]. On the other hand, relating the measurements to exceedances of air pollutant concentration limits concerns the permissible number of such exceedances of the average daily limit value. However, due to the diversity of health effects of exposure to particulate matter, it is necessary to assess the dustiness of the air with averaging the measurement results over time. Even short-term exposure is dangerous, so it is important to continuously measure the exhaust gas emissions from vehicles driving on city thoroughfares. The health effects associated with short-term exposure to air which is polluted by particulate matters, according to the World Health Organization [58] are as follows:
  • respiratory problems,
  • pneumonia,
  • increased consumption of drugs,
  • increased number of deaths,
  • increased number of hospitalizations,
  • unfavorable changes in the circulatory system.
In contrast, the effects related to long-term exposure to particulate matter are as follows:
  • increased number of chronic symptoms of diseases of the upper respiratory tract,
  • decreased respiratory function of the lungs in children,
  • decreased respiratory function of the lungs in adults,
  • decrease life expectancy.
Due to the fact that Polish air is one of the worst in Europe in terms of pollution [59,60], efforts should be made to minimize the negative impact on the environment by motor vehicles, for example, through continuous monitoring of the current state and implementation of new infrastructure solutions that are more environmentally friendly.
The diurnal emission cycle in the city and the presence of traffic peaks on the main arteries of the city (inciting dust on street routes) have a significant impact on the daily course of air dust [58,61]. On the example of the researched roundabout, it can be seen that the highest emission of harmful components of exhaust gases from vehicles takes place near pedestrian crossings, which are located near the roundabout entrances. Therefore, it is important to influence the awareness of people who should prefer pro-ecological behavior on a daily basis.
One of the methods of limiting the emission and concentration of harmful exhaust components from vehicles is the use of such road infrastructure solutions that will have a better impact on the flow of traffic, while reducing the number of vehicle stops. In terms of the analyzed area of the roundabout, it would be reasonable to use a turbo roundabout solution.
Therefore, simulation analyses were carried out, adopting the basic principles that guide this type of solution to the model. The main direction of traffic was the north-south direction (this applies to the geometry of the turbo roundabout). The traffic volume for the turbo roundabout simulation scenario was the same as for the two-lane roundabout model. The results of the simulation are shown in Figure 16.
From Figure 16 it can be seen that this solution of roundabout would reduce the high concentration points of PM10 from 4 for a two-lane roundabout to 2 for a turbo roundabout. Unfortunately, it can be noticed that for roads that are less privileged (east-west direction) there was an increase in the length of the increased concentration of PM10. This state of affairs is because the traffic in the main directions is smoother; that means that there is less stop and go operations of vehicles.
In order to further search for a better solution to reduce the concentration of the roundabout area, an additional vehicle structure was created for the model of a two-lane roundabout, including electric cars. The idea of more common use of electric cars, especially in the field of urban mobility, is now popular all over the world [62,63,64,65]. The use of electric vehicles is the subject of numerous studies regarding both the improvement of vehicles and batteries [66,67] and the propensity of users [67,68,69,70] but also from the point of view of transport planning with the location of charging stations [71,72].
Germany has set itself a target of 6 million electric vehicles by 2030 [73].
The Norwegian mobility policy has led to an electric vehicle share of 50% of total vehicle sales [74]. In connection with numerous initiatives to popularize electric cars, the Polish government also applied certain subsidies to their purchase, as well as development plans for its own vehicle designs [41]. In Poland, the number of electric cars is growing. In 2019, the number of hybrid electric vehicles (HEVs) accounted for 7% of total sales [42].
Therefore, the simulation model assumed that 25% of vehicles in the current vehicle structure will be full electric. Electric vehicles replaced 25% of diesel vehicles. This state of affairs has an impact not only on the generation of PM10 concentration in the analyzed area, but also on the driving characteristics, because electric cars are characterized by a higher torque, which is available from zero speed [75]. Therefore, electric cars accelerate more dynamically, which translates into more smooth traffic. Therefore, the desired speed and acceleration parameters were modified in the micro-simulation model for the class of electric vehicles. This simulation scenario was implemented on a two-lane roundabout model with the same traffic volume assumption as for the previous simulations. The obtained concentration map for traffic on a two-lane roundabout, where the share of electric vehicles is 25%, is presented in Figure 17.
Determining the share of 25% of fully electric vehicles resulted in the fact that the PM10 concentration on most of the inlet and outlet roads from the roundabout is about 15 µg/m3, while it increases only in the scope of the roundabout itself, where it is about 75 µg/m3. Increasing the share of electric vehicles would therefore reduce the PM10 emissions from motor vehicle sources by approximately 30%. Based on Figure 17, a significant reduction in the length of high PM10 concentration can also be observed. In fact, its highest concentration is within the entrance and exit of the roundabout. Popularizing and increasing the share of electric vehicles in the city, in particular in terms of crossing intersections, in the analyzed case of roundabouts would be of great benefit for pedestrians, as it would result in lower values of particulate matters concentration within pedestrian crossings and pavements located along the road.
Due to this state of affairs, most of the studied area in this case has a very low status of air pollutants in the CAQI scale of the air quality index. This confirms the current global policy on electromobility, which should apply in particular to inner-city areas.

5. Conclusions

The effects of air pollution on human health, particularly on overall mortality, have been known for years, especially because of the enormous health impact of some severe pollution episodes in the 1930s through the 1950s.
However, as shown by recent epidemiological studies, cities are still to be considered at risk due to different types of pollutants including vehicular emissions.
Over the years we have seen the definition of restrictive regulations on traffic pollution with the use of mitigation strategies and the dissemination of urban planning and transport characterized by road geometries with fewer stop and gos. Moreover, the development of new forms of vehicle power supply has significantly reduced pollutant emissions.
The comparative analysis of traffic scenarios allows evaluating in a predictive way the best strategy to be adopted in the field of infrastructure management and urban planning policies of cities.
The comparison of road intersections in terms supporting the use of software to bring out some considerations arising directly or indirectly from the geometry investigated.
Based on the conducted analyses of the real tests and simulation results, it follows that:
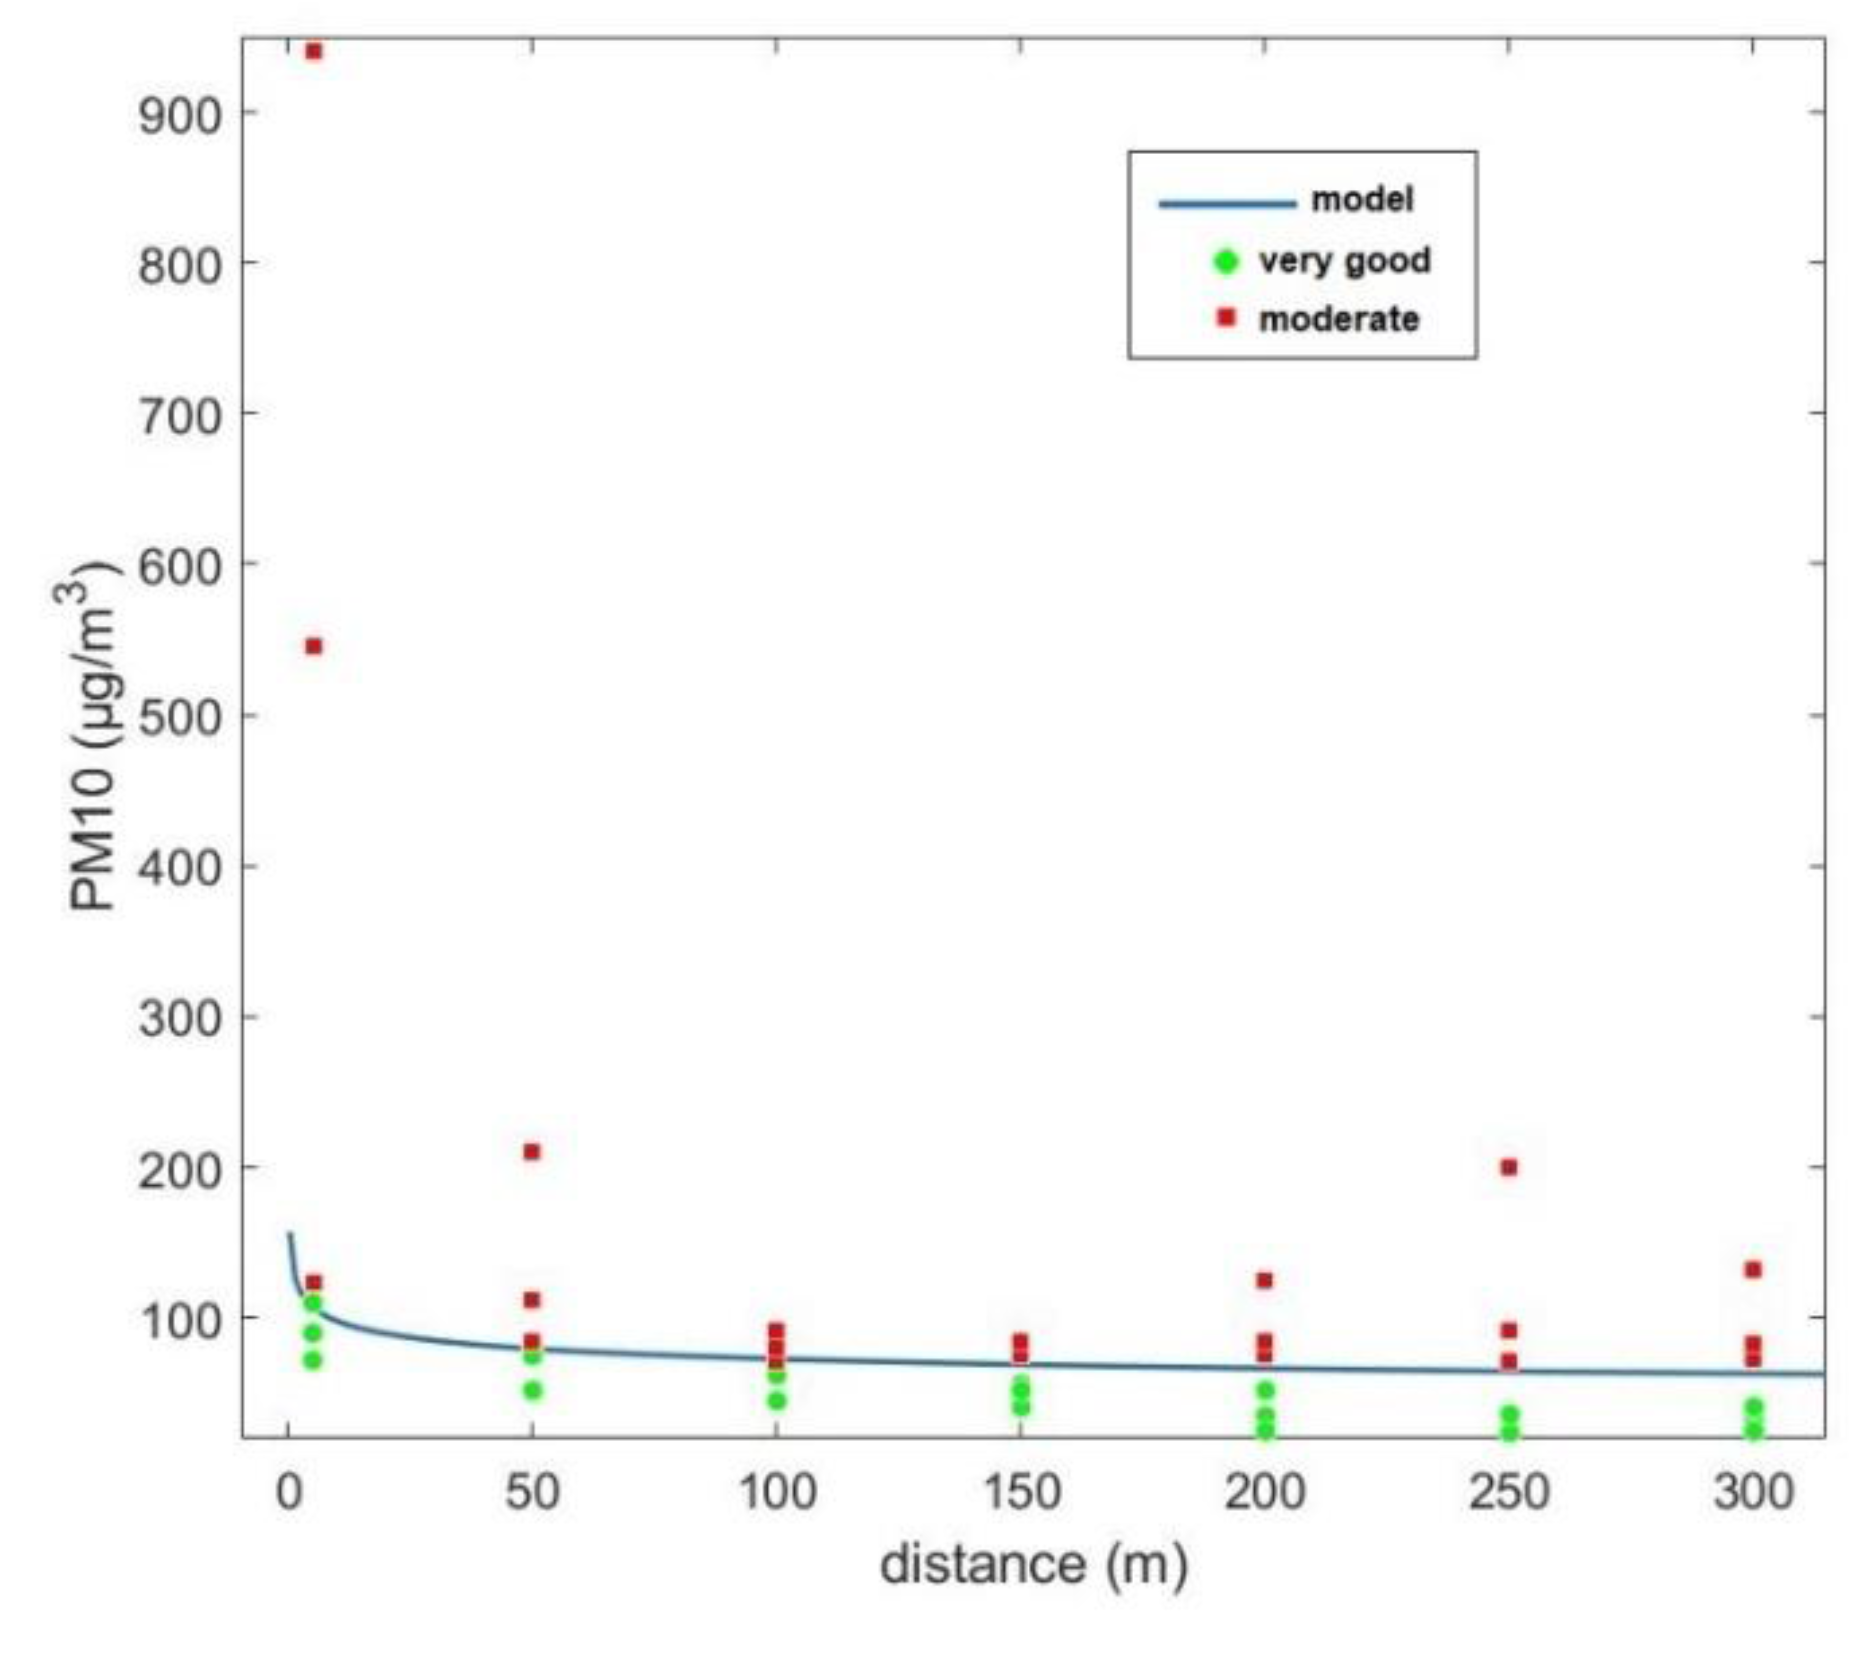
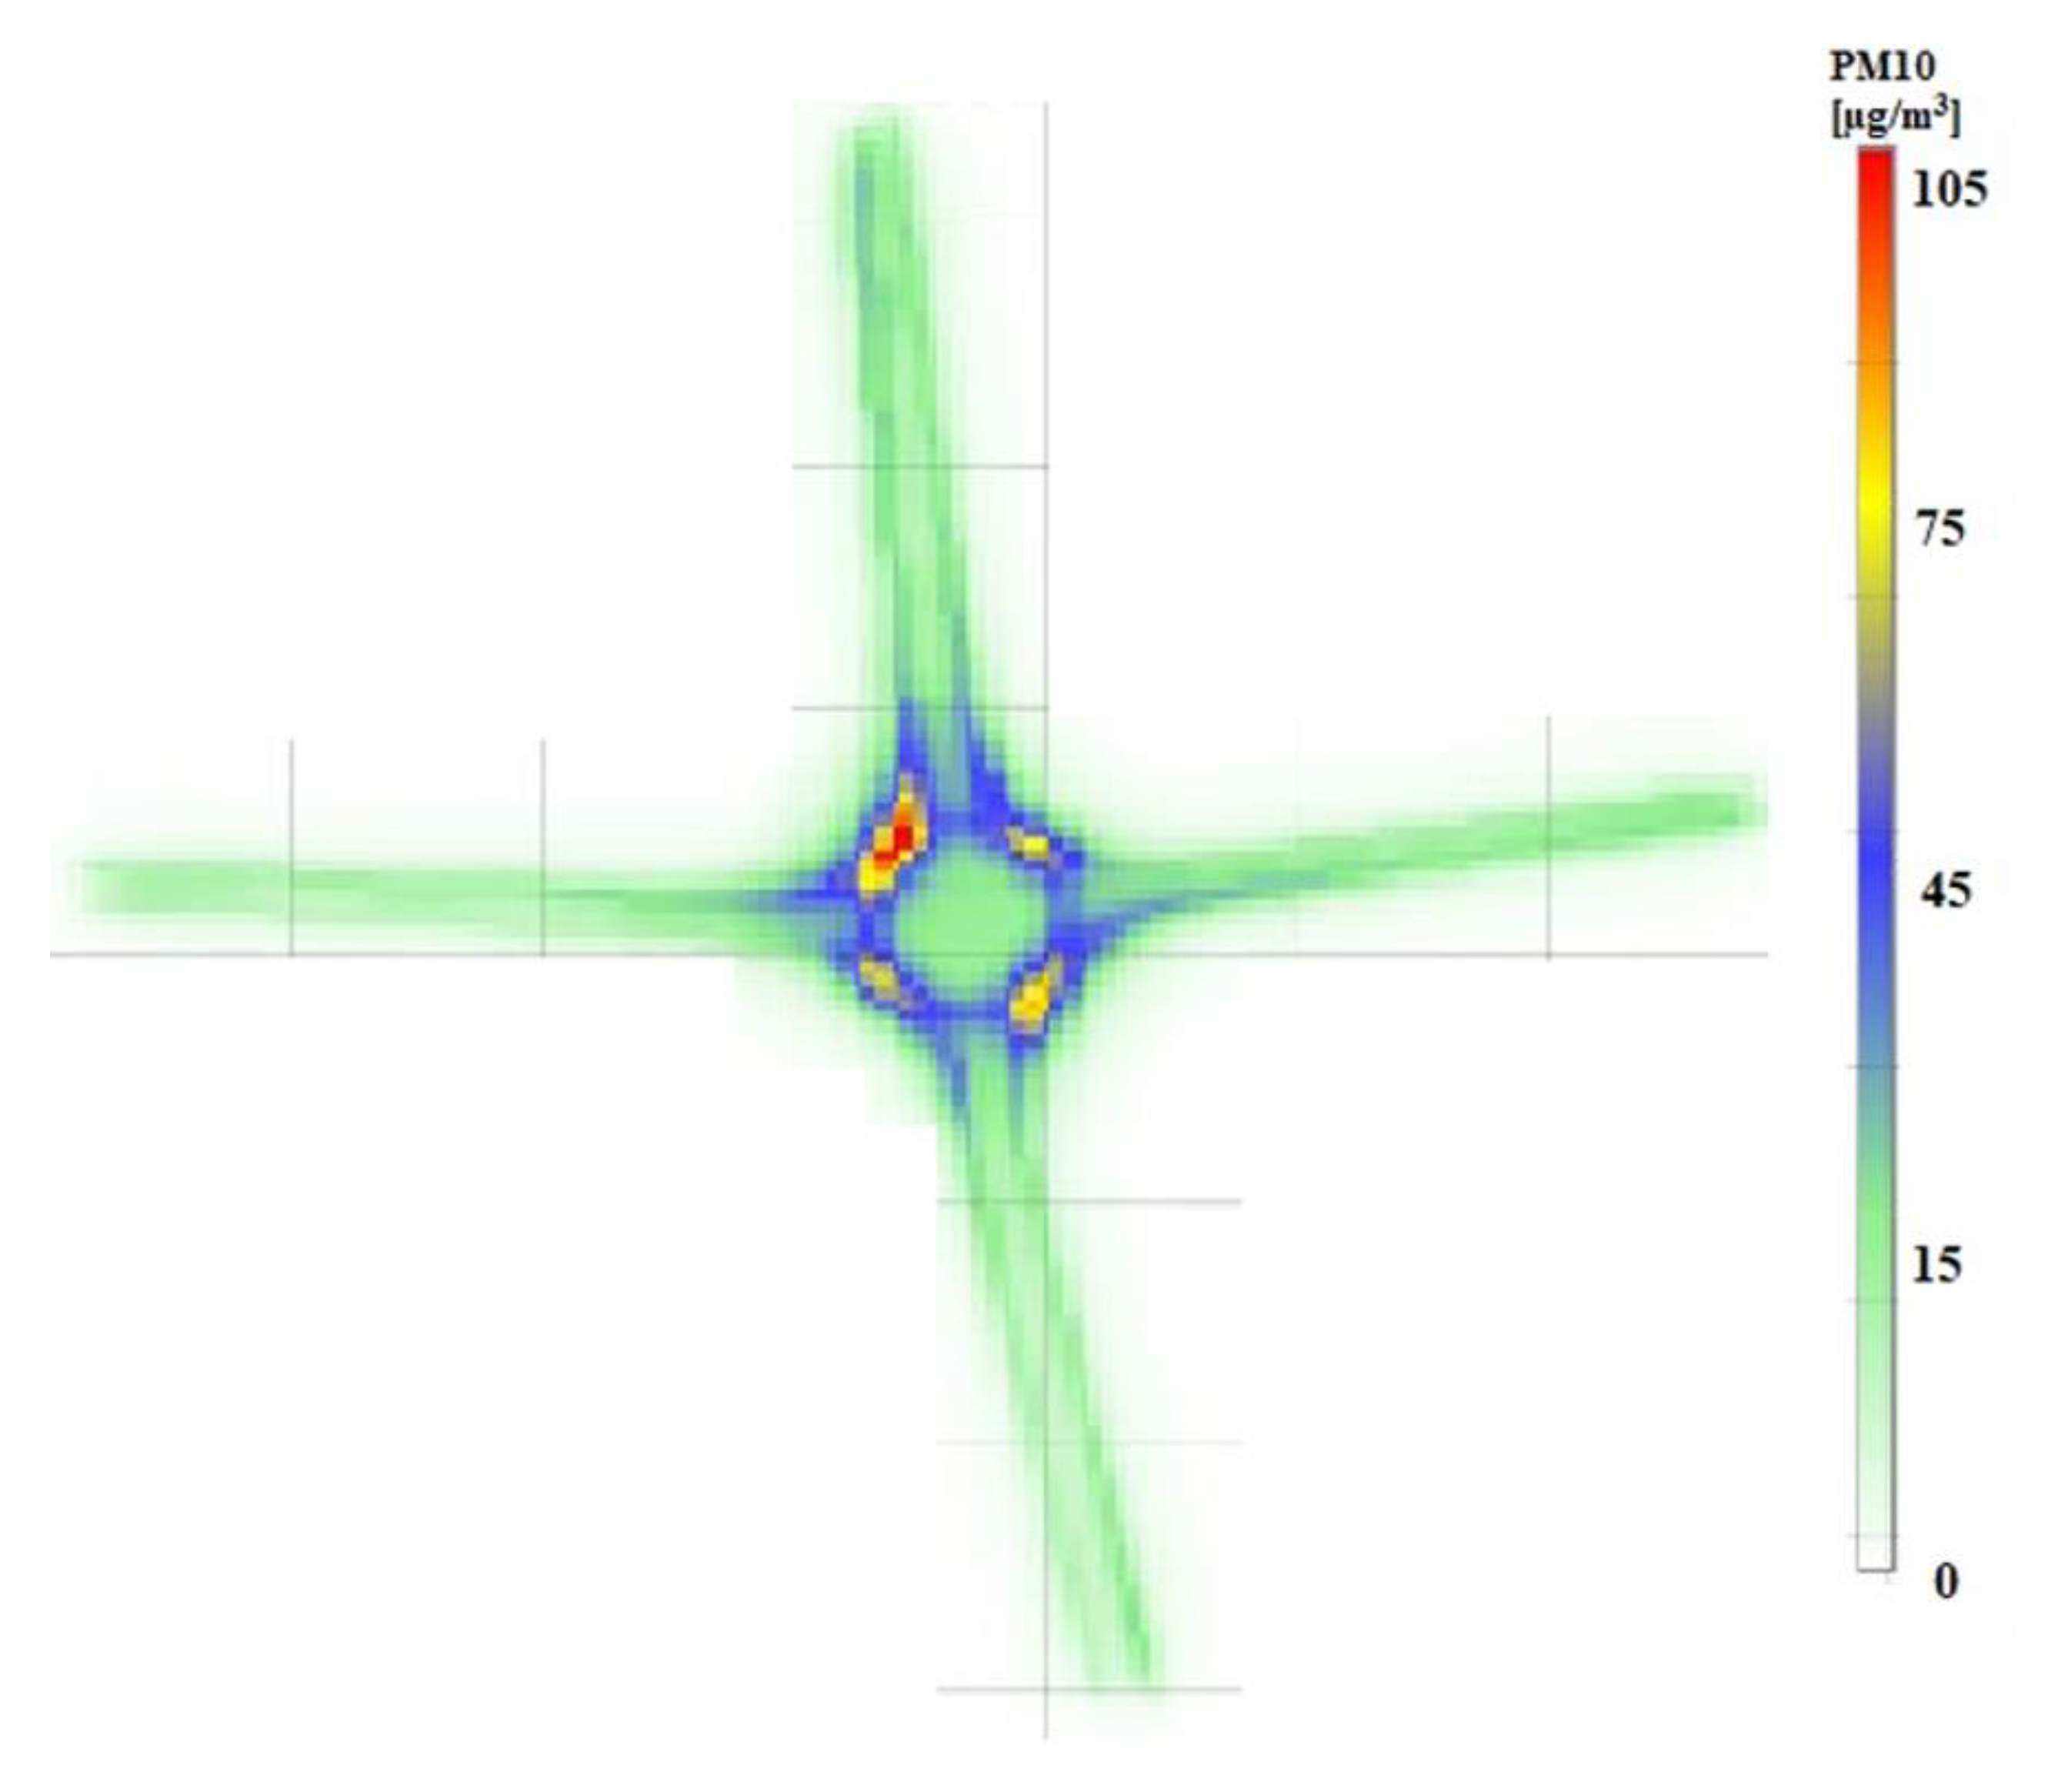
  • the results of PM10 concentration from motor vehicles depend on the air quality for the ambient background, which is influenced by for example, wind force,
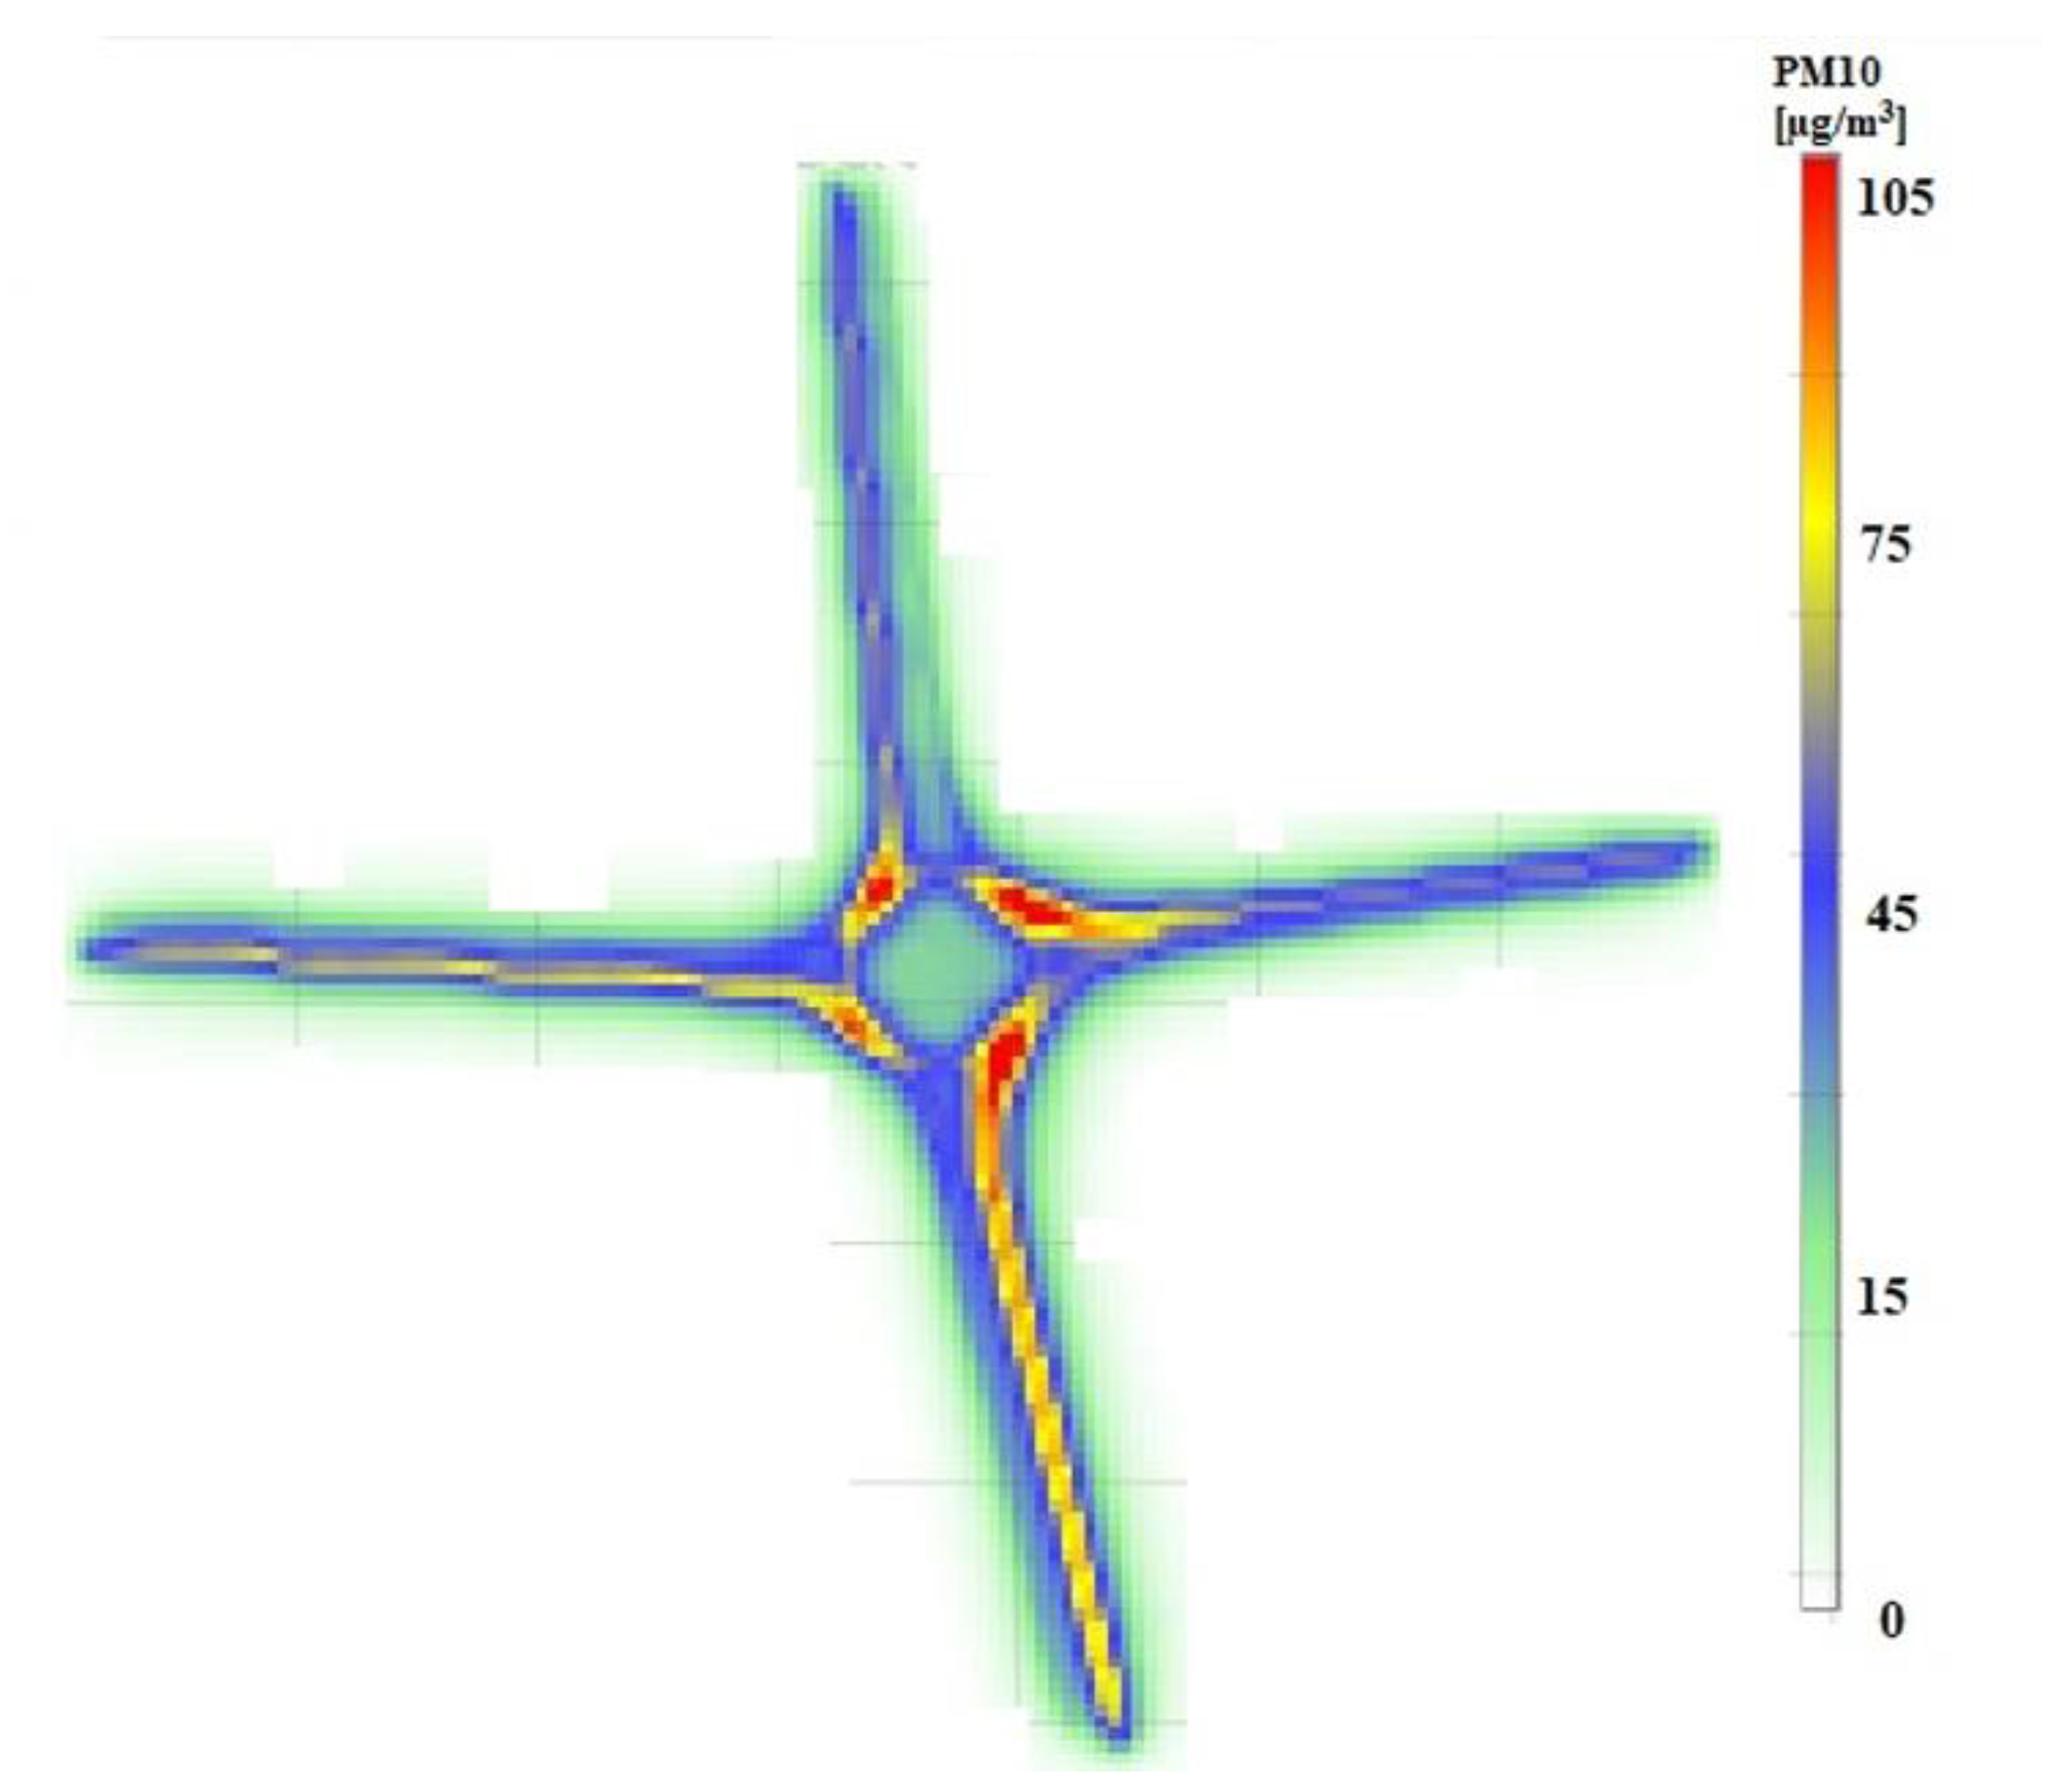
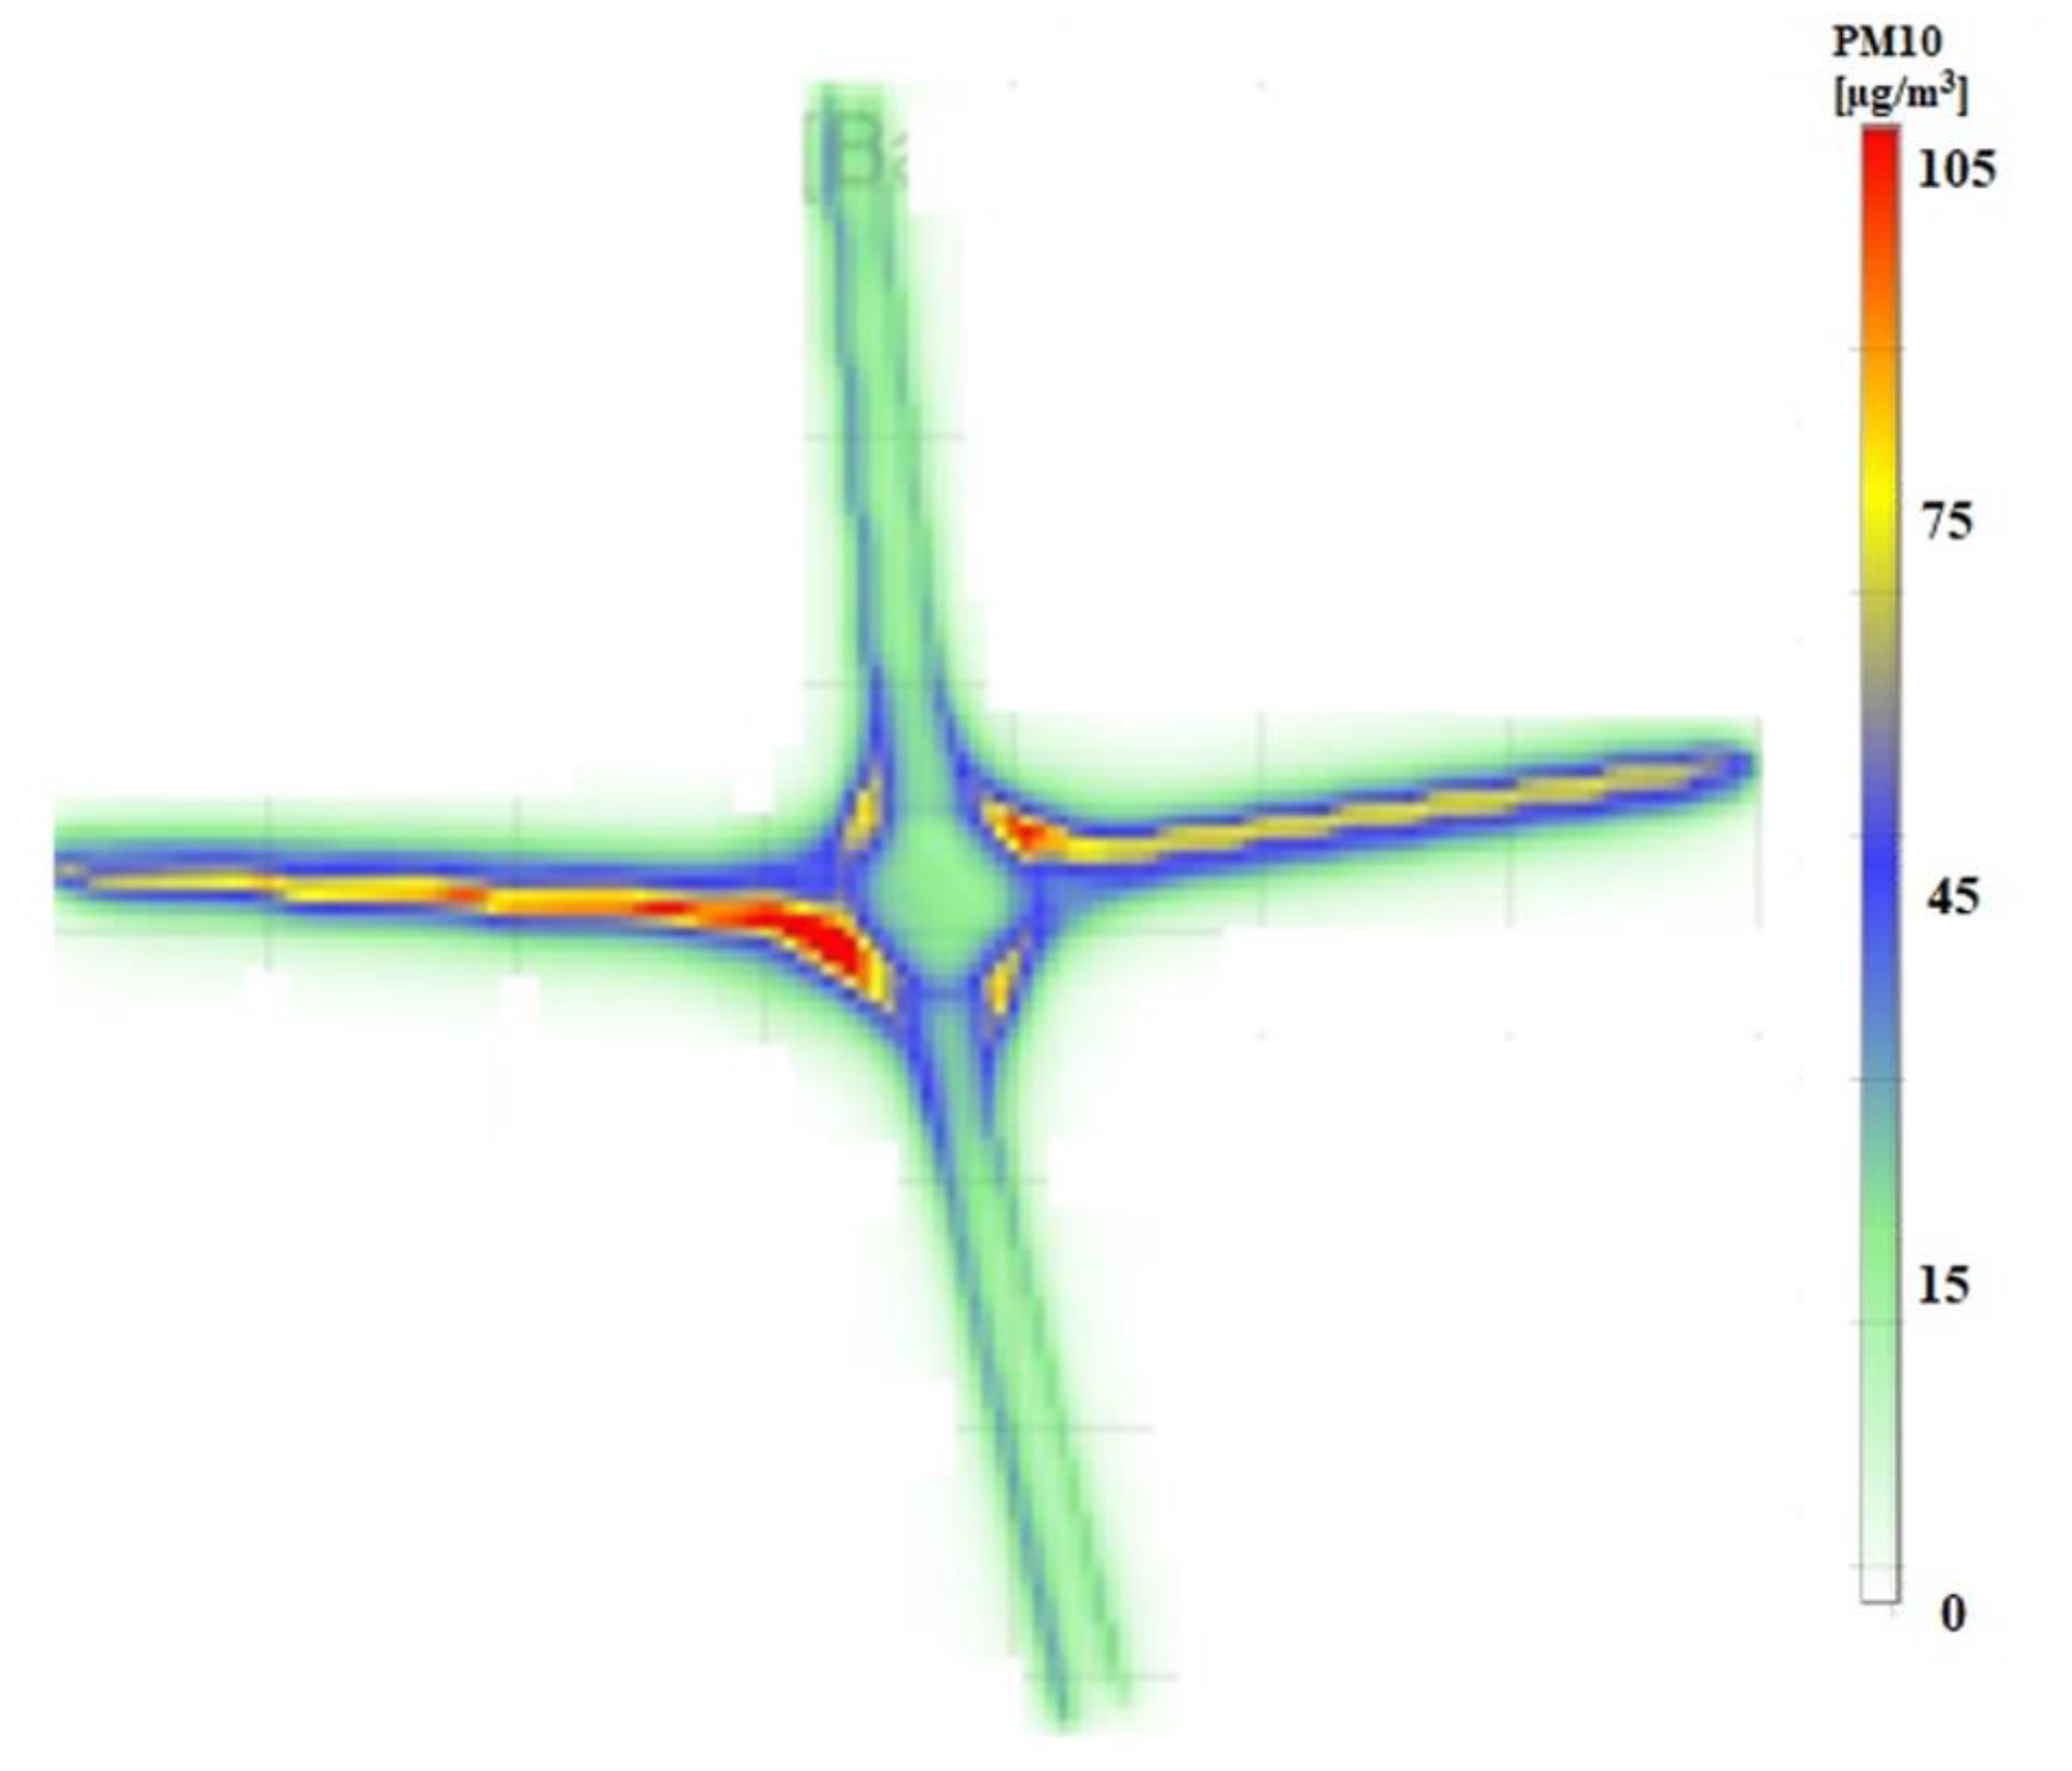
  • it is possible to improve air quality for the area of roundabouts and reduce PM10 higher concentration points from 4 to 2 by applying newer infrastructure solutions such as turbo roundabouts,
  • a significant improvement in air quality is possible if we replace diesel engines with fully electric cars; especially on inlet and outlet roads of roundabouts, it can lead to reducing of PM10 concentration by about 30%, and
  • the preparation of concentration maps and their analysis in relation to various solutions would allow for a better location of pedestrian crossings and minimize the harmfulness of exhaust gases to the health of pedestrians.
From the results of the analyses conducted, it can be seen that the greatest benefits in terms of reducing harmful exhaust components (particulate matter is considered in this analysis) come from increasing the share of all-electric vehicles. The development trends of many countries in the world include the electrification of vehicles, thus replacing internal combustion vehicles. It should be considered whether these changes are not taking place too slowly, because now on the car market there are many models that use only the electric motor. Future legislative efforts i.e., EU countries should focus on the further reduction of vehicles with internal combustion engines in favor of electric drive, because such a solution is necessary to significantly reduce the impact of exhaust emission from transport on the environment and human health.
The varied use of different air quality indexes also indicates the need to create a new global air quality index, such that regardless of geographic location, it would have the same impact on human health and the environment.
The limitations and, at the same time, goals for future research are to compare other types of roundabouts in terms of the emission of harmful exhaust components from vehicles, for example, the flower roundabout. It is also necessary to conduct this type of analysis for other days of the week, taking into account the traffic of heavy vehicles and buses and also a different percentage of electric vehicles. For development purposes, the analysis of traffic calming action, for example, zone-30 signs etc. would also be beneficial.

Author Contributions

Conceptualization, T.C. and M.M.; methodology, A.J.; software, M.M. and T.C.; validation, G.T., A.J., T.C. and M.M.; formal analysis, G.T. and A.J.; investigation, A.J. and M.M.; resources, A.J., T.C. and M.M.; data curation, A.J.; writing—original draft preparation, M.M. and T.C.; writing—review and editing, G.T., M.M. and T.C.; visualization, M.M.; supervision, G.T. All authors have read and agreed to the published version of the manuscript.

Funding

This work was supported by the Ministry of Infrastructure and Development as part of the Eastern Poland Development Operational Program in association with the European Regional Development Fund, which financed the research instruments.

Institutional Review Board Statement

Not applicable.

Informed Consent Statement

Not applicable.

Data Availability Statement

Data is contained within the article.

Conflicts of Interest

The authors declare no conflict of interest.

References

  1. Tibaquirá, J.E.; Huertas, J.I.; Ospina, S.; Quirama, L.F.; Niño, J.E. The Effect of Using Ethanol-Gasoline Blends on the Mechanical, Energy and Environmental Performance of In-Use Vehicles. Energies 2018, 11, 221. [Google Scholar] [CrossRef] [Green Version]
  2. Giechaskiel, B.; Suarez-Bertoa, R.; Lahde, T.; Clairotte, M.; Carriero, M.; Bonnel, P.; Maggiore, M. Emissions of a Euro 6b Diesel Passenger Car Retrofitted with a Solid Ammonia Reduction System. Atmosphere 2019, 10, 180. [Google Scholar] [CrossRef] [Green Version]
  3. Merkisz, J.; Bielaczyc, P.; Pielecha, J.; Woodburn, J. RDE Testing of Passenger Cars: The Effect of the Cold Start on the Emissions Results; SAE Technical Paper 2019-01-0747; SAE International: Warrendale, PA, USA, 2019. [Google Scholar] [CrossRef]
  4. Bielaczyc, P.; Merkisz, J.; Pielecha, J.; Woodburn, J. RDE-Compliant PEMS Testing of a Gasoline Euro 6d-TEMP Passenger Car at Two Ambient Temperatures with a Focus on the Cold Start Effect; SAE Technical Paper 2020-01-0379; SAE International: Warrendale, PA, USA, 2020. [Google Scholar] [CrossRef]
  5. Lee, H.; Lee, K. Comparative Evaluation of the Effect of Vehicle Parameters on Fuel Consumption under NEDC and WLTP. Energies 2020, 13, 4245. [Google Scholar] [CrossRef]
  6. Cubito, C.; Millo, F.; Boccardo, G.; Di Pierro, G.; Ciuffo, B.; Fontaras, G.; Serra, S.; Otura Garcia, M.; Trentadue, G. Impact of Different Driving Cycles and Operating Conditions on CO2 Emissions and Energy Management Strategies of a Euro-6 Hybrid Electric Vehicle. Energies 2017, 10, 1590. [Google Scholar] [CrossRef]
  7. Liu, X.; Zhao, F.; Hao, H.; Chen, K.; Liu, Z.; Babiker, H.; Amer, A.A. From NEDC to WLTP: Effect on the Energy Consumption, NEV Credits, and Subsidies Policies of PHEV in the Chinese Market. Sustainability 2020, 12, 5747. [Google Scholar] [CrossRef]
  8. Jaworski, A.; Mądziel, M.; Kuszewski, H.; Lejda, K.; Jaremcio, M.; Balawender, K.; Jakubowski, M.; Wos, P.; Lew, K. The Impact of Driving Resistances on the Emission of Exhaust Pollutants from Vehicles with the Spark Ignition Engine Fueled with Petrol and LPG; SAE Technical Paper 2020-01-2206; SAE International: Warrendale, PA, USA, 2020. [Google Scholar] [CrossRef]
  9. Jaworski, A.; Mądziel, M.; Kuszewski, H.; Lejda, K.; Balawender, K.; Jaremcio, M.; Jakubowski, M.; Wojewoda, P.; Lew, K.; Ustrzycki, A. Analysis of Cold Start Emission from Light Duty Vehicles Fueled with Gasoline and LPG for Selected Ambient Temperatures; SAE Technical Paper 2020-01-2207; SAE International: Warrendale, PA, USA, 2020. [Google Scholar] [CrossRef]
  10. Fuel Types of New Cars: Petrol +11.9%, Diesel −3.7%, electric +80.5% in Fourth Quarter of 2019. Available online: https://www.acea.be/press-releases/article/fuel-types-ofnew-cars-petrol-11.9-diesel-3.7-electric-81.3-in-fourth-quart (accessed on 21 November 2020).
  11. European Environment Agency, Air Quality in Europe—2019 Report. Available online: https://www.eea.europa.eu/publications/air-quality-in-europe-2019 (accessed on 1 November 2020).
  12. European Commission: Climate Change: Report. Europe: Directorate-General for Communication, Brussels, Belgium. 2011. Available online: https://ec.europa.eu/commfrontoffice/publicopinion/archives/ebs/ebs_372_en.pdf (accessed on 1 November 2020).
  13. Savostin-Kosiak, D.; Mądziel, M.; Jaworski, A.; Ivanushko, O.; Tsiuman, N.; Loboda, A. Establishing the regularities of correlation between ambient temperature and fuel consumption by city diesel buses. East. Eur. J. Enterp. Technol. 2020, 6, 23–32. [Google Scholar]
  14. Żak, M.; Mainka, A. Cross-Regional Highway Built through a City Centre as an Example of the Sustainable Development of Urban Transport. Sustainability 2020, 12, 10403. [Google Scholar] [CrossRef]
  15. Jain, P.C. Greenhouse effect and climate change: Scientific basis and overview. Renew. Energy 1993, 3, 403–420. [Google Scholar] [CrossRef]
  16. Saxena, A.K. Greenhouse Gas Emissions—Estimation and Reduction. Asian Productivity Organization. 2009. Available online: https://www.apo-tokyo.org/00e-books/GP-19_GHG_Manual/GP-19_GHG_Manual.pdf (accessed on 1 November 2020).
  17. Lindley, A.A.; McCulloch, A. Regulating to reduce emissions of fluorinated greenhouse gases. J. Fluor. Chem. 2005, 126, 1457–1462. [Google Scholar] [CrossRef]
  18. Venkataraman, S.V.; Iniyan, S.; Goic, R. A review of climate change, mitigation and adaptation. Renew. Sustain. Energy Rev. 2012, 16, 878–897. [Google Scholar] [CrossRef]
  19. Wei, Z.; Jiangming, M.; Yunting, F.; Xiankai, L.; Hui, W. Effects of nitrogen deposition on the greenhouse gas fluxes from forest soils. Acta Ecol. Sin. 2008, 28, 2309–2319. [Google Scholar] [CrossRef]
  20. Mathissen, M.; Grigoratos, T.; Lahde, T.; Vogt, R. Brake Wear Particle Emissions of a Passenger Car Measured on a Chassis Dynamometer. Atmosphere 2019, 10, 556. [Google Scholar] [CrossRef] [Green Version]
  21. Zhao, Y.; Li, X.; Hu, S.; Ma, C. Effects of the Particulate Matter Index and Particulate Evaluation Index of the Primary Reference Fuel on Particulate Emissions from Gasoline Direct Injection Vehicles. Atmosphere 2019, 10, 111. [Google Scholar] [CrossRef] [Green Version]
  22. Grigoratos, T.; Agudelo, C.; Grochowicz, J.; Gramstat, S.; Robere, M.; Perricone, G.; Sin, A.; Paulus, A.; Zessinger, M.; Hortet, A.; et al. Statistical Assessment and Temperature Study from the Interlaboratory Application of the WLTP–Brake Cycle. Atmosphere 2020, 11, 1309. [Google Scholar] [CrossRef]
  23. Noland, R.B.; Quddus, M. Flow improvements and vehicle emissions: Effects of trip generation and emission control technology. Transp. Res. D 2006. [Google Scholar] [CrossRef] [Green Version]
  24. Smit, R.; Ntziachristos, L.; Boulter, R. Validation of road vehicle and traffic emission models—A review and meta-analysis. Atmos. Environ. 2010, 38, 48–64. [Google Scholar] [CrossRef]
  25. Mądziel, M.; Jaworski, A.; Savostin-Kosiak, D.; Lejda, K. The Impact of Exhaust Emission from Combustion Engines on the Environment: Modelling of Vehicle Movement at Roundabouts. Int. J. Automot. Mech. Eng. 2020, 17, 8360–8371. [Google Scholar] [CrossRef]
  26. Fernandes, P.; Salamati, K.; Rouphail, N.M.; Coelho, M.C. Identification of emission hotspots in roundabouts corridors. Transp. Res. D 2015. [Google Scholar] [CrossRef]
  27. Tollazzi, T.; Guerrieri, M.; Jovanović, G.; Renčelj, M. Functions, Capacities, and Traffic Safety Characteristics of Some Types of Two-Level Roundabouts. Sustainability 2020, 12, 6914. [Google Scholar] [CrossRef]
  28. Campisi, T.; Tesoriere, G.; Canale, A. The variability of Level of Service and Surrogate Safety Assessment of urban turbo-roundabout with BRT system. J. Multidiscip. Eng. Sci. Technol. 2018, 5, 8861–8869. [Google Scholar]
  29. Tesoriere, G.; Campisi, T.; Canale, A.; Zgrablić, T. The Surrogate Safety Appraisal of the Unconventional Elliptical and Turbo Roundabouts. J. Adv. Transp. 2018, 2018, 2952074. [Google Scholar] [CrossRef] [Green Version]
  30. Smit, R.; Smokers, R.; Shoen, E.; Hensema, A. A new modelling approach for road traffic emissions: VERSIT + LD—background and methodology. Transport. Res. D Tr. E 2006, 12, 414–422. [Google Scholar] [CrossRef]
  31. Polish Air Quality Index. Available online: www.gios.gov.pl (accessed on 21 November 2019).
  32. Elshout, S.; Bartelds, H.; Hermann, H.; Leger, K. CAQI Air Quality Index Comparing Urban Air Quality across Borders—2012. European Union European Regional Development Fund Regional Initiative Project 2012. Available online: https://www.airqualitynow.eu/download/CITEAIR-Comparing_Urban_Air_Quality_across_Borders.pdf (accessed on 2 November 2020).
  33. PTV Group. PTV Vissim 2020 User Manual; PTV Group: Karlsruhe, Germany, 2020; p. 1278. [Google Scholar]
  34. Smieszek, M.; Dobrzanska, M.; Dobrzanski, P. Rzeszow as a city taking steps towards developing sustainable public transport. Sustainability 2019, 11, 402. [Google Scholar] [CrossRef] [Green Version]
  35. Fortuijn, L. Turbo roundabouts: Design principles and safety performance. Transp. Res. Rec. J. Transp. Res. Board 2009, 2096, 16–24. [Google Scholar] [CrossRef]
  36. Fortuijn, L. Turbo roundabouts: Estimation of capacity. Transp. Res. Rec. J. Transp. Res. Board 2009, 83–92. [Google Scholar] [CrossRef]
  37. Campisi, T.; Tesoriere, G.; Canale, A. Microsimulation approach for BRT system: The case study of urban turbo roundabout. In AIP Conference Proceedings; AIP Publishing LLC: Melville, NY, USA, 2017; Volume 1906, p. 190005. [Google Scholar]
  38. Campisi, T.; Canale, A.; Tesoriere, G.; Renčelj, M. The newest public transport system applied to turbo roundabouts. In Engineering Sustainability; Thomas Telford Ltd.: London, UK, 2020. [Google Scholar]
  39. Cumming, B. Roundabouts: Why they are dangerous for cyclists and what can be done about it. Transp. Eng. Aust. 2011, 13, 27. [Google Scholar]
  40. First Registrations of Used PC (Imported to Poland) 2019–2020. Available online: https://www.pzpm.org.pl/en/Automotivemarket/Used-Passenger-Car-Import-to-Poland/First-Registrations-of-Used-PC-imported-to-Poland2/FirstRegistrations-of-Used-PC-imported-to-Poland-2019-2020-pdf (accessed on 10 June 2020).
  41. Wappelhorst, S.; Pniewska, I. Emerging Electric Passenger Car Markets in Europe: Can Poland Lead the Way? Working Paper 2020–2019; International Council on Clean Transportation: San Francisco, CA, USA, 2020. [Google Scholar]
  42. Information Regarding Number of Electric Vehicles in Poland. Available online: https://www.statista.com/statistics/1081299/poland-number-of-electric-passenger-vehicles/ (accessed on 1 December 2020).
  43. Inquinamento Delle Auto Elettriche. Available online: https://www.cism.it/media/filer_public/8c/69/8c69263b-da1f-4cfd-a9b0-46093509882f/auto_elt_mar_19.pdf (accessed on 10 November 2020).
  44. CEM DT-9881M Analyzer. Available online: https://www.atal.nl/media/downloads/mn/cem/AT-DT-9880-9881.pdf (accessed on 21 November 2020).
  45. Regulation of the Minister of the Environment of 24 August 2012 on the Levels of Certain Substances in the Air. Available online: http://www.fao.org/faolex/results/details/en/c/LEX-FAOC129545/ (accessed on 21 November 2020).
  46. Quaassdorff, C.; Borge, R.; Pérez, J.; Lumbreras, J.; de la Paz, D.; de Andrés, J.M. Microscale traffic simulation and emission estimation in a heavily trafficked roundabout in Madrid (Spain). Sci. Total Environ. 2016, 566, 416–427. [Google Scholar] [CrossRef]
  47. Minoura, H.; Takekawa, H.; Terada, S. Roadside nanoparticles corresponding to vehicle emissions during one signal cycle. Atmos. Environ. 2009, 3, 43. [Google Scholar] [CrossRef]
  48. Li, X.; Li, G.; Pang, S.; Yang, X.; Tian, J. Signal timing of intersections using integrated optimization of traffic quality, emissions and fuel consumption: A note. Transp. Res. D 2004, 9. [Google Scholar] [CrossRef]
  49. Campisi, T.; Deluka-Tibljaš, A.; Tesoriere, G.; Canale, A.; Rencelj, M.; Šurdonja, S. Cycling traffic at turbo roundabouts: Some considerations related to cyclist mobility and safety. Transp. Res. Procedia 2020, 45, 627–634. [Google Scholar] [CrossRef]
  50. Campisi, T.; Canale, A.; Tesoriere, G. Study of emergency setting for urban facility using microsimulation tool. In AIP Conference Proceedings; AIP Publishing LLC: Melville, NY, USA, 2017; Volume 1906, p. 190004. [Google Scholar]
  51. Elhassy, Z.; Abou-Senna, H.; Shaaban, K.; Radwan, E. The Implications of Converting a High-Volume Multilane Roundabout into a Turbo Roundabout. J. Adv. Transp. 2020, 2020, 5472806. [Google Scholar] [CrossRef]
  52. Jaworski, A.; Lejda, K.; Mądziel, M. Emission of pollution from motor vehicles with respect to selected solutions of roundabout intersections Polish Scientific Society of Combustion Engines. Combust. Engines 2017, 1, 140–144. [Google Scholar]
  53. Rzeszow Public Road Administration. Available online: https://mzd.erzeszow.pl (accessed on 21 November 2020).
  54. Polish Local Data Bank. Available online: https://bdl.stat.gov.pl (accessed on 21 November 2020).
  55. Ahad, N.; Alipiah, F.; Azhari, F. Applicability of G-test in analyzing categorical variables. In AIP Conference Proceedings; AIP Publishing: Melville, NY, USA, 2019. [Google Scholar]
  56. Eijk, A.; Ligterink, N.; Inanc, S. EnViVer 4.0 Pro and Enterprise Manual; TNO: The Hague, The Netherlands, 2013. [Google Scholar]
  57. Eijk, A.R.A.; Stelwagen, U. EnViVer Voor Vlaanderen Ontwikkeling van Vlaamse EnViVer Emissiemodellen (No. TNO 2018 R11237). TNO. 2018. Available online: https://repository.tno.nl/islandora/object/uuid%3A74d3138b-bbf7-4f85-8d39-afd23cb8190a (accessed on 1 November 2020).
  58. Krzemińska, M. Jakość podstawowych elementów środowiska. In Opracowanie w oparciu o sprawozdanie Zakładu Ekologii Instytutu Meterologii i Gospodarki Wodnej; Oddział we Wrocławiu, Instytut Ochrony Środowiska: Warszawa, Poland, 2008. [Google Scholar]
  59. European Environment Agency. Air Quality in Europe—2016 Report. Available online: https://www.eea.europa.eu/publications/air-quality-in-europe-2016 (accessed on 2 November 2020).
  60. Wdowiak, A.; Wdowiak, E.; Sadowska, M.; Bojar, I. Legal Aspects of Protection against Air Pollution in Poland. Eur. J. Med. Technol. 2018, 1, 18. [Google Scholar]
  61. Jaworski, A.; Mądziel, M.; Lejda, K. Creating an emission model based on portable emission measurement system for the purpose of a roundabout. Environ. Sci. Pollut. Res. 2019, 26, 21641. [Google Scholar] [CrossRef] [Green Version]
  62. Van Mierlo, J. The World Electric Vehicle Journal, The Open Access Journal for the e-Mobility Scene. World Electr. Veh. J. 2018, 9, 1. [Google Scholar] [CrossRef] [Green Version]
  63. Berckmans, G.; Messagie, M.; Smekens, J.; Omar, N.; Vanhaverbeke, L.; Van Mierlo, J. Cost Projection of State of the Art Lithium-Ion Batteries for Electric Vehicles Up to 2030. Energies 2017, 10, 1314. [Google Scholar] [CrossRef] [Green Version]
  64. Xu, G.; Li, W.; Xu, K.; Song, Z. An Intelligent Regenerative Braking Strategy for Electric Vehicles. Energies 2011, 4, 1461–1477. [Google Scholar] [CrossRef] [Green Version]
  65. Xiong, R.; Sharkh, S.M.; Zhang, X. Research Progress on Electric and Intelligent Vehicles. Energies 2018, 11, 1762. [Google Scholar] [CrossRef] [Green Version]
  66. Löbberding, H.; Wessel, S.; Offermanns, C.; Kehrer, M.; Rother, J.; Heimes, H.; Kampker, A. From Cell to Battery System in BEVs: Analysis of System Packing Efficiency and Cell Types. World Electr. Veh. J. 2020, 11, 77. [Google Scholar] [CrossRef]
  67. Yodwong, B.; Thounthong, P.; Guilbert, D.; Bizon, N. Differential Flatness-Based Cascade Energy/Current Control of Battery/Supercapacitor Hybrid Source for Modern e–Vehicle Applications. Mathematics 2020, 8, 704. [Google Scholar] [CrossRef]
  68. Campisi, T.; Torrisi, V.; Ignaccolo, M.; Inturri, G.; Tesoriere, G. University propensity assessment to car sharing services using mixed survey data: The Italian case study of Enna city. Transp. Res. Procedia 2020, 47, 433–440. [Google Scholar] [CrossRef]
  69. Hasan, S.; Simsekoglu, Ö. The role of psychological factors on vehicle kilometer travelled (VKT) for battery electric vehicle (BEV) users. Res. Transp. Econ. 2020, 82, 100880. [Google Scholar] [CrossRef]
  70. Campisi, T.; Ignaccolo, M.; Tesoriere, G.; Inturri, G.; Torrisi, V. The Evaluation of Car-Sharing to Raise Acceptance of Electric Vehicles: Evidences from an Italian Survey among University Students (No. 2020-24-0021); SAE Technical Paper; SAE International: Warrendale, PA, USA, 2020. [Google Scholar]
  71. Campisi, T.; Ignaccolo, M.; Inturri, G.; Tesoriere, G.; Torrisi, V. The Growing Urban Accessibility: A Model to Measure the Car Sharing Effectiveness Based on Parking Distances. In Proceedings of the 20th International Conference on Computational Science and Its Applications, Cagliari, Italy, 1–4 July 2020. [Google Scholar]
  72. Ala, G.; Di Filippo, G.; Viola, F.; Giglia, G.; Imburgia, A.; Romano, P.; Castiglia, V.; Pellitteri, F.; Schettino, G.; Miceli, R. Different Scenarios of Electric Mobility: Current Situation and Possible Future Developments of Fuel Cell Vehicles in Italy. Sustainability 2020, 12, 564. [Google Scholar] [CrossRef] [Green Version]
  73. Kemfert, C. Promoting Electric Vehicles in Germany via Subsidies—An Efficient Strategy? CESifo DICE Report 4. 2016. Available online: https://www.econstor.eu/bitstream/10419/167287/1/ifo-dice-report-v14-y2016-i4-p65-70.pdf (accessed on 2 November 2020).
  74. Pelegov, D.V.; Pontes, J. Main Drivers of Battery Industry Changes: Electric Vehicles—A Market Overview. Batteries 2018, 4, 65. [Google Scholar] [CrossRef] [Green Version]
  75. Hwang, M.-H.; Lee, H.-S.; Cha, H.-R. Analysis of Torque Ripple and Cogging Torque Reduction in Electric Vehicle Traction Platform Applying Rotor Notched Design. Energies 2018, 11, 3053. [Google Scholar] [CrossRef] [Green Version]
Figure 1. Flow chart of research.
Energies 14 01046 g001
Figure 2. Satellite image of the researched roundabout with the marked outer diameter.
Energies 14 01046 g002
Figure 3. Example of turbo-roundabout located in Maribor-Slovenia.
Energies 14 01046 g003
Figure 4. Researched roundabouts solutions modelled in Vissim: (a) two-lane (b) turbo (red dots are conflict points).
Energies 14 01046 g004
Figure 5. E-vehicle share on each region of Poland in 2019. Based on [41].
Energies 14 01046 g005
Figure 6. Trend of battery electric vehicles (BEVs) and plug-in hybrid electric vehicles (PHEVs) during the period May 2019 to July 2020.
Energies 14 01046 g006
Figure 7. Photograph of sample results in the monitored area.
Energies 14 01046 g007
Figure 8. Place of measurement of particulate matter (PM) concentrations for the researched case study roundabout.
Energies 14 01046 g008
Figure 9. Cumulative frequency distribution of the desired speed of the real test data.
Energies 14 01046 g009
Figure 10. Structure of EURO emission standards of vehicles for the studied case.
Energies 14 01046 g010
Figure 11. The speed for road tests, model and calibrated data.
Energies 14 01046 g011
Figure 12. The acceleration for road tests, model and calibrated data.
Energies 14 01046 g012
Figure 13. Comparison of the results of PM10 concentration from the model and from real data, when the air quality was very good or moderate for the area of a two-lane roundabout.
Energies 14 01046 g013
Figure 14. Summary of the results of PM2.5 concentration for real data, when the ambient air quality was good or moderate for the area of a two-lane roundabout (values above the black lines determine the PM2.5 limits according to the Polish Air Quality Index).
Energies 14 01046 g014
Figure 15. PM10 concentration related to monitored case study (two-lane roundabout) based on the VERSIT + model.
Energies 14 01046 g015
Figure 16. PM10 concentration from an alternative turbo roundabout according to the VERSIT + model.
Energies 14 01046 g016
Figure 17. PM10 concentration from the tested two-lane roundabout according to the VERSIT + model for the share of 25% of electric vehicles.
Energies 14 01046 g017
Table 1. Short description of different evaluated scenarios.
ScenarioRoad SchemeTraffic Composition Emission Source
0two-lane
roundabout
80% light vehicle (fuel engine); 10% heavy vehicle; 10% busesdirect acquisition + simulation
1turbo
roundabout
80% light vehicle (fuel engine); 10% heavy vehicle; 10% busessimulation
2two-lane
roundabout
55% light vehicle (fuel engine) + 25% e-vehicle; 10% heavy vehicle; 10% busessimulation
Table 2. Selected parameters of the CEM DT-9881M analyzer. Based on [44].
Mass of PM ConcentrationParticulate Number PNMeasurement of Ambient Temperature and Relative Humidity
Channels: PM2.5/PM10Channels: 0.3; 0.5; 1.0; 2.5; 5.0; 10 µmTemperature measuring range: 0–50 °C
Mass concentration range: 0-2000 µg/m3Flow: 0.1 ft3 (2.83l/min)Relative humidity measuring range: 0–100% RH
Resolution: 1µg/m3Counting efficiency: 50% for 0.3 µm; 100% for particles > 0.45 µmAccuracy temperature measuring: ±0.5 °C
Table 3. Polish Air Quality Index for concentrations of PM10 and PM2.5; Based on [31].
Air Quality IndexPM10 [µg/m3]PM2,5 [µg/m3]Health Information
Very good0–210–13Air quality is satisfactory, air pollution is not a threat, ideal conditions for outdoor activities.
Good21.1–6113.1–37Air quality is good, conditions are good for outdoor activities, air pollutants can pose a minimal risk to those at higher risk (including children, the elderly, and people with heart or respiratory diseases).
Moderate61.1–10137.1–61The air quality is acceptable. Acceptable conditions for outdoor activities, although air pollutants may pose a risk to those at increased risk (including children, the elderly, and people with heart or respiratory disease).
Sufficient101.1–14161.1–85The air quality is sufficient, it is recommended to limit outdoor activity, air pollution is a threat to people at high risk (including children, the elderly and people with heart or respiratory diseases), other people should limit staying outside, especially when they experience symptoms such as a cough or sore throat.
Bad141.1–20185.1–121The air quality is bad, outdoor activities are not recommended, people at high risk (including children, the elderly and people with heart or respiratory diseases should avoid being outdoors), other people should limit their use of outdoors.
Very bad>201>121The air quality is very bad, all outdoor activities are discouraged, people in the high-risk group (including children, elderly people, and people with heart or respiratory diseases should absolutely avoid being outside), other people should limit staying outside to a minimum.
Table 4. Common Air Quality Index (CAQI) index for PM concentration ranges for the hourly mean values; based on [32].
Qualitative NamePM10 [µg/m3]PM2.5 [µg/m3]
Very high>180>110
High180–90110–55
Medium90–5055–30
Low50–2530–15
Very low<25<15
Publisher’s Note: MDPI stays neutral with regard to jurisdictional claims in published maps and institutional affiliations.

