
Diversity and Changes in the Energy Balance in EU Countries


Institute of Economics and Finance, Warsaw University of Life Sciences, 02-787 Warsaw, Poland
*
Author to whom correspondence should be addressed.
Energies 2021, 14(4), 1098; https://doi.org/10.3390/en14041098
Submission received: 30 December 2020
/
Revised: 4 February 2021
/
Accepted: 6 February 2021
/
Published: 19 February 2021
(This article belongs to the Special Issue Energy Supplies in the Countries from the Visegrad Group)
Abstract
:The main purpose of the paper was to present the energy balance in the EU countries. The specific objectives were to show the concentration and directions of changes in the demand, production, import, and export of energy in the EU countries, to determine the degree of variability (or stability) of these energy balance parameters, and to establish the correlation between the energy balance parameters and economic parameters. All members of the European Union were determinedly selected for research on 31 December 2018 (28 countries). The research period embraced the years 2004–2018. The sources of materials were the literature on the topic and data from Eurostat. Descriptive, tabular, and graphical methods, Gini coefficient, Lorenz curve, coefficient of variation, Pearson’s linear correlation coefficient, and constant-based dynamics indicators were used in the analysis and presentation of materials. It was determined that only the demand for energy and its import in EU countries were nearly related to the economic situation. In turn, exports and production were medium and weakly correlated. In these parameters, economic factors had a smaller impact than other factors, such as political development or the level of energy development in the country. It was also found that the EU countries’ energy imports were characterized by lower volatility than its exports. As a rule, the most significant stabilization in the given parameters occurred in countries with a stable economy, the so-called developed economies, while the most significant volatility was in developing countries. Energy security is of great importance in all EU countries.
1. Introduction
Energy is obtained from many sources, such as crude oil, fossil fuels (hard coal, lignite, peat), and natural gas. They are conventional energy sources. In turn, renewable sources include energy obtained from wind, sun, water, biomass and biofuels, or geothermal energy. There are differences in the structure of energy sources between countries [1,2,3,4,5]. There is a common energy policy in the EU which is gradually evolving, based on three pillars: competition, security of supply, and sustainable development. Energy security includes, among other aspects, availability of supply, affordability, and sustainability [6,7]. Energy security is understood in many dimensions and takes different specifics depending on the country (or continent), time frame, or energy source. It can also be stated that the concept of energy security is very broad and is constantly evolving. Primary energy supply security and geopolitics are essential. This approach will dominate the article [8,9,10,11,12,13,14]. In this context, a balanced supply and demand for energy resources are important, as well as their high availability and relative price stability [15]. It is the availability and affordability of energy that has the greatest impact on the overall energy security of the society. In turn, the promotion of renewable energy and diversification are important national energy security strategies [16,17,18,19]. Often, separate indicators for each energy source are used to measure energy security [20]. Overall, there are many indicators that measure energy security. As examples, indicators, more or less complex, developed by Scheepers et al. [21], Löschel et al. [22], Augutis et al. [23], Sovacool [24,25], Narula et al. [26,27,28], Erahman et al. [29], Ying and Liu [30], and Stavytskyy et al. [31] can be mentioned.
With the emergence of new technologies and the pursuit of policies favoring renewable energy sources, the energy system has transformed. As a result, some energy importers have become exporters, and countries long described as significant energy exporters have become centers of increasing demand. For each country, its technical, environmental, economic, and social conditions, i.e., country specificity, are essential. The right combination of policy and technology could support economic growth while ensuring safe and affordable energy [32,33,34,35,36,37].
The common electricity market in the EU has been established for almost 30 years. EU energy policy is based on three pillars: competition, the security of supply, and sustainable development. Objectives such as reducing greenhouse gas emissions, increasing the consumption of energy generated from renewable sources, and increasing energy efficiency and expanding electricity connections are also important [38,39,40,41,42,43,44]. On the one hand, energy policy focuses on the liberalization of the entire sector and, on the other hand, on development towards a smarter, more sustainable energy sector [45,46,47,48,49]. All goals were implemented gradually and evolved. The 2010 Strategy should be mentioned among the important documents concerning energy policy in recent years. It focuses on achieving energy efficiency targets and implementing low-carbon technologies [50]. In 2011, 2050 targets were set for a low-carbon economy [51]. Another document from 2015 is also concerned about supporting the previous goals in EU energy policy [52]. It is also necessary to mention the document from 2016 on renewable energy [53].
Different energy sources are used in EU countries. Despite this, there are energy crises, mainly related to interruptions in natural gas supplies from Russia. In such a case, it is crucial to diversify energy sources and suppliers [54,55,56,57,58,59,60]. The idea of the Energy Union is also gaining importance. The Energy Union strategy aims to provide Europe and its citizens with affordable, secure, competitive, and sustainable energy. Its key elements are the diversification of routes and sources of supply (the EU is heavily dependent on energy imports), regional cooperation, an integrated internal energy market, and energy infrastructure development [61,62,63,64].
The main purpose of the paper is to present the energy balance in EU countries. The specific objectives are to show the concentration and directions of changes in the demand, production, import, and export of energy in the EU countries, to determine the degree of variability (or stability) of these energy balance parameters, and to establish the correlation between the energy balance parameters and economic parameters. The research results make it possible to verify the correctness, based on current data. It is vital in the evolution of the situation of the European Union energy policy’s objectives.
Two hypotheses are put forward in the study:
- 1.
- All the energy balance parameters in EU countries are closely related to a given country’s economic situation.
Such parameters determined the economic situation as total and per capita GDP value, total and per capita household expenditure, the value of exports and imports, and added values of the economy’s most critical energy-intensive sectors. T
- 2.
- Energy imports in EU countries were less volatile than energy exports.
Thus, there is stability in the volume of energy imports.
2. Materials and Methods
All members of the European Union were selected for research on December 31, 2018 (28 countries). The research period covers the years 2004–2018. In 2004, the EU enlarged considerably, with ten new countries joining. This also resulted in large differences in the EU energy balance. The last year in which there were complete data needed to carry out the research using the assumed research methods at the time of the research was 2018. The sources of materials were the literature on the subject and also data from Eurostat. The use of Eurostat data made it possible to compare all EU countries. The tested parameters were calculated based on the same methodology. Descriptive, tabular, and graphical methods, Gini coefficient, coefficient of variation, Lorenz curve, constant-based dynamics indicators, and Pearson’s linear correlation coefficient method were used for the analysis and presentation of materials.
In the first stage of the research, the shaping of primary production, import, export, and total energy supply in the European Union was presented. Primary production of energy is any extraction of energy products in a usable form from natural sources. Imports of energy represent all entries into the national territory excluding transit quantities. Exports of energy represent all exits from the national territory excluding transit quantities. Total energy supply is the sum of production and imports subtracting exports and storage changes.
The aim is to show the changes in these parameters of the energy balance. In the second stage, the Gini concentration coefficient was calculated. It was used to determine the concentration level of primary production, import, export, and total energy supply in European Union countries. It is measured by the amount of energy produced, consumed, or traded in the EU. If these values were related to only one country, the coefficient would be 1. If they are spread over more countries, the coefficient becomes lower. The closer it is to 0, the more it proves that the volume of a given energy balance parameter is evenly distributed among the EU countries. The Lorenz curve is a graphical presentation of the level of volume concentration of a given parameter in the EU countries.
The Gini coefficient is a measure of the unevenness of a random variable’s distribution. The coefficient can be represented by the formula below when the observations are sorted in ascending order [65]:
where:
- n—number of observations;
- —value of the “i-th” observation;
- —the average value of all observations, i.e.,
The degree of concentration of a one-dimensional random variable distribution determines the Lorenz curve [66]. With sorted observations yi, which are non-negative values , , the Lorenz curve is a polyline which apexes , for h = 0,1,…, n, have the following coordinates:
The Gini coefficient determines the Lorenz curve area and the diagonal of a unit square multiplied by 2.
The third stage of the research presents the structure of energy imports in the EU. The energy import structure in selected EU countries was presented—two with the highest imports, one with the middle of the rate, and one with the lowest imports. It made it possible to determine trends and differences in different countries regarding the volume of energy imports. Various country models are presented.
In the fourth stage, the dynamics indicators for the parameters of the energy balance were calculated. As a result, data on the directions and strength of primary production, import, export, and total energy supply in individual EU countries were obtained. The dynamics indicators with a constant base were used. The dynamics indicators with a fixed base are determined as follows [67]:
where:
—the level of the phenomenon in a certain period; —the level of the phenomenon during the reference period.
In the fifth stage of the research, the coefficients of variation for the energy balance parameters in individual EU countries were calculated. Thanks to this, it was possible to determine whether the primary production, import, export, and total energy supply are stable or subject to very large-scale fluctuations.
The variation coefficient eliminates the unit of measurement from the standard deviation of a series of numbers. It is dividing them by the mean of series of numbers. Formally the coefficient of variation is computed as [68]:
where:
- S—standard deviation from the sample;
- M—arithmetic mean from the sample.
In the sixth stage, the relationship between the value of primary production, import, export, and total energy supply in the EU countries and the economy’s parameters was examined. The parameters used for the analysis were selected on purpose and were selected based on a literature review. Parameters highlight the most important aspects related to the economy of the studied country. Thanks to this research, it was possible to determine which parameters are significant and the strength of their relationship with the energy balance parameters.
The strength of a straight-line relationship between two measurable features is a measure of Pearson’s linear correlation coefficient, and it is expressed through the formula [69]:
where:
- C(X,Y)—covariance between the X and Y;
- —X feature variance;
- —X feature’s standard deviation;
- —Y feature variance;
- —Y feature’s standard deviation.
The linear correlation coefficient is considered as the normalized covariance. The correlation takes values from the range (−1, 1).
3. Results
3.1. Concentration and Directions of Changes in the Demand, Production, Import, and Export of Energy in EU Countries
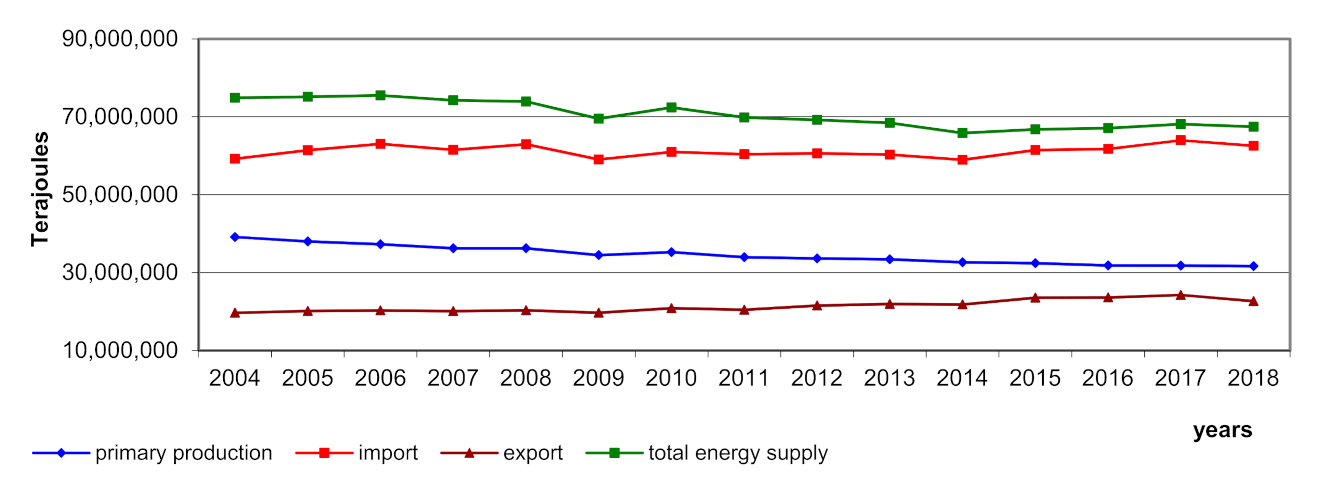
The energy demand in the EU-28 countries was not covered by production (Figure 1). In 2004–2018, the energy deficit increased from 48% in 2004 to 53% in 2018. Therefore, it was necessary to import energy and energy resources. There was also export, which is the domain of the free market. However, the fact is that this market is not entirely free because high tariffs and non-tariff barriers partially limit it. Some countries produced more of a given type of energy and sold the surplus. In the years 2004–2018, energy production in the EU decreased by 19%, and its consumption by 10%. Nevertheless, the import of energy resources was still needed. In 2004–2018 it remained at a relatively similar level and increased slightly by 6%. On the other hand, exports of energy resources increased by 15%. Therefore, changes in the parameters of the energy balance in the entire EU were small. In individual EU countries, however, they could take place, mainly due to energy sources. In 2018, energy supply in the EU countries was mainly based on crude oil (29%), natural gas (22%), renewable energy sources (14%), solid fuels, and nuclear energy (12% each). The remaining energy sources were of little importance. In 2004–2018, the energy supply increased the most using renewable energy sources and non-renewable waste (109% each). The dynamics were slightly lower in the case of oil shale (increase by 43%). The supply of energy from solid fuels decreased the most (a decrease by 32%), followed by peat and peat products (by 21%), crude oil and nuclear energy (19% each), and natural gas (by 10%). The energy in the EU was produced from various sources. In 2018, renewable energy sources accounted for 31% of the total energy produced. It was followed by nuclear energy (28%), reliable fossil fuels (16%), natural gas (12%), and oil (10%). The production structure did not correspond to the consumption structure. Individual countries used their natural resources or opportunities to produce renewable energy. Trends in the dynamics of changes in internal energy production were quite similar to those in energy demand. However, much larger declines can be noticed in the case of energy production from natural gas (down 54%), crude oil (47%), and solid fuels (40%). In the case of exports, the dominant source of energy resources was crude oil. In 2018 it was accounted for 77% of all energy exports. Natural gas accounted for 12% and electricity 6% of exports. It should also be emphasized that energy trade often took place between individual EU countries located in close neighborhood.
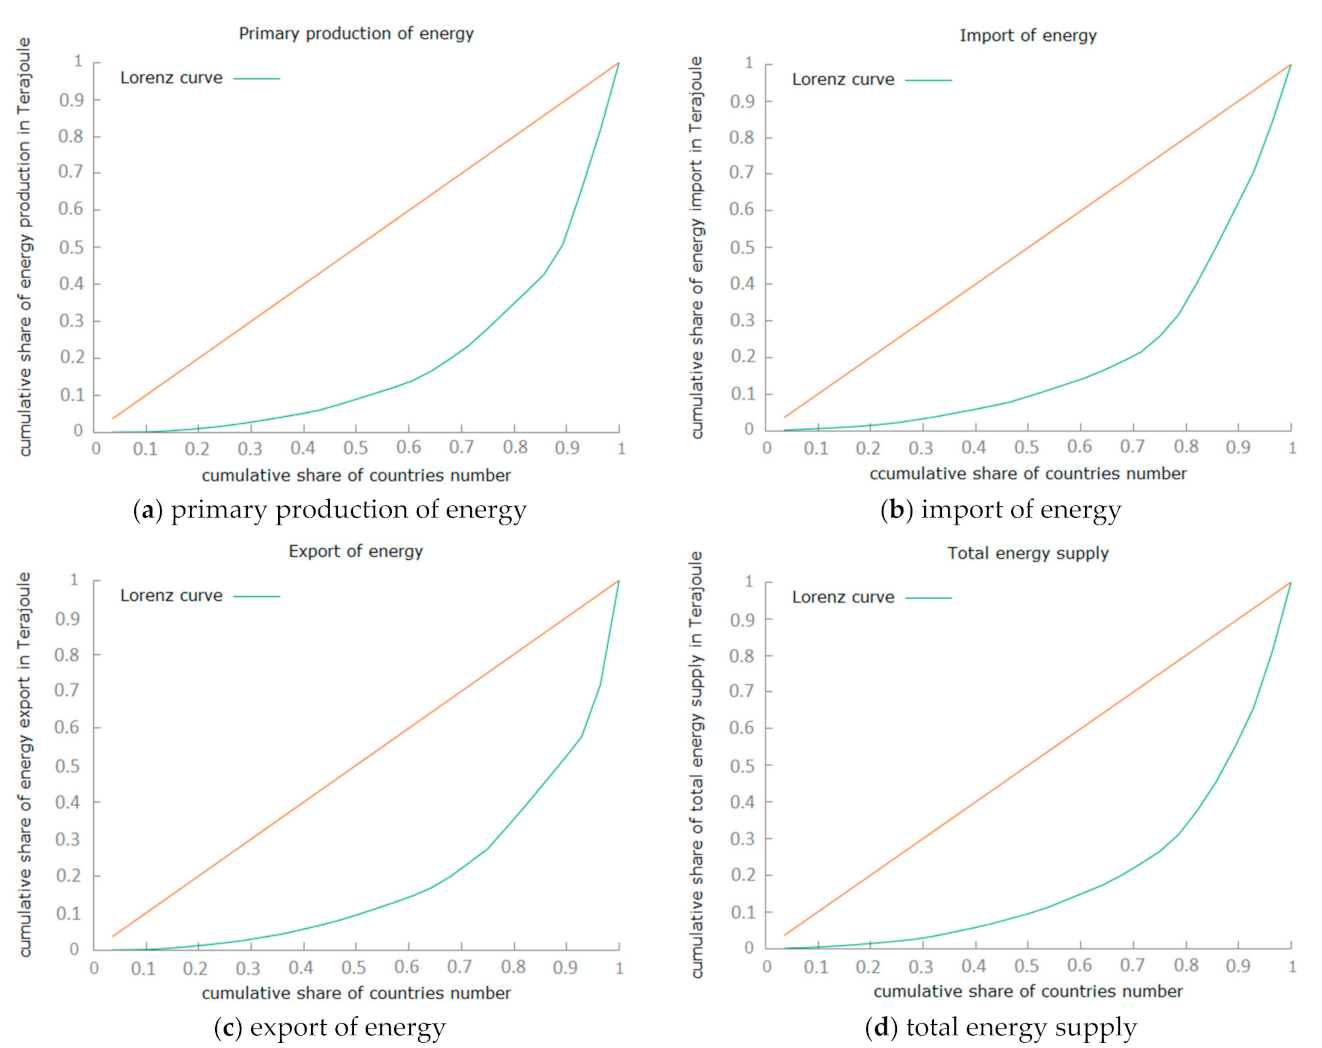
The Gini coefficient determined the concentration level of primary production, import, export, and total energy supply in the European Union. This coefficient is a commonly used measure of inequality, as it meets the postulated axioms in this respect [70]. It always takes values from 0 to 1. A result close to 1 means a very high concentration of one energy value, and a result close to 0 means a dispersion of these values. The data accepted for the study related to 2018 and covered all EU countries. The Gini coefficient calculated z for energy production in the EU was 0.62. The estimated coefficient for the population was 0.65. It suggests a high concentration of one or more countries in energy production. Gini coefficients were also calculated for the other energy parameters. Additionally, the differentiation was presented using the Lorenz concentration curve [71] (Figure 2). In 2018, there was a high concentration of energy imports in the EU countries (the sample coefficient was 0.60 and the estimated 0.63), as well as exports (from the sample 0.63, estimated 0.65) and energy consumption (respectively 0.62 and 0.64). Concentration coefficients were also calculated for 2004. There has been a significant reduction in energy production and exports in the EU from one or more sources towards diversification. The Gini coefficients for energy production in 2004 were 0.67 from the sample and 0.69 estimated. In the case of exports, it was 0.69 and 0.71, respectively. In the case of energy imports and consumption, there were virtually no changes. The concentration level did not change. For energy imports, the Gini coefficient from the sample was 0.62, and the estimated one was 0.64. For energy consumption, it was 0.62 and 0.65, respectively. Therefore, it can be concluded that there was a high concentration concerning individual elements of the energy balance in the EU. The changes did not occur at all or were very slow. The high concentration of production, import, export, and energy consumption in several countries is also due to several countries with high economic potential and large population populations. Additionally, there were many smaller countries in the EU reporting less energy demand. Changes in the future will not happen quickly. Different countries have access to quite similar technologies, so their energy efficiency differences are usually not very large. Therefore, it can be said with a high probability that the high level of concentration of production, trade, and energy consumption in the EU will be maintained for many years.
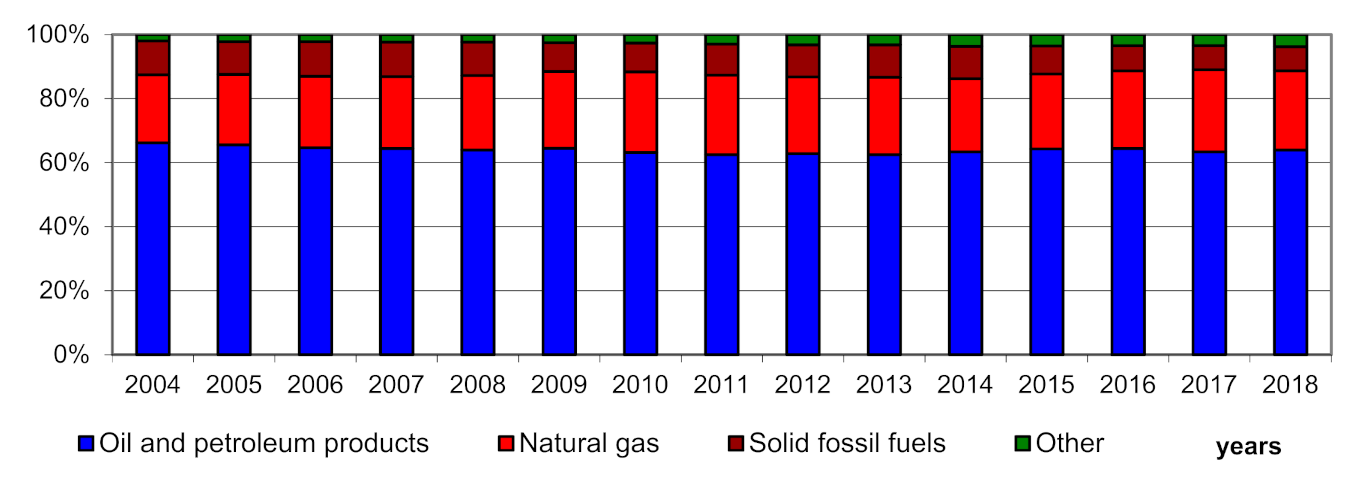
Energy security depends to a large extent on access to energy resources. It is important to be slightly dependent on one or more suppliers. It is also advisable to diversify energy supply sources, improving energy security, and not using energy supplies as a political instrument. Import is a vital element of the energy balance of the EU countries. In 2018, mainly crude oil was imported (64% of all energy imports), but also natural gas (25%) and solid fuels (7%) (Figure 3). The share of other energy sources was 4%. Imports of other energy resources, such as those from non-renewable waste and renewable energy sources, grew the fastest. However, the scale of these imports was small. In the years 2004–2018, the import of natural gas (by 23%) and crude oil (by 2%) increased, while the import of solid fuels (by 26%) decreased. In the case of the energy balance parameters, slight changes in the energy volume can be noticed. However, there were changes in the structure concerning energy sources. Renewable energy sources were introduced. However, it was impossible to abandon crude oil, especially in transport, and natural gas, for use in households and industrial plants.
3.2. Case Studies in the Field of Energy Balance in Selected EU Countries
The situation in individual countries in terms of energy balance was diversified. Malta, Luxembourg, and Cyprus were almost entirely dependent on external energy sources. Theoretically, energy production covered the reported demand only in Denmark in 2004–2012, Estonia in 2015 and 2017–2018, and Great Britain in 2004. However, there was practically no country that was self-sufficient in energy and did not need imports. The reason was the large variety of energy sources and the strict allocation of the raw materials to specific needs. For example, electricity used to power electric cars could be an alternative to crude oil in transport. However, the use of electric cars is low, so there is practically no alternative to oil. To select countries’ representatives for a more detailed analysis compared investments received by individual countries regarding energy imports. Germany imported the most energy resources. Some justification may be the country’s size and the degree of economic development, and the resulting needs. The country’s energy self-sufficiency in 2018 was only 37%. The Netherlands took second place. It is also economically developed, but much smaller in terms of area and population. Energy self-sufficiency in 2018 amounted to 50%. Hungary (14th position) was in the middle to import energy resources in the EU. It was an economically developing country. The country’s energy self-sufficiency in 2018 was 41%. Cyprus was last. However, it was a tiny country with little diversification of energy sources. Estonia was selected for the analysis. In terms of the volume of energy, imports was in the penultimate place. It was an economically developing country with an extensive diversification of energy sources. In 2018, this country was self-sufficient because production accounted for 106% of the energy supply. However, it must be taken into account that some energy sources have not been widely replaced, e.g., crude oil.
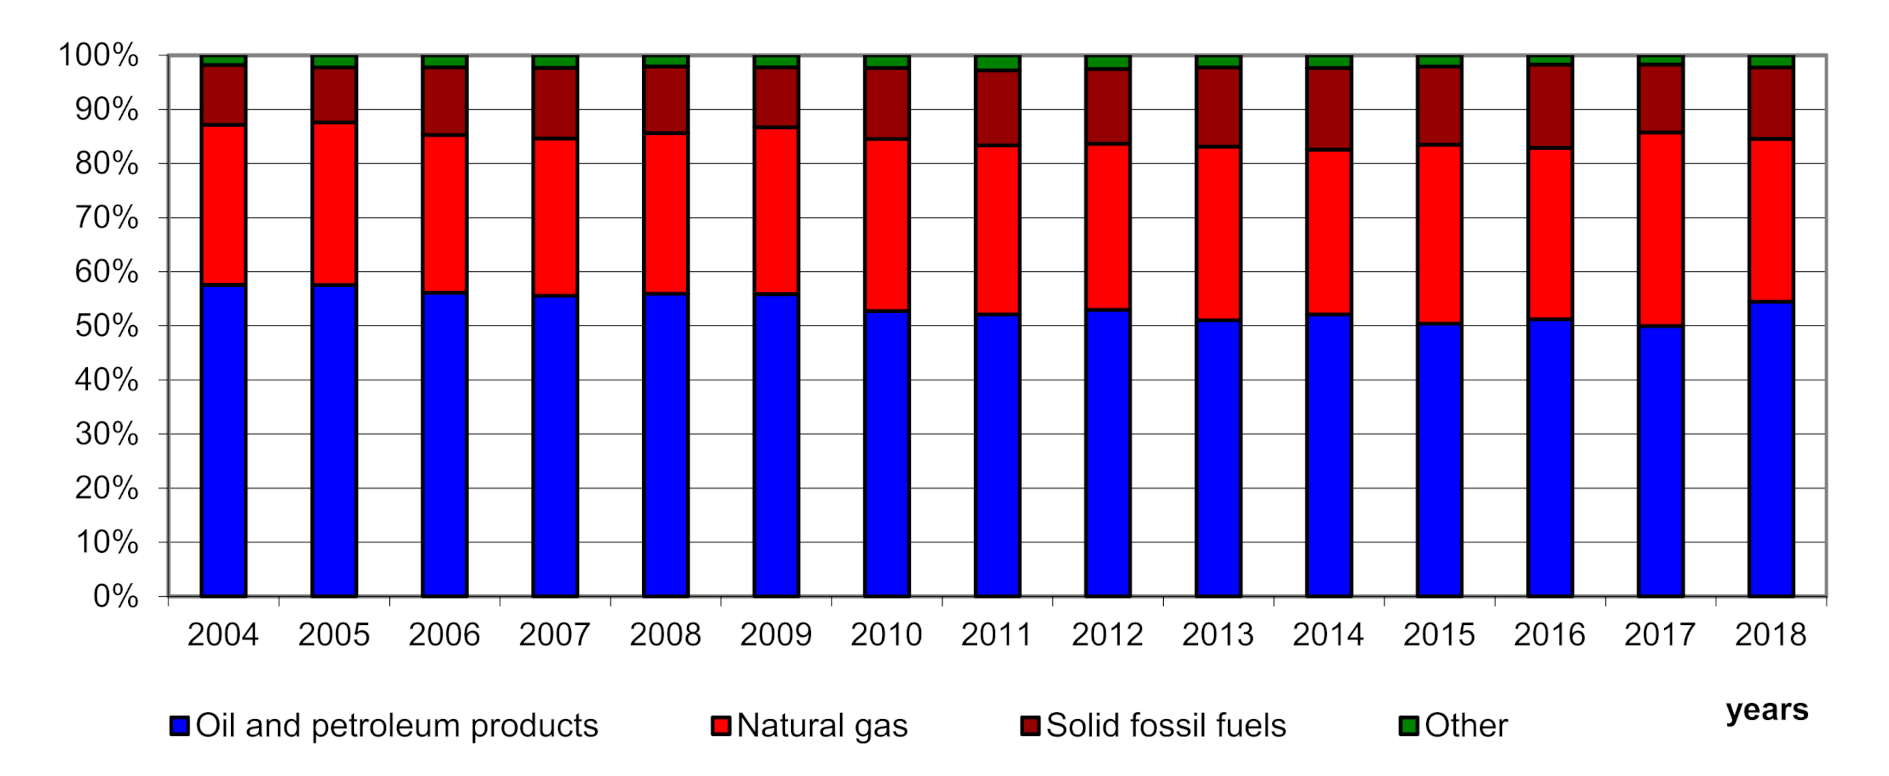
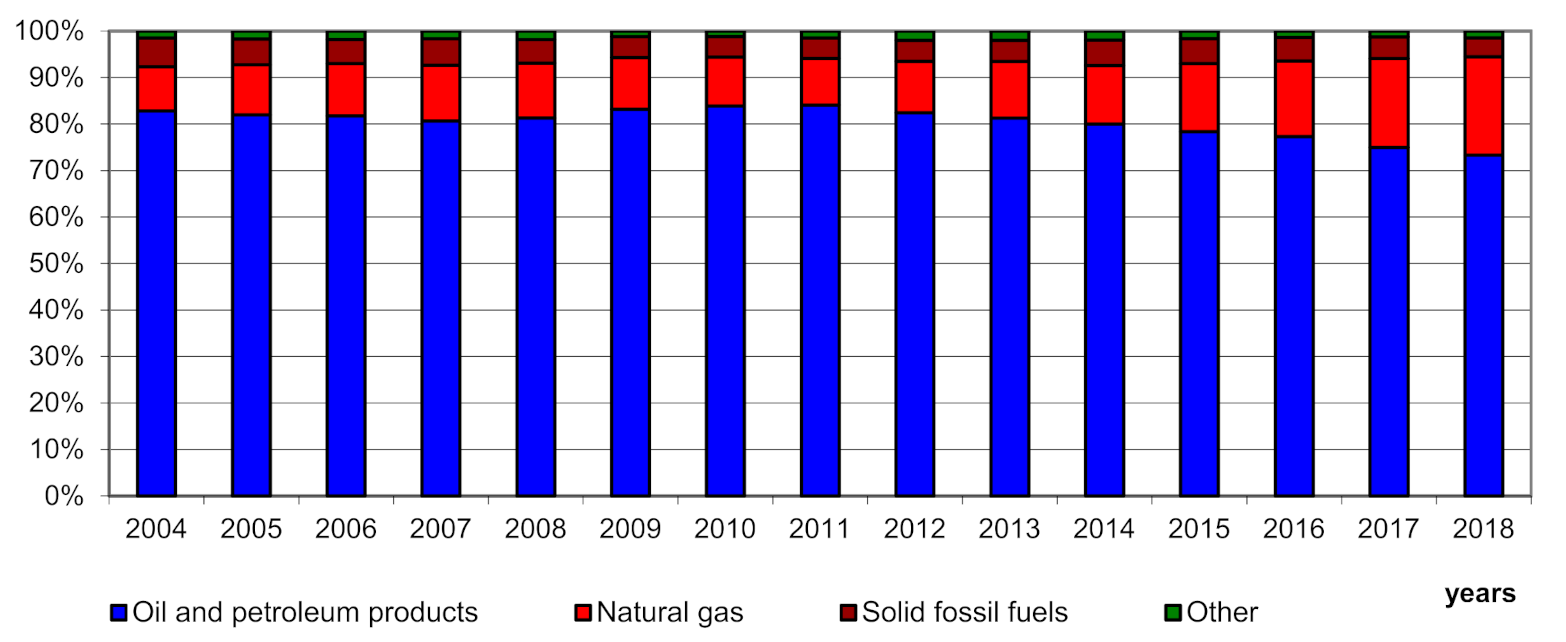
In the years 2004–2018 in Germany, the energy demand decreased (by 11%), its production (by 18%), export (by 11%), and import (by 9%). In the case of imports, crude oil dominated in the structure in 2018 (54% of total imports), while natural gas (30%) and solid fuels (13%) were of less importance. This structure did not change significantly (Figure 4). In the years 2004–2018, the fastest in relative terms was importing energy from renewable sources (an increase by 365%). Imports of solid fuels also increased slightly (by 9%). However, less crude oil (by 14%) and natural gas (by 7%).
In the Netherlands, between 2004 and 2018, energy demand decreased by 9% and its production by 46%. Interestingly, both exports (by 38%) and imports of energy resources (by 45%) increased during this period. The Netherlands is one of the countries that trade in energy resources. Some of the purchased raw materials were subject to foreign trade, making it possible to earn money on this type of activity. In 2018, crude oil dominated in energy imports (73%). Natural gas (21%) and solid fuels (4%) were of less importance (Figure 5). In the years 2004–2018, natural gas imports increased the fastest in relative terms (by 223%). Growth was also recorded in renewable energy (81%), electricity (25%), and oil (28%). Substantial fuel imports fell by 6%.
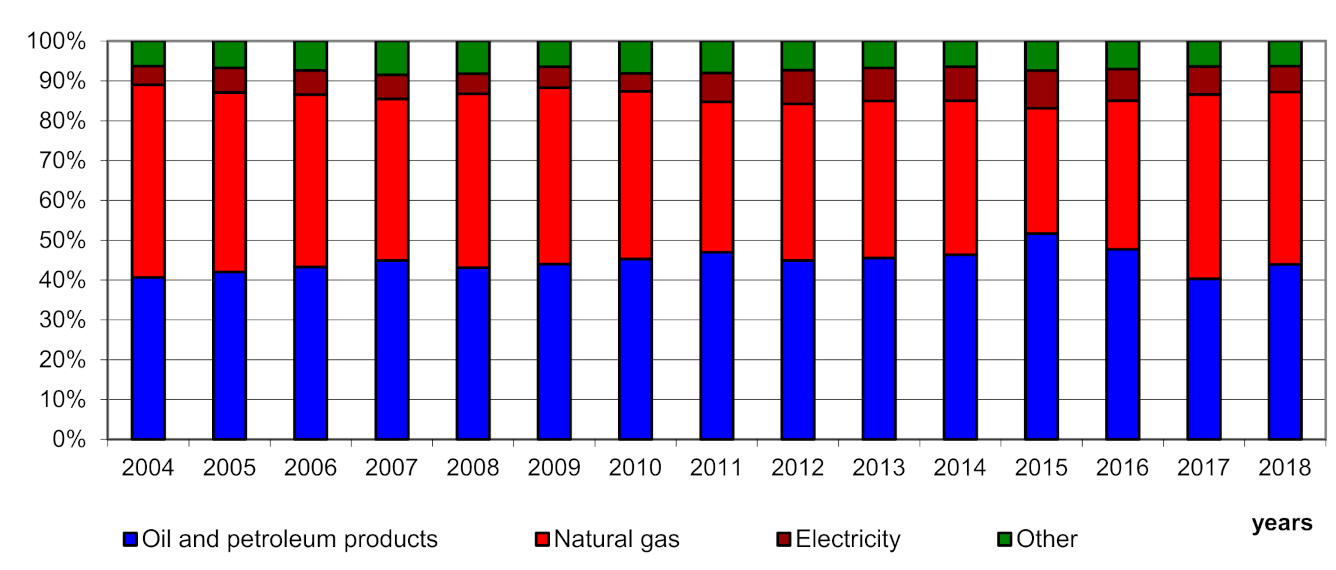
Hungary was in the middle in terms of energy imports. In 2004–2018, the demand for energy in this country increased by 1%, and domestic production by 6%. Much more significant increases were recorded in energy imports (an increase by 28%) and its exports (by 194%). Two sources dominated the import structure in 2018, i.e., crude oil and natural gas (Figure 6). They accounted for 43% of imported energy each. The imports of electricity (7%) and solid fuels (5%) were much lower. In Hungary, in the analyzed period, the import of electricity (77%) and crude oil (38%) were increasing the fastest, and imports of natural gas (14%) and solid fuels (3%) the slowest. A separate category is an energy from renewable sources, which has been imported only since 2009. In 2009–2018, the growth dynamics for this type of energy was 435%. Still, the importance of renewable energy was low. Hungary is one of the economically developing countries with a high demand for imported energy.
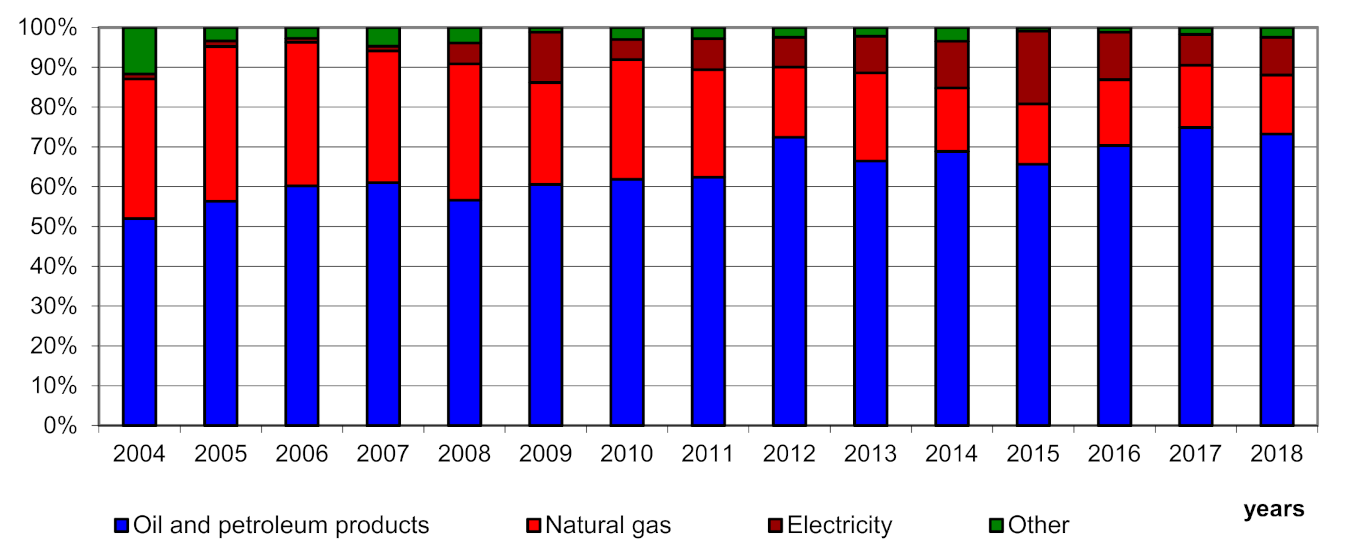
The lowest energy import was recorded in Estonia. In the years 2004–2018, all parameters of the energy balance in this country increased, i.e., energy demand (by 18%), its production (by 78%), export (by 399%), and imports (by 26%). The import structure was dominated by crude oil, as it accounted for as much as 73% of total energy imports in 2018. Natural gas (15%), electricity (9%), and renewable energy sources (1%) were of less importance (Figure 7). In the years 2004–2018, the imports of crude oil (an increase by 77%) and electricity (by 780%) increased, while the imports of solid fuels (by 19%) and natural gas (by 47%) decreased. In the case of other energy sources, the import of energy from renewable sources is growing rapidly. Such imports appeared only in 2009. In 2004, the import of bituminous shale was of great importance, but this source of energy was abandoned in the following years. The regularities in Estonia were quite similar to those in Hungary. It was different, among others structure of imported energy.
The presented examples of countries show some models concerning external energy sources and ensuring energy security. The countries differed in the size of imports, but also the degree of economic development. There have not been many changes in economically-developed countries, but, as a rule, energy production and consumption were reduced. Examples of such countries are Germany and the Netherlands, where many energy efficiency projects were implemented. In economically developing countries, all parameters of the energy balance tended to increase. This is due to the enormous economic needs of these countries and higher energy demand. Additionally, these countries, as a rule, used less efficient technologies in terms of energy efficiency. A common feature of all countries is the growing importance of renewable energies. Moreover, since 2009, this source of energy has become a relatively common subject of international trade. Renewable energy imports in all countries have grown tremendously. Of course, the scale of this energy import was still much smaller than conventional energy sources.
3.3. Degree of Variability (or Stability) of Energy Balance Parameters in EU Countries
In the next stage, the dynamics indices were calculated for the energy balance parameters, i.e., energy supply, production, export, and import. The level from 2004 was adopted as the basis (Table 1). The results were ordered in descending order due to the dynamics of energy imports. Energy imports have increased in most EU countries over the fourteen years. The decreases concerned nine countries, but they did not exceed 22%. The largest increase in energy imports was recorded in Poland. Imports almost doubled there. There were also high dynamics in Malta, the Netherlands, and Slovenia. Changes in imports may result from policies implemented at the country level. Due to the existing economic and social conditions, each country should be analyzed separately. In most EU countries, the energy demand has decreased. The changes were not significant. Much greater fluctuations occurred in the case of exports and energy production. Some countries increased energy sales several times, for example, Estonia, the Netherlands, Hungary, Denmark, the Czech Republic, and Germany. The explanation is that energy is increasingly being traded as a commodity. More and more energy is purchased to meet one’s own energy needs and for speculative purposes. Additionally, a considerable diversification of energy sources and the inability to use a given source for all purposes causes the exchange to occur. Countries that specialize in producing given energy, or have considerable energy resources, sell energy to other countries. In turn, they buy energy and the necessary raw materials that are in shortage on their market. In energy production, one-half of the countries recorded declines, and the other half increases. The scale of the changes varied. In general, the largest increases in energy production occurred in small countries with low production. In larger countries, the scale of changes was not so significant.
Then, the coefficients of variation for the parameters related to the energy balance were calculated. The results refer to the years 2004–2018 and have been ordered in ascending order according to energy imports’ variability (Table 2). The variation in energy demand was not very large, which means no sharp changes in energy consumption. The most significant fluctuations in energy demand occurred in Lithuania, Malta, and Greece. Austria and France were among the most stable countries in terms of energy demand. In the case of energy imports, the most significant variability was in Malta, Romania, Poland and Estonia. In turn, energy imports were the most stable in Belgium, Germany, and Austria. There was high variability in the production and export of energy. There was very high variability in energy production in Malta and Ireland, Lithuania, and Cyprus. Energy production was stable in France, Slovenia, and Slovakia. Energy exports were generally highly volatile, with the highest volatility in Cyprus, Malta, and Estonia. The smallest fluctuations in energy exports occurred in the Czech Republic, France and Slovakia. As a rule, in countries with a stable economy, the so-called economically-developed, there was better stability in energy consumption, production, and import. In turn, in developing countries, this variability was generally much higher. In addition to other economic development and applied government policies, there was also a different energy development level in individual EU countries.
3.4. Correlation between the Energy Balance Parameters and Economic Parameters in EU Countries
To establish the relationship between the parameters related to the energy balance in the EU countries and economic parameters, Pearson’s linear correlation coefficients were calculated (Table 3). p = 0.05 was adopted as the border value of the significance level. Irrelevant results are marked with red font color in the table. Correlation coefficients have been calculated for all EU countries for the entire 2004–2018 period. The study examined a correlation that does not indicate that a given factor affects another but indicates a strong or weak relationship. All parameters related to the energy balance were adopted for the research: primary production, import, export, and total energy supply [32]. It was essential to determine the relationship of these parameters with the relevant economic parameters. The research also used economic parameters that testify to the economic situation and situation. The parameters also referred to the results per capita, which indicated the country’s economic development level. Parameters relating to individual sectors of the economy were also adopted. Virtually all departments are energy-dependent, so these departments’ situations could be correlated with the energy balance parameters. Solid positive relationships were found between the demand for energy and its import and economy parameters. Only in the case of economic parameters related to per capita were these relationships were fragile. The expected results have been achieved as the economic situation has a strong influence on energy needs. When production increases, practically all sectors of the economy report a greater energy demand. Besides, energy consumption also results from consumption in households. In the case of energy exports, the relationships were also positive, but their strength was smaller. Similarly, per capita parameters showed less correlation with energy exports. One explanation for the observed regularities is the greater tendency to trade in energy. More and more countries are exporting energy or trading in energy resources. In the case of energy production, the dependencies with the economy were weak and negative. This means that the economic situation does not affect production decisions. European countries mainly produce energy from their resources, such as solid fuels, renewable sources, and gas. There is much pressure to abandon coal mining and replace this source with renewable energy. Hence, the achieved results are not surprising. In the absence of social and environmental pressure, the likely correlation would be high and positive. The general climate policy in contemporary realities more influences governments’ decisions regarding the use of non-renewable energy sources than the economic situation.
4. Discussion
In Matsumoto et al. [72] studies, it was found that the level of energy security improved in most EU countries between 1978 and 2014. The most remarkable improvement was recorded in Denmark and the Czech Republic. This was due to the increase in the diversification of primary energy sources and the diversification of imports, particularly the diversification of energy import sources. In the studies by Dudin et al. [73] it was found that, in a shorter period, in the years 1990–2018, the dependence on total energy imports increased. Such trends were observed for all energy sources. The given dependencies are consistent with the results obtained by the authors of this article. In studies by Augutis et al. [74], based on the example of the Baltic states, it was found that the level of energy security depended on their energy resources. Jonek-Kowalska [75] investigated the reasons for the transformation of energy balances in selected EU countries dominated by hard coal. It determined that these fuels are being replaced by other non-renewable energy sources or renewable energy sources, or nuclear energy. EU countries are most often compensated for the decreasing share of coal with the growing share of gas. The share of nuclear energy increased in France, the Czech Republic, and Great Britain. The research of other authors found that the share of renewable energy sources in the energy mix significantly depended on the economic condition of the EU countries. Countries without their fossil fuel sources invested in renewable energy to the greatest extent [76,77,78,79].
Bluszcz’s [80] research showed similar results as authors of this article in terms of the dependence of the EU countries on imports. Dependence on oil, gas, and imported coal was highest in 2013 in Malta, Luxembourg, and Cyprus, and lowest in Estonia and Denmark. Many EU countries were utterly dependent on oil imports. Only Denmark and the United Kingdom had a positive balance sheet and were oil exporters. The member states were also highly dependent on imported natural gas. Only Denmark and the Netherlands had a positive balance sheet. In the case of hard coal, the dependence was smaller. Only Poland, the Czech Republic, and Estonia had a positive balance. Imports of energy in countries dependent on it and its export in the case of producers can significantly impact the country’s balance of payments. Additionally, the costs of energy acquisition significantly affect the competitive position of the economy of the country [81,82,83,84].
Some studies show that energy consumption contributes to economic growth. Some studies show that energy consumption has little or no impact on economic growth that can be ignored. Many authors viewed energy as a critical resource used in all production phases and consumed as a product, increasing the welfare level [85,86,87,88,89,90,91,92]. This hypothesis is called the growth hypothesis in the literature. It assumes that energy is one of the critical indicators of economic growth. Opponents of this hypothesis argue that energy plays a minimal or neutral role in economic growth and proposes their assumption as the neutrality hypothesis. Many studies support the neutrality hypothesis [93,94,95,96,97,98]. In line with these assumptions, policies to reduce energy consumption do not affect economic growth. In their research, the article’s authors confirmed the hypothesis about an enormous impact of energy on economic growth. However, it should be noted that this influence depended on a given parameter of the energy balance. The most significant dependence was found in the case of total energy supply, and a very weak one in the primary production of energy.
Many studies have found a positive relationship between economic growth and energy use. However, energy matters less at low levels of economic growth. The weak impact of economic growth on energy consumption also occurs in countries with the highest GDP. Economically developed countries have lower energy needs because they use more energy-saving technologies. In developing countries, there is a close link between energy consumption and economic growth [99,100,101,102,103,104,105,106,107]. Additionally, countries have to balance between economic growth and energy transformation. There are differences on this issue between economically developed and developing countries. However, all of them must strive to develop with the use of sustainable energy sources [108,109,110].
The increase in energy security and reducing the risk of dependence on imports can be influenced by using different tools. It is important to support the development of new technologies, renewable energy sources, and diversification of energy carriers. These elements are reflected in the provisions of the energy and climate package and the Energy Roadmap 2050 [111]. The increase in energy security is to be ensured by the Energy Union. However, there are differences between countries as regards the competences of the EU and individual countries in the field of energy policy [112,113]. The problems of energy balance and energy security are very important for the socio-economic development of EU countries. These problems cannot be solved quickly, they require an energy transformation of the country’s economy. Such processes are spread over several decades.
5. Conclusions
Energy security is understood in many ways. In the simplest sense, it concerns the stability of supplies and the diversification of energy sources. Important parameters in the energy balance are production, import, export, and energy supply. In the EU, the demand for energy was not covered by production. The energy deficit was about 50% and did not change significantly from year to year. Energy has become a larger subject of trade, as evidenced by the growing share of exports. EU countries buy energy not only with their own supply in mind, but also with trade. Additionally, the surplus of energy generated from a given source is exported. This is especially the case with renewable energy.
In the EU, oil and natural gas were used as main energy sources. Subsequently, renewable energy, nuclear energy, and fossil energy were used. In the case of in-house production, the order was different, as energy generated from renewable sources and nuclear energy dominated. Other sources of energy were followed (solid fuels, natural gas, and crude oil each accounted for several percent of energy production in the EU). The production structure was different from the demand. The imports concerned mainly crude oil, which accounted for 64% of all energy imports in 2018. Natural gas accounted for 25%, and solid fuels for 7%. This structure is understandable. Crude oil is mainly consumed by transport, and European countries do not have large resources of this energy resource. Natural gas is increasingly imported in the EU. It should also be emphasized that in individual EU countries the situation in terms of the energy balance was varied. The largest energy imports were in Germany and the Netherlands. Germany was quite stable in terms of the volume of energy imports, which was also caused by the stabilization of the economy. This country has achieved a high level of economic development and introduced energy-efficient technologies. In the Netherlands, there were large increases in imports, mainly due to energy trade and its export. In both countries, the structure of imports was slightly different, but crude oil predominated, followed by natural gas and solid fuels. Hungary and Estonia are among the developing countries. Hungary found itself in the middle of the stakes in terms of energy imports, and Estonia at the bottom of it. In both countries, the demand for energy increased. More and more imports were necessary. The structure of imports was different. In Hungary, crude oil and natural gas had an equally high share, while oil was clearly dominant in Estonia. In all the countries analyzed in detail, renewable energy has become increasingly important in terms of production, trade and consumption. For example, in Estonia and Hungary, the import of renewable energy started in 2009 and was increasing very quickly.
In half of the EU countries, energy imports increased. These were developing countries like Poland, but also developed countries like the Netherlands. In Poland, the purchased energy was used for its own needs, while in the Netherlands it was traded. Each country had a separate energy policy. Overall, EU energy demand has fallen, but the changes have not been rapid. In the case of exports and production, these changes were very large. Energy has become a commodity subject to trade. There is also a diversification of energy sources. Energy production has declined in most countries, although there have also been some that have recorded increases. The presented regularities were also confirmed in regression models for individual parameters of the energy balance.
The volatility of energy demand and its import was insignificant. Much greater variability occurred in the case of energy exports and production. Thus, the second hypothesis was confirmed. As a rule, the greatest stabilization in the given parameters occurred in countries with a stable economy, the so-called economically developed, while the greatest variability was in developing countries. The energy policy and the level of energy development of each country had an impact on the achieved results. There was a very strong correlation between the demand for energy and its import, and the parameters of the economy. This result was expected. Only in the case of per capita parameters the strength of the relationship was small. In the case of energy exports, the strength of the relationship with the parameters was smaller, which also results from the increasingly common treatment of energy as an object of trade. The relationships between energy production and economic parameters were weak and negative, which results from the withdrawal of countries from, for example, hard coal mining and social pressure related to reducing the emission of pollutants into the environment. The first hypothesis was only partially confirmed with regard to energy demand and its import. For these parameters, there was a strong correlation with the parameters of the economy. The strength of the relationship was medium or weak for exports and energy production.
Author Contributions
Conceptualization, T.R., A.P. data curation, T.R., A.P.; formal analysis, T.R., A.P.; methodology, T.R., A.P.; resources, T.R., A.P.; visualization, T.R., A.P.; writing—original draft, T.R., A.P. writing—review and editing, T.R., A.P. supervision, T.R., A.P. funding acquisition, T.R., A.P. All authors have read and agreed to the published version of the manuscript.
Funding
This research received no external funding.
Conflicts of Interest
The authors declare no conflict of interest.
References
- Owusu, P.A.; Asumadu-Sarkodie, S. A review of renewable energy sources, sustainability issues and climate change mitigation. Cogent Eng. 2016, 3, 1167990. [Google Scholar] [CrossRef]
- Liang, X. Emerging power quality challenges due to integration of renewable energy sources. IEEE Trans. Ind. Appl. 2016, 53, 855–866. [Google Scholar] [CrossRef]
- Tareen, W.U.K.; Anjum, Z.; Yasin, N.; Siddiqui, L.; Farhat, I.; Malik, S.A.; Aamir, M. The prospective non-conventional alternate and renewable energy sources in Pakistan—A focus on biomass energy for power generation, transportation, and industrial fuel. Energies 2018, 11, 2431. [Google Scholar] [CrossRef] [Green Version]
- Rodríguez-Monroy, C.; Mármol-Acitores, G.; Nilsson-Cifuentes, G. Electricity generation in Chile using non-conventional renewable energy sources—A focus on biomass. Renew. Sustain. Energy Rev. 2018, 81, 937–945. [Google Scholar] [CrossRef]
- Khan, K.A.; Hasan, M.; Islam, M.A.; Alim, M.A.; Asma, U.; Hassan, L.; Ali, M.H. A study on conventional energy sources for power production. Int. J. Adv. Res. Innov. Ideas Educ. 2018, 4, 214–228. [Google Scholar]
- Lockwood, M.; Froggatt, A.; Wright, G.; Dutton, J. The implications of Brexit for the electricity sector in Great Britain: Trade-offs between market integration and policy influence. Energy Policy 2017, 110, 137–143. [Google Scholar] [CrossRef]
- Cox, E. Assessing long-term energy security: The case of electricity in the United Kingdom. Renew. Sustain. Energy Rev. 2018, 82, 2287–2299. [Google Scholar] [CrossRef]
- Chester, L. Conceptualising energy security and making explicit its polysemic nature. Energy Policy 2010, 38, 887–895. [Google Scholar] [CrossRef]
- Kruyt, B.; van Vuuren, D.P.; de Vries, H.J.; Groenenberg, H. Indicators for energy security. Energy Policy 2009, 37, 2166–2181. [Google Scholar] [CrossRef]
- Cherp, A.; Jewell, J. The three perspectives on energy security: Intellectual history, disciplinary roots and the potential for integration. Curr. Opin. Environ. Sustain. 2011, 3, 202–212. [Google Scholar] [CrossRef] [Green Version]
- Sovacool, B.K.; Mukherjee, I. Conceptualizing and measuring energy security: A synthesized approach. Energy 2011, 36, 5343–5355. [Google Scholar] [CrossRef]
- Winzer, C. Conceptualizing energy security. Energy Policy 2012, 46, 36–48. [Google Scholar] [CrossRef] [Green Version]
- Ang, B.W.; Choong, W.L.; Ng, T.S. Energy security: Definitions, dimensions and indexes. Renew. Sustain. Energy Rev. 2015, 42, 1077–1093. [Google Scholar] [CrossRef]
- Song, Y.; Zhang, M.; Sun, R. Using a new aggregated indicator to evaluate China’s energy security. Energy Policy 2019, 132, 167–174. [Google Scholar] [CrossRef]
- Jun, E.; Kim, W.; Chang, S.H. The analysis of security cost for different energy sources. Appl. Energy 2009, 86, 1894–1901. [Google Scholar] [CrossRef]
- Augutis, J.; Krikstolaitis, R.; Martisauskas, L.; Peciulyte, S.; Žutautaitė, I. Integrated energy security assessment. Energy 2017, 138, 890–901. [Google Scholar] [CrossRef]
- Ren, J.; Sovacool, B.K. Quantifying, measuring, and strategizing energy security: Determining the most meaningful dimensions and metrics. Energy 2014, 76, 838–849. [Google Scholar] [CrossRef]
- Lucas, J.N.V.; Francés, G.E.; González, E.S.M. Energy security and renewable energy deployment in the EU: Liaisons Dangereuses or Virtuous Circle? Renew. Sustain. Energy Rev. 2016, 62, 1032–1046. [Google Scholar] [CrossRef]
- Narula, K.; Reddy, B.S.A. SES (sustainable energy security) index for developing countries. Energy 2016, 94, 326–343. [Google Scholar] [CrossRef]
- Månsson, A.; Johansson, B.; Nilsson, L.J. Assessing energy security: An overview of commonly used methodologies. Energy 2014, 73, 1–14. [Google Scholar] [CrossRef] [Green Version]
- Scheepers, M.; Seebregts, A.; de Jong, J.; Maters, H. EU standards for energy security of supply. Gas 2007, 52, 67–75. [Google Scholar]
- Löschel, A.; Moslener, U.; Rübbelke, D.T.G. Indicators of energy security in industrialized countries. Energy Policy 2010, 38, 1665–1671. [Google Scholar] [CrossRef]
- Augutis, J.; Krikstolaitis, R.; Martisauskas, L.; Peciulyte, S. Energy security level assessment technology. Appl. Energy 2012, 97, 143–149. [Google Scholar] [CrossRef]
- Sovacool, B.K. Assessing energy security performance in the Asia Pacific, 1990–2010. Renew. Sustain. Energy Rev. 2013, 17, 5846–5853. [Google Scholar] [CrossRef]
- Sovacool, B.K. An international assessment of energy security performance. Ecol. Econ. 2013, 88, 148–158. [Google Scholar] [CrossRef]
- Narula, K. Is sustainable energy security of India increasing or decreasing? Int. J. Sustain. Energy 2014, 33, 1054–1075. [Google Scholar] [CrossRef]
- Narula, K.; Reddy, B.S. Three blind men and an elephant: The case of energy indices to measure energy security and energy sustainability. Energy 2015, 80, 148–158. [Google Scholar] [CrossRef]
- Narula, K.; Reddy, B.S.; Pachauri, S. Sustainable energy security for India: An assessment of energy demand sub-system. Appl. Energy 2017, 186, 126–139. [Google Scholar] [CrossRef]
- Erahman, Q.F.; Purwanto, W.W.; Sudibandriyo, M.; Hidayatno, A. An assessment of Indonesia’s energy security index and comparison with seventy countries. Energy 2016, 111, 364–376. [Google Scholar] [CrossRef]
- Ying, Q.U.; Liu, Y. Evaluating the low-carbon development of urban China. Environ. Dev. Sustain. 2016, 19, 1–15. [Google Scholar]
- Stavytskyy, A.; Kharlamova, G.; Giedraitis, V.; Šumskis, V. Estimating the interrelation between energy security and macroeconomic factors in European countries. J. Int. Stud. 2018, 11, 217–238. [Google Scholar] [CrossRef]
- Franki, V.; Višković, A. Energy security, policy and technology in South East Europe: Presenting and applying an energy security index to Croatia. Energy 2015, 90, 494–507. [Google Scholar] [CrossRef]
- Atlam, B.M.; Rapiea, A.M. Assessing the future of energy security in Egypt. Int. J. Energy Econ. Policy 2016, 6, 684–700. [Google Scholar]
- Chentouf, M.; Allouch, M. Assessment of energy security in MedRing countries and regional trends towards renewable energy deployment. J. Renew. Sustain. Energy 2017, 9, 065904. [Google Scholar] [CrossRef]
- Gao, D.; Li, Z.; Liu, P.; Zhao, J.; Zhang, Y.; Li, C. A coordinated energy security model taking strategic petroleum reserve and alternative fuels into consideration. Energy 2018, 145, 171–181. [Google Scholar] [CrossRef]
- Cîrstea, S.D.; Moldovan-Teselios, C.; Cîrstea, A.; Turcu, A.C.; Darab, C.P. Evaluating Renewable Energy Sustainability by Composite Index. Sustainability 2018, 10, 811. [Google Scholar] [CrossRef] [Green Version]
- Azzuni, A.; Breyer, C. Global Energy Security Index and Its Application on National Level. Energies 2020, 13, 2502. [Google Scholar] [CrossRef]
- Van den Bergh, K.; Delarue, E.; D’haeseleer, W. Impact of renewables deployment on the CO2 price and the CO2 emissions in the European electricity sector. Energy Policy 2013, 63, 1021–1031. [Google Scholar] [CrossRef] [Green Version]
- Thema, J.; Suerkemper, F.; Grave, K.; Amelung, A. The impact of electricity demand reduction policies on the EU-ETS: Modelling electricity and carbon prices and the effect on industrial competitiveness. Energy Policy 2013, 60, 656–666. [Google Scholar] [CrossRef] [Green Version]
- Strambo, C.; Nilsson, M.; Månsson, A. Coherent or inconsistent? Assessing energy security and climate policy interaction within the European Union. Energy Res. Soc. Sci. 2015, 8, 1–12. [Google Scholar] [CrossRef]
- Antonioli, D.; Borghesi, S.; D’Amato, A.; Gilli, M.; Mazzanti, M.; Nicolli, F. Analysing the interactions of energy and climate policies in a broad policy ‘optimality’framework: The Italian case study. J. Integr. Environ. Sci. 2014, 11, 205–224. [Google Scholar] [CrossRef] [Green Version]
- Leal-Arcas, R. Towards Sustainability in Trade, Energy and Climate. Mod. Environ. Sci. Eng. 2020, 6, 1–30. [Google Scholar] [CrossRef]
- Leal-Arcas, R.; Lesniewska, F.; Proedrou, F. Prosumers: New actors in EU energy security. In Netherlands Yearbook of International Law; TMC Asser Press: The Hague, The Netherlands, 2017; pp. 139–172. [Google Scholar]
- De Almeida, A.; Fonseca, P.; Schlomann, B.; Feilberg, N. Characterization of the household electricity consumption in the EU, potential energy savings and specific policy recommendations. Energy Build. 2011, 43, 1884–1894. [Google Scholar] [CrossRef]
- Pereira, G.I.; da Silva, P.P.; Soule, D. Policy-adaptation for a smarter and more sustainable EU electricity distribution industry: A foresight analysis. Environ. Dev. Sustain. 2018, 20, 231–267. [Google Scholar] [CrossRef]
- Soares, N.; Martins, A.G.; Carvalho, A.L.; Caldeira, C.; Du, C.; Castanheira, É.; Ferreira, J.P. The challenging paradigm of interrelated energy systems towards a more sustainable future. Renew. Sustain. Energy Rev. 2018, 95, 171–193. [Google Scholar] [CrossRef] [Green Version]
- Pereira, G.; da Silva, P.P.; Soule, D. Designing Markets for Innovative Electricity Services in the EU: The Roles of Policy, Technology, and Utility Capabilities. In Consumer, Prosumer, Prosumager: How Service Innovations will Disrupt the Utility Business Model; Elsvire: London, UK, 2019; p. 355. [Google Scholar]
- Kang, J.N.; Wei, Y.M.; Liu, L.C.; Han, R.; Yu, B.Y.; Wang, J.W. Energy systems for climate change mitigation: A systematic review. Appl. Energy 2020, 263, 114602. [Google Scholar] [CrossRef]
- Marques, G.S.; Dias, M.A.P.; Vianna, J.N.S. Innovation in the electricity sector in the age of Disruptive Technologies and renewable Energy Sources: A Bibliometric study from 1991 to 2019. Int. J. Adv. Eng. Res. Sci. 2020, 7, 261–272. [Google Scholar] [CrossRef]
- European Commission. Energy 2020. In A Strategy for Competitive, Sustainable and Secure Energy; European Commission: Brussels, Belgium, 2010. [Google Scholar]
- European Commission. Energy Roadmap 2050; European Commission: Brussels, Belgium, 2011. [Google Scholar]
- European Commission. Energy Union Package. In A Framework Strategy for a Resilient Energy Union with a Forward Looking Climate Change Policy; European Commission: Brussels, Belgium, 2015. [Google Scholar]
- European Commission. Clean Energy for All Europeans. In Communication from the Commission to the European Parliament, the Council, the European Economic and Social Committee, the Committee of the Regions and the European Investment Bank; European Commission: Brussels, Belgium, 2016. [Google Scholar]
- Richter, P.M.; Holz, F. All quiet on the eastern front? Disruption scenarios of Russian natural gas supply to Europe. Energy Policy 2015, 80, 177–189. [Google Scholar] [CrossRef] [Green Version]
- Kustova, I. EU–Russia Energy Relations, EU Energy Integration, and Energy Security: The State of the Art and a Roadmap for Future Research. J. Contemp. Eur. Res. 2015, 11, 287–295. [Google Scholar]
- Romanova, T. Is Russian Energy Policy towards the EU Only about Geopolitics? The Case of the Third Liberalisation Package. Geopolitics 2016, 21, 857–879. [Google Scholar] [CrossRef]
- Bouwmeester, M.C.; Oosterhaven, J. Economic impacts of natural gas flow disruptions between Russia and the EU. Energy Policy 2017, 106, 288–297. [Google Scholar] [CrossRef]
- Osieczko, K.; Polaszczyk, J. Comparison of chosen aspects of Energy Security Index for the natural gas sector in Poland and Ukraine. Int. J. Manag. Econ. 2018, 54, 185–196. [Google Scholar] [CrossRef] [Green Version]
- Jääskeläinen, J.J.; Höysniemi, S.; Syri, S.; Tynkkynen, V.P. Finland’s Dependence on Russian Energy—Mutually Beneficial Trade Relations or an Energy Security Threat? Sustainability 2018, 10, 3445. [Google Scholar] [CrossRef] [Green Version]
- Jääskeläinen, J.; Lager, J.; Syri, S. Development of Energy Security in Finland and in the Baltic States since 1991. In Proceedings of the 2019 16th International Conference on the European Energy Market (EEM), Ljubljana, Slovenia, 18–20 September 2019; pp. 1–6. [Google Scholar]
- Austvik, O.G. The Energy Union and security-of-gas supply. Energy Policy 2016, 96, 372–382. [Google Scholar] [CrossRef]
- Szulecki, K.; Fischer, S.; Gullberg, A.T.; Sartor, O. Shaping the ‘Energy Union’: Between national positions and governance innovation in EU energy and climate policy. Clim. Policy 2016, 16, 548–567. [Google Scholar] [CrossRef] [Green Version]
- Szulecki, K.; Westphal, K. Taking security seriously in EU energy governance: Crimean shock and the energy union. In Energy Security in Europe; Palgrave Macmillan: Cham, Switzerland, 2018; pp. 177–202. [Google Scholar]
- Dumitrescu, A.L.; Prisecaru, P. The Energy Union Progress. The Evaluation Reports and The Strategic Directions, 2015–2019. Euroinfo 2019, 3, 47–67. [Google Scholar]
- Dixon, P.M.; Weiner, J.; Mitchell-Olds, T.; Woodley, R. Erratum to ‘Bootstrapping the Gini Coefficient of Inequality. Ecology 1988, 69, 1307. [Google Scholar] [CrossRef]
- Dagum, C. The Generation and Distribution of Income, the Lorenz Curve and the Gini Ratio. Econ. Appliquée 1980, 33, 327–367. [Google Scholar]
- Starzyńska, W. Statystyka Praktyczna; Wydawnictwo Naukowe PWN: Warsaw, Poland, 2002; p. 102. [Google Scholar]
- Abdi, H. Coefficient of variation. Encycl. Res. Des. 2010, 1, 169–171. [Google Scholar]
- Jajuga, K.; Walesiak, M. Remarks on the Dependence Measures and the Distance Measures. In Klasyfikacja i Analiza Danych—Teoria i Zastosowania; Jajuga, K., Walesiak, M., Eds.; Prace Naukowe Akademii Ekonomicznej we Wrocławiu nr 1022, AE; Wroclaw University of Economics and Business: Wroclaw, Poland, 2004; pp. 348–354. [Google Scholar]
- Atkinson, A.B. The Economics of Inequality; Clarendon Press: Oxford, UK, 1983; pp. 46–59. [Google Scholar]
- Lorenz, M.O. Methods of Measuring the Concentration of Wealth; Publications of the American Statistical Association, 1905; Volume 9, pp. 209–219. [Google Scholar] [CrossRef]
- Matsumoto, K.I.; Doumpos, M.; Andriosopoulos, K. Historical energy security performance in EU countries. Renew. Sustain. Energy Rev. 2018, 82, 1737–1748. [Google Scholar] [CrossRef]
- Dudin, M.N.; Zasko, V.N.; Dontsova, O.I.; Osokina, I.V. The energy politics of the european union and the possibility to implement it in post-soviet states. Int. J. Energy Econ. Policy 2020, 10, 409–416. [Google Scholar] [CrossRef]
- Augutis, J.; Krikštolaitis, R.; Martišauskas, L.; Urbonienė, S.; Urbonas, R.; Ušpurienė, A.B. Analysis of energy security level in the Baltic States based on indicator approach. Energy 2020, 199, 117427. [Google Scholar] [CrossRef]
- Jonek-Kowalska, I. Transformation of energy balances with dominant coal consumption in European economies and Turkey in the years 1990–2017. Oeconomia Copernic. 2019, 10, 627–647. [Google Scholar] [CrossRef] [Green Version]
- Papież, M.; Śmiech, S.; Frodyma, K. Determinants of renewable energy development in the EU countries. A 20-year perspective. Renew. Sustain. Energy Rev. 2018, 91, 918–934. [Google Scholar] [CrossRef]
- Brodny, J.; Tutak, M. Analyzing similarities between the European Union countries in terms of the structure and volume of energy production from renewable energy sources. Energies 2020, 13, 913. [Google Scholar] [CrossRef] [Green Version]
- Gullberg, A.T.; Ohlhorst, D.; Schreurs, M. Towards a low carbon energy future–Renewable energy cooperation between Germany and Norway. Renew. Energy 2014, 68, 216–222. [Google Scholar] [CrossRef]
- Moorthy, K.; Patwa, N.; Gupta, Y. Breaking barriers in deployment of renewable energy. Heliyon 2019, 5, e01166. [Google Scholar]
- Bluszcz, A. European economies in terms of energy dependence. Qual. Quant. 2017, 51, 1531–1548. [Google Scholar] [CrossRef] [Green Version]
- Correlje, A.; van der Linde, C. Energy supply security and geopolitics: A European perspective. Energy Policy 2006, 34, 532–543. [Google Scholar] [CrossRef]
- Jones, D.; Leiby, P.; Paik, K. Oil price shocks and the macro-economy: What has been learned since 1996. Energy J. 2004, 25, 1–32. [Google Scholar] [CrossRef]
- Johansson, B. A broadened typology on energy and security. Energy 2013, 53, 199–205. [Google Scholar] [CrossRef] [Green Version]
- Knopf, B.; Nahmmacher, P.; Schmid, E. The European renewable energy target for 2030—An impact assessment of the electricity sector. Energy Policy 2015, 85, 50–60. [Google Scholar] [CrossRef]
- Stern, D.I. A multivariate cointegration analysis of the role of energy in the US macroeconomy. Energy Econ. 2000, 22, 267–283. [Google Scholar] [CrossRef] [Green Version]
- Shiu, A.; Lam, P.L. Electricity consumption and economic growth in China. Energy Policy 2004, 32, 47–54. [Google Scholar] [CrossRef]
- Altinay, G.; Karagol, E. Electricity consumption and economic growth: Evidence from Turkey. Energy Econ. 2005, 27, 849–856. [Google Scholar] [CrossRef]
- Odhiambo, N.M. Energy consumption and economic growth nexus in Tanzania: An ARDL bounds testing approach. Energy Policy 2009, 37, 617–622. [Google Scholar] [CrossRef]
- Apergis, N.; Payne, J.E. Energy consumption and growth in South America: Evidence from a panel error correction model. Energy Econ. 2010, 32, 1421–1426. [Google Scholar] [CrossRef]
- Iyke, B.N. Electricity consumption and economic growth in Nigeria: A revisit of the energy-growth debate. Energy Econ. 2015, 51, 166–176. [Google Scholar] [CrossRef] [Green Version]
- Osman, M.; Gachino, G.; Hoque, A. Electricity consumption and economic growth in the GCC countries: Panel data analysis. Energy Policy 2016, 98, 318–327. [Google Scholar] [CrossRef]
- Le, T.H.; Nguyen, C.P. Is energy security a driver for economic growth? Evidence from a global sample. Energy Policy 2019, 129, 436–451. [Google Scholar] [CrossRef]
- Akarca, A.T.; Long, T.V. Relationship between energy and GNP: A re-examination. J. Energy Dev. 1980, 5, 326–331. [Google Scholar]
- Yu, E.S.H.; Hwang, B.K. The relationship between energy and GNP: Further results. Energy Econ. 1984, 6, 186–190. [Google Scholar] [CrossRef]
- Cheng, B.S. An investigation of cointegration and causality between energy consumption and economic growth. J. Energy Dev. 1995, 21, 73–84. [Google Scholar]
- Hondroyiannis, G.; Lolos, S.; Papapetrou, E. Energy consumption and economic growth: Assessing the evidence from Greece. Energy Econ. 2002, 24, 319–336. [Google Scholar] [CrossRef]
- Altinay, G.; Karagol, E. Structural break, unit root, and the causality between energy consumption and GDP in Turkey. Energy Econ. 2004, 26, 985–994. [Google Scholar] [CrossRef]
- Ozturk, I.; Aslan, A.; Kalyoncu, H. Energy consumption and economic growth relationship: Evidence from panel data for low and middle income countries. Energy Policy 2010, 38, 4422–4428. [Google Scholar] [CrossRef]
- Erdal, G.; Erdal, H.; Esengün, K. The causality between energy consumption and economic growth in Turkey. Energy Policy 2008, 36, 3838–3842. [Google Scholar] [CrossRef]
- Shahbaz, M.; Zeshan, M.; Afza, T. Is energy consumption effective to spur economic growth in Pakistan? New evidence from bounds test to level relationships and Granger causality tests. Econ. Model. 2012, 29, 2310–2319. [Google Scholar] [CrossRef] [Green Version]
- Tugcu, C.T.; Ozturk, I.; Aslan, A. Renewable and non-renewable energy consumption and economic growth relationship revisited: Evidence from G7 countries. Energy Econ. 2012, 34, 1942–1950. [Google Scholar] [CrossRef]
- Al-Mulali, U.; Sab, C.N.B.C. The impact of energy consumption and CO2 emission on the economic growth and financial development in the Sub Saharan African countries. Energy 2012, 39, 180–186. [Google Scholar] [CrossRef]
- Saidi, K.; Hammami, S. The impact of CO2 emissions and economic growth on energy consumption in 58 countries. Energy Rep. 2015, 1, 62–70. [Google Scholar] [CrossRef] [Green Version]
- Wang, S.; Li, Q.; Fang, C.; Zhou, C. The relationship between economic growth, energy consumption, and CO2 emissions: Empirical evidence from China. Sci. Total Environ. 2016, 542, 360–371. [Google Scholar] [CrossRef] [PubMed]
- Saidi, K.; Rahman, M.M.; Amamri, M. The causal nexus between economic growth and energy consumption: New evidence from global panel of 53 countries. Sustain. Cities Soc. 2017, 33, 45–56. [Google Scholar] [CrossRef]
- Shahbaz, M.; Zakaria, M.; Shahzad, S.J.H.; Mahalik, M.K. The energy consumption and economic growth nexus in top ten energy-consuming countries: Fresh evidence from using the quantile-on-quantile approach. Energy Econ. 2018, 71, 282–301. [Google Scholar] [CrossRef] [Green Version]
- Nyasha, S.; Gwenhure, Y.; Odhiambo, N.M. Energy consumption and economic growth in Ethiopia: A dynamic causal linkage. Energy Environ. 2018, 29, 1393–1412. [Google Scholar] [CrossRef]
- Podbregar, I.; Šimić, G.; Radovanović, M.; Filipović, S.; Maletič, D.; Šprajc, P. The International Energy Security Risk Index in Sustainable Energy and Economy Transition Decision Making—A Reliability Analysis. Energies 2020, 13, 3691. [Google Scholar] [CrossRef]
- Razmjoo, A.A.; Sumper, A.; Davarpanah, A. Energy sustainability analysis based on SDGs for developing countries. Energy Sources Part a Recover. Util. Environ. Eff. 2019, 42, 1041–1056. [Google Scholar]
- Siksnelyte, I.; Zavadskas, E.K.; Štreimikienė, D.; Sharma, D. An Overview of multi-criteria decision-making methods in dealing with sustainable energy development issues. Energies 2018, 11, 2754. [Google Scholar] [CrossRef] [Green Version]
- Energy Roadmap 2015, COM 885 Final; European Commission: Brussels, Belgium, 15 December 2011.
- Mišík, M. On the way towards the Energy Union: Position of Austria, the Czech Republic and Slovakia towards external energy security integration. Energy 2016, 111, 68–81. [Google Scholar] [CrossRef]
- Mišík, M. Energy Union and the Visegrad four countries: Blurred unity? Int. Issues Slovak Foreign Policy Aff. 2016, 25, 68–80. [Google Scholar]
Figure 1.
Primary production, import, export, and total energy supply in European Union in 2004–2018.
Figure 1.
Primary production, import, export, and total energy supply in European Union in 2004–2018.

Figure 2.
Lorenz concentration curves for energy balance parameters in the EU countries in 2018. Source: Own study based on Eurostat.
Figure 2.
Lorenz concentration curves for energy balance parameters in the EU countries in 2018. Source: Own study based on Eurostat.

Figure 3.
The structure of energy imports in the European Union according to the most important sources in 2004–2018.
Figure 3.
The structure of energy imports in the European Union according to the most important sources in 2004–2018.

Figure 4.
Share of energy import sources in Germany in 2004–2018.

Figure 5.
Share of energy import sources in Netherlands in 2004–2018.

Figure 6.
Share of energy import sources in Hungary in 2004–2018.

Figure 7.
Share of energy import sources in Estonia in 2004–2018.


Table 1.
Dynamics indicators for energy parameters in EU countries in 2004–2018 (year 2004 = 100).
| Countries | Dynamics Indicators for Energy Parameters in 2004–2018 | |||
|---|---|---|---|---|
| Primary Production | Import | Export | Total Energy Supply | |
| Poland | 78.62 | 189.65 | 79.78 | 115.99 |
| Malta | 8387.14 | 173.98 | - | 82.11 |
| Netherlands | 53.63 | 144.62 | 138.33 | 90.79 |
| Slovenia | 98.73 | 143.26 | 349.46 | 95.12 |
| Greece | 72.67 | 128.19 | 344.95 | 76.48 |
| Hungary | 106.35 | 127.99 | 294.41 | 100.86 |
| Estonia | 178.02 | 125.93 | 498.82 | 117.62 |
| United Kingdom | 53.89 | 120.88 | 71.04 | 78.07 |
| Czechia | 81.65 | 116.54 | 86.53 | 94.41 |
| Lithuania | 37.43 | 116.47 | 105.81 | 81.06 |
| Austria | 121.86 | 112.87 | 222.17 | 101.45 |
| Denmark | 45.03 | 112.80 | 48.44 | 88.36 |
| Latvia | 154.84 | 109.60 | 294.55 | 104.55 |
| Cyprus | 392.20 | 109.53 | - | 104.82 |
| Belgium | 87.25 | 108.73 | 129.04 | 91.53 |
| Sweden | 108.14 | 107.93 | 159.63 | 95.75 |
| Croatia | 88.33 | 105.78 | 134.05 | 88.58 |
| Spain | 107.03 | 105.74 | 324.66 | 90.86 |
| EU | 80.87 | 105.58 | 115.19 | 90.10 |
| Portugal | 167.61 | 100.11 | 291.39 | 87.09 |
| Bulgaria | 116.48 | 95.22 | 157.81 | 99.55 |
| Finland | 124.11 | 92.15 | 147.40 | 91.42 |
| Germany | 81.78 | 91.30 | 78.80 | 89.35 |
| Luxembourg | 246.79 | 90.50 | 49.66 | 90.99 |
| Slovakia | 94.66 | 88.12 | 90.45 | 93.23 |
| France | 101.85 | 87.98 | 104.31 | 92.01 |
| Romania | 87.72 | 86.13 | 128.34 | 85.34 |
| Italy | 128.14 | 82.60 | 117.37 | 83.65 |
| Ireland | 268.05 | 78.26 | 139.04 | 95.45 |
Table 2.
Coefficients of variation for energy parameters in EU countries in 2008–2019.
| Countries | Coefficients of Variation for Energy Parameters | |||
|---|---|---|---|---|
| Primary Production | Import | Export | Total Energy Supply | |
| EU | 0.07 | 0.02 | 0.07 | 0.05 |
| Belgium | 0.10 | 0.04 | 0.09 | 0.04 |
| Germany | 0.07 | 0.04 | 0.15 | 0.04 |
| Austria | 0.08 | 0.05 | 0.26 | 0.02 |
| Spain | 0.06 | 0.05 | 0.42 | 0.07 |
| Finland | 0.06 | 0.05 | 0.18 | 0.05 |
| Czechia | 0.08 | 0.05 | 0.06 | 0.04 |
| Sweden | 0.06 | 0.06 | 0.20 | 0.04 |
| Luxembourg | 0.24 | 0.06 | 0.22 | 0.05 |
| France | 0.02 | 0.06 | 0.07 | 0.03 |
| Slovakia | 0.03 | 0.06 | 0.07 | 0.05 |
| Croatia | 0.07 | 0.07 | 0.11 | 0.07 |
| Portugal | 0.18 | 0.07 | 0.45 | 0.07 |
| Latvia | 0.14 | 0.08 | 0.41 | 0.04 |
| United Kingdom | 0.25 | 0.08 | 0.14 | 0.09 |
| Cyprus | 0.38 | 0.09 | 2.59 | 0.08 |
| Bulgaria | 0.07 | 0.09 | 0.18 | 0.05 |
| Lithuania | 0.46 | 0.09 | 0.13 | 0.12 |
| Greece | 0.12 | 0.09 | 0.40 | 0.12 |
| Ireland | 0.52 | 0.09 | 0.19 | 0.05 |
| Italy | 0.08 | 0.10 | 0.10 | 0.08 |
| Denmark | 0.27 | 0.10 | 0.19 | 0.07 |
| Netherlands | 0.18 | 0.11 | 0.12 | 0.04 |
| Slovenia | 0.03 | 0.11 | 0.41 | 0.05 |
| Hungary | 0.04 | 0.12 | 0.31 | 0.05 |
| Estonia | 0.17 | 0.14 | 0.53 | 0.07 |
| Poland | 0.07 | 0.16 | 0.15 | 0.04 |
| Romania | 0.05 | 0.18 | 0.16 | 0.09 |
| Malta | 1.10 | 0.22 | 1.40 | 0.11 |
Table 3.
Pearson’s linear correlation coefficients between energy parameters and the economic parameters.
Table 3.
Pearson’s linear correlation coefficients between energy parameters and the economic parameters.
| Tested Parameters | Pearson’s Linear Correlation Coefficients | |||||||
|---|---|---|---|---|---|---|---|---|
| Primary Production | Import | Export | Total Energy Supply | |||||
| r | P-Value | r | P-Value | r | P-Value | r | P-Value | |
| GDP value | −0.223 | 0.001 | 0.910 | 0.001 | 0.538 | 0.001 | 0.963 | 0.001 |
| Final consumption expenditure of households | −0.216 | 0.001 | 0.891 | 0.001 | 0.528 | 0.001 | 0.950 | 0.001 |
| Export of goods and services | −0.203 | 0.001 | 0.915 | 0.001 | 0.618 | 0.001 | 0.897 | 0.001 |
| Import of good and services | −0.184 | 0.001 | 0.926 | 0.001 | 0.629 | 0.001 | 0.920 | 0.001 |
| GDP per capita | −0.205 | 0.001 | 0.213 | 0.001 | 0.242 | 0.001 | 0.144 | 0.003 |
| Final consumption expenditure of households per capita | −0.170 | 0.001 | 0.400 | 0.001 | 0.377 | 0.001 | 0.327 | 0.001 |
| Value added of agriculture, forestry and fishing | −0.045 | 0.358 | 0.832 | 0.001 | 0.422 | 0.001 | 0.846 | 0.001 |
| Value added of industry (except construction) | −0.187 | 0.001 | 0.890 | 0.001 | 0.466 | 0.001 | 0.941 | 0.001 |
| Value added of manufacturing | −0.200 | 0.001 | 0.875 | 0.001 | 0.428 | 0.001 | 0.926 | 0.001 |
| Value added of construction | −0.213 | 0.001 | 0.870 | 0.001 | 0.515 | 0.001 | 0.929 | 0.001 |
Publisher’s Note: MDPI stays neutral with regard to jurisdictional claims in published maps and institutional affiliations. |
© 2021 by the authors. Licensee MDPI, Basel, Switzerland. This article is an open access article distributed under the terms and conditions of the Creative Commons Attribution (CC BY) license (http://creativecommons.org/licenses/by/4.0/).
Share and Cite
MDPI and ACS Style
Rokicki, T.; Perkowska, A. Diversity and Changes in the Energy Balance in EU Countries. Energies 2021, 14, 1098. https://doi.org/10.3390/en14041098
AMA Style
Rokicki T, Perkowska A. Diversity and Changes in the Energy Balance in EU Countries. Energies. 2021; 14(4):1098. https://doi.org/10.3390/en14041098
Chicago/Turabian StyleRokicki, Tomasz, and Aleksandra Perkowska. 2021. "Diversity and Changes in the Energy Balance in EU Countries" Energies 14, no. 4: 1098. https://doi.org/10.3390/en14041098
Note that from the first issue of 2016, this journal uses article numbers instead of page numbers. See further details here.