
Temperature, Ageing and Thermal Management of Lithium-Ion Batteries


1
Department of Energy and Process Engineering, Norwegian University of Science and Technology (NTNU), 7491 Trondheim, Norway
2
Department of Chemical Engineering, University College London (UCL), London WC1E 6BT, UK
*
Author to whom correspondence should be addressed.
Energies 2021, 14(5), 1248; https://doi.org/10.3390/en14051248
Submission received: 17 December 2020
/
Revised: 15 February 2021
/
Accepted: 22 February 2021
/
Published: 25 February 2021
(This article belongs to the Special Issue Advanced Technology to Improve Energy Efficiency and Storage)
Abstract
:Heat generation and therefore thermal transport plays a critical role in ensuring performance, ageing and safety for lithium-ion batteries (LIB). Increased battery temperature is the most important ageing accelerator. Understanding and managing temperature and ageing for batteries in operation is thus a multiscale challenge, ranging from the micro/nanoscale within the single material layers to large, integrated LIB packs. This paper includes an extended literature survey of experimental studies on commercial cells investigating the capacity and performance degradation of LIB. It compares the degradation behavior in terms of the influence of operating conditions for different chemistries and cell sizes. A simple thermal model for linking some of these parameters together is presented as well. While the temperature appears to have a large impact on ageing acceleration above room temperature during cycling for all studied cells, the effect of SOC and C rate appear to be rather cell dependent.Through the application of new simulations, it is shown that during cell testing, the actual cell temperature can deviate severely from the reported temperature depending on the thermal management during testing and C rate. It is shown, that the battery lifetime reduction at high C rates can be for large parts due to an increase in temperature especially for high energy cells and poor cooling during cycling studies. Measuring and reporting the actual battery (surface) temperature allow for a proper interpretation of results and transferring results from laboratory experiments to real applications.
1. Introduction
The current efforts of transitioning from fossil fuels and traditional energy sources to renewable energy sources have led to a massive increase in the lithium-ion battery (LIB) market. LIBs have become the leading energy storage technology in many sectors due to their high gravimetric and volumetric energy density, high power density, high efficiency, low self-discharge property and compatibility with the existing electric infrastructure [1]. The transport sector has had a large impact on the increase in the LIB market; BloombergNEF forecasts in the Electric Vehicle Outlook 2020 [2] that EVs will hit 10% of the global passenger vehicle sales by 2025 and 58% in 2040, with LIBs being the established energy storage technology [3].
However, for the successful application of LIBs in these market segments, high energy, high power and fast charging rates are required; this is typically associated with large amounts of heat being generated and non-uniform current distribution. This in turn leads to safety problems, decreased performance and long term durability challenges, as reaction rates and diffusivity are temperature dependent. Thermal management systems are used to keep the battery temperature at an optimal range, aiming to enable a uniform temperature distribution. Apart from reversible heat, generated heat is an indicator of lost work during energy conversion during the charging and discharging process.
Many studies in the past three decades have been devoted to improving the understanding of the thermal behaviour of LIBs at cell and pack level. Experiments and numerical thermal simulations are the preferred methods in most studies [4,5,6,7,8], and several cooling methods have been proposed and researched [9,10,11,12].
Firstly, a comprehensive literature review of experimental ageing studies is presented and secondly combined with new thermal modelling. The aim is to illustrate the importance of the thermal management system and proper temperature monitoring during ageing studies for comparability and transferability of results from laboratory experiments to real battery applications. The first section provides a brief, didactic overview of the working principal of LIB in general, the most common materials used in commercially available LIB and the development trends, as well as thermal modelling and thermal management systems. The second section is a review of experimental cycling and ageing studies on capacity degradation and resistance increase. Those studies are compared in terms of the effect of operation conditions (temperature, state of charge (SOC) and C rate). The third section presents the simple thermal model used in this work for an evaluation of the importance of thermal management during degradation studies. Finally, the results of the thermal modelling are presented and used for an evaluation of the comparability of degradation studies and the validity of those when it comes to differentiating between ageing acceleration due to temperature and C rate increase.
1.1. Working Principle and Geometries
A LIB cell (as schematically shown in Figure 1) utilizes two open-structured materials as electrodes, where the lithium-ions (Li-ions) intercalate. The positive and negative electrode are attached to current collectors and separated by an electrolyte filled separator. The electrolyte-filled separator provides Li-ion transport and prevents electron flow. While charging, Li-ions from the positive electrode dissolve in the electrolyte solution, forming a positive ion and an electron in an oxidation reaction [13]. The Li-ions move to the negative electrode through the electrolyte while the electrons circulate through the external circuit. The negative electrode consumes the electrons upon intercalation of the Li-ions. During discharging, the Li-ions and electrons circulate in opposite directions than during charging. By definition, the electrode that has the oxidation reaction during discharge is the anode and the reduction reaction during discharge takes place at the cathode [14]. As LIBs are typically operated outside the electrochemical stability range of the electrolyte, the organic electrolyte is partially reduced and forms a passivating layer on the anode. This layer is called the solid electrolyte interphase (SEI) and mostly prevents the further reduction of electrolyte, however, an unstable SEI layer leads to further consumption of Li-ions and increase in the impedance of the cell during operational lifetime [15].
The current collectors are cast with electrode material on both sides. One cell consists of electrode and separator sheets sandwiched with anode/cathode/anode or cathode/anode/cathode. Those cells are stacked to form a full battery. The most common battery geometries are pouch cell, cylindrical cell, button cell and prismatic cell. To fulfil energy and voltage requirements, several batteries are connected in series and parallel as a pack. Different types of spacing are used between the batteries or packs to stop failure propagation and help with thermal management.
1.2. Currently Used Chemistries and Development Trends
Most commercially available LIBs consist of a carbon-based intercalation anode and a cathode utilizing mixed lithium transition metal oxides or olivine compounds. The most widely used cathode materials are the lithium transition metal oxides, lithium cobalt oxide (LCO), lithium nickel cobalt manganese oxide (NMC), lithium nickel cobalt aluminium oxide (NCA), and lithium manganese oxide (LMO) and the olivine lithium iron phosphate (LFP) [16]. These cathode and anode compounds are typically mixed with small quantities of a polymeric binder (e.g., polyvinylidene fluoride) and conductive agents (e.g., carbon black) and printed onto a metal current collector (aluminium for the cathode and copper for the anode).
The requirements on high energy/power density, cost reduction, prolonged lifetime, and safety are steadily increasing and are major driving forces in the LIB research. The common strategies on increasing the energy density on the material level are to improve the specific and volumetric capacities as well as their operating potentials, i.e., maximizing the cell voltage with cathode materials operating at high electrode potentials and anode materials operating at low electrode potentials. The most promising trends in the LIB world are electrodes with a significantly higher theoretical capacity, such as silicon [17], increasing energy density by using higher cell voltages [18], increasing ionic and electronic conductivity to allow thicker electrodes and the utilization of solid-state electrolytes to enable higher charging rates [19] and improved safety [20].
Cathode Materials: LCO, LMO, NMC, and LFP
LiCoO (LCO) was introduced by Goodenough in 1980 [21]. By combing the cathode material with a carbon anode, Sony introduced the first successful commercial LIB on the market around 1990. Until now, LCO remains one of the most used cathode materials of commercial available LIBs [22]. It is a layered transition metal oxide: cobalt (Co) and Li are located in octahedral sites and occupy alternating layers, forming a hexagonal symmetry. The paths for lithiation and delithiation are planes. The average operation voltage is 3.8 V [16]. Despite a high theoretical capacity of 270 Ah/kg, only around 145 Ah/kg can be reversibly accessed, due to the risk of structural instability [23]. The main drawback with LCO is the toxic and expensive Co and poor thermal stability. The poor thermal stability is caused by an exothermic release of oxygen when an LCO cathode is heated above a certain point, leading to a thermal runaway reaction [16]. To obtain cheaper materials and increase Li utilization, new materials are being developed, trying to replace Co with cheaper transition metals like manganese, nickel, and iron [23].
By substituting Co in LCO cathodes with Manganese (Mn), the cathode material LiMnO (LMO) was obtained. It has a spinel structure, with manganese occupying the octahedral sites and Li predominantly occupying the tetrahedral sites [24]. Here, the paths for lithiation and delithiation are a three-dimensional network of channels [25]. The average operating voltage is 4.1 V and the theoretically available specific capacity 148 Ah/kg [16]. The cathode material LiNiMnO (NMO) was the result of extensive research efforts to create a cheaper cathode material. However, to enhance rate capability, Co was added and resulted in the formulation of LiNiCoMnO (NMC). NMC has a similar or higher achievable specific capacity than LCO, while having lower costs due to a reduced Co content. Nowadays, the commercially most available form is LiNiCoMnO, with an average voltage of 3.7 V and theoretically available specific capacity of 280 Ah/kg [16]. However, compositions with increased nickel (Ni) content (LiNiCoMnO with x > 0.6) have recently received an increase in interest, as they provide larger specific capacities and energy densities and lower the costs due to the higher capacity and lower costs of Ni compared to Co [26,27,28,29,30,31,32,33]. The common abbreviation NMC is added with numbers indicating the decimals of each element (e.g., NMC523: LiNiCoMnO). Ni is associated with higher capacity, cobalt with better rate capability and manganese with improved safety/stability [29]. One of the major drawbacks with nickel rich NMC is the decreased thermal stability. Some EVs of the current generation already employ NMC with a Ni:Co:Ma ratio of 5:3:2 [29], which was shown to have so far the optimized composition, offering a reasonably good thermal stability and high capacity due to a well-balanced ratio of Ni content to Mn and Co contents [34]. The main problems with Ni-rich NMC cathode, summarized by Schipper et al. [29], are the large amount of highly reactive Ni at high SoC that lead to undesired side reactions with the electrolyte solution and the poor thermal stability resulting in serious safety concerns. In addition, it leads to Li and Ni cation lattice substitution and corresponding spinel formation on the electrode particle crystal surface which eventually results in inactive Fm(-)3m phase and capacity fade. Additionally, the composition in a ratio of 8:1:1 during cycling will lead to cracks in the secondary particle along the grain boundaries which result in increased surface area and thus more active sites for parasitic reactions [30]. Research is therefore focused on ensuring stability while increasing the nickel content. Increased Ni content can also result in increased cation mixing and increased parasitic reactions at the valence of surface Ni increases towards highly reactive Ni. Additionally, to maintain a layered structure, excessive Li is used for Ni rich NMC cathodes. Side reactions with water vapour and CO in air can lead to the formation of LiOH and LiCO on the surface that thickens when cycled [35]. Research is mainly focused on creating artificial cathode-electrolyte interphases, either by introducing functional groups on the surface [30], electrolyte additives [32] or surface coating [36].
LiFePO (LFP) was first reported by Goodenough in 1996 [21]. It has an olivine structure, with covalently bonded PO groups forming the PO tetrahedron together with a chemically stable Fe/Fe couple within the FeO octahedron. During charging and discharging, the Li-ions are respectively extracted from and inserted into LiFePO, while the central iron ions are oxidized and reduced. The main advantages of this material are the use of inexpensive and environmentally benign Fe as well as the very good safety characteristics due to the structure and voltage plateau at 3.4 V which suppresses electrolyte degradation. The main disadvantage is the low volumetric energy density with a theoretical available capacity of 170 Ah/kg [16].
Anode Materials: Hard Carbon, Graphite and Silicon
Anode materials are commonly divided into three main categories, depending on their LIB performances and reaction mechanisms. These are intercalation anodes which are mostly carbon-based, alloy anodes like silicon, and germanium and conversion anodes using transition metal compounds like oxides, phosphides, sulphides, and nitrides [37].
Currently, the most common commercial anode materials are based on carbon. Carbon is cheap, has a low delithiation potential vs. Li/Li, high Li diffusivity, high electrical conductivity and relatively low volume changes during lithiation and delithiation. Carbon anode materials can be divided into graphitic carbons and hard carbons [16]. Graphite is a three-dimensional ordered crystal with large graphite grains and a density of 2.26 g/cm [38]. It is a very stable allotrope of carbon. During battery operation, a Li atom is intercalated between the graphite layers to form an intercalation compound (i.e., LiC). The surface most exposed to the electrolyte is the basal plane, but the Li-ions predominantly intercalate into the graphene layers through the edge planes which are normal to the graphene layers [39,40]. During the intercalation of Li, the graphitic particles undergo uniaxial strain along the edge planes [41]. Hard carbon or “non-graphitized carbon” consists of two dimensional “ordered” graphene sheets, which are randomly stacked. The structure of both hard carbon and graphite are schematically shown in Figure 2. Its density is between 1.4 and 1.8 g/cm and is smaller than graphite [38]. The SEI layer that is formed on the carbon anode depends on the properties of the carbon/graphite. Important factors are the degree of crystallinity, basal-to-edge-plane ratio, particle and pore size, and surface chemical composition. A high degree of graphite crystallinity is preferred for high energy LIB anodes [40], but the strains during the intercalation of Li in the graphitic particle may damage the SEI and reduce the cell’s cycle life. On the other hand, SEI on hard carbon is thicker, due to the accumulation of electrolyte-reduction products in surface voids [39]. Moreover, hard carbon has a higher fraction of exposed edge planes and therefore an increased quantity of SEI formed in the first cycles [16].
Vast amounts of research have been focused in recent years on increasing the capacity of the anode by using silicon [42]. Silicon anodes offer an up to 10 times higher gravimetric capacity, and a higher potential (∼0.4 V vs. Li/Li) than currently used carbon anodes [17]. However, silicon anodes show poor cycling stability due to large volume expansion and contraction (300–400%) and subsequent cracking during the lithiation and delithiation. During the volume changes, the SEI layer is damaged and new SEI is constantly formed and consumes Li-ions. Therefore, so far, only small amounts of silicon particles combined with silicon dioxide and graphite are used for commercial LIBs.
To be able to increase the amount of silicon in the anode while maintaining long-term capacity retention, different strategies are currently explored. A large focus is on using nanostructured silicon to overcome surface cracking and particle fractures as Liu et al. [43] found that the critical particle size is 150 nm. Nanomaterials and structures like nanoparticle, nanowires, nanotubes and nanoporous networks have shown superior electrochemical properties [44,45,46,47], but industrial applications are still challenging, as their fabrication is not yet cost-effective [37]. Other efforts are focused on finding new binder materials [48,49], new electrolytes and electrolyte additives (e.g., fluoroethylene carbonate) that stabilize the electrolyte/electrode interphase [48,50] or surface modification like molecular layer deposition [48]. Other considered options are the coating of Si particle with graphene [51], increasing the porosity [52] and using composite anodes, e.g., formed by silicon, Li and highly electronically conductive materials such as TiC/C [45,53]. Moreover, applying special cycling procedures that use for example limited potential windows [54,55] or prelithiation of the anode by introducing an alternative Li source [56,57,58,59] are considered. Prelithiation leads to a high initial Coulombic efficiency and prevents the Li in the cathode from being consumed during the initial SEI formation. One approach is to bring a Li foil in contact with an electrolyte-wetted anode in a temporary cell to realize electrochemical prelithiation.
Separator, Electrolyte and Additives
The purpose of the separator is preventing direct electrical contact between the cathode and the anode and thus avoiding short-circuiting. Commercially used separators utilize mostly polyolefin-based microporous membranes like polyethylene (PE), polypropylene (PP) or PE/PP composite membranes. They have good mechanical properties, chemical stability and are economically viable. However, their low porosity, insufficient electrolyte wettability, and low melting point can affect the electrochemical properties and safety of LIBs [60]. In recent years, research was focused on improving the performance of polyolefin-based separators by coating common membranes. These coated separators showed improved thermal stability [61]. However, this method reduces the porosity, and more recent approaches have been focusing on using electrospinning to obtain microporous nanofiber membranes with high porosity and enhanced wetting properties [62,63,64].
The electrolyte interacts with all components in the battery and is therefore important for power density, cycling stability and safety of the battery. The most important criteria for a good electrolyte is good ionic conductivity, whilst being electronically insulating, a wide electrochemical stability window to prevent electrolyte degradation, being inert to other components, as well as low costs, non-toxicity, and sustainability. Most of the electrolytes used in commercially available LIBs are non-aqueous solutions utilizing lithium hexafluorophosphate (LiPF) salt, dissolved in organic carbonates, mostly mixtures of ethylene carbonate (EC), dimethyl carbonate (DMC), propylene carbonate (PC), diethyl carbonate (DEC) and ethyl methyl carbonate (EMC) [65]. Electrolyte additives are used to improve the performance of LIBs. The amount is usually no more than 5%. Additives are mostly utilized to improve the SEI formation, protect the cathode, stabilize the LiPF salt and increase safety [66].
Solid-state electrolytes (SSE) have attracted great attention as the key components for all-solid-state LIBs, allowing high safety and increased energy density due to improved stacking. By replacing the organic liquid electrolytes and separator with an inorganic solid electrolyte, it is possible to use higher potential cathode materials due to an improved electrochemical stability. As SSE are inorganic they are not flammable. Additionally, they are reported to enable higher charging rates as, in contrast to liquid electrolytes, no concentration gradient is built up during charging and discharging at high rates [19]. The major downside with SSE is about 10 times lower ionic conductivity compared to liquid electrolytes resulting in high resistance and therefore high losses at high rates [20]. Furthermore, achieving simultaneous electron and ion transport at the interface is challenging [67]. Different electrolytes are currently investigated, with NASICON-, garnet- and perovskite-type solid electrolytes being the most promising ones for application in all-solid-state LIBs. However, Zheng et al. [20] concluded in their extensive review that further improvement is necessary for the compatibility between solid electrolytes and electrodes.
1.3. Thermal Modelling
Numerical simulations can simulate the thermal behaviour of the whole batteries and can be fitted to different conditions and geometries by alternating model parameters. The models can be classified into two major categories according to the underlying mathematical model. A first category is a multiphysics approach where a thermal model is mostly coupled with an electrical model (based on an equivalent circuit) [68,69] or an electrochemical model [70,71]. The second category is a purely thermal model based on solving the energy balance and heat generation equation with the respective boundary conditions. Bernardi et al. [72] presented one of the first thermal models by deriving a general energy balance for battery systems with heat generation due to phase changes, enthalpy of mixing and enthalpy of reaction consisting of heat due to overpotential, ohmic heating and entropic heat. They showed that a simplified form, where the heat generation due to phase changes and enthalpy of mixing is neglected, is valid for most systems. The heat is transferred inside the battery by conduction and therefore determined by the thermal conductivities of all components.
1.4. Thermal Management
The primary aim of a battery thermal management system (BTMS) is to maintain the batteries within the optimum operating temperature range with a uniform temperature distribution inside the cell and the pack. It is of utmost importance to enable a uniform temperature distribution on both cell and pack level, as uneven temperature distribution leads to non-uniform and accelerated degradation [73]. An unbalanced system restricts the optimum performance and decreases the lifetime of a battery severely [74]. The magnitude of the overall heat generation of the battery under load dictates the size and design of the cooling system needed [75].
Generally, BTMS can be categorized into internal and external systems and according to the used cooling medium. External systems remove the generated heat from the battery surface in different forms and geometries [9,10,76]. External BTMS using air cooling is the most traditional approach, studied intensively, and is widely adopted in commercial applications. The efficiency of external systems is limited, as the maximum temperature of a battery is located at the internal portion of the cell. Therefore, increasing the velocity of the cooling medium in the external BTMS increases the difference within the cell—enhancing non-uniformity [73]. To enable a BTMS that contributes to a uniform temperature distribution while removing heat, several internal cooling systems have been proposed. Mohammadian et al. [11] embedded microchannels into the electrode area using an electrolyte as a coolant. They concluded that at the same pumping power internal cooling decreases the internal bulk temperature more than external cooling with a more uniform temperature distribution. Shah et al. [12] proposed using an annular channel through the axis of a cylindrical 26650 cell. They concluded that airflow, heat pipe insertion and using a thin metal rod result in sufficient cooling.
BTMS can also be categorized based on the cooling medium used. Air cooling and liquid cooling are frequently used, but also phase change (liquid to gas) cooling, phase change (solid to liquid) cooling and combinations of them are obtaining increased attention [10]. As already mentioned, although air-cooling has the advantages of low cost, simple structure and abundant source of coolant materials, it lacks efficiency. It can be differentiated in natural air-cooling and forced air-cooling using fans to drive an airflow. Liquid-cooling is also frequently used with high cooling efficiency. It has been used in commercial EVs like General Motors Volt and Tesla Model S [10]. It generally allows a better battery temperature control than air-cooling, especially at higher charging and discharging rates. Direct liquid cooling the cells or battery pack is stored in a fluid environment, whereas in an indirect liquid-cooling system, the coolant is circulated between the battery pack and a heat sink [77]. The efficiency is mostly influenced by fluid flow rate, fluid temperature, flow channel structure and cooling medium. The main disadvantage of this liquid cooling methods is the increase in weight and space consumption, due to extra components like pumps, valves and cooling channels. It also increases the parasitic power costs and therefore decreases cooling efficiency [10].
To enable an efficient thermal management system without adding motive components, research has been focused on utilizing phase change materials (PCM). The generated heat can be absorbed by PCMs during the phase change process. Often, thermal conductivity enhanced materials like graphite sheets, metal foam or carbon fibre are added to allow a rapid transfer of heat to the PCM. Huang et al. [78] proposed the use of flexible form-stable composite PCM embedded in battery packs to lower the thermal contact resistance and improve the thermal control performance. Another option is the utilization of the liquid to gas phase change. This is often done in combination with exploiting the heat pipe effect. The generated heat vaporises the working fluid which flows up to the condenser due to the energy density difference and is condensed there. After being transformed into a liquid state, it moves back to the evaporator under the effect of capillary force [79]. Fang et al. [10] proposed thermal management for a tube-shell LIB pack using water evaporation, using a sodium alginate film with high water content coupled with forced air cooling.
Chen et al. [80] compared cooling methods for a LIB pack for electric drive vehicles. Their results show that an air-cooling system needs 2 to 3 times more energy compared to fin cooling and direct and indirect liquid cooling to keep the same average temperature. An indirect liquid cooling system was found to have the lowest maximum temperature rise and a fin cooling system adds the most weight (about 40% extra weight of cell). Indirect liquid cooling (cooling of fins) is a more practical form than direct liquid cooling, though it has a slightly lower cooling performance.
2. Comparing Ageing and Degradation Studies
In the following, a review of experimental cycling and calendar ageing studies is presented, focusing on capacity degradation and resistance increase. The reviewed studies are compared in terms of the effect of operation conditions on the ageing rates.
2.1. Ageing Mechanism
The performance of a LIB deteriorates over time, which includes both losses of available energy and power. This results from a capacity degradation and a resistance increase. This degradation is caused by different ageing mechanisms and is frequently studied for different cell chemistries. Battery degradation is known to be a result of several simultaneous physicochemical processes: these processes lead to loss of Li inventory (LLI), loss of active materials (LAM), and impedance increase due to reaction kinetics degradation [81]. LLI is mainly caused by the growth and decomposition of the SEI layer, electrolyte decomposition, and Li plating and dendrite formation. LAM can be introduced by the dissolution of material, structural degradation, particle isolation, corrosion of current collector, loss of electric contact and electrode delamination. Increased impedance is a result of the formation of passive films at the active particle surfaces, pore-clogging, as well as electrolyte conductivity losses and loss of electric contact [4]. The increase in internal resistance causes an earlier termination of the charging or discharging process. These degradation mechanisms are influenced by time, (ambient) temperature, current load, voltage, accumulated ampere-hour throughput, and mechanical stress [4,5,6,7,8].
The ageing, underlying mechanisms, and influencing factors are investigated in different ways. Dubarry et al. [4] categorized the ageing investigation methods into experimental, modelling, post mortem and electrochemical voltage spectroscopy. Experimental ageing studies on different commercially available chemistries will be compared in terms of capacity degradation and internal resistance increase in the following.
2.2. Definitions and Calculations
Traditionally, capacity degradation was used to describe the ageing behavior of a battery. In recent years, changes in internal resistance have received more attention as an ageing characteristic as well. When considering ageing in connection with internal temperature, ohmic resistance plays a significant role. As the resistance increases, the ohmic heat generation increases and the available energy is reduced as power is lost to ohmic heating. This is especially significant for high C rates.
Capacity degradation can be presented in different ways. One way of evaluating the battery degradation is relating the cell coulombic capacity at a specific point to the initial cell capacity. This relative cell capacity is frequently used in ageing studies [6,7] and generally referred to as the state of health (SOH) [82], normalized capacity [8] and relative, remaining or relative discharge capacity [5,83,84]. Another way of evaluating battery degradation is by presenting the accumulated capacity loss normalized to initial conditions using the terms maximum available capacity degradation [85] and degradation percentage [86]. Moreover, it is common to measure the capacity at a given C rate to allow for comparison between different test regimes. The available capacity varies; C rate as the charge at the lowest SOC is less available at higher currents.
The resistance of a battery depends on SOC, current, temperature, pulse duration and frequency. In ageing tests, several resistance measuring methods can be used to characterize ageing, where most studies use pulse resistance [6,7,81,85,87]. Resistance values by the pulse measurements are calculated using the voltage step method, based on Ohm’s law. Here, a current pulse is applied to the cell at equilibrium voltage. The internal resistance can be derived from the overvoltage due to the current pulse that immediately occurs. Therefore, the difference in voltage before and at the end of the pulse is divided by the currents at the respective points. Depending on the length of the current pulse, different impedance effects are included in the measured resistance. While at low frequency or short current pulses (around 1 ms), only purely ohmic resistance is included, at medium length pulses a combination of ohmic resistance and charge-transfer resistance are measured. Impedance effects due to solid-state diffusion processes are only included when the current pulse is long enough. Electrochemical impedance spectroscopy (EIS) is often used to differentiate between the impedance distributions. The ohmic resistance of a cell is typically caused by the electrolyte resistance and the contact resistance of current collector and active mass. The electrolyte resistance depends on the ionic conductivity, which changes with the concentration of the conductive salt. As this concentration is changing with ageing, ohmic resistance is often used to identify electrolyte degradation [88]. The measured internal resistances compared in this study are using 10 to 20 s pulses.
Ageing studies can generally be divided into cycle life and storage (shelf, calendar) life studies. Storage life studies look at battery degradation versus the time that a battery was stored under specific conditions. For this, the presently reviewed calendar ageing studies performed characterization tests before storing and periodically after storing at the defined SOC and temperature for specific time intervals. The characterization tests mostly consist of capacity measurements using 1 to 3 cycles and IR (ohmic potential) measurements at room temperature (defined either at 20 °C or 25 °C). Schmitt et al. [84] showed that the degradation due to this electrochemical testing plays a significant role when looking at the relatively small degradation rates during storage. They showed that the resistance increase after 186 days, for a storage test with intermediate characterization tests can be more than 3 times the resistance increase for a storage test without intermediate characterization tests. Therefore, the frequency of the characterization tests has to be considered carefully when discussing and comparing calendar ageing studies.
Cycle life studies look at battery degradation when continuously cycled. For the evaluation, the amount of cycling is quantified in different ways. Some studies look at the number of cycles defined as one charge and one discharge until specified cut-off voltages [81,85,86] or the degradation to the time that the battery is cycled [8,82]. Other studies relate the current cycle capacity to the original cell capacity. This method is applied using the terms normalized cycles [5], full equivalent cycles [7] or equivalent full cycles [81]. This method will be referred to as full equivalent cycles (FEC) in the following. To compare ageing data from different studies, the cycling time and the number of cycles were calculated to FEC. The cycling time was converted to FEC by multiplying with half of the C rate as the C rate is the rate at which a battery is discharged relative to its initial capacity (a C rate of 1C means that the discharge current is equivalent to that of discharging a battery from 100% to 0% SOC in 1 hour, e.g., from 70–20% SOC in half an hour). The number of cycles was converted to FEC by multiplying the cycle number with the depth of discharge (e.g., 80% in case of a SOC window of 10–90%) and integrating the capacity loss over the number of cycles using a linear regression between two measurement points. When evaluating degradation characteristics batteries are cycled in different SOC windows (e.g., 20% to 80% SOC) or stored at a specific SOC. Some studies use the term Depth of Discharge (DOD) instead of SOC. The DOD can either be given from 100% SOC, so that e.g., 60% DOD is equal to a SOC window of 40% to 100%, or DOD can be given around 50% SOC, so that e.g., 60% DOD around 50% is equal to a SOC window of 20% to 80% SOC (as one utilises 60% around a reference SOC at 50%) [7].
2.3. Cycling: Capacity Fade and Resistance Increase as a Function of Temperature, C Rate and SOC Window
Capacity fade and resistance increase and the effect of different parameter on those are compared for cycling ageing for different chemistries and studies.
2.3.1. Capacity Fade
The capacity degradation as a function of FEC from different reviewed cycle life studies are presented in Figure 3. All presented studies use commercial LIB and cycle with a C rate (charging/discharging) of 1 C/1 C, within a SOC window of 0–100% and a temperature of 25 °C unless specified otherwise in the legend. The cathode and anode material are specified in the figure legend, more details are presented in Table 1. The studied batteries are numbered to simplify referencing. All studies use a climate chamber for temperature regulation (except [89]) without further specifying the cooling strategy. It is noticeable that three studies report a significantly slower degradation of the observed batteries (3, 8, 11) than all others (1, 7, 13–16). The slower degrading batteries are those using a NMC cathode and a carbon anode without silicon and LFP/graphite. A SOH of 80% and thus the defined end of life for automotive applications was reached after nearly 3150 FEC for LFP/graphite (3) and 4000 FEC for NMC/hard carbon (8). The NMC/graphite (11) reached more than 8800 FEC, but it has to be noted that this battery was cycled with a reduced DOD of 80%. The NMC/hard carbon (8) shows a drop in SOH around 500 FEC and a further steady decrease in SOH afterwards. The SOH of the LFP/graphite (3) drops to around 3000 FEC. The other study on an LFP/graphite (1) presented in the figure shows a significantly faster capacity degradation. A SOH of 80% is already reached after 600. Both studied batteries are cylindrical but the better performing battery (3) has 2.3 Ah, while the other only has 1 Ah. Although, the most significant difference is the ambient temperature during operation. The faster degrading battery was operated at 45 °C, while the other was operated at 30 °C. The other batteries with significantly larger degradation rate are NMC/LMO blend with carbon anode (7), NMC with Si/C (13, 14) and the LCO/graphite (15, 16). The NMC/LMO blend with carbon anode (7) has a slow degradation rate for the first 500 FEC before the capacity starts decreasing quickly, reaching a SOH of 80% around 800 FEC.
Both NMC batteries with a Si/C anode (13,14) degrade significantly faster than the NMC batteries with carbon-based anodes without silicon (8, 11). The capacity of battery 14 decreases extremely fast; a SOH of 90% is already reached after less than 100 FEC. Battery 13 reaches a SOH of 90% after around 400 FEC. (For comparison: the NMC batteries with silicon free anodes reach this after around 1900 FEC (8) and 3800 FEC (11)). Both studied batteries are cylindrical but the better performing battery (13) has 1.3 Ah while the battery 14 has 3.45 Ah. While battery 13 is cycled at 45 °C with 1 C, battery 14 is cycled only at 25 °C and 0.5 C. While the NMC type was not specified for battery 13, battery 14 has a Ni-rich NMC cathode.
The SOH of both LCO/graphite batteries starts decreasing quickly from the start, reaching a SOH of 80% already around 500 FEC for battery 15. The study on LCO/graphite 16 is not as extensive. However, the capacity degradation is a little slower. Battery 15 is cylindrical and has capacity of 2.4 Ah while battery 16 is prismatic and has a capacity of 1.35 Ah. The charging current in the study of battery 16 is only 0.5 C.
It must be addressed that not only the anode and cathode chemistry differ between the batteries in the reviewed studies, but also other factors like electrolyte composition, size and geometry. While the electrolyte composition is not communicated, size and geometry are in most studies. Table 1 shows that the nominal capacity of the batteries vary between 1 and 40 Ah. It is noticeable that the two largest batteries (11, 13) belong to the three batteries that are degrading the slowest. Unfortunately, it is not possible to draw any conclusion from this, as no comparable study with smaller NMC batteries was found in literature. In general, it appears that the battery size does not impact the degradation behavior as much as electrode material composition or operating condition. While for LFP/graphite (1, 3), the smaller battery showed a faster degradation, for the studies with NMC/SiC (13, 14) and LCO/graphite (15, 16), the larger battery showed a faster degradation. In all cases, either the temperature, cathode composition or C rate varied between the studies as well.
Figure 4 shows the FEC relative to the number of cycles at 25 °C (18 °C for LFP/Graphite) at constant SOH as a function of temperature. For example; the lighter green line compares NMC/LMO at 80% SOH. When cycling this battery at 60 °C, one only achieves around 40% of the cycle compared to that of 25 °C. The figure therefore illustrates the accelerating effect of increased temperature on batteries using NMC/LMO blend, NMC, LCO, and LFP as the cathode material and a carbon-based anode. Although NMC/Hard carbon and LFP/Graphite age slowest, it appears that they are more temperature-sensitive compared to LCO and NMC/LMO. When considering a temperature increase from 25 °C to 55 °C for the NMC battery, the SOH of 80% is already reached after only 5% of the FEC. It is also striking that except for a SOH of 95%, the temperature dependency is nearly linear and very similar for different SOH, which is important for temperature accelerated ageing tests. The capacity degradation of the battery with NMC/LMO shows a lower but still significant temperature dependency with a decreasing impact with ageing. The lowest impact can be observed for the battery with the LCO cathode. Increasing the temperature from 25 °C to 55 °C results into a 60% decrease of FEC at a SOH of 95%. The battery with LFP cathode shows a decrease in capacity, with temperature similar to the battery with NMC cathode. It is also noticeable that NMC, LCO, LFP have the largest temperature dependency in a temperature interval between 25 °C and 40 °C. A further increase in temperature has a declining effect on capacity degradation. The temperature dependency of the NMC/LMO shows the same trend for a SOH of 95%, but appears to be most sensitive to temperature changes in a temperature interval of 50 °C to 60 °C for further cycling.
Figure 5 illustrates the accelerated capacity fading due to an increased charging rate. Moreover, the y-axis represents how many cycles one can expect at a given C rate relative to 1 C, with all other conditions unchanged. Generally, the chemistries with the poorest ageing properties are also the ones most sensitive to rate changes. When increasing the charging rate from 0.5 C to 1.5 C for the LCO battery, a SOH of 85% is reached after only 30% of the FEC. However, initial accelerated ageing for a C rate of 0.5 C as a 95% SOH is already reached 20% faster. The accelerating effect of the C rate on degradation is even more significant at the beginning of cycling. For the battery with the NMC cathode, the effect of the charging rate increases with ageing. Only around 50% of the FEC can be realized before reaching a SOH of 80% when increasing the charging rate from 0.5 C to 1.5 C. It is noticeable that while dependency on charging rate for NMC seems to be linear, the dependency for the LCO is higher when charging rates of 1 C and higher are reached. For the battery with LFP cathode, an increase of the C rate from 1 C to 2 C seems to have nearly no effect.
Figure 6 shows the amount of FEC for different SOC windows around a SOC of 50% relative to a SOC window of 0–100%, which was the only common point of reference. The batteries with NMC cathode benefits from decreasing the SOC window. When decreasing the SOC window from 0–100% to 20–80%, a SOH of 95% is only reached after nearly 2 times the amount of FEC. A further decrease to 40–60% seems to bring no further improvement. The battery with the LFP cathode shows a complex relationship between SOC window and capacity degradation with plateaus between the DOD of 100% to 60% and 50% to 10%. Decreasing the SOC window from 0–100% to 25–75% bisects the amount of FEC that can be realized until a specific SOH. A further decrease in the SOC window until 45–55% has no additional effect. The voltage window of a LFP cathode is more narrow than other cathodes. It never reaches as high a voltage as NMC etc., which are especially critical for the stability. This explains why a decrease in the SOC window is not beneficial.
One can summarize that NMC and LFP with a carbon-based anode perform the best at a constant and moderate temperature, as they are very sensitive to an increase in temperature beyond room temperature. Temperature has the largest impact on the ageing behaviour for all the chemistries. Only LCO/graphite appears to be aged more aggressively by charging rate in comparison to ambient temperature. Increasing the charging rate from 0.5 C to 1 C has a similar effect on the capacity as increasing the ambient temperature from 25 °C to 35 °C.
The effect of an increased C rate and SOC window seem to be in the same order of magnitude for the battery with NMC and carbon based anode, with the effect of the SOC window being smaller for the study using a larger variation in SOC window and a graphite anode instead of hard carbon. This leaves an unanswered question about if a further reduction of the SOC window is accelerating ageing more or if it is the anode material that is responsible for the change in behaviour? The LFP/graphite seems to be most sensitive to an increase in temperature, followed by the variation in SOC window and showing nearly no effect when changing the charging rate.
2.3.2. Resistance Increase from Cycling Rate
Most studies only communicate the relative changes of the resistance during cycling. However, when looking at the few reported values, it stands out that the internal resistance of LCO appears to be significantly larger than for NMC. Gao et al. [85] report a 1 s resistance of approx. 33 m at the beginning of life (BOL) for the LCO battery they evaluate, while Richter et al. [93] and Gao et al. [81] report an internal resistance of around 2–3 m for NMC batteries. All evaluated studies [81,85,87] that examine the effect of cycling on the internal resistance show that, apart from an initial decrease in resistance for certain conditions, cycling increases the resistance of a LIB.
The elevated operating temperature has the largest impact on the rate of resistance increase, followed by an increased C rate over 1 C [85,87]. Some studies show that by reducing the SOC window the effect on the C rate increase can be reduced [87]. The effect of the SOC window is inconclusive when comparing different studies. Wikner et al. [87] show that the resistance increase is most pronounced at higher SOC windows in their study with an NMC/LMO cathode and surface-treated natural graphite anode. On the other hand, Gao at al. [81] show that the resistance increase in their study with an NMC cathode and graphite anode is most pronounced at low SOC windows.
2.4. Calendar Ageing: Capacity Fade as a Function of SOC and Temperature
2.4.1. Capacity Fade
When comparing the results from calendar life studies for the cathode materials NMC and LFP stored at 100% SOC and a temperature between 20 and 30 °C, the study by Schmitt et al. [84] with a NMC-graphite battery and two studies with LFP-graphite batteries by Grolleau et al. [92] and Naumann et al. [83] show a similar behavior in capacity degradation over time. However, the study by Richter et al. [5] with a battery with NMC cathode and hard carbon anode has the largest decrease in SOH with time. It can be observed that the capacity decrease slows down with time. In literature, this is often modeled as square root dependency and explained with the growth rate of the SEI. The increased SEI thickness results in a reduction of the solvent diffusion rate and consequently to a slowing down of SEI growth and capacity loss [83]. As expected, the battery stored at 20 °C loses capacity slower than the one stored at 25 °C. However, the capacity of the LFP battery stored at 25 °C in the study by Naumann et al. [83] fades slightly slower than the capacity of the LFP battery stored at 30 °C in the study by Grolleau et al. [92]. Figure 7 shows that increasing the temperature has an accelerating effect on the capacity degradation of an LFP battery, even though this effect is not very severe. This is similar for all compared studies [6,83,92], although the study by Grolleau et al. appears to be the least affected by temperature. It is only possible to speculate what the reason for this behavior is. One reason can be different testing schedules with more frequent characterization cycling and temperature change in the studies with faster fading or slightly different cell chemistries (e.g., electrolyte additives, crystallinity of the graphite) that were not communicated, or different battery sizes (e.g., 3 Ah in Naumann et al., 15 Ah in Grolleau et al.).
Figure 7 shows the storage time relative to a temperature between 40 and 45 °C for batteries with an NMC cathode and a hard carbon anode and LFP cathode and a graphite anode. The effect of increasing the temperature from room temperature is more severe for the NMC battery and increases with ageing. When increasing the storage temperature from 25 °C to 42.5 °C, a SOH of 85% is reached 6 times faster and 15 times faster when increasing the storage temperature to 55 °C. All three studies on batteries with LFP cathode show that the capacity degradation is increasing with temperature as well, however less significant than for the NMC battery. When increasing the storage temperature from 25 °C to 40 °C, a SOH of 90% is reached 1.3 times faster and 5 times faster when increasing the storage temperature further to 60 °C.
In Figure 8, the storage time relative to a SOC 90 or 100% for batteries with NMC cathode and hard carbon anode and LFP cathode and graphite anode is presented. The effect of an increased SOC during storage is more severe for the NMC/hard carbon battery and is increasing with ageing. The effect of an increased SOC appears to be linear in the SOC window from 60% to 90% before it reaches a plateau for a further increase until 100%. When storing an NMC/hard carbon battery at 100% instead of 60%, a SOH of 90% is reached 7 times faster. The effect of an increased SOC during storage is accelerating the capacity degradation less severe for batteries with LFP/graphite battery.
In summary, both increased SOC and temperature during storage are accelerating capacity degradation with the temperature being more damaging. These trends appear the same for both batteries with an NMC cathode with a hard carbon anode and an LFP cathode with graphite anode but are more severe for the NMC battery with a hard carbon anode. While the NMC/hard carbon battery performed best when evaluating the cycling, the LFP/graphite batteries are more stable in terms of calendar ageing. A SOH of 90% was reached for an LFP/graphite battery after 260 days at 40 °C and a SOC of 90% in [6], after around 220 days at a SOC of 100% (25 °C: 660 days) in [83] and around 100 days at a SOC of 100% and a temperature of 45 °C in [92]. The same SOH was already reached after around 70 days for an NMC/hard carbon battery in [5], after storage at 80% SOC and 42.3 °C (25 °C: 360 days).
2.4.2. Resistance Increase during Storage
All evaluated studies [5,6,7,81,83,84,85,87,88] show a clear increase in resistance during storage and cycling. The resistance generally increases between 30% and 100% from BOL (beginning of life) with 100% SOH to EOL (80% SOH).
During storage, an approximately linear increase of resistance with storage time can be observed. Some studies show an initial decrease until a SOH around 95% in resistance before finally increasing [83,87,93]. This appears to be independent of the cathode and anode material. An increased storage temperature accelerates the resistance increase rate significantly. The influence of the SOC (or SOC window) appears to be different for different chemistries—especially for LFP. For NMC and NCA, the rate is increasing with SOC [5,88]. The resistance increase for LFP is by far the lowest and the impact of SOC is fairly small [83,88]. The largest resistance increase is observed when storing at 50% SOC, smaller impact towards 0% and 100% SOC, lowest for 0% [83].
The increase of internal resistance during calendar ageing is often explained with increased ionic resistance due to the formation of surface layers (e.g., SEI). This would agree with different observation and behaviour for LFP.
2.5. Discussion
The degradation mechanisms of LIBs are manifold and strongly linked to many interactive factors, such as battery materials, types and operating conditions. There are large variations between the LIB cells in different literature studies, of which some are reported like anode and cathode material, capacity and geometry and others are not like electrolyte composition and fabrication parameter. Others are partially reported, like the cooling strategy and cycling schedule. Those external factors are known to have an impact on the different degradation mechanisms inside LIB which are categorized into LLI, LAM and impedance increase. Section 2.3 and Section 2.4 showed that the studied LFP/graphite, NMC/hard carbon and NMC/graphite had the longest cycle life and longest when cycled and stored at moderate temperatures. The studied batteries NMC/LMO with graphite and carbon particle, NMC/Si-C and LCO/graphite had a significant shorter cycle life. It appears that apart from the batteries using anodes with silicon, the type of cathode material has the largest impact on the length of the cycle life. It appeared that the rate of capacity degradation during cycling was most significantly increased by an increased ambient temperature for all compared studies, with the batteries utilizing LFP or NMC and a carbon-based anode being the most sensitive. It was noticeable that the LCO/graphite battery (15) was significantly more sensitive to a C rate increase than any other compared battery. Due to a lack of data, only LFP/graphite and NMC/hard carbon were compared in terms of storage lifetime. While they show a similar capacity degradation when stored at moderate temperatures, NMC/hard carbon appeared to be significantly more effected by larger storage temperatures and storing at high SOC.
In present electrolyte solutions with LiPF, traces of HF are often inevitable and this leads to the dissolution of transition metal ions from the cathode. This results in a reduction in active material and passivation of the negative carbon electrode due to redeposition of these transition metal compounds. This leads to increased thermal resistance and is accelerated with increased temperature. Aurbach et al. [94] showed that this degradation mechanism is more important for LCO and LFP than other chemistries, and that LiMnNiO and LiMnNiO have better stability in this respect, and attributed it to the unique surface chemistry due to the presence of nickel ions in the lattice.
The main ageing mechanisms in NMC- and Ni-rich NMC cathodes are the cracking of secondary particle due to expansion and contraction of crystal lattices during cycling, surface reconstructions resulting an inhibition of Li+ insertion and desertion. At high SOC high-valence, ions can trigger side reactions like the decomposition of electrolyte often resulting in dissolution of NMC materials. Transition metals, especially Mn2+ from dissolved NMC, can cause significant capacity loss due to massive damage to the SEI layer [35]. Naumann et al. [83] showed that the loss of active material on the anode when using an LFP cathode at elevated temperatures was a result of Fe deposition on the anode.
The main ageing mechanism on carbon-based anodes is the development of the SEI layer over time which consumes Li-ions and increases the resistance. This is more severe at a higher SOC (>80%) and accelerated with temperature [82]. A high SOC results in a lowered anode potential which causes electrochemical instability on the electrolyte components [7]. A further expansion of the SEI layer can be triggered during storage at high cell voltage (low anode reduction potential). Solvent interaction with graphite after diffusion of solvent components through the SEI layer, can induce graphite exfoliation and gas creation leads to the cracking of the SEI layer which again leads to further SEI growth. This is in agreement with the degradation acceleration by the SOC for all chemistries, except LFP, as the voltage window of an LFP chemistry is smaller. Additional Li-ions are consumed due to side reactions on the anode [95]. High temperatures can furthermore lead to a dissolving of the SEI and creation of Li salts less permeable to Li-ions which results in an increased anode ohmic impedance. At low temperatures (<∼5 °C), a decrease of Li diffusivity within SEI and the carbon anode can lead to plating of metallic Li outside the SEI/anode material and subsequent reaction with the electrolyte, leading to loss of cyclable Li. The temperature at which plating of Li happens depends on the polarization potential vs. Li/Li, and is, therefore, material dependent [82]. As for graphite anodes, further degradation occurs due to the cracking of layered graphitic structures [35].
Studies [27,42,96] showed that even with 5% of silicon added in a carbon anode, the extreme expansion and contraction of silicon upon lithiation and delithiation have massive effects on the degradation. Particle cracking leading to contact loss and thickening of the SEI layer contribute to an impedance rise and loss of cyclable Li.
For all reviewed and compared studies, there was no obvious correlation of the size and geometry and the battery lifetime and sensitivity towards operation condition. As the amount of comparable literature data is relatively small, it is not possible to draw a detailed conclusion. Although, it is possible to say that the cathode and anode material appear to have a more significant impact.
In addition to the discussed, other factors like fabrication parameter, electrolyte composition and thermal management strategy have been shown to have an impact on both the performance and degradation of LIB. The fabrication process parameter determine the mesostructure of the electrode materials which is characterized by the spatial location of the active material particles, carbon additive and binder, contact between electrode material and current collector etc. Fabrication process parameters that have been among others shown to have a large impact on the performance are coating of active particle [97], slurry composition [98], calendaring of electrodes [99]. Electrolyte additives are used to improve the performance and lifetime of LIB. Additives are mostly utilized to improve the SEI formation, protect the cathode, stabilize the LiPF salt and therefore have a significant impact on the degradation behavior [100,101,102]. As all reviewed studies have been conducted with commercial cells, details on fabrication parameter and the electrolyte composition were not disclosed and therefore outside the scope of this review. While all reviewed studies report the type of climate chamber used for the study, settings like fan speed are not specified. To elude more on the importance of the cooling strategy for the comparability of the ageing studies, simple thermal simulations have been conducted and used for further evaluation of the reviewed literature data.
From the review, it is concluded that temperature has the largest impact on the ageing behaviour in terms of capacity degradation and resistance increase for all the chemistries, both in operation and during storage. Only LCO appears to be aged more aggressively by charging rate in comparison to ambient temperature.
3. Modelling Battery Temperature
In the following, a sufficiently simplified thermal battery model and the studies conducted to allow a further evaluation of the reviewed ageing studies are presented.
3.1. Thermal Model
To indicate the impact of the SOC and C rate on the battery temperature, simulations based on a simple thermal model are performed. The 1D stationary solution of the energy balance is used. This simplification does not allow one to model the transient temperature change when starting to discharge a resting cell, but rather models a steady-state once a balance between heat generation and external heat transfer is reached. This is representative for batteries continuously cycled at constant rate, with heat sources averaged over the SOC window. This allows to assess the external temperature difference; the difference between the average battery temperature and the ambient air temperature which is reported in most experimental studies. For internal temperature gradients, Equation (1) describes this model.
where is the thermal conductivity in the through-plane direction and Q is the volumetric heat generation. The thermal conductivity in through-plane direction is calculated by normalising the electrodes and the separator by their thickness :
Heat generation due to activation overpotentials, ohmic heating and entropic heat is considered [103]. While the entropic heat is reversible, the overpotential and ohmic heating are lost work. All heat sources depend on the current density j:
- heat due to the resistances to the electrochemical reactions, expressed in the overpotential, ,
- the ohmic heat, , due to the paths of the charge carrier (the ion transport in the electrolyte, and the electron transport in the solid-state materials and metals.
- heat due to rearrangement in the electrode, expressed as entropy change, , which is reversible and acts as a heat source during discharge and heat sink during charge.
The total heat generation during charge and discharge for a full LIB can be described as follows:
For simplification, the center of the battery is set at . The volumetric heat generation for half a LIB with n cells during charge and discharge becomes:
As a stack of several single cells is modeled, it is fair to assume the maximum temperature in the center of the battery. The heat transfer due to convection is assumed to dominate and the heat transfer coefficient h to describe the heat transfer from the surface of the battery to the ambient is used. The heat transfer coefficient is the proportionality constant between the heat flux and the thermodynamic driving force for the flow of heat (i.e., the temperature difference). The boundary conditions therefore become:
where the ambient temperature.
Calculation of the overpotential is based on Tafel equation valid for current densities significantly larger than the exchange current density. Burheim et al. [106] showed no significant difference in the Tafel behaviour with SOC within the SOC range of 20% to 100%.
where a = −b log , b is the observed Tafel slope, j and are the effective current density and exchange current density.
3.2. Modelling Cases and Parameterisation
The parameters used for all the modelled cases are presented in Table 2. A 1 D simulation for a battery cell consisting of 24 unit cells is conducted. Simulations are conducted for three different studies presented in the following. These allow one to evaluate the benefit of an efficient thermal management and the effect of a temperature increase during operation on the lifetime of a cell.
Study 1: Heat transfer from the battery surface to the surroundings. The average temperature increase of a LIB is modelled for different C rate and heat transfer coefficients at the BOL and with an average entropy change in the range of most common chemistries (e.g., NMC and LFP). The increase in battery temperature is modeled in comparison to the ambient temperature depending on the heat transfer from the surface of the battery to the ambient, which is described using the heat transfer coefficient. Typical values for the heat transfer coefficient range from 7 W/mK for natural air convection [107] and gradually increase with air velocity. Commonly forced air convection is starting in the range of 25 W/mK [108]. Natural water cooling starts around 30 W/mK and can increase up to 8000 W/mK with increasing water velocity [109].
Study 2: LCO battery. The LCO battery appeared to be most sensitive to increased C rates among the chemistries reviewed, and more sensitive to C rates than temperature increase, as shown in Section 2.3. The potential effect of of the cathode chemistry on the temperature increase is evaluated. It is noted that the internal resistance of the studied LCO battery was about 10 times larger than the reviewed NMC chemistry and the LCO chemistry has an about 3–4 times larger average entropy change compared to LFP-G and NMC-G [105]. Both have an effect on the battery heat generation.
Study 3: Ageing. The temperature increase of an aged cell with a cell at the BOL are compared. Section 2.4.2 showed that the internal resistance generally increases between 30% and 100% from BOL to EOL. Additionally, the internal heat transport depends on the thermal conductivity of the battery materials. Richter et al. [93] showed that the thermal conductivity decreases with ageing and a decrease in amount of electrolyte.
4. Results and Discussion
In the following, the results from the thermal modelling are presented and the importance of an efficient thermal management system for different C rates, by estimating the maximum internal temperature, the increase during discharge compared to the ambient temperature is evaluated and discussed. Prospects of chemistry-dependent changes and ageing are presented. The results are discussed in light of temperature and C rate dependent ageing rates, presented in Section 2.3.
Study 1: Heat transfer from the battery surface to the surroundings.Figure 9 shows the difference between the battery temperature and the ambient temperature as a function of the heat transfer coefficient compared for different C rates (while discharging). All results present a steady-state temperature difference between the ambient and the temperature in the battery midplane (at x = 0). The figure also indicates which cooling strategies correspond to the heat transfer coefficients (discussed in Section 3.2). The heat transfer coefficient has a large impact on the temperature increase, especially for high C rates. When considering only natural air convection (h = 7.17 W/m) for the removal of heat, higher C rates can cause a significant temperature increase of up to 40 K for 8 C and 13 K for 4 C. For lower discharging rates of 0.5 C to 1 C, the generated heat only leads to a temperature increase of up to 2 K above the ambient temperature. With an effective thermal management system instead of natural air convection and therefore significantly larger heat transfer coefficient, it is possible to reduce the battery temperature by up to 35 K for 8 C and 11 K for 4 C (compared to h = 7.17 W/m). The maximum temperature is proportional to the inverse of the heat transfer coefficient.
Comparing these modelling results with the conclusion from the review in Section 2.3 allows us to better understand the benefit of a thermal management system. As discussed in Section 2.3 both a temperature increase in this order, as well as an increased C rate, have a serious effect on the capacity decrease and resistance increase. When assuming that the acceleration effect of a high C rate is superimposed from the increased temperature and the actual C rate effect, it allows us to estimate the benefit of the thermal management system for the battery lifetime. When having C rates of around 4 to 8 C a significant difference between the battery and ambient temperature of around 13 K to 40 K, respectively, can be observed. This is when no active thermal management system is applied. The study on temperature-dependent cycling ageing showed that an increase of around 30 K to 35 K can lead to a decrease in the battery life of around 65% to 95% depending on the chemistry. This is for a constant C rate, only considering the increase in degradation due to temperature increase. When changing the cooling strategy from non-active air cooling (h = 7.17 W/m) to forced air cooling (h = 50 W/m), the temperature difference can be decreased to 3 K to 8 K (for 4 and 8 C, respectively). This can lead to a temperature-induced decrease in the battery lifetime of up to 55%. The cooling can be further enhanced when changing the cooling medium to water, resulting in a difference of battery and ambient temperature of 2 K to 4 K (for 4 and 8 C, respectively), reducing the temperature-induced decrease of battery life to around 1% to 20%, but as previously stated—water cooling is complicated. All mentioned numbers only consider the temperature effect of a high C rate, but not the effect of a C rate increase itself.
Study 2: LCO battery. In the literature review (Section 2.3), the LCO battery appeared to be most sensitive to increased C rates among the chemistries reviewed. The battery temperature for the reviewed LCO and NMC chemistry with the internal resistance being about 10 times larger and about 3–4 times larger average entropy change of the reviewed LCO chemistry compared to the NMC chemistries (cf. Table 2) are modelled and compared. Figure 10 shows the results for discharging rates of 0.5 C, 1 C and 2 C and a heat transfer coefficient from 7 to 50 W/mK. The higher internal resistance and entropy change result in a significant larger temperature increase. The additional temperature increase is already significant for small C rates of up to 2 C. In the extreme case of only considering heat removal from the battery due to natural convection, the internal temperature of an LCO battery at a C rate of 2 C can have an up to 23 K larger temperature increase compared to NMC—28 K in total.
It was shown in Section 2.3 that a temperature increase of around 25 to 30 K can lead to a temperature-induced decrease in the battery lifetime of up to 50% for an LCO battery. This compares to a lifetime reduction of around 20% for an 5 K increase for NMC. In experimental studies, studies investigating the effect of temperature and C rate on capacity loss are separated. The cooling management during those studies is rarely communicated. When considering capacity loss to be comprised of capacity loss due to increased temperature and C rate, it is possible to evaluate the actual effect of increased C rates on degradation. Table 3 summarizes and compares the results for the discussed studies for the LCO battery and NMC battery for a C rate increase from 0.5 C to 1.5 C and estimates the actual C rate effect. The lifetime reduction due to a C rate increase from 0.5 C to 1.5 C was found to be 80% for LCO and 30% for NMC in the presented studies, see Figure 5. Considering only heat removal from the battery due to natural convection for both, the modelling results (Figure 10) show that this C rate increase can lead to a temperature rise of 14.5 K and 2.3 K, respectively. Based on the data presented in Figure 4, and using linear interpolation, it is possible to estimate the lifetime reduction purely due to this temperature increase to be 43% for LCO and 11% for NMC, which results in an actual C rate effect of 36% and 19%. This shows that even though LCO appears to be far more sensitive to an increased C rate than other chemistries, a considerable proportion is actually due to an increased heat generation rate.
Study 3: Ageing.Figure 11 shows how an increase in resistance of 100% and a decrease in thermal conductivity due to ageing effects the temperature increase. While the affect is insignificant for low C rates (0.5 and 1 C), it becomes significant for larger C rates. It results in an additional temperature increase of up to 2.5 K at 2 C and 8 K at 4 C when considering no active cooling. The increase is more significant for higher C rates, as the ohmic heat is proportional to the current density squared. While the resistance increase contributes mostly to the external temperature gradient, the thermal conductivity affects only the internal heat transport. The combination of increased ohmic resistance and lowered internal thermal heat transfer can result in even more severe accelerated ageing towards the EOL of a battery.
It has to be mentioned that from a practical point of view, a simple calculation of the battery temperature is not straight forward. The cell geometry and structure parameter e.g., tab size and positions, electrode and separator thickness, have an impact on the temperature increase during cycling [110,111,112]. Most parameters were not enclosed by the studies. In addition, the temperature rise of the battery was simulated steady-state; although this might hold for low C rates, many experimental studies have shown the transient nature of the temperature [73,113,114]. This especially becomes clear, when approaching h = 0 (no heat removal), where the temperature would approach infinity. This is not possible in real batteries due to the heat generation being finite and the batteries capability to store heat. In the present study we have considered a stationary model for assessing an average external temperature difference; the difference between the battery temperature and the ambient air temperature of the testing chamber. Ohmic heating, entropic heating and Tafel overpotential heating have been considered, as they have been shown to have the largest contribution to the heat generation of a battery. The internal resistance have been measured to vary around 20% over the full SOC window [106]. The entropy change varies significantly over the full SOC window and even changes sign, but only makes up around 10% of the total heat generation at the C rates that we are considering [105]. The entropy variation with SOC and the ohmic resistance variation do somewhat balance each other out, so that it is a fair simplification to consider the heat sources constant throughout the SOC window. Moreover, the Tafel heat appears constant with SOC [106], and when then considering continuous cycling, we indeed consider a stationary temperature model to be a sufficiently good approximation for the purpose of discussing temperature deviations between the ambient air and the battery in cycling ageing measurement. The aim was not to provide specific battery temperatures but rather illustrate the large range of temperatures possible during ageing studies, the large dependency on different factors and the effect of this uncertainty with regards to the actual battery temperature during different ageing studies. In the following, some of the simplifications are discussed in more detail.
It is well established that different battery geometries like cylindrical, pouch or prismatic have an impact on the temperature rise and temperature distribution of LIB. This component was not included in the calculations, as all calculations were done in 1D for the same cell thickness. This especially becomes important in Study 2, as the simulation results were used to evaluate and compare the degradation behavior of NMC/hard carbon (8) and LCO/graphite (15). While the NMC/hard carbon battery (8) was a 17.5 Ah pouch cell, the LCO/graphite battery (15) was a 2.4 Ah cylindrical 18,560 cell. Here, only the impact of the different cathode materials and internal resistances on the heat generation, were included. Waldmann et al. [113] experimentally studied the influence of the cell design on temperatures in LIB. By comparing the ratio of the maximum surface temperature to the C rate of small (1.5 Ah) and larger (16 Ah) pouch cells to high-power and high-energy cylindrical 18,650 cells, they found that the ratio for pouch cells is in between that of high-energy and high-power 18,650-type cells. The main difference between high-power and high-energy cells was found to be the smaller radial heat conductivity and higher cell resistances. The internal resistance of the LCO/graphite battery (15) is in the range of that of a high-power 18,650-type cell, showing that while neglecting the geometrical differences between those two cells compared in Study 2, the significantly larger temperature rise calculated of the LCO/graphite battery (15) compared to the 17.5 Ah pouch cell appears to be reasonable.
Modelling the cooling of a battery is not straight forward beyond the options of forced air convection. Cooling strategies should target the use of dry air, to prevent possible shortings and leaking currents. Cooling by adding metal fins between pouch cells will, due to expansion during charging cycles, lead to layers of air of up to a millimeter or more—resulting in a heat transfer coefficient of 25 W/mK or less. Moreover, it has to be noticed that the cooling strategy calculations represent an extreme case, with cooling over the full surface area and no heating of the cooling media. This (uniform air flow) can be true for using air as a cooling medium, but is less likely when water channels are used, which causes a decrease in the area used and an increase in temperature of the cooling media from the beginning to the end. Still, air temperature will increase as air flows over a warm battery surface.
It has to be noted that internal resistance is known to be temperature dependent and decreases with increased temperature. Therefore, the ohmic heating can be assumed to be reduced once the battery is heated up and does not behave linearly. This might result in a slight overestimation of the temperature increase, as the temperature dependency of the resistance was not included in this simple simulation. Additionally, it has to be noted that inhomogeneities are not considered in the simulations and the actual local temperature might be significantly larger.
The results illustrate the challenge of comparing different studies on cycling ageing and transferring study results from laboratory experiments to real battery applications. The batteries are generally stored in temperature chambers, but it has to be taken into consideration in what way the chambers are ventilated and thermally controlled. Ageing studies should communicate the actual battery (surface) temperature to allow comparability and an actual differentiation between temperature-induced and C rate-induced ageing.
Additionally, this information can be useful to find the most efficient thermal management system with the best cost-benefit ratio for the specific battery application. Evaluating the decrease in a lifetime based on the increased temperature in combination with modelling the internal temperature for different cooling methods helps to find the optimal thermal management strategy for different battery applications.
5. Conclusions
A review of degradation studies with different commercial LIBs was conducted, covering different anode and cathode materials, geometries and nominal capacities. The sensitivity of ageing behavior towards operation conditions was examined. As temperature and charging rates are important, these ageing effects were compared in the light of a sufficiently simplified thermal battery model.
The following trends were found from reviewing experimental degradation studies:
- In general, it appeared that the size of the nominal capacity and geometry does not impact the degradation behavior during cycling as much as electrode material composition, with the cathode material being more important than the anode material for all anodes without silicon.
- Considering the operation conditions, it was found that temperature has the largest comparative impact on battery ageing above room temperature. It accelerates both capacity degradation and resistance increase.
- LIB utilizing LFP as cathode and carbon-based anodes appear to be less affected by higher cycling rates (up to 2 C) and SOC window changes, then other chemistries.
- The resistance generally increases between 30% and 100% from beginning of life (BOL) with 100% SOH to end of life (EOL) (80% SOH).
- Both increased SOC window and temperature were shown to accelerate capacity degradation during storage with the temperature being more damaging.
- LIB utilizing LFP cathode and carbon based anodes are less have a longer storage life and are less effected by storage temperature and storage SOC then LIB with NMC cathode and carbon-based anodes.
- During storage, an approximately linear increase (after an initial decrease) of internal resistance with storage time was observed.
- For cells stored without cycling, the frequency of cell characterisation tests appears to affect the results, indicating that this type of studies has to be evaluated and compared carefully.
For a deeper analysis, more comparable data and experimental studies are needed.
The thermal modelling showed that cooling strategy during studies on cycle ageing have a significant impact on the actual battery temperature. The following trends were found from evaluating the literature data with the results from the thermal modelling:
- When testing cells, the actual cell temperature can deviate severely from the reported ambient temperature. Depending on the cooling strategy and C rate, the difference between cell and ambient temperature can range between only a fraction of a degree, up to 40 °C.
- The battery lifetime reduction at high C rates can be for large parts (Table 3) due to an increase in temperature, especially for high energy cells and poor cooling during cycling studies.
This provides a challenge both when comparing different studies and when transferring results from laboratory experiments to real applications, as cooling conditions differ. Therefore, measuring and reporting the actual battery (surface) temperature is crucial to allow for a proper interpretation of results, and especially when evaluating charging and discharging at high rates.
Author Contributions
Conceptualization, L.S. and O.S.B.; methodology, L.S. and O.S.B.; formal analysis, L.S.; investigation, L.S.; writing—original draft preparation, L.S.; writing—review and editing, L.S., O.S.B. and P.R.S.; visualization, L.S.; supervision, O.S.B. and P.R.S. All authors have read and agreed to the published version of the manuscript.
Funding
This research was funded by Norges forsknigsråd grant number 281005, Norges Teknisk-Naturvitenskapelige Universitet grant number 68024013 and Royal Academy of Engineering grant number CiET1718/59.
Institutional Review Board Statement
Not applicable.
Informed Consent Statement
Not applicable.
Data Availability Statement
Not applicable.
Acknowledgments
The authors LS and OSB are grateful for financial support from the Research Council of Norway, via the research project BattMarine (project no. 281005), and from Norwegian University of Science and Technology (NTNU), via the strategic research ENERSENSE (project no. 68024013). PRS acknowledges support from The Royal Academy of Engineering (CiET1718/59).
Conflicts of Interest
The authors declare no conflict of interest.
Abbreviations
The following abbreviations are used in this manuscript:
| BOL | Beginning of life |
| BTMS | Battery thermal management system |
| Thickness of component i | |
| DEC | Diethyl carbonate |
| DMC | Dimethyl carbonate |
| DOD | Depth of discharge |
| Entropy change | |
| EC | Ethylene carbonate |
| EIS | Electrochemical impedance spectroscopy |
| EMC | Ethyl methyl carbonate |
| EOL | End of life |
| Overpotential | |
| EV | Electrical vehicle |
| FEC | Fully equivalent cycle |
| j | Current density |
| Exchange current density | |
| LAM | Loss of active materials |
| Thermal conductivity in the through-plane direction | |
| LCO | Lithium cobalt oxide |
| LFP | Lithium iron phosphate |
| LFP | Lithium iron phosphate |
| LIB | Lithium ion battery |
| LLI | Loss of Li inventory |
| LMO | Lithium manganese oxide |
| n | Number of unit cells |
| NCA | Lithium nickel cobalt aluminium oxide |
| NMC | Lithium nickel cobalt manganese oxide |
| PC | Propylene carbonate |
| PCM | Phase change material |
| PE | Polyethylene |
| PP | Polypropylene |
| q | Area specific heat generation |
| Q | Volumetric heat generation |
| Ohmic resistance | |
| Ambient temperature | |
| SEI | Solid electrolyte interphase |
| SOC | State of charge |
| SOH | State of health |
| SSE | Solid-state electrolytes |
References
- Marom, R.; Amalraj, S.F.; Leifer, N.; Jacob, D.; Aurbach, D. A review of advanced and practical lithium battery materials. J. Mater. Chem. 2011, 21, 9938. [Google Scholar] [CrossRef]
- Bloomberg NEF. Electric Vehicle Outlook 2020. Available online: bnef.turtl.co/story/evo-2020 (accessed on 15 October 2020).
- Zubi, G.; Dufo-López, R.; Carvalho, M.; Pasaoglu, G. The lithium-ion battery: State of the art and future perspectives. Renew. Sustain. Energy Rev. 2018, 89, 292–308. [Google Scholar] [CrossRef]
- Dubarry, M.; Qin, N.; Brooker, P. Calendar aging of commercial Li-ion cells of different chemistries—A review. Curr. Opin. Electrochem. 2018, 9, 106–113. [Google Scholar] [CrossRef]
- Richter, F.; Kjelstrup, S.; Vie, P.J.; Burheim, O.S. Thermal conductivity and internal temperature profiles of Li-ion secondary batteries. J. Power Sources 2017, 359, 592–600. [Google Scholar] [CrossRef] [Green Version]
- Sarasketa-Zabala, E.; Gandiaga, I.; Rodriguez-Martinez, L.M.; Villarreal, I. Calendar ageing analysis of a LiFePO4/graphite cell with dynamic model validations: Towards realistic lifetime predictions. J. Power Sources 2014, 272, 45–57. [Google Scholar] [CrossRef]
- Sarasketa-Zabala, E.; Gandiaga, I.; Martinez-Laserna, E.; Rodriguez-Martinez, L.M.; Villarreal, I. Cycle ageing analysis of a LiFePO4/graphite cell with dynamic model validations: Towards realistic lifetime predictions. J. Power Sources 2015, 275, 573–587. [Google Scholar] [CrossRef]
- Wang, J.; Liu, P.; Hicks-Garner, J.; Sherman, E.; Soukiazian, S.; Verbrugge, M.; Tataria, H.; Musser, J.; Finamore, P. Cycle-life model for graphite-LiFePO4 cells. J. Power Sources 2011, 196, 3942–3948. [Google Scholar] [CrossRef]
- Saw, L.H.; Poon, H.M.; Thiam, H.S.; Cai, Z.; Chong, W.T.; Pambudi, N.A.; King, Y.J. Novel thermal management system using mist cooling for lithium-ion battery packs. Appl. Energy 2018, 223, 146–158. [Google Scholar] [CrossRef] [Green Version]
- Fang, G.; Huang, Y.; Yuan, W.; Yang, Y.; Tang, Y.; Ju, W.; Chu, F.; Zhao, Z. Thermal management for a tube–shell Li-ion battery pack using water evaporation coupled with forced air cooling. RSC Adv. 2019, 9, 9951–9961. [Google Scholar] [CrossRef] [Green Version]
- Mohammadian, S.K.; He, Y.L.; Zhang, Y. Internal cooling of a lithium-ion battery using electrolyte as coolant through microchannels embedded inside the electrodes. J. Power Sources 2015, 293, 458–466. [Google Scholar] [CrossRef]
- Shah, K.; McKee, C.; Chalise, D.; Jain, A. Experimental and numerical investigation of core cooling of Li-ion cells using heat pipes. Energy 2016, 113, 852–860. [Google Scholar] [CrossRef] [Green Version]
- Julien, C.; Mauger, A.; Vijh, A.; Zaghib, K. Lithium Batteries; Springer: Cham, Swizerland, 2016. [Google Scholar]
- Rahn, C.D.; Wang, C.Y. Battery Systems Engineering; John Wiley & Sons: Hoboken, NJ, USA, 2013. [Google Scholar]
- Besenhard, J.O. Handbook of Battery Materials; Wiley-VCH: Weinheim, Germany, 2018. [Google Scholar]
- Nitta, N.; Wu, F.; Lee, J.T.; Yushin, G. Li-ion battery materials: Present and future. Mater. Today 2015, 18, 252–264. [Google Scholar] [CrossRef]
- Zhang, J.; Terrones, M.; Park, C.R.; Mukherjee, R.; Monthioux, M.; Koratkar, N.; Kim, Y.S.; Hurt, R.; Frackowiak, E.; Enoki, T.; et al. Carbon science in 2016: Status, challenges and perspectives. Carbon 2016, 98, 708–732. [Google Scholar] [CrossRef]
- Li, W.; Song, B.; Manthiram, A. High-voltage positive electrode materials for lithium-ion batteries. Chem. Soc. Rev. 2017, 46, 3006–3059. [Google Scholar] [CrossRef] [PubMed]
- Placke, T.; Kloepsch, R.; Dühnen, S.; Winter, M. Lithium ion, lithium metal, and alternative rechargeable battery technologies: The odyssey for high energy density. J. Solid State Electrochem. 2017, 21, 1939–1964. [Google Scholar] [CrossRef]
- Zheng, F.; Kotobuki, M.; Song, S.; Lai, M.O.; Lu, L. Review on solid electrolytes for all-solid-state lithium-ion batteries. J. Power Sources 2018, 389, 198–213. [Google Scholar] [CrossRef]
- Mizushima, K.; Jones, P.; Wiseman, P.; Goodenough, J.B. LixCoO2 (0 < x < −1): A new cathode material for batteries of high energy density. Mater. Res. Bull. 1980, 15, 783–789. [Google Scholar]
- Liu, F.; Mukherjee, P.P. Materials for positive electrodes in rechargeable lithium-ion batteries. In Rechargeable Lithium Batteries; Elsevier: Amsterdam, The Netherlands, 2015; pp. 21–39. [Google Scholar]
- Fergus, J.W. Recent developments in cathode materials for lithium ion batteries. J. Power Sources 2010, 195, 939–954. [Google Scholar] [CrossRef]
- Thackeray, M.; Kock, A.; David, W. Synthesis and structural characterization of defect spinels in the lithium-manganese-oxide system. Mater. Res. Bull. 1993, 28, 1041–1049. [Google Scholar] [CrossRef]
- Whittingham, M.S. Lithium Batteries and Cathode Materials. Chem. Rev. 2004, 104, 4271–4302. [Google Scholar] [CrossRef]
- Noh, H.J.; Youn, S.; Yoon, C.S.; Sun, Y.K. Comparison of the structural and electrochemical properties of layered Li[NixCoyMnz]O2 (x = 1/3, 0.5, 0.6, 0.7, 0.8 and 0.85) cathode material for lithium-ion batteries. J. Power Sources 2013, 233, 121–130. [Google Scholar] [CrossRef]
- Li, X.; Colclasure, A.M.; Finegan, D.P.; Ren, D.; Shi, Y.; Feng, X.; Cao, L.; Yang, Y.; Smith, K. Degradation mechanisms of high capacity 18650 cells containing Si-graphite anode and nickel-rich NMC cathode. Electrochim. Acta 2019, 297, 1109–1120. [Google Scholar] [CrossRef]
- Manthiram, A.; Song, B.; Li, W. A perspective on nickel-rich layered oxide cathodes for lithium-ion batteries. Energy Storage Mater. 2017, 6, 125–139. [Google Scholar] [CrossRef]
- Schipper, F.; Erickson, E.M.; Erk, C.; Shin, J.Y.; Chesneau, F.F.; Aurbach, D. Review—Recent Advances and Remaining Challenges for Lithium Ion Battery Cathodes: I. Nickel-Rich, LiNixCoyMnzO2. J. Electrochem. Soc. 2017, 164, 6220–6228. [Google Scholar] [CrossRef]
- Song, H.J.; Jang, S.H.; Ahn, J.; Oh, S.H.; Yim, T. Artificial cathode-electrolyte interphases on nickel-rich cathode materials modified by silyl functional group. J. Power Sources 2019, 416, 1–8. [Google Scholar] [CrossRef]
- Xia, Y.; Zheng, J.; Wang, C.; Gu, M. Designing principle for Ni-rich cathode materials with high energy density for practical applications. Nano Energy 2018, 49, 434–452. [Google Scholar] [CrossRef]
- Zhao, W.; Zheng, G.; Lin, M.; Zhao, W.; Li, D.; Guan, X.; Ji, Y.; Ortiz, G.F.; Yang, Y. Toward a stable solid-electrolyte-interfaces on nickel-rich cathodes: LiPO2F2 salt-type additive and its working mechanism for LiNi0.5Mn0.25Co0.25O2 cathodes. J. Power Sources 2018, 380, 149–157. [Google Scholar] [CrossRef]
- Julien, C.M.; Mauger, A. NCA, NCM811, and the Route to Ni-Richer Lithium-Ion Batteries. Energies 2020, 13, 6363. [Google Scholar] [CrossRef]
- Structural changes and thermal stability of charged LiNixMnyCozO2 cathode materials studied by combined in situ time-resolved XRD and mass spectroscopy. ACS Appl. Mater. Interfaces 2014, 6, 22594–22601. [CrossRef]
- Li, T.; Yuan, X.Z.; Zhang, L.; Song, D.; Shi, K.; Bock, C. Degradation Mechanisms and Mitigation Strategies of Nickel-Rich NMC-Based Lithium-Ion Batteries. Electrochem. Energy Rev. 2020, 3, 43–80. [Google Scholar] [CrossRef] [Green Version]
- Xu, G.L.; Liu, Q.; Lau, K.K.S.; Liu, Y.; Liu, X.; Gao, H.; Zhou, X.; Zhuang, M.; Ren, Y.; Li, J.; et al. Building ultraconformal protective layers on both secondary and primary particles of layered lithium transition metal oxide cathodes. Nat. Energy 2019, 4, 484–494. [Google Scholar] [CrossRef]
- Goriparti, S.; Miele, E.; de Angelis, F.; Di Fabrizio, E.; Proietti Zaccaria, R.; Capiglia, C. Review on recent progress of nanostructured anode materials for Li-ion batteries. J. Power Sources 2014, 257, 421–443. [Google Scholar] [CrossRef] [Green Version]
- Azuma, H.; Imoto, H.; Yamada, S.; Sekai, K. Advanced carbon anode materials for lithium ion cells. J. Power Sources 1999, 81-82, 1–7. [Google Scholar] [CrossRef]
- Peled, E.; Golodnitsky, D.; Ulus, A.; Yufit, V. Effect of carbon substrate on SEI composition and morphology. Electrochim. Acta 2004, 50, 391–395. [Google Scholar] [CrossRef]
- An, S.J.; Li, J.; Daniel, C.; Mohanty, D.; Nagpure, S.; Wood, D.L. The state of understanding of the lithium-ion-battery graphite solid electrolyte interphase (SEI) and its relationship to formation cycling. Carbon 2016, 105, 52–76. [Google Scholar] [CrossRef] [Green Version]
- Qi, Y.; Gou, H.; Hector, L.; Timmons, A. Threefold Increase in the Young’s Modulus of Graphite Negative Electrode during Lithium Intercalation. J. Electrochem. Soc. 2010, 157, A558–A566. [Google Scholar] [CrossRef]
- Zuo, X.; Zhu, J.; Müller-Buschbaum, P.; Cheng, Y.J. Silicon based lithium-ion battery anodes: A chronicle perspective review. Nano Energy 2017, 31, 113–143. [Google Scholar] [CrossRef]
- Liu, X.H.; Zhong, L.; Huang, S.; Mao, S.X.; Zhu, T.; Huang, J.Y. Size-dependent fracture of silicon nanoparticles during lithiation. ACS Nano 2012, 6, 1522–1531. [Google Scholar] [CrossRef] [PubMed]
- Chan, C.K.; Peng, H.; Liu, G.; McIlwrath, K.; Zhang, X.F.; Huggins, R.A.; Cui, Y. High-performance lithium battery anodes using silicon nanowires. Nat. Nanotechnol. 2008, 3, 31. [Google Scholar] [CrossRef] [PubMed]
- Yao, Y.; Huo, K.; Hu, L.; Liu, N.; Cha, J.J.; McDowell, M.T.; Chu, P.K.; Cui, Y. Highly conductive, mechanically robust, and electrochemically inactive TiC/C nanofiber scaffold for high-performance silicon anode batteries. ACS Nano 2011, 5, 8346–8351. [Google Scholar] [CrossRef]
- Wen, Z.; Lu, G.; Mao, S.; Kim, H.; Cui, S.; Yu, K.; Huang, X.; Hurley, P.T.; Mao, O.; Chen, J. Silicon nanotube anode for lithium-ion batteries. Electrochem. Commun. 2013, 29, 67–70. [Google Scholar] [CrossRef]
- Szczech, J.R.; Jin, S. Nanostructured silicon for high capacity lithium battery anodes. Energy Environ. Sci. 2011, 4, 56–72. [Google Scholar] [CrossRef]
- Burrell, A.; Cunningham, B. Silicon Electrolyte Interface Stabilization (SEISta): Second Quarter Progress Report 2018; SEISta Project; National Renewable Energy Laboratory (NREL): Golden, CO, USA, 2018.
- Wang, C.; Wu, H.; Chen, Z.; McDowell, M.T.; Cui, Y.; Bao, Z. Self-healing chemistry enables the stable operation of silicon microparticle anodes for high-energy lithium-ion batteries. Nat. Chem. 2013, 5, 1042. [Google Scholar] [CrossRef]
- Chen, X.; Li, X.; Mei, D.; Feng, J.; Hu, M.Y.; Hu, J.; Engelhard, M.; Zheng, J.; Xu, W.; Xiao, J.; et al. Reduction mechanism of fluoroethylene carbonate for stable solid–electrolyte interphase film on silicon anode. ChemSusChem 2014, 7, 549–554. [Google Scholar] [CrossRef]
- Zong, L.; Jin, Y.; Liu, C.; Zhu, B.; Hu, X.; Lu, Z.; Zhu, J. Precise perforation and scalable production of Si particles from low-grade sources for high-performance lithium ion battery anodes. Nano Lett. 2016, 16, 7210–7215. [Google Scholar] [CrossRef]
- Dash, R.; Pannala, S. The potential of silicon anode based lithium ion batteries. Mater. Today 2016, 19, 483–484. [Google Scholar] [CrossRef]
- Chae, S.; Ko, M.; Park, S.; Kim, N.; Ma, J.; Cho, J. Micron-sized Fe–Cu–Si ternary composite anodes for high energy Li-ion batteries. Energy Environ. Sci. 2016, 9, 1251–1257. [Google Scholar] [CrossRef]
- Yoon, T.; Nguyen, C.C.; Seo, D.; Lucht, B. Capacity Fading Mechanisms of Silicon Nanoparticle Negative Electrodes for Lithium Ion Batteries. J. Electrochem. Soc. 2015, 162, A2325–A2330. [Google Scholar] [CrossRef] [Green Version]
- Philippe, B.; Dedryvère, R.; Gorgoi, M.; Rensmo, H.; Gonbeau, D.; Edström, K. Role of the LiPF6 salt for the long-term stability of silicon electrodes in Li-ion batteries—A photoelectron spectroscopy study. Chem. Mater. 2013, 25, 394–404. [Google Scholar] [CrossRef]
- Jin, Y.; Zhu, B.; Lu, Z.; Liu, N.; Zhu, J. Challenges and recent progress in the development of Si anodes for lithium-ion battery. Adv. Energy Mater. 2017, 7, 1700715. [Google Scholar] [CrossRef] [Green Version]
- Kim, H.J.; Choi, S.; Lee, S.J.; Seo, M.W.; Lee, J.G.; Deniz, E.; Lee, Y.J.; Kim, E.K.; Choi, J.W. Controlled prelithiation of silicon monoxide for high performance lithium-ion rechargeable full cells. Nano Lett. 2016, 16, 282–288. [Google Scholar] [CrossRef]
- Forney, M.W.; Ganter, M.J.; Staub, J.W.; Ridgley, R.D.; Landi, B.J. Prelithiation of silicon—Carbon nanotube anodes for lithium ion batteries by stabilized lithium metal powder (SLMP). Nano Lett. 2013, 13, 4158–4163. [Google Scholar] [CrossRef] [PubMed]
- Zhao, J.; Lu, Z.; Liu, N.; Lee, H.W.; McDowell, M.T.; Cui, Y. Dry-air-stable lithium silicide—Lithium oxide core—Shell nanoparticles as high-capacity prelithiation reagents. Nat. Commun. 2014, 5, 5088. [Google Scholar] [CrossRef] [Green Version]
- Liu, J.; Liu, Y.; Yang, W.; Ren, Q.; Li, F.; Huang, Z. Lithium ion battery separator with high performance and high safety enabled by tri-layered SiO2@PI/m-PE/SiO2@PI nanofiber composite membrane. J. Power Sources 2018, 396, 265–275. [Google Scholar] [CrossRef]
- Man, C.; Jiang, P.; Wong, K.W.; Zhao, Y.; Tang, C.; Fan, M.; Lau, W.M.; Mei, J.; Li, S.; Liu, H.; et al. Enhanced wetting properties of a polypropylene separator for a lithium-ion battery by hyperthermal hydrogen induced cross-linking of poly(ethylene oxide). J. Mater. Chem. A 2014, 2, 11980–11986. [Google Scholar] [CrossRef]
- Liu, Y.; Xie, K.; Pan, Y.; Wang, H.; Li, Y.; Zheng, C. Simplified modeling and parameter estimation to predict calendar life of Li-ion batteries. Solid State Ionics 2018, 320, 126–131. [Google Scholar] [CrossRef]
- Wang, Y.; Wang, S.; Fang, J.; Ding, L.X.; Wang, H. A nano-silica modified polyimide nanofiber separator with enhanced thermal and wetting properties for high safety lithium-ion batteries. J. Membr. Sci. 2017, 537, 248–254. [Google Scholar] [CrossRef]
- Chen, W.; Liu, Y.; Ma, Y.; Yang, W. Improved performance of lithium ion battery separator enabled by co-electrospinnig polyimide/poly(vinylidene fluoride-co-hexafluoropropylene) and the incorporation of TiO2-(2-hydroxyethyl methacrylate). J. Power Sources 2015, 273, 1127–1135. [Google Scholar] [CrossRef]
- Li, X.; Jiang, J.; Le Wang, Y.; Chen, D.; Zhang, Y.; Zhang, C. A capacity model based on charging process for state of health estimation of lithium ion batteries. Appl. Energy 2016, 177, 537–543. [Google Scholar] [CrossRef]
- Zhang, S.S. A review on electrolyte additives for lithium-ion batteries. J. Power Sources 2006, 162, 1379–1394. [Google Scholar] [CrossRef]
- Famprikis, T.; Canepa, P.; Dawson, J.A.; Islam, M.S.; Masquelier, C. Fundamentals of inorganic solid-state electrolytes for batteries. Nat. Mater. 2019, 18, 1278–1291. [Google Scholar] [CrossRef]
- Damay, N.; Forgez, C.; Bichat, M.P.; Friedrich, G. Thermal modeling of large prismatic LiFePO 4 /graphite battery. Coupled thermal and heat generation models for characterization and simulation. J. Power Sources 2015, 283, 37–45. [Google Scholar] [CrossRef]
- Cheng, X.; Shi, N.; Li, Y.; Wang, S. Engineering-Oriented Modeling for Thermal Behaviors of 18650 Li-ion Batteries. Energy Procedia 2017, 105, 4757–4762. [Google Scholar] [CrossRef]
- Mastali, M.; Foreman, E.; Modjtahedi, A.; Samadani, E.; Amirfazli, A.; Farhad, S.; Fraser, R.A.; Fowler, M. Electrochemical-thermal modeling and experimental validation of commercial graphite/LiFePO4 pouch lithium-ion batteries. Int. J. Therm. Sci. 2018, 129, 218–230. [Google Scholar] [CrossRef]
- An, Z.; Jia, L.; Wei, L.; Yang, C. Numerical modeling and analysis of thermal behavior and Li+ transport characteristic in lithium-ion battery. Int. J. Heat Mass Transf. 2018, 127, 1351–1366. [Google Scholar] [CrossRef]
- Bernardi, D.; Pawlikowski, E.; Newman, J. A general energy balance for battery systems. J. Electrochem. Soc. 1985, 132, 5. [Google Scholar] [CrossRef] [Green Version]
- Cavalheiro, G.M.; Iriyama, T.; Nelson, G.J.; Huang, S.; Zhang, G. Effects of nonuniform temperature distribution on degradation of lithium-ion batteries. J. Electrochem. Energy Convers. Storage 2020, 17, 021101. [Google Scholar] [CrossRef]
- Wang, X.; Li, S.; Wang, L.; Sun, Y.; Wang, Z. Degradation and Dependence Analysis of a Lithium-Ion Battery Pack in the Unbalanced State. Energies 2020, 13, 5934. [Google Scholar] [CrossRef]
- Bhattacharjee, A.; Mohanty, R.K.; Ghosh, A. Design of an Optimized Thermal Management System for Li-Ion Batteries under Different Discharging Conditions. Energies 2020, 13, 5695. [Google Scholar] [CrossRef]
- Zhao, C.; Zhang, B.; Zheng, Y.; Huang, S.; Yan, T.; Liu, X. Hybrid Battery Thermal Management System in Electrical Vehicles: A Review. Energies 2020, 13, 6257. [Google Scholar] [CrossRef]
- Huber, C.; Kuhn, R. Thermal management of batteries for electric vehicles. In Advances in Battery Technologies for Electric Vehicles; Elsevier: Amsterdam, The Netherlands, 2015; pp. 327–358. [Google Scholar]
- Huang, Y.H.; Cheng, W.L.; Zhao, R. Thermal management of Li-ion battery pack with the application of flexible form-stable composite phase change materials. Energy Convers. Manag. 2019, 182, 9–20. [Google Scholar] [CrossRef]
- Liu, H.; Wei, Z.; He, W.; Zhao, J. Thermal issues about Li-ion batteries and recent progress in battery thermal management systems: A review. Energy Convers. Manag. 2017, 150, 304–330. [Google Scholar] [CrossRef]
- Chen, D.; Jiang, J.; Kim, G.H.; Yang, C.; Pesaran, A. Comparison of different cooling methods for lithium ion battery cells. Appl. Therm. Eng. 2016, 94, 846–854. [Google Scholar] [CrossRef] [Green Version]
- Gao, Y.; Jiang, J.; Zhang, C.; Zhang, W.; Jiang, Y. Aging mechanisms under different state-of-charge ranges and the multi-indicators system of state-of-health for lithium-ion battery with Li(NiMnCo)O2 cathode. J. Power Sources 2018, 400, 641–651. [Google Scholar] [CrossRef]
- Waldmann, T.; Wilka, M.; Kasper, M.; Fleischhammer, M.; Wohlfahrt-Mehrens, M. Temperature dependent ageing mechanisms in Lithium-ion batteries—A Post-Mortem study. J. Power Sources 2014, 262, 129–135. [Google Scholar] [CrossRef]
- Naumann, M.; Schimpe, M.; Keil, P.; Hesse, H.C.; Jossen, A. Analysis and modeling of calendar aging of a commercial LiFePO4/graphite cell. J. Energy Storage 2018, 17, 153–169. [Google Scholar] [CrossRef]
- Schmitt, J.; Maheshwari, A.; Heck, M.; Lux, S.; Vetter, M. Impedance change and capacity fade of lithium nickel manganese cobalt oxide-based batteries during calendar aging. J. Power Sources 2017, 353, 183–194. [Google Scholar] [CrossRef]
- Gao, Y.; Jiang, J.; Zhang, C.; Zhang, W.; Ma, Z.; Jiang, Y. Lithium-ion battery aging mechanisms and life model under different charging stresses. J. Power Sources 2017, 356, 103–114. [Google Scholar] [CrossRef]
- Leng, F.; Tan, C.M.; Pecht, M. Effect of Temperature on the Aging rate of Li Ion Battery Operating above Room Temperature. Sci. Rep. 2015, 5, 12967. [Google Scholar] [CrossRef] [Green Version]
- Wikner, E. Lithium Ion Battery Aging: Battery Lifetime Testing and Physics-Based Modeling for Electric Vehicle Applications. Ph.D. Thesis, Department of Electrical Engineering, Chalmers University of Technology, Göteborg, Sweden, 2017. [Google Scholar]
- Keil, P.; Jossen, A. Calendar Aging of NCA Lithium-Ion Batteries Investigated by Differential Voltage Analaysis and Coulomb Tracking. J. Electrochem. Soc. 2017, 164. [Google Scholar] [CrossRef]
- Berecibar, M.; Dubarry, M.; Omar, N.; Villarreal, I.; Van Mierlo, J. Degradation mechanism detection for NMC batteries based on Incremental Capacity curves. World Electr. Veh. J. 2016, 8, 350. [Google Scholar] [CrossRef] [Green Version]
- Yang, F.; Wang, D.; Zhao, Y.; Tsui, K.L.; Bae, S.J. A study of the relationship between coulombic efficiency and capacity degradation of commercial lithium-ion batteries. Energy 2018, 145, 486–495. [Google Scholar] [CrossRef]
- Keil, P.; Schuster, S.; Wilhelm, J.; Travi, J.; Hauser, A.; Karl, R.C.; Jossen, A. Calendar Aging of Lithium-Ion Batteries. J. Electrochem. Soc. 2016, 163, A1872–A1880. [Google Scholar] [CrossRef]
- Grolleau, S.; Delaille, A.; Gualous, H.; Gyan, P.; Revel, R.; Bernard, J.; Redondo-Iglesias, E.; Peter, J. Calendar aging of commercial graphite/LiFePO4 cell – Predicting capacity fade under time dependent storage conditions. J. Power Sources 2014, 255, 450–458. [Google Scholar] [CrossRef]
- Richter, F.; Vie, P.J.; Kjelstrup, S.; Burheim, O.S. Measurements of ageing and thermal conductivity in a secondary NMC-hard carbon Li-ion battery and the impact on internal temperature profiles. Electrochim. Acta 2017, 250, 228–237. [Google Scholar] [CrossRef]
- Aurbach, D.; Markovsky, B.; Salitra, G.; Markevich, E.; Talyossef, Y.; Koltypin, M.; Nazar, L.; Ellis, B.; Kovacheva, D. Review on electrode—Electrolyte solution interactions, related to cathode materials for Li-ion batteries. J. Power Sources 2007, 165, 491–499. [Google Scholar] [CrossRef]
- Barré, A.; Deguilhem, B.; Grolleau, S.; Gérard, M.; Suard, F.; Riu, D. A review on lithium-ion battery ageing mechanisms and estimations for automotive applications. J. Power Sources 2013, 241, 680–689. [Google Scholar] [CrossRef] [Green Version]
- Galvez-Aranda, D.E.; Verma, A.; Hankins, K.; Seminario, J.M.; Mukherjee, P.P.; Balbuena, P.B. Chemical and mechanical degradation and mitigation strategies for Si anodes. J. Power Sources 2019, 419, 208–218. [Google Scholar] [CrossRef]
- Yu, B.Z.; Liu, X.L.; Zhang, H.G.; Jing, G.Y.; Ma, P.; Luo, Y.; Xue, W.M.; Ren, Z.Y.; Fan, H.M. Fabrication and structural optimization of porous single-crystal α-Fe2O3 microrices for high-performance lithium-ion battery anodes. J. Mater. Chem. A 2015, 3, 16544–16550. [Google Scholar] [CrossRef]
- Rucci, A.; Ngandjong, A.C.; Primo, E.N.; Maiza, M.; Franco, A.A. Tracking variabilities in the simulation of Lithium Ion Battery electrode fabrication and its impact on electrochemical performance. Electrochim. Acta 2019, 312, 168–178. [Google Scholar] [CrossRef]
- Lenze, G.; Röder, F.; Bockholt, H.; Haselrieder, W.; Kwade, A.; Krewer, U. Simulation-supported analysis of calendering impacts on the performance of lithium-ion-batteries. J. Electrochem. Soc. 2017, 164, A1223. [Google Scholar] [CrossRef]
- Ming, J.; Cao, Z.; Wu, Y.; Wahyudi, W.; Wang, W.; Guo, X.; Cavallo, L.; Hwang, J.Y.; Shamim, A.; Li, L.J.; et al. New insight on the role of electrolyte additives in rechargeable lithium ion batteries. ACS Energy Lett. 2019, 4, 2613–2622. [Google Scholar] [CrossRef]
- Zhao, H.; Yu, X.; Li, J.; Li, B.; Shao, H.; Li, L.; Deng, Y. Film-forming electrolyte additives for rechargeable lithium-ion batteries: Progress and outlook. J. Mater. Chem. A 2019, 7, 8700–8722. [Google Scholar] [CrossRef]
- Haregewoin, A.M.; Wotango, A.S.; Hwang, B.J. Electrolyte additives for lithium ion battery electrodes: Progress and perspectives. Energy Environ. Sci. 2016, 9, 1955–1988. [Google Scholar] [CrossRef]
- Burheim, O.; Vie, P.; Pharoah, J.G.; Kjelstrup, S. Ex situ measurements of through-plane thermal conductivities in a polymer electrolyte fuel cell. J. Power Sources 2010, 195, 249–256. [Google Scholar] [CrossRef]
- Murashko, K.A.; Mityakov, A.V.; Mityakov, V.Y.; Sapozhnikov, S.Z.; Jokiniemi, J.; Pyrhönen, J. Determination of the entropy change profile of a cylindrical lithium-ion battery by heat flux measurements. J. Power Sources 2016, 330, 61–69. [Google Scholar] [CrossRef]
- Viswanathan, V.V.; Choi, D.; Wang, D.; Xu, W.; Towne, S.; Williford, R.E.; Zhang, J.G.; Liu, J.; Yang, Z. Effect of entropy change of lithium intercalation in cathodes and anodes on Li-ion battery thermal management. J. Power Sources 2010, 195, 3720–3729. [Google Scholar] [CrossRef]
- Burheim, O.S.; Onsrud, M.A.; Pharoah, J.G.; Vullum-Bruer, F.; Vie, P.J.S. Thermal Conductivity, Heat Sources and Temperature Profiles of Li-Ion Batteries. ECS Trans. 2014, 58, 145–171. [Google Scholar] [CrossRef] [Green Version]
- Lee, K.J.; Smith, K.; Pesaran, A.; Kim, G.H. Three dimensional thermal-, electrical-, and electrochemical-coupled model for cylindrical wound large format lithium-ion batteries. J. Power Sources 2013, 241, 20–32. [Google Scholar] [CrossRef]
- Chen, Y.; Evans, J. Thermal Analysis of Lithium-Ion Batteries. J. Electrochem. Soc. 1996, 143, 2708–2712. [Google Scholar] [CrossRef]
- Lasance, C.J.; Simons, R.E. Advances in high-performance cooling for electronics. Electron. Cool. 2005, 11, 22–39. [Google Scholar]
- Lee, J.J.; Kim, J.S.; Chang, H.K.; Lee, D.C.; Kim, C.W. The Effect of Tab Attachment Positions and Cell Aspect Ratio on Temperature Difference in Large-Format LIBs Using Design of Experiments. Energies 2021, 14, 116. [Google Scholar] [CrossRef]
- Du, S.; Jia, M.; Cheng, Y.; Tang, Y.; Zhang, H.; Ai, L.; Zhang, K.; Lai, Y. Study on the thermal behaviors of power lithium iron phosphate (LFP) aluminum-laminated battery with different tab configurations. Int. J. Therm. Sci. 2015, 89, 327–336. [Google Scholar] [CrossRef]
- Li, H.; Wang, Y.; He, X.; Li, Q.; Lian, C.; Wang, Z. Effects of structure parameters on the thermal performance of a ternary lithium-ion battery under fast charging conditions. Energy Fuels 2020, 34, 8891–8904. [Google Scholar] [CrossRef]
- Waldmann, T.; Bisle, G.; Hogg, B.I.; Stumpp, S.; Danzer, M.A.; Kasper, M.; Axmann, P.; Wohlfahrt-Mehrens, M. Influence of cell design on temperatures and temperature gradients in lithium-ion cells: An in operando study. J. Electrochem. Soc. 2015, 162, A921. [Google Scholar] [CrossRef]
- Surya, S.; Marcis, V.; Williamson, S. Core Temperature Estimation for a Lithium ion 18650 Cell. Energies 2021, 14, 87. [Google Scholar] [CrossRef]
Figure 1.
Schematic illustration of a lithium-ion battery (LIB) under discharge. The Li-ions are moving from the anode to the cathode while the electrons circulate through the external circuit.
Figure 1.
Schematic illustration of a lithium-ion battery (LIB) under discharge. The Li-ions are moving from the anode to the cathode while the electrons circulate through the external circuit.

Figure 2.
Structure of hard carbon (left) and graphite (right).

Figure 3.
State of health (SOH) as a function of full equivalent cycles (FEC). If not specified differently in the legend, all batteries were cycled under the same conditions (charging/ discharging rate of 1 C/1 C, SOC window of 0–100% and a temperature of 25°). Numbers are specified in Table 1. Linear segments that connect data points for visual orientation.

Figure 4.
Capacity fade during cycling as a function of temperature. NMC/Hard carbon (8) [5] and NMC/LMO- Graphite & carbon [82] relate to 25 °C, charging and discharging rate of 1 C and 100% DOD. LCO/Graphite (16) [86] similarly, but with a charging rate of 0.5 C. LFP/Graphite (3) [8] relates to 15 °C, discharge rate 0.5 C and data summarized for DOD of 10 to 90%. Linear segments that connect data points for visual orientation.

Figure 5.
Capacity fade during cycling as a function of the charging rate. NMC/Hard carbon (8) [5] and LCO/Graphite (15) [85] at 25 °C and fixed discharging rate at 1 C, LFP/Graphite (3) [7] 30 °C, the discharge rate is similar to charging rate. Linear segments that connect data points for visual orientation.

Figure 6.
Capacity fade during cycling as a function of DOD around 50% SOC e.g., 60% DOD is equal to a SOC window of 20% to 80%. NMC/Graphite (12) [81] at 25 °C and 6 C charging and discharging rate, NMC/Hard carbon (8) [5] at 25 °C and 2 C charging and discharging rate and LFP/Graphite (3) [7] at 30 °C and 1 C charging and discharging rate. Linear segments that connect data points for visual orientation.

Figure 7.
Capacity fade during storage as a function of temperature. Series marked with * are related to 42.5 °C [5] instead of 40 °C and series marked with ** are related to 45 °C [92] instead of 40 °C [6,83]. The NMC/ Hard carbon (8) battery was stored at 80%, LFP/Graphie (3) [6] (purple) at 90% and LFP/Graphite (6) [83] (blue) and LFP/Graphite (4) [92] (green) at 100% SOC. Linear segments that connect data points for visual orientation.

Figure 8.
Capacity fade during storage as a function of SOC. Series marked with * are related to 90% SOC instead of 100% SOC. ‘NMC [5]’: 25 °C, ‘LFP [6]’, ‘LFP [84]’: 40 °C. Linear segments that connect data points for visual orientation.

Figure 9.
Difference between battery and ambient temperature depending on the heat transfer from the battery surface to the ambient for different C rates.
Figure 9.
Difference between battery and ambient temperature depending on the heat transfer from the battery surface to the ambient for different C rates.

Figure 10.
Difference between internal and ambient temperature as a function of heat transfer coefficient—impact of a larger internal resistance and average entropy change for LCO-G.
Figure 10.
Difference between internal and ambient temperature as a function of heat transfer coefficient—impact of a larger internal resistance and average entropy change for LCO-G.

Figure 11.
Difference between internal and ambient temperature as a function of heat transfer coefficient—impact of ageing.
Figure 11.
Difference between internal and ambient temperature as a function of heat transfer coefficient—impact of ageing.


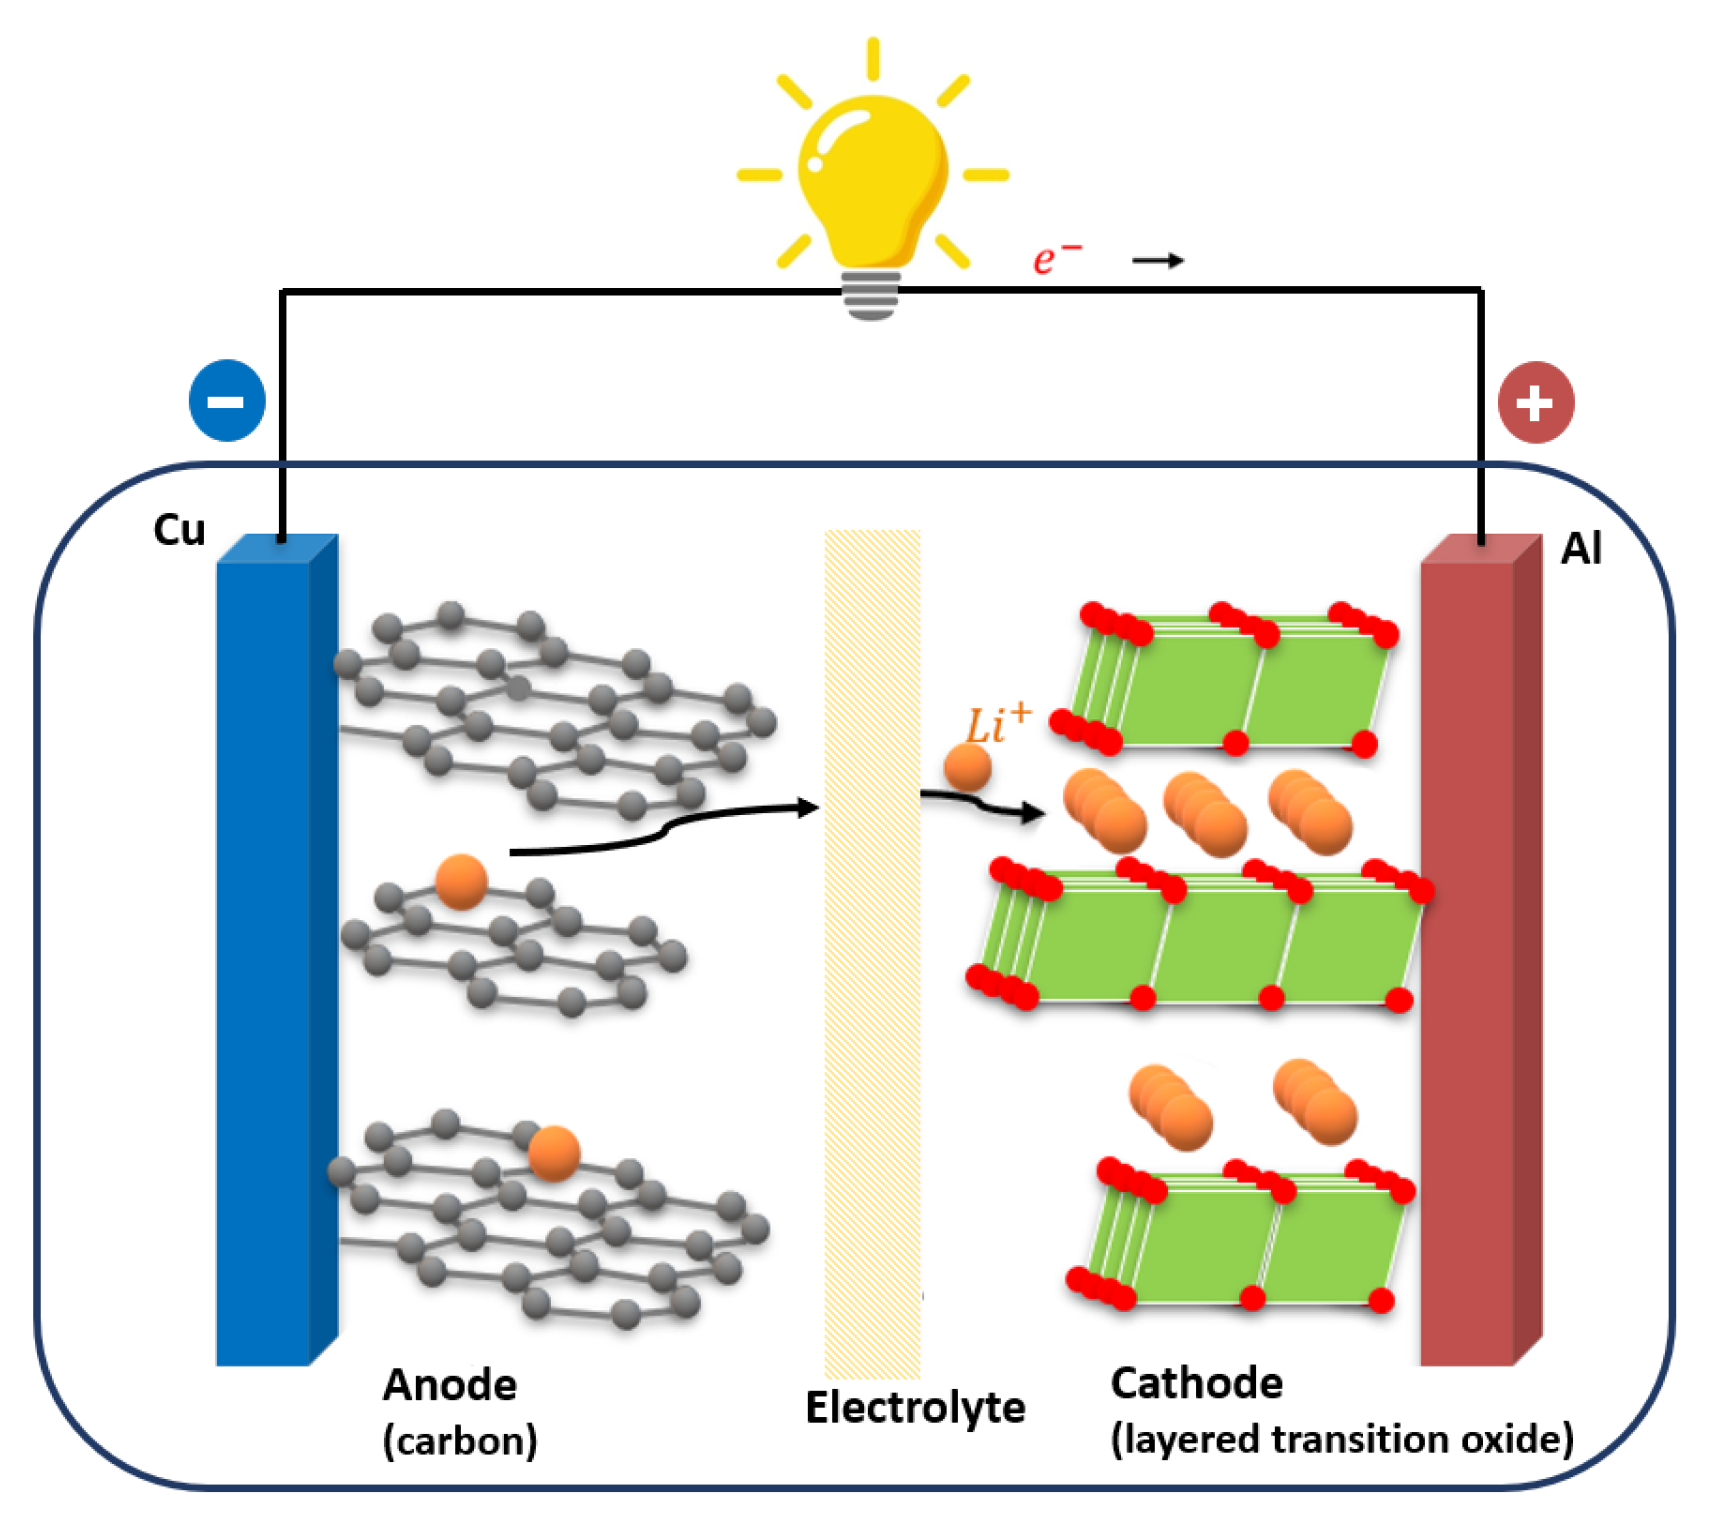
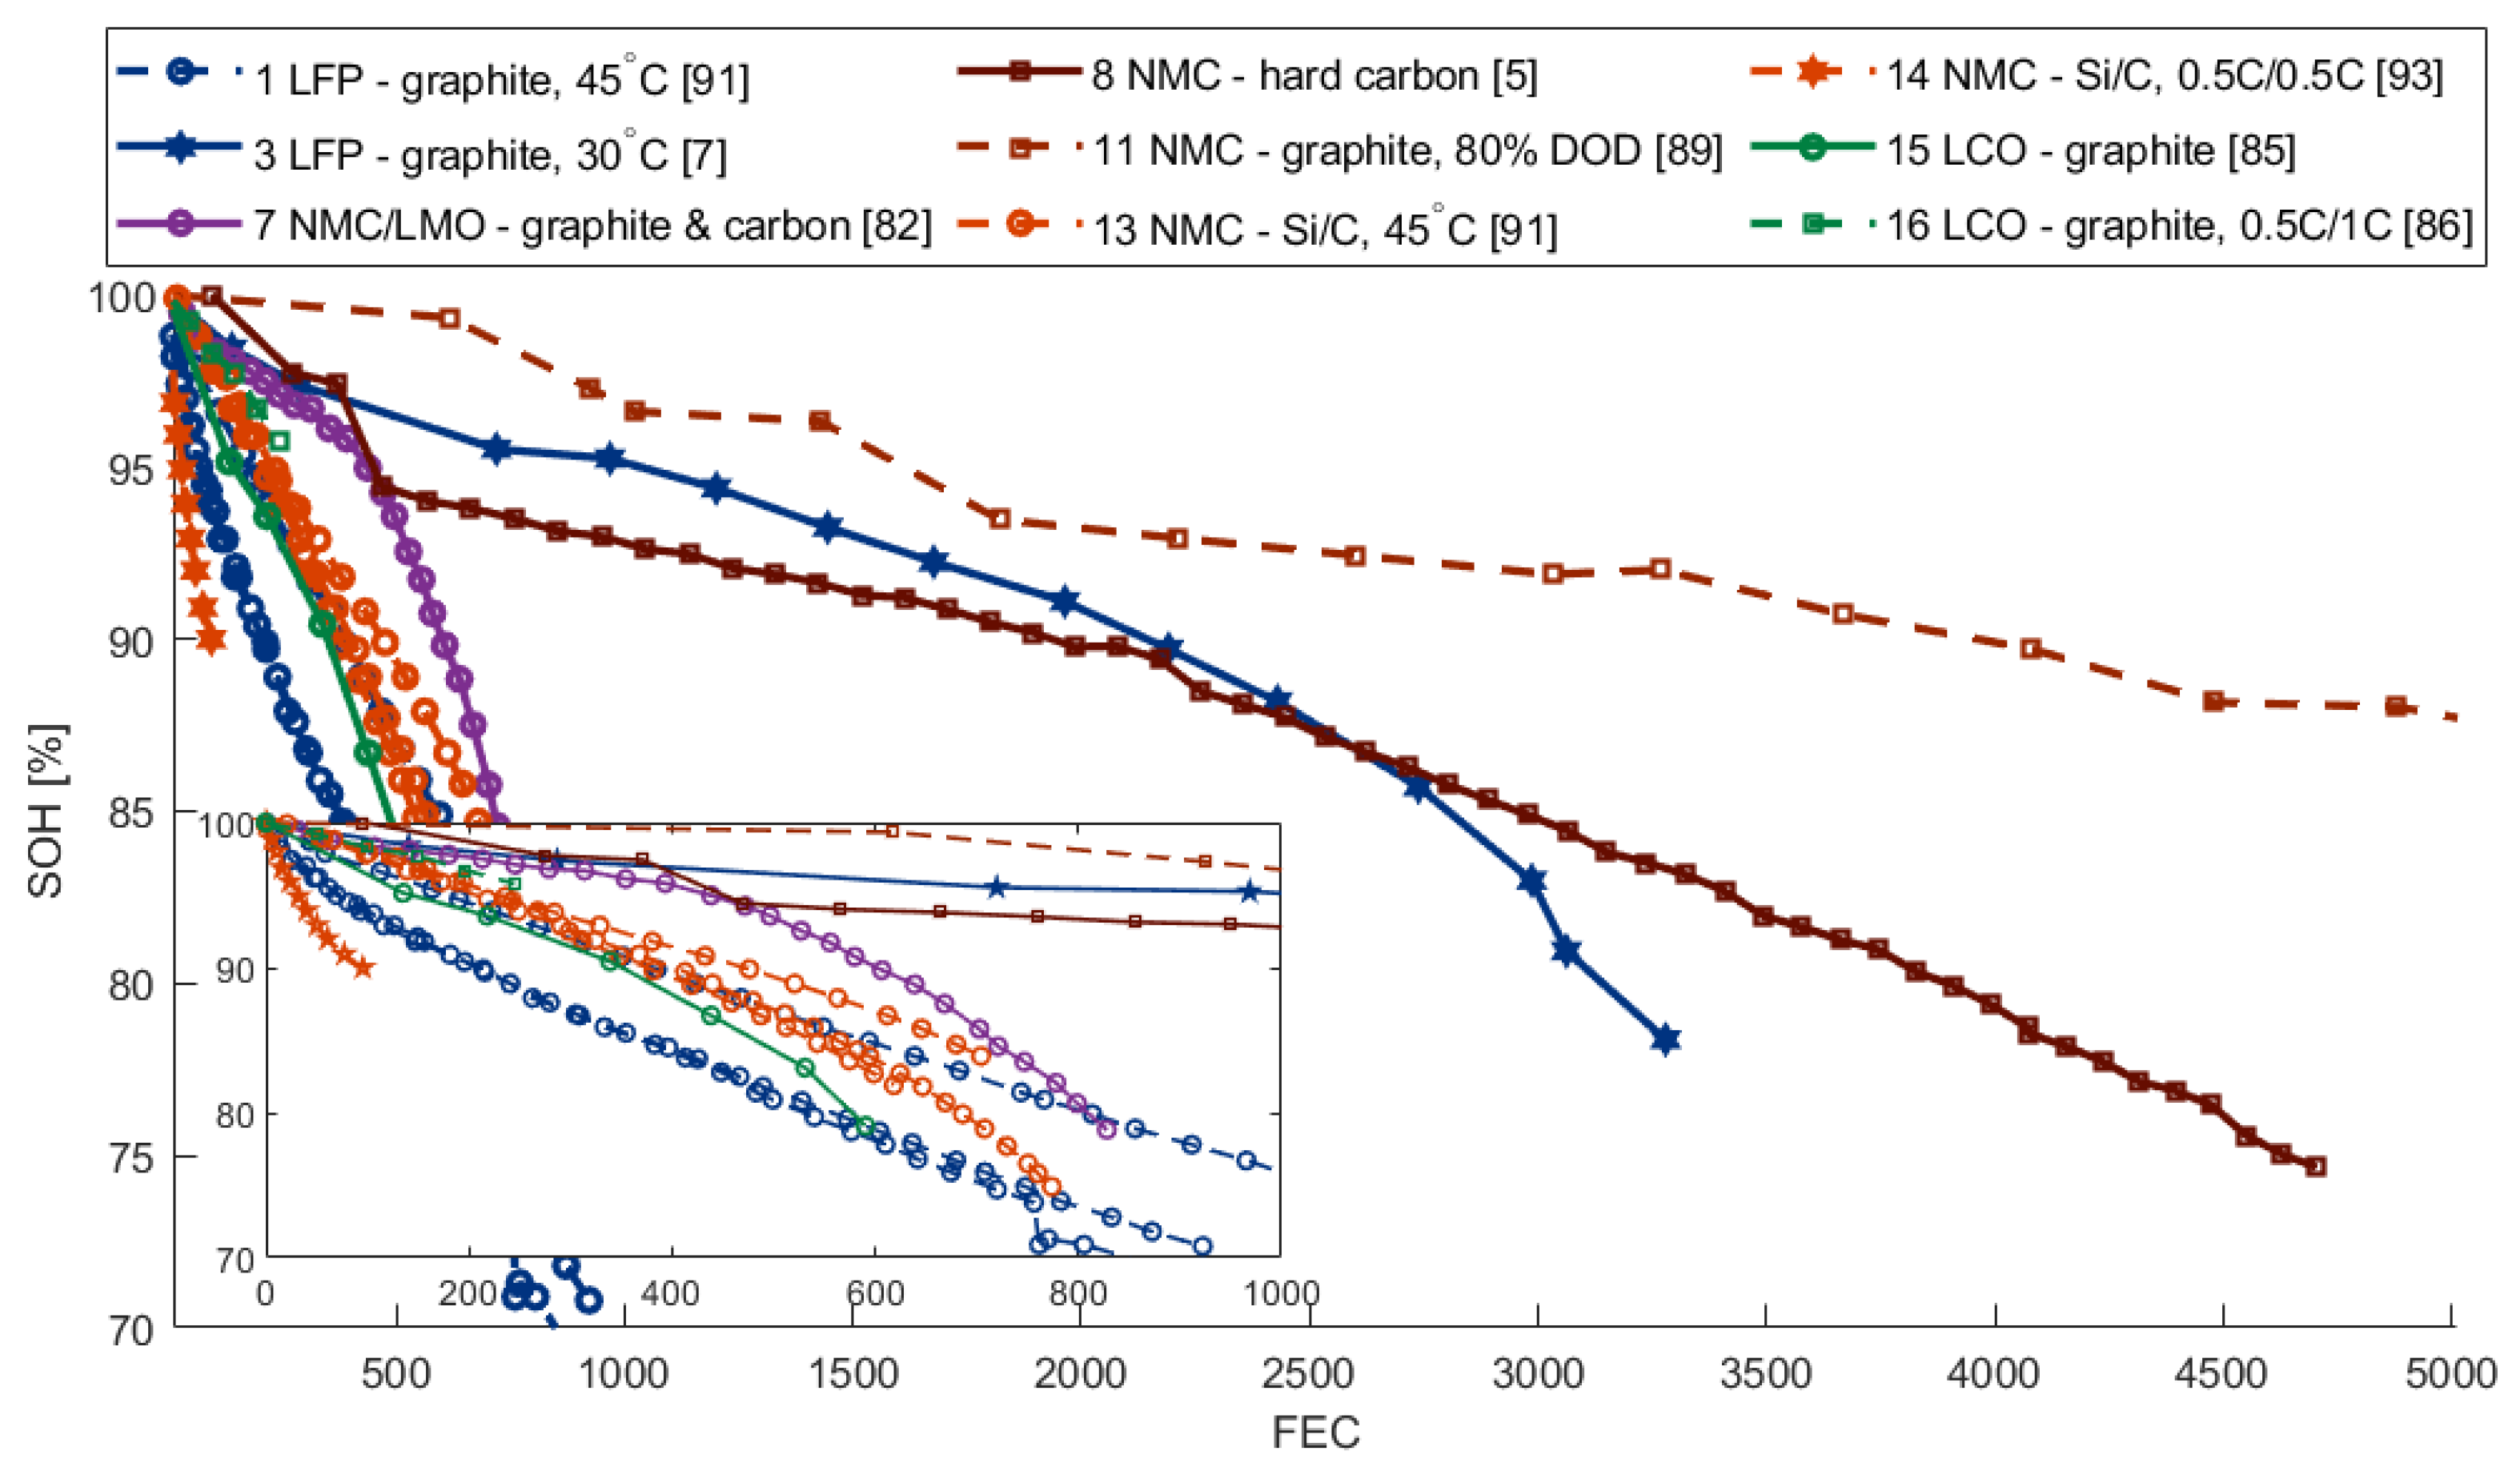
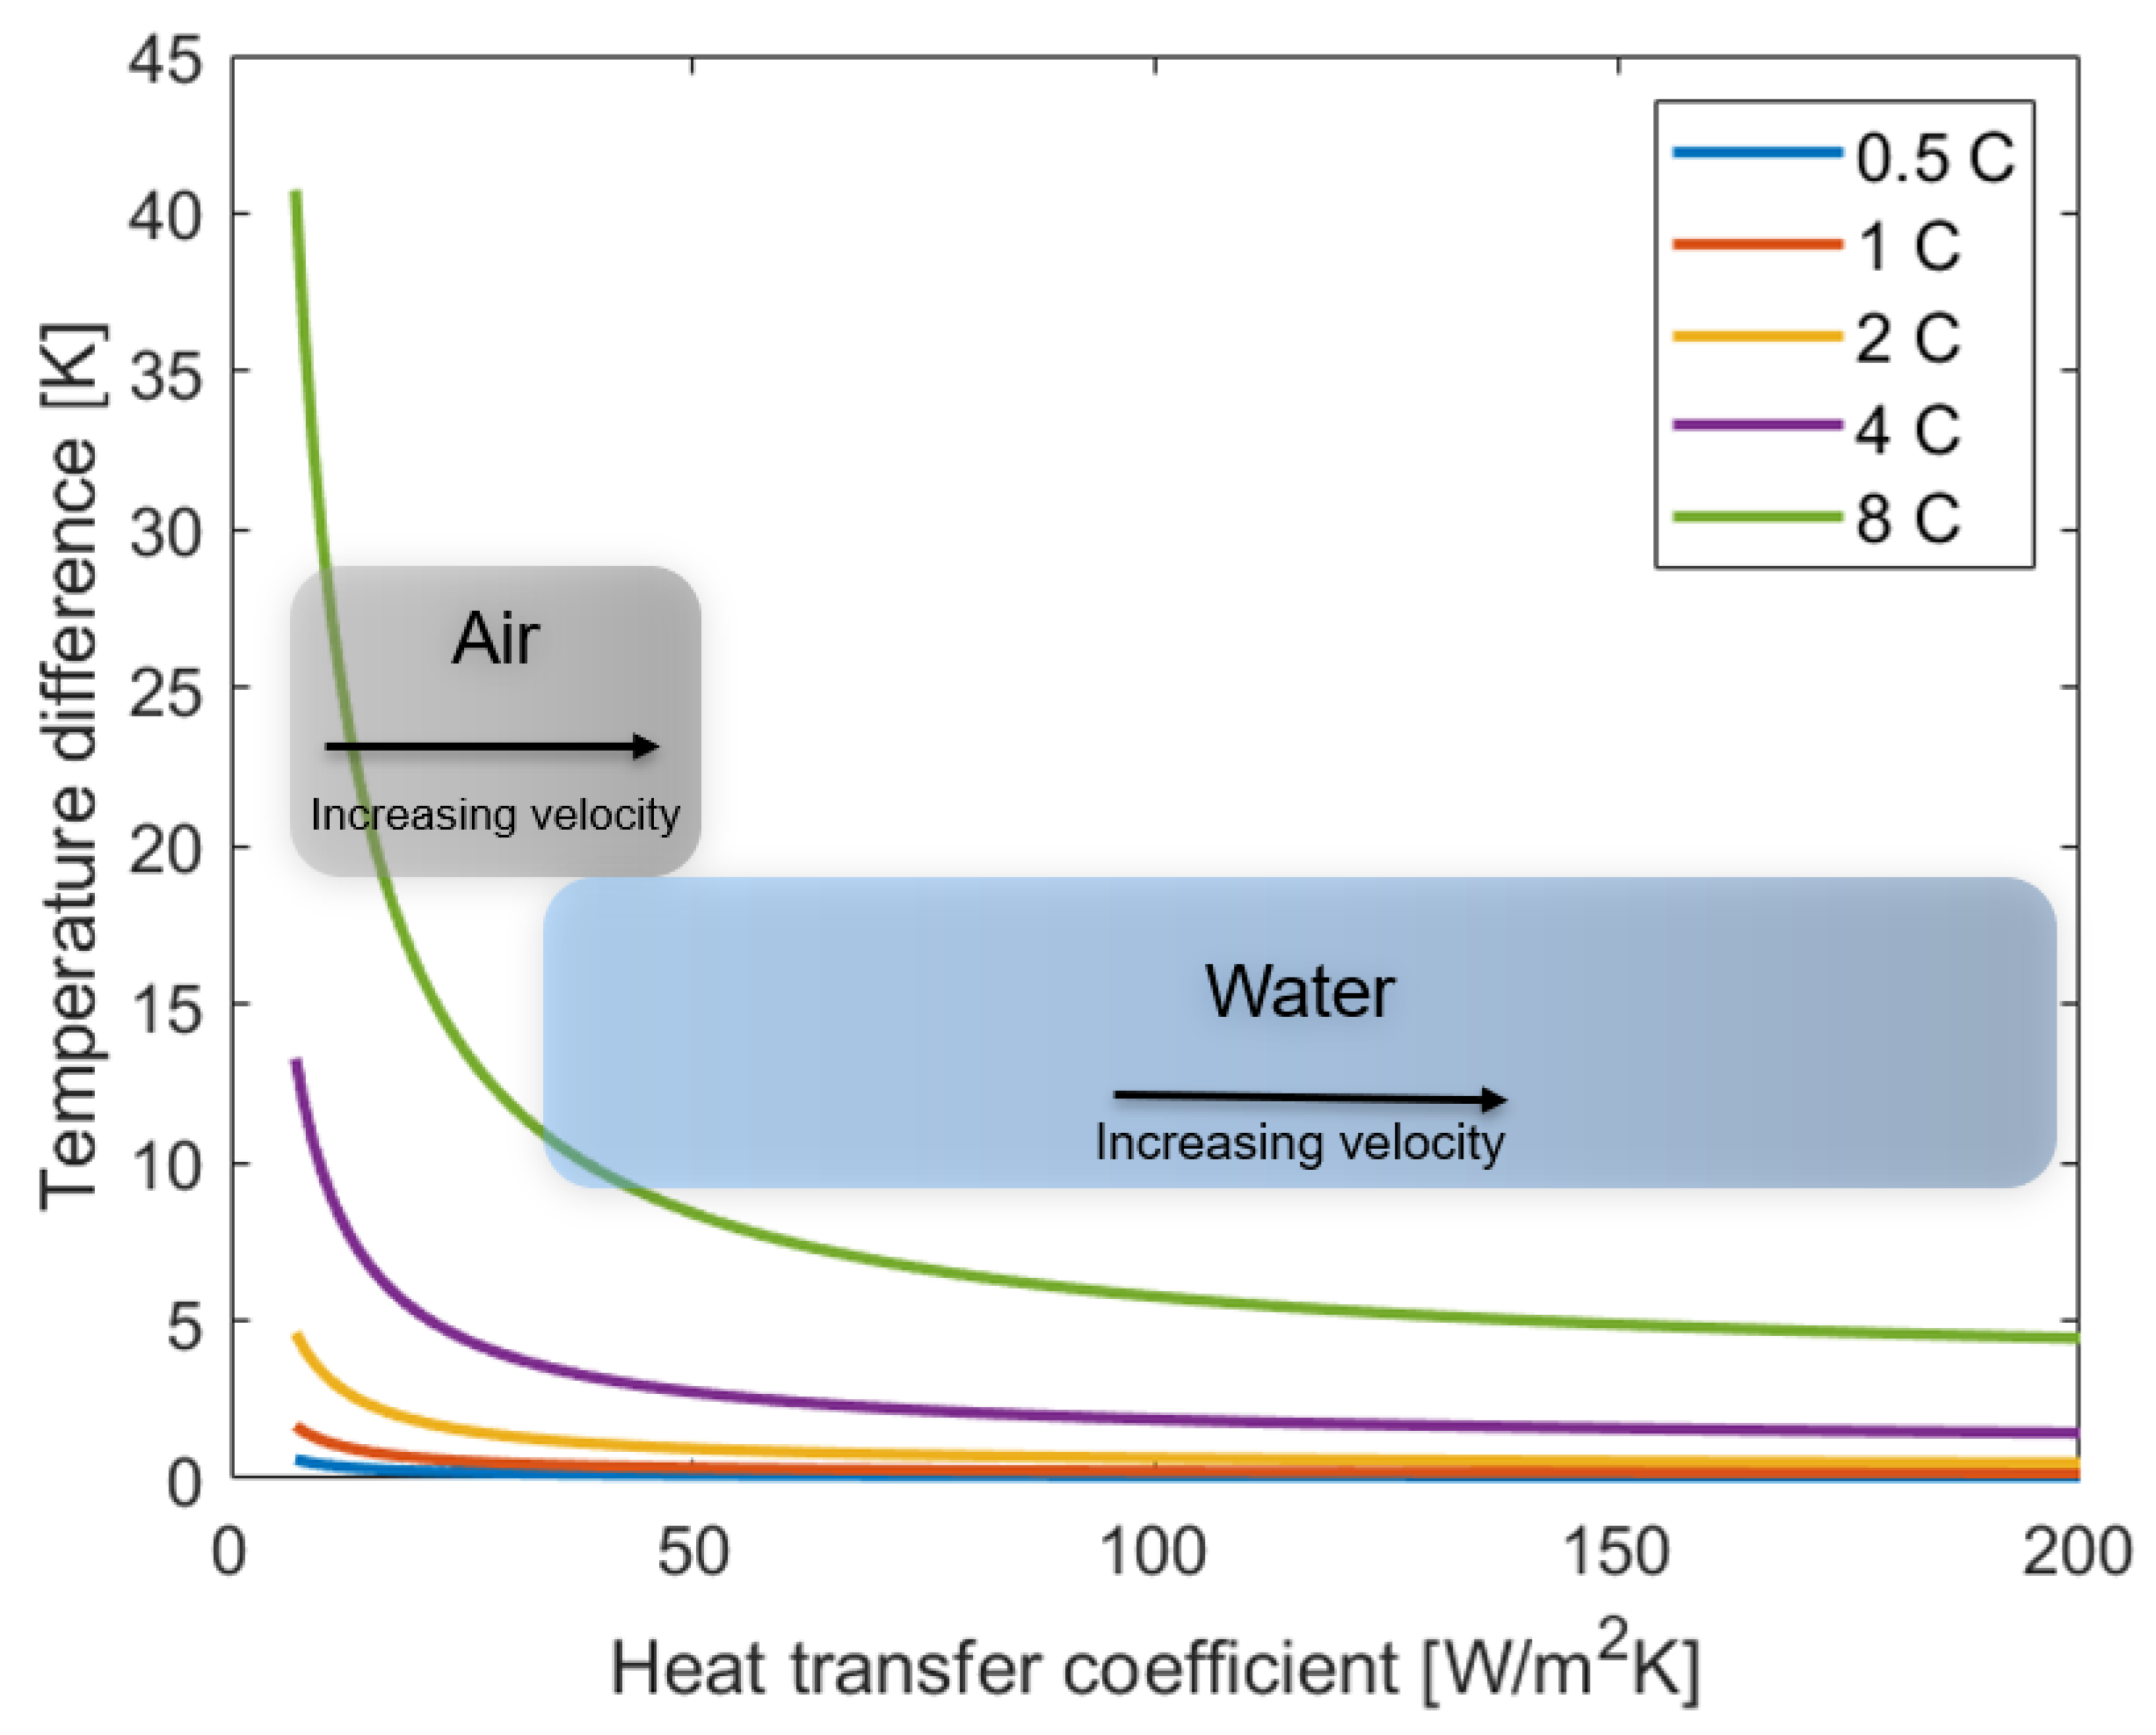
Table 1.
Battery specifications from reviewed studies.
| Nr. | Cathode | Anode | Nominal Capacity | Geometry | Study Type | Ref. |
|---|---|---|---|---|---|---|
| 1 | LFP | graphite | 1 Ah | cylindrical (18,650) | cycling | [90] |
| 2 | LFP | graphite | 1.1 Ah | cylindrical (18,650) | storage | [91] |
| 3 | LFP | graphite | 2.3 Ah | cylindrical (26,650) | cycling, storage | [6,7] |
| 4 | LFP | graphite | 15 Ah | cylindrical (N/S) | storage | [92] |
| 5 | LFP | carbon | 2.2 Ah | cylindrical (26,650) | cycling | [8] |
| 6 | LFP | carbon | 3 Ah | cylindrical (26,650) | storage | [83] |
| 7 | NMC/LMO | graphite and carbon particle | 1.5 Ah | cylindrical (18,650) | cycling | [82] |
| 8 | NMC | hard carbon | 17.5 Ah | pouch (23 × 15 × 0.5 cm) | cycling and storage | [5] |
| 9 | NMC | graphite | 2.05 Ah | cylindrical (18,650) | storage | [91] |
| 10 | NMC | graphite | 2.15 Ah | cylindrical (18,650) | storage | [84] |
| 11 | NMC | graphite | 40 Ah | (N/S) | cycling | [89] |
| 12 | NMC | graphite | 8 Ah | pouch (N/S) | cycling | [81] |
| 13 | NMC | Si/C | 1.3 Ah | cylindrical (18,650) | cycling | [90] |
| 14 | NMC (Ni rich) | Si/C | 3.45 Ah | cylindrical (18,650) | cycling | [27] |
| 15 | LCO | graphite | 2.4 Ah | cylindrical (18,650) | cycling | [85] |
| 16 | LCO | graphite | 1.35 Ah | prismatic (6.6 × 33.8 × 50 mm) | cycling | [86] |
Table 2.
Input parameter for the thermal model.
| Parameter | Value | Ref. |
|---|---|---|
| Number of single cells | 24 | |
| Ambient temperature | 290 K | |
| 1 C rate | 35 | |
| Anode thickness | 74 μm | |
| Separator thickness | 12.1 μm | |
| Cathode thickness | 67 μm | |
| Current collector thickness | 20 μm | |
| Thermal conductivity, anode, new and soaked | 1.11 WK m | [5] |
| Thermal conductivity, separator, new and soaked | 0.31 WK m | [5] |
| Thermal conductivity, cathode, new and soaked | 0.33 WK m | [5] |
| Thermal conductivity, anode, aged and dry | 0.32 WK m | [5] |
| Thermal conductivity, separator, aged and dry | 0.10 WK m | [5] |
| Thermal conductivity, cathode, aged and dry | 0.13 WK m | [5] |
| Average entropy change over 0–100% SOC range, LFP-G | 12.5 J mol K | [105] |
| Average entropy change over 0–100% SOC range, NMC-G | 10 J mol K | [105] |
| Average entropy change over 0–100% SOC range, LCO-G | 37 J mol K | [105] |
| Internal resistance, NMC | 2 m | [93] |
| Internal resistance, LCO | 33 m | [85] |
| Tafel parameter a | −0.039 V | [106] |
| Tafel parameter b | 0.068 V decade | [106] |
Table 3.
Comparing and evaluating temperature increase and FEC reduction of LCO and NMC for a C rate increase from 0.5 C to 1.5 C.
Table 3.
Comparing and evaluating temperature increase and FEC reduction of LCO and NMC for a C rate increase from 0.5 C to 1.5 C.
| LCO | NMC | |
|---|---|---|
| Temperature increase | 14.5 K | 2.3 K |
| Temperature induced FEC reduction (Figure 4) | 43% | 11 ± 1.2% |
| “C rate induced” FEC reduction (Figure 5) | 79.5 ± 0.6% | 30 ± 6% |
| Revised C rate induced FEC reduction | 36% | 19% |
Publisher’s Note: MDPI stays neutral with regard to jurisdictional claims in published maps and institutional affiliations. |
© 2021 by the authors. Licensee MDPI, Basel, Switzerland. This article is an open access article distributed under the terms and conditions of the Creative Commons Attribution (CC BY) license (http://creativecommons.org/licenses/by/4.0/).
Share and Cite
MDPI and ACS Style
Spitthoff, L.; Shearing, P.R.; Burheim, O.S. Temperature, Ageing and Thermal Management of Lithium-Ion Batteries. Energies 2021, 14, 1248. https://doi.org/10.3390/en14051248
AMA Style
Spitthoff L, Shearing PR, Burheim OS. Temperature, Ageing and Thermal Management of Lithium-Ion Batteries. Energies. 2021; 14(5):1248. https://doi.org/10.3390/en14051248
Chicago/Turabian StyleSpitthoff, Lena, Paul R. Shearing, and Odne Stokke Burheim. 2021. "Temperature, Ageing and Thermal Management of Lithium-Ion Batteries" Energies 14, no. 5: 1248. https://doi.org/10.3390/en14051248
Note that from the first issue of 2016, this journal uses article numbers instead of page numbers. See further details here.