
Investigations of Electrical and Optical Parameters of Some LED Luminaires—A Study Case


1
Department of Marine Electronics, Gdynia Maritime University, Morska 83, 81-225 Gdynia, Poland
2
Department of Microelectronics and Computer Science, Lodz University of Technology, Wólczańska 221/223, 90-924 Lodz, Poland
*
Author to whom correspondence should be addressed.
Energies 2021, 14(6), 1612; https://doi.org/10.3390/en14061612
Submission received: 10 February 2021
/
Revised: 8 March 2021
/
Accepted: 11 March 2021
/
Published: 14 March 2021
(This article belongs to the Special Issue Selected Papers from 27th International Conference on Mixed Design of Integrated Circuits and Systems – MIXDES 2020)
Abstract
:In the paper, the electrical and optical parameters of wirelessly controlled LED lamps of the Hue type are analysed. Features of this class of wirelessly controlled LED lamps given by the producer are described and a measuring setup for the electrical and optical parameters of the considered LED lamps is proposed. The results of measurements of the two investigated lamps with variable hue, based on RGB chips or emitted white light of different CCTs (correlated colour temperatures), are shown and discussed. Attention was given to the parameters characterising the influence of the tested LED lamp on such electric power quality indicators as PF (power factor) and THD (total harmonic distortion). Therefore, the influence of voltage supply and the selected value of power density of the emitted light on the THD and PF is analysed and discussed.
1. Introduction
Both white LED luminaires (with constant or variable correlated colour temperature (CCT)) and colour LEDs (with constant or variable hue) are used in lighting techniques [1,2,3]. LED lamps consist of four main components [4,5]: LED modules, LED drivers, optical lens and the lamp case with a heat-sink, which makes it possible to effectively remove the heat generated in this lamp.
The important aim of lighting systems is to obtain a desirable colour of emitted light and luminous flux. Classical LED lamps do not show such functionality and the colour or CCT of emitted light is fixed in the stage of production of these lamps. On the other hand, it is known from the literature [1,2,5,6,7,8,9,10,11,12] that the luminous flux emitted by power LEDs can be easily controlled by changing the value of the LEDs’ current, and the colour of the emitted light can be regulated using RGB diodes and by adjusting the value of the current flowing through each diode.
The papers [8,9,10,11,12,13,14,15,16] describe the control methods and application systems for RGB LEDs. The influence of selected RGB LED control methods on the dynamic parameters of lighting systems is also presented. On the other hand, there is a lack of measurement results describing the influence of the parameters of the signal-controlling RGB LEDs on the electrical and optical parameters of selected LED lamps. Thus, these papers present a measurement setup to obtain the RGB LED characteristics.
In the papers [2,3,4,5,6,17,18], some results of experimental studies on the influence of the operating temperature on the operating parameters of solid-state light sources and LED lamps are presented. We can notice a significant impact of the operating temperature of LED lamps on the value of the emitted luminous flux and on the shift in the optical spectrum generated by the mentioned semiconductor light sources. In the paper [19], a closed-loop feedback electronic circuit is proposed for the real-time white point adjustment of LED lamps. It is shown both experimentally and theoretically that RGB sensors can be used in feedback systems for the control of the CCT of white light. The proposed real-time control system does not require expensive and time-consuming factory calibration of the investigated LED lamps.
One of the main advantages of LED lamps is the high luminous efficiency [6,17,20], which causes these lamps to be characterised by a low consumption of electrical energy. Unfortunately, in most cases, the quality of LED drivers included in such lamps is low [4,8,13,18,20,21,22,23,24,25,26], and they cause essential noise of the current received from the power plant. This can lead to the worsening of indicators characterising the quality of electrical energy [13,18,22,26]. These indicators are, e.g., the total harmonic distortion (THD) and the power factor (PF) [7,8,20,25,27,28,29,30,31,32].
The papers [4,18,23,25,27,33] analyse the influence of selected exploitation parameters of the lighting systems containing solid-state light sources on the THD and the PF. The paper [16] also analyses the impact of the operating parameters of these lighting systems on the obtained shape of the input current received from the electro-energy network.
The papers [9,13,16,26,33] propose methods and application systems to improve the power quality of the electro-energy network at operation with a highly nonlinear load such as LED light sources. The cited papers also analyse the impact of different application circuits used in various types of solid-state light sources on the THD or PF.
The development of solid-state light sources and systems of intelligent lighting of buildings results in the production of wirelessly controlled LED lamps, which are managed with mobile devices [7,34,35]. This control is performed with the use of radio signals and such systems as Bluetooth, Wi-Fi or ZigBee [35]. The radio signal is transmitted between the controller and the lamp containing the unique address of the lamp and the required parameters describing properties of the emitted light [34,35].
The paper [36] presents an overview of communication standards used to supply and control lighting systems using solid-state light sources. These standards use wired and wireless communication via the public ISM (Industrial, Scientific and Medical) radio band with the operating frequency of 2.4 GHz. One of the standards that uses wired communication is the PLC (Power Line Communication) standard.
Philips is one of the main producers of wirelessly controlled LED lamps, offering among other devices, LED lamps of the Philips Hue type [37]. The first lamps belonging to this group were introduced to the market in October 2012. They provide various features including a change in colour of the emitted light or CCT (for white light only). At present, three generations of Philips Hue lamps are accessible on the market assuring full compatibility [37]. The lamps selected for the tests are characterised by the following value of parameters: Maximum luminous flux equal to 806 lm, dissipated power equal to 9 W, CRI > 78, CCT in the range from 2200 to 6500 K, bulb type A60 and thread type E27 [37].
Some European regulations, e.g., [38,39,40], describe conditions which have to fulfil lighting sources in order to be accepted for common use. In the papers [39,41,42], the problem of the photobiological safety of LED lamps is considered. Particularly, the cited papers discuss the spectra of emitted light. In turn, the measurements of photometric parameters of LED lamps and the manner of presenting their results are described. The influence of electrical equipment on public electricity networks is characterised in the norms [40,43]. An analysis of this problem for LED light sources is presented in the paper [44] with a focus on selected power quality parameters.
There is a lot of research on the electrical and optical properties of selected types of LED lamps in the literature [4,14,18,20,21,45]. However, no results of investigations of lamps that have a remote control function have been examined yet.
The paper [46] presents the results of measurements of selected exploitation parameters of a wirelessly controlled LED lamp emitting white light of three basic CCT values corresponding to cold, neutral and warm white light. This paper shows the influence of the duty cycle of the PWM controlling signal on the value of the current taken from the electro-energy network and on the value of the power flux generated by the tested LED lamp. The results of the THD measurements are obtained using a simplified method. This parameter describes the influence of harmonic frequencies on the shape of the current received from the electro-energy network. This simplification causes big discrepancies between the measured results of this parameter with a single-phase power analyser and with an oscilloscope.
This paper, which is an extended version of the paper [47], presents a comparison of the exploitation parameters of two selected wirelessly controlled LED lamps. One of them emits light with three basic colours (blue, green and red), whereas the other—white light—with three arbitrarily selected values of CCT (warm, cold and neutral). The greatest emphasis is placed on the comparison of the obtained parameters characterising the quality of the electrical energy consumed by the tested LED lamps. The waveform and the spectrum of the current feeding the tested LED lamps are also analysed.
2. Tested Lamps
Wirelessly controlled colour and dynamic white LED lamps of the Hue type which emit optical radiation in three different colours: Green, red and blue, or three different CCT values, were selected for experimental investigations. The colour and CCT value of the emitted light were selected by means of the application Philips Hue 3.0.1 dedicated to mobile devices with Windows, iOS and Android operating systems. This application makes it possible to configure up to 50 LED lamps of the Hue type and choose a hue from the palette of sixteen million colours. It also enables the regulation of intensity of the light within the range from 1 to 100% with a step of 1%. The examined lamp of the type White and Colour Ambiance model 9CK is characterised with the maximum value of the emitted luminous flux equal to 806 lm. The electrical power consumed from the electro-energy network is equal to 9.5 W [37].
The colour of the emitted optical radiation in the case of the LED lamp White and Color Ambience is obtained by means of RGB LEDs. These LEDs are controlled with three separate PWM (pulse-width modulation) signals, and the colour of illuminance is regulated by changing the value of the suitable level of the duty cycle for each PWM signal. This is one of the methods to obtain a suitable colour of the emitted light and it is widely described in the literature [4,7,12,18,34]. Communication between the selected LED lamp and the mobile device is based on the ZigBee protocol described in the standard IEEE 802.15.4 [35,37].
An indispensable component of the system of the remote control is a communication bridge—the Hue Control Bridge. It is used for remote communication with the end devices of the Hue system (with LED lamps) [37]. The Hue communication bridge operates in the waveband from 2.4 to 2.484 GHz in the ISM range. The bridge uses this frequency range to communicate with the examined LED lamp and with the mobile device. The Wi-Fi router and the Hue communication bridge are connected with the LAN (local area network) by the RJ-45 cable. These devices are supplied power from the electro-energy network from a feeder producing 5V DC voltage.
3. Measurement Setup
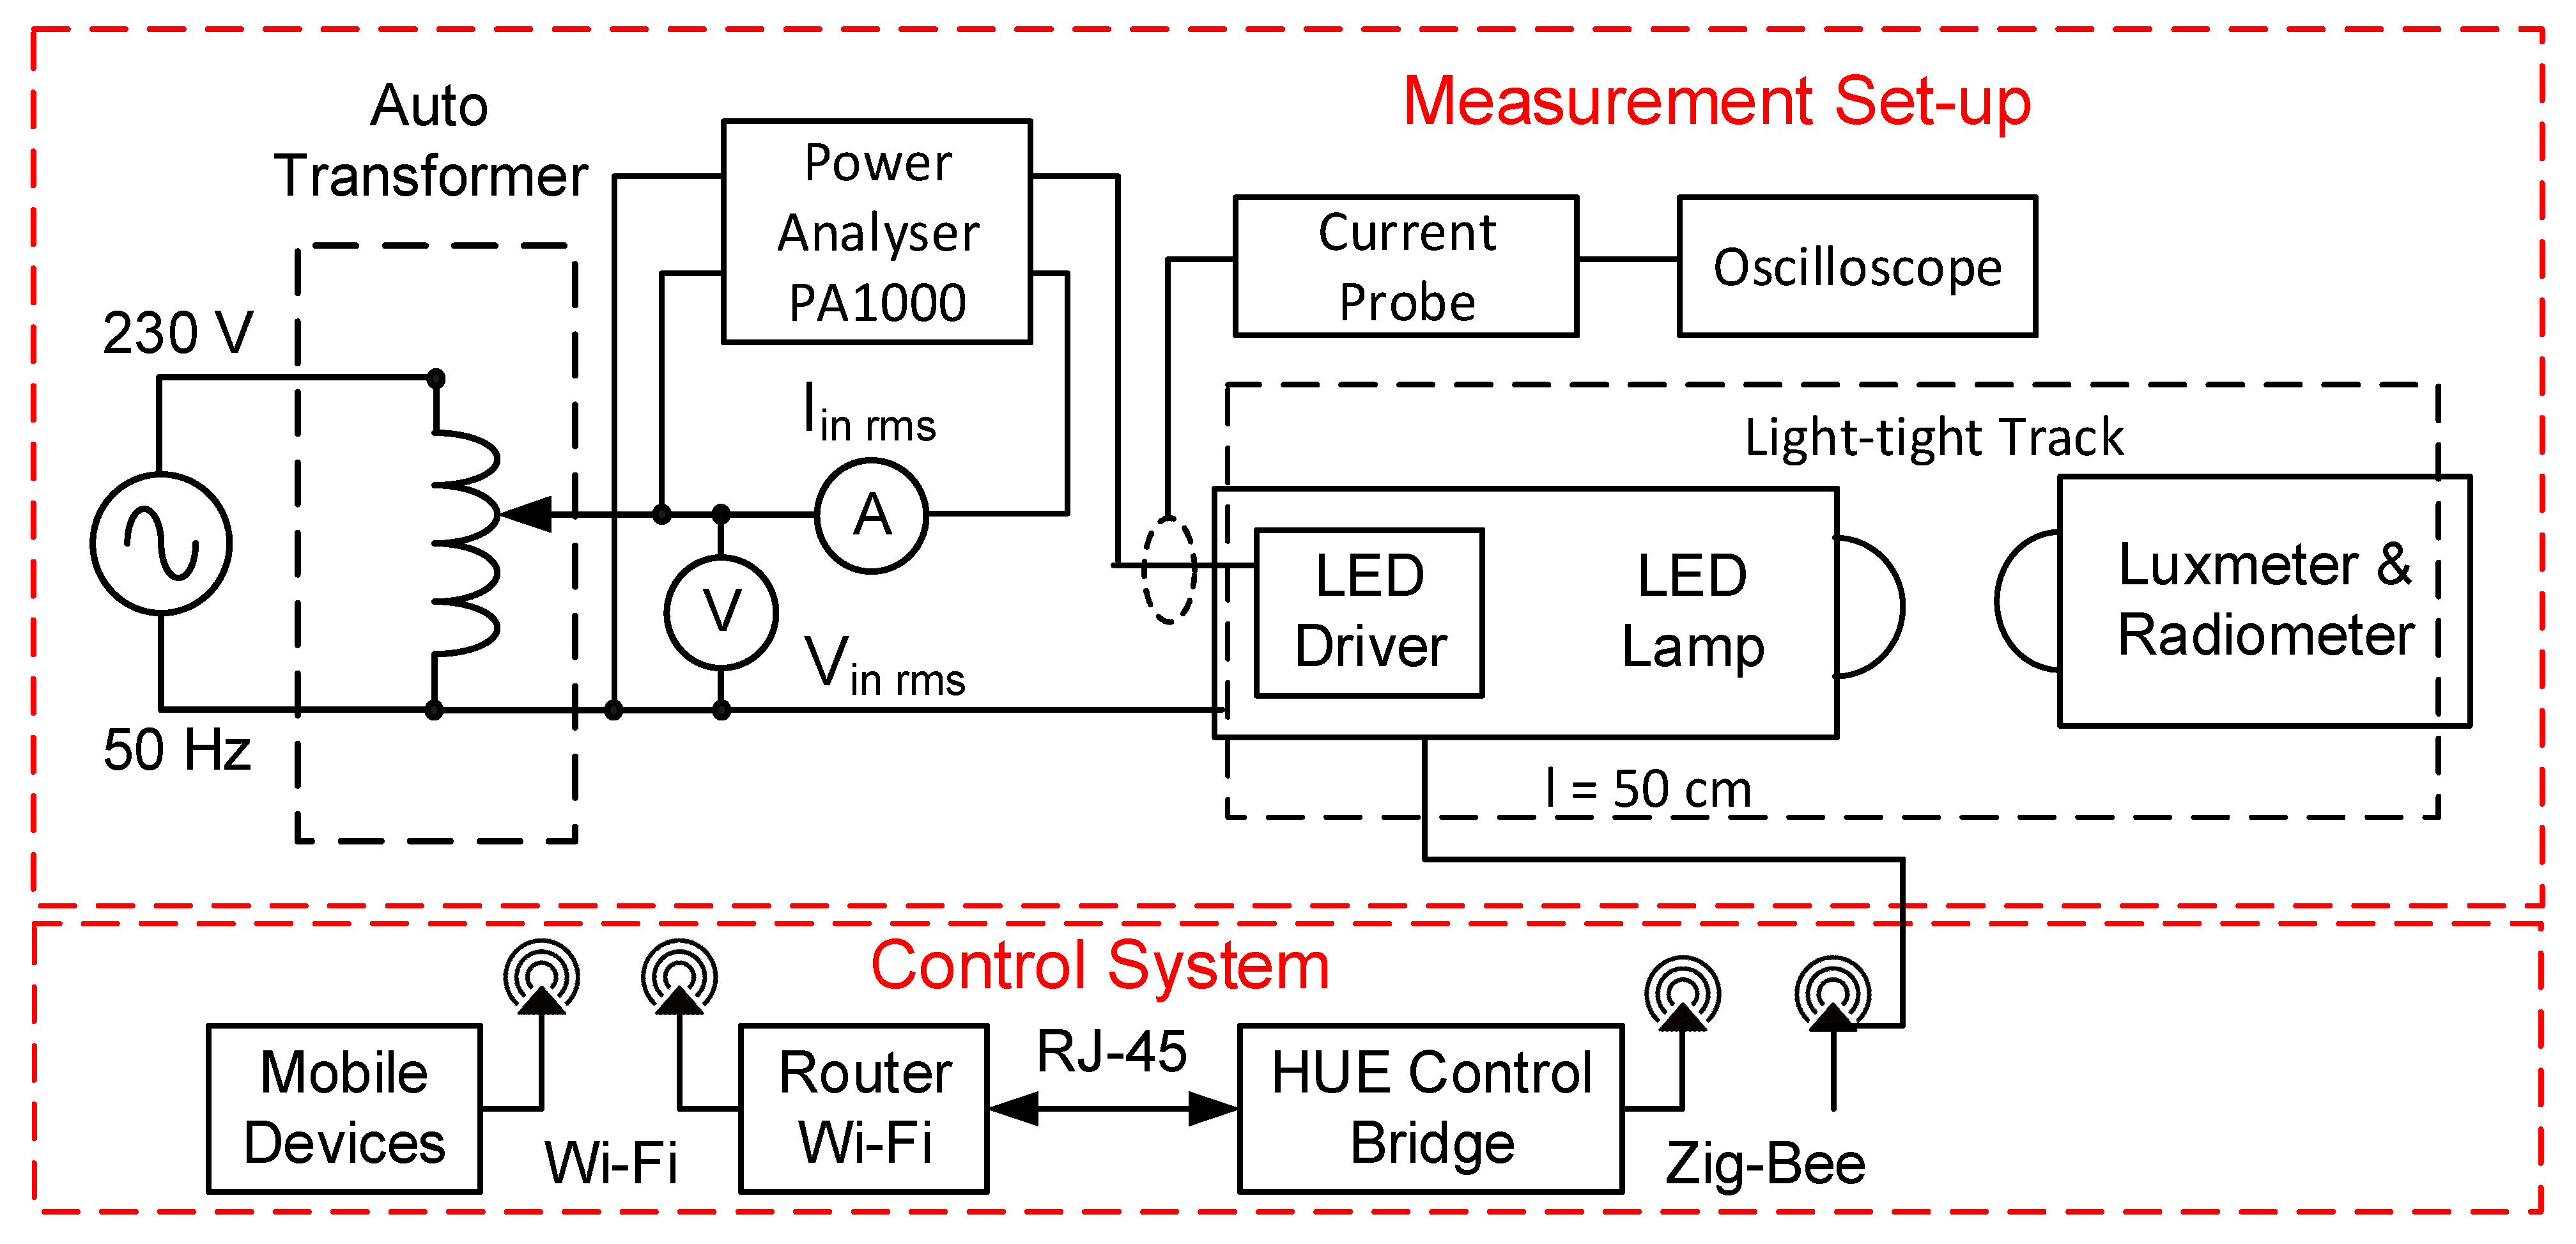
In order to measure characteristics of the examined LED lamps of the Hue type, a measuring setup was designed and constructed. This setup makes it possible to measure optical and electrical parameters of the examined LED lamps. In order to measure optical parameters of the selected LED lamps, the light-tight measuring-track containing a PCV pipe with a length of 50 cm was built. Figure 1 presents the block scheme of the measurement setup.
This setup contains an autotransformer ATS-REG1.2 [48], two multimeters Unit 804 [49] realising the function of an ammeter and a voltmeter, the current probe Tektronix TCPA300 [50], a single-phase power analyser Tektronix PA1000 [51] and an oscilloscope Gw Instek GDS 2104a [52]. The power supply voltage of the examined LED lamp is regulated with the use of the autotransformer connected to the electro-energy network. The voltage is regulated within the range from 100 to 230 V, making it possible to obtain different values of illuminance and power density of the emitted light for the examined LED lamps of the Hue type.
The illuminance obtained on a surface of the probe at a distance l = 50 cm from the investigated lamp is registered by an illuminance meter L200 [53], whereas the power density of emitted light in the axis of the tested lamps at a distance l from these lamps is registered by a radiometer HD2302 [54]. The measuring probe of these devices was placed at the end of the optical path. In order to measure spectral characteristics of the examined LED lamp, an Ocean Optic USB 650 spectrometer [55] was used. The measurements of optical parameters were software-controlled from the PC.
In order to examine the quality of the electrical energy received from the electro-energy network, an oscilloscope and a current probe were used. These instruments enabled measurements of the spectrum of the current received from the electro-energy network by fast Fourier transformation (FFT) processing. Additionally, the spectrum of this current was also measured by a Tektronix PA1000 single-phase power analyser [15].
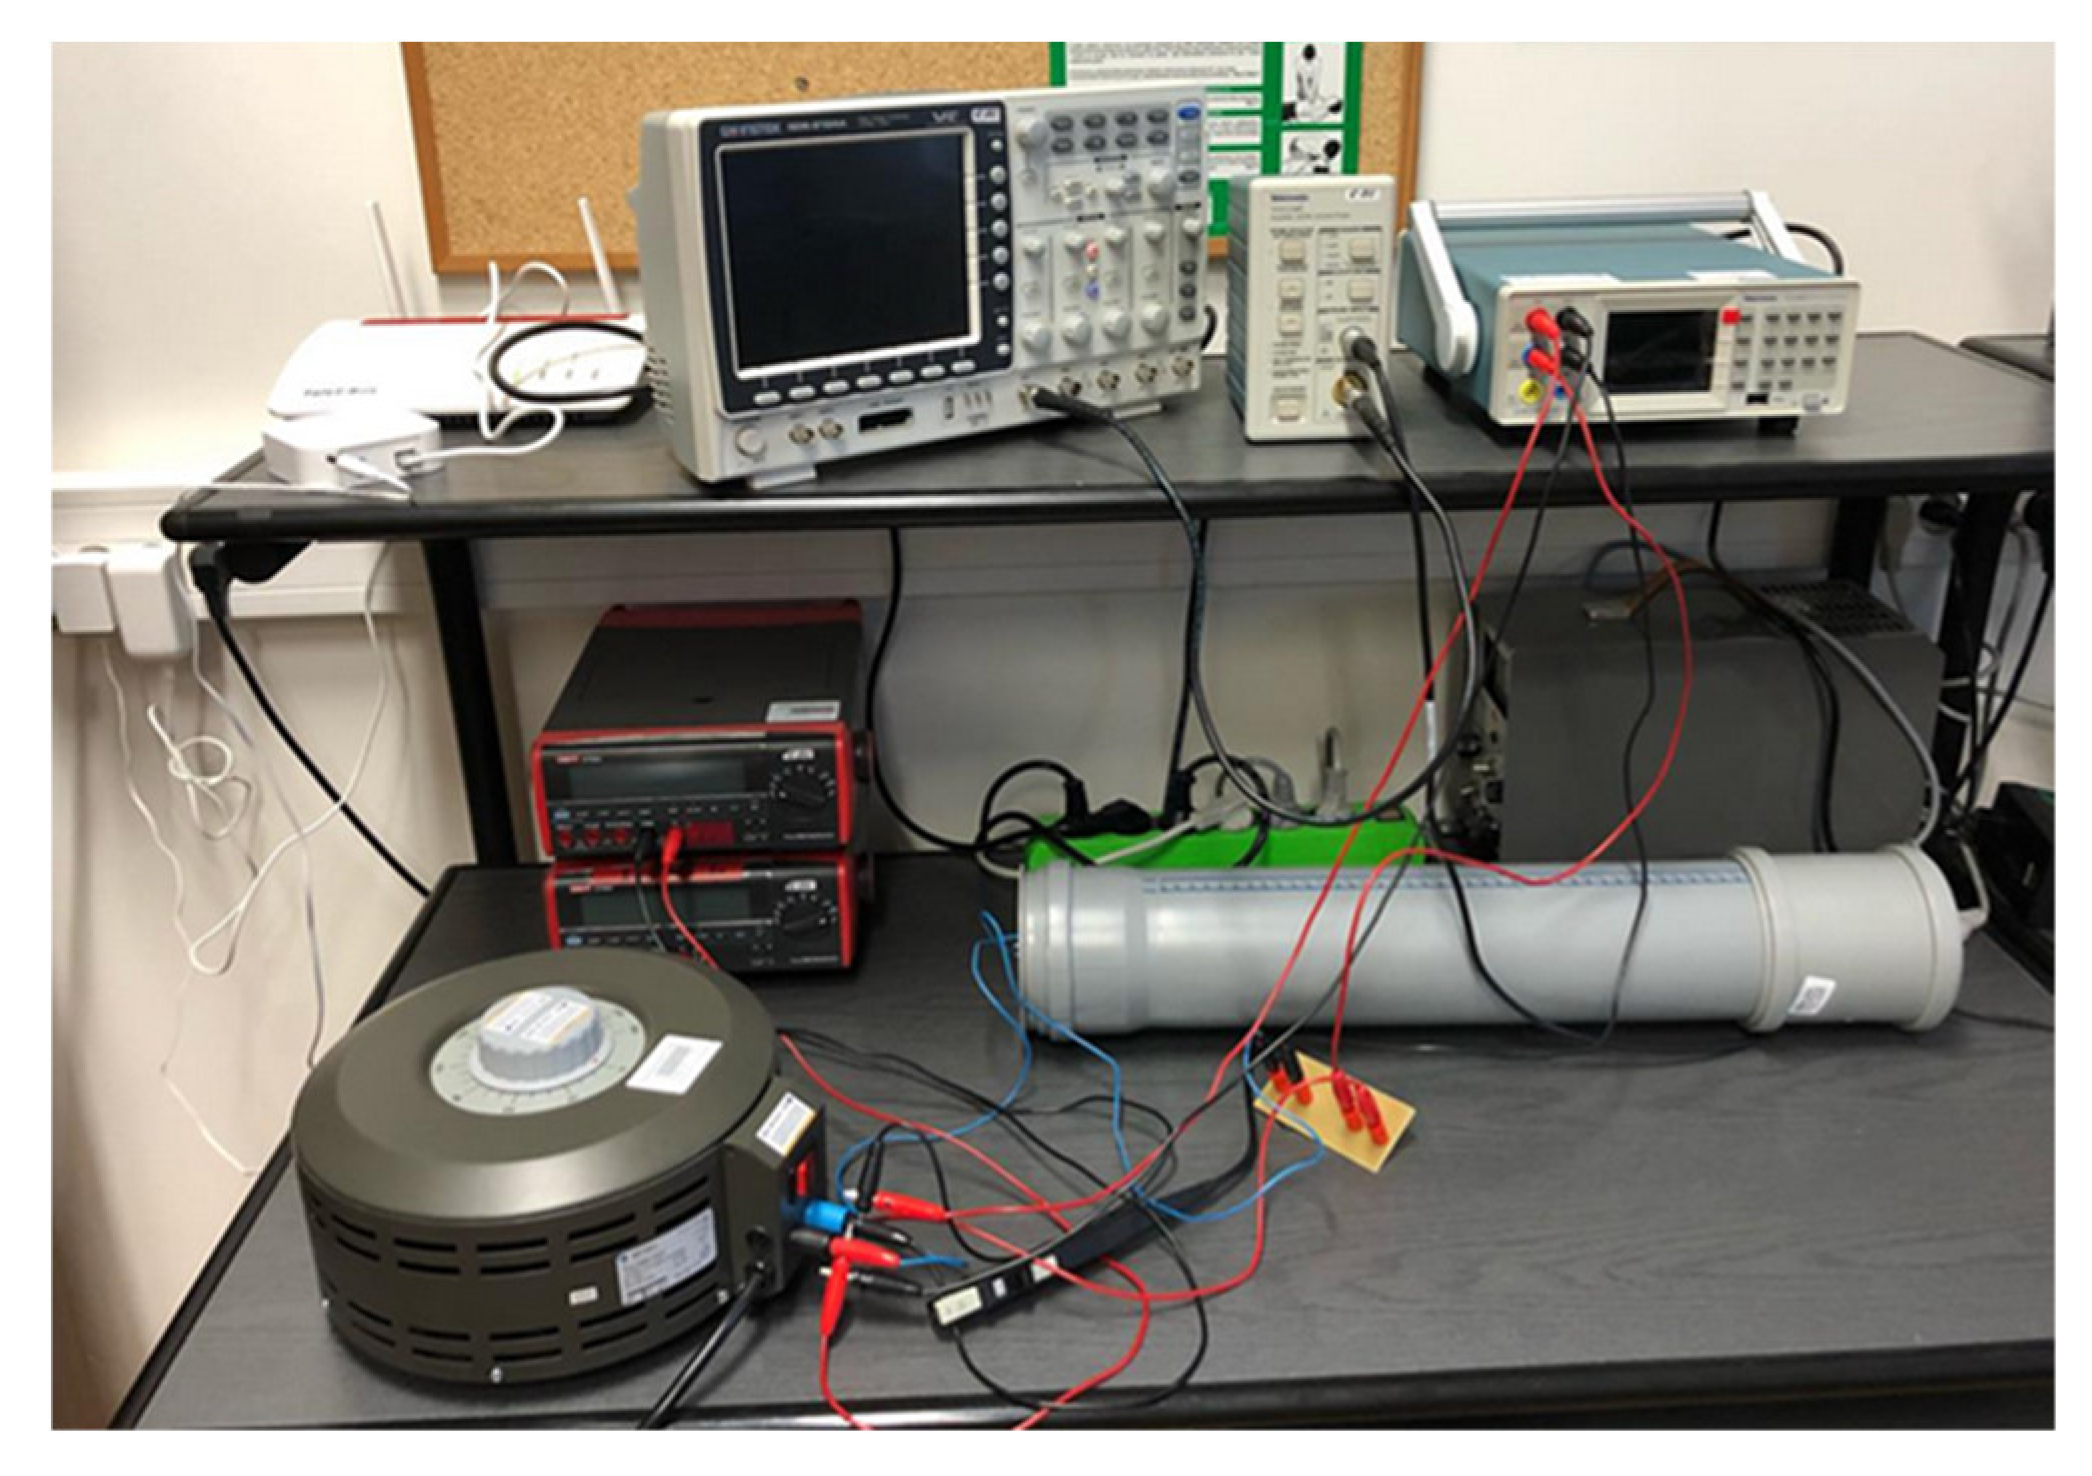
The view of the used measurement setup is presented in Figure 2.
Tektronix power analysers have highly extensive input circuits, which allow more accurate FFT processing than a good-class oscilloscope. Therefore, the input current waveform of the tested LED lamps can be represented more accurately and with a higher number of harmonics. In the case of the Tektronix PA1000 power analyser, it is possible to register up to 70 harmonics of current, while in the case of spectrum measurements with a digital oscilloscope using the fast Fourier transform (FFT) function, the number of these harmonics does not exceed 20. This is due to the use of less complex input filters.
The total deformation of the waveform of the supplying current can be characterised by means of the coefficient of total harmonic distortion THD. The value of this coefficient is described by the formula
where Ik denotes the k-th harmonic of the current and n is the number of used harmonics.
The unfavourable influence of the device current received from the electro-energy network on this network is typically characterised by the power factor PF measured by a power analyser. The power analyser used in the setup measures the value of the power factor based on the definitional example of the form [46]
where T denotes the period of waveforms of current iin(t) and voltage vin(t), and Vin,RMS and Iin,RMS are root mean square (RMS) values of the supplying voltage and current, respectively. The calculations were performed using the following formula [15]:
where the THD coefficient is estimated by Formula (1) and based on the data measured and collected with the oscilloscope.
4. Results
In order to test properties of the selected LED lamps, a set of parameter measurements was performed with different RMS values of sinusoidal feeding voltage at a frequency equal to 50 Hz. The measurement setup described in Section 3 was used to measure optical power density, illuminance and RMS values of the input current at the steady state. Additionally, waveforms of illuminance and spectral characteristics of the examined LED lamp were measured. Measurements of the total harmonic distortion THD and power factor PF coefficients were performed for different RMS values of feeding voltage. All the parameters which were measured at different values of feeding voltage were also measured for various values of dimming factor d, characterising the emitted light, in the range from 0 to 100% that was controlled using a special application designed for the Hue system.
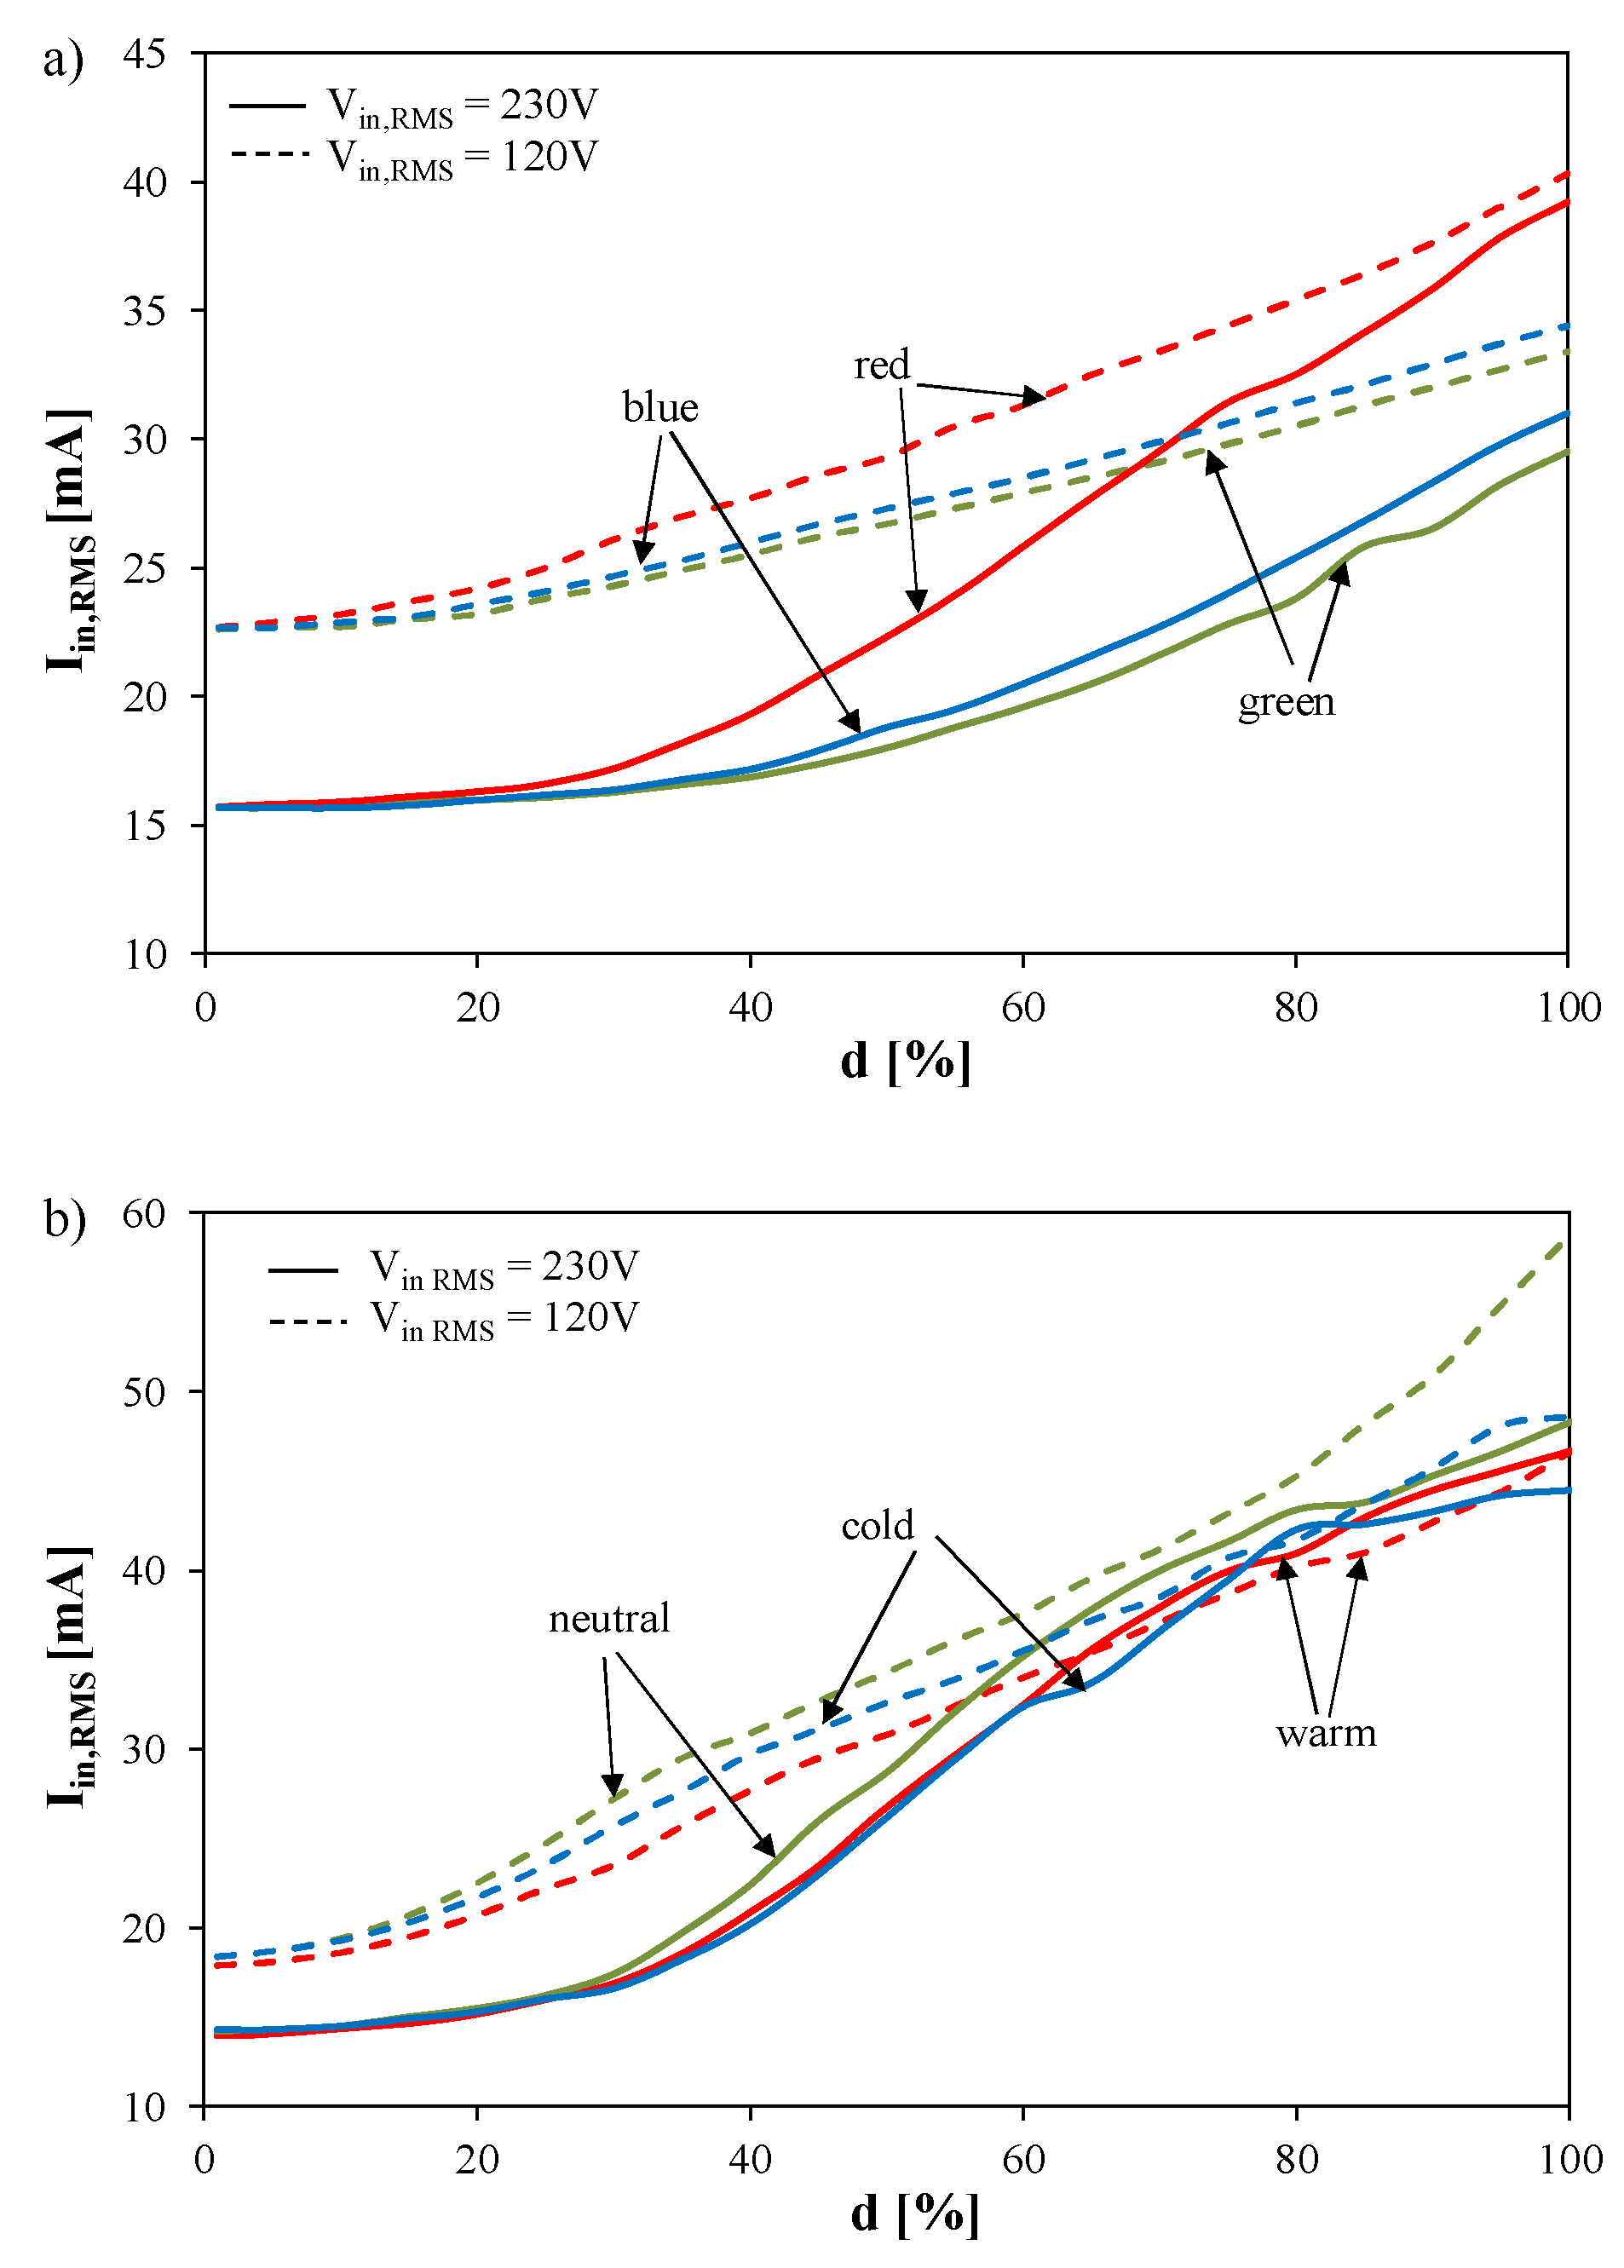
Figure 3 presents the measured dependences of the supplying current as a function of parameter d and for two different voltage supply values equal to 120 (dashed lines) and 230 V (solid lines), respectively. The measurements were performed for both LED lamps.
As expected, an increase in the fixed value of parameter d caused an increase in the RMS value of the supplying current, but this increase was nonlinear. In the range of the change in dimming factor d < 30%, the value of the current Iin,RMS was nearly constant. In this range, the input current was consumed mostly by the LED driver, whereas only a small part of this current was consumed by the LEDs. The current decreased with voltage supply. The measurements for a colour LED lamp (Figure 3a) indicate that the highest consumption of current corresponds to red-coloured light, and the least to green-coloured light. This is associated with the spectral sensitivity of the human eye [56]. When analysing Figure 3b, it should be noted that the highest power consumption corresponds to neutral white light, and the lowest—to cold white light. The observed changes in the supplying current correspond to properties of the LED drivers used in the tested lamps. The input current of these drivers depends on the current consumed by the feeding LEDs. In order to obtain the selected value of luminous flux, the red LED needs a much higher current than the blue or the green LED. For the lamp emitting white light of different CCTs, changes in the current Iin,RMS are much smaller than for the lamp emitting coloured light.
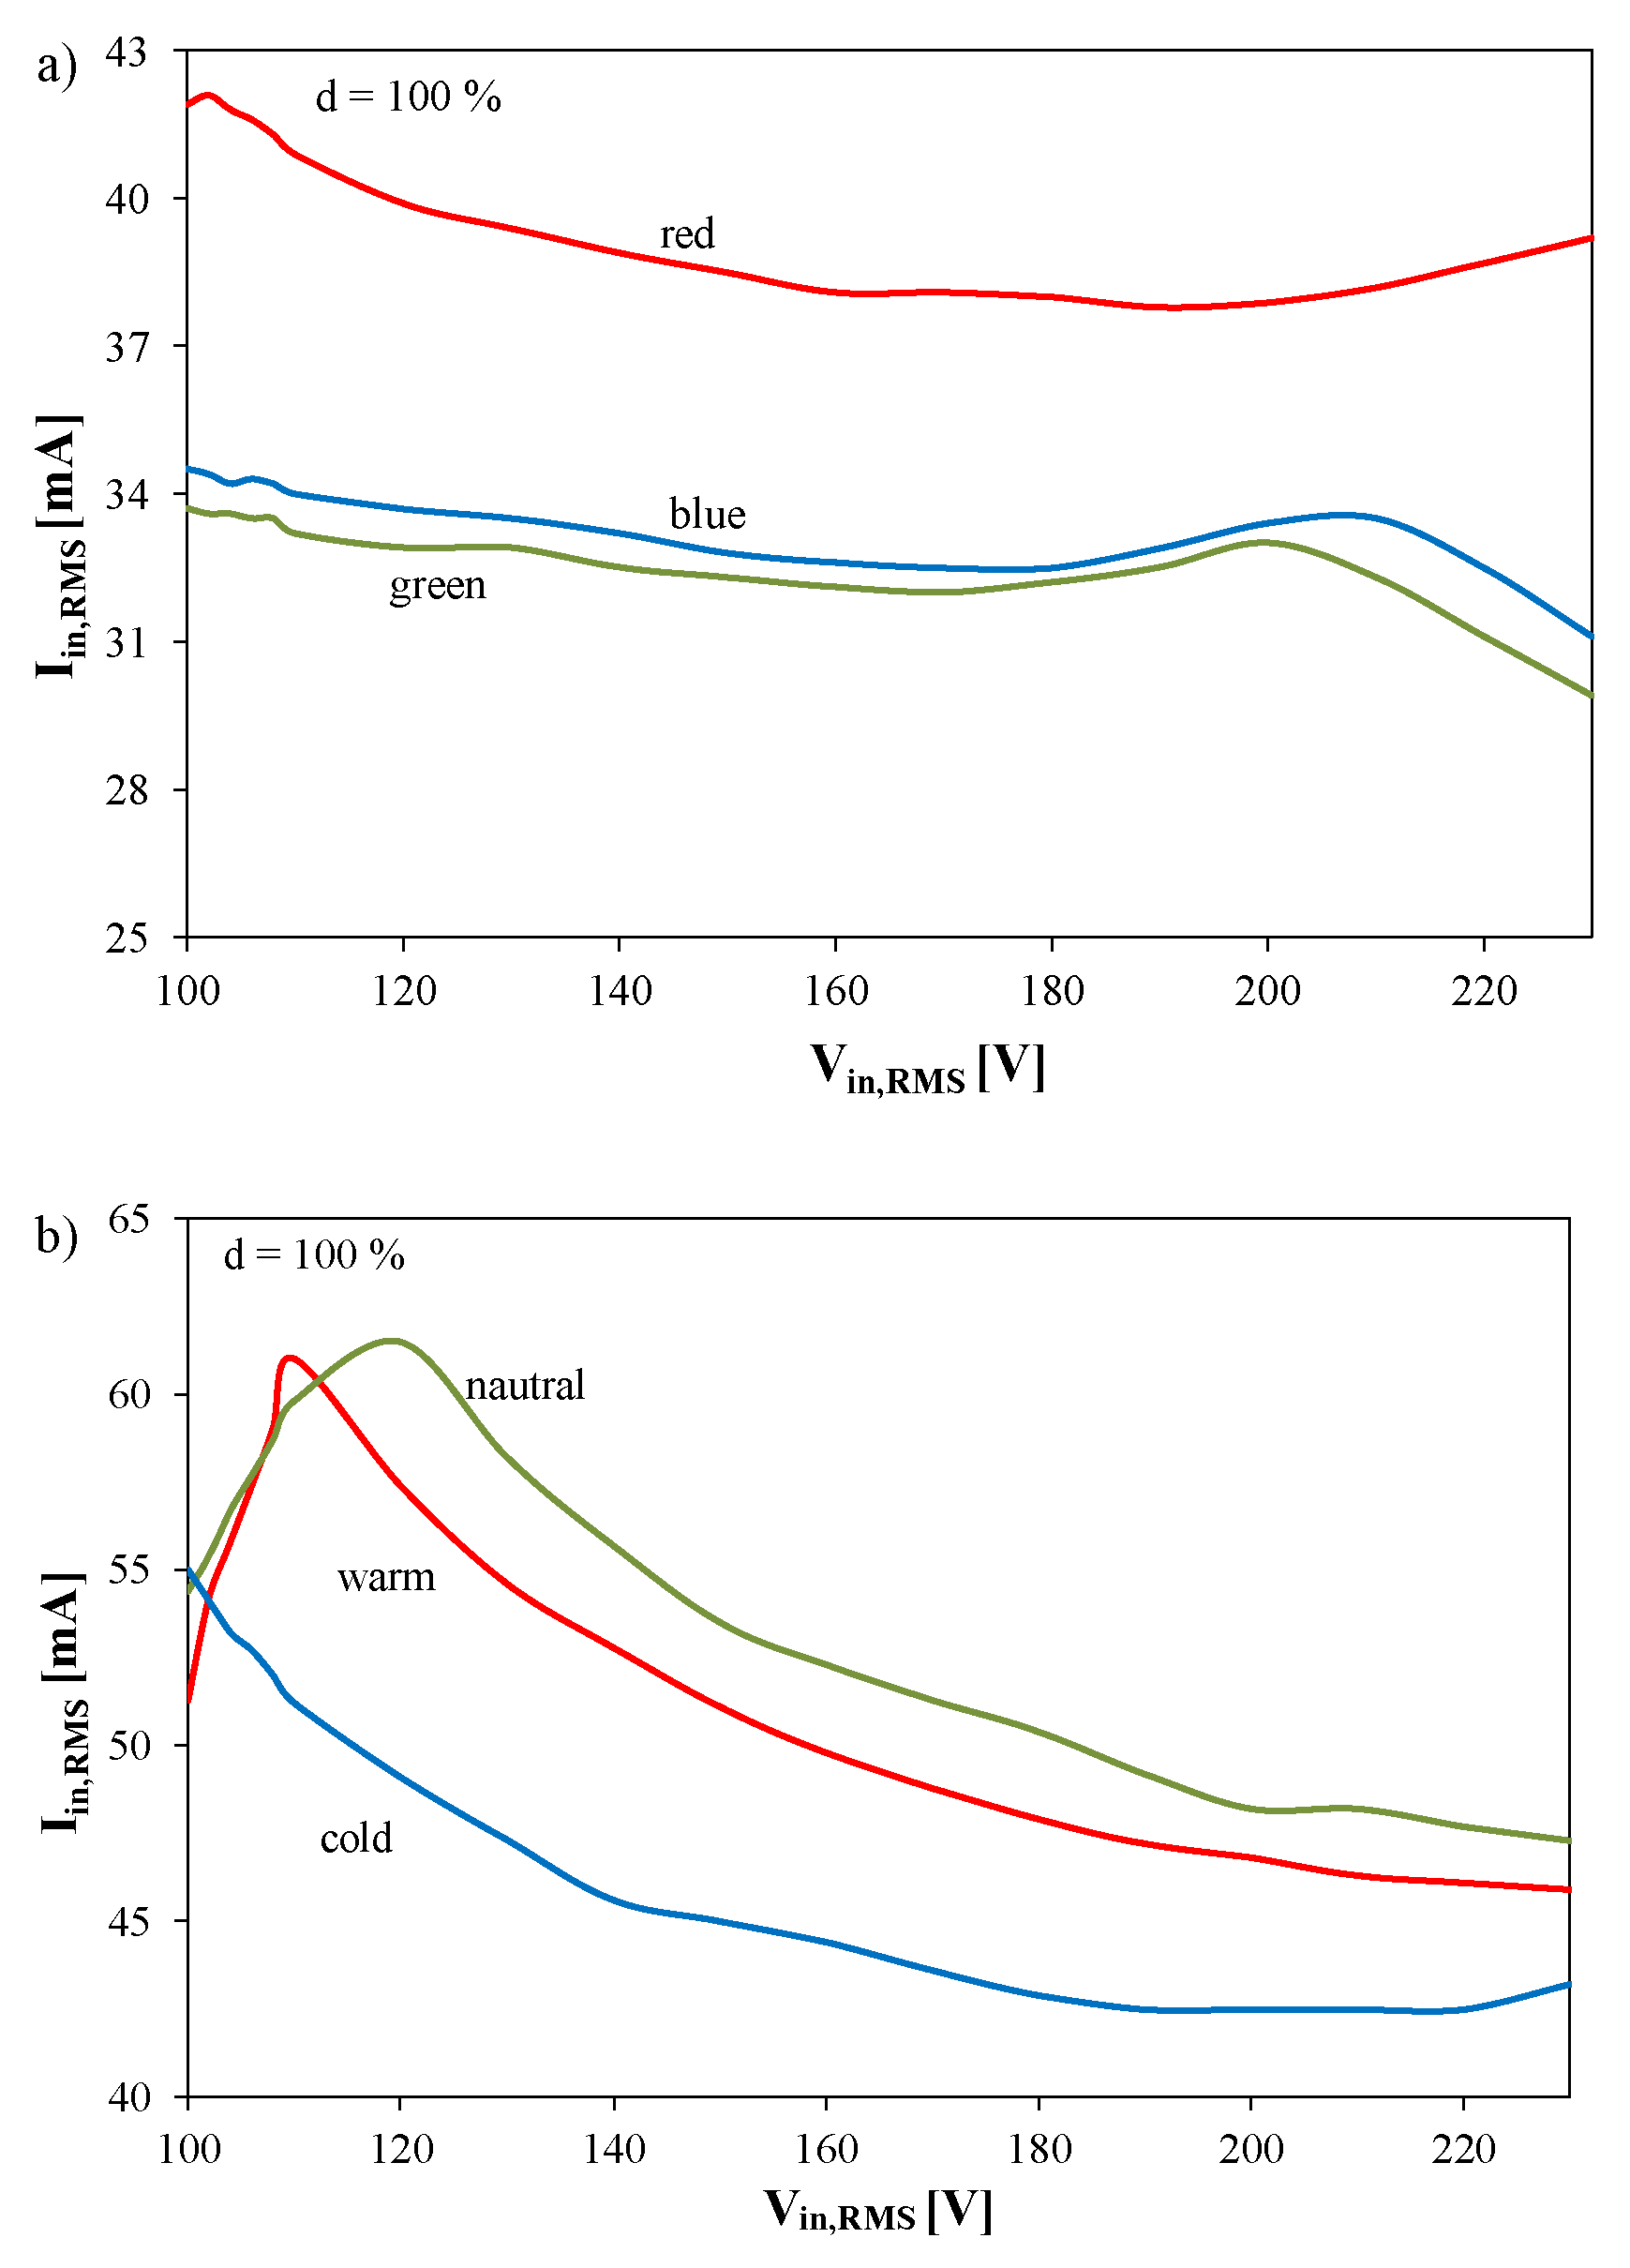
Figure 4 shows the dependence of the supplying current Iin,RMS as a function of the input voltage Vin,RMS in the range from 100 to 230 V for two LED lamps emitting the coloured (a) and white (b) light. The measurements were carried out for a constant value of dimming factor d = 100%.
As can be seen, the value of Iin,RMS current decreases with Vin,RMS voltage. This relationship can be observed for both the tested LED lamps, regardless of the colour and CCT emitted by the LED lamp. The changes in Iin,RMS current are much bigger for the lamp emitting the white light. They are equal to 20%, whereas for the colour lamp, they do not exceed 10%. The obtained relationship Iin,RMS(Vin,RMS) is typical for switch-mode power supplies. Such power supplies are used as LED drivers in the tested LED lamps. Observed differences in the values of Iin,RMS obtained at emitted light of different colours or different CCT result from differences in the forward voltages of the used RGB LEDs [57].
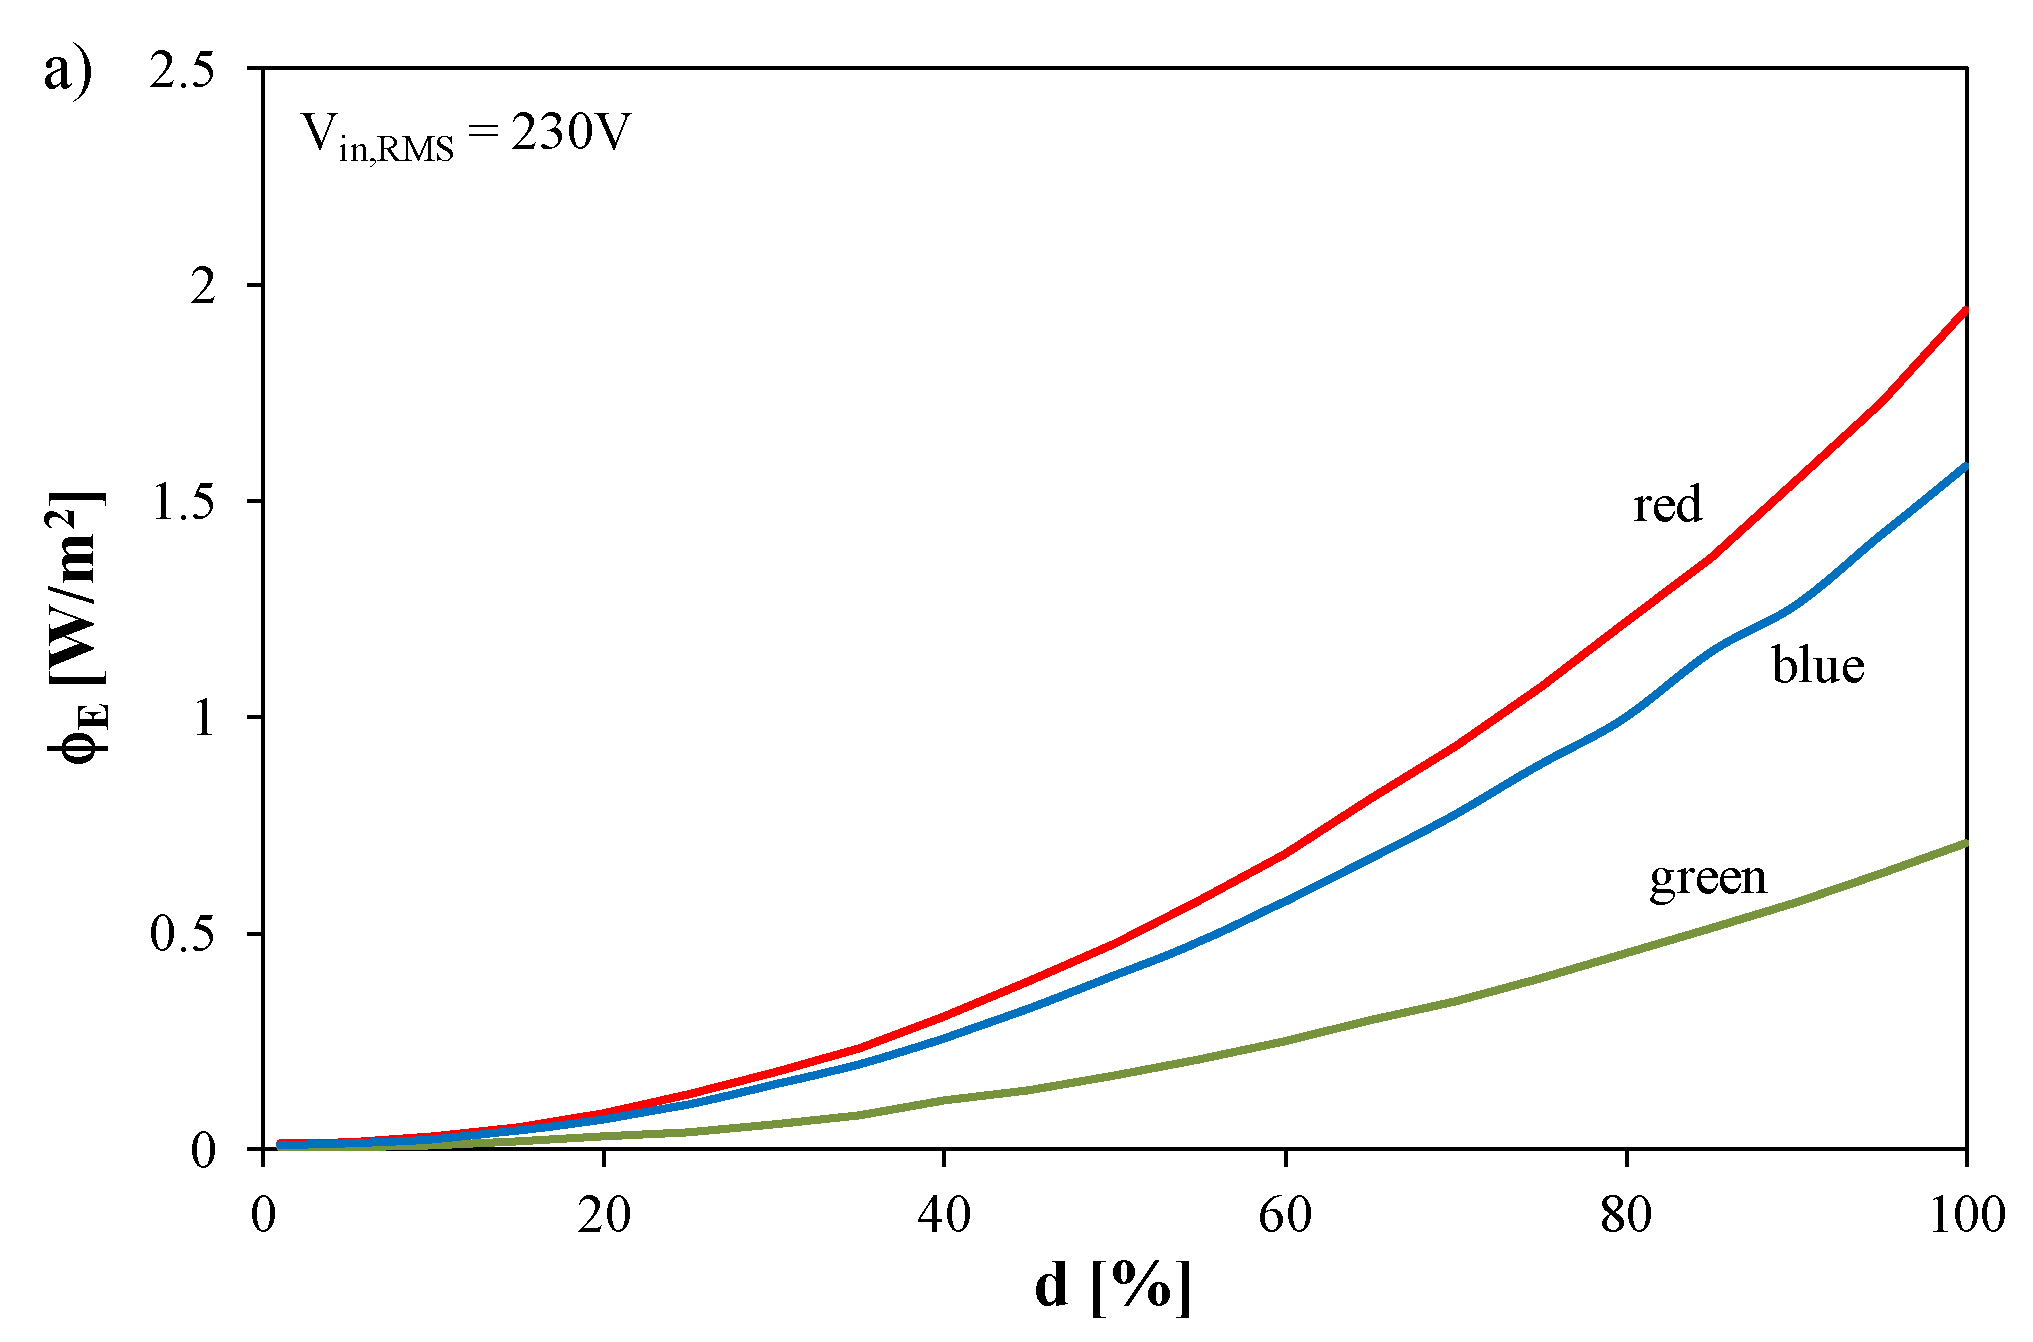
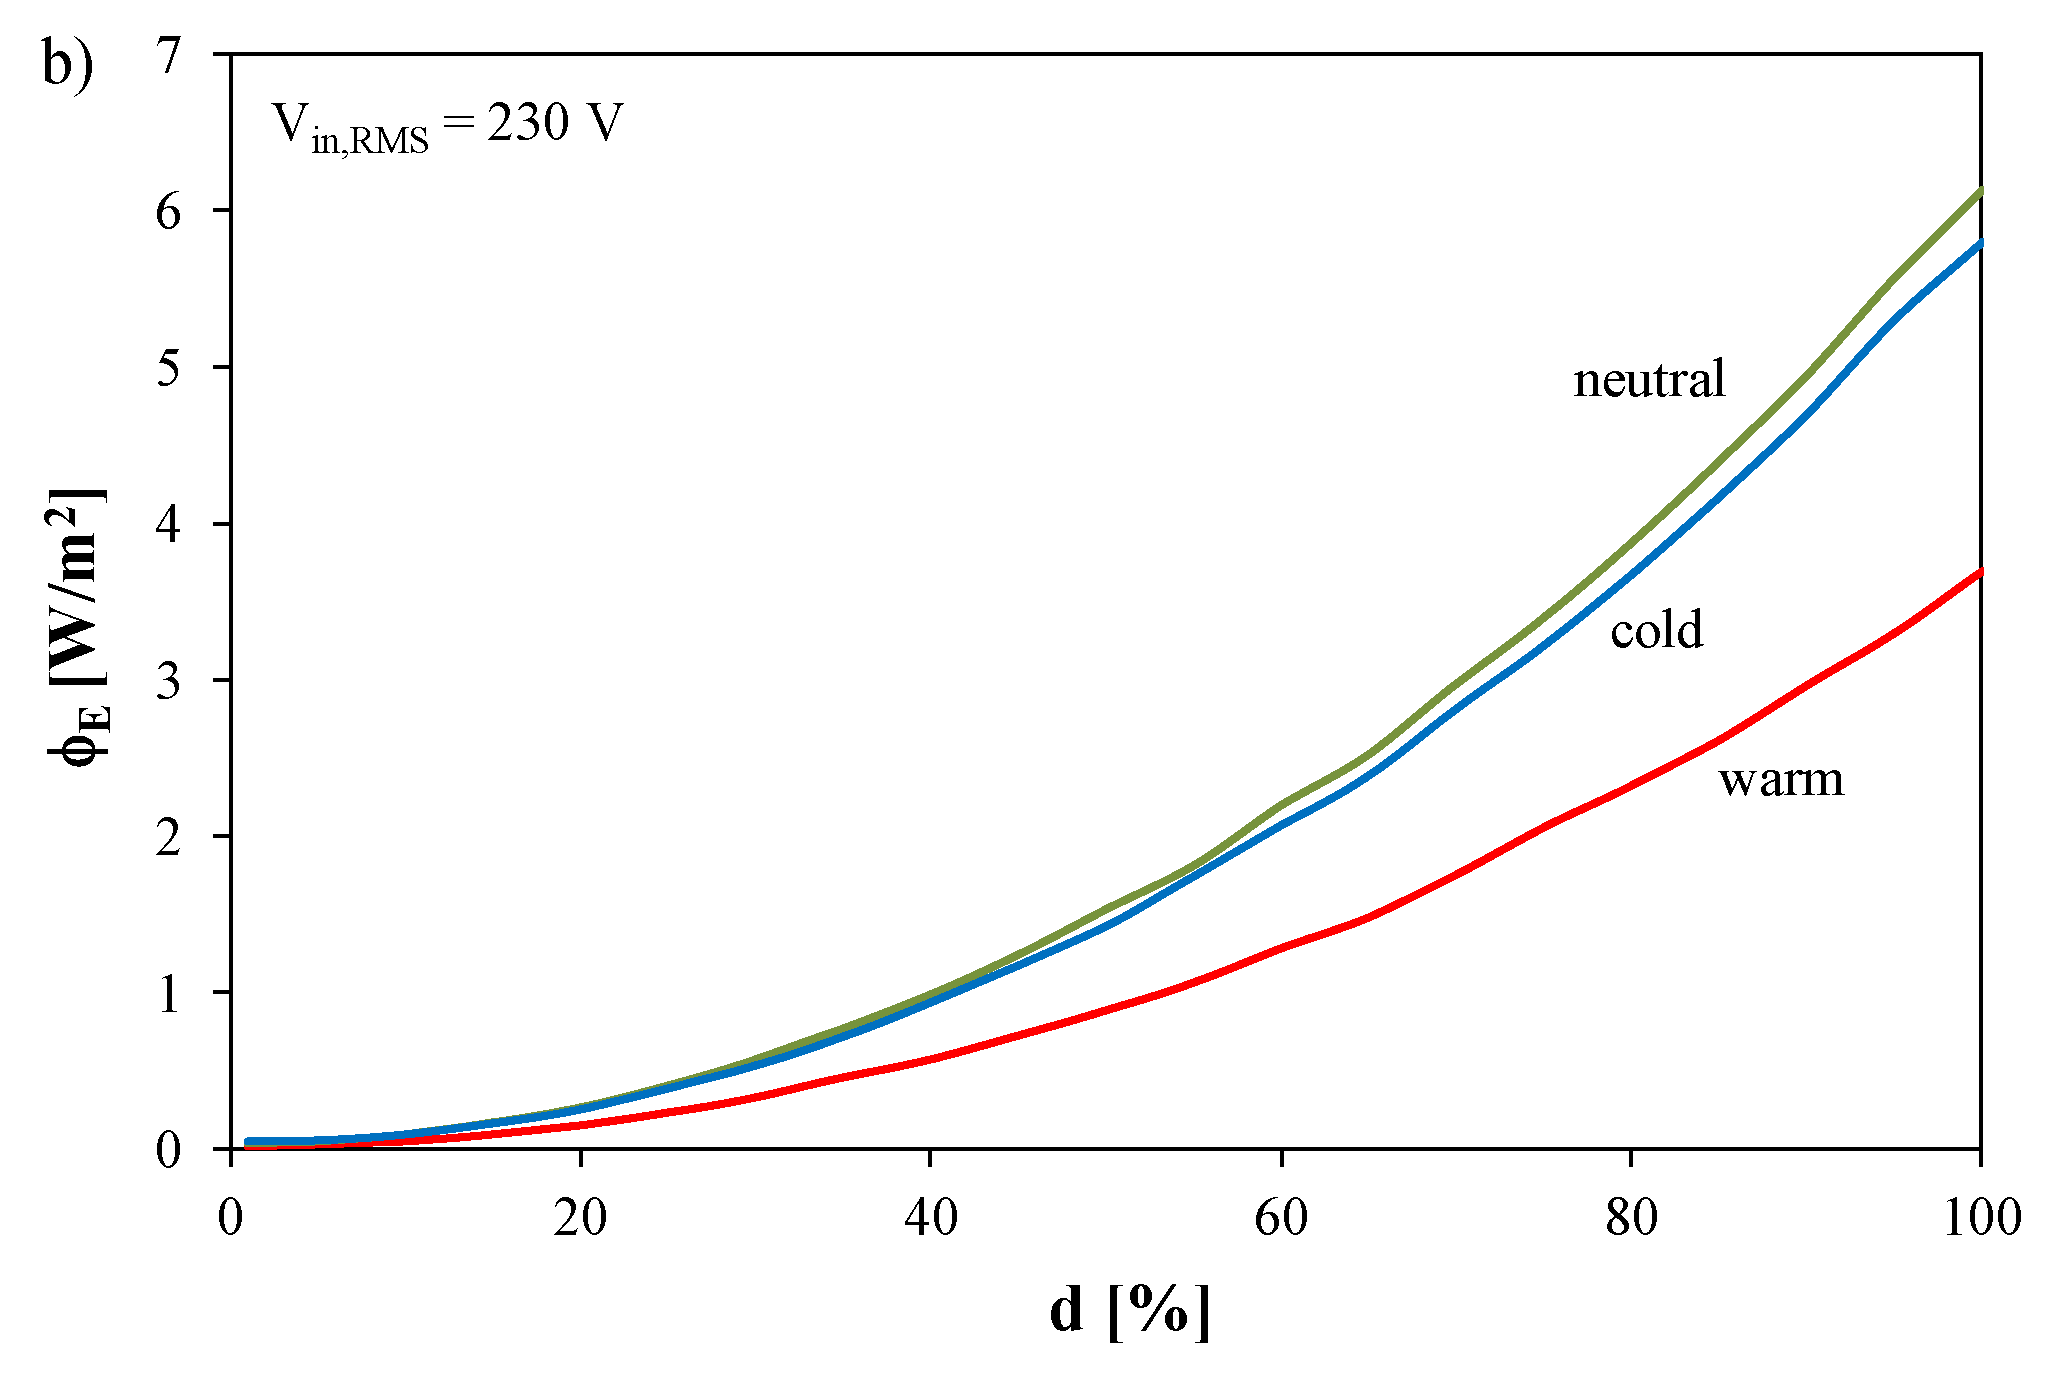
The following figures show the dependence of the optical parameters recorded for two selected Hue-type LED lamps on the value of parameter d (Figure 5) and on the wavelength of the emitted light (Figure 6).
In Figure 5, the measured dependences of irradiance at a distance of 50 cm from the LED luminaires on the fixed value of parameter d for both LED lamps: Coloured (a) and dynamic white (b), are shown.
The considered dependence is a monotonically increasing function. It is worth noticing that at the maximum value of parameter d, irradiance is largest for the dynamic white LED lamp, and smallest for the colour LED lamp. It can be noticed that for the colour LED lamp, the values of irradiance corresponding to these colours of the emitted light differ between each other three times. It is easy to observe that the obtained dependence ΦE(d) is nonlinear. It can be approximated by a square function. Such a dependence makes it possible to precisely regulate the emitted luminous flux in the range of its small values.
The measurements of parameters characterising the illuminance of the examined LED lamps were performed, too. These measurements show constancy of this parameter, which testifies to the efficient removal of the heat generated in the examined LED lamps [5,11] or suitable compensation of the changes in internal temperature of light sources by a change in the value of the current flowing through these sources.
In Figure 6, normalised spectral characteristics of the examined colour and dynamic white LED lamps operating respectively in the mode of emission of the red, blue and green light and the cold, warm and neutral white light are presented.
It can be noticed that when the lamp operates in the mode of emission of red light, its spectral characteristic is narrowest. In turn, in the mode of emission of blue light, two maxima are visible on the spectral characteristics corresponding to blue and green colours. By analysing the spectrum of white LED lamp radiation, it can be noticed that all the spectra have two local maxima. Warm light is closer to red, neutral light is better balanced and cold light has more blue component.
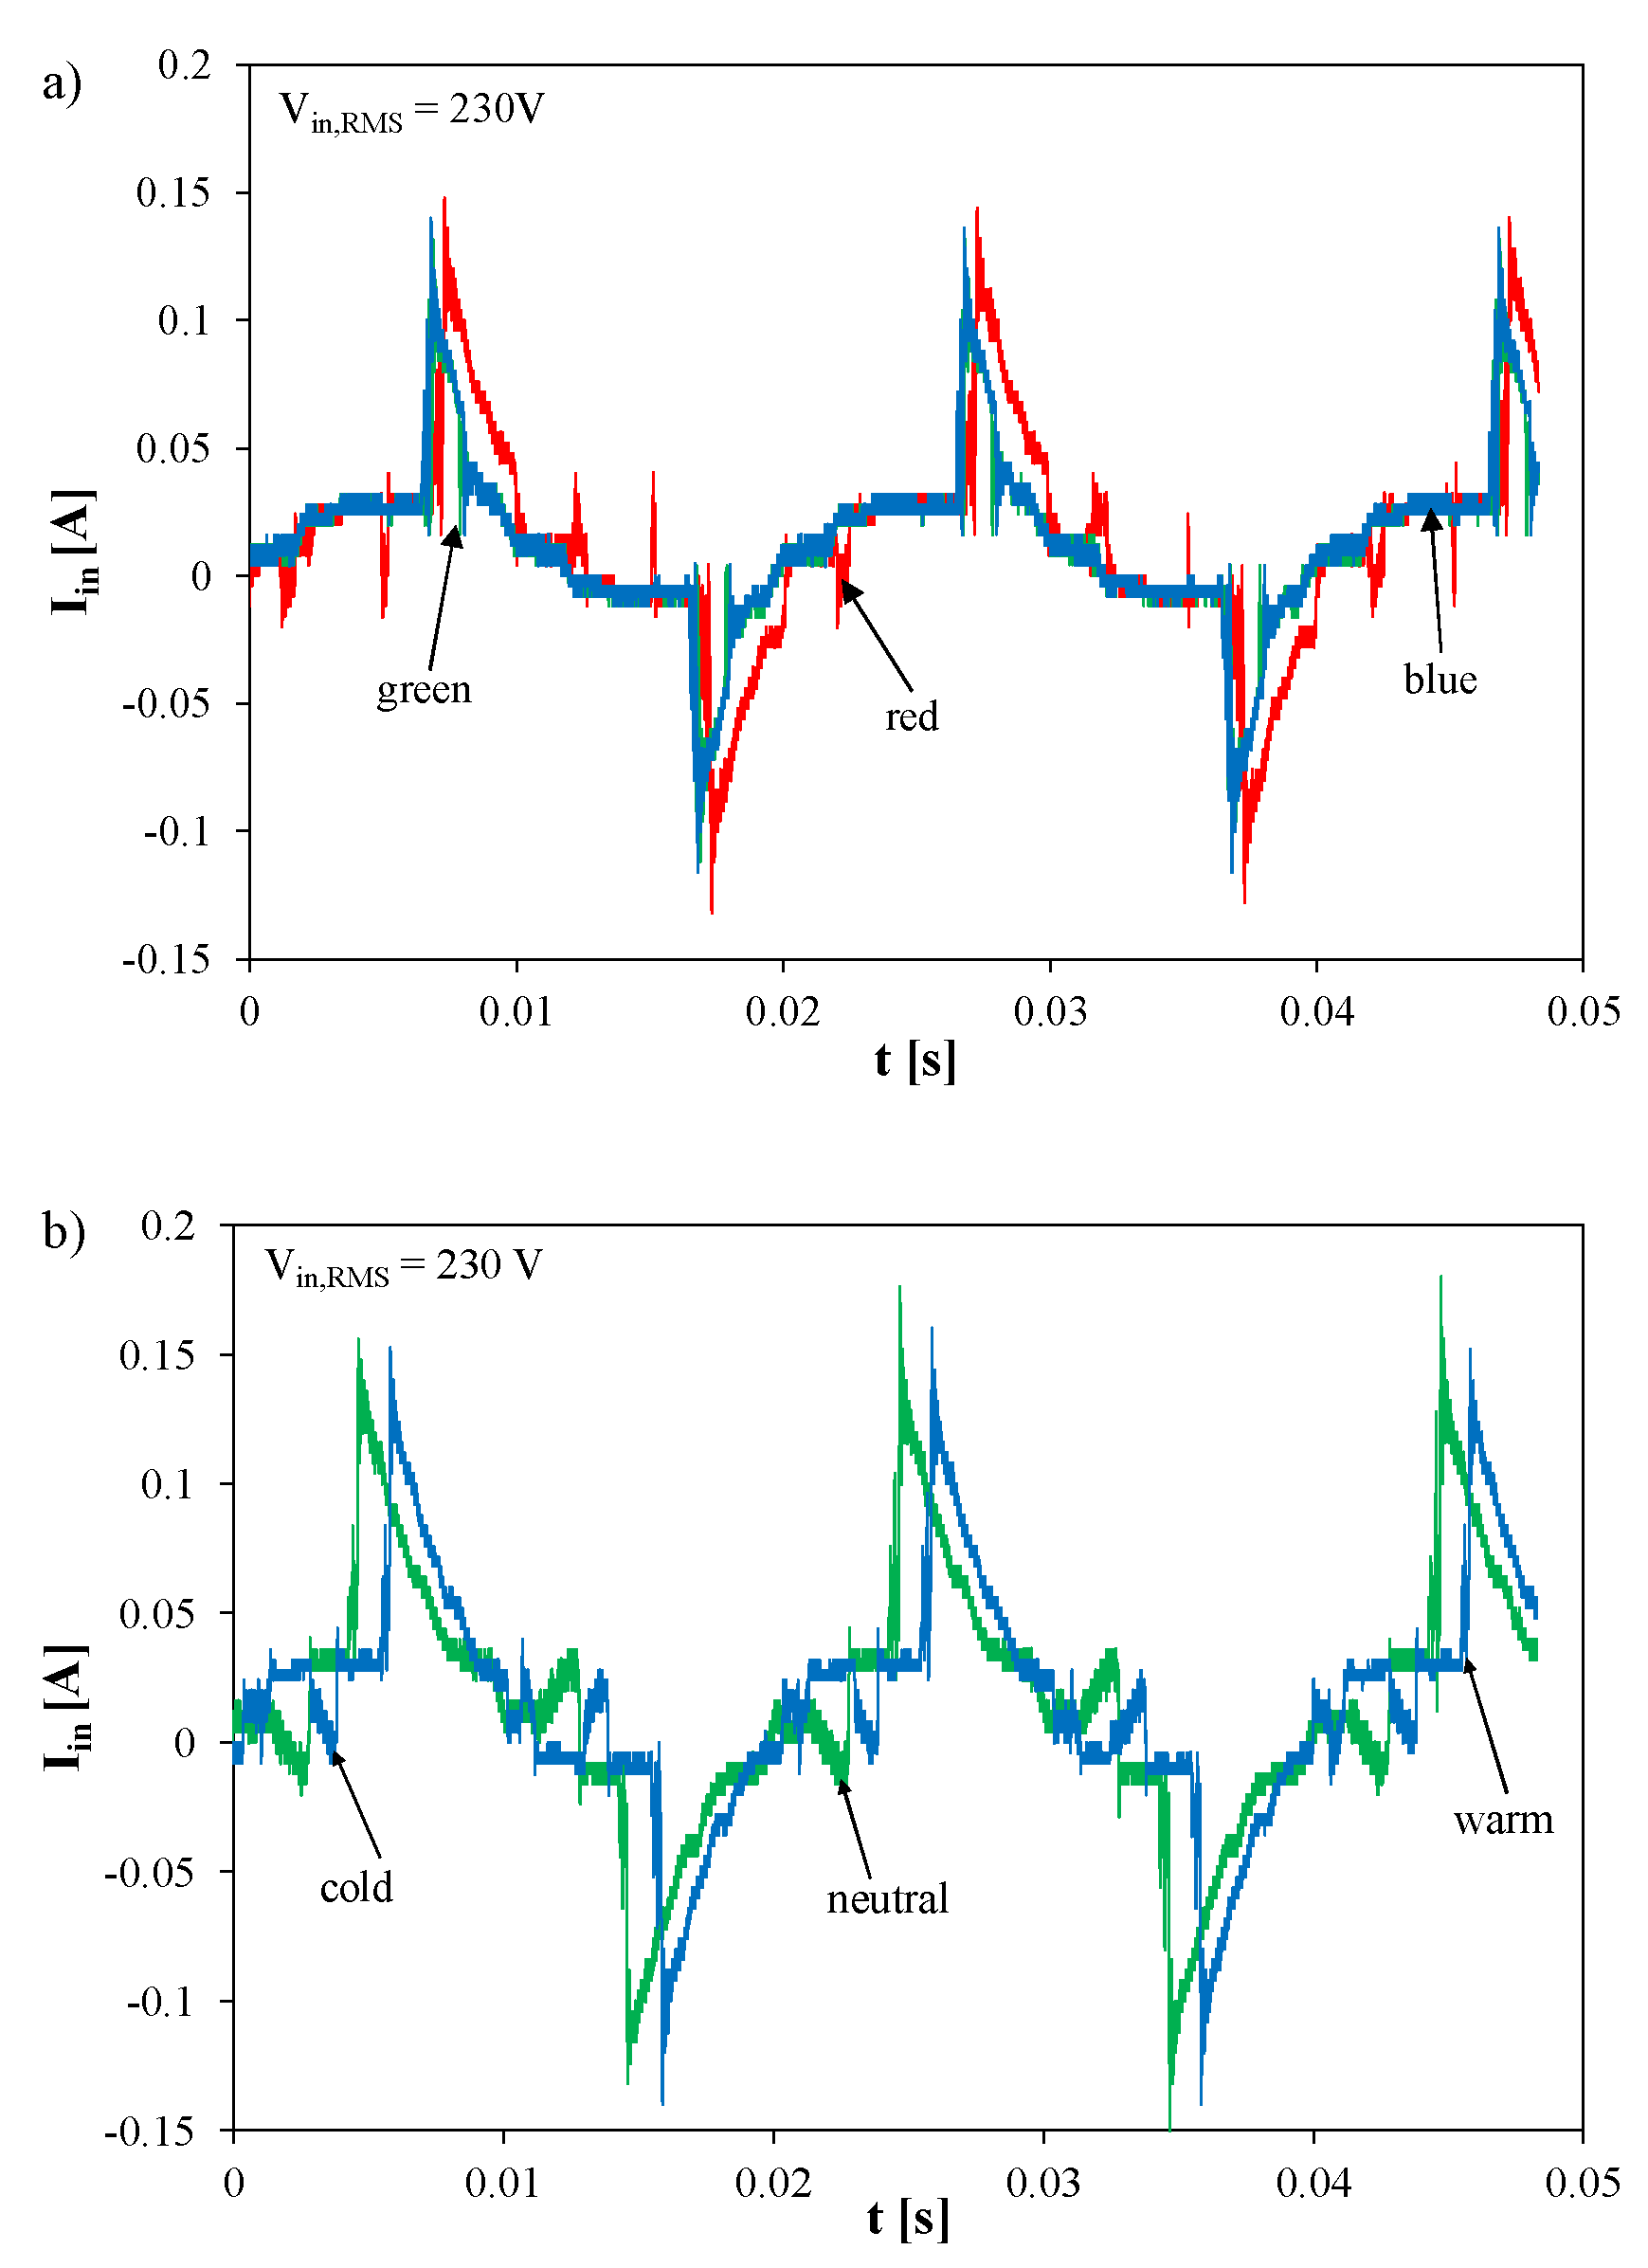
Figure 7, Figure 8, Figure 9 and Figure 10 show the dependences characterising the shape of the supplying current for two selected LED lamps emitting radiation in the whole visible light range. These dependences were registered with the fixed values of the Vin,RMS voltage.
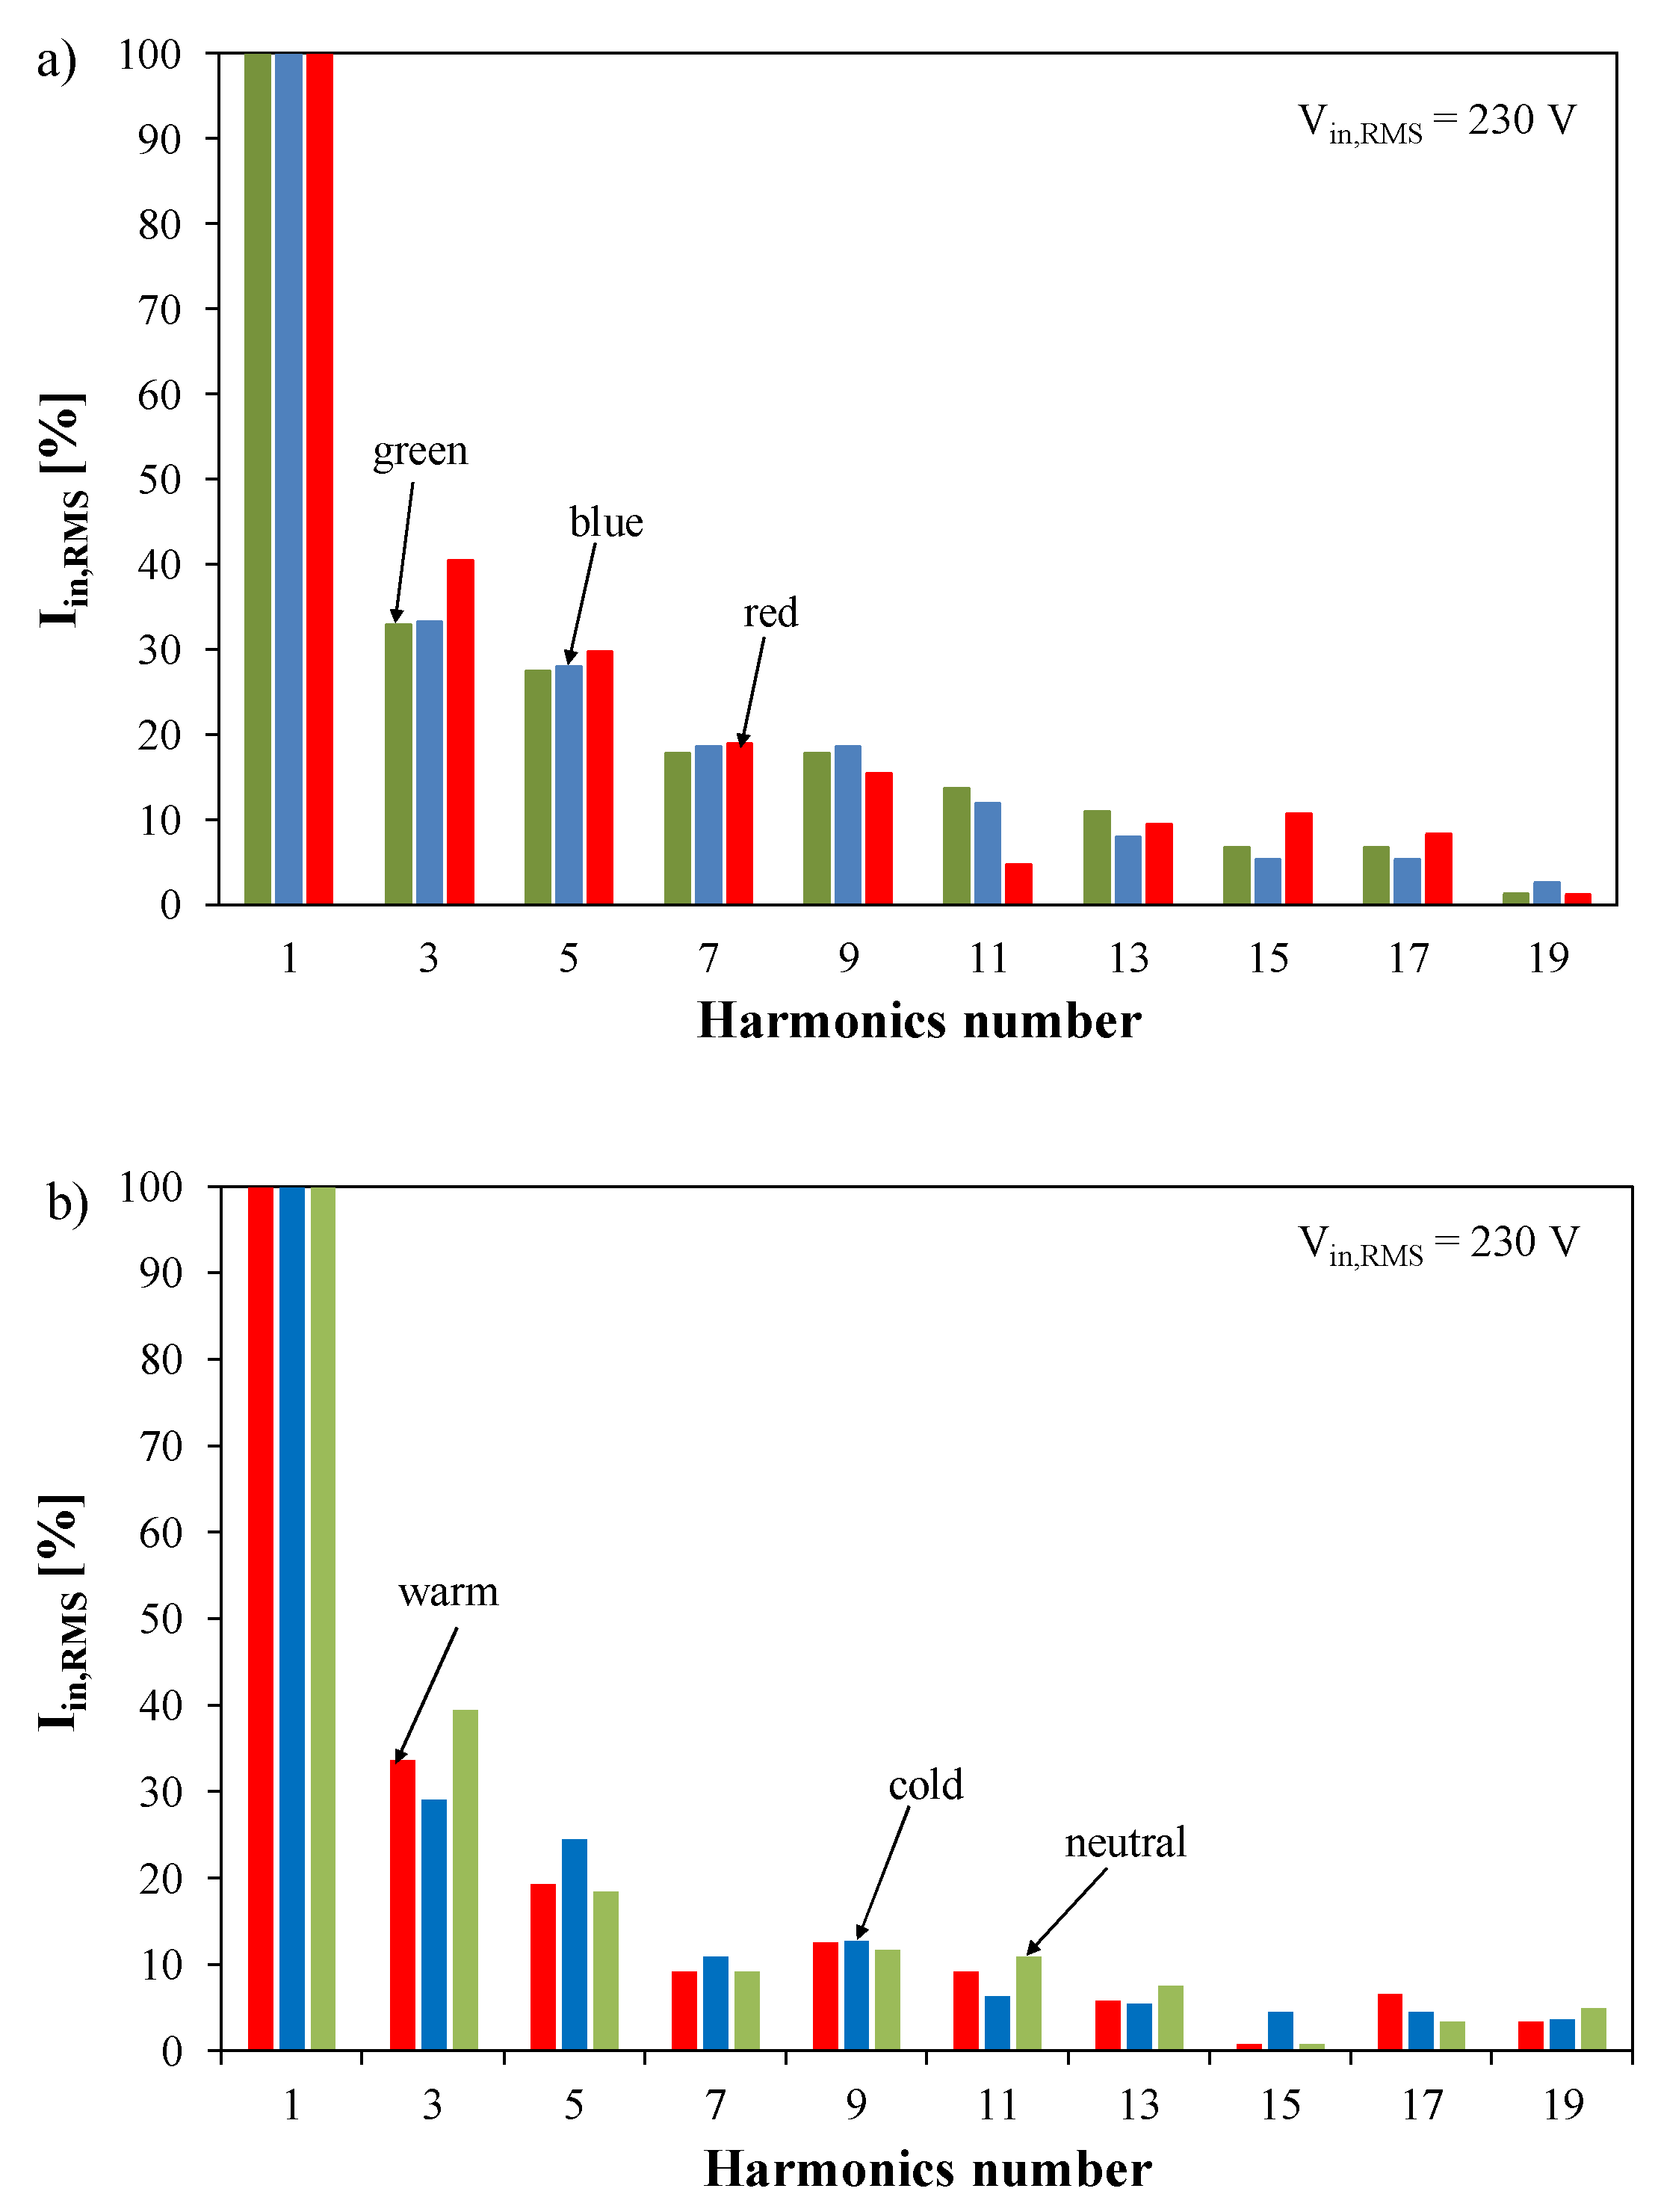
Figure 7 illustrates the waveforms of the supplying current of the colour LED lamp (a) and the dynamic white LED lamp (b) for the value of feeding voltage Vin,RMS = 230 V and parameter d = 100%. Figure 8 shows the relative values of amplitudes of selected harmonics normalised to the amplitude of the harmonic of the fundamental frequency for the colour LED lamp (a) and the dynamic white LED lamp (b).
In Figure 7, visible deviations in the measured current from the desirable sinusoidal waveform in both the examined lamps are observed. It is worth paying attention to large current impulses occurring in the regions of extrema of the waveforms of the network voltage. The shape of these waveforms shows the capacitive character of the input impedance of the feeder contracted in both the examined lamps and the use of a full wave rectifier in them. The impulses of the supplying current even reach 150 mA.
In Figure 8, the spectra of harmonics of the supplying current of only odd harmonics for both the investigated lamps are visible. The dominant role is played by the first harmonic, but in the measured spectra, harmonics to the number 19 are visible. Higher harmonics defined by the norm [55] are below the resolution level of the used instruments. It should be noticed that the relations between the values of each harmonic in the spectrum of supplying current is different for each colour of light emitted by the tested lamp or for different CCT values characterising white light.
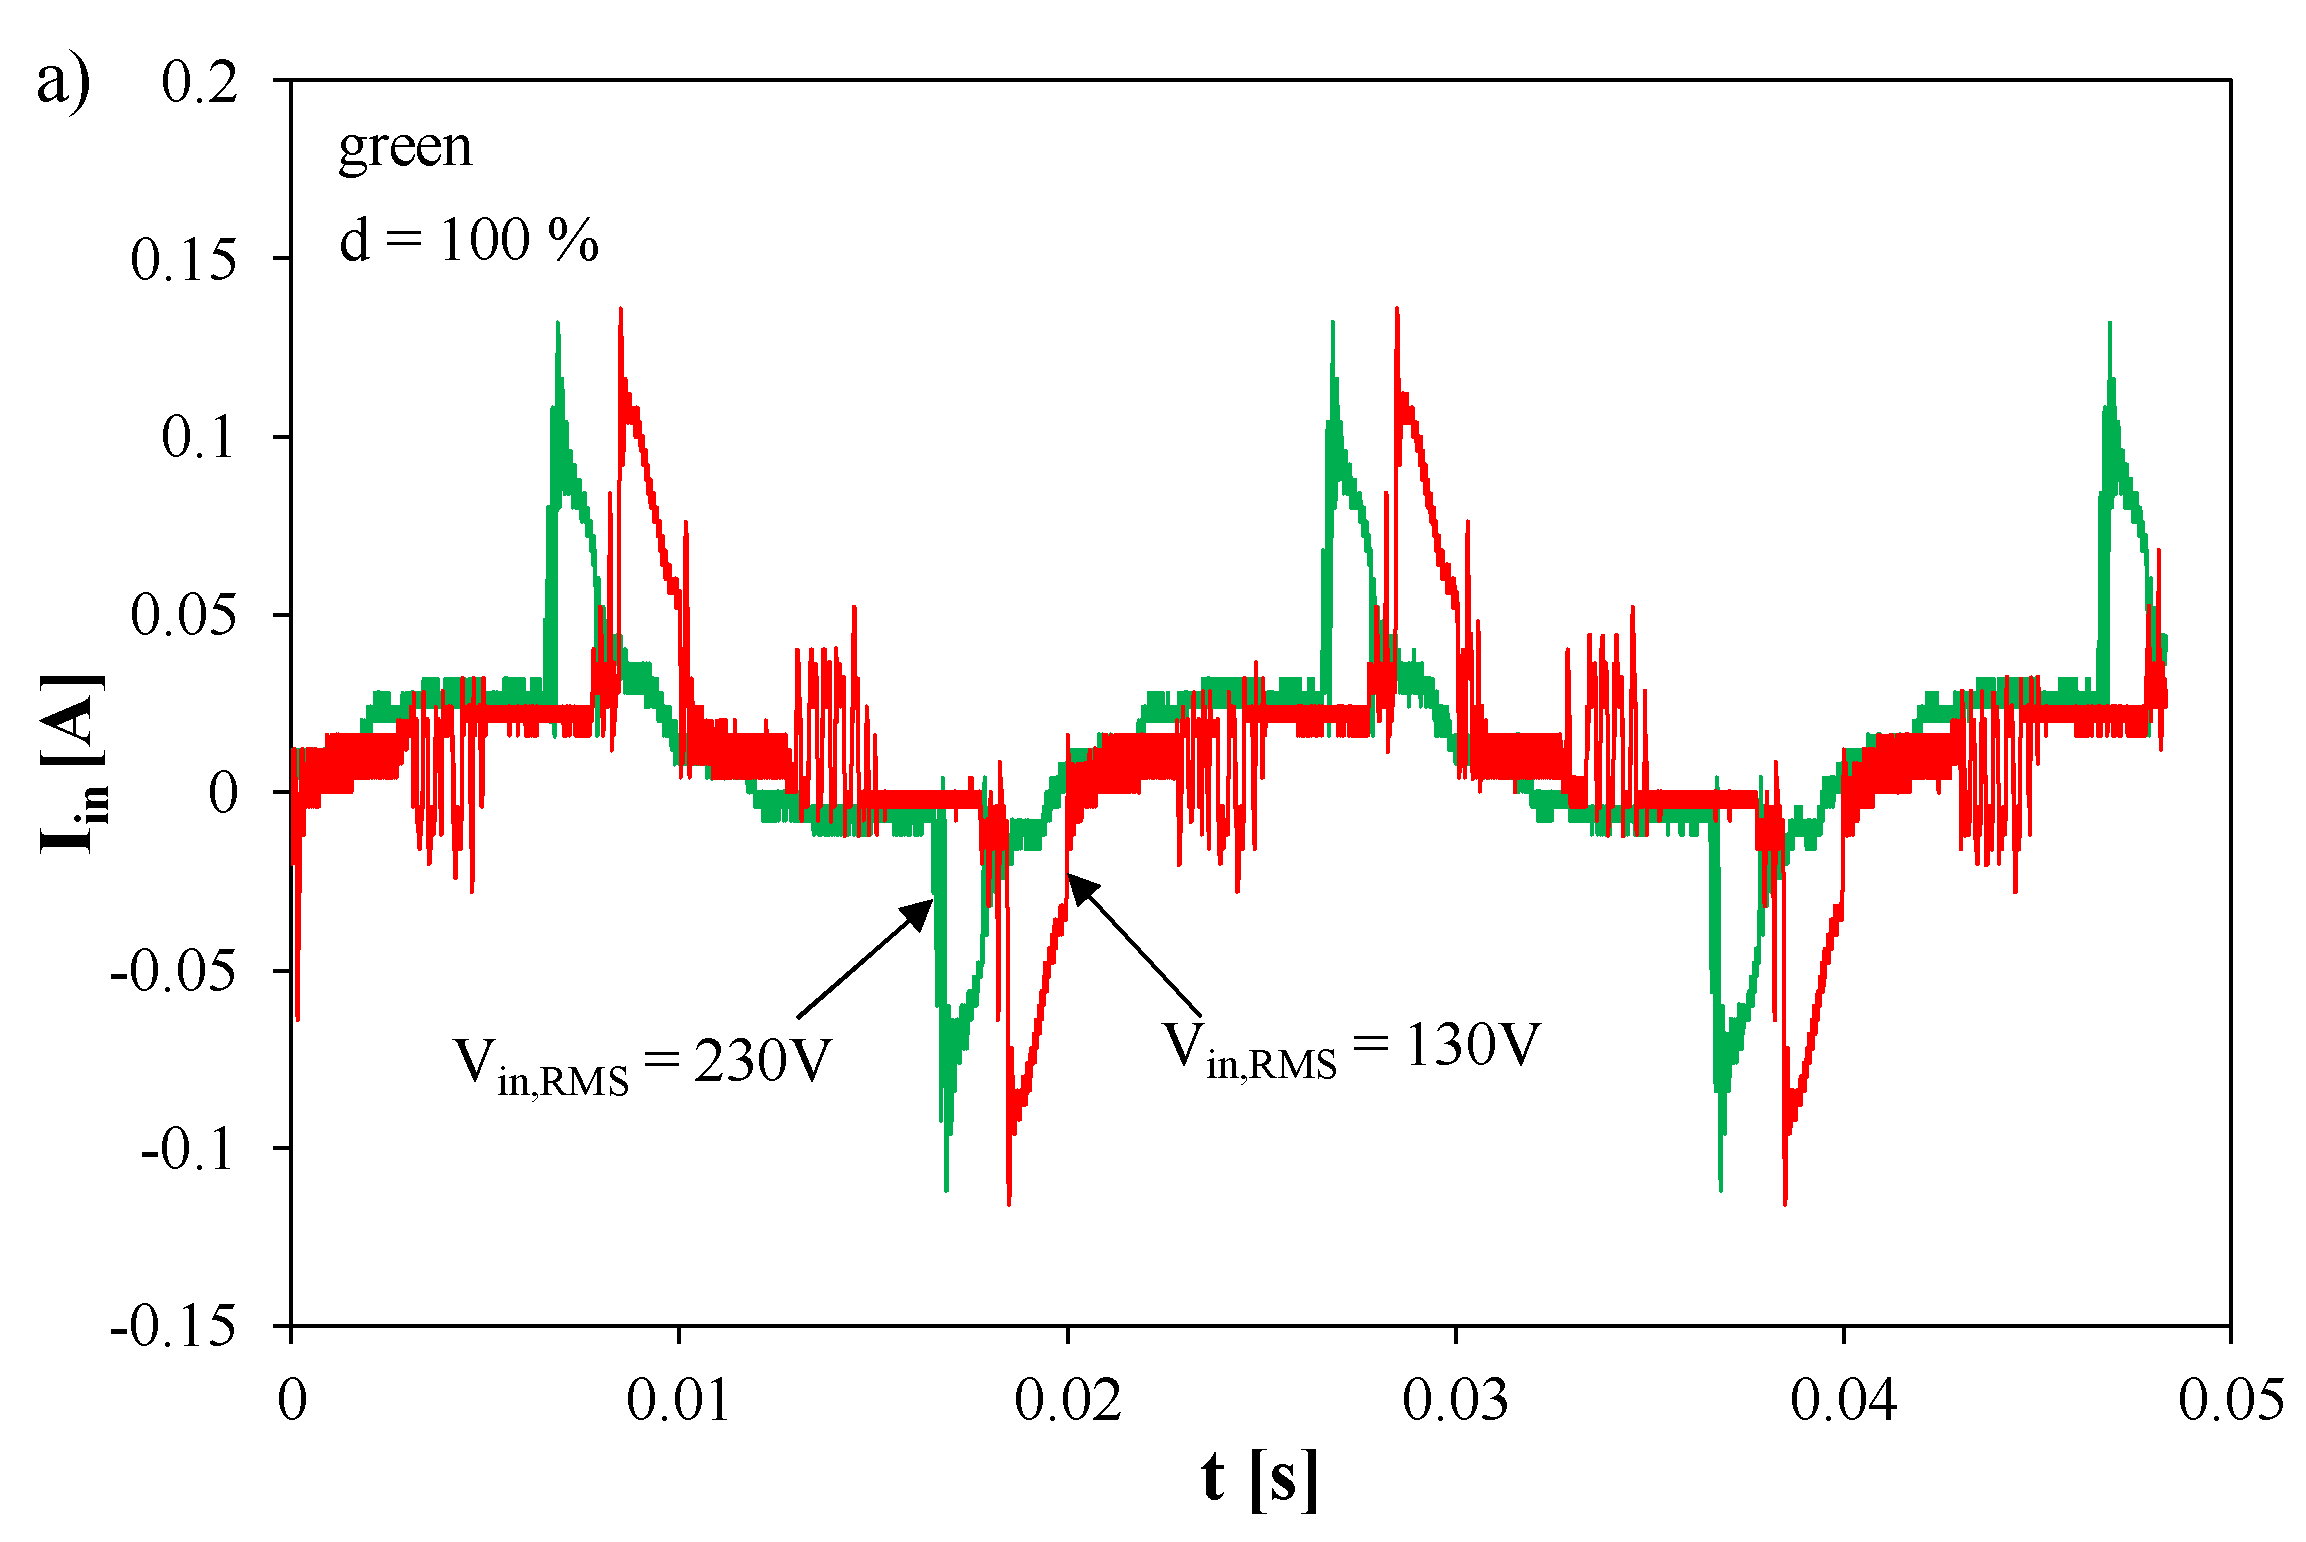
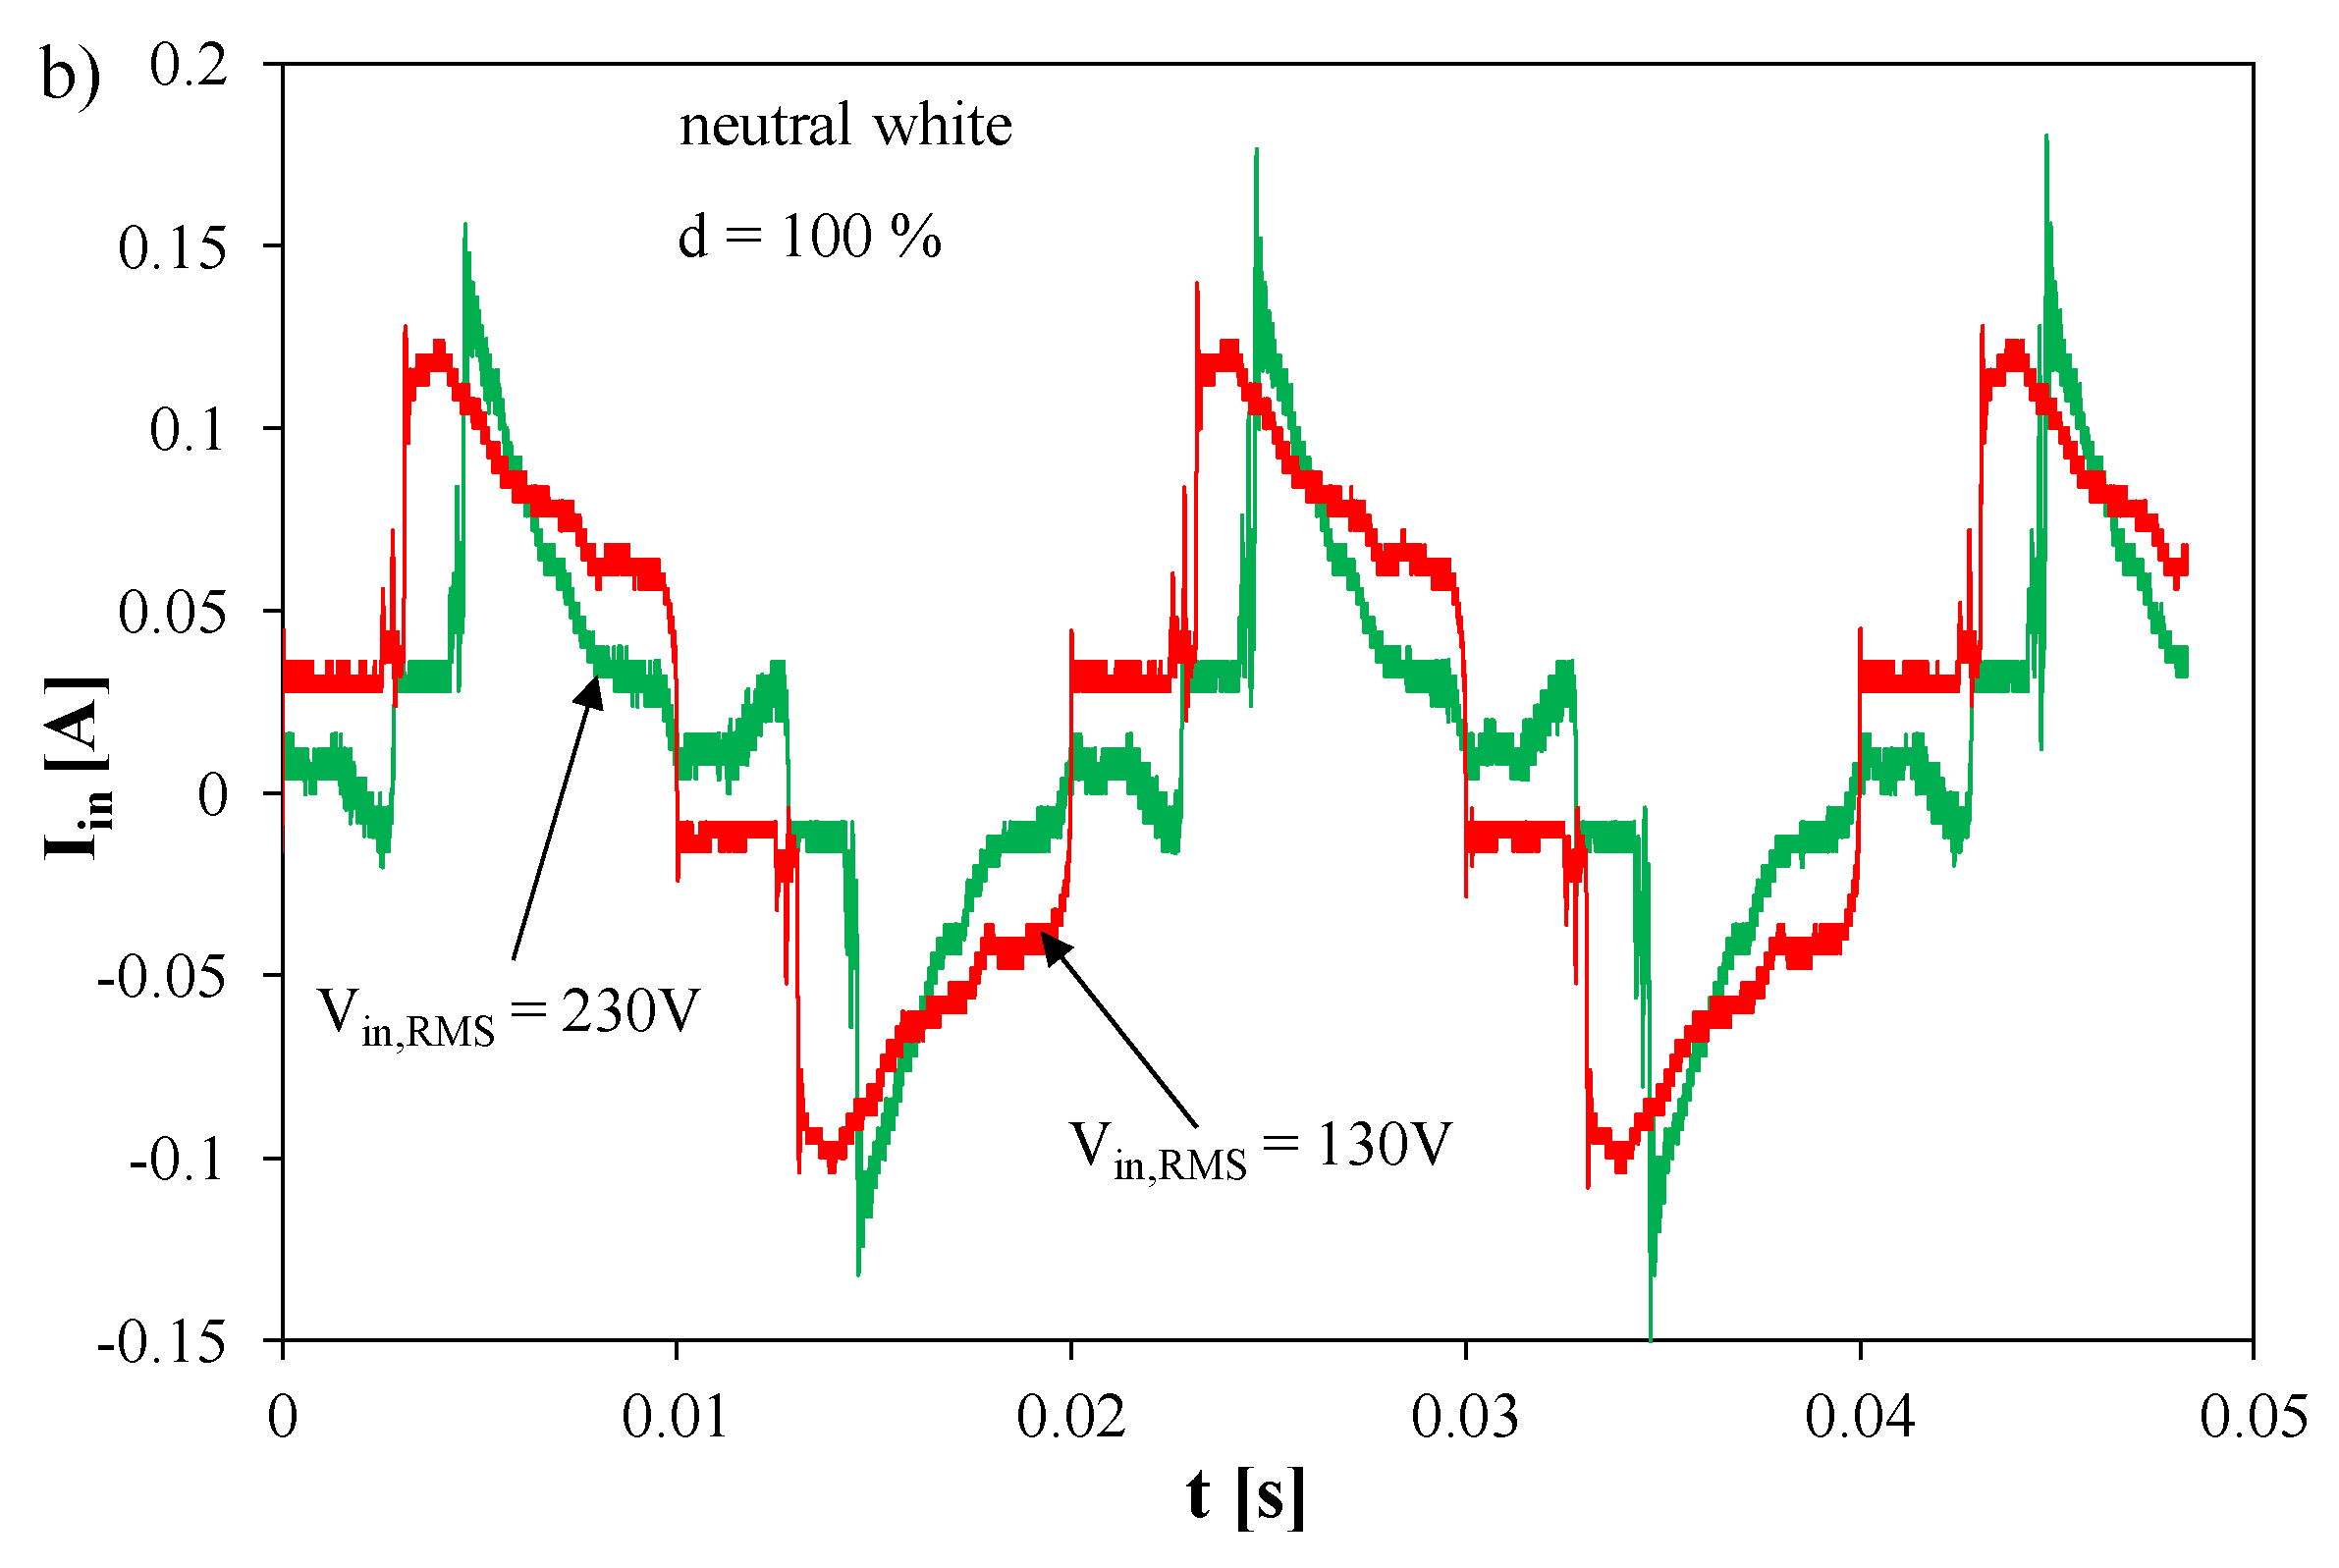
Figure 9 illustrates the waveforms of the supplying current of the green light LED lamp (a) and neutral white LED lamp (b) for the fixed value of parameter d = 100%. Figure 10 shows the relative values of particular harmonics normalised to the amplitude of the fundamental harmonics for the green LED lamp (a) and neutral white LED lamp (b).
By analysing Figure 9, it can be observed that the LED lamp emitting green light is characterised by a more distorted supplying current waveform. The level of distortions increases with the decrease in the RMS voltage Vin,RMS, which manifests itself in higher distortions of the instantaneous value of the current waveform supplying the LED lamp. It should also be noted that for the LED lamp emitting the green light, the peak-to-peak value of the supplying current does not change with the change in the RMS value of the line voltage and amounts to approximately 250 mA. Analysing the shape of the supplying current of both the values of power supplies of selected LED lamps, the capacitive nature of the impedance of solid-state light sources can be noticed.
The analysis of the results presented in Figure 10 shows that the LED lamp emitting the green light is characterised by higher values of the normalised harmonics compared to the white LED lamp, which also confirms the greater current waveform distortion of the green LED lamp.
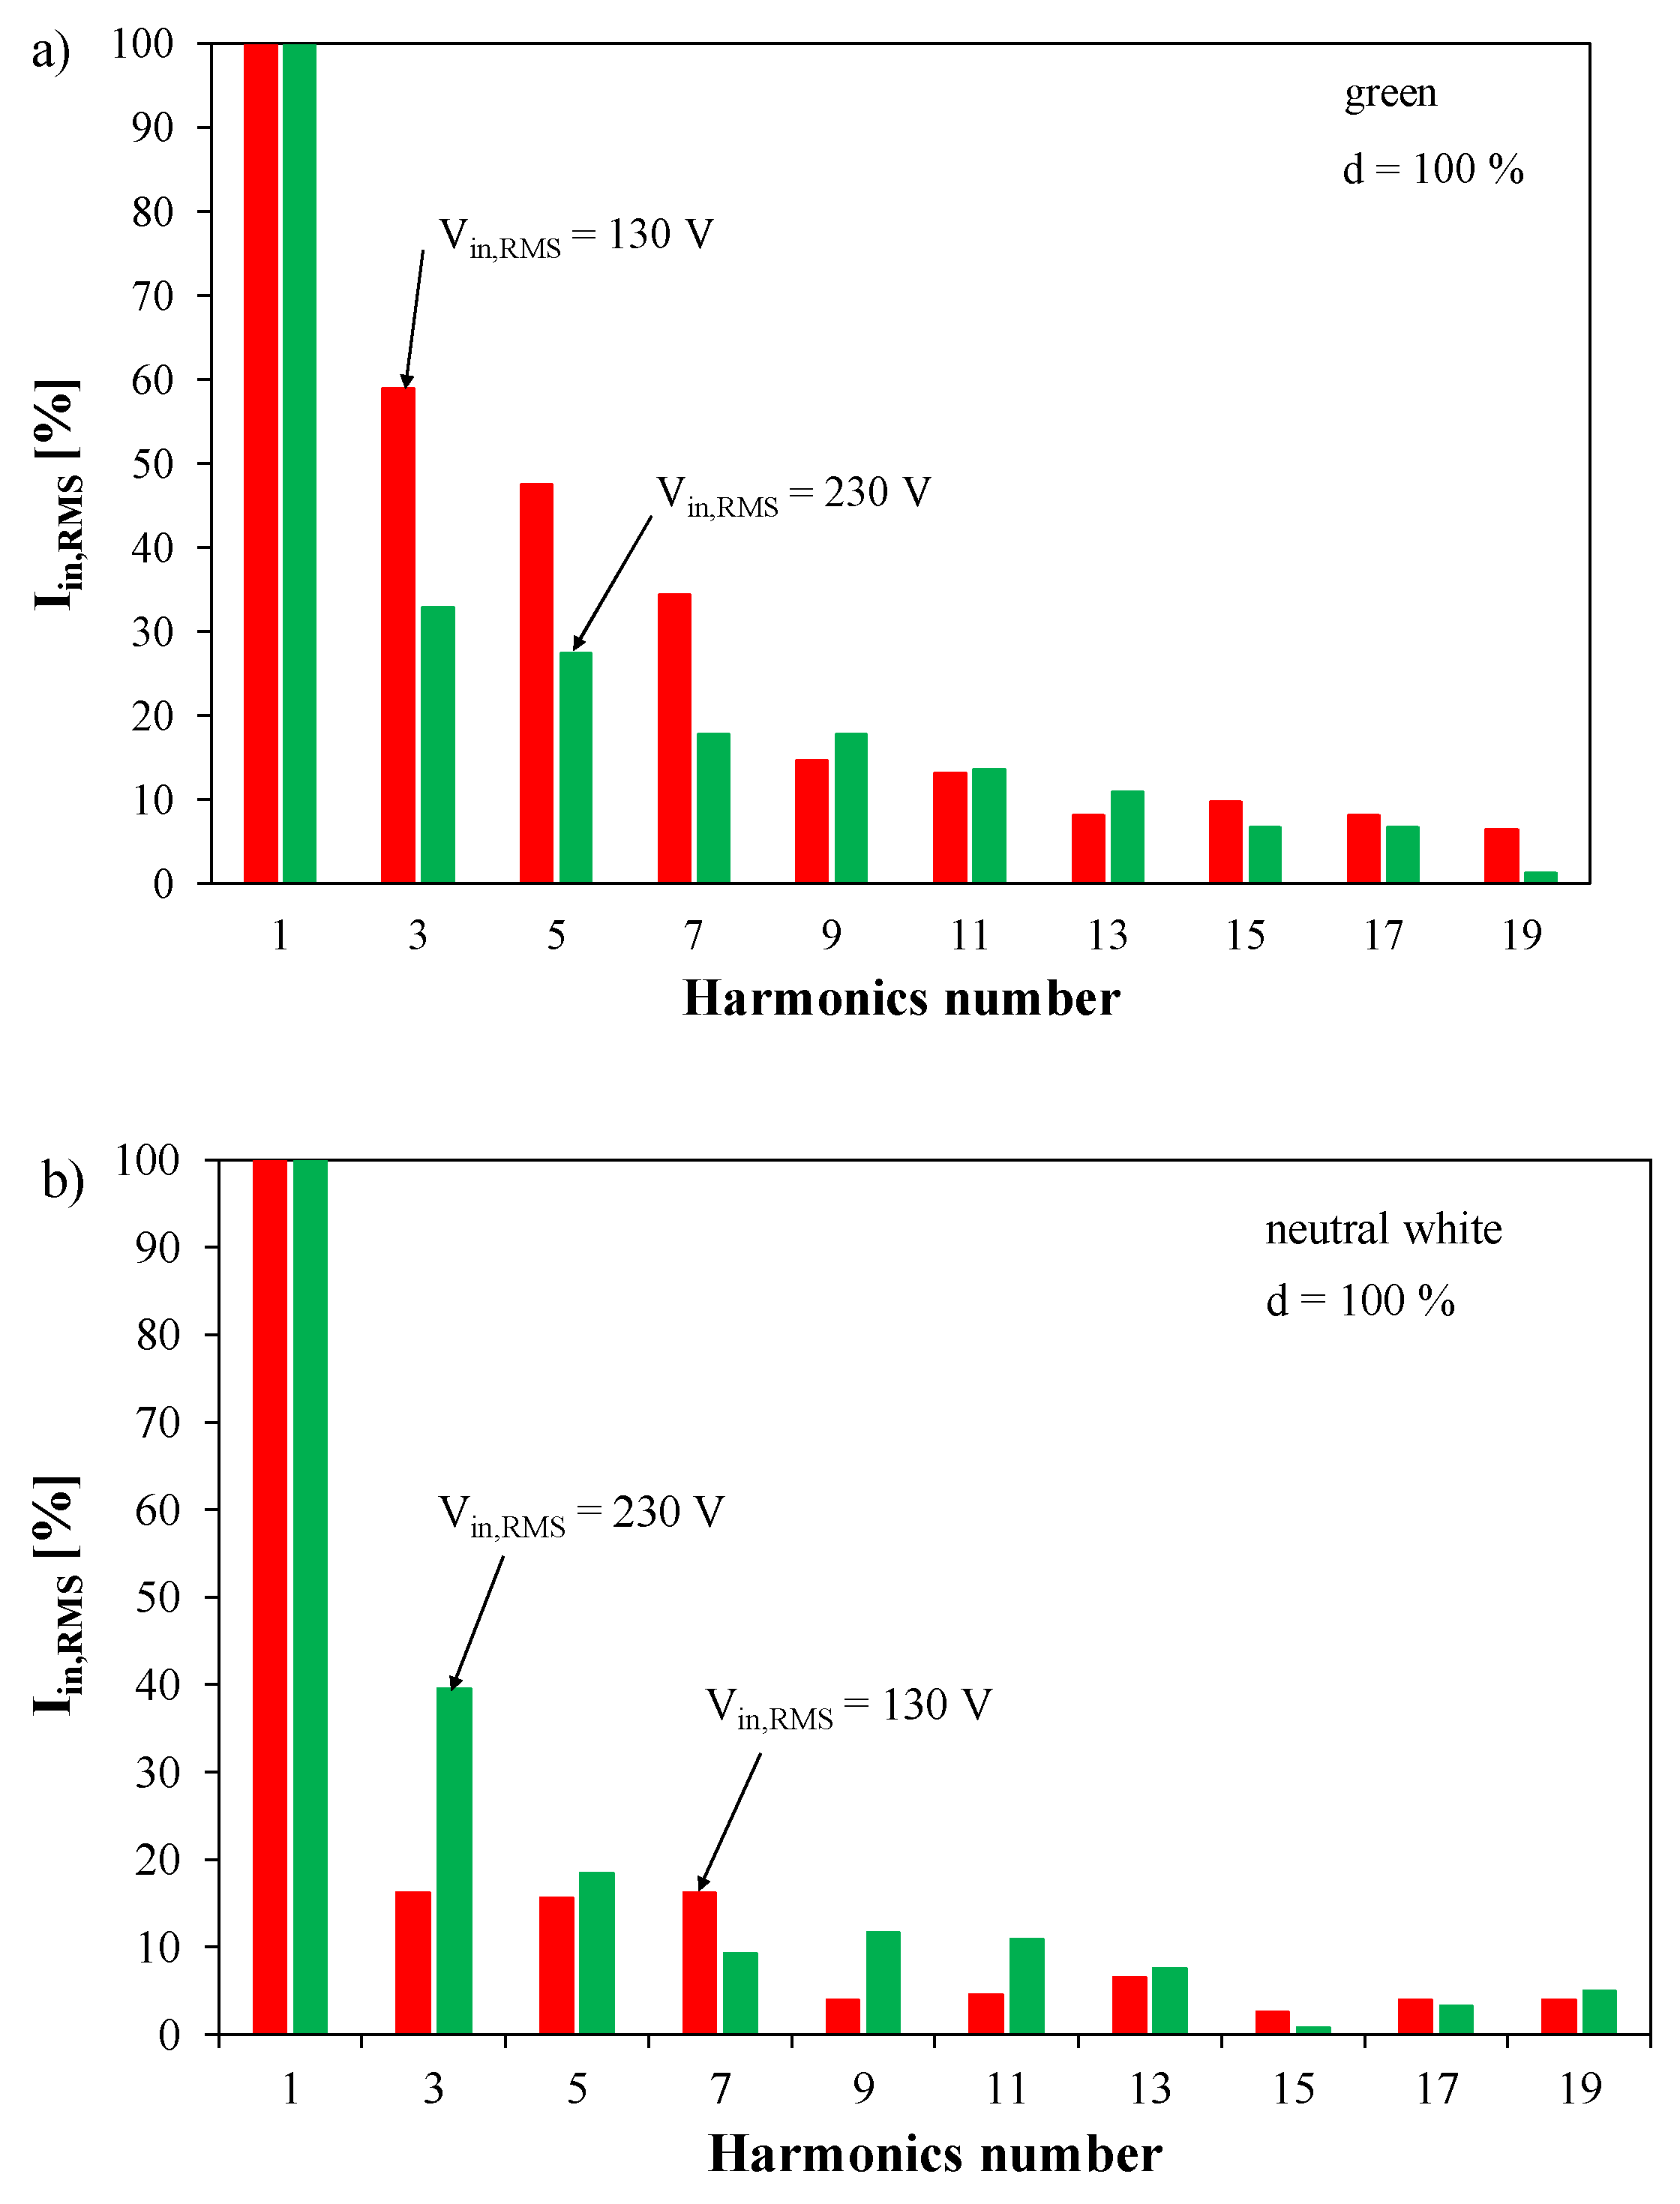
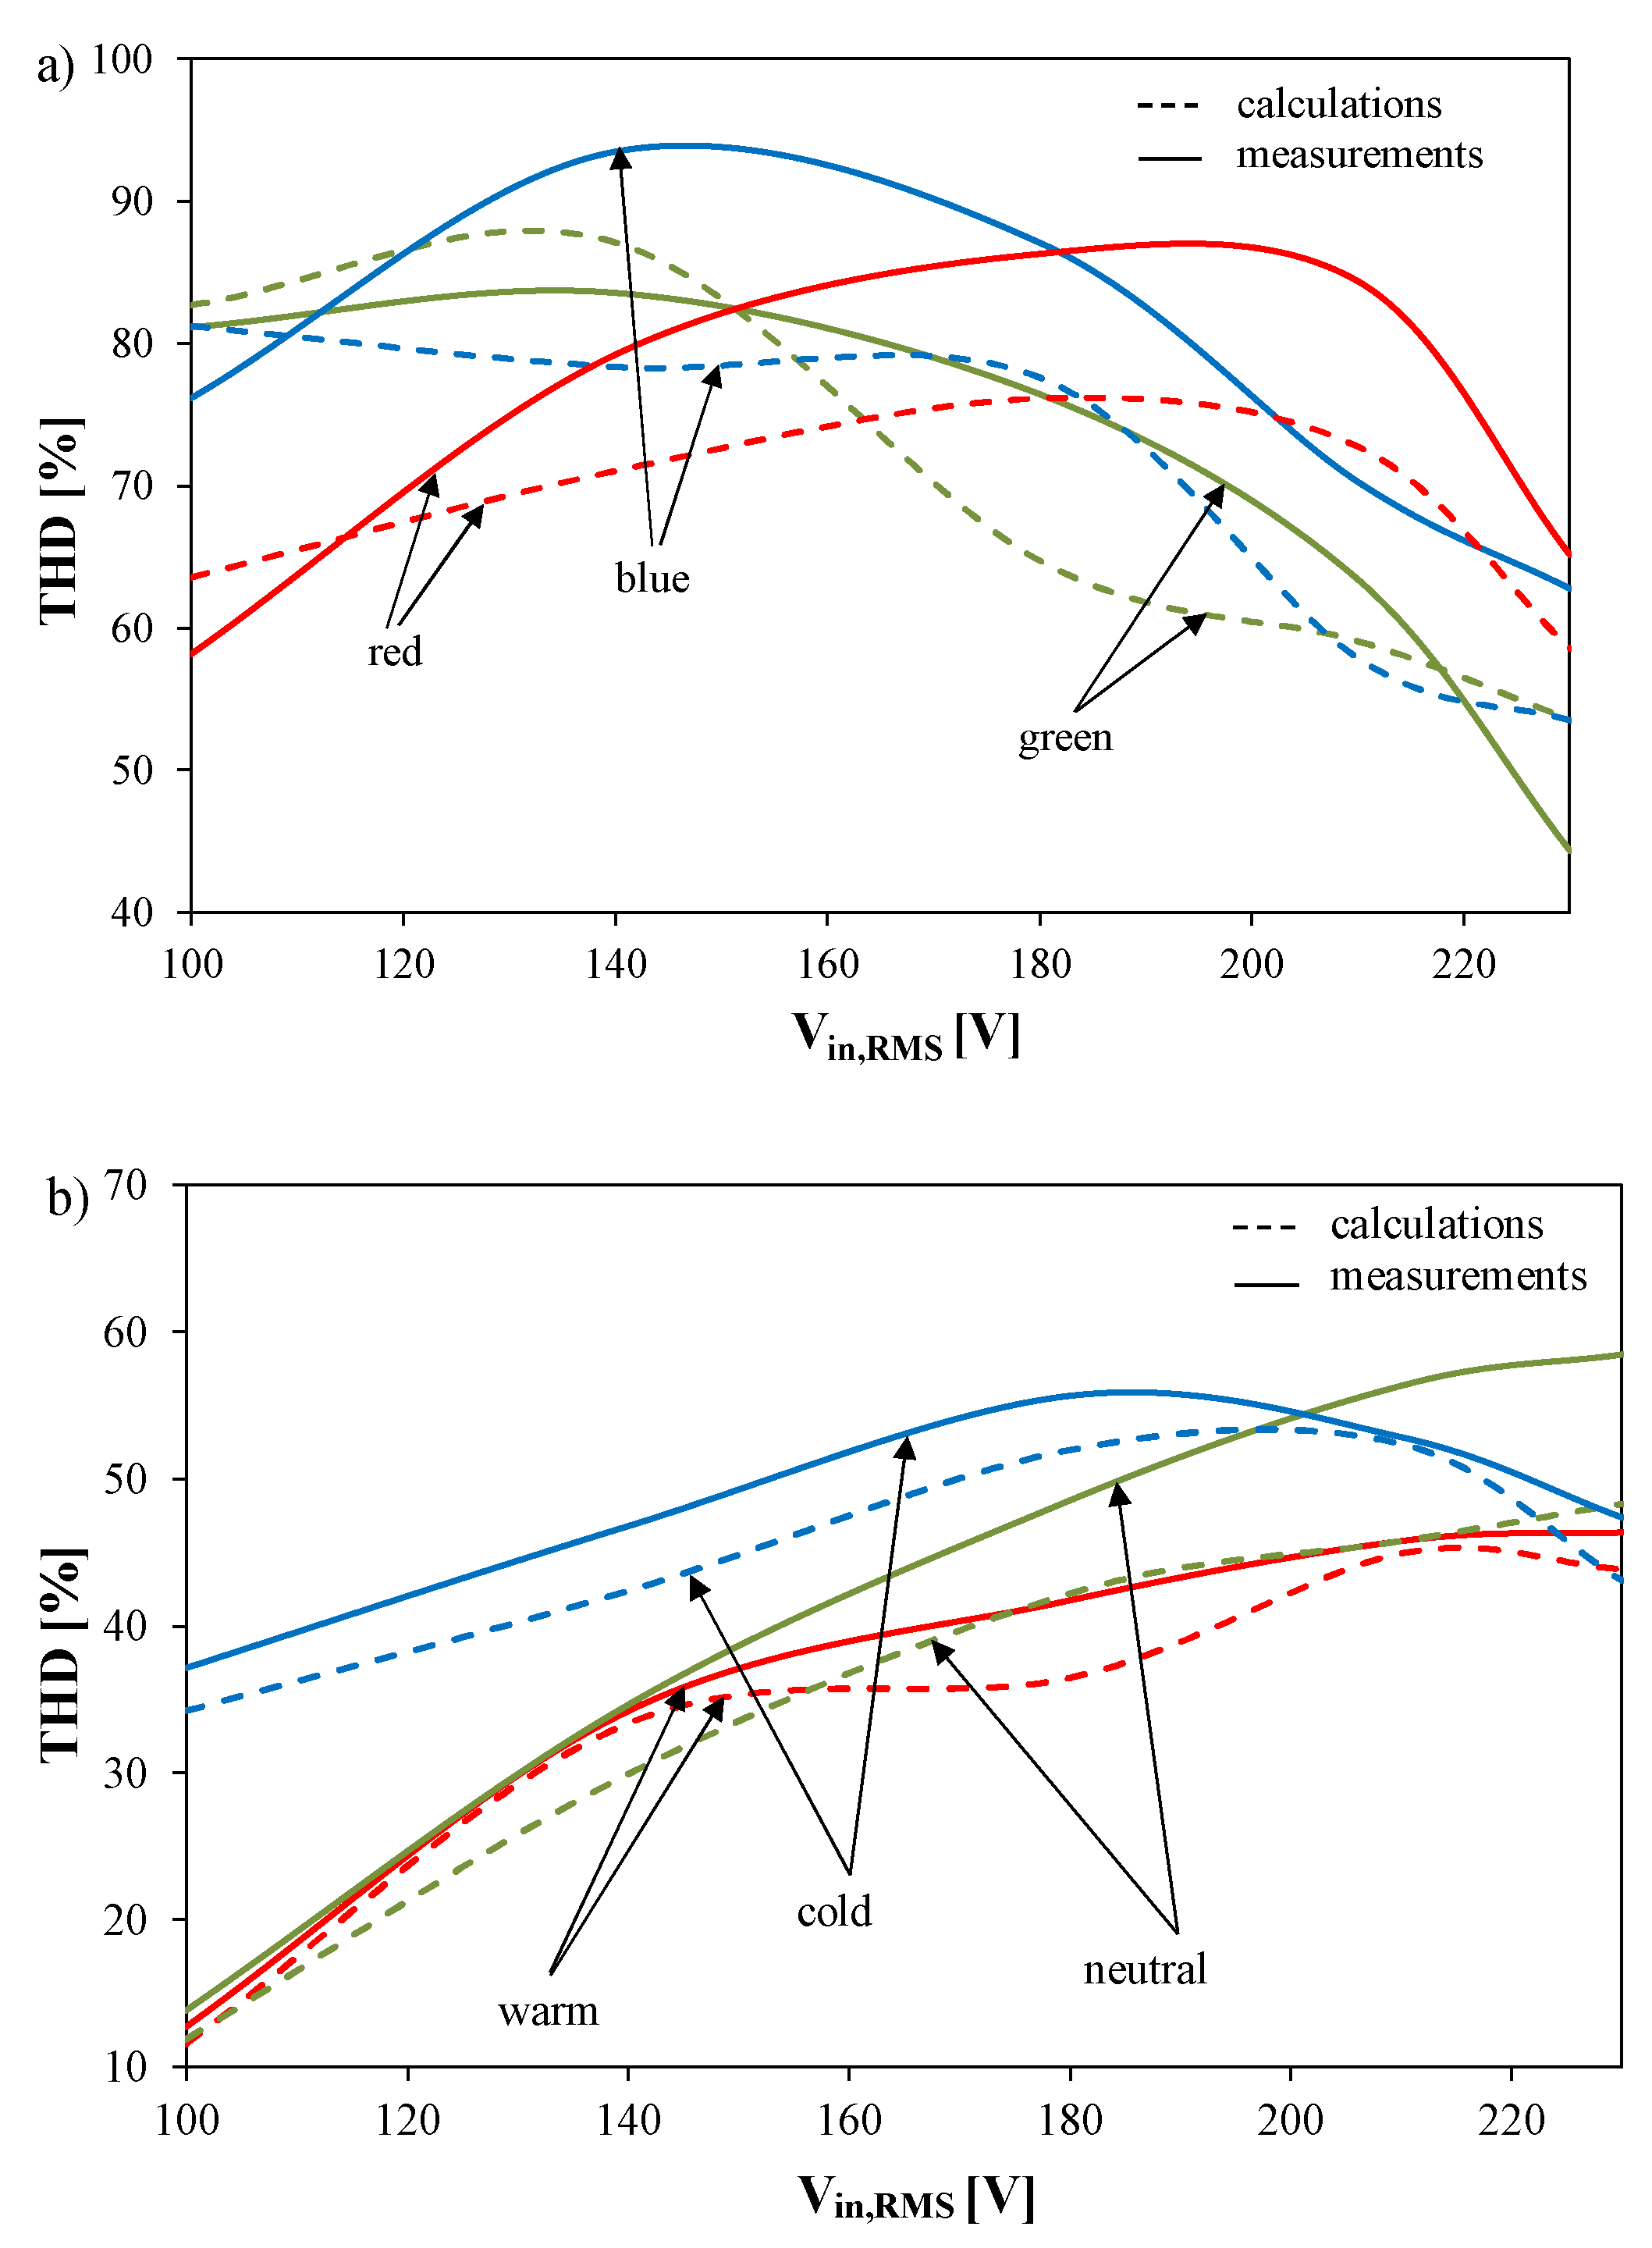
Using the values of each harmonic of the supplying current measured by means of the current probe and the oscilloscope, the THD values are calculated for the supplying current of the colour and dynamic white lamps operating in the modes of emission of the whole spectrum of visible light. The values of the THD calculated using Formula (1) for different values of feeding voltage are marked in Figure 11 by means of dashed lines. The results of measurements of the THD value of the supplying current of the examined lamp performed with the use of the Power Analyzer PA1000 are also shown in the figure. These results are marked with solid lines. These analyses were performed in a wide range of changes in the RMS voltage Vin,RMS.
As can be observed in Figure 11a, the THD values of the supplying current strongly depend on the colour of the emitted light and on feeding voltage. Analysing the results obtained by means of the power analyser, it is visible that in the considered range of changes in the feeding voltage, the maximum of the dependence of THD(Vin) occurs. For each of the considered colours of the emitted light, the lowest THD value at the nominal value of feeding voltage equal to 230 V is obtained. At this value of feeding voltage, the greatest THD value of current of the power supply is obtained at the emission of red light and reaches 65%. The lowest THD value equal to 45% is obtained at the emission of green light. In the case of the dependence of THD(Vin) calculated with the use of Formula (1) and the measurements performed by means of the oscilloscope, it is clearly visible that these values are considerably different from the values obtained by means of the power analyser. The differences in the THD values obtained by means of both methods even reach 15%.
As can be observed in Figure 11b, the THD values strongly depend on the CCT of the emitted light and feeding voltage. It can also be noticed that the dependences of the THD coefficient as a function of the feeding voltage for warm and neutral white light are monotonically increasing functions. With the nominal value of the voltage of the tested LED lamps equal to 230 V, it can be observed that the highest THD value is obtained for neutral white light and is 59%, while the lowest THD value is obtained for warm white light and is equal to only 46%. In the case of the values calculated using Formula (1) and the measurements made with the PA1000 power analyser, it can be seen that these values differ significantly from each other. The observed differences between the THD values obtained with the use of various measuring devices result from the construction of these devices and can even reach 5%.
These differences between results of THD obtained from measurements and calculations can be a result of the finite resolution of instruments used to measure the values of each harmonic. As it was mentioned above, this resolution does not make it possible to measure high-order harmonics, which can influence the value of THD.
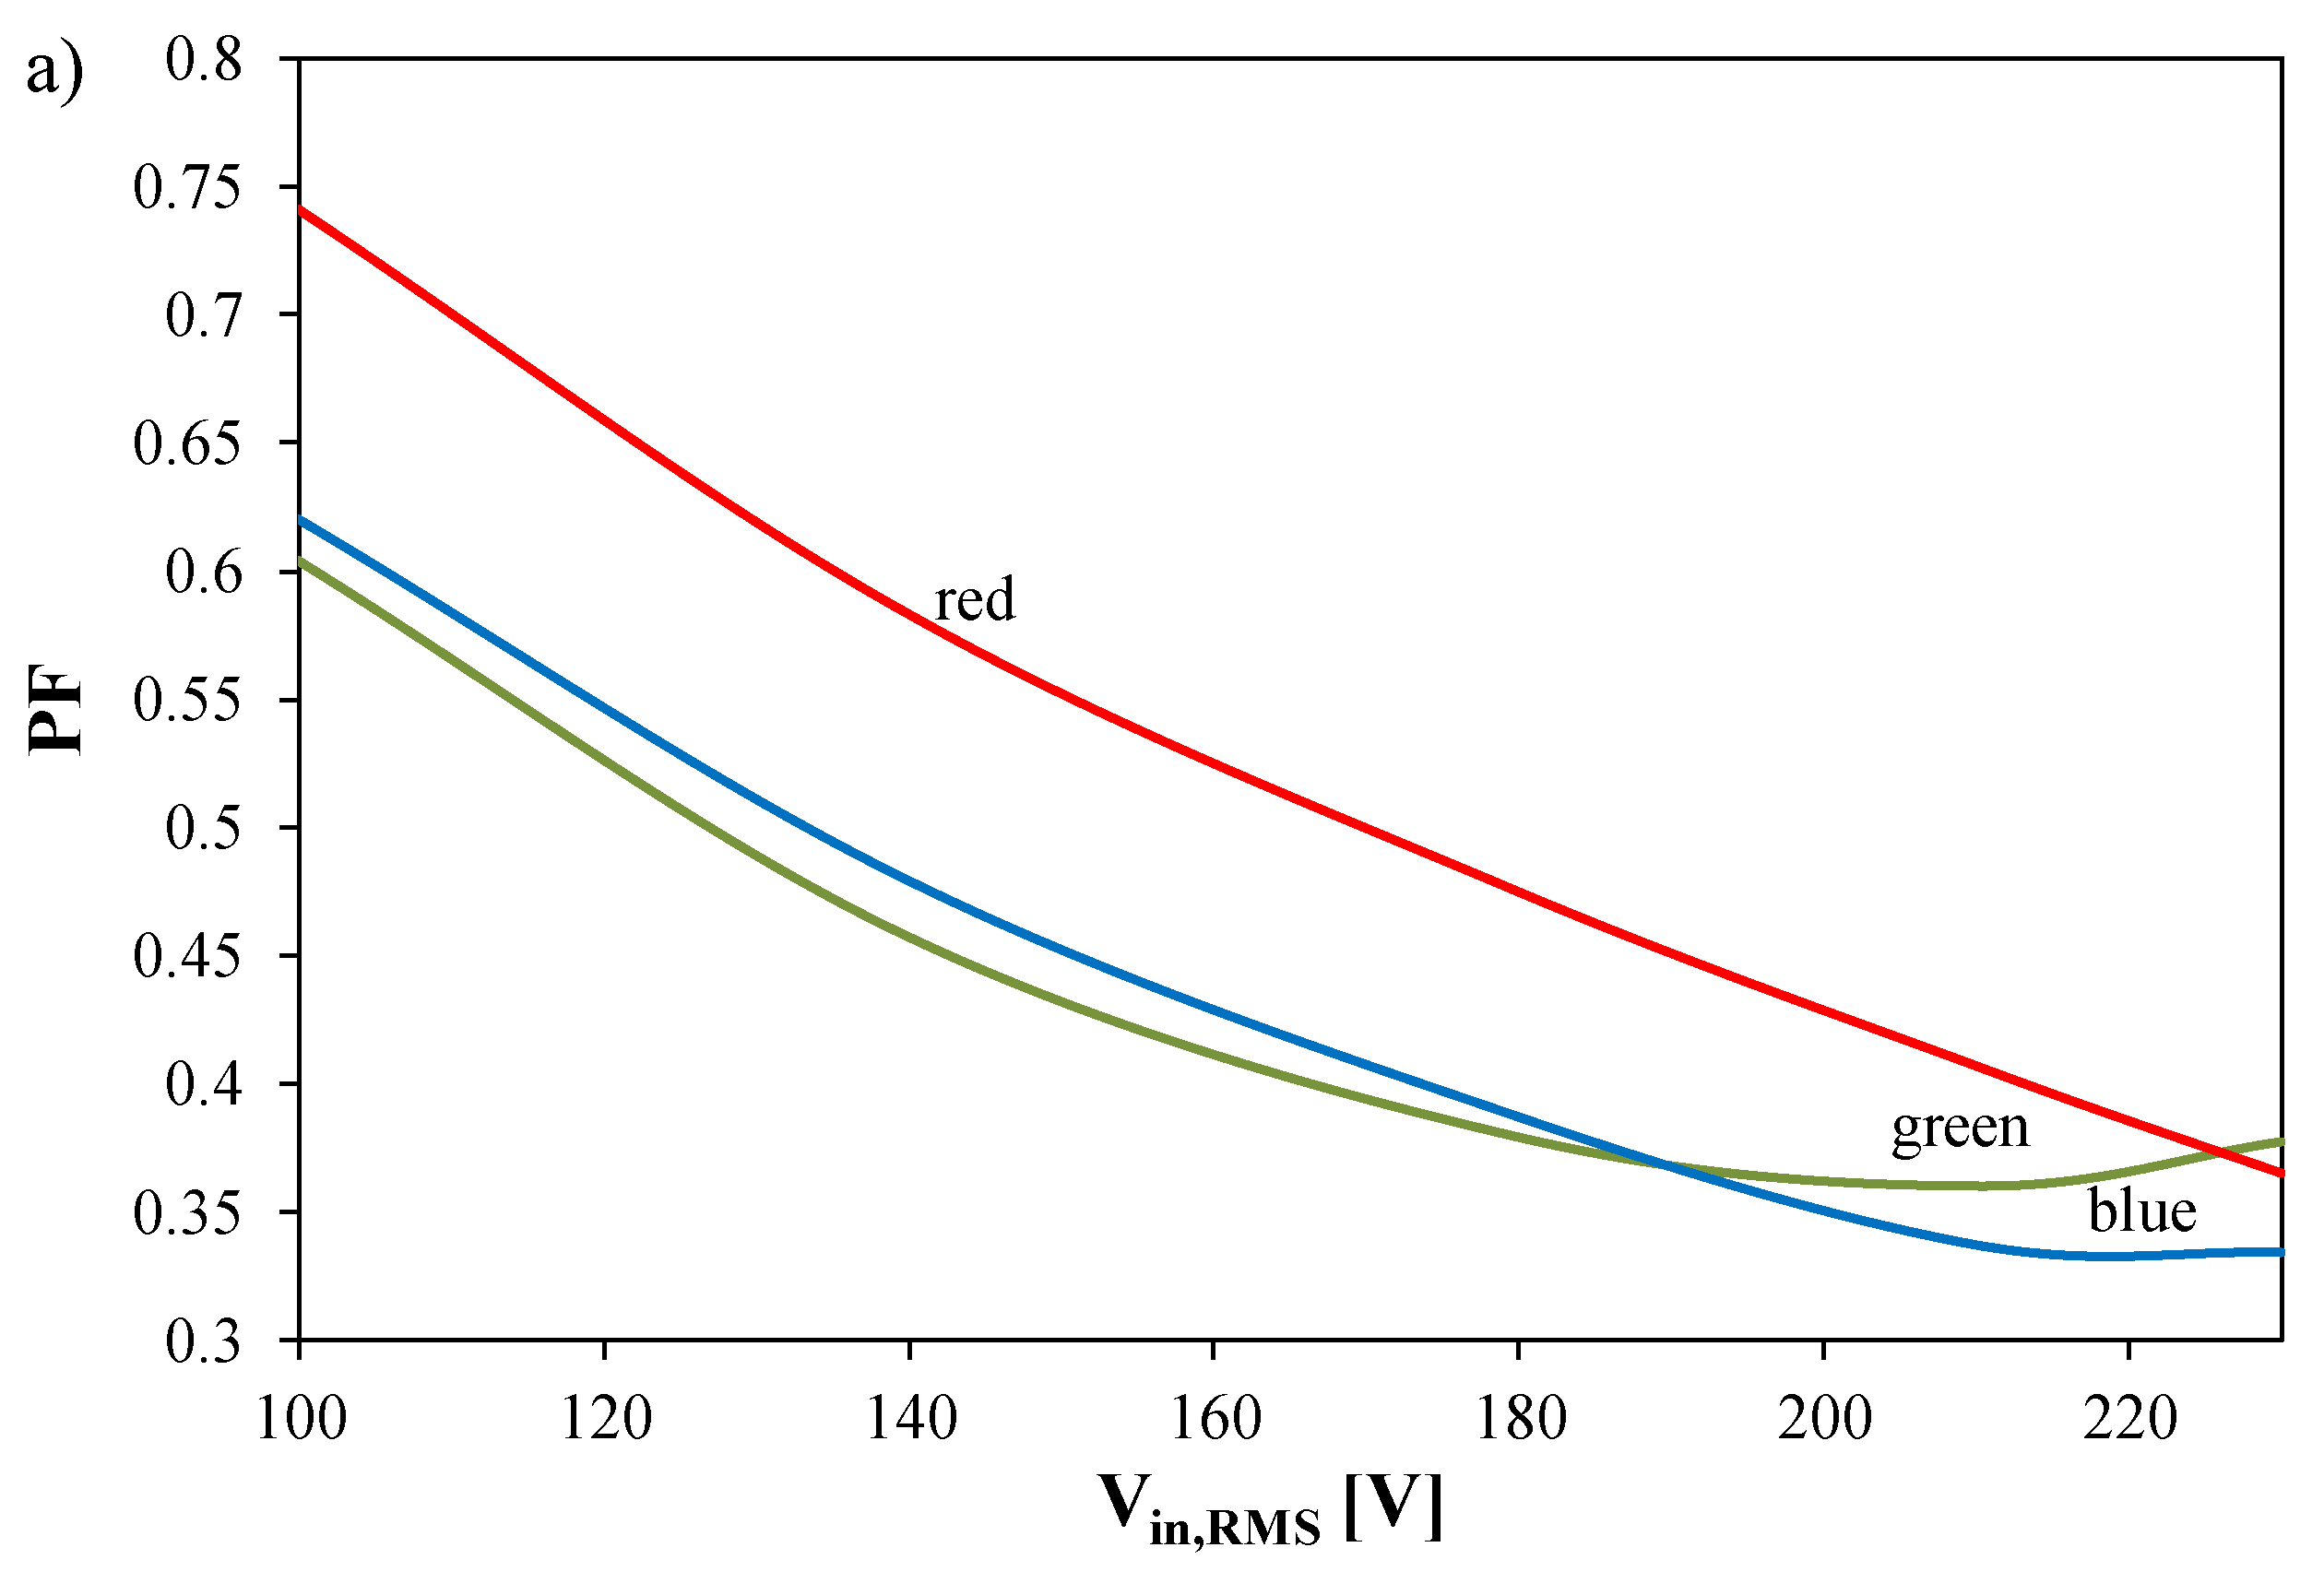
Figure 12 shows the dependence of the power factor PF on the RMS voltage of feeding voltage VinRMS. The measurements were carried out for two LED lamps emitting light in the spectrum of visible light. These analyses were performed in a wide range of changes in the RMS value of feeding voltage from 100 to 230 V. The values of the power factor PF were measured using a single-phase power analyser PA1000.
It is visible that the value of the power factor is a decreasing function of feeding voltage. At the nominal value of feeding voltage, the value of the power factor is contained in the range from 0.35 to 0.4 for the colour lamp. This is a very small value (lower than 0.5 declared by the producer [37]), which shows that the considered lamp has a very unfavourable influence on the power plant. For the lamp emitting white light, the value of PF is in the range from 0.55 to 0.7 (lower than 0.8 declared by the producer [37]). The obtained results of measurements show that no power factor correction circuit was applied in the feeder of the examined lamp.
PF values were also calculated using Equation (3) and the calculated values of THD shown in Figure 11. The obtained values of calculations are much higher than the measured values of this parameter. For example, at VinRMS = 230 V, values of the PF are in the range from 0.85 to 0.95, and they are higher than the value declared by the producer in [37]. According to information given in [15], Equation (3) can be used only in the case when the value of THD is nearly zero.
Comparing the obtained results of the measurements of the power factor to the values of this parameter obtained for other light sources, and among others in the paper [25], it can be stated that the use of the examined lamps, to a considerably higher degree, results in the worsening of the quality of electrical energy in the power plant than classical bulbs and popular LED lamps. The obtained values of PF for the examined lamp are nearing the values corresponding to a fluorescent lamp.
5. Conclusions
In the paper, the results of measurements and calculations illustrating electrical and optical properties of LED lamps of the Philips Hue-type emitting light of selected colours or white light of different CCTs were presented. A manner of regulating useful parameters of the considered lamps was presented, and the characteristics illustrating the relation between the values of the selected optical parameters and the measured values of the emitted luminous flux and the spectral characteristics of the examined lamps were shown.
Attention was given to properties of the LED drivers feeding lighting components of the examined lamps. The influence of voltage supply and the colour or CCT of the emitted light and dimming factor d of the lamp on the RMS value of the supplying current, its waveform, the coefficient of the total harmonic distortion and the power factor was discussed.
The measurements were performed with the use of the authors’ measuring setup. The measurements of the RMS value of the supplying current show that it is an increasing function of parameter d and a decreasing function of voltage supply. The waveforms of the supplying current registered during the experimental part of the research confirm strong deformation, and they can constitute a proof that in the LED driver, a block of the power factor correction was not applied. The performed measurements and calculations of the THD and PF also showed that the examined lamps unfavourably influence the quality of energy in the power plant. One should pay attention to the fact that the values of the THD and PF obtained by means of the power analyser accept far less favourable values than in the case of using the oscilloscopic measurements and the simplified analytic formulas given in the literature. The observed differences result probably from the fact that the waveband, wherein the harmonics values of the supplying current are measured, is considerably wider in the case of the power analyser. When the oscilloscope is used, the fast Fourier transformation taking into account only about 20 harmonics frequencies of the network are identified, but the norm [55] needs 25 harmonics. Therefore, the disturbances of frequency higher than 1 kHz are not taken into account while determining the THD value. By contrast, the power analyser uses 70 harmonics. The obtained results show that it is worth taking into account a change in the law regulations and increase in the number of harmonics of the supplying current for LED lamps connected to the power plant.
The findings presented in this paper can be useful for designers of lighting systems with LED lamps. One should also take into account the influence of the properties of electronic devices on the power plant to make allowance for harmonics of higher order which correspond to the current impulses connected with the use of switch-mode power supplies in the LED driver contained in LED lamps. The objective of further investigations would be a proposal of systemic solutions making it possible to decrease the THD and increase the PF value characterising the waveforms of the supplying current of the examined LED lamps.
Author Contributions
Conceptualization, P.P. and K.G.; methodology, P.P.; formal analysis, P.P., M.O. and J.H.; investigation, J.H.; resources, J.H.; data curation, M.O.; writing—original draft preparation, P.P. and K.G.; writing—review and editing, K.G., P.P. and M.O.; visualization P.P.; supervision, P.P. and K.G.; funding acquisition, K.G. All authors have read and agreed to the published version of the manuscript.
Funding
The project was financed within the program of the Ministry of Science and Higher Education called ”Regionalna Inicjatywa Doskonałości” in the years 2019–2022, with project number 006/RID/2018/19, and sum of financing 11,870,000 PLN.
Institutional Review Board Statement
Not applicable.
Informed Consent Statement
Not applicable.
Data Availability Statement
Data are contained within the article.
Conflicts of Interest
The author declares no conflict of interest.
Nomenclature
| Tj | junction temperature |
| Ta | ambient temperature |
| Popt | optical power |
| Ee | surface power density of the emitted light |
| Zthe(t) | electrical transient thermal impedance |
| vD | forward voltage |
| iD | diode current |
References
- Wang, K.; Liu, S.; Luo, X.; Wu, D. Freeform Optics for LED Packages and Applications; Wiley: Singapore, 2017. [Google Scholar]
- Huang, J.; Kuo, H.C.; Shen, S.C. Nitride Semiconductor Light-Emitting Diodes (LEDs), 2nd ed.; Elsevier: Taiwan, 2018. [Google Scholar]
- Chang, M.-H.; Das, D.; Varde, P.; Pecht, M. Light emitting diodes reliability review. Microelectron. Reliab. 2012, 52, 762–782. [Google Scholar] [CrossRef]
- Górecki, K.; Ptak, P. Modeling power supplies of LED lamps. Int. J. Circuit Theory Appl. 2018, 46, 629–636. [Google Scholar] [CrossRef]
- Górecki, K.; Ptak, P. Modelling LED lamps in SPICE with thermal phenomena taken into account. Microelectron. Reliab. 2017, 79, 440–447. [Google Scholar] [CrossRef]
- Schubert, E.F. Light Emitting Diodes, 2nd ed.; Cambridge University Press: New York, NY, USA, 2008. [Google Scholar]
- Svilainis, L. Comparison of the EMI Performance of LED PWM Dimming Techniques for LED Video Display Application. J. Disp. Technol. 2012, 8, 162–165. [Google Scholar] [CrossRef]
- Rata, G.; Rata, M. The study of harmonics from dimmable LED lamps, using CompactRIO. In Proceedings of the 2016 International Conference on Development and Application Systems (DAS), Suceava, Romania, 19–21 May 2016; pp. 180–183. [Google Scholar] [CrossRef]
- Winder, S. Power Supplies for LED Driving, 2nd ed.; Elsevier BV: Aalborg, Denmark, 2017. [Google Scholar]
- Krishna, A.A.; Kartha, B.A.; Nair, V.S. Dynamic traffic light system for unhindered passing of high priority vehicles: Wireless implementation of dynamic traffic light systems using modular hardware. In Proceedings of the 2017 IEEE Global Humanitarian Technology Conference (GHTC), San Jose, CA, USA, 19–22 October 2017; pp. 1–5. [Google Scholar]
- Arias, M.; Lamar, D.G.; Sebastian, J.; Balocco, D.; Diallo, A.A. High-Efficiency LED Driver without Electrolytic Capacitor for Street Lighting. IEEE Trans. Ind. Appl. 2012, 49, 127–137. [Google Scholar] [CrossRef]
- Jia, L.; Liu, Y.-F. Topology and Control Innovation for Auxiliary Power Supply in Dimmable LED Drivers. IEEE Trans. Power Electron. 2016, 32, 1. [Google Scholar] [CrossRef]
- Pollock, A.; Pollock, H.; Pollock, C. High Efficiency LED Power Supply. IEEE J. Emerg. Sel. Top. Power Electron. 2015, 3, 617–623. [Google Scholar] [CrossRef]
- Chung, Y.-C.; Lee, K.-M.; Choe, H.-J.; Sung, C.-H.; Kang, B. Low-Cost Drive Circuit for AC-Direct LED Lamps. IEEE Trans. Power Electron. 2014, 30, 5776–5782. [Google Scholar] [CrossRef]
- Rashid, M.H. Power Electronics Handbook; Elsevier: Amsterdam, The Netherlands, 2007. [Google Scholar]
- Adragna, C.; Gritti, G.; Raciti, A.; Rizzo, S.A.; Susinni, G. Analysis of the Input Current Distortion and Guidelines for Designing High Power Factor Quasi-Resonant Flyback LED Drivers. Energies 2020, 13, 2989. [Google Scholar] [CrossRef]
- Lasance, C.J.M.; Poppe, A. Thermal Management for LED Applications; Springer Science+Business Media: New York, NY, USA, 2014. [Google Scholar]
- Uddin, S.; Shareef, H.; Mohamed, A.; Hannan, M.A. Harmonics and thermal characteristics of low wattage LED lamps. Prze-gląd Elektrotechniczny 2012, 88, 266–271. [Google Scholar]
- Muthu, S.; Schuurmans, F.; Pashley, M. Red, green, and blue LED based white light generation: Issues and control. In Proceedings of the Conference Record of the 2002 IEEE Industry Applications Conference. 37th IAS Annual Meeting (Cat. No.02CH37344), Pittsburgh, PA, USA, 13–18 October 2003. [Google Scholar]
- Górecki, K. The influence of power supply voltage on exploitive parameters of the selected lamps. Informacije MIDEM J. Microelectr. Electr. Compon. Mater. 2013, 43, 193–198. [Google Scholar]
- Górecki, K.; Górecka, K.; Górecki, P. Porównanie właściwości eksploatacyjnych wybranych typów lamp LED. Przegląd Elektrotechniczny 2012, 88, 111–114. [Google Scholar]
- Ndokaj, A.; Di Napoli, A. LED power supply and EMC compliance. In Proceedings of the 2012 IEEE International Energy Conference and Exhibition (ENERGYCON), Florence, Italy, 9–12 September 2012; pp. 254–258. [Google Scholar]
- Pinto, M.F.; Mendonca, T.R.F.; Duque, C.A.; Braga, H.A.C. Power quality measurements embedded in smart lighting systems. In Proceedings of the 2015 IEEE 24th International Symposium on Industrial Electronics (ISIE), Rio de Janeiro, Brazil, 3–5 June 2015; pp. 1202–1207. [Google Scholar]
- Bloudicek, R.; Luzica, S.; Rydlo, S.; Hon, L. Power supply in LED airport lighting systems. In Proceedings of the 2017 International Conference on Military Technologies (ICMT), Brno, Czech Republic, 31 May–2 June 2017; pp. 588–591. [Google Scholar]
- Uddin, S.; Shareef, H.; Mohamed, A.; Hannan, M. An analysis of harmonics from dimmable LED lamps. In Proceedings of the 2012 IEEE International Power Engineering and Optimization Conference, Melaka, Malaysia, 6–7 June 2012; pp. 182–186. [Google Scholar]
- Lho, Y.H.; Lee, S.Y. A Study on methodology to improve the power factor of high power LED module. In Proceedings of the 2014 14th International Conference on Control, Automation and Systems (ICCAS 2014), Seoul, Korea, 22 October 2014; pp. 1404–1406. [Google Scholar]
- Ionescu, C.; Dima, M.; Bonfert, D. Flicker distortion power factor analysis in lighting LED’s. In Proceedings of the 2017 IEEE 23rd International Symposium for Design and Technology in Electronic Packaging (SIITME), Constanta, Romania, 26–29 October 2017; pp. 280–285. [Google Scholar]
- Dolara, A.; Leva, S. Power Quality and Harmonic Analysis of End User Devices. Energies 2012, 5, 5453–5466. [Google Scholar] [CrossRef]
- Shackelford, J.; Mathew, P.; Regnier, C.; Walter, T. Laboratory Validation of Integrated Lighting Systems Retrofit Performance and Energy Savings. Energies 2020, 13, 3329. [Google Scholar] [CrossRef]
- Devarapalli, H.P.; Dhanikonda, V.S.S.S.S.; Gunturi, S.B. Non-Intrusive Identification of Load Patterns in Smart Homes Using Percentage Total Harmonic Distortion. Energies 2020, 13, 4628. [Google Scholar] [CrossRef]
- Hernández, J.; Romero, A.A.; Meyer, J.; Blanco, A.M. Impact of Nonlinear Lighting Loads on the Neutral Conductor Current of Low Voltage Residential Grids. Energies 2020, 13, 4851. [Google Scholar] [CrossRef]
- Beaty, W.H. Handbook of Electric Power Calculations, 3rd ed.; McGraw-Hill: New York, NY, USA, 2012. [Google Scholar]
- Phannil, N.; Jettanasen, C.; Ngaopitakkul, A. Harmonics and Reduction of Energy Consumption in Lighting Systems by Using LED Lamps. Energies 2018, 11, 3169. [Google Scholar] [CrossRef] [Green Version]
- Apse-Apsitis, P.; Avotins, A.; Ribickis, L. Wirelessly controlled LED lighting system. In Proceedings of the 2012 IEEE International Energy Conference and Exhibition (ENERGYCON), Florence, Italy, 9–12 September 2012; pp. 952–956. [Google Scholar] [CrossRef]
- Mishra, B.C.; Panda, A.S.; Rout, N.K.; Mohapatra, S.K. A Novel Efficient Design of Intelligent Street Lighting Monitoring System Using ZigBee Network of Devices and Sensors on Embedded Internet Technology. In Proceedings of the 2015 International Conference on Information Technology (ICIT), Bhubaneswar, India, 21–23 December 2015; pp. 200–205. [Google Scholar]
- Thielemans, S.; Di Zenobio, D.; Touhafi, A.; Lataire, P.; Steenhaut, K. DC Grids for Smart LED-Based Lighting: The EDISON Solution. Energies 2017, 10, 1454. [Google Scholar] [CrossRef] [Green Version]
- What Philips Hue Smart Lights Are You Looking For? Available online: https://www.philips-hue.com/en-gb?locale_code=en_&remember_locale=en_gb (accessed on 25 February 2021).
- EN 13032-4:2015 standard. Light and Lighting. Measurement and Presentation of Photometric Data of Lamps and Luminaires. LED Lamps, Modules and Luminaires; Official Journal of the European Union: Luxembourg, 2015. [Google Scholar]
- IEC62471:2006 standard. Photobiological Safety of Lamps and Lamp Systems; Official Journal of the European Union: Luxembourg, 2006. [Google Scholar]
- EN 50160:2007 standard. Voltage Characteristics in Public Distribution Systems; Official Journal of the European Union: Luxembourg, 2007. [Google Scholar]
- Pawlak, A. Evaluation of the Hazard Caused by Blue Light Emitted by LED Sources. In Proceedings of the 2018 VII. Lighting Conference of the Visegrad Countries (Lumen V4), Trebic, Czech Republic, 18–20 September 2018; pp. 1–6. [Google Scholar]
- Stepanek, J.; Skoda, J.; Krbal, M.; Motycka, M.; Nekvapil, J. Measurement of Photobiogical Safety for LEDs with Different Spectra. In Proceedings of the 2018 VII. Lighting Conference of the Visegrad Countries (Lumen V4), Trebic, Czech Republic, 18–20 September 2018; pp. 1–5. [Google Scholar]
- EN 61000–3–2 standard. Electromagnetic Compatibility (EMC)—Part 3-2: Limits—Limits for Harmonic Current Emissions (Equipment Input Current up to and Including 16 A per Phase), 5th ed.; Official Journal of the European Union: Luxembourg, 2018. [Google Scholar]
- Putz, Ł.; Kurzawa, M. Measurements and analysis selected power quality parameters in systems with LED light sources. Comput. Appl. Electr. Eng. 2016, 14, 551–561. [Google Scholar] [CrossRef]
- Sreedevi, V.; Devi, V.; Sunil, A.A. Analysis and simulation of a single stage power supply for LED lighting. In Proceedings of the 2013 International Conference on Green Computing, Communication and Conservation of Energy (ICGCE), Tamil Nadu, India, 12–14 December 2013; pp. 453–457. [Google Scholar]
- Ptak, P.; Górecki, K.; Heleniak, J. Wpływ trybu pracy lampy LED typu HUE na jej parametry elektryczne i optyczne. Przegląd Elektrotechniczny 2020, 96, 102–105. [Google Scholar] [CrossRef]
- Ptak, P.; Górecki, K.; Heleniak, J. An Influence of the Operation Mode of a LED Lamp of the HUE Type on Its Electrical and Optical Parameters. In Proceedings of the 2020 27th International Conference on Mixed Design of Integrated Circuits and System (MIXDES), Wroclaw, Poland, 25–27 June 2020; pp. 204–209. [Google Scholar]
- Autotransformer ATS-REG1.2. Available online: https://www.sklep.cyfronika.com.pl/pl/p/ATS-REG1.2-Autotransformator-z-regulowanym-napieciem-moc-1.25-kW/15527 (accessed on 29 January 2020).
- Multimeter Unit 804. Available online: https://www.gotronik.pl/ut804-cyfrowy-multimetr-laboratoryjny-p-326.html (accessed on 29 January 2020).
- Current probe Tektronix TCPA300. Available online: https://pl.rs-online.com/web/p/akcesoria-do-sond/7644391/ (accessed on 29 January 2020).
- Power Analyser Tektronix PA1000. Available online: https://pl.farnell.com/tektronix/pa1000/ac-power-analyzer-1ph-1v-to-600v/dp/2772544 (accessed on 29 January 2020).
- Oscilloscope Gw Instek GDS 2104. Available online: https://www.tme.eu/pl/details/gds-2104a/oscyloskopy-cyfrowe/gw-instek/ (accessed on 29 January 2020).
- Luxmeter L 200. Available online: https://www.sonopan.com.pl/pl/produkty/swiatlo/luksomierz-precyzyjny-l-200/ (accessed on 29 January 2020).
- Radiometer HD2302. Available online: https://sklep.emd.net.pl/foto-radiometr-hd23020-delta-ohm-p-2724.html (accessed on 29 January 2020).
- Spectrometer USB 650 Ocean Optic. Available online: https://www.oceaninsight.com/products/spectrometers/usb-series/ (accessed on 29 January 2020).
- Smith, W.J. Modern Optical Engineering: The Design of Optical Systems, 4th ed.; McGraw Hill: New York, NY, USA, 2008. [Google Scholar]
- Górecki, K.; Ptak, P. Compact Modelling of Electrical, Optical and Thermal Properties of Multi-Colour Power LEDs Operating on a Common PCB. Energies 2021, 14, 1286. [Google Scholar] [CrossRef]
Figure 1.
Diagram of the measurement setup.

Figure 2.
View of the used measurement setup.

Figure 3.
Measured dependences of the RMS value of the supplying current on the fixed value of parameters for both LED lamps: Three basic colours (a) and dynamic white (b).
Figure 3.
Measured dependences of the RMS value of the supplying current on the fixed value of parameters for both LED lamps: Three basic colours (a) and dynamic white (b).

Figure 4.
Measured dependences of the RMS value of the supplying current on the fixed value of feeding voltage for colour (a) and dynamic white (b) LED lamps at d = 100%.
Figure 4.
Measured dependences of the RMS value of the supplying current on the fixed value of feeding voltage for colour (a) and dynamic white (b) LED lamps at d = 100%.

Figure 5.
Measured dependences of irradiance at a distance of 50 cm from both the LED luminaires operating in the mode of emission of red, green and blue light (a) and white light of different CCT (b) on the fixed value of parameter d.
Figure 5.
Measured dependences of irradiance at a distance of 50 cm from both the LED luminaires operating in the mode of emission of red, green and blue light (a) and white light of different CCT (b) on the fixed value of parameter d.


Figure 6.
Measured spectral characteristics of the tested LED lamps operating in the mode of emission of red, green and blue light (a) and white light of different correlated colour temperatures (CCTs) (b).
Figure 6.
Measured spectral characteristics of the tested LED lamps operating in the mode of emission of red, green and blue light (a) and white light of different correlated colour temperatures (CCTs) (b).

Figure 7.
Measured waveforms of the supplying current of the tested lamps obtained in the mode of emission of red, green and blue light (a) and dynamic white LED lamps (b).
Figure 7.
Measured waveforms of the supplying current of the tested lamps obtained in the mode of emission of red, green and blue light (a) and dynamic white LED lamps (b).

Figure 8.
Measured spectrum of harmonics of the supplying current of the tested lamps obtained in the mode of red, green and blue light (a) and dynamic white LED lamps (b).
Figure 8.
Measured spectrum of harmonics of the supplying current of the tested lamps obtained in the mode of red, green and blue light (a) and dynamic white LED lamps (b).

Figure 9.
Measured waveforms of the supplying current of the tested lamps obtained in the mode of emission of green light (a) and neutral white light (b).
Figure 9.
Measured waveforms of the supplying current of the tested lamps obtained in the mode of emission of green light (a) and neutral white light (b).


Figure 10.
Measured spectrum of harmonics of the supplying current of the tested lamps obtained in the mode of green light (a) and neutral white LED lamp (b).
Figure 10.
Measured spectrum of harmonics of the supplying current of the tested lamps obtained in the mode of green light (a) and neutral white LED lamp (b).

Figure 11.
Measured and calculated dependences of the total harmonic distortion (THD) of the supplying current on the input voltage for the tested lamp emitting: (a) Coloured light and (b) white light.
Figure 11.
Measured and calculated dependences of the total harmonic distortion (THD) of the supplying current on the input voltage for the tested lamp emitting: (a) Coloured light and (b) white light.

Figure 12.
Measured dependence of the power factor (PF) on feeding voltage for the tested lamps emitting coloured light (a) or white light (b).
Figure 12.
Measured dependence of the power factor (PF) on feeding voltage for the tested lamps emitting coloured light (a) or white light (b).


Publisher’s Note: MDPI stays neutral with regard to jurisdictional claims in published maps and institutional affiliations. |
© 2021 by the authors. Licensee MDPI, Basel, Switzerland. This article is an open access article distributed under the terms and conditions of the Creative Commons Attribution (CC BY) license (http://creativecommons.org/licenses/by/4.0/).
Share and Cite
MDPI and ACS Style
Ptak, P.; Górecki, K.; Heleniak, J.; Orlikowski, M. Investigations of Electrical and Optical Parameters of Some LED Luminaires—A Study Case. Energies 2021, 14, 1612. https://doi.org/10.3390/en14061612
AMA Style
Ptak P, Górecki K, Heleniak J, Orlikowski M. Investigations of Electrical and Optical Parameters of Some LED Luminaires—A Study Case. Energies. 2021; 14(6):1612. https://doi.org/10.3390/en14061612
Chicago/Turabian StylePtak, Przemysław, Krzysztof Górecki, Jakub Heleniak, and Mariusz Orlikowski. 2021. "Investigations of Electrical and Optical Parameters of Some LED Luminaires—A Study Case" Energies 14, no. 6: 1612. https://doi.org/10.3390/en14061612
Note that from the first issue of 2016, this journal uses article numbers instead of page numbers. See further details here.