
A Hybrid Method to Evaluate Soil Liquefaction Potential of Seabed at Offshore Wind Farm in Taiwan


1
Department of Hydraulic and Ocean Engineering, National Cheng-Kung University, Tainan 701, Taiwan
2
CECI Engineering Consultants, Taipei 114, Taiwan
3
National Center for Research on Earthquake Engineering, Taipei 106, Taiwan
*
Author to whom correspondence should be addressed.
Energies 2021, 14(7), 1853; https://doi.org/10.3390/en14071853
Submission received: 20 February 2021
/
Revised: 11 March 2021
/
Accepted: 18 March 2021
/
Published: 26 March 2021
(This article belongs to the Special Issue Foundation Systems for Offshore Wind Turbines)
Abstract
:This paper undertakes liquefaction analysis with simplified procedures with standard penetration test (SPT) data and cone penetration test (CPT) data obtained from an offshore wind farm in the Changhua area. The soil liquefaction resistance calculated by the SPT-based simplified procedure suggested by the Japan Railway Association was in agreement with the laboratory results. The CPT is widely used in the site investigation of offshore wind farms. However, Taiwan’s registered professional engineers are still familiar with soil liquefaction analysis for offshore wind farms using SPT-based methods. Hence, a hybrid method that incorporates an SPT–CPT correlation into the New Japan Road Association (NJRA) method is proposed to evaluate the soil liquefaction potential for offshore wind farms in Taiwan. In the case studies of soil liquefaction with five groups of adjacent boreholes in Changhua’s offshore wind farms, the hybrid method shows that the soil liquefaction potential with CPT data is consistent with the results calculated with SPT-based simplified procedures. To quantify the risk of soil liquefaction, Monte Carlo simulation is used to calculate the uncertainty of CPT–qc for estimating the probability of soil liquefaction with the hybrid method.
1. Introduction
The Taiwan Strait has substantial wind resources to develop offshore wind farms. However, a potential offshore wind farm is located at the junction of the Eurasian plate and the Philippine Sea plate of the Circum-Pacific seismic zone, which makes the site vulnerable to severe earthquakes, thus leading to structural damage. The alluvial sediment of the Chang-Bin offshore area is mainly from the Zhuoshui River and Wu River. Some preliminary geotechnical investigation reports show the highly variable soil conditions within the area; the soil layer is mostly composed of silty sand (SM), low-plasticity clay (CL) and low-plasticity silt (ML) [1,2,3,4,5,6,7]. SPT blow counts N values between 10 and 20 occur at 20-m of the surface soil layer, meaning that the weak and saturated, cohesionless soil has high potential to liquefy under a severe earthquake. Soil liquefaction caused by seabed soil deposit begins to weaken under cyclic seismic activity and should be taken into consideration in the foundation design of offshore wind turbines (OWTs) [8]. Due to the high liquefaction potential of the soil layer, it is necessary to conduct advanced laboratory tests (e.g., cyclic triaxial test or cyclic simple shear test) to understand the mechanical properties of soil when liquefaction occurs, which is suggested by the Standard of Wind Turbines Part 1: Design requirements (CNS15176-1) Appendix H, published by the Bureau of Standard Metrology and Inspection.
The standard penetration test (SPT) is the most used site investigation test in Taiwan’s onshore area, and Taiwan’s Seismic Design Specifications and Commentary of Buildings Code recommends the simplified procedure of the Japan Road Association (JRA) for the assessment of soil liquefaction potential in Taiwan [9]. However, as the cone penetration test (CPT) has good repeatability and reliability, many offshore foundation design approaches are based on CPT correlations. Therefore, CPT has become the most used site investigation test during the development of offshore wind farms in Taiwan. However, a method for evaluating soil liquefaction potential with CPT data is absent in the Taiwan’s Seismic Design Specification and Commentary of Buildings Code and Standard of wind turbine design (CNS15176-1).
Ever since Seed and Idriss (1971) proposed SPT-based simplified procedures, there have been more approaches based on localized liquefaction events developed and suggested in the local seismic design code [10,11,12,13]. Before CPT was widely used, Seed and Idriss (1981) and Douglas et al. (1981) suggested that CPT data can be used in existing SPT-based simplified procedures through the SPT–CPT correlation [14,15]. As CPT survey technology matures, much research has proposed different CPT-based methods, including Robertson and Campanella (1985), Seed and De Alba (1986), Stark and Olson (1995), Robertson and Wride (1998) [16,17,18,19]. The methods proposed by Robertson and Wride (1998) are often used among all and are recommended by National Center for Earthquake Engineering Research (NCEER) [20], which has now been updated in Robertson (2009) [21]. Most of the simplified procedure is carried out by summarizing local seismic liquefaction historical events and the laboratory test results of soil sample from terrestrial sites. The applicability of the simplified procedure in offshore wind farms still needs to be discussed. We compare the results of the SPT-based (JRA method) and CPT-based methods of Robertson (2009) with soil liquefaction resistance obtained from laboratory tests conducted on undisturbed soil samples from offshore wind farms in Taiwan, and the applicability of the simplified methods is evaluated in this study. A hybrid method exploiting the SPT–CPT correlation to evaluate the soil liquefaction potential for the Changhua offshore area is presented and it shows a better estimated result for soil liquefaction resistance.
There are uncertainties in the input data for the simplified procedure of soil liquefaction analysis, which includes seismic force, field test parameters and variety of soil. Therefore, a systematic quantitative method has been gradually developed for the assessment of soil liquefaction potential. Liao et al. (1988), Youd and Nobel (1997), Toprak et al. (1999) considered the factors that affect the risk of soil liquefaction, such as seismic intensity, epicenter distance and fine content, FC, and proposed a method using logistic regression analysis to evaluate the probability of soil liquefaction [22,23,24]. Haldar and Tang (1979), Yegian and Whitman (1978) considered the uncertainties of the required parameters in the simplified procedure method using statistical methods [25,26]. They assumed that CRR and CSR had lognormal distribution and were independent, and they derived the liquefaction probability from liquefaction and non-liquefaction events. Chen and Juang (2000), Juang and Jiang (2000), Juang et al. (2000, 2002) obtained the probability of soil liquefaction Pf through reliability analysis of numerous data and established the relationship between liquefaction safety factor FL and liquefaction probability by the Bayesian mapping function [27,28,29,30]. Kuo et al. (2020) and Raghu Kanth & Dash (2008) used Monte Carlo simulation and a simplified procedure to evaluate the probability of soil liquefaction by establishing the SPT-N model, which varies with soil type or relative density [31,32].
In order to determine the impact of the uncertainties of CPT parameters on soil liquefaction analysis, we collect CPT data in the Changhua offshore area and classify the soil behavior types using the method of Robertson (2010) [33], using the Kolmogorov–Smirnov test (K–S test) to determine the CPT-qc distribution, and analyzing the probability of soil liquefaction by the hybrid method proposed in this paper with Monte Carlo simulation.
2. Site Investigation and Seismic Load Analysis of Taiwan’s Offshore Wind Farm
2.1. Borehole Data of Changhua Offshore Wind Farm
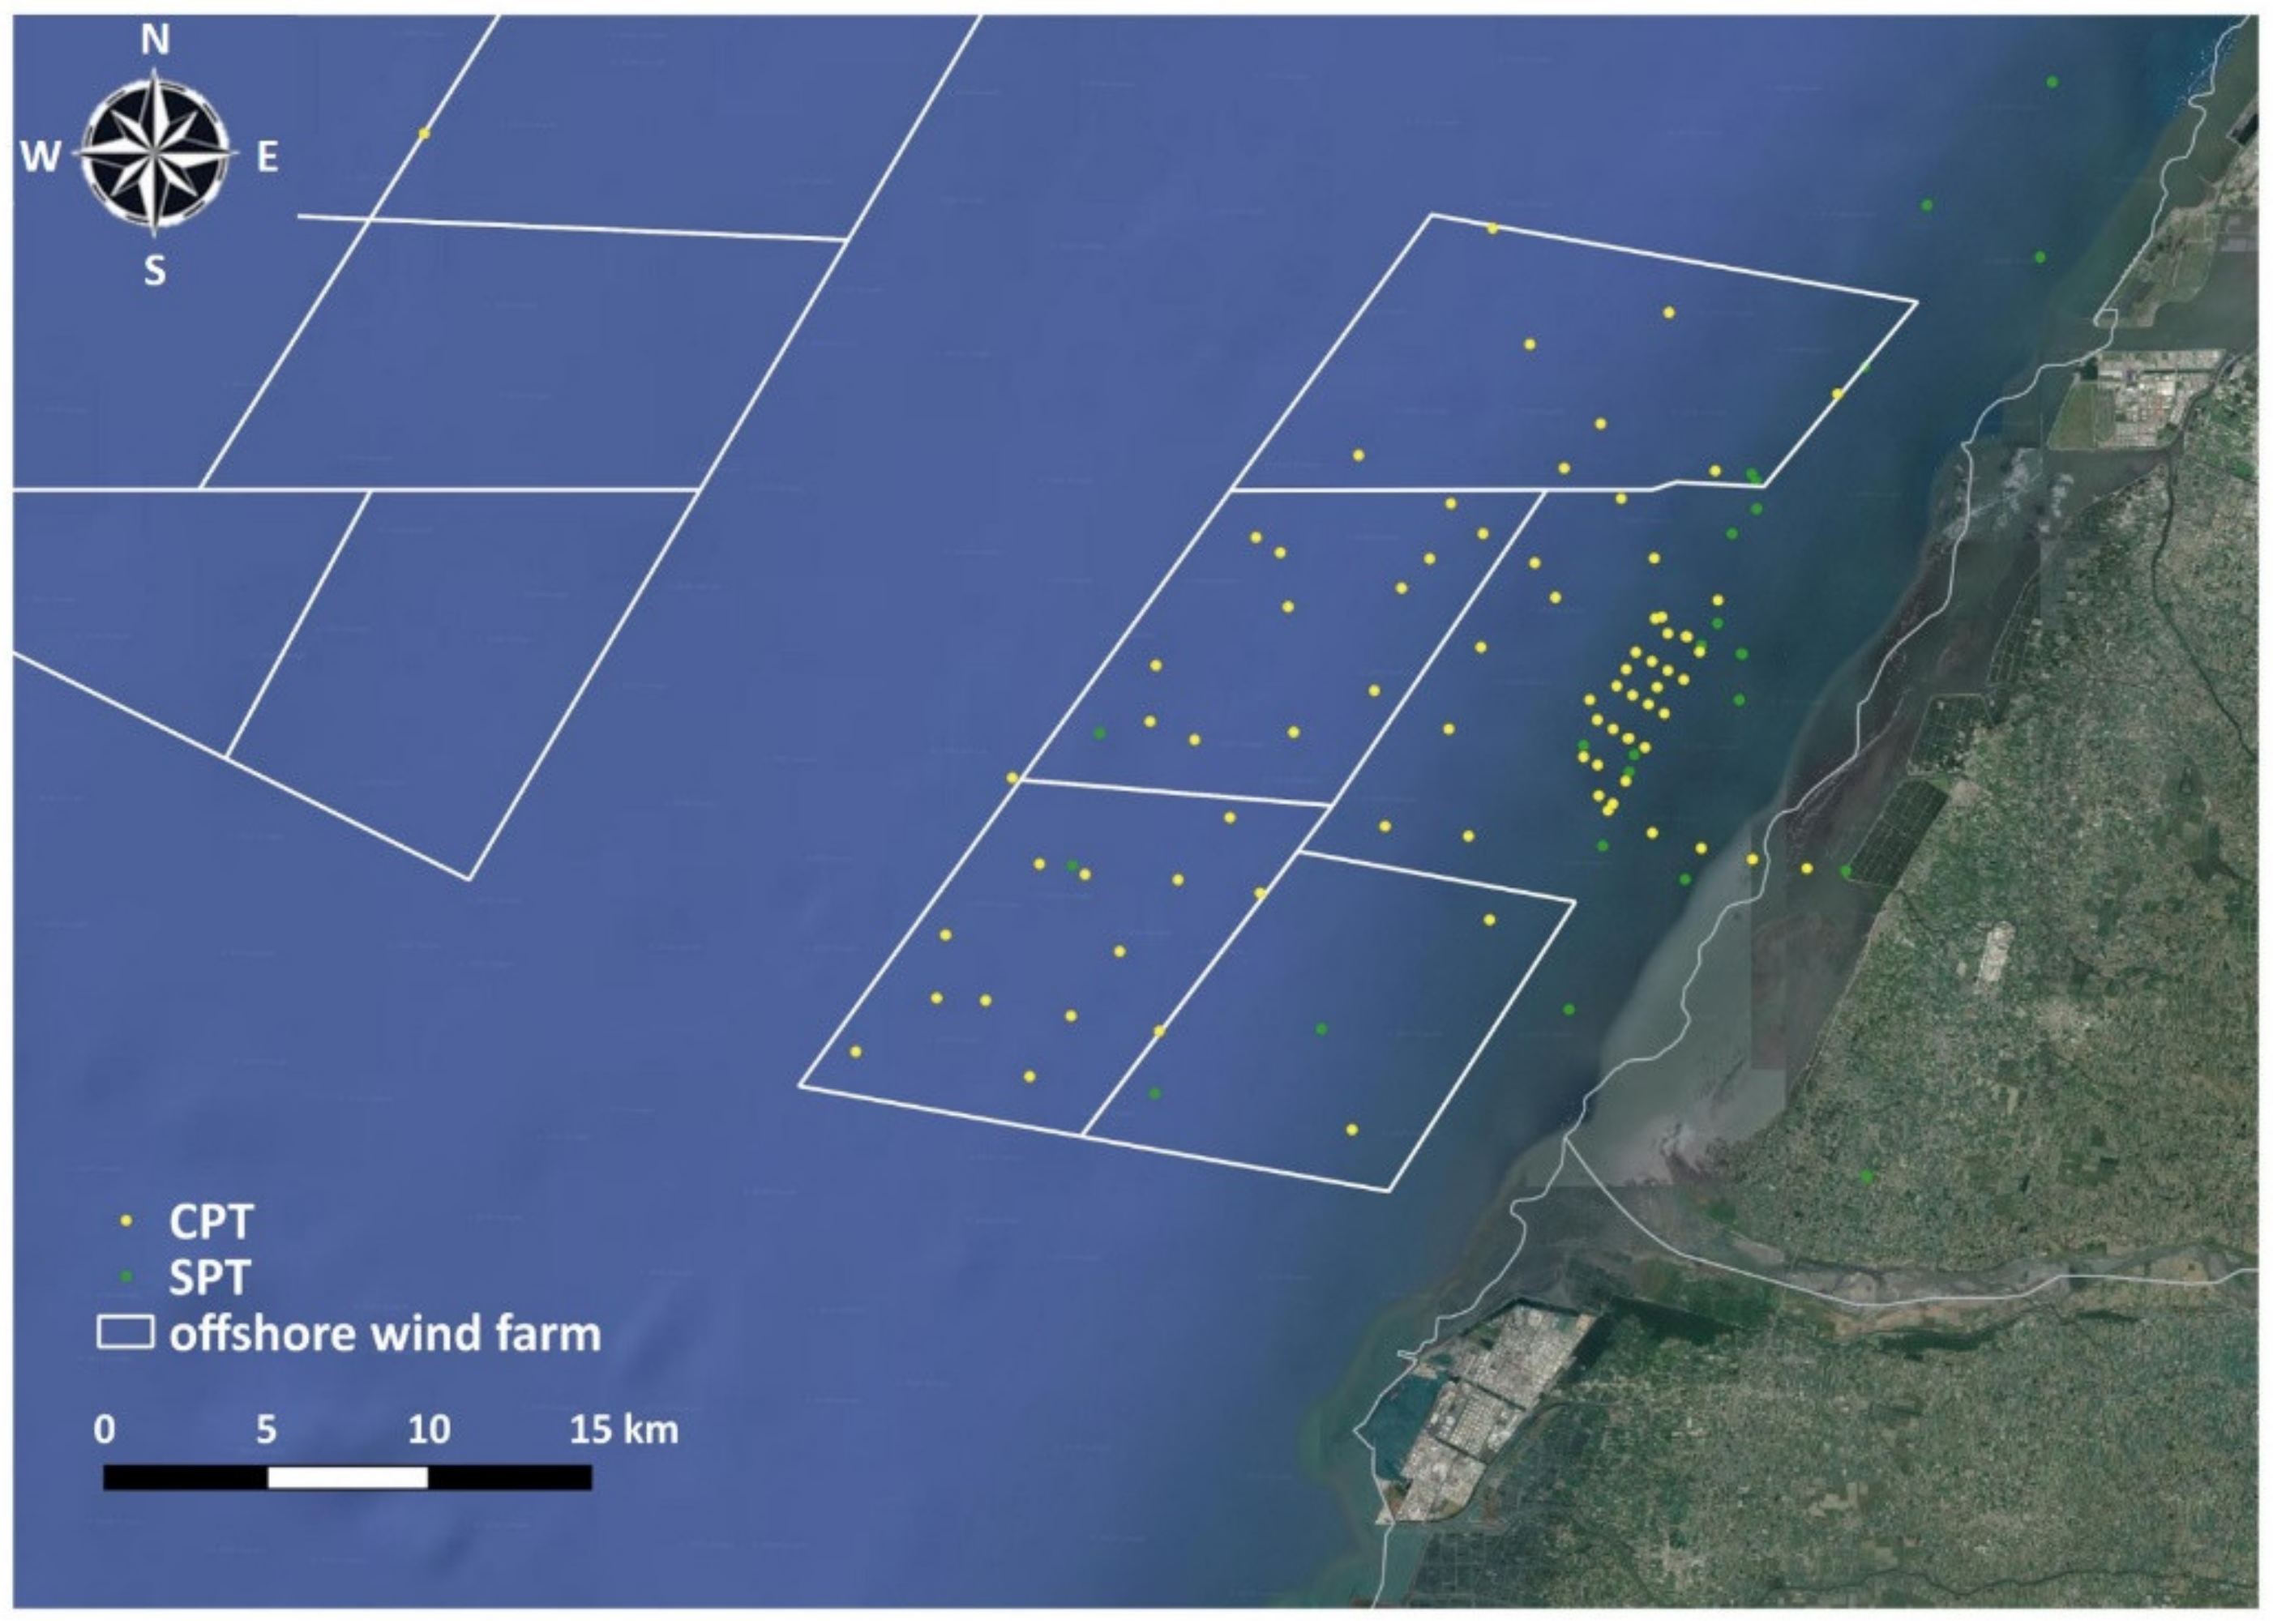
In order to identify the SPT–CPT correlation for the soils in Taiwan’s offshore wind farm, we collect a total of 27 SPT borehole data and 81 CPT borehole data from environmental impact assessment reports. The depth of an SPT borehole is around 80 m to 100 m. Most CPT boreholes have a depth of around 20 m; only a few CPT boreholes reach a depth of 100 m. The locations of SPT and CPT boreholes are shown in Figure 1.
For SPT site investigation, the Unified Soil Classification System (USCS) is often used to classify soil types. The soil is classified into 15 groups, and the main compositions of sediment in the Changhua offshore area are silty sand (SM), low-plasticity clay (CL) and low-plasticity silt (ML). In CPT surveys, the Soil Behavior Type (SBT) chart suggested by Robertson (2010) is mostly used to divide soil type into organic soils, clays, silt mixtures, sand mixtures, sands and gravelly sand to sand through the soil behavior type index Ic as shown in Table 1. According to the description of the soil behavior classification table, SBT Zone 2 to Zone 4 can be regarded as cohesive soil; SBT Zone 5 to Zone 7 can be regarded as cohesionless soil. Since most soil liquefaction cases have historically shown that cohesionless soil is more susceptible to liquefaction, we only analyze the soil liquefaction potential of soils in Zone 5 to Zone 7 from SBT.
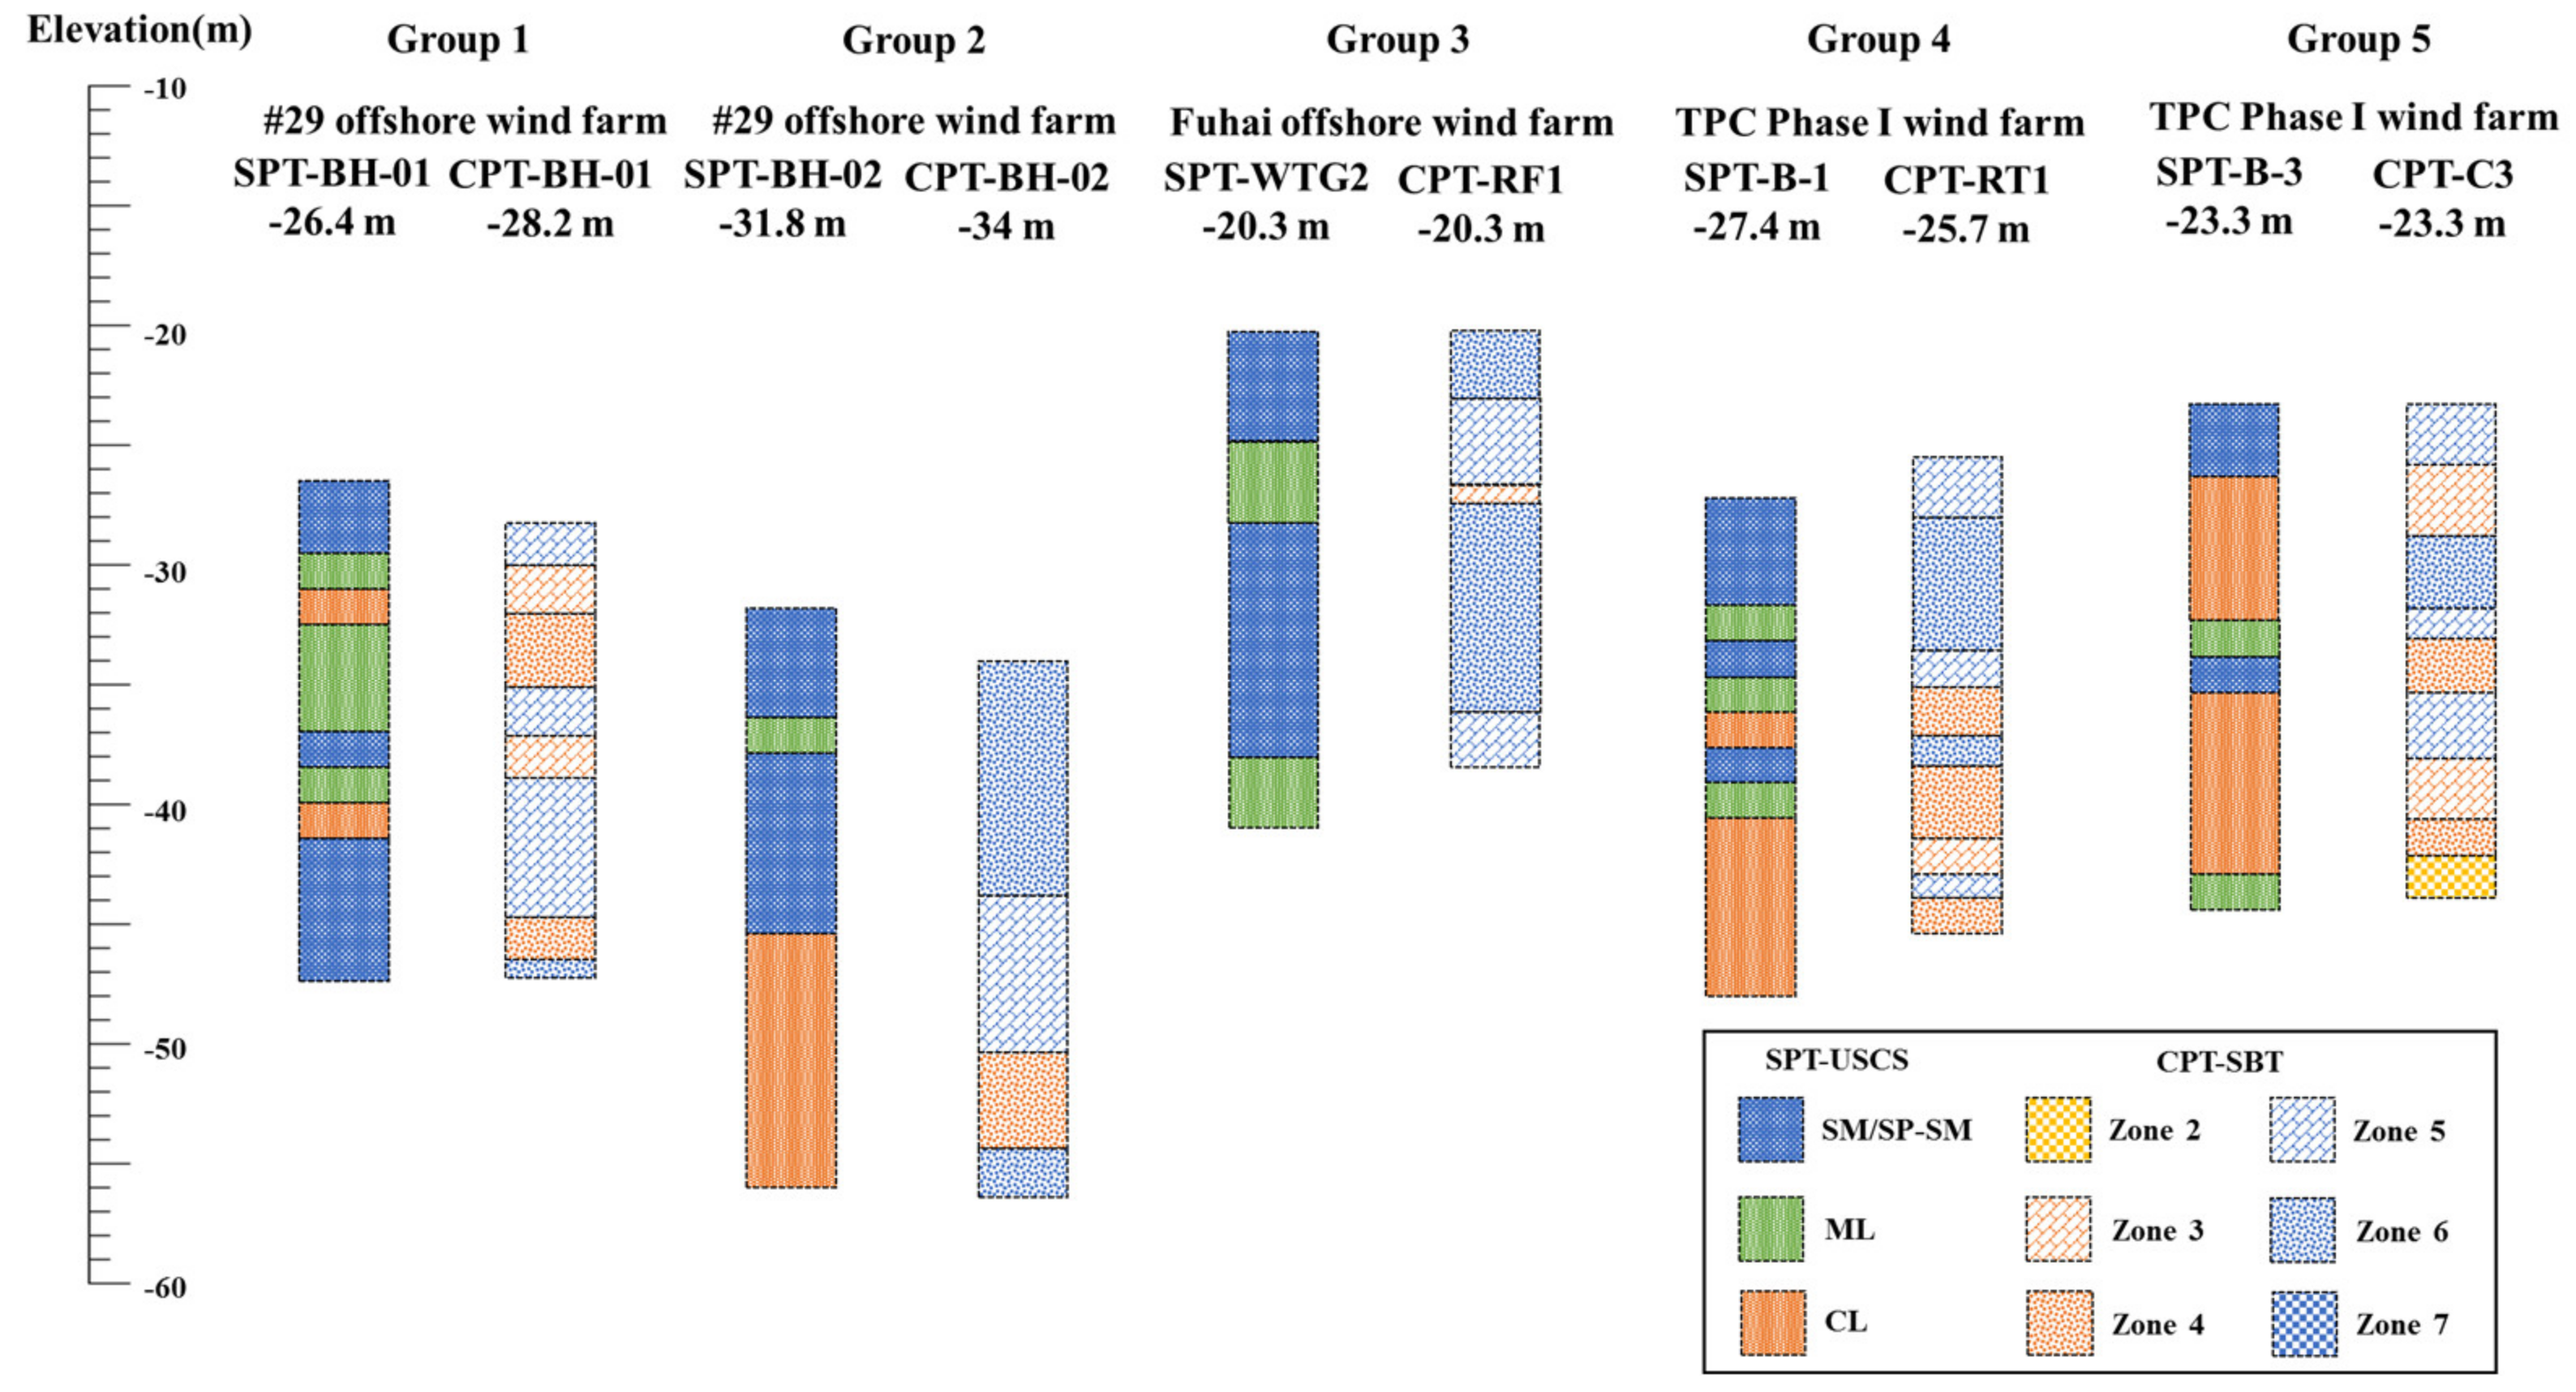
Generally, the correlation analysis between CPT and SPT for onshore soil is performed with boreholes in which the horizontal spacing between adjacent soundings are very close for a similar ground condition [34]. However, offshore borehole data are more rare and difficult to obtain; there are 5 groups of SPT and CPT adjacent boreholes within 30 m in the existing database, as shown in Figure 2. The SPT boreholes and CPT boreholes were created at different times. The spacing of adjacent boreholes in group 1 and group 2 was 10 m; the adjacent boreholes in group 3 were 28 m; the adjacent boreholes in group 4 were 7 m; the adjacent boreholes in group 5 were 13 m. The elevation of adjacent boreholes in the 5 groups changes due to sand wave movements and the elevation differences are all less than 3 m. The comparison of the soil profiles obtained from adjacent borehole in Figure 2 shows that the SPT and CPT is approximately consistent for sandy soil (SBT Zone 5–7 and SM) at surface seabed. However, there is no good correspondence between the clay layer and the silt layer due to the difference between the two classification systems and sampling rate.
2.2. Seismic Demand of Offshore Wind Farm in Changhua Area
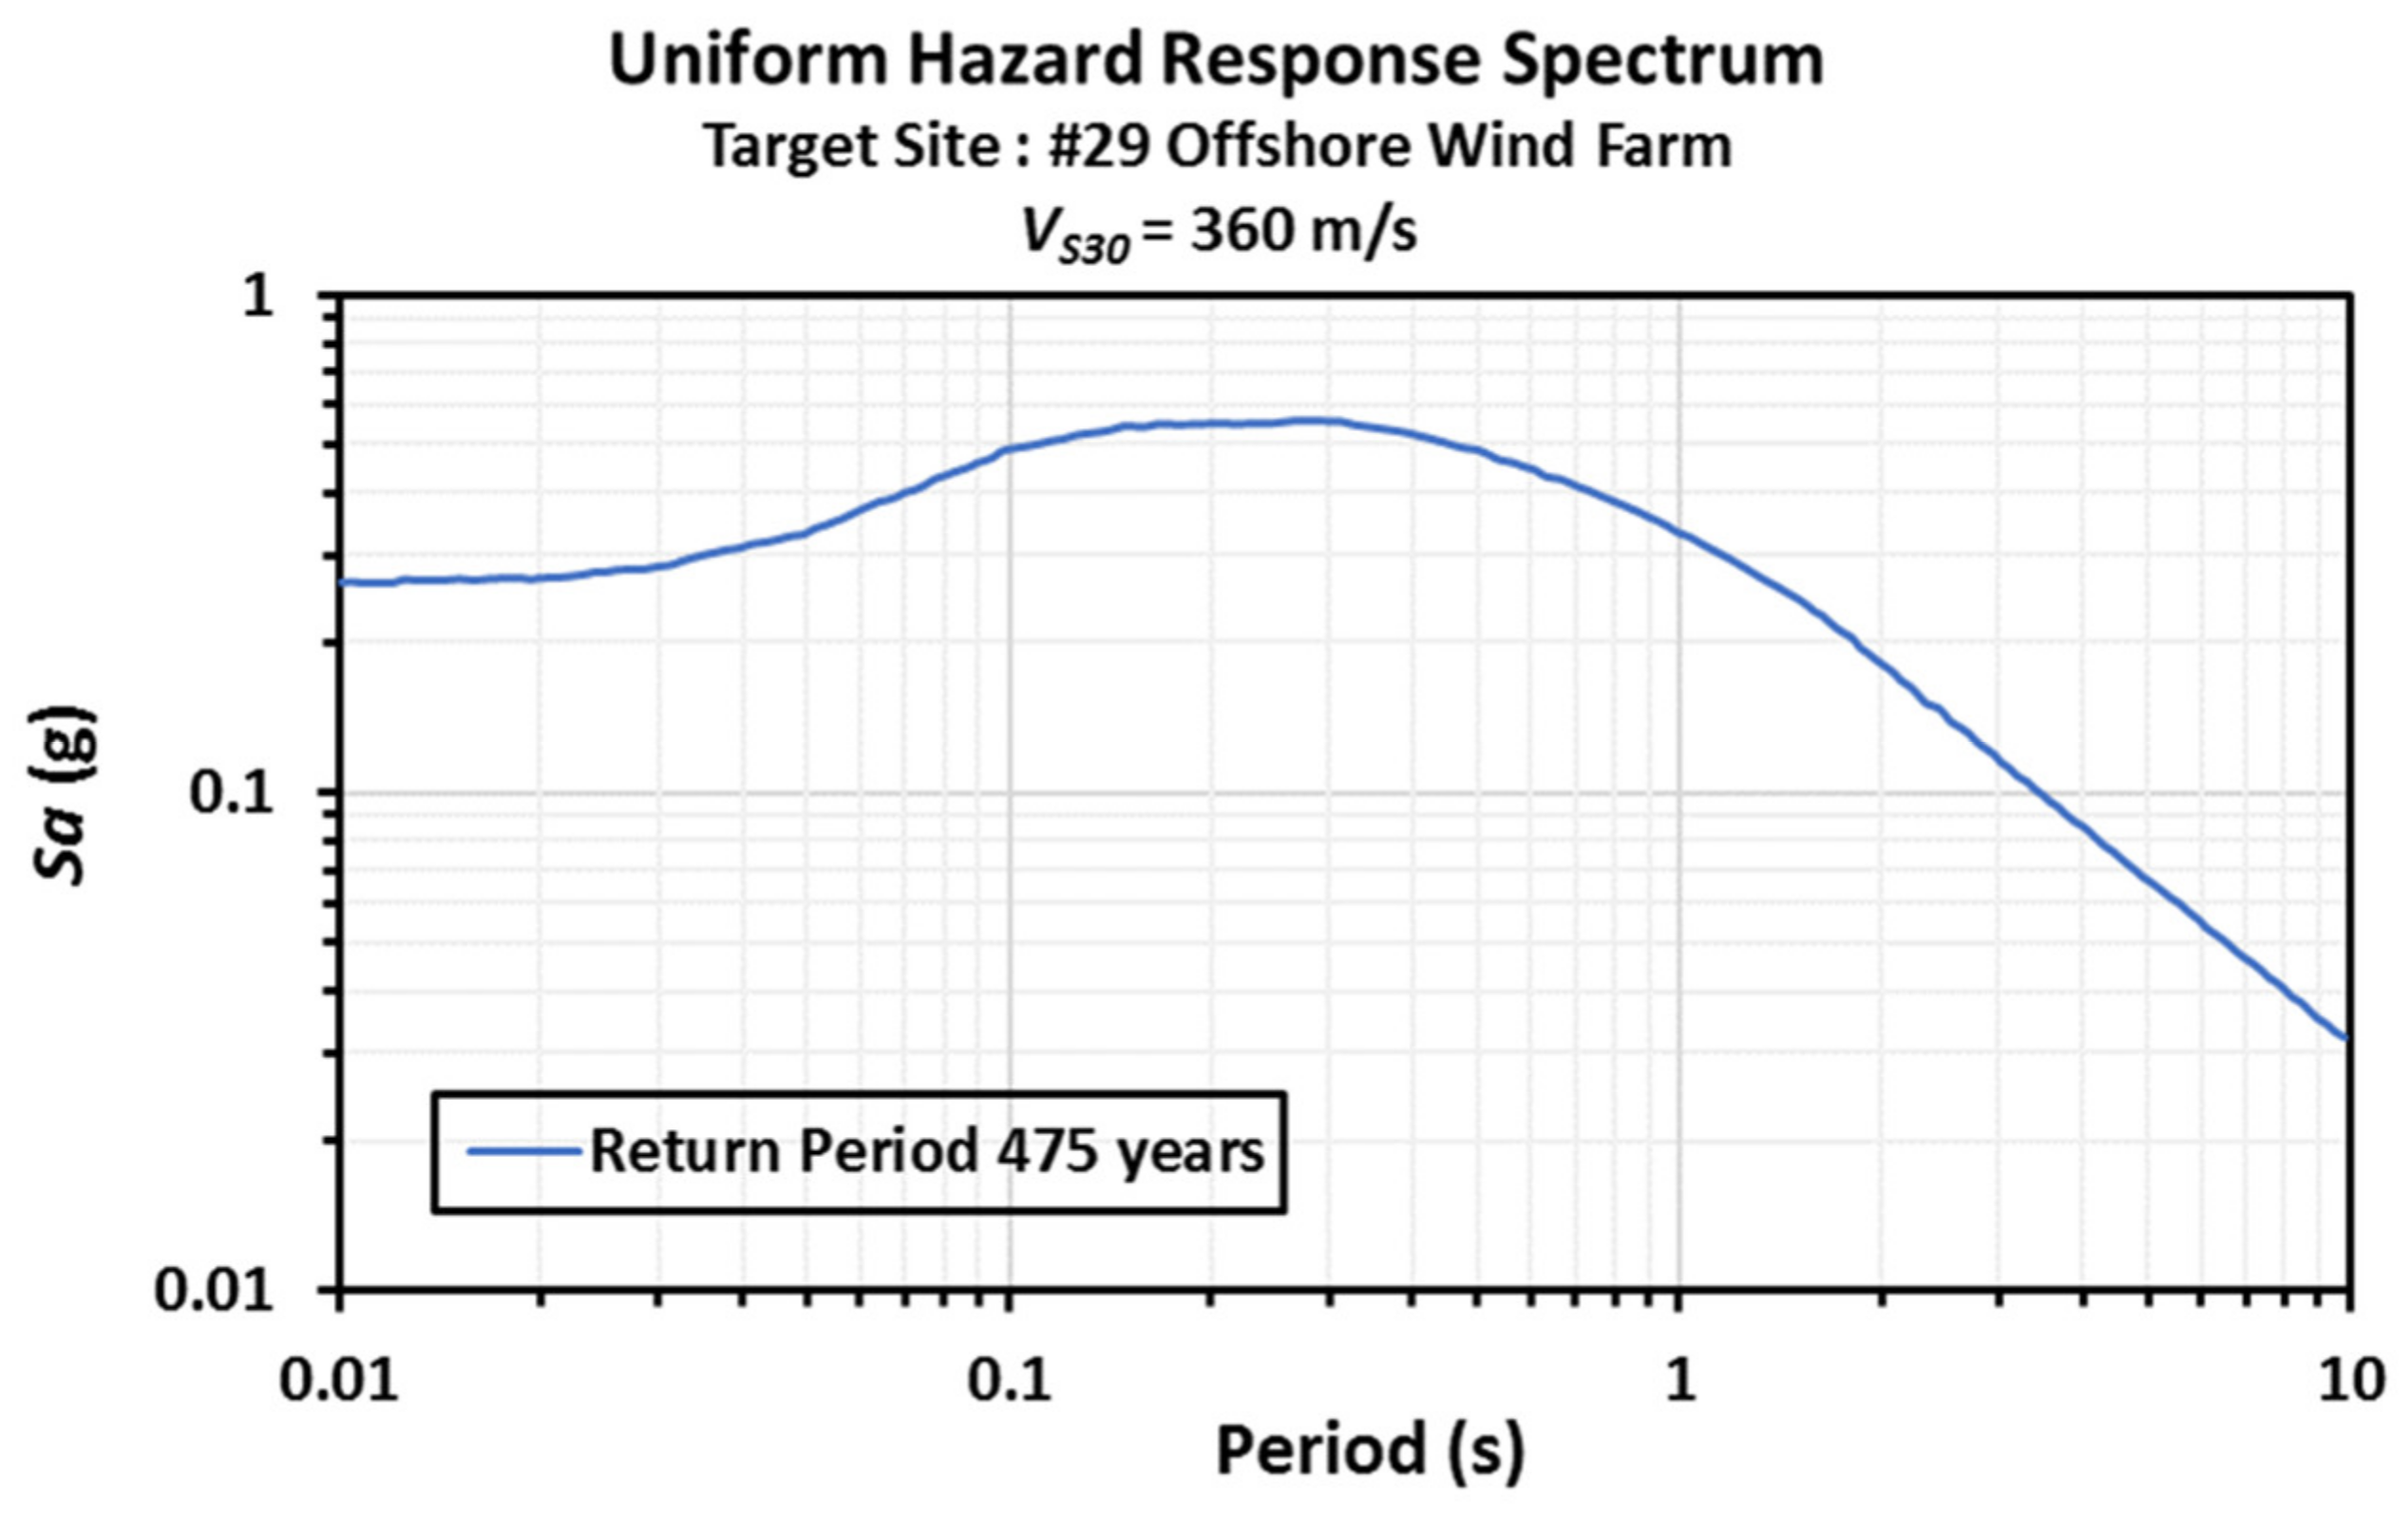
According to Appendix H of CNS15176–1, the design of seismic load must be carried out at each location, respectively [8]. We collect the seismic historical data around the worksite of the area with a radius of 320 km and determine the depth of engineering bedrock with VSD30 (the average shear velocity in 30 m) larger than 360 m/s. The design earthquake uses a 475-year return period with a 50-year exceedance probability of approximately 10%. The response spectra at the #29 offshore wind farm in the Changhua area are shown in Figure 3. The distance from the #29 offshore wind farm to all the boreholes in Figure 2 is within 14 km. The design seismic load of the #29 offshore wind farm is used to estimate the cyclic stress ratio (CSR) for the soil during the earthquake. Seismic ground response analysis has been carried out using DEEPSOIL software [35], and the CSR induced by design earthquake of each borehole in Figure 2 is quantified and introduced in the liquefaction potential analysis.
3. Simplified Empirical Method and Laboratory Tests for Evaluating Liquefaction Potential
The simplified procedure was established by numerous laboratory tests, field tests and liquefaction case history. Liquefaction resistance ratio CRR can be determined by the field test parameters, such as SPT-N, CPT-qc and shear wave velocity (Vs) with basic input data including the soil profiles, the water level of the groundwater, the median particle diameter D50 and the fine content FC. In addition, the periodic shear stress ratio CSR caused by the seismic load is mainly estimated by the peak ground acceleration in the seismic ground motion analysis. The factor of safety against soil liquefaction FL is defined as the ratio of the cyclic resistance ratio CRR to the cyclic stress ratio CSR, as expressed in Equation (1).
3.1. Soil Liquefaction Simplified Procedure
The SPT-based simplified procedure presented in Taiwan’s Seismic Design Specification and Commentary of Buildings Code is a revised method referring to the Japan Road Association (1996) based on the experience of the earthquake on 21 September in 1999 (known as the 921 Earthquake), Taiwan. The τmax in Equation (2) for calculating CSR can be determined by ground motion analysis. The relationship between CRR and SPT-N is determined through liquefaction case history onshore and cyclic triaxial test results of undisturbed frozen samples. The Japan Road Association defines the dynamic triaxial strength RL by summarizing cyclic stress ratios according to a total of 20 cycles of loading for tested samples (considering the earthquake magnitude 7.5–8.0). The simplified procedure suggested that RL can be evaluated by the SPT-N, unit weight and fine content. If RL needs to be converted to the site conditions CRRfield, the correction coefficient cw can be determined based on the type of earthquake (interplate earthquake or epicentral earthquake) as shown in Equation (3), since most earthquakes in Taiwan are interplate earthquakes. The value of cw can be determined with the Japan Road Association (2002) “Design specifications of highway bridges, Part V seismic design” [36] for interplate earthquakes in Taiwan as 1, which means that RL is equal to the CRRfield.
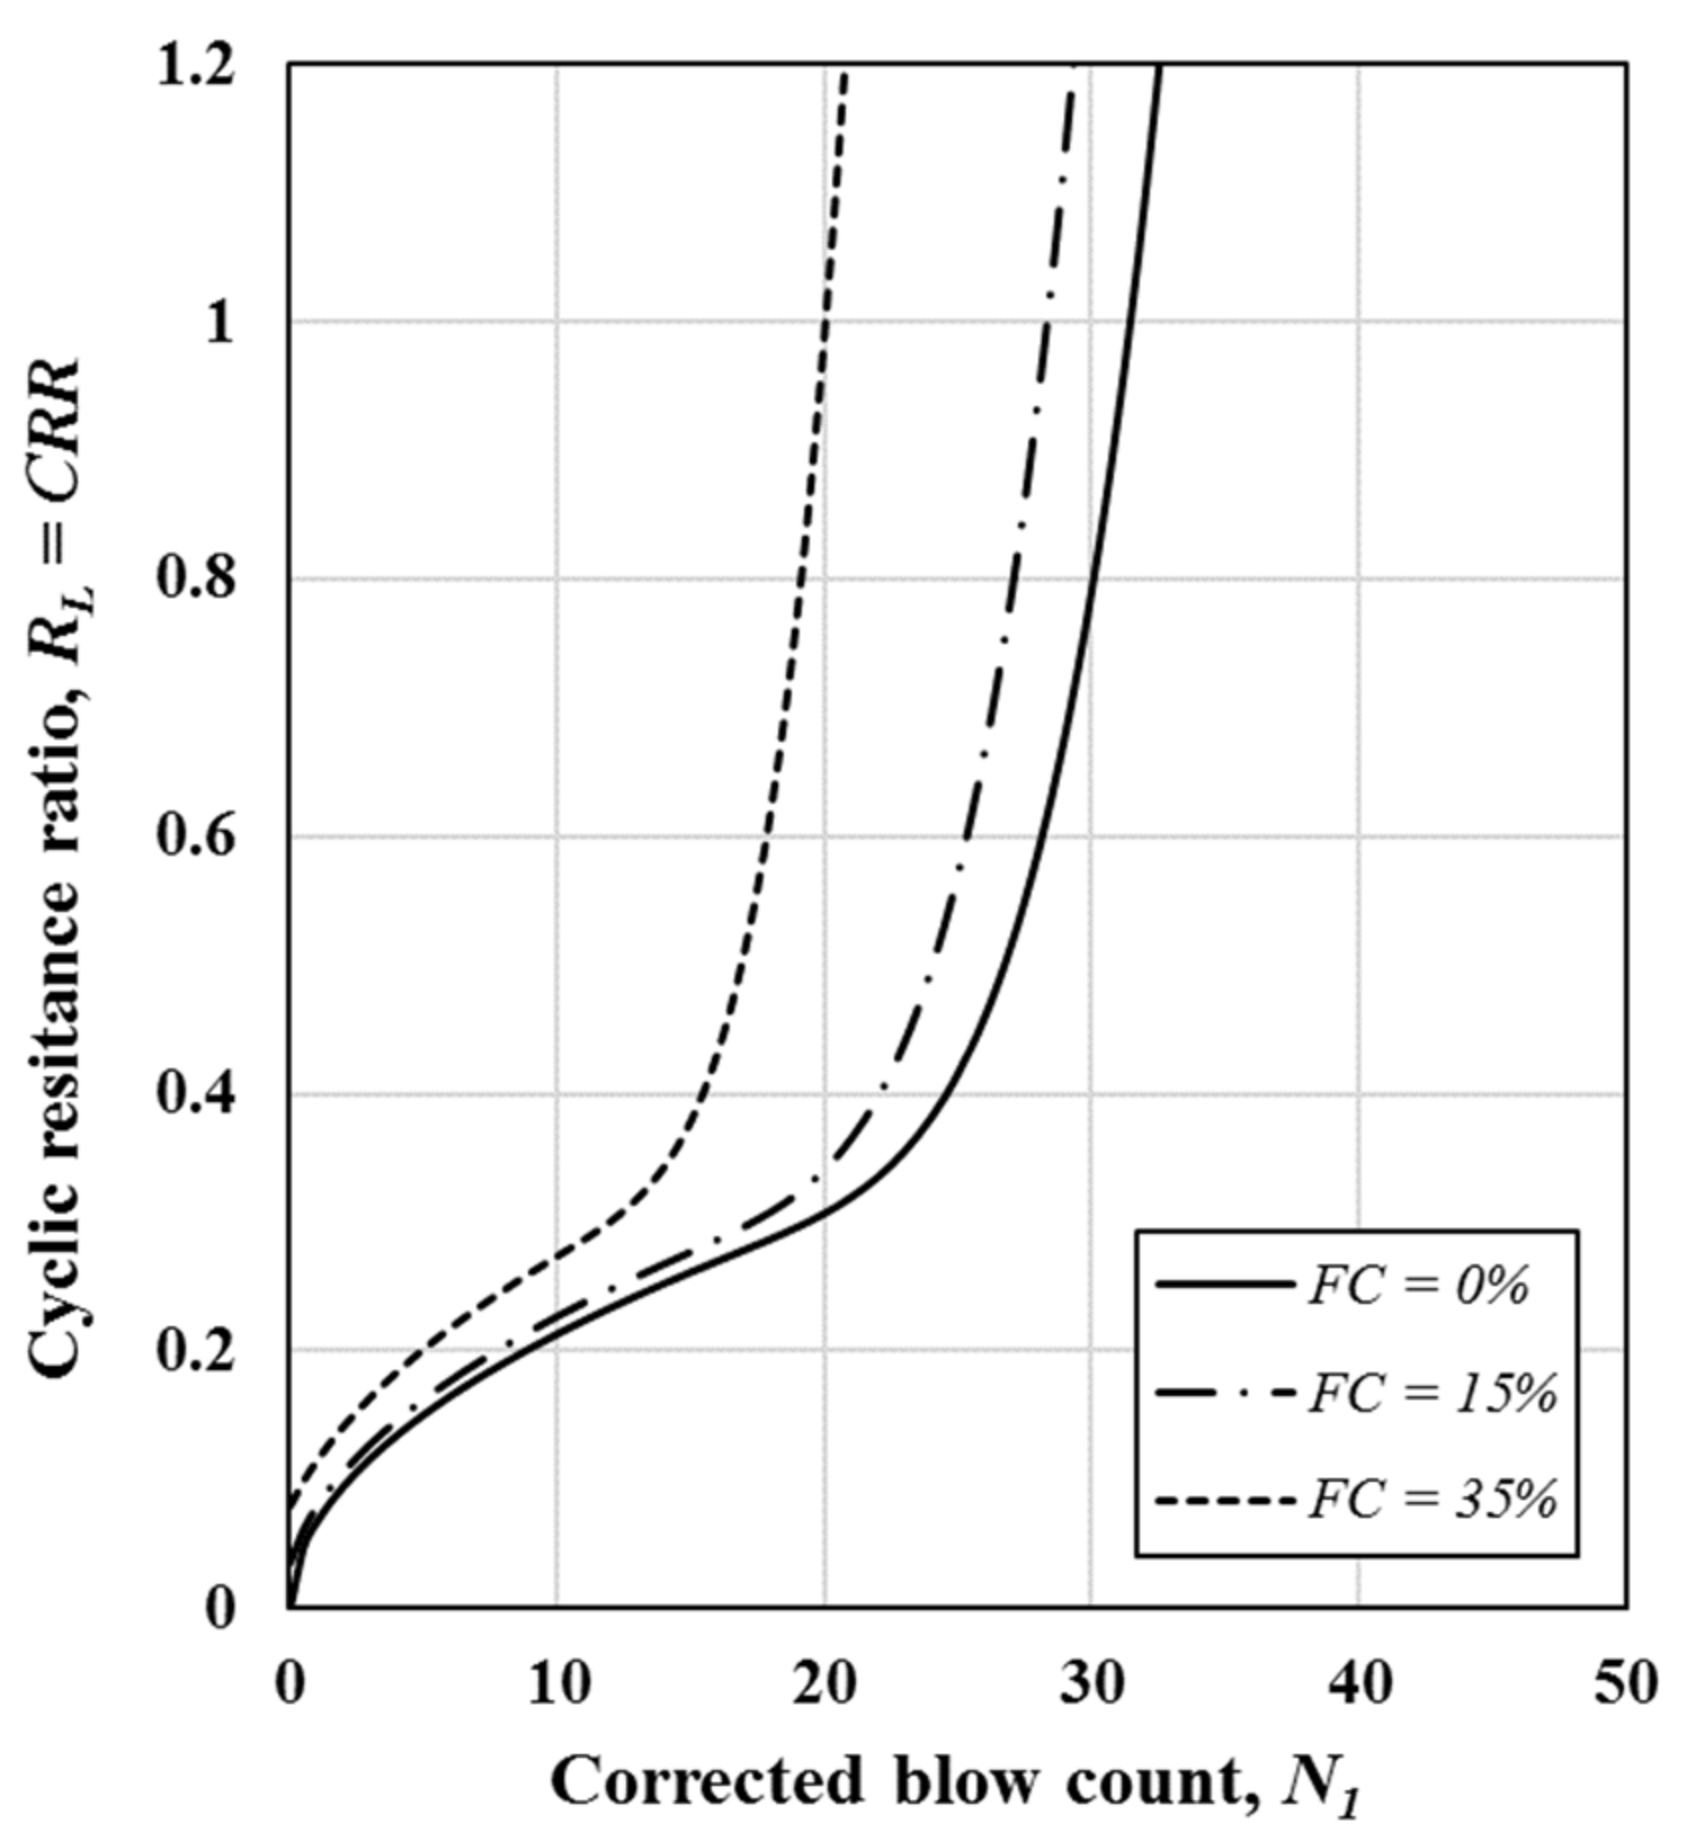
Dynamic triaxial resistance RL can be evaluated by the SPT-N and the fine content FC (%) as Equation (4) to Equation (8), where Na is the corrected SPT-N considering the overburden stress and FC, N1 is the corrected SPT-N considering the overburden stress, and c1 and c2 are the correction coefficients for FC. In Figure 4, the cyclic resistance ratio CRRfield increases with fine content for a given corrected blow count N1.
The CPT-based simplified method proposed by Robertson (2009) is often used to evaluate soil liquefaction potential in engineering. The τmax in Equation (9) for calculating CSR are also estimated by ground motion analysis. Seed (1975) suggested that a factor of 0.65 peak cyclic stress ratio should be used to convert an irregular time series to equivalent uniform cycles NL, and an earthquake magnitude of 7.5 is equivalent to 15 cycles [37]. The CRR suggested by Robertson (2009) needs to classify the soil types into sand-like material (Ic ≤ 2.50), the transition region (2.50 < Ic < 2.70) and clay-like material soil (Ic ≥ 2.70). The CRR of sand-like material and transition region can be calculated by Equation (10) to Equation (13), where Kc is the grain characteristics correction factor, Qtn is the normalized cone penetration resistance, Fr is the friction ratio.
For an earthquake with a magnitude of 7.5, the CRR of the sand-like material and transition regions can be calculated by Equation (10). Qtn are modified to the normalized cone penetration resistance of clean sand as Qtn,cs by multiplying with Kc. Correction factor Kc can be determined by Equation (12) and Equation (13) for the soil with Ic < 2.70.
- Sand-like material (Ic ≤ 2.50)
- 2.
- Transition regions (2.50 < Ic < 2.70)
3.2. Cyclic Laboratory Tests and Results Analysis
The cyclic triaxial test and cyclic simple shear test are generally used to investigate the soil resistance to liquefaction; the mechanisms of these two tests simulate the different cyclic seismic loads on the soil [38,39]. Pyke et al. (1975) suggests that the shear stress generated by the earthquake comes from various directions; it is different from the unidirectional load given in the laboratory test, which causes the pore water pressure more easily to be generated [40]. Seed et al. (1975) suggested that the CSR of the soil layer during an earthquake event is 10% less than that of CSRfield compared to the test results [41].
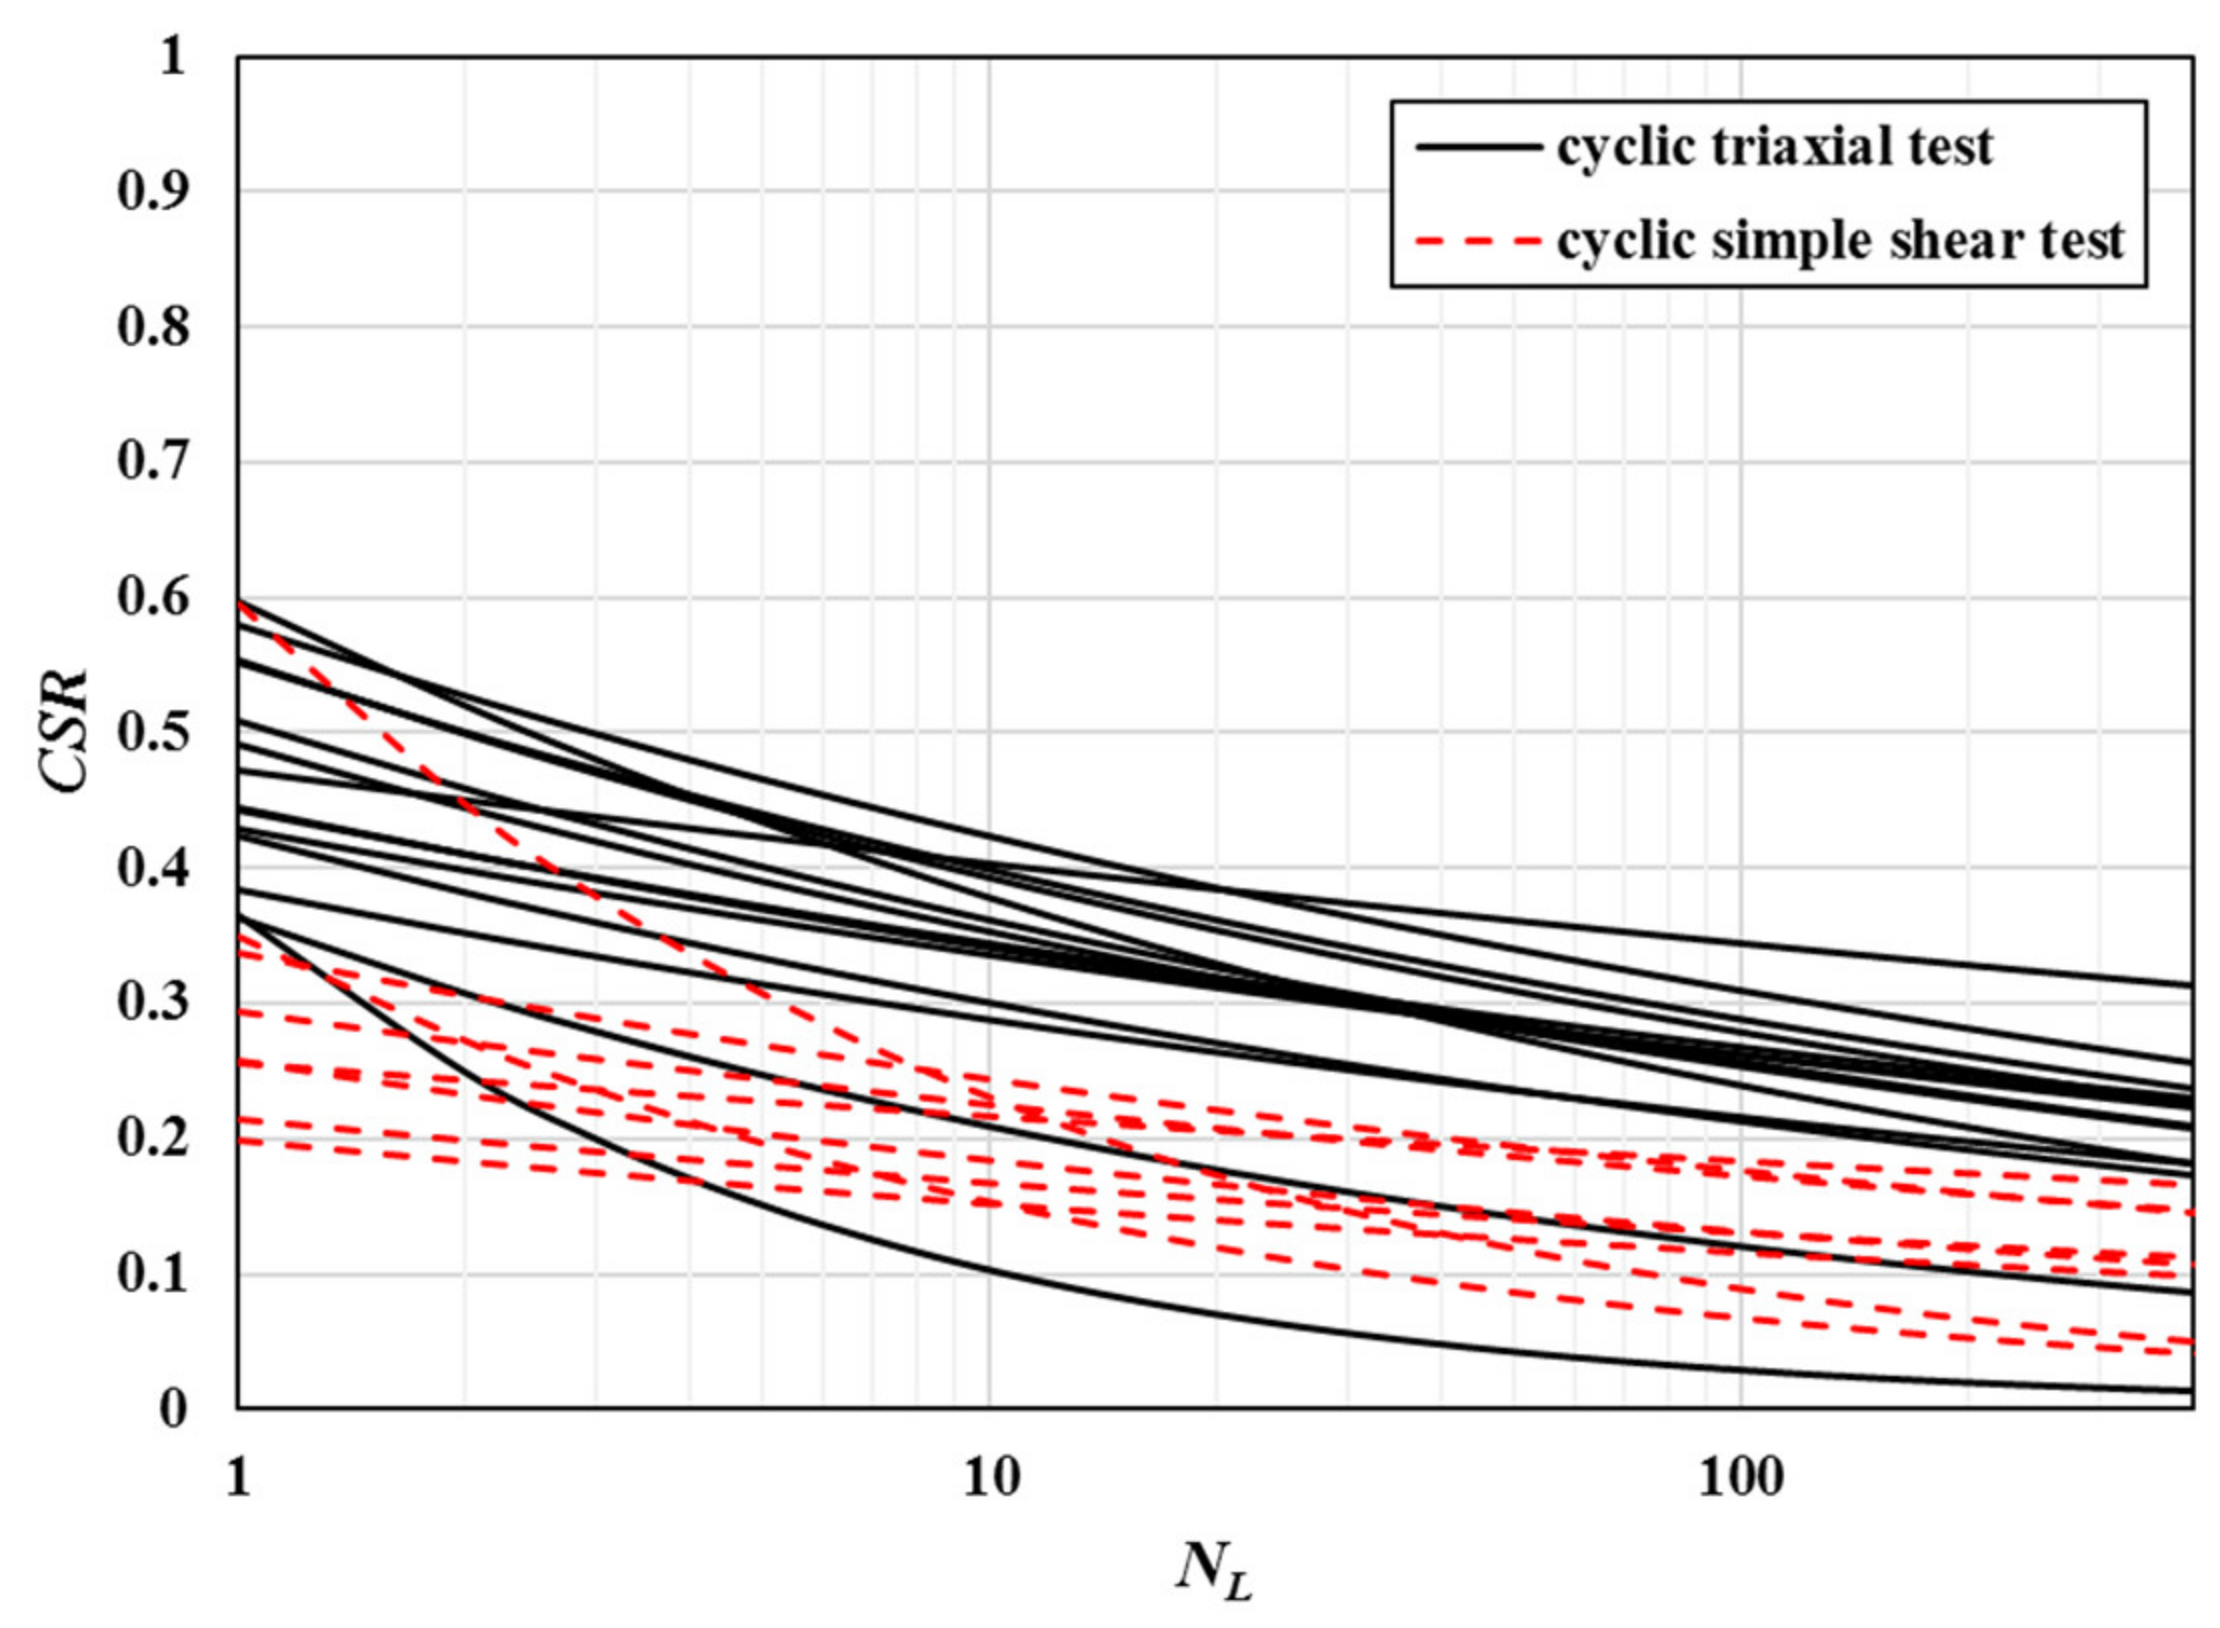
This study collects laboratory test reports of offshore wind farms in Taiwan, including 14 cyclic triaxial test results with SPT test sampling and eight cyclic simple shear test results with CPT test sampling. The laboratory of “initial liquefaction” triggering criteria has often been defined as an excess pore water ratio (ru) equal to 1.0 or a soil specimen reaching a certain level of strain. This study refers to the Japan Road Association’s suggestion that the initial liquefaction occurs when the axial strain double amplitude reaches 5% for the triaxial test and the equivalent shear strain double amplitude reaches 7.5% for the simple shear test. We use the relationship of CRR (the cyclic stress ratio required to cause liquefaction) and NL (Equation (15)) proposed by Idriss and Boulanger (2008) [42] to establish the resistance curve, as shown in Figure 5. NL is the number of cycles when soil is under initial liquefaction conditions under a given cyclic stress ratio, and NL can be obtained from cyclic triaxial tests or cyclic simple shear tests. Since the SPT-based method proposed by JRA is established through the cyclic stress ratio required to cause liquefaction after 20 cycles in cyclic triaxial tests, there is no need for conversion before comparing the CRR from the simplified procedures and laboratory test results.
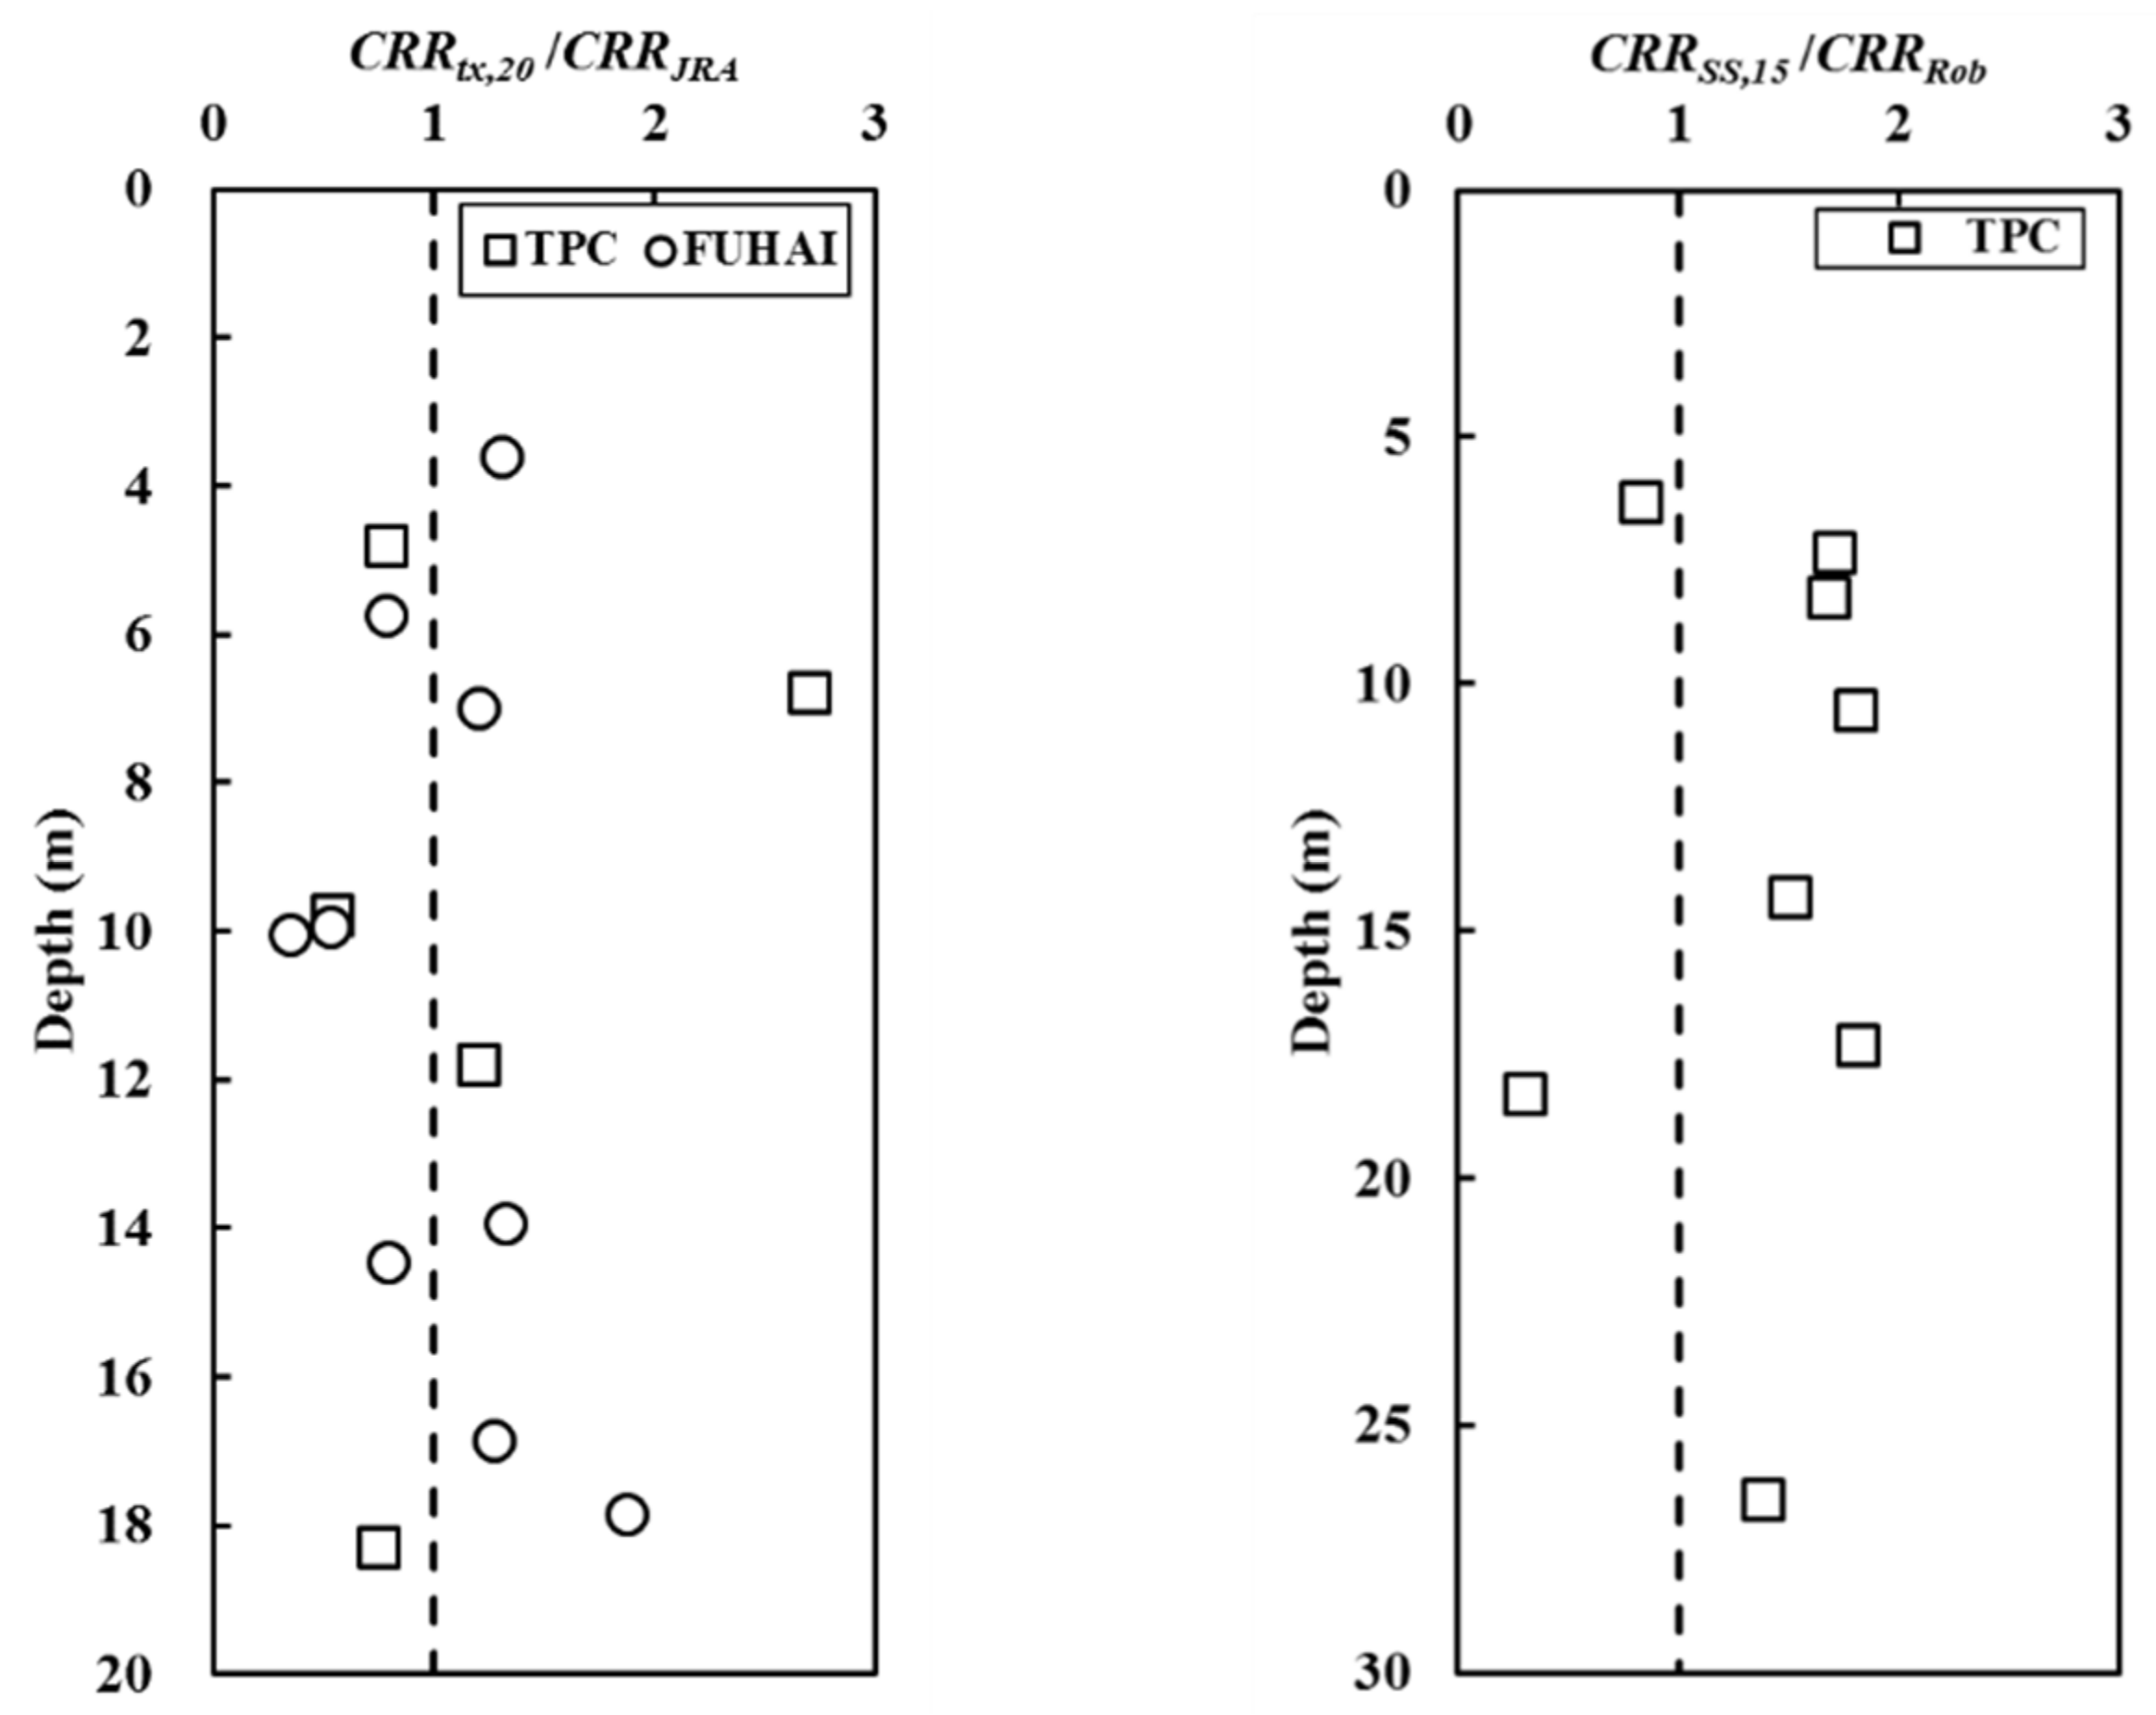
The comparison results are shown in Figure 6 left. The cyclic stress ratio corresponding to 15 cycles CRRSS,15 (equivalent of magnitude 7.5) can be obtained by the resistance curve from the results of the cyclic simple shear test and by referring to Equation (14), modified with the site’s seismic conditions. The comparison of the CRRSS,15 and CRRRob is shown in Figure 6 right.
The comparison between the simplified procedures and the laboratory test results shows that the ratio of CRRtx,20/CRRJRA is between 0.7 and 1.3, and the ratio of CRRSS,15/CRRRob is between 1.3 and 1.8. The CRRRob evaluated by Robertson (2009) is mostly lower than the results of the cyclic simple shear test. Figure 6 shows that the evaluation results of the JRA method display a relatively minor difference from the laboratory test results. To match with the CPT data for offshore wind farm development, this paper proposes a hybrid method that incorporates the SPT–CPT correlation into the JRA method.
4. Hybrid CPT-Based Soil Liquefaction Simplified Method
4.1. SPT–CPT Correlation
Normalized cone resistance (qc/Pa) and an efficiency of 60% hammer energy SPT-N60 are often used for the correlation of CPT-qc and SPT-N. The medium particle diameter D50 or fine content, FC, are used as the relevant correction parameters [43,44]. However, the grain characteristic is not available in CPT. Therefore, a direct relationship based on CPT was proposed by Robertson et al. (1986) through the soil classification chart corresponding to the (qc/Pa)/N60 ratio [45]. Lunne et al. (1997) modified the SPT–CPT correlation of Jefferies & Davies (1993) based on the soil classification chart of Robertson (1990) [46,47], as shown in Equation (16). Robertson (2012) noted that the correlation suggested by Lunne et al. (1997) is suitable for most soil, but the result N60 for low-sensitivity clays in North America is underestimated, so an updated correlation is proposed as Equation (17) [48]. However, the SPT procedure and equipment still have some problems associated with its repeatability and reliability, especially relating to the energy efficiency of the hammer–anvil–operator system affecting the SPT results. Taiwan’s registered professional engineers are still familiar with soil liquefaction analysis for offshore wind farms with SPT-based methods. It is desirable to refer to the SPT-based method when using CPT data to carry out a soil liquefaction susceptibility analysis.
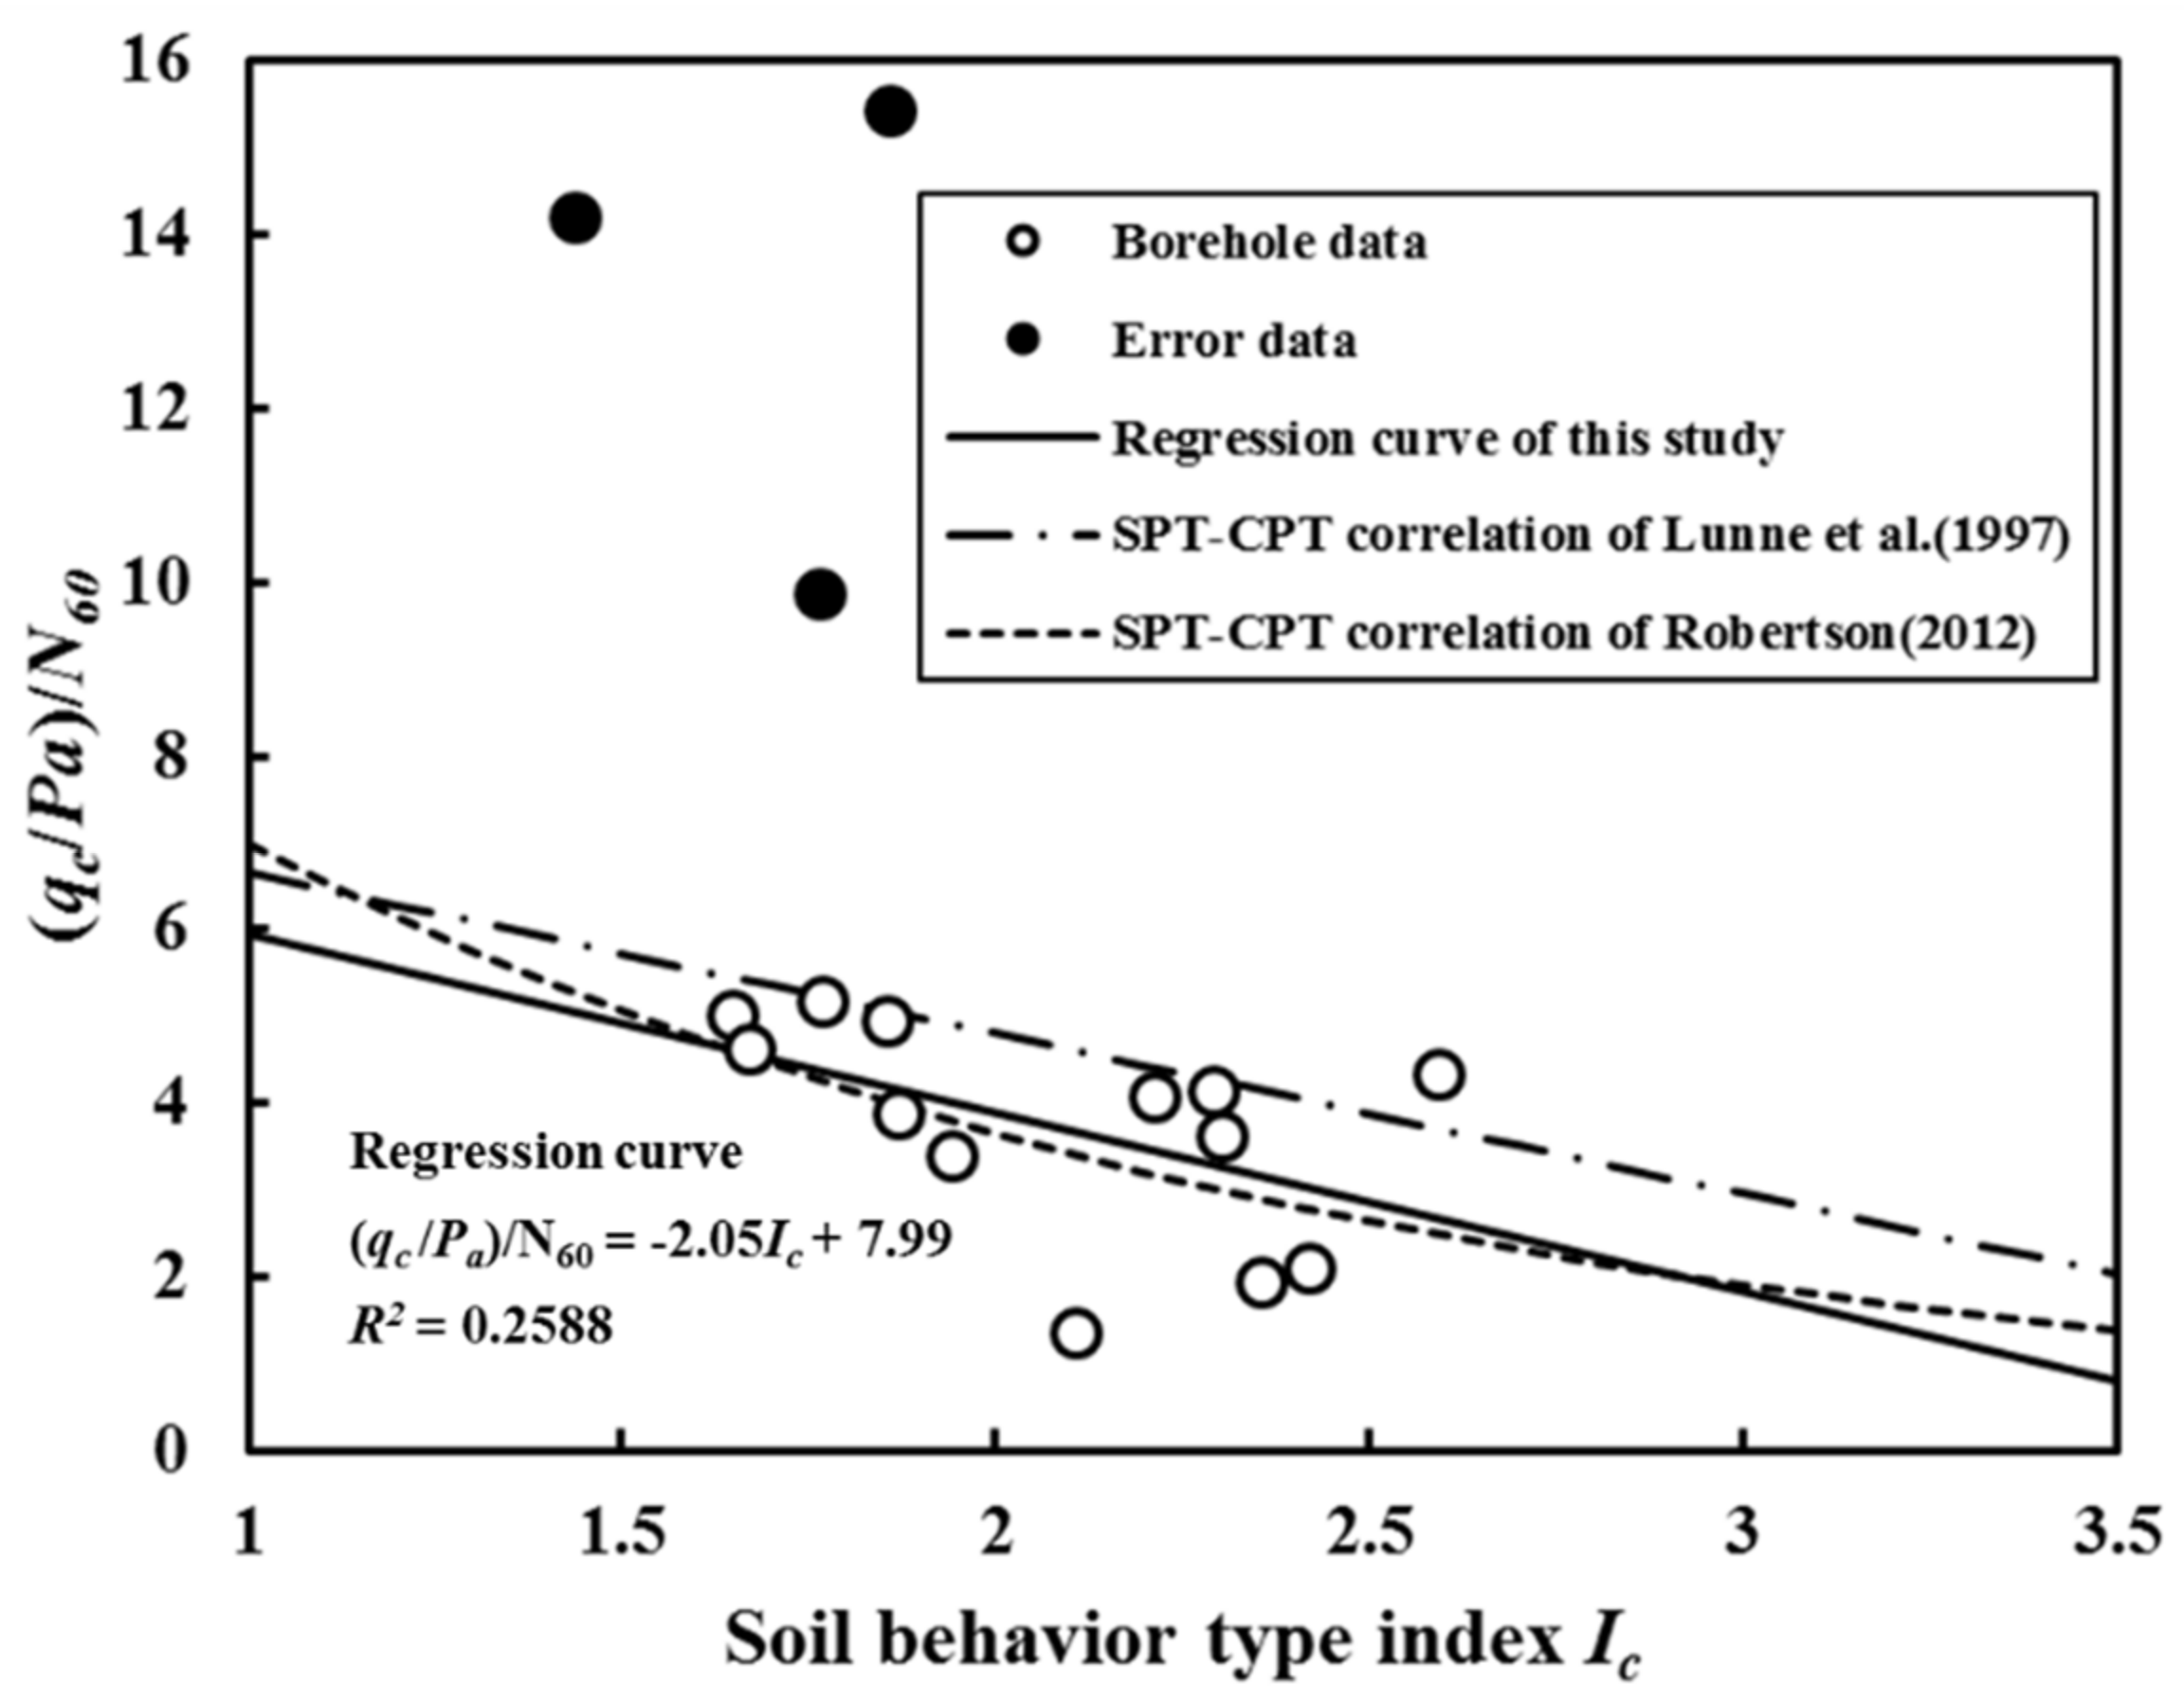
We use the cohesionless soil data of adjacent boreholes in Figure 2 to establish the relationship between SPT and CPT with the suggested formula of Lunne et al. (1997) The SPT–CPT correlation of the Changhua offshore wind farm is shown in Figure 7. The circular marks represent cohesionless soil data, and the solid circles are not considered in the correlation. The overburden stress directly affects the correlation between the qc and N60. The solid circles are the data of shallow deposits; the changes in seabed topography between the adjacent SPT boreholes and CPT boreholes has a strong influence on the test results. It is worth noting that the SPT–CPT correlation in Figure 7 is based on Changhua cohesionless soils with a depth of within 20 m, limitations which should be considered in practical applications.
4.2. The Influence of Fine Content on the Analysis Results of Soil Liquefaction Potential
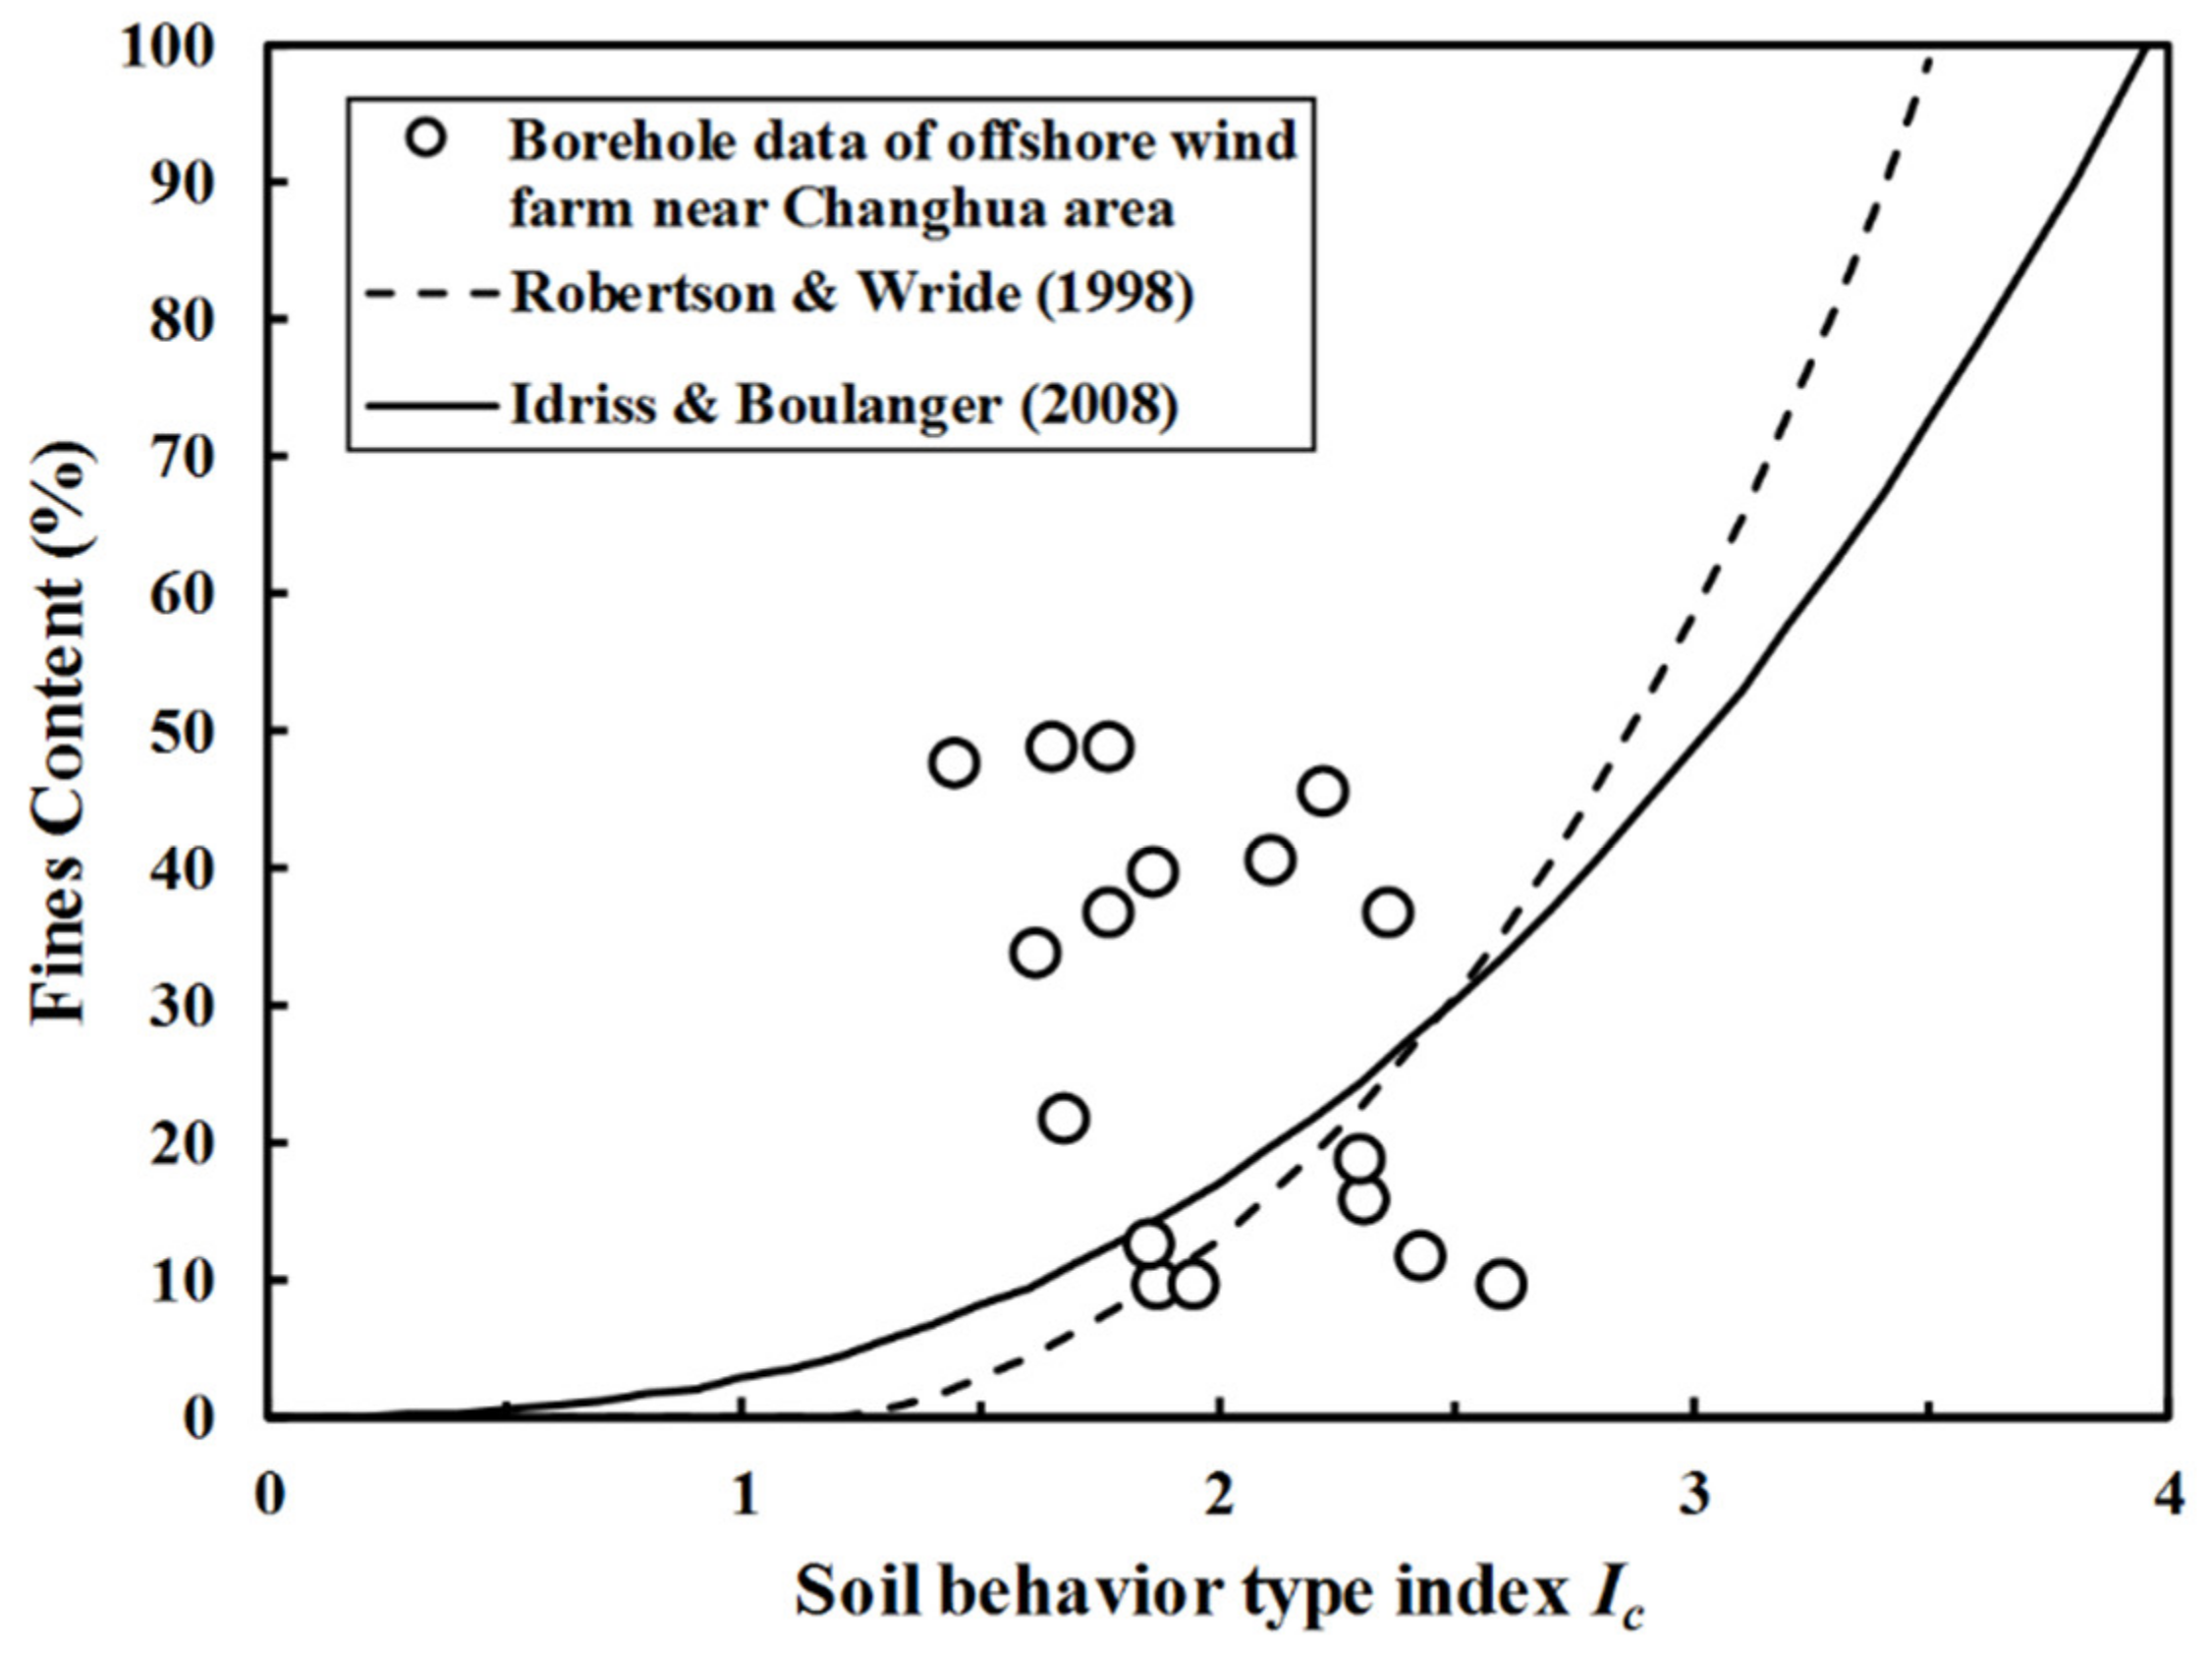
The fine content, FC, is an important parameter in the soil liquefaction simplified procedure for correction of the clean sand resistance curve. Robertson & Wride (1998) and Idriss & Boulanger (2008) have proposed a formula to estimate FC from field CPT parameters. The SBT index Ic is the most relevant parameter [19,42]. Figure 8 shows that there is no obvious relationship between the FC and Ic for the cohesionless soil data of adjacent boreholes of SPT and CPT; this result is consistent with Ku (2001) and Huang et al. (2009) found in Taiwan onshore areas [49,50]. The Ic index may not be a perfect parameter for capturing the grain characteristics (fine content), especially for the intermediate soil conditions (silty sands–sandy silt) and layered deposits [51,52,53,54]. The layered deposits are found in the five groups’ boreholes shown in Figure 2. The FC may not be predicted accurately by the Ic index. In Figure 8, the FC of most cohesionless soils in the Changhua area is higher than the estimated value suggested by Robertson & Wride (1998). In the simplified procedures, CRR increases with FC, and a lower FC may lead to underestimated CRR, which is also consistent with the analysis results shown in Figure 5. Therefore, the measured FC from the SPT borehole adjacent to the CPT borehole at the Changhua offshore wind farm is used in the hybrid method for liquefaction analysis.
4.3. Soil Liquefaction Potential Estimated by Hybrid Method
The JRA method clearly defines the depth of soil liquefaction analysis as 20 m beneath the ground surface for saturated soil, and the soil parameters, such as FC, plasticity index IP and median particle diameter D50, need to be considered in the soil liquefaction analysis. It is difficult to obtain the physical properties of soil when conducting an offshore soil investigation with CPT. Moreover, the SBT classification presented by the CPT soil classification method does not correspond well with the USCS. It is difficult to determine the soil conditions from the CPT classification while carrying out the JRA method combined with CPT parameters. Robertson (2009) and Boulanger & Idriss (2014) collected past liquefaction case history [21,55]. Most of the case history showed that the liquefied layer has a soil behavior type index Ic of less than 2.60; therefore, this criterion (Ic > 2.60) is used in the hybrid method to determine the non-liquefied soil layer.
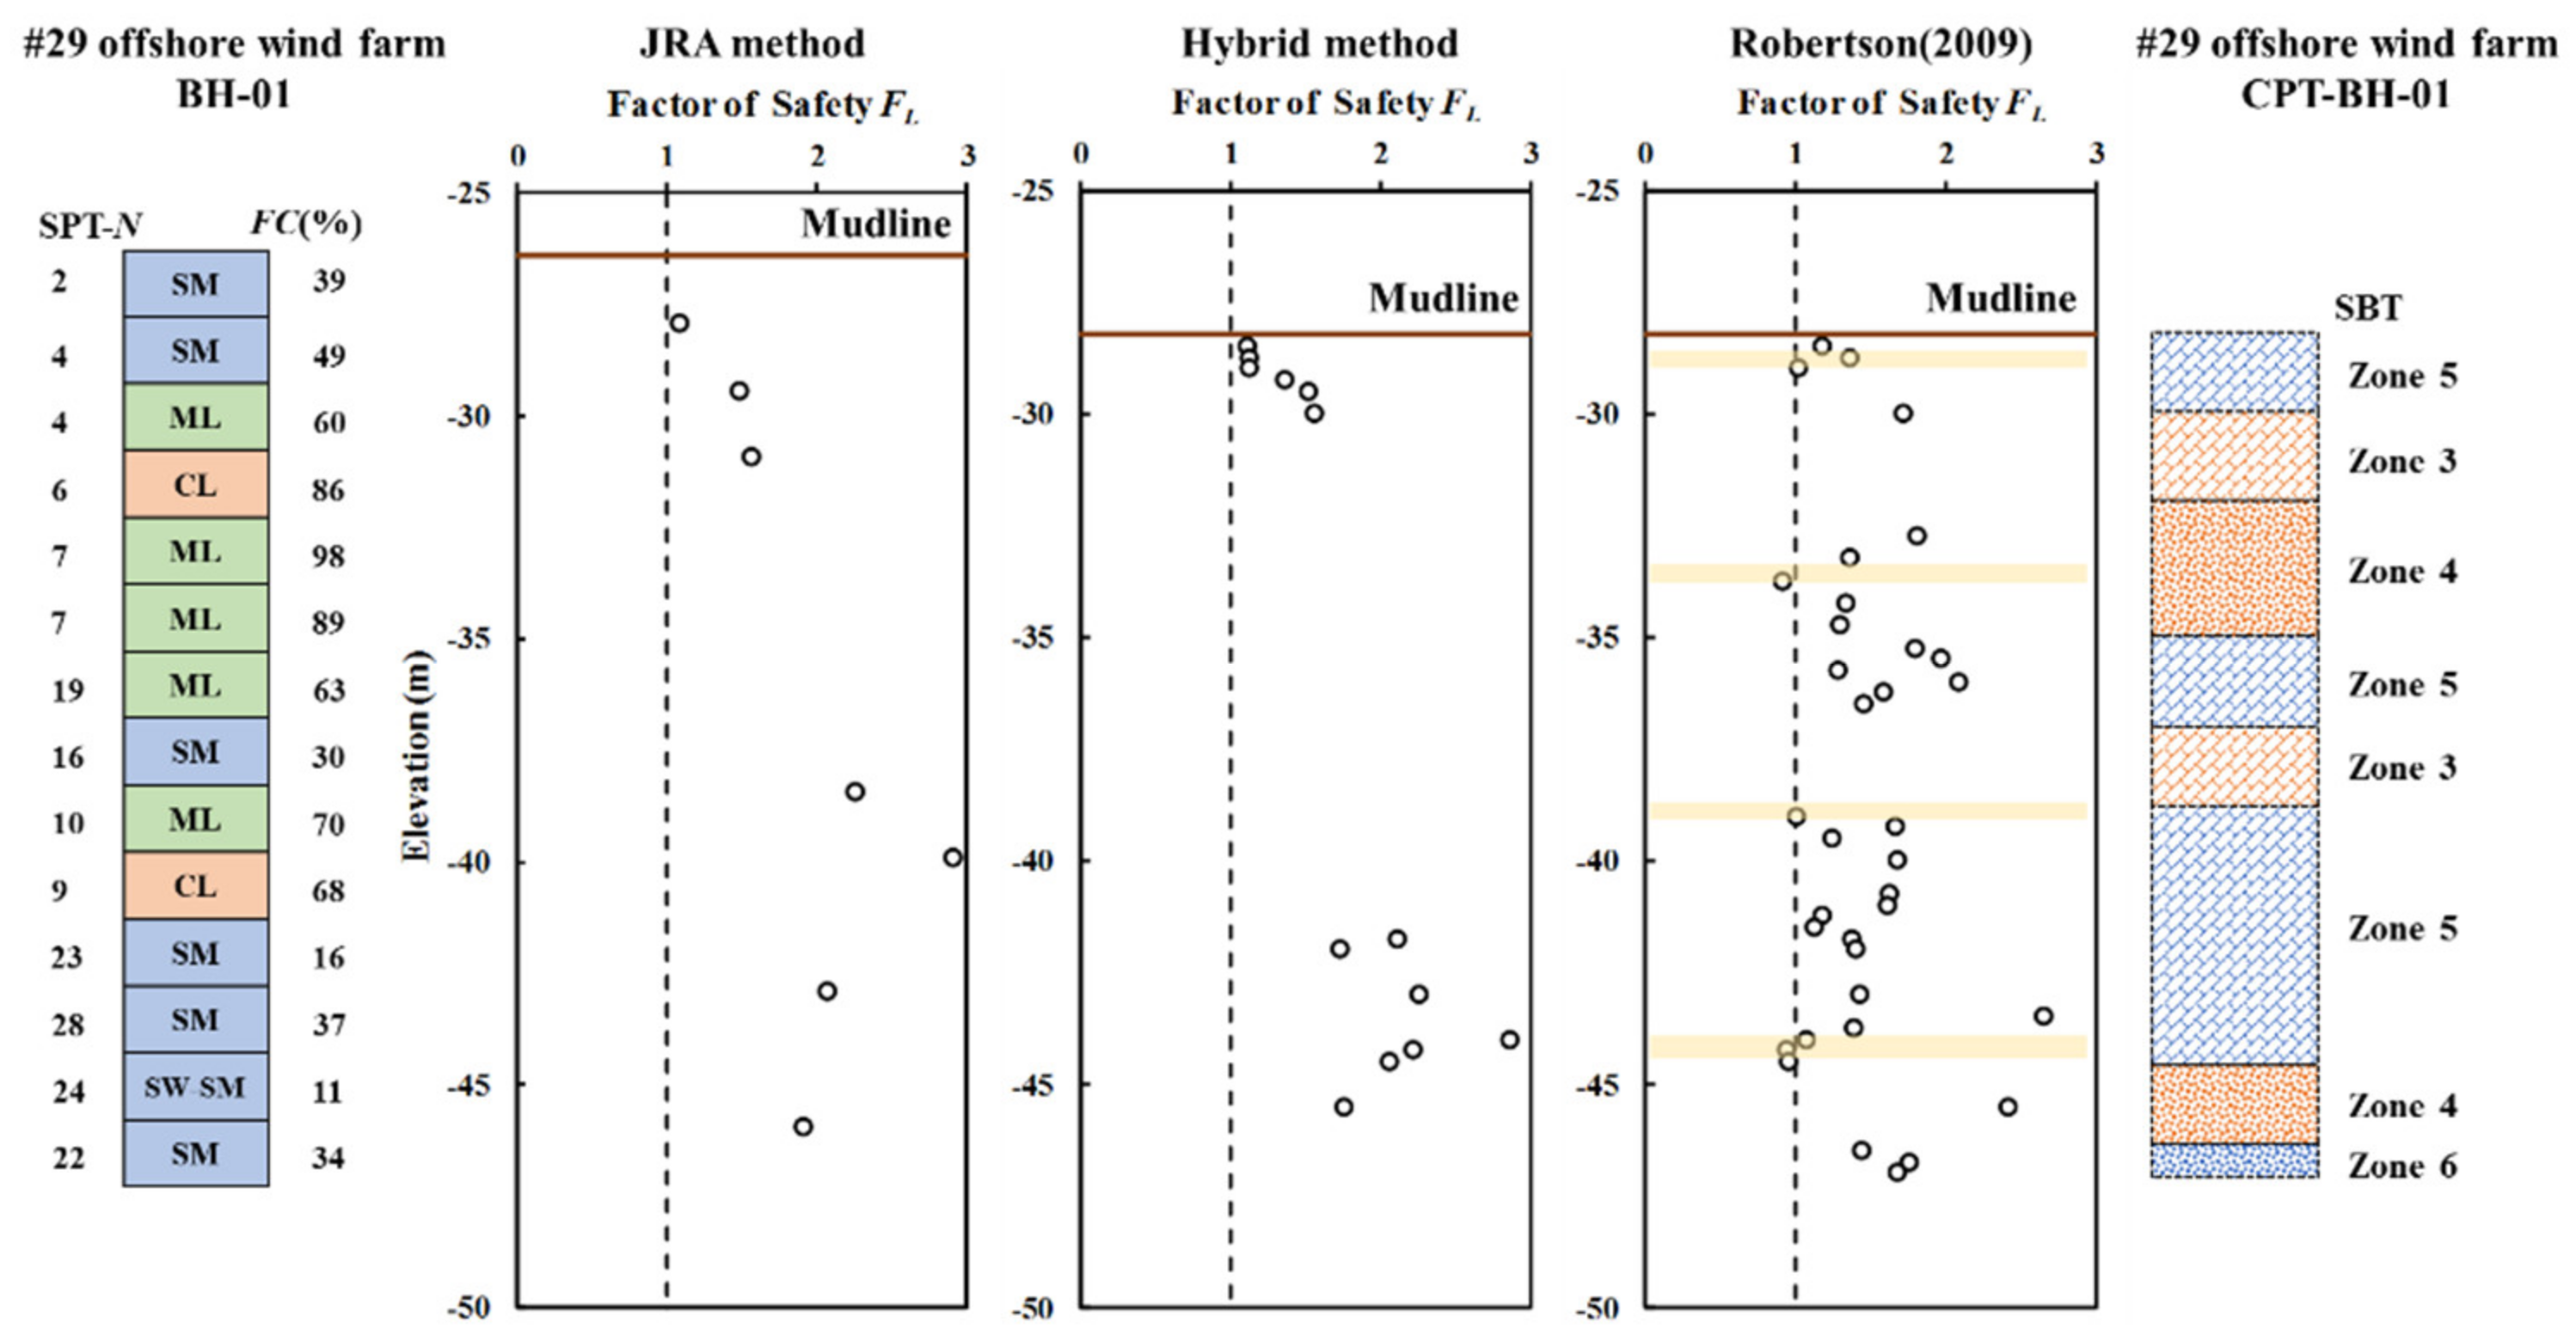
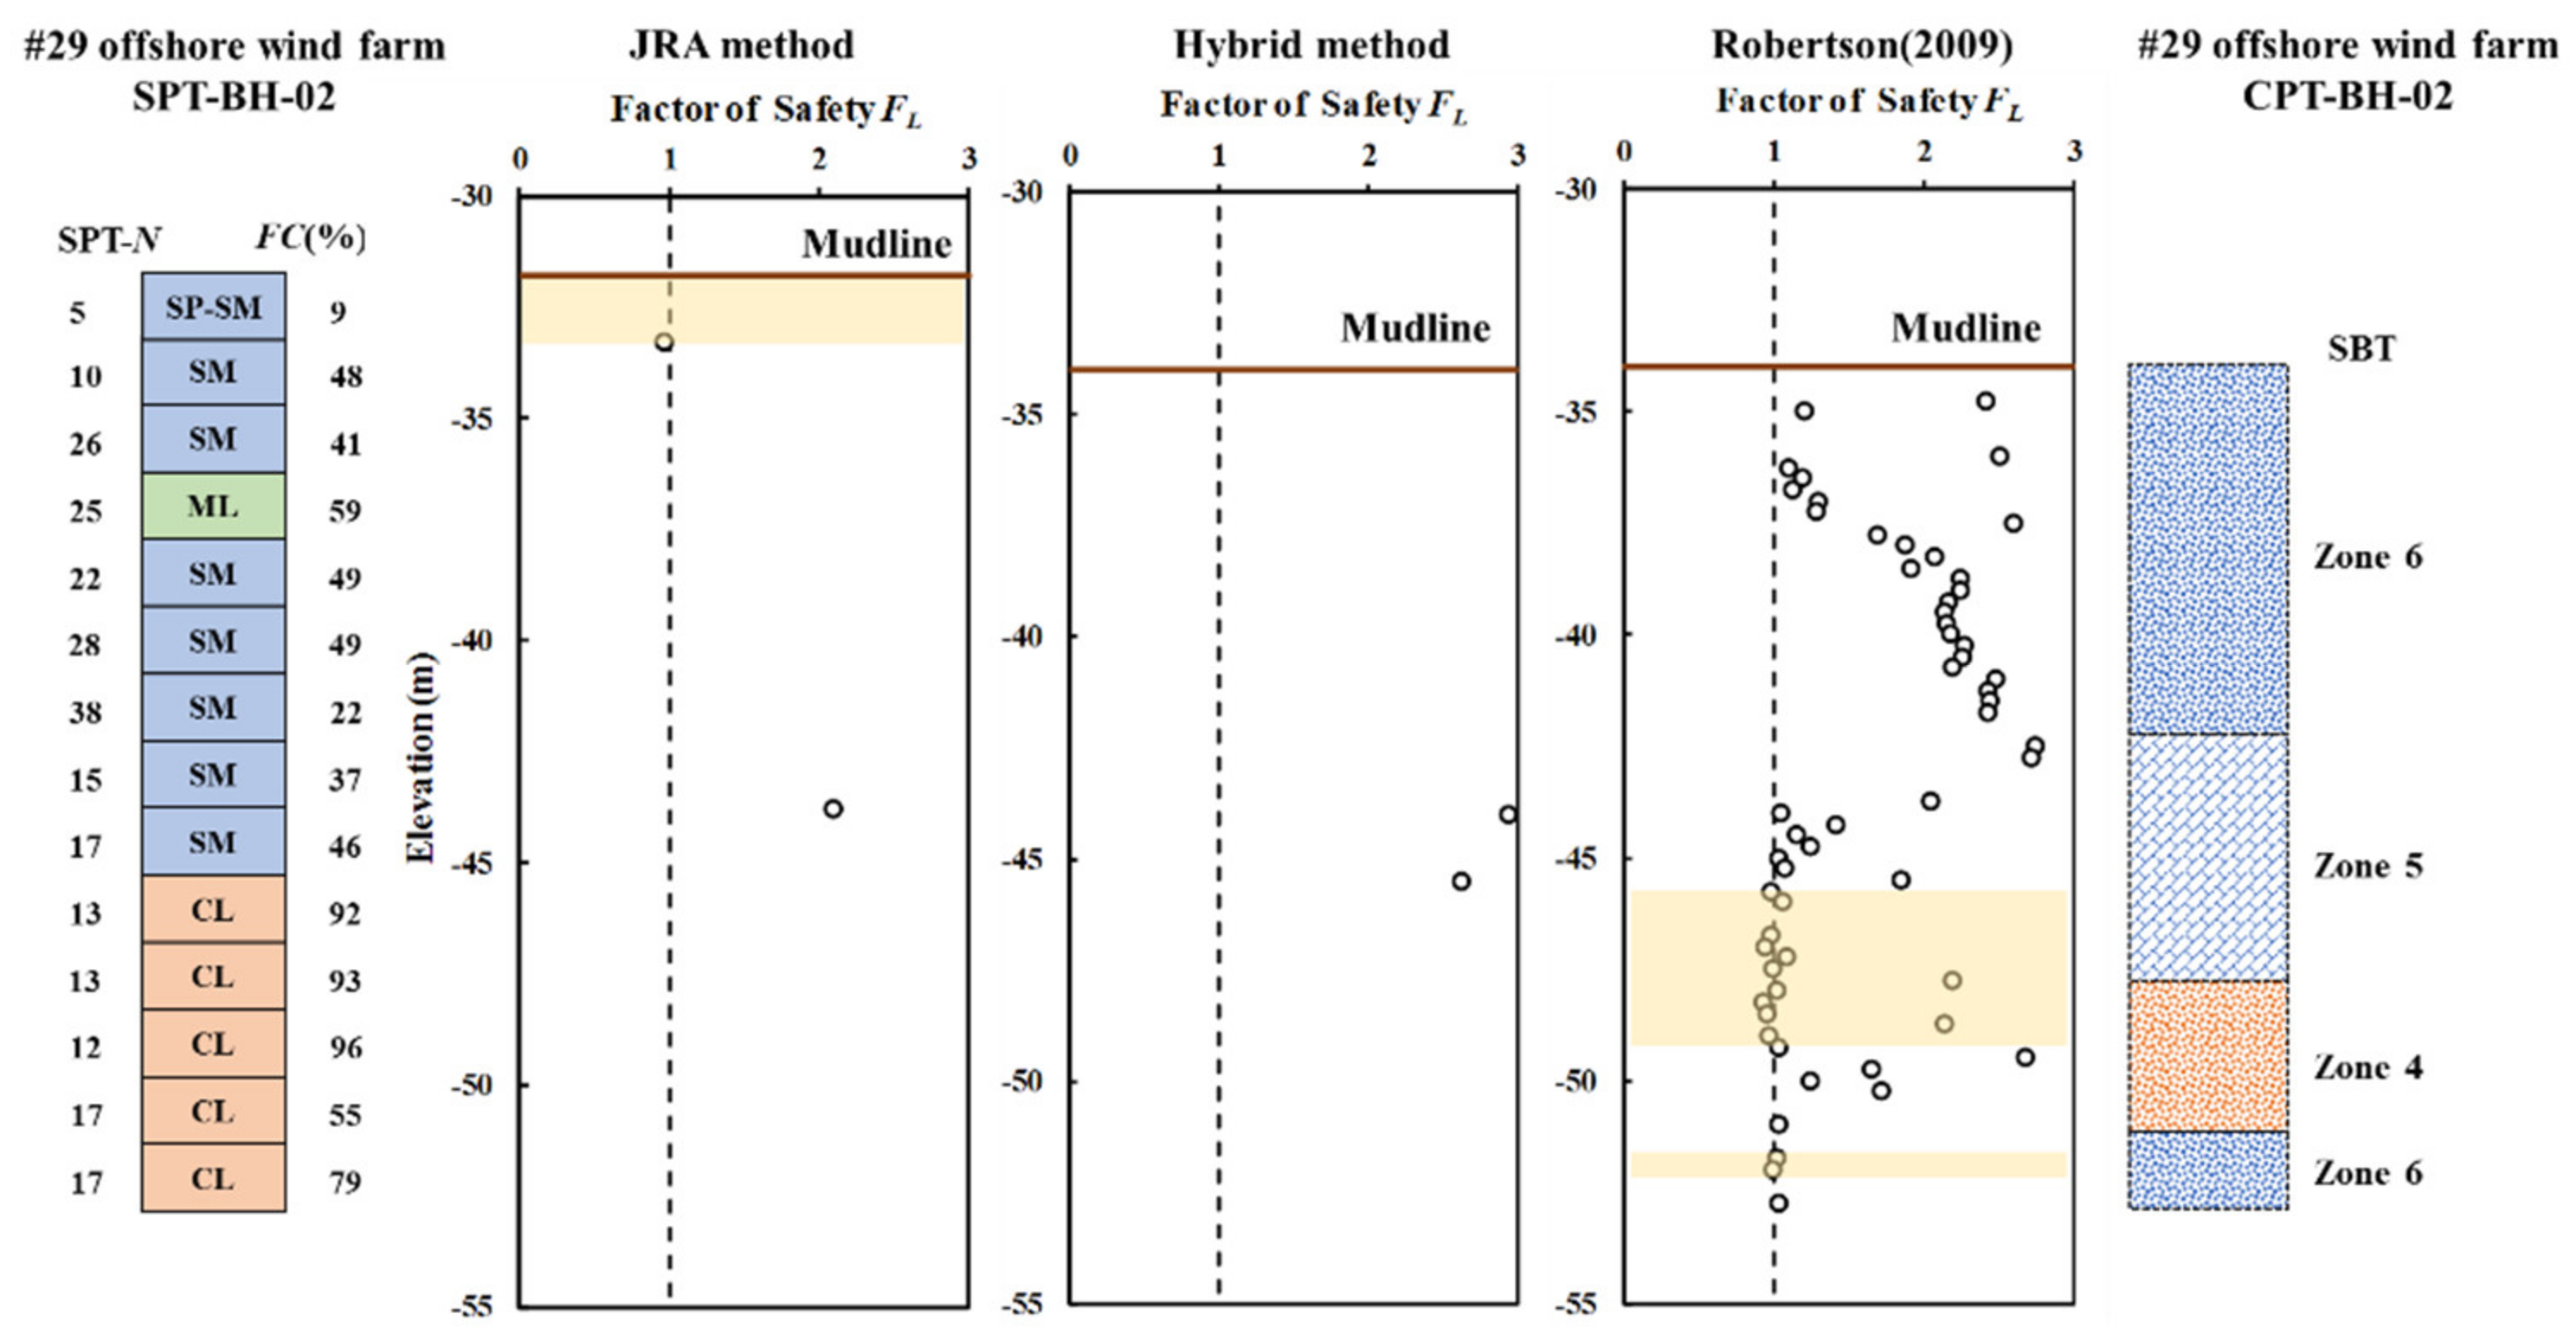
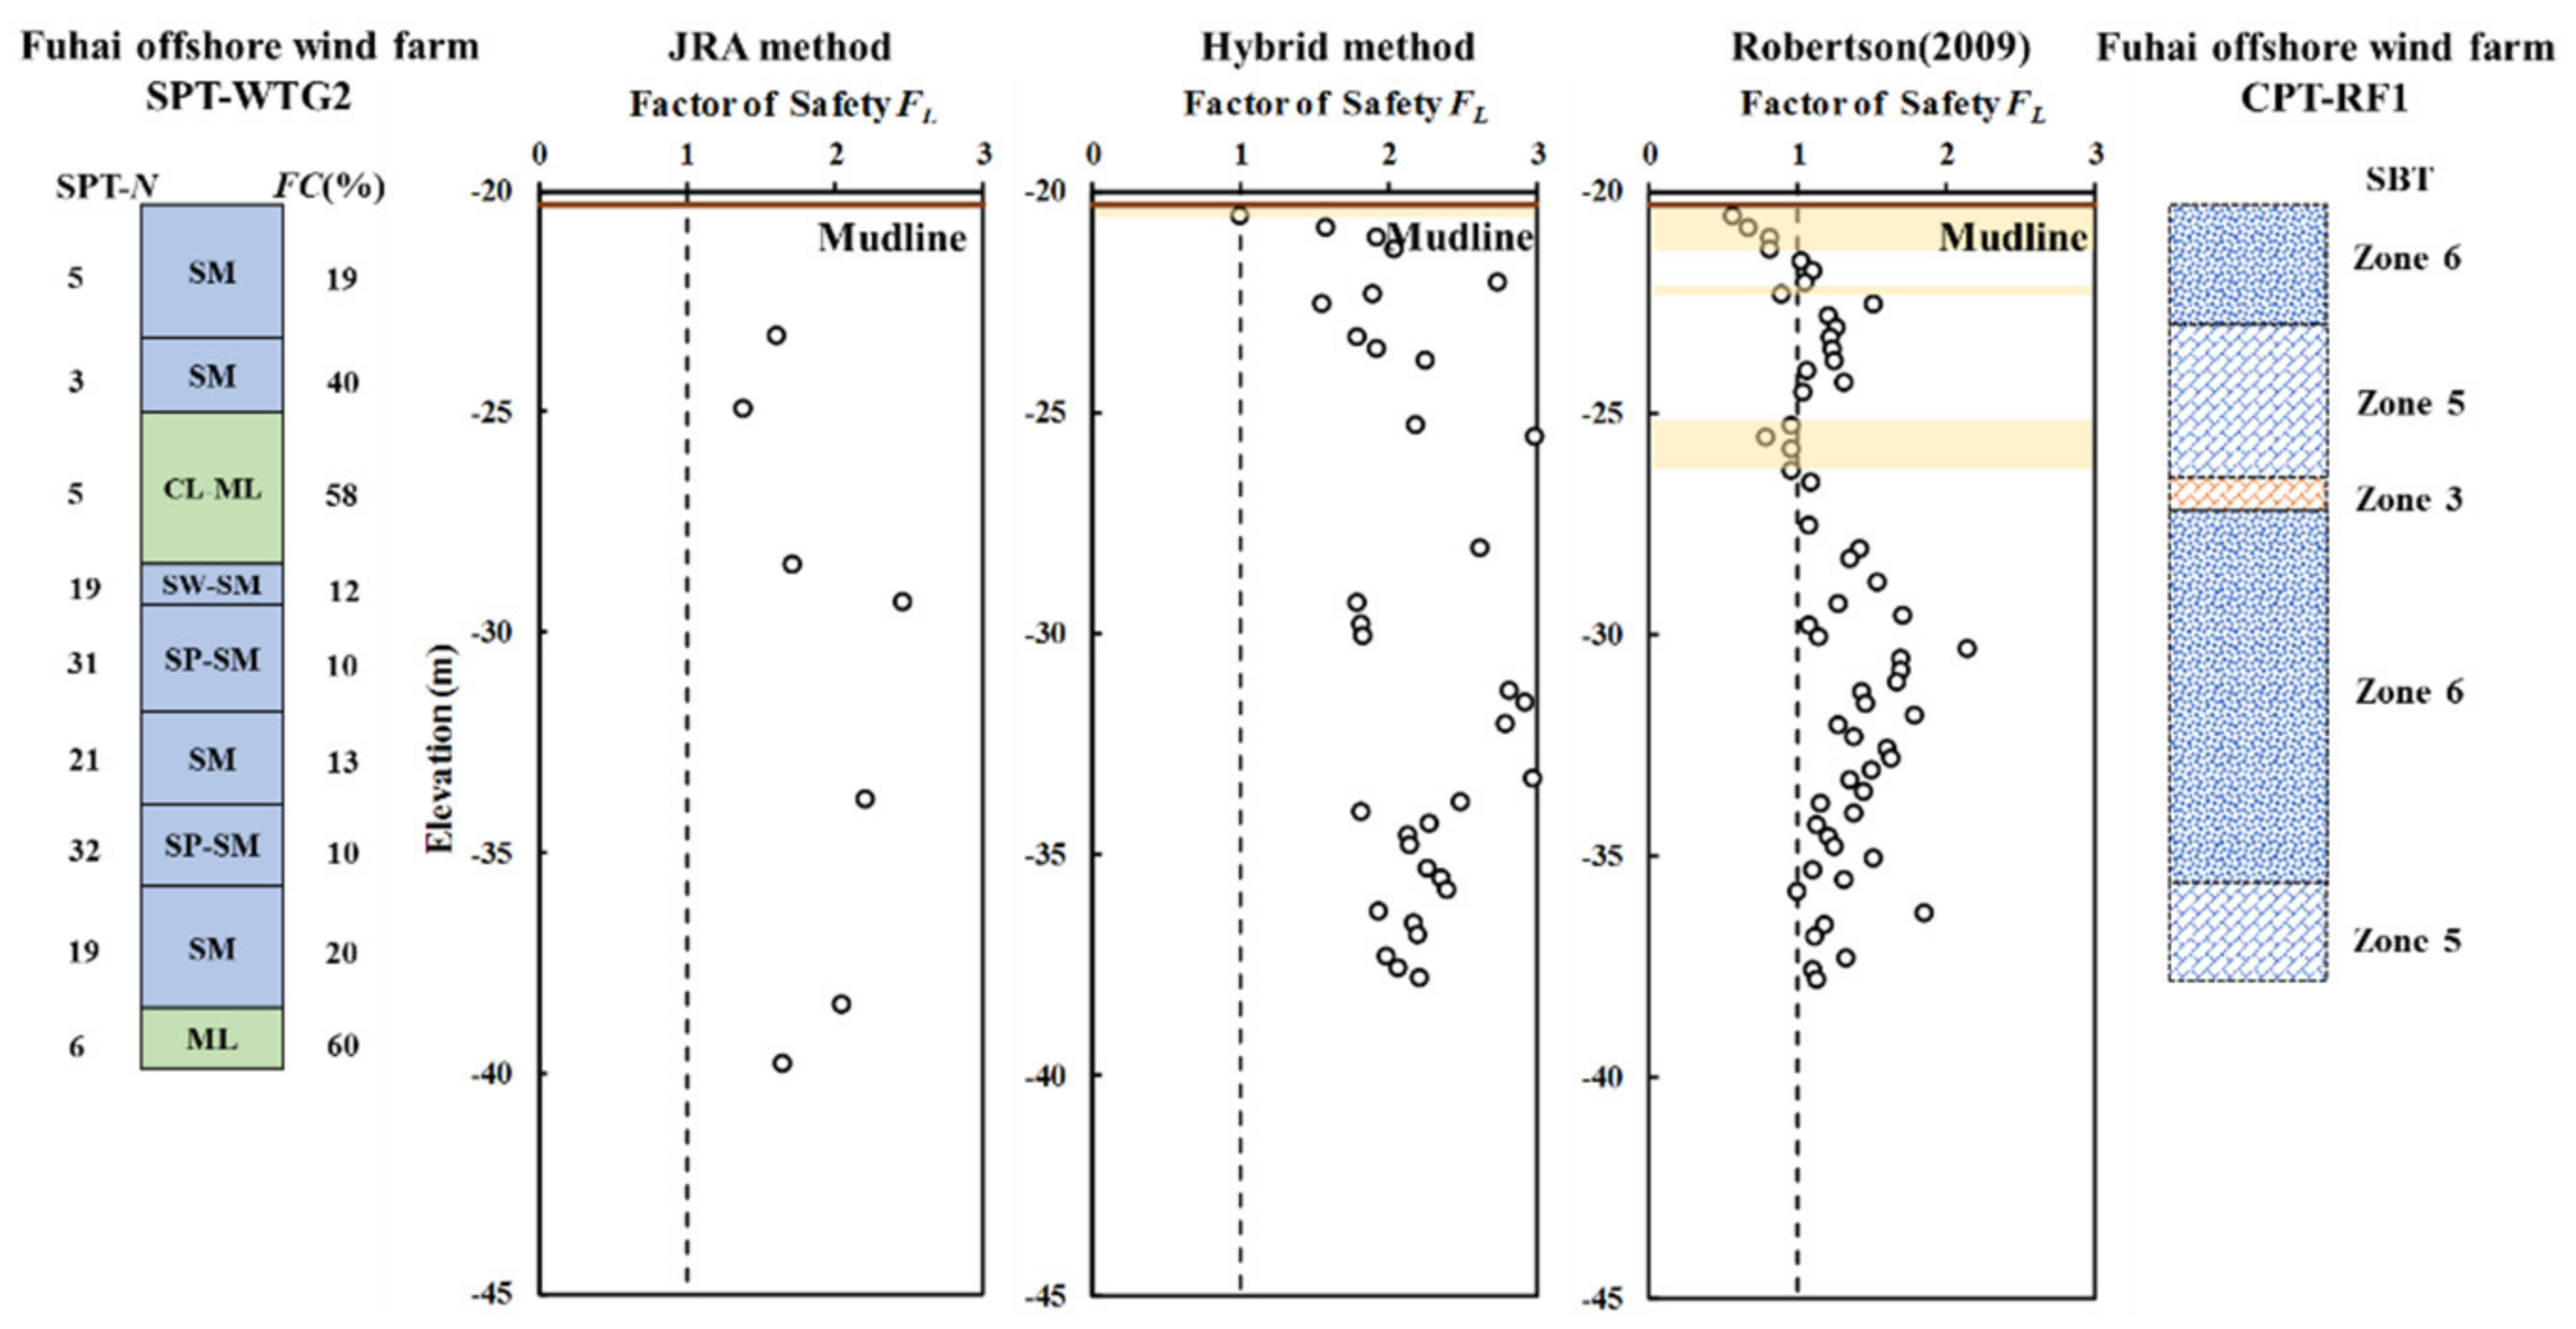
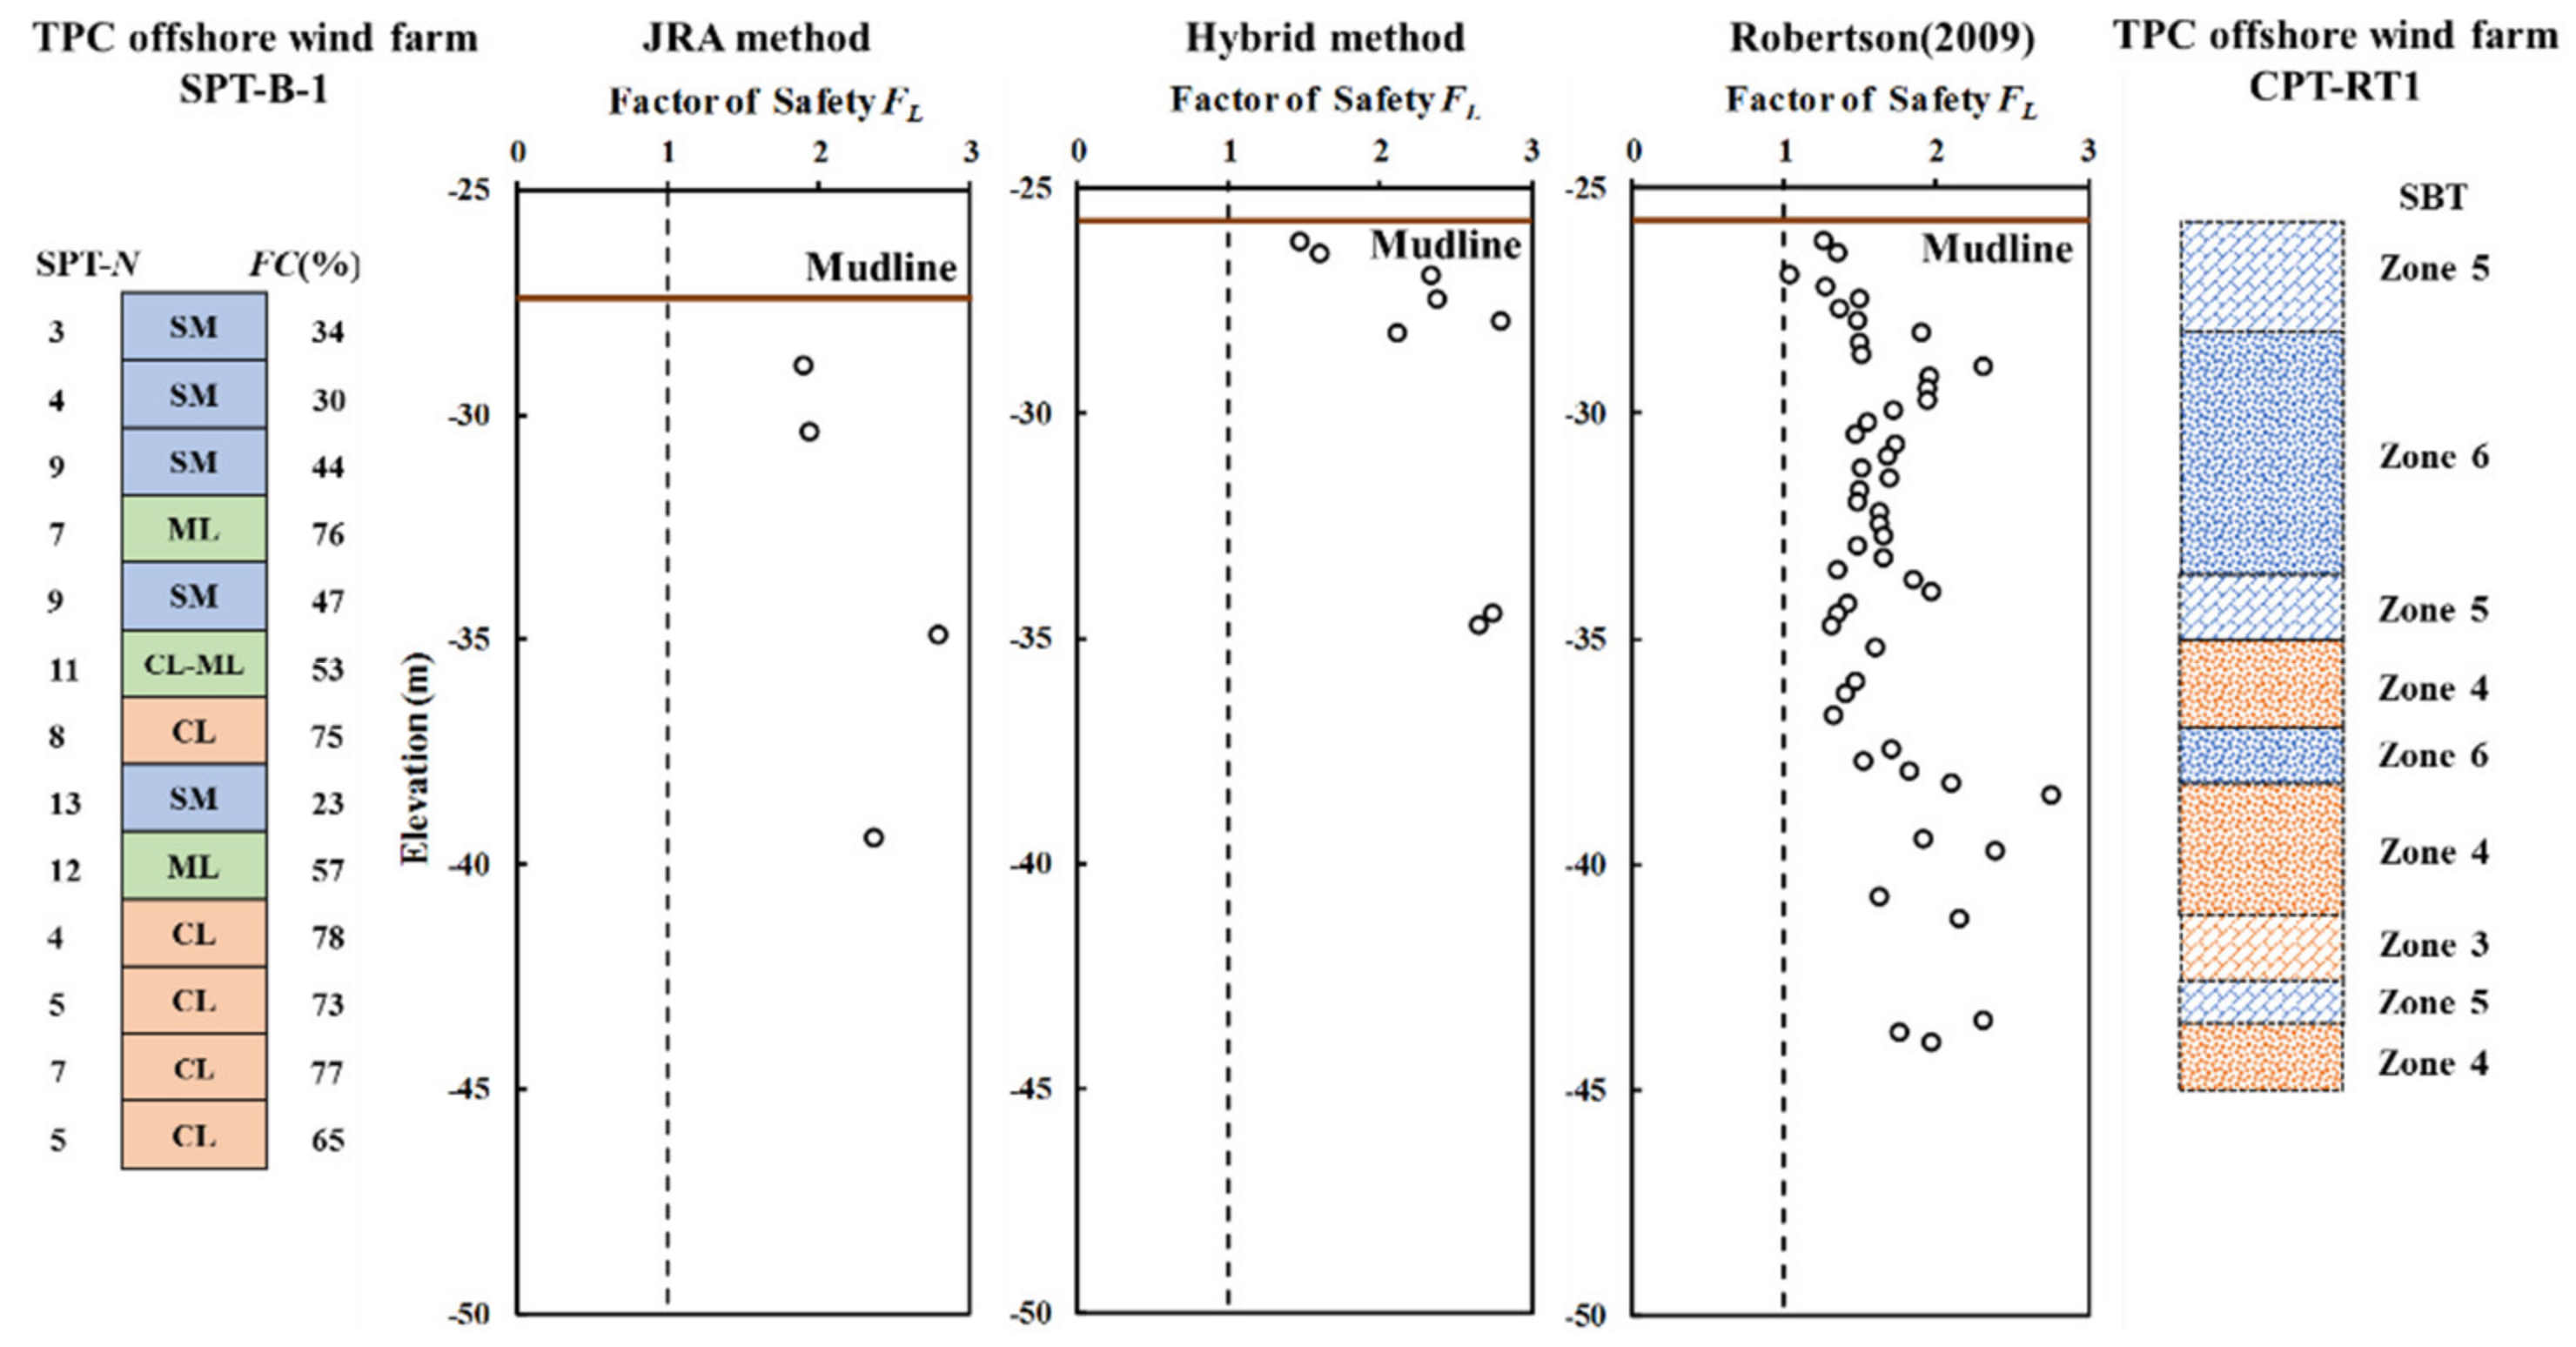
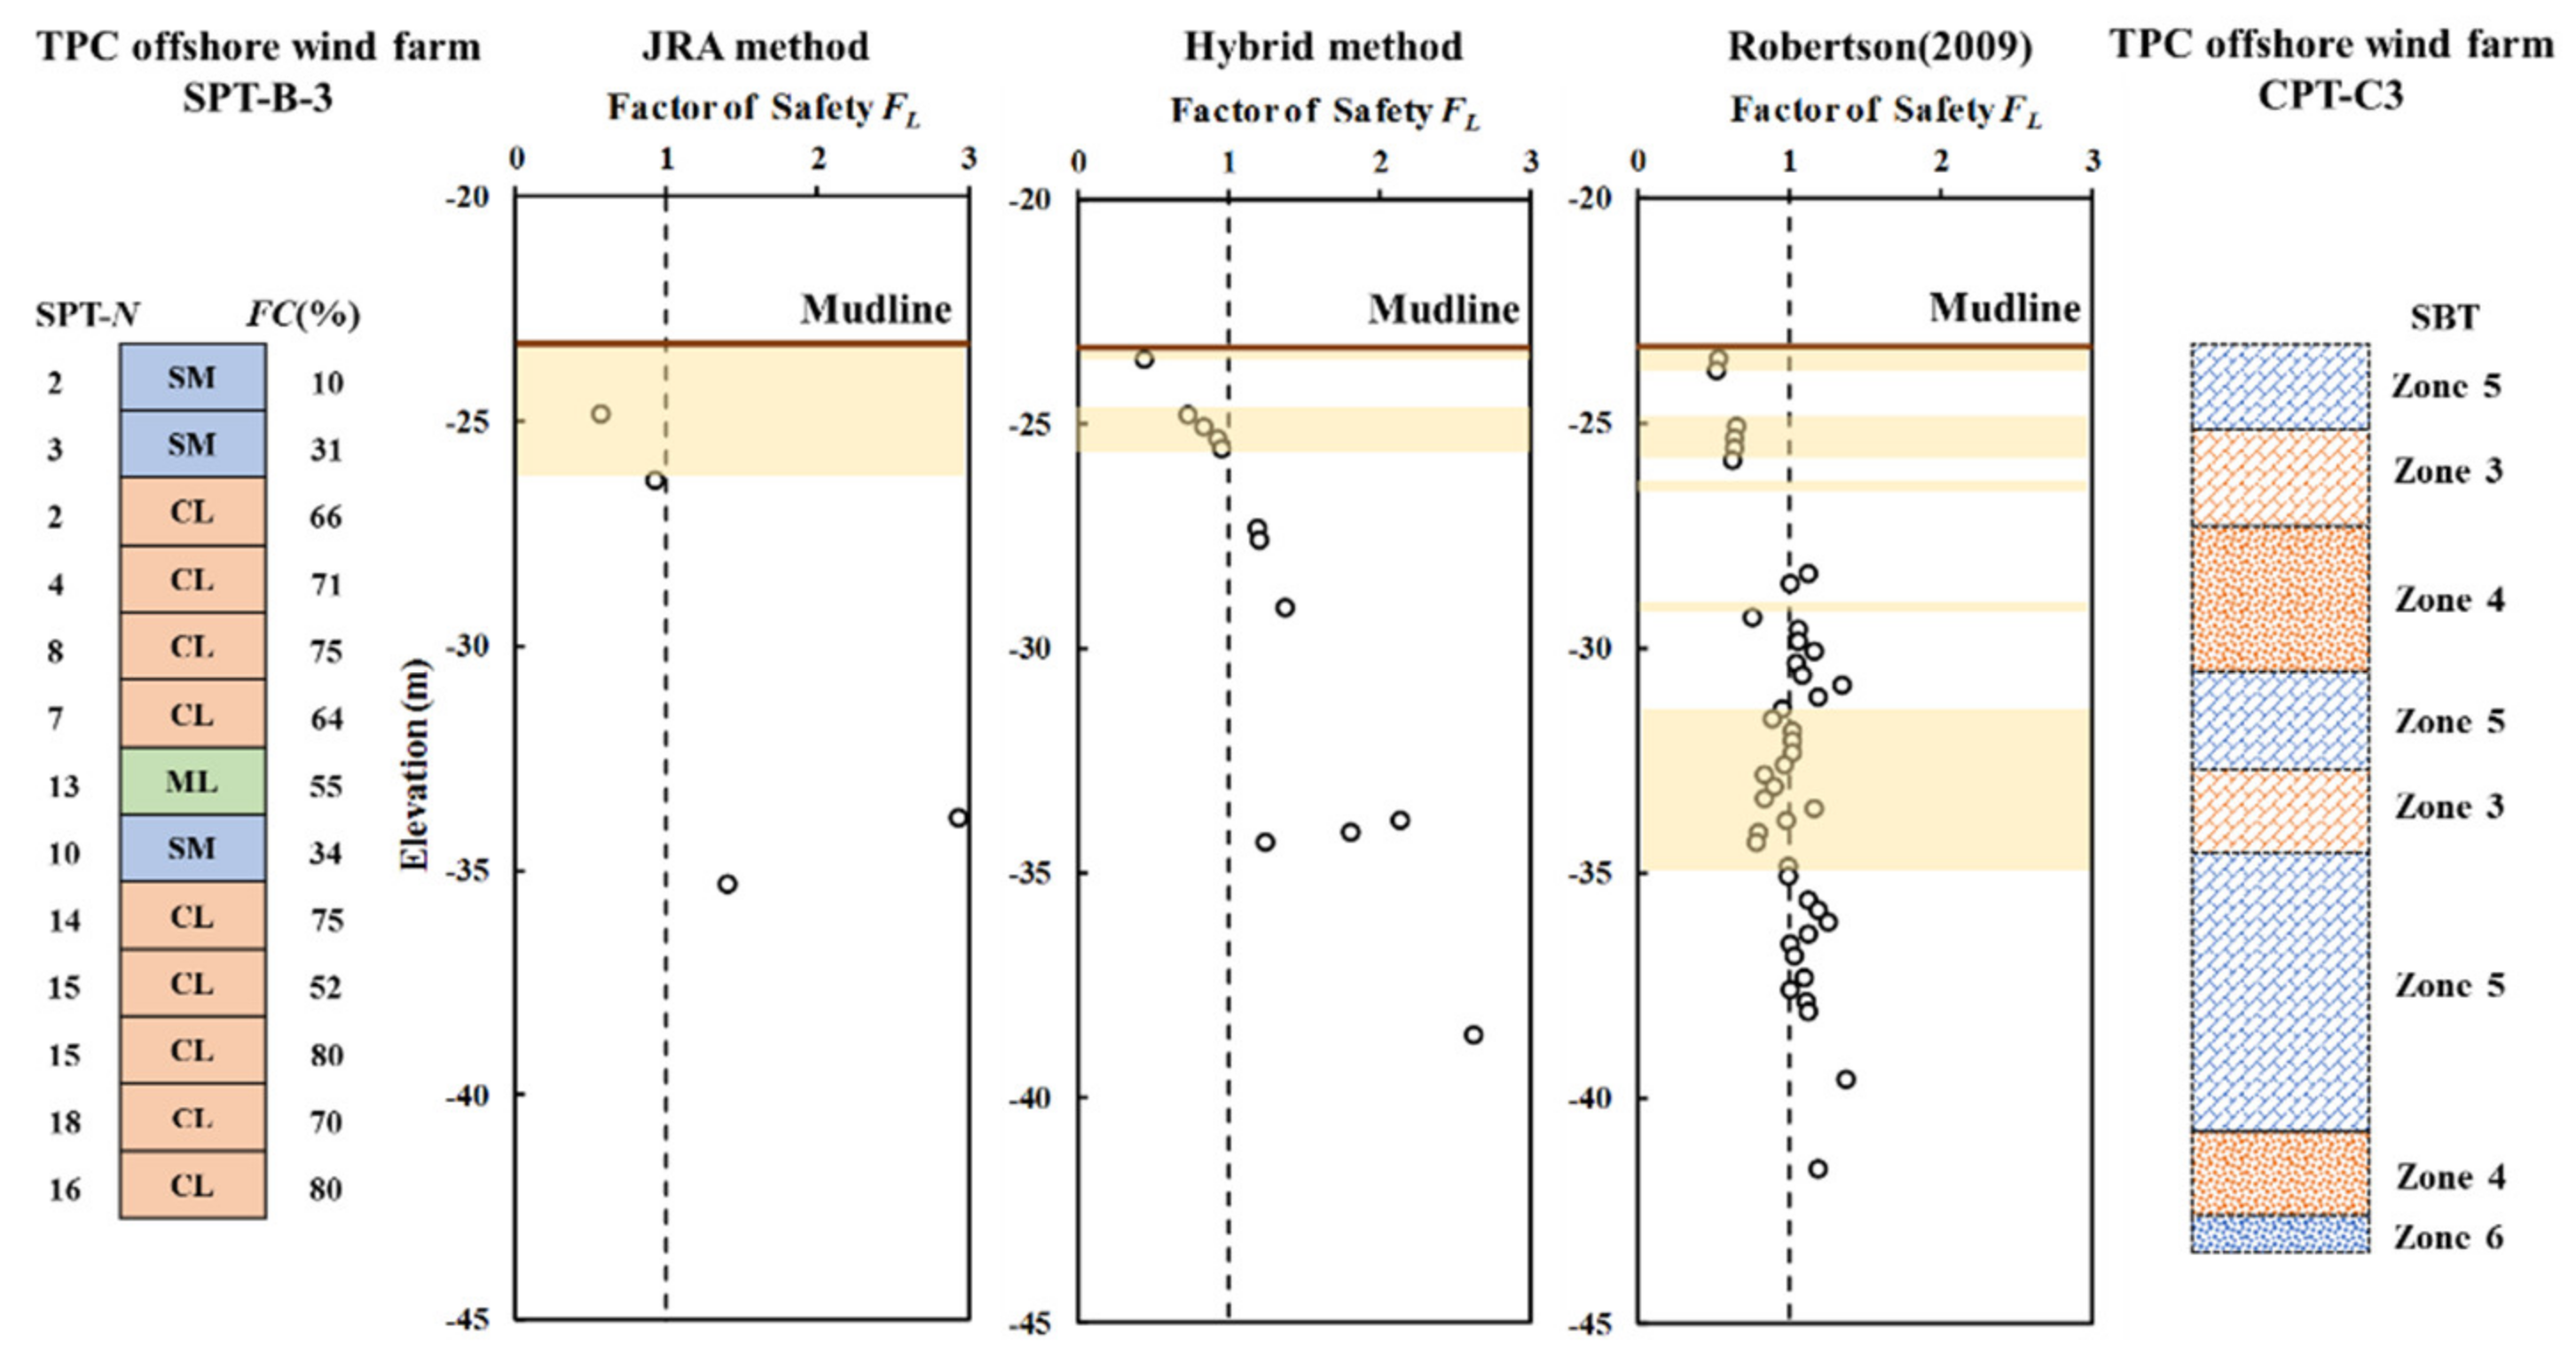
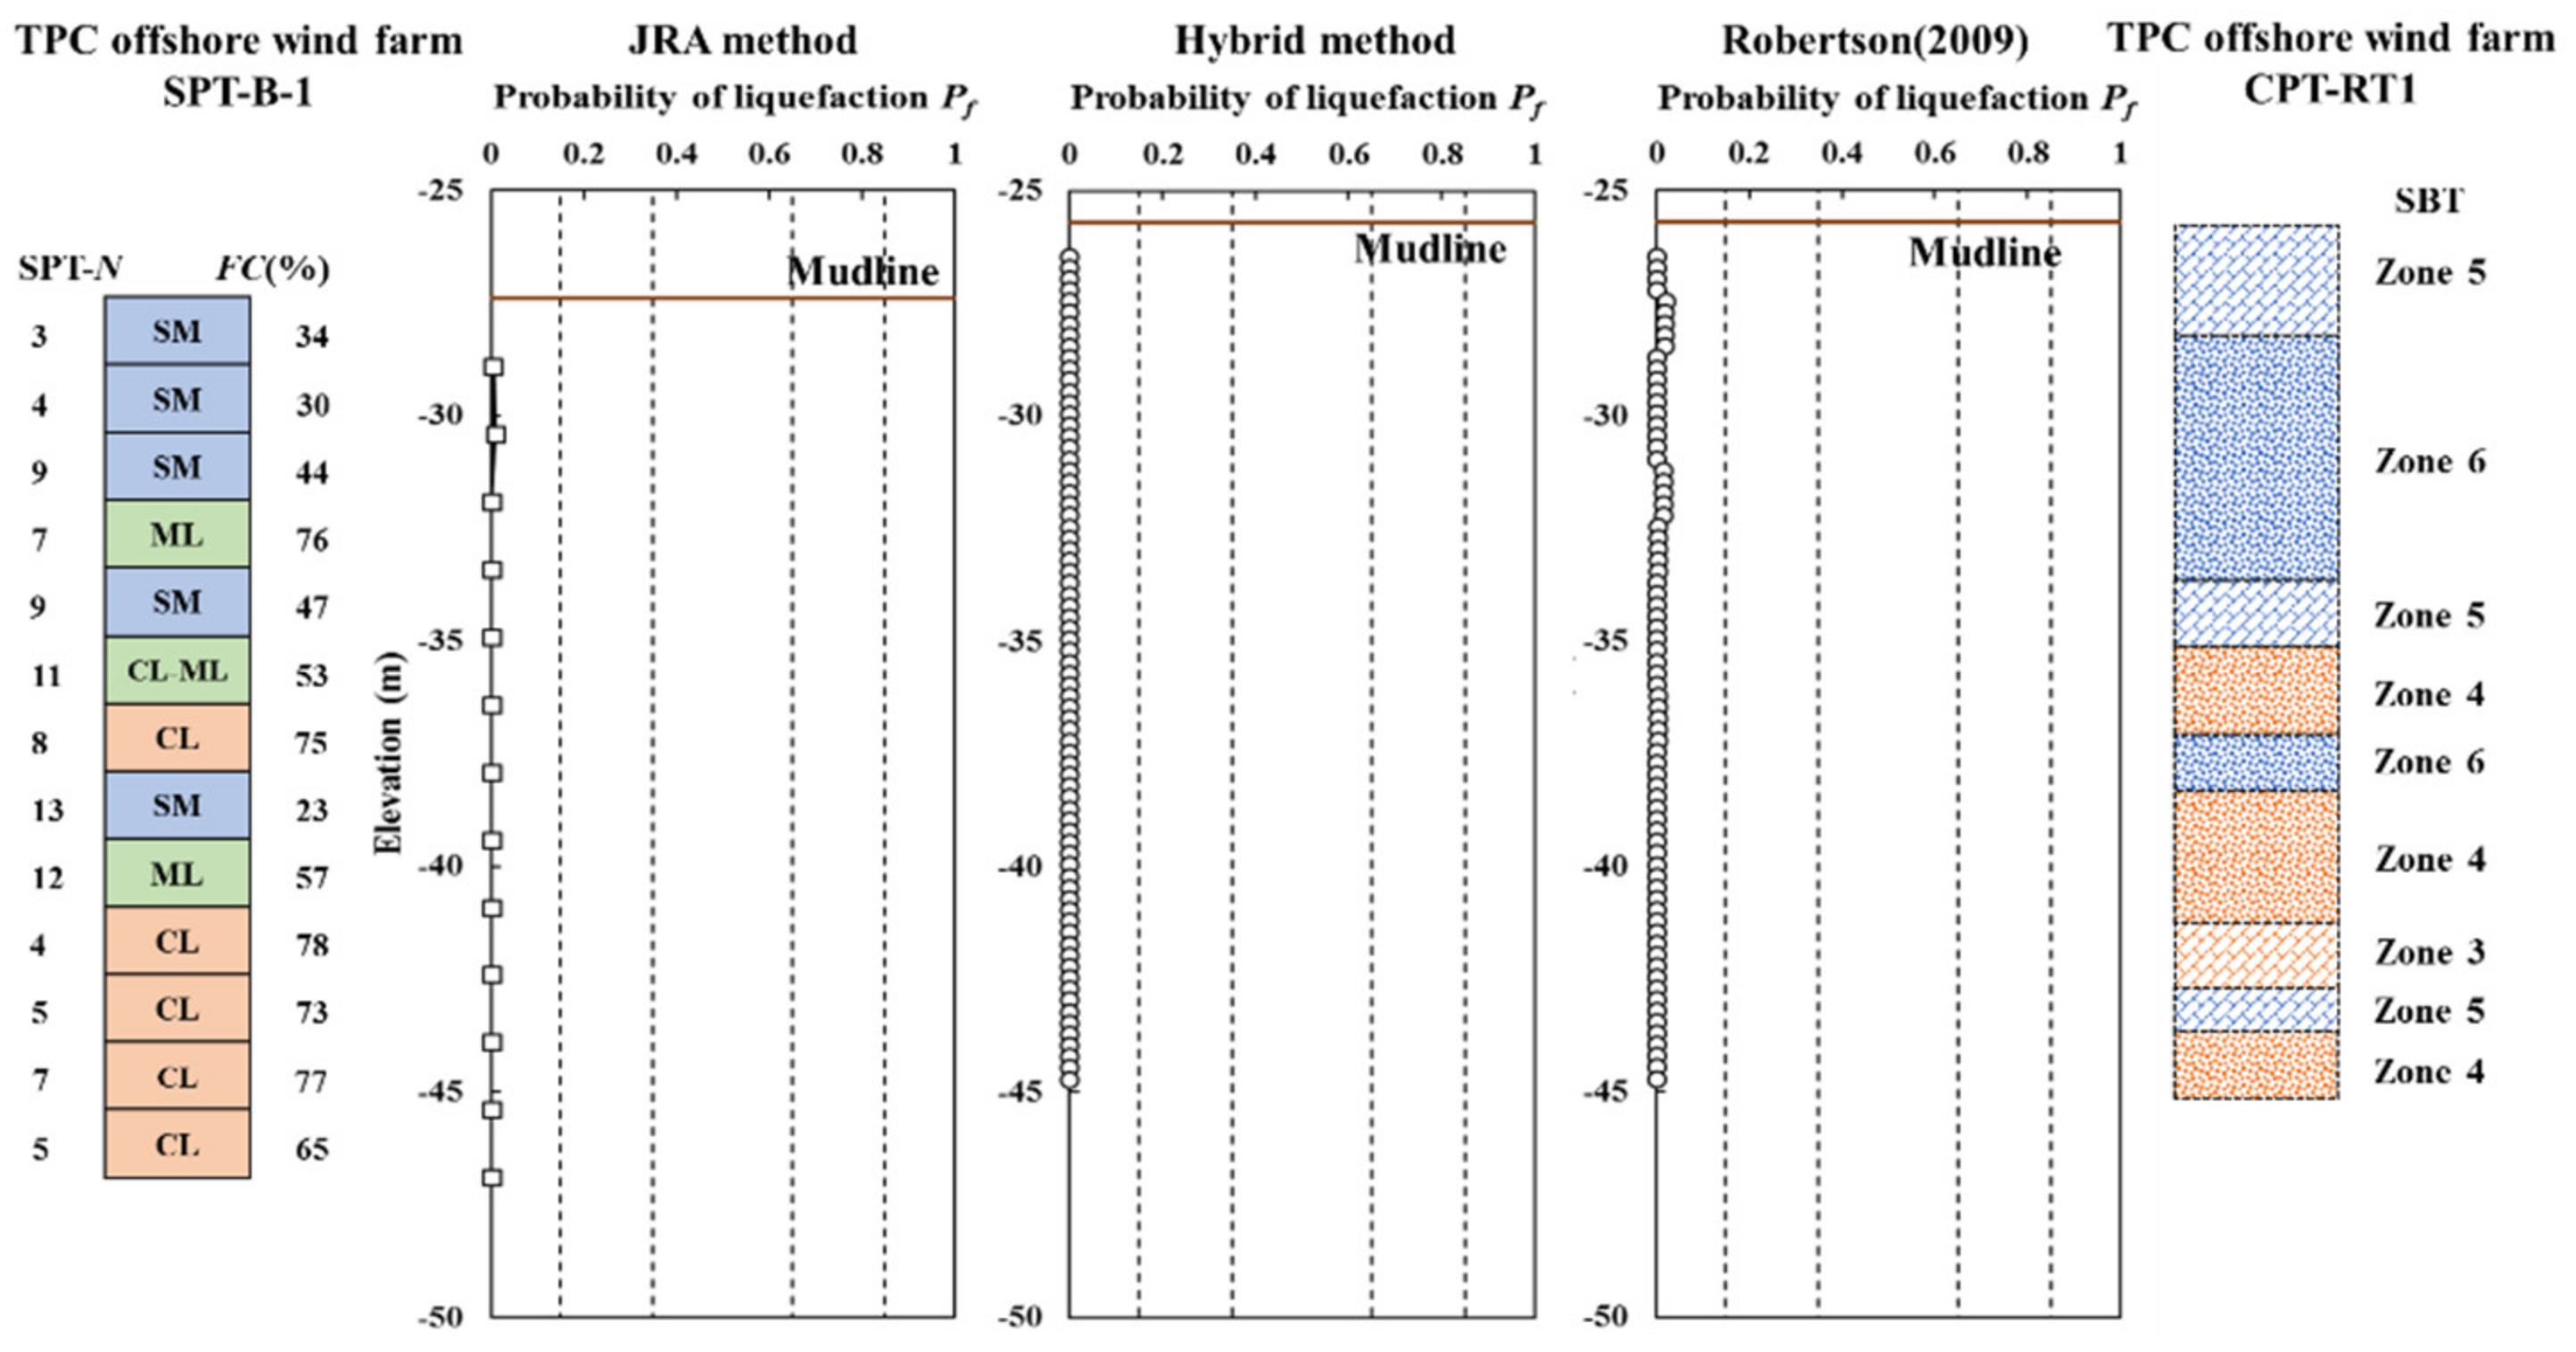
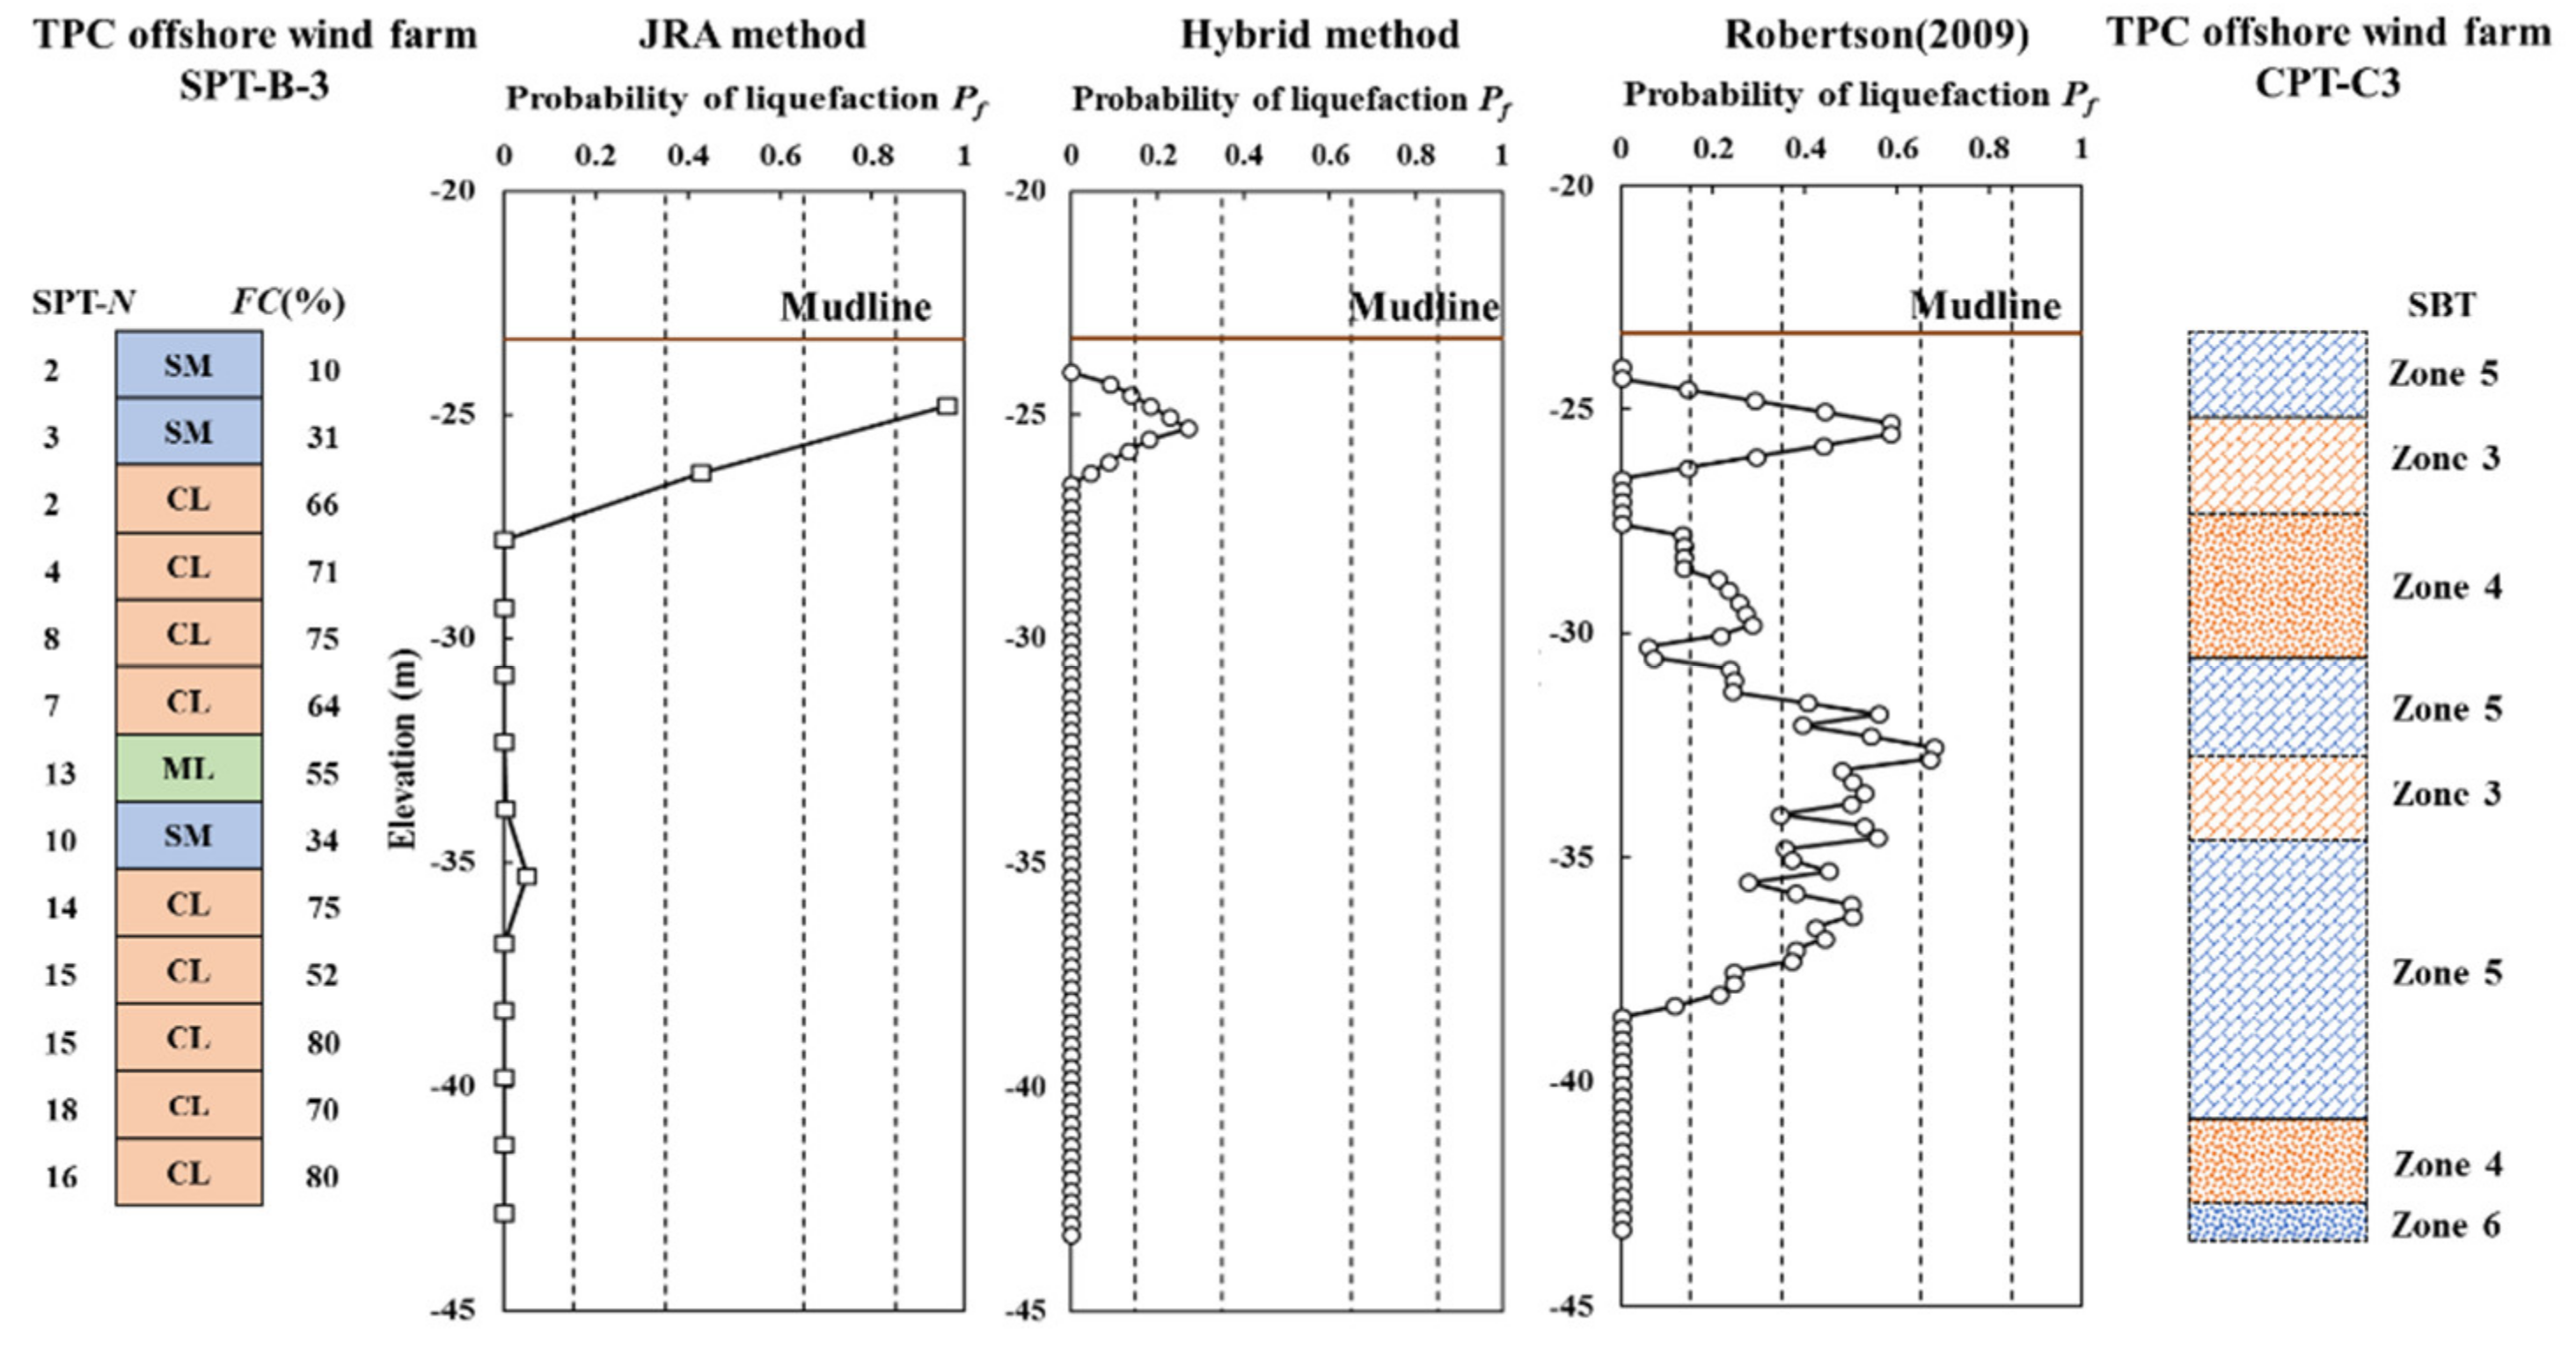
An SPT-based simplified procedure (JRA method), the CPT-based simplified procedure of Robertson (2009) and the hybrid method presented in this study are used to analyze soil liquefaction potential in five groups’ adjacent boreholes, as in Figure 2, for case studies. The CSR of each soil layer required for simplified procedures is obtained from ground motion analysis in Section 2.2. Figure 9, Figure 10, Figure 11, Figure 12 and Figure 13 show the results of the soil liquefaction potential analysis, where 0 < FL <3, and the yellow blocks are the possibly liquefied soil layer (FL < 1.0). A comparison of the results obtained from the three methods shows that the results of the hybrid method and the results of the JRA method are similar, which means that the hybrid method can be used to analyze soil liquefaction potential with CPT parameters reasonably.
5. The Influence of CPT Parameter Uncertainty on the Analysis of Seabed Soil Liquefaction in Offshore Wind Farm
5.1. Probability Distribution of CPT-qc
This paper carries out uncertainty analysis to clarify the influence of CPT-qc on the soil liquefaction potential analysis. Baecher & Christian (1983) used the 95% confidence level K–S test to investigate the probability distribution of qc in the Piney Point Mine in the United States [56]. Seyedein (2012) used the chi-square test to explore the probability distribution of qc [57]. Imre (2013) performed a K–S test on 125 CPT borehole data [58]. Shakir (2018a) used CPT data of the Nahiriya Water Diversion Project in Iraq to evaluate the failure probability of square shallow foundations of different sizes through the Monte Carlo method, and the distribution of qc was determined by the coefficient of determination (R2) in a goodness of fit test [59]. Shakir (2018b) collected 24 CPT borehole data in the refinery of Nahiriya, Iraq. A moment-ratio diagram was used to determine the distribution of clay, sandy silt and clayey sand within 20 m [60].
The probability distribution suggested by the researchers mentioned above is considered as the hypothetical distribution in a goodness of fit test, which includes the beta distribution (4 parameters), the power distribution (3 parameters), the normal distribution, the lognormal distribution, the logistic distribution, the extreme value distribution, the Weibull distribution, the gamma distribution (2 parameters). Respectively, the CPT-qc data of SBT Zone 2 and Zone 7 at the Changhua offshore area are only 10 and 2. The amount of these two soil types is not enough to conduct a goodness of fit test; hence, the mean value of CPT-qc is given to these two soil types in the risk assessment. The K–S test with a 95% confidence level is used in the goodness of fit test for determining the probability distribution of CPT-qc here. If several hypothetical distributions pass the K–S test, the distribution with the higher P-value is selected. The result of goodness of fit test shows that the probability distributions of SBT Zone 3 to Zone 6 are normal, Weibull, beta and Weibull. The statistical parameters of the probability distribution of CPT-qc are shown in Table 2.
The histograms and probability density function are shown in Figure 14.
5.2. Randomly Given Model of CPT-qc Value of Changhua Offshore Wind Farm
Since the SBT index Ic is a function of CPT–qc, the value of Ic changes with the randomly given CPT–qc, which affects the SBT classification. If the soil type updated by the randomly given CPT–qc is different from the original soil classification, the randomly given CPT–qc values are removed, and the model repeats the above process, until the analysis meets the required number of samplings. The accuracy of the Monte Carlo simulation depends on the number of random samples. As the number of random samples reaches 10,000, the analysis results of this study gradually converge and approach a stable value. According to the definition of soil liquefaction failure in simplified procedures, the margin of safety function M is defined as the difference between CRR and CSR as Equation (18). If M < 0 means that soil liquefaction occurs, the index I is equal to 1; otherwise, the index I is equal to 0. The probability of soil liquefaction Pf is defined as the mean value of the index function.
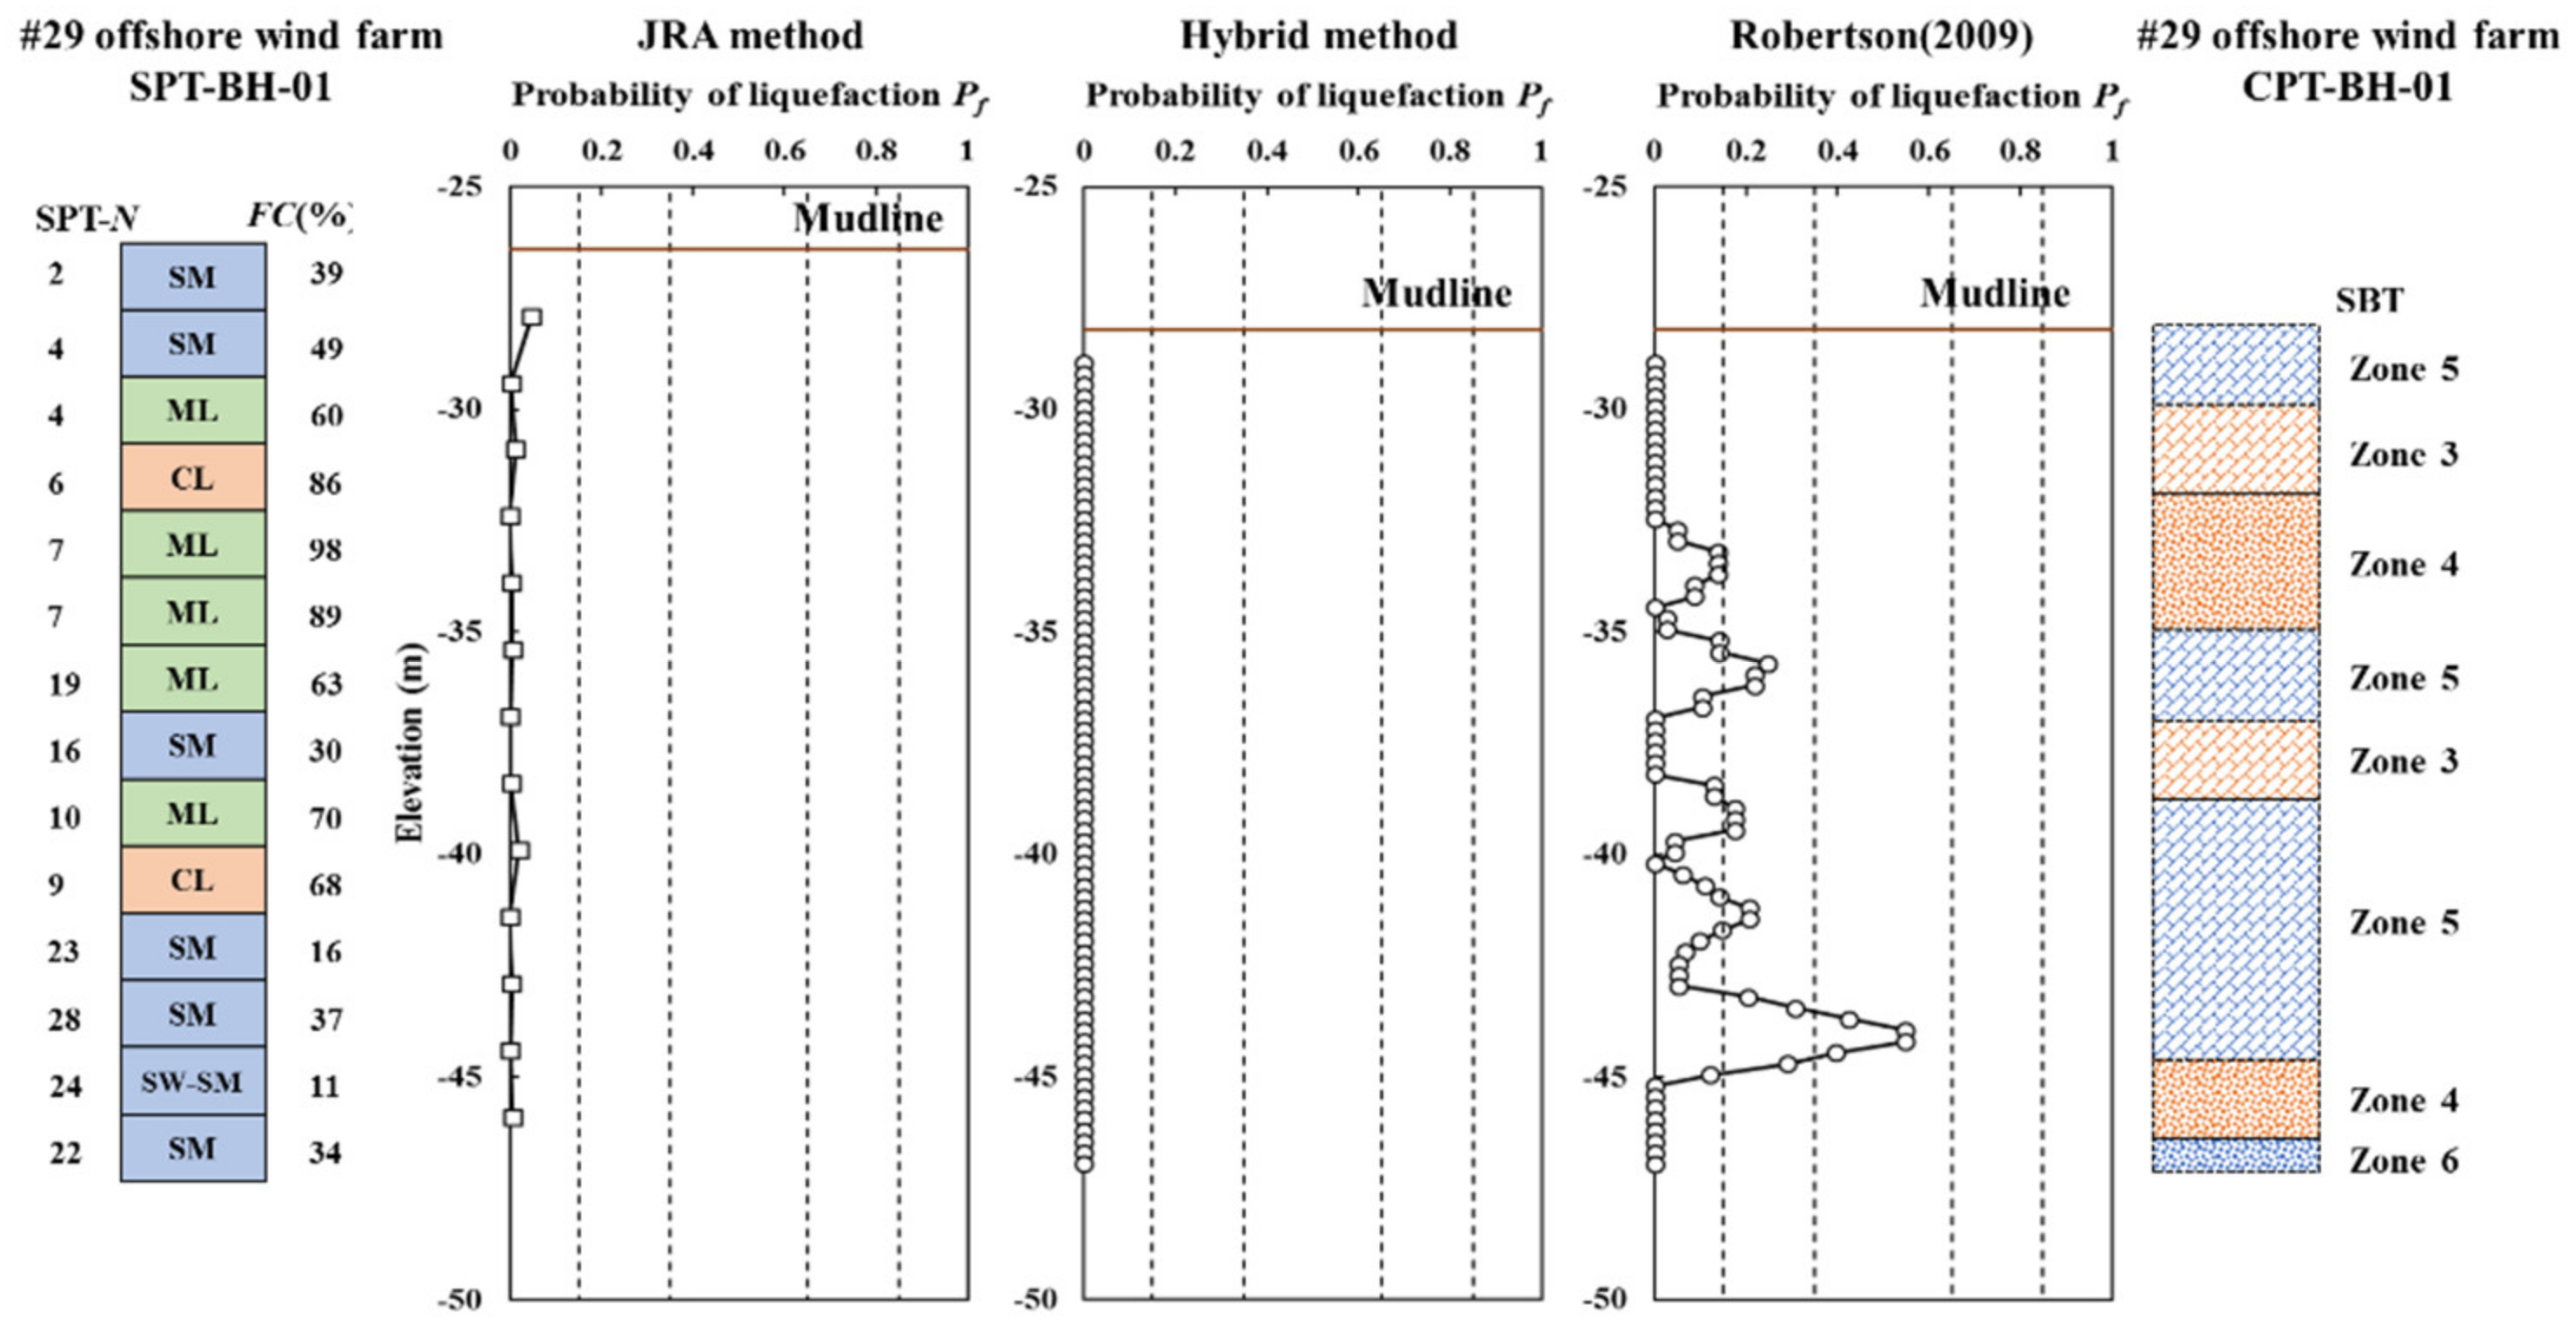
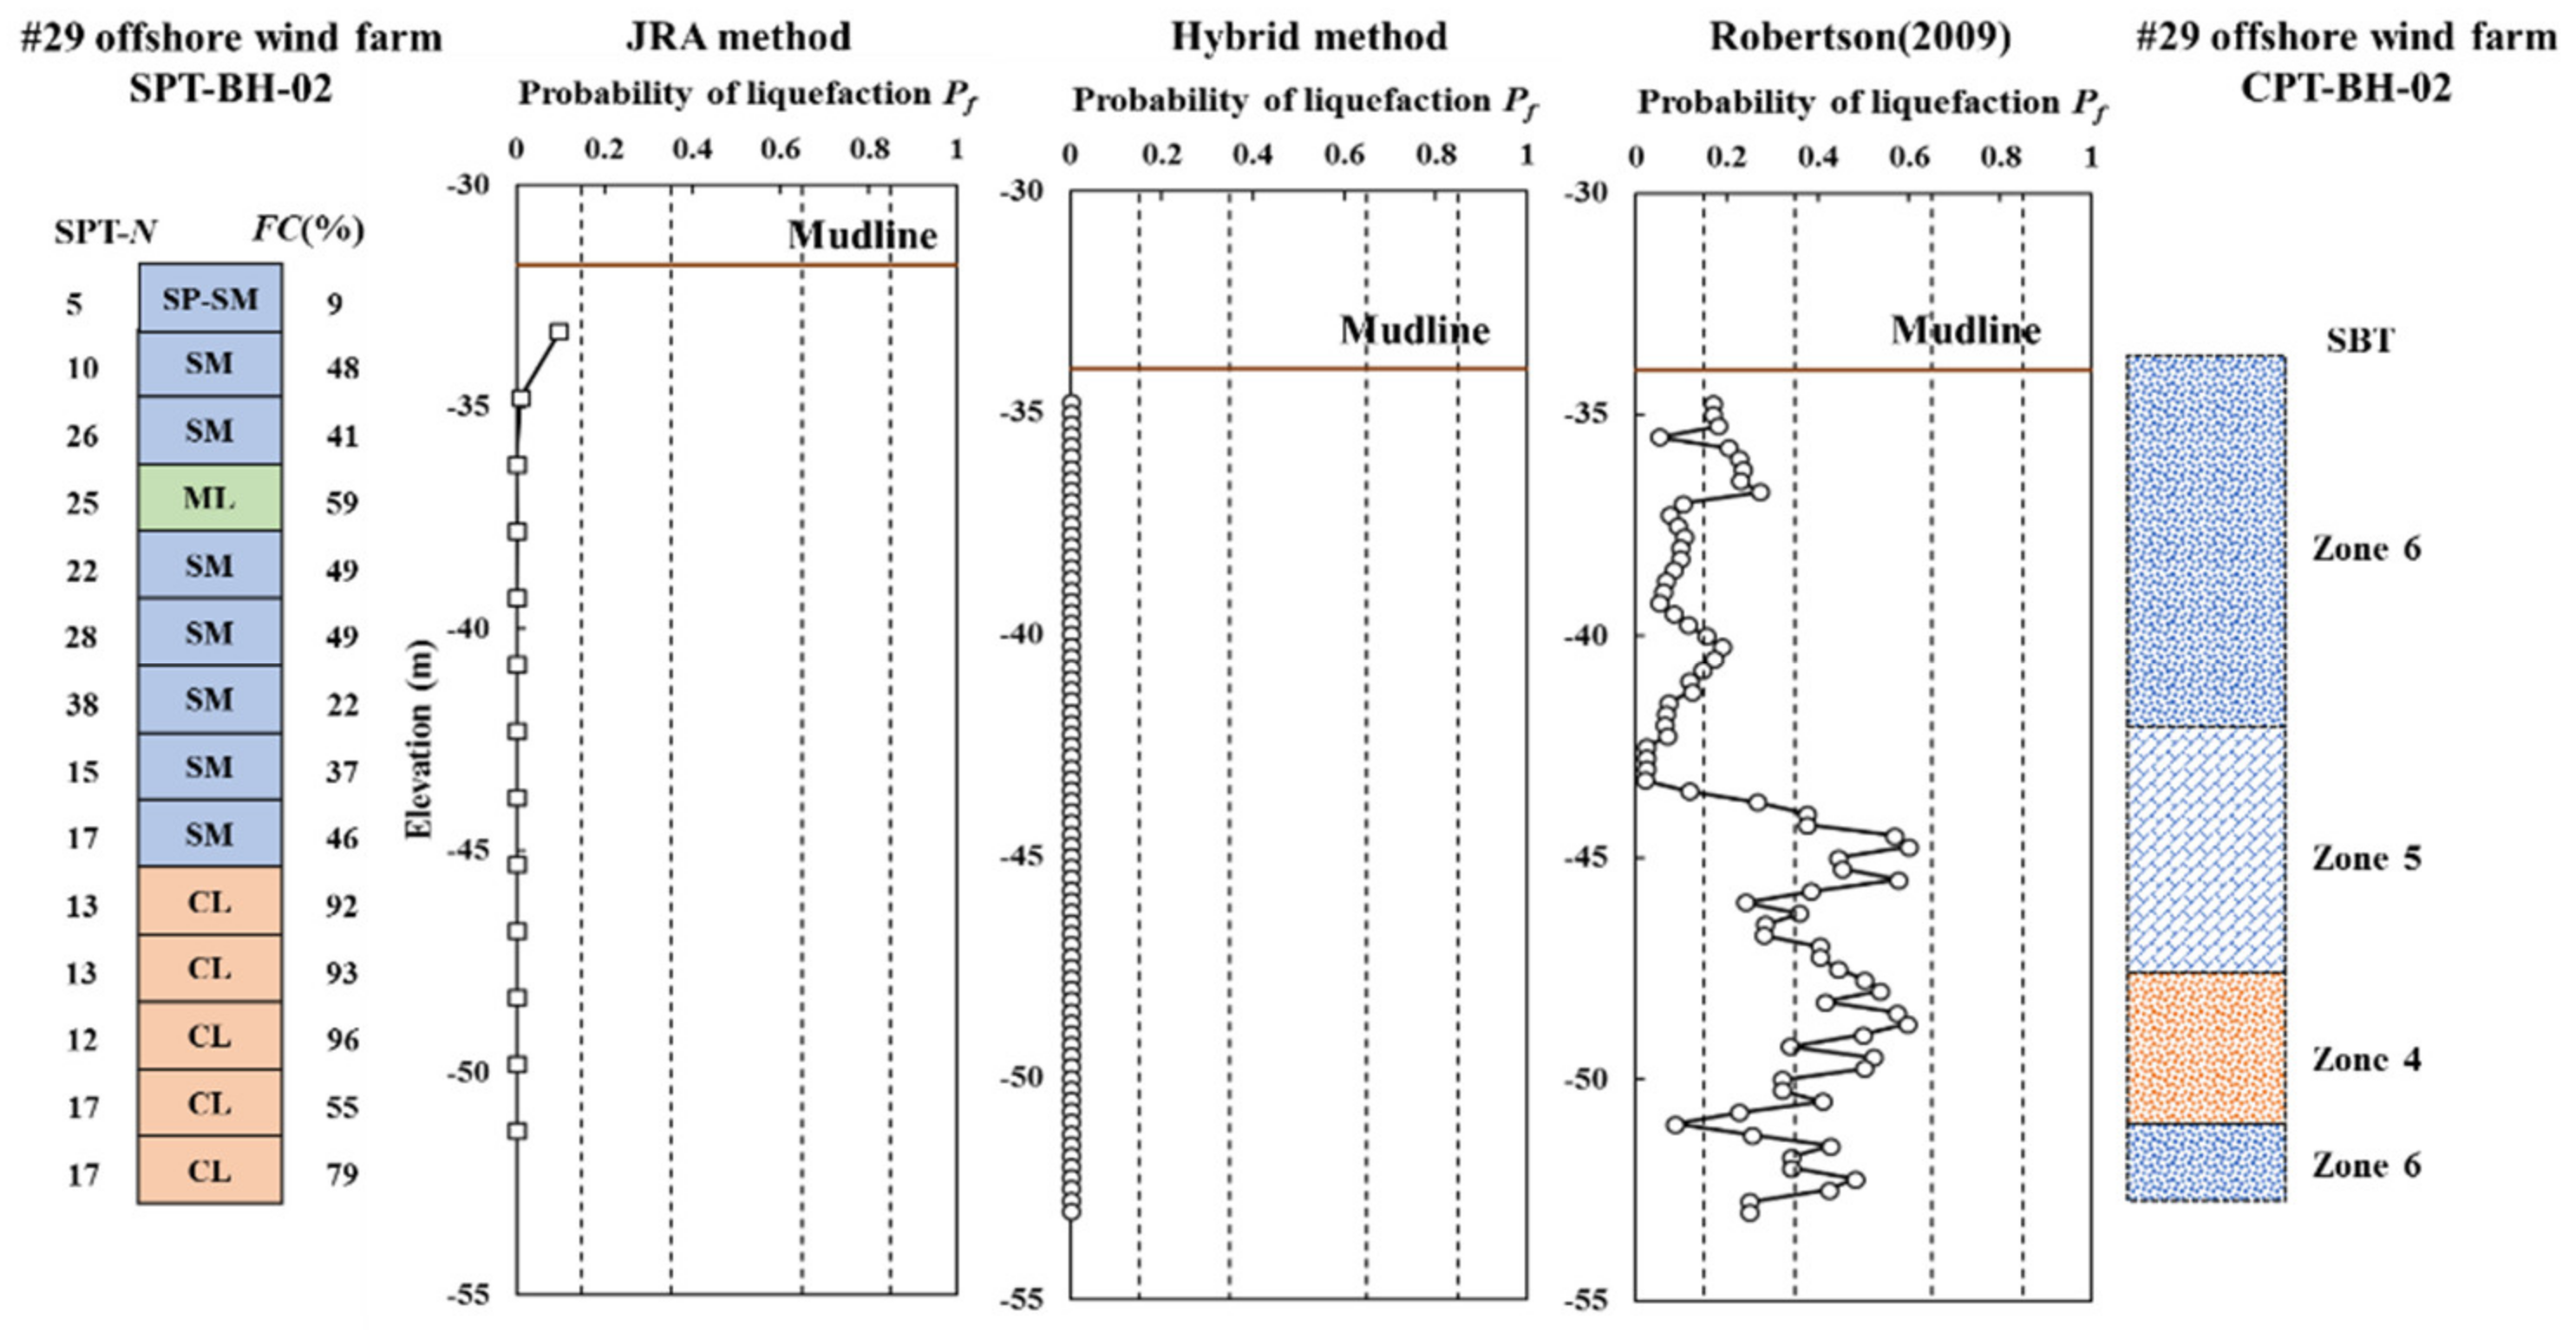
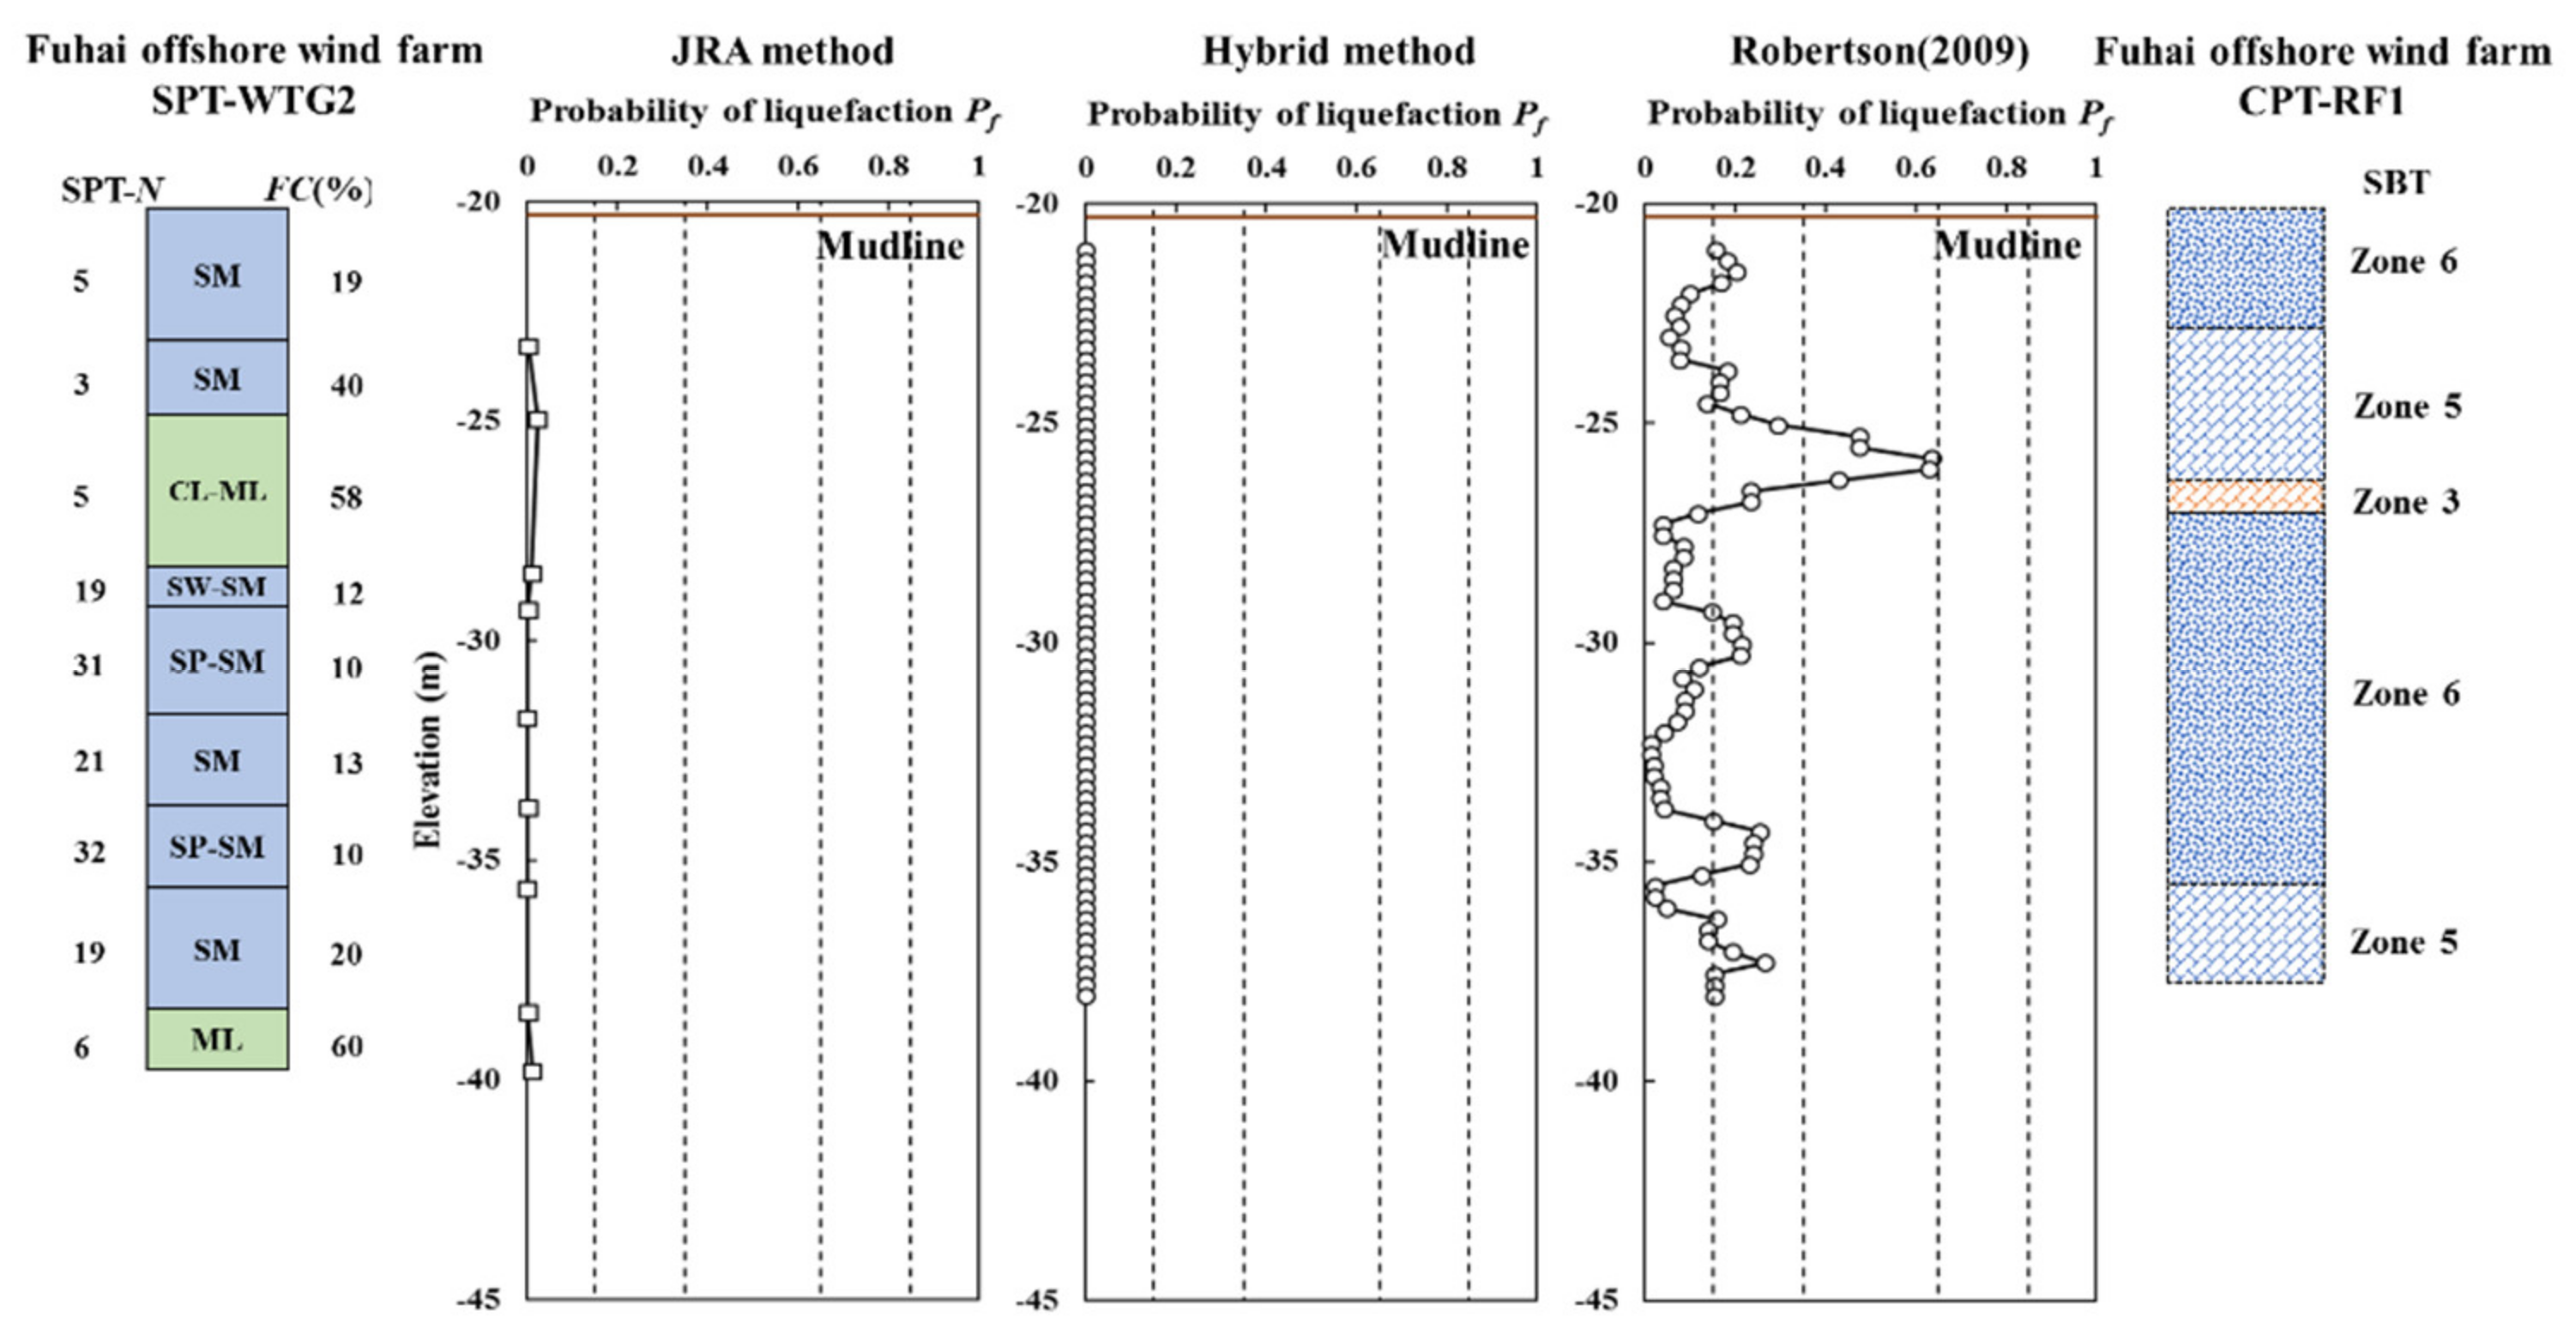
The moving average method is used to reflect the smooth trend of probability of soil liquefaction. The CPT-C3 borehole with high liquefaction potential in the hybrid method serves as an example to carry out the risk analysis and we used the CPT-qc random model combined with the simplified procedure of Robertson (2009) for probability analysis. For the risk analysis of adjacent borehole SPT-B-3, the risk analysis method of SPT refers to Kuo et al. (2020). The result of three types of analysis is shown in Figure 15, Figure 16, Figure 17, Figure 18 and Figure 19. The results show that the probability analysis results of the JRA method and hybrid method are similar, but the probability of the surface layer shows a significant difference. The main reason is that the CPT random sampling model is only classified as SBT Zone. As an example of a CPT-C3 borehole, the SBT Zone of the surface layer is Zone 5 and the qc value is in the range of 0–1 MPa. According to Figure 14, which shows the probability distribution of Zone 5, most of the random samples have a value exceeding 2 MPa, which will increase the SPT-N value and reduce the probability of soil liquefaction. Chen & Juang (2000) describe soil liquefaction likelihood classification as in Table 3 [28]. The occurrence of soil liquefaction is quantified in a specific interval; practical design can be carried out according to different design considerations. Taking the borehole CPT-C3 as an example, soil liquefaction may occur within 3 m below the seabed under the design condition Pf < 15%. The soil strength parameters should be reduced when designing an offshore wind turbine’s foundations.
6. Conclusions
This paper collects SPT data, CPT data and laboratory test results of Taiwan offshore wind farms. The liquefaction resistance ratio CRR is evaluated by the SPT-based simplified procedure, CPT-based simplified procedure and laboratory test results. The results obtained from the JRA method (SPT-based simplified procedure) and the laboratory test results are similar. To utilize the CPT data in the soil liquefaction analysis of offshore wind farms for registered professional engineers in Taiwan, we propose a hybrid soil liquefaction analysis method that incorporates the SPT–CPT correlation into the JRA method. The soil liquefaction potential analysis is carried out by using five adjacent SPT and CPT boreholes of offshore wind farms. A comparison of the analysis results shows that the hybrid method can predict the soil liquefaction potential similarly to the JRA method, which means that the hybrid method can be used to analyze soil liquefaction potential with CPT parameters reasonably.
Fine content, FC, is an important parameter in the soil liquefaction simplified procedures. When CPT tests are utilized in soil investigation in Taiwan’s offshore wind farms, laboratory testing for determining FC with soil sampling should be considered in the soil campaign.
In order to consider the impact of the uncertainty of CPT parameters on the analysis results of the seabed soil liquefaction potential of Taiwan offshore wind farms, the K–S test is used to determine the probability distribution of the qc of SBT Zone 3 to Zone 6. CPT-qc are randomly generated with Monte Carlo simulation and the hybrid method is used for quantitative assessment of soil liquefaction risk. Engineers can quickly evaluate the location and thickness of the liquefied soil layers based on the probability of soil liquefaction Pf when designing the pile foundation of the offshore wind turbine. The hybrid method can be combined with a ground model to show the location of the three-dimensional soil liquefaction layer under a specific probability of soil liquefaction conditions to reduce the risks and optimize the layout of an offshore wind farm.
Author Contributions
Conceptualization, (Y.-S.K.); methodology, (Y.-S.K.); and (K.-J.C.); software, (K.-J.C.); validation, (K.-J.C.); formal analysis, (K.-J.C.); investigation, (S.-C.C.); resources, (J.-F.C.); data curation, (H.-T.H.); writing—original draft preparation, (Y.-S.K.); and (K.-J.C.); writing—review and editing, (Y.-S.K.); and (H.-T.H.); visualization, (Y.-S.K.); and (K.-J.C.); supervision, (Y.-S.K.); project administration, (Y.-S.K.); funding acquisition, (Y.-S.K.). All authors have read and agreed to the published version of the manuscript.
Funding
The research was supported by the grants “Uncertainty of cone penetration test parameters and seabed soil liquefaction potential assessment of offshore wind farm (MOST 109-2622-E-006-005 -CC2)”, from the Ministry of Science and Technology of Taiwan and CECI Engineering Consultants, Inc., Taiwan.
Institutional Review Board Statement
Not applicable.
Informed Consent Statement
Not applicable.
Data Availability Statement
Not applicable.
Conflicts of Interest
The authors declare no conflict of interest.
References
- China Steel Company. Ground Investigation Report of #29 Offshore Wind Farm; China Steel Company: Kaohsiung, Taiwan, 2016. [Google Scholar]
- Hai-Shia Offshore Wind Energy Co., Ltd. Hai-Shia Offshore Wind Power Project (No. 27 Wind Farm); Environmental Impact Statement; Hai-Shia Offshore Wind Energy Co., Ltd.: Taiwan, 2017.
- Hai-Shia Offshore Wind Energy Co., Ltd. Hai-Shia Offshore Wind Power Project (No. 28 Wind Farm); Environmental Impact Statement; Hai-Shia Offshore Wind Energy Co., Ltd.: Taiwan, 2017.
- Chien, L.K.; Chiu, S.Y.; Feng, T.W.; Lin, T.K. The geotechnical investigation of offshore wind farm for Fuhai deployment zone. Sino Geotech. 2014, 142, 59–68. [Google Scholar]
- Ocean Research Institute (TORI). Field Investigation and Test Analysis of Drilling Soils of Chang-Bin Offshore Area; Taiwan Ocean Research Institute: Kaohsiung, Taiwan, 2012. [Google Scholar]
- Taiwan Power Company (TPC). Ground Investigation Report of Chang-Bin Pilot Offshore Wind Farm; Taiwan Power Company: Taipei, Taiwan, 2012. [Google Scholar]
- Taiwan Power Company (TPC). Bidding Review Information for Offshore Wind Farm Development; Taiwan Power Company: Taipei, Taiwan, 2018. [Google Scholar]
- Bureau of Standards, Metrology and Inspection (BSMI). Standard of Wind Turbines, Part 1: Design Requirements (CNS15176-1); Bureau of Standard, Metrology and Inspection: Taipei, Taiwan, 2018.
- Construction and Planning Agency (CPA). Seismic Design Specifications and Commentary of Buildings; Construction and Planning Agency: Taipei, Taiwan, 2011. [Google Scholar]
- Seed, H.B.; Idriss, I.M. Simplified procedure for evaluating soil liquefaction potential. J. Soil Mech. Found. Div. 1971, 97, 1249–1273. [Google Scholar] [CrossRef]
- Tokimatsu, K.; Yoshimi, Y. Empirical correlation of soil liquefaction based on SPT N-value and fines content. Soils Found. 1983, 23, 56–74. [Google Scholar] [CrossRef] [Green Version]
- Seed, H.B.; Tokimatsu, K.; Harder, L.F.; Chung, R.M. The influence of SPT procedures in soil liquefaction resistance evalua-tions. J. Geotech. Eng. 1985, 111, 1425–1445. [Google Scholar] [CrossRef]
- Japan Road Association. Specification for Highway Bridges, Part V, Seismic Design; Japan Road Association: Tokyo, Japan, 1996. [Google Scholar]
- Seed, H.B.; Idriss, I. Evaluation of Liquefaction Potential of Sands Deposits Based on Observations of Performance in Previous Earthquakes, Session on In Situ Testing to Evaluate Liquefaction Susceptibility. In Proceedings of the ASCE National Convention, St. Louis, MO, USA, 26–28 October 1981. Preprint 81-544. [Google Scholar]
- Douglas, B.J.; Olsen, R.S.; Martin, G.R. Evaluation of the Cone Penetrometer Test for SPT Liquefaction Assessment, Session on In Situ Testing to Evaluate Liquefaction Susceptibility. In Proceedings of the ASCE National Convention, St. Louis, MO, USA, 26–28 October 1981. Preprint 81-544. [Google Scholar]
- Robertson, P.K.; Campanella, R.G. Liquefaction potential of sands using the CPT. J. Geotech. Eng. 1985, 111, 384–403. [Google Scholar] [CrossRef]
- Seed, H.B.; de Alba, P. Use of SPT and CPT Tests for Evaluating the Liquefaction Resistance of Sands; Use of In-Situ Tests in Geotechnical Engineering; ASCE: Reston, VA, USA, 1986; pp. 281–302. [Google Scholar]
- Stark, T.D.; Olson, S.M. Liquefaction resistance using CPT and field case histories. J. Geotech. Eng. 1995, 121, 856–869. [Google Scholar] [CrossRef] [Green Version]
- Robertson, P.K.; Wride, C.E. Evaluating cyclic liquefaction potential using the cone penetration test. Can. Geotech. J. 1998, 35, 442–459. [Google Scholar] [CrossRef]
- Youd, T.L.; Idriss, I.M. Liquefaction resistance of soils: Summary report from the 1996 NCEER and 1998 NCEER/NSF workshops on evaluation of liquefaction resistance of soils. J. Geotech. Geoenviron. Eng. 2001, 127, 297–313. [Google Scholar] [CrossRef] [Green Version]
- Robertson, P. Performance based earthquake design using the CPT. In Proceedings of the International Conference on Performance-Based Design in Earthquake Geotechnical Engineering, Tokyo, Japan, 15–18 June 2009. [Google Scholar]
- Liao, S.S.C.; Veneziano, D.; Whitman, R.V. Regression models for evaluating liquefaction probability. J. Geotech. Eng. 1988, 114, 389–411. [Google Scholar] [CrossRef]
- Youd, T.L.; Noble, S.K. Liquefaction criteria based on statistical and probabilistic analyses. In Proceedings of the NCEER Workshop on Evaluation of Liquefaction Resistance of Soils, Salt Lake City, UT, USA, 5–6 January 1996; Volume 22, pp. 201–205. [Google Scholar]
- Toprak, S.; Holzer, T.L.; Bennett, M.J.; Tinsley, J.C., III. CPT-and SPT-based probabilistic assessment of liquefaction. In Proceedings of the 7th US–Japan Workshop on Earthquake Resistant Design of Lifeline Facilities and Countermeasures Against Liquefaction, Seattle, WA, USA, 4–7 November 1999; pp. 69–86. [Google Scholar]
- Haldar, A.; Tang, W.H. Probabilistic evaluation of liquefaction potential. J. Geotech. Eng. Div. 1979, 105, 145–163. [Google Scholar] [CrossRef]
- Yegian, M.K.; Whitman, R.V. Risk analysis for ground failure by liquefaction. J. Geotech. Eng. Div. 1978, 104, 921–938. [Google Scholar] [CrossRef]
- Chen, C.J.; Juang, C.H. Calibration of SPT- and CPT-based liquefaction evaluation methods. Slope Stab. 2000, 49–64. [Google Scholar] [CrossRef]
- Juang, C.H.; Jiang, T. Assessing probabilistic methods for liquefaction potential evaluation. Slope Stab. 2000, 148–162. [Google Scholar] [CrossRef]
- Juang, C.H.; Chen, C.J.; Jiang, T.; Andrus, R.D. Risk-based liquefaction potential evaluation using standard penetration tests. Can. Geotech. J. 2000, 37, 1195–1208. [Google Scholar] [CrossRef]
- Juang, C.H.; Jiang, T.; Andrus, R.D. Assessing probability-based methods for liquefaction potential evaluation. J. Geotech. Geoenviron. Eng. 2002, 128, 580–589. [Google Scholar] [CrossRef]
- Kuo, Y.-S.; Chong, K.-J.; Tseng, Y.-H.; Hsu, C.-W.; Lin, C.-S. Assessment on liquefaction potential of seabed soil in Chang-Bin Offshore wind farm considering parametric uncertainty of standard penetration tests. Eng. Geol. 2020, 267, 105497. [Google Scholar] [CrossRef]
- Kanth, S.T.G.R.; Dash, S.K. Stochastic modeling of SPT N-Value and evaluation of probability of liquefaction at Guwahati city. J. Earthq. Tsunami 2008, 2, 175–196. [Google Scholar] [CrossRef]
- Robertson, P.K. Soil behavior type from the CPT: An Update. In Proceedings of the 2nd International Symposium on Cone Penetration Testing, CPT’10, Huntington Beach, CA, USA, 9–11 May 2010. [Google Scholar]
- Pincus, H.; Jefferies, M.; Davies, M. Use of CPTu to estimate equivalent SPT N60. Geotech. Test. J. 1993, 16, 458. [Google Scholar] [CrossRef]
- Hashash, Y.M.A.; Musgrove, M.I.; Harmon, J.A.; Ilhan, O.; Groholski, D.R.; Phillips, C.A.; Park, D. DEEPSOIL 7.0, User Manual; University of Illinois at Urbana-Champaign: Champaign, IL, USA, 2017. [Google Scholar]
- Japan Road Association. Design Specifications of Highway Bridges, Part V Seismic Design; Maruzen: Tokyo, Japan, 2002. [Google Scholar]
- Seed, H.B. Representation of Irregular Stress Time Histories by Equivalent Uniform Stress Series in Liquefaction Analyses; National Technical Information Service: Berkeley, CA, USA, 1975.
- Seed, H.B.; Lee, K.L. Liquefaction of saturated sands during cyclic loading. J. Soil Mech. Found. Div. 1966, 92, 105–134. [Google Scholar] [CrossRef]
- Seed, H.B.; Peacock, W.H. Test procedures for measuring soil liquefaction characteristics. J. Soil Mech. Found. Div. 1971, 97, 1099–1119. [Google Scholar] [CrossRef]
- Pyke, R.M.; Seed, H.B.; Chan, C.K. Settlement of sands under multi-directional loading. J. Geotech. Eng. Div. 1975, 101, 379–398. [Google Scholar] [CrossRef]
- Seed, H.B.; Arango, I.; Chan, C.K. Evaluation of Soil Liquefaction Potential for Level Ground during Earthquakes, A Summary Report; No. NUREG-0026; Shannon and Wilson Inc.: Seattle, WA, USA; Agbabian Associates: El Segundo, CA, USA, 1975. [Google Scholar]
- Idriss, I.M.; Boulanger, R.W. Soil Liquefaction during Earthquakes; Earthquake Engineering Research Institute: Oakland, CA, USA, 2008. [Google Scholar]
- Robertson, P.K.; Campanella, R.G.; Wightman, A. SPT-CPT correlations. J. Geotech. Eng. 2008, 109, 1449–1459. [Google Scholar] [CrossRef]
- Kulhawy, F.H.; Mayne, P.H. Manual on Estimation Soil Properties for Foundation Design; Report No. EPRI-EL-6800; Electric Power Research Institute, EPRI: Palo Alto, CA, USA; Cornell University: Ithaca, NY, USA, 1990. [Google Scholar]
- Robertson, P.K.; Campanella, R.G.; Gillespie, D.; Greig, J. Use of Piezometer Cone Data. In Use of In Situ Tests in Geotechnical Engineering; ASCE: Reston, VA, USA, 1986; pp. 1263–1280. [Google Scholar]
- Lunne, T.; Robertson, P.K.; Powell, J.J.M. Cone-penetration testing in geotechnical practice. Soil Mech. Found. Eng. 2009, 46, 237. [Google Scholar] [CrossRef] [Green Version]
- Robertson, P.K. Soil classification using the cone penetration test. Can. Geotech. J. 1990, 27, 151–158. [Google Scholar] [CrossRef]
- Robertson, P.K. Interpretation of in-situ tests—Some insights. In Proceedings of the ISC-4 Geotechnical Site Characterization, Recife, Brazil, 18–21 September 2012. [Google Scholar]
- Ku, C.S. A Study on Soil Classification and Liquefaction Evaluation Based on CPT. Ph.D. Thesis, National Cheng Kung University, Tainan, Taiwan, 2001. [Google Scholar]
- Huang, A.-B.; Tai, Y.-Y.; Lee, W.F.; Huang, Y.-T. Field evaluation of the cyclic strength versus cone tip resistance correlation in silty sands. Soils Found. 2009, 49, 557–567. [Google Scholar] [CrossRef] [Green Version]
- Idriss, I.; Boulanger, R. Semi-empirical procedures for evaluating liquefaction potential during earthquakes. Soil Dyn. Earthq. Eng. 2006, 26, 115–130. [Google Scholar] [CrossRef]
- Lo Presti, D.C.; Giusti, I.; Cosanti, B.; Squeglia, N.; Pagani, E. Interpretation of CPTu in ‘unusual’ soils. Riv. Ital. Geotec. 2016, 50, 23–42. [Google Scholar]
- Meisina, C.; Kardoğan, P.S. Öztürk; Bonì, R.; Stacul, S.; Castaldini, D.; Fontana, D.; Lugli, S.; Bordoni, M.; Presti, D.L. Development and Use of a Minicone for Liquefaction Risk Evaluation in Layered Soil Deposits. J. Geotech. Geoenviron. Eng. 2021, 147, 04020169. [Google Scholar] [CrossRef]
- Boulanger, R.W.; DeJong, J.T. Inverse filtering procedure to correct cone penetration data for thin-layer and transition effects. In Cone Penetration Testing; CRC Press: Boca Raton, FL, USA, 2018; pp. 25–44. [Google Scholar]
- Boulanger, R.W.; Idriss, I.M. CPT and SPT Based Liquefaction Triggering Procedures; Report No. UCD/CGM-14/01; University of California: Davis, CA, USA, 2014. [Google Scholar]
- Baecher, G.B.; Christian, J.T. Reliability and Statistics in Geotechnical Engineering; John and Wiley and Sons: Chichester, UK, 2003. [Google Scholar]
- Seyedein, M.S.; Chenari, R.J.; Eslami, A. Investigation on probability density function for cone penetration test data. In Proceedings of the AECM’ 12, Seoul, Korea, 26–29 August 2012. [Google Scholar]
- Laufer, I. Statistical analysis of CPT tip resistances. Period. Polytech. Civ. Eng. 2013, 57, 45–61. [Google Scholar] [CrossRef] [Green Version]
- Shakir, R.R. Probabilistic-based analysis of a shallow square footing using Monte Carlo simulation. Eng. Sci. Technol. Int. J. 2019, 22, 313–333. [Google Scholar] [CrossRef]
- Shakir, R.R. Selecting the probability distribution of cone tip resistance using moment ratio diagram for soil in Nasiriyah. Geotech. Geol. Eng. 2018, 37, 1703–1728. [Google Scholar] [CrossRef]
Figure 1.
Locations of SPT and CPT boreholes in Changhua offshore wind farm.

Figure 2.
Comparison of SPT and CPT soil profiles at Taiwan offshore wind farm.

Figure 3.
Response spectra at #29 offshore wind farm engineering bedrock.

Figure 4.
SPT-based resistance curve for different fine content values.

Figure 5.
The resistance curve of the laboratory test.

Figure 6.
Comparing the results of cyclic laboratory test and simplified method.

Figure 7.
Relationship between SPT-N60 and CPT-qc as a function of Ic.

Figure 8.
Relationship between FC and Ic in adjacent borehole.

Figure 9.
The soil liquefaction potential of boreholes CPT-BH-01 and SPT-BH-01 in #29 offshore wind farm.
Figure 9.
The soil liquefaction potential of boreholes CPT-BH-01 and SPT-BH-01 in #29 offshore wind farm.

Figure 10.
The soil liquefaction potential of boreholes CPT-BH-02 and SPT-BH-02 in #29 offshore wind farm.
Figure 10.
The soil liquefaction potential of boreholes CPT-BH-02 and SPT-BH-02 in #29 offshore wind farm.

Figure 11.
The soil liquefaction potential of boreholes CPT-RF1 and SPT-WTG2 in Fuhai offshore wind farm.
Figure 11.
The soil liquefaction potential of boreholes CPT-RF1 and SPT-WTG2 in Fuhai offshore wind farm.

Figure 12.
The soil liquefaction potential of boreholes CPT-RT1 and SPT-B1 in TPC offshore wind farm.
Figure 12.
The soil liquefaction potential of boreholes CPT-RT1 and SPT-B1 in TPC offshore wind farm.

Figure 13.
The soil liquefaction potential of boreholes CPT-C3 and SPT-B-3 in TPC offshore wind farm.
Figure 13.
The soil liquefaction potential of boreholes CPT-C3 and SPT-B-3 in TPC offshore wind farm.

Figure 14.
SBT Zone 3 to Zone 6 CPT–qc probability distribution histogram.

Figure 15.
The probability of liquefaction of boreholes CPT-BH-01 and SPT-BH-01 in #29 offshore wind farm.
Figure 15.
The probability of liquefaction of boreholes CPT-BH-01 and SPT-BH-01 in #29 offshore wind farm.

Figure 16.
The probability of liquefaction of boreholes CPT-BH-02 and SPT-BH-02 in #29 offshore wind farm.
Figure 16.
The probability of liquefaction of boreholes CPT-BH-02 and SPT-BH-02 in #29 offshore wind farm.

Figure 17.
The probability of liquefaction of boreholes CPT-RF1 and SPT-WTG2 in Fuhai offshore wind farm.
Figure 17.
The probability of liquefaction of boreholes CPT-RF1 and SPT-WTG2 in Fuhai offshore wind farm.

Figure 18.
The probability of liquefaction of boreholes CPT-RT1 and SPT-B-1 in TPC offshore wind farm.
Figure 18.
The probability of liquefaction of boreholes CPT-RT1 and SPT-B-1 in TPC offshore wind farm.

Figure 19.
The probability of liquefaction of boreholes CPT-C3 and SPT-B-3 in TPC offshore wind farm.
Figure 19.
The probability of liquefaction of boreholes CPT-C3 and SPT-B-3 in TPC offshore wind farm.


Table 1.
Soil classification of CPT.
| Zone | Ic | Description | Characteristic |
|---|---|---|---|
| 2 | Ic > 3.60 | Organic soils—peats | Cohesive |
| 3 | 2.95 < Ic < 3.60 | Clays—clay to silty clay | |
| 4 | 2.60 < Ic < 2.95 | Silt mixtures—clayey silt to silty clay | |
| 5 | 2.05 < Ic < 2.60 | Sand mixtures—silty sand to sandy silt | Cohesionless |
| 6 | 1.31 < Ic < 2.05 | Sands—clean sand to silty sand | |
| 7 | Ic < 1.31 | Gravelly sand to sand |
Table 2.
Statistical parameters of CPT-qc probability distribution for SBT zone.
| CPT-qc | Distribution | Probability Density Function | Parameter |
|---|---|---|---|
| Zone 3 | Weibull | σ = 0.6696 μ = 0.9946 | |
| Zone 4 | Beta | α = 1.8818 β = 1.9482 | |
| Zone 5 | Weibull | α1 = 1.4691 α2 = 5.2573 a = 0.4624 b = 12.665 | |
| Zone 6 | Normal | α = 2.8139 β = 7.5718 |
Table 3.
Soil liquefaction likelihood classification.
| Class | Probability of Soil Liquefaction (Pf) | Description of Likelihood |
|---|---|---|
| 5 | Pf ≥ 0.85 | Almost certain that it will liquefy |
| 4 | 0.65 ≤ Pf < 0.85 | Liquefaction very likely |
| 3 | 0.35 ≤ Pf < 0.65 | Liquefaction and non-liquefaction equally likely |
| 2 | 0.15 ≤ Pf < 0.35 | Liquefaction unlikely |
| 1 | Pf < 0.15 | Almost certain that it will not liquefy |
Publisher’s Note: MDPI stays neutral with regard to jurisdictional claims in published maps and institutional affiliations. |
© 2021 by the authors. Licensee MDPI, Basel, Switzerland. This article is an open access article distributed under the terms and conditions of the Creative Commons Attribution (CC BY) license (http://creativecommons.org/licenses/by/4.0/).
Share and Cite
MDPI and ACS Style
Kuo, Y.-S.; Chong, K.-J.; Chang, S.-C.; Chai, J.-F.; Hsu, H.-T. A Hybrid Method to Evaluate Soil Liquefaction Potential of Seabed at Offshore Wind Farm in Taiwan. Energies 2021, 14, 1853. https://doi.org/10.3390/en14071853
AMA Style
Kuo Y-S, Chong K-J, Chang S-C, Chai J-F, Hsu H-T. A Hybrid Method to Evaluate Soil Liquefaction Potential of Seabed at Offshore Wind Farm in Taiwan. Energies. 2021; 14(7):1853. https://doi.org/10.3390/en14071853
Chicago/Turabian StyleKuo, Yu-Shu, Kai-Jun Chong, Shang-Chun Chang, Juin-Fu Chai, and Hui-Ting Hsu. 2021. "A Hybrid Method to Evaluate Soil Liquefaction Potential of Seabed at Offshore Wind Farm in Taiwan" Energies 14, no. 7: 1853. https://doi.org/10.3390/en14071853
Note that from the first issue of 2016, this journal uses article numbers instead of page numbers. See further details here.