Article

Total Cost of Ownership and Its Potential Consequences for the Development of the Hydrogen Fuel Cell Powered Vehicle Market in Poland

1
Division of Aircraft Construction and Operation, Institute of Aviation Technology, Faculty of Mechatronics, Armament and Aerospace of the Military University of Technology, Sylwestra Kaliskiego 2, 00-908 Warsaw, Poland
2
Research Center for Management of Energy Sector, Institute of Management, University of Szczecin, Cukrowa Street 8, 71-004 Szczecin, Poland
3
Faculty of Economics, West Pomeranian University of Technology Szczecin, Zołnierska 47, 71-210 Szczecin, Poland
*
Authors to whom correspondence should be addressed.
Energies 2021, 14(8), 2131; https://doi.org/10.3390/en14082131
Submission received: 11 March 2021 / Revised: 26 March 2021 / Accepted: 31 March 2021 / Published: 11 April 2021
(This article belongs to the Special Issue Sustainable Finance in Energy Sectors)

Abstract

:
Electromobility is a growing technology for land transport, constituting an important element of the concept of sustainable economic development. The article presents selected research results concerning one of the segments of this market-vehicles powered by hydrogen fuel cells. The subject of the research was to gain extensive knowledge on the economic factors influencing the future purchasing decisions of the demand side in relation to this category of vehicles. The research was based on a numerical experiment. For this purpose, a comparative analysis of purchase prices in relation to the TCO of the vehicle after 3–5 years of use was performed. The research included selected models that are powered by both conventional and alternative fuels. The use of this method will allow to assess the real costs associated with the hydrogen vehicle. The authors emphasize the important role of economic factors in the form of the TCO index for the development of this market. The experimental approach may be helpful in understanding the essence of economic relations that affect the development of the electro-mobility market and the market demand for hydrogen fuel cell-powered vehicles in Poland.

1. Introduction

Along with the deteriorating quality of life, there is a reorientation of activities towards sustainable and intelligent transport solutions [1,2,3,4,5,6,7]. One of such precedent, is a plan for electrification of means of transport through electromobility development programs, promoted by the governments of individual countries [8,9,10,11,12,13,14,15]. One of the key problems that should be solved as soon as possible is reduction of environmental pollution from the use of conventionally powered vehicles [16,17,18,19]. Introduction of Rechargeable Hybrid Cars (PHEV) was the first step towards clean transport [20,21]. Although they were intended to reduce emissions by 38–41% compared to conventional vehicles [22,23,24]. Research published by the International Clean Transport Council (ICCT) shows, that PHEV users rarely use the possibility of connecting their cars to the power grid. As the outcome, the actual level of CO2 emissions, was 2–4 times higher than the catalog data [25]. The next step in this process was the introduction to the market of EV/BEV vehicles, which are distinguished by zero emissions of carbon dioxide, hydrocarbons and nitrogen oxides.
A significant German consulting company -Berylls Strategy Advisors-published a report which indicates that the production and use of electric cars is very energy-intensive, considering that in countries such as Poland [26,27], electricity is mainly produced from fossil fuels [28]. However, it is possible, to use renewable or zero-emission energy sources for the production of hydrogen fuel [29]. This problem can be solved with hydrogen powered vehicles (FCV) [30,31]. In this case, hydrogen can be used to power cars in two ways. Firstly, it can be exploited as a fuel in a traditional combustion engine and secondly, it might be used to run an electric vehicle [32]. Many studies shows the benefits of using hydrogen powered vehicles [33,34], unlike other classic cars, they do not emit pollutants into the environment (The only by-product is H2O). Another advantage, unlike BEVs, is their quick refueling process [34]. Meaning that, in contrast to classic electric cars, it takes an average of 3–5 min (depending on the type of charging station and vehicle type) to load the full range of the vehicle [35]. What is more, comparing hydrogen powered vehicles to classic electric cars in the field of total range, pops out that hydrogen cars (which are available on the European market in 2020) have an average around 500 km. This parameter is comparable to the range of vehicles equipped with conventional combustion engines, and larger than an electric vehicle by an average of over 200 km. Better parameters in terms of fuel economy and high constant torque of the engine, is another advantage in favor of hydrogen powered vehicles, not to mention the advantage of elimination of high-frequency sounds and impulse noise accompanying energy production [31]. Moreover, many researchers emphasize that FCV and FCEV vehicles contain fewer moving parts than traditional internal combustion vehicles [30,31,32,35]. As a result, in theory, they should generate lower operating costs and be characterized by a higher reliability coefficient [36].
Despite the many advantages of FCV and FCEV vehicles and the programs encouraging their purchase, the current situation with the usage of this type of vehicles in urban transport systems in Poland and others is not impressive [37]. Researchers emphasize that this state of affairs is influenced by economic factors [38,39].
The literature on the subject emphasizes, that under the time of stagnation in the demand of many market segments, the purchase of a car should be based primarily on a precise and realistic economic calculation [40]. In practice, this means that all expenses for the car should be calculated on the basis of all related costs. A helpful tool that can help in this process is the Total Cost of Ownership (TCO) parameter.
Although TCO is a term used to describe the cost structure related to the functioning of assets in an enterprise [41], this indicator has also found its practical application in relation to the automotive market and determines the total cost of use of the vehicle [42]. Buying a new car is an investment that has long-term economic consequences. Thus, every user of the vehicle should be familiar with all estimating costs associated with owning it. This TCO index allows the user of the vehicle not only to determine the amount of money that he will have to incur during the exploitation process, but also, at the stage of making a purchase decision, in the reference to the loss of value which would occur after a given period of its usage.
As indicated in the available literature on the subject, TCO consists of two basic parameters: loss of value of the car at resale and costs of its use [43]. Impairment of a car is the difference between the car’s purchase price and its residual value, i.e., the price at which the car can be resold. The resale market value of the vehicle is defined as the market value for the sale of a vehicle is defined as the residual value of vehicle ownership [44] The residual value of a vehicle is influenced by many factors, not only of an economic nature, but also of technical aspects, which at the first stage of consideration are not fully verifiable and traceable, especially in the available studies. There are several factors to consider when predicting a vehicle’s future resale value, such as the type of power source, the frequency of model changes for a given vehicle brand, the frequency of faults, and overall consumer perception of the brand.
A significant impact on the loss of the residual value of the vehicle is its equipment, i.e., the more expensive the package of extra-standard equipment, the greater the loss of the residual value of the vehicle.
On the other hand, the category of operating costs includes min. fuel- energy cost. Experts from the automotive market emphasize that it is challenging to estimate TCO elements, mainly due to the unknown as to fuel-energy prices in the long run. With the glance on the current market, the prices of raw materials depends on many factors beyond the control of the vehicle user [45,46,47]. Estimating the fuel-energy consumption, based on the analysis of the average mileage of the vehicle, is a much easier process. In the case of this cost category, observations of the market reality indicates that one should not rely on catalog data, but on reliable combustion tests of renowned research institutes.
The costs of using the vehicle also includes insurance costs. While the estimation of insurance costs in the first year of vehicle ownership is not a complex process, it may be much more difficult in the following years, while the estimation of insurance costs in the first year of vehicle ownership is not a complex process, it may be much more difficult in the following years.
Insurance costs are influenced not only by the history of our accidents, but also by the selected brand, model or engine version [48]. A slightly more straightforward process is to estimate the cost of insurance in the case of a leasing vehicle or long-term rental. In this case, the price of the policy is a component of the instalments paid and, as a rule, it is a fixed value usually defined for the entire duration of the contract.
Other cost categories are service and operation. Estimating the costs of compulsory inspections from a procedural point of view should not cause problems, because information on the price for the service and the frequency of inspections is available at any dealers of a given brand. However, a much more complicated process is to estimate the costs of possible repairs and the cost of spare parts.
The costs of usage also includes the costs of purchasing tires and registration. Although the purchase costs of tires are part of the service costs, nevertheless, due to their cyclical nature, it is easier to estimate their cost over a more extended period of time in a separate cost category. The same applies to vehicle registration costs.
At this stage, it is worth emphasizing that in the case of TCO, some researchers mention other costs of car ownership [49] such as parking fees, tolls for highways, car wash costs, etc. As a result, their TCO share is negligible and most market analysts do not include them in their TCO analysis.
Market observations shows that despite many advantages resulting from including the parameter in the form of total costs in the purchasing strategy, this tool has no practical application. This state of affairs is influenced by certain factors, resulting, inter alia, from the lack of proper knowledge in the use of this device, or an incorrect process approach in the area of meeting the purchasing needs. The analysis of purchasing decisions on the polish automotive market allows us to state that the most important of them includes:
  • Lack of awareness of vehicle users about overhead costs beyond the purchase price apart from the purchase price. The vehicle purchase price parameter is still the basic selection criterion. Many potential users still decides to buy a vehicle, analyzing only the purchase price. This leads to the lack of awareness of the demand side that, in general, the potential economic benefits obtained from the low purchase price of the vehicle may be offset precisely by the additional costs associated with its use.
  • Lack of a process approach in facing the purchasing needs on the demand side. The new procurement process based on TCO analysis requires additional time, for example to collect relevant data and perform analyzes and forecasts.
  • Lack of special knowledge and experience in conducting a self-contained TCO analysis. Most future vehicle owners are unaware that a complete TCO analysis requires a set of data that takes into account many cost parameters.
  • No access to specialized expert programs. In up to date market’s reality, a small group of automotive experts have access to the tools, which significantly limits the possibility of popularizing and using this instrument in optimizing purchasing processes.
The correct estimation of TCO is not only a complex process, but also requires interdisciplinary knowledge. It is worth emphasizing that this variable includes many factors that may not be fully verifiable at the initial stage of car purchase planning, and even very difficult to estimate. As in the case of other European automotive markets [50,51,52,53], the knowledge of the essence of the TCO parameter, i.e., the total cost of usage of a vehicle, is of fundamental economic base, both for private users and for owners of a commercial vehicle fleet in terms of the growing importance of vehicles such as polish electromobility market. In order to create appropriate mathematical algorithms, formulas and experimental data on reference combustion engines are necessary [54,55,56]. These data will make it possible to define the reference values of energy consumption and failure frequency of ICEV vehicles in relation to other propulsion systems [57,58,59,60,61].
This study extends the current research in the field of electromobility by showing the important role of economic factors identified as total costs of ownership in the development of the hydrogen fuel cell-powered vehicle market in Poland.
The results constitute the foundation for every region, country in the world, because they mainly refer to the nature of the timetable broken down into individual types of drive systems of motor vehicles. Thus, the potential user, operator or group of interested manufacturers can see the results of the specific proposed solutions and cost of ownership analysis. The consequences of the introduced consumer incentives may be the appropriate selection of the propulsion system for a given timetable in a given urban or non-urban agglomeration. Additionally, a strategy for planning the implementation of individual stages of hydrogen fuel implementation in a given territorial area can be adopted. Total cost of ownership with the adoption of specific conditions of use, operation and reliability phenomena will contribute to the precise determination of the strengths and weaknesses of the implementation of given drive system solutions or transformation of the transport system in a universal manner for any terrain.
To the best of our knowledge, this article is the first to combine TCO considerations with the development of the hydrogen cell vehicle market (including a comparative analysis of models on the market that run on both conventional and alternative fuels) and the first to address in the study case-domestic market. In short, this article brings new insights to the existing literature in the following areas: (I) electromobility and development strategy, (II) demand modeling for hydrogen fuel cell vehicles, passenger vehicle segment, (II) technology (fuel cells) and (IV) sustainable development and the domestic market.
The scientific novelty of the work is the expansion of the total cost of ownership model with utility values, including in particular the aspects of periodic and aperiodic faults. The introduction of these variables with the division into appropriate driving modes and types of drive system preferred by users significantly changes the general perception as to the justification for using a given solution. This model makes it possible to very precisely forecast the future economic effects of the introduced solution. The nature of faults and their frequency of occurrence is a very complex problem, especially in the assessment of different drives and different driving mode preferences in a given area. These data indicate significant differences in the results and analyzes in relation to the current models. Additionally, the introduced adjustments are based on actual user data for given groups, which significantly increases the credibility of the forecasts obtained.
The article is organized as follows. Section 2 provides a detailed description of the research approach. Section 3 describes the results of experimental studies, and contains their interpretations. Section 4 presents the final conclusions of the research, indicating their limitations, practical application and future directions of research in this field.

2. Methodology

The comparison of the energy consumption of HFEV vehicles, taking into account all energy losses resulting from the vehicle movement depending on the adopted characteristics of their displacement in relation to vehicles with other drives, is crucial in the analysis of the economic use of these vehicles. Analytical research should take into account the model of the location of the refueling station and the model of the power system and analyze their interaction. The adopted correlation of these parameters allows to determine the nature of the vehicle timetable, the potential distribution of the drive system load, which translates into the total efficiency of the vehicle and its effective range.
The adoption of the total cost of ownership (TCO) method allows to create a model of the costs of purchasing an HFEV and ICEV (Internal combustion engine vehicle) vehicle and the costs of services related to their operation and operation for a specific group of suppliers and covers the total cost of living related to the ownership of a given vehicle. This assessment is based on many variables that must be taken into account in order to obtain reliable results of the economic efficiency of the given drive system solutions. TCO modes are implemented using aggregated forecasts (periodic and stochastic models) and historical data to determine costs. A vehicle mileage of approximately 60,000 km was selected as the mileage variable. Consistent with the objective of operating cost modeling, the cost assumptions include the operator’s critical costs for typical activities, i.e., approximated conditions resulting from experimentally accepted timetables. The distribution and nature of vehicle use is of particular importance for the mileage and intensification of its consumption and operating costs. The assessment also covers the frequency and cost of unforeseen malfunctions as well as periodic operating costs, e.g., replacement of necessary components and operating means. The purchase cost of the vehicle is provided by the manufacturer as well as the estimated fuel consumption and other handling costs. Generally, there are capital costs and costs of ownership which stands out.
A detailed breakdown of the Total Cost of Ownership (TCO) is shown in Figure 1.
Capital costs includes the cost of assets or purchases without VAT (in most cases, under applicable law, companies can claim a VAT refund on vehicles, excluding vehicles intended for private purposes, not related to the company’s operations). These costs determine the initial cost of purchasing vehicles as presented by the manufacturers for a given period of time. The statement assumes that the vehicle purchase costs constitute an one-off financial transaction without taking into account other forms of payment, e.g., loans or leasing installments, to which variable interest should be added (individual costs depending on the bank). It is assumed that in most cases total capital costs increases with inflation in such a way that their provisional value remains the same, without a discount rate. The exception to this assumption is the residual value. It depends significant on the nature of usage and the operating costs, e.g., replacement of essential consumables or aperiodic faults depending on the operating conditions. Fuel costs were calculated for each vehicle in PLN per kilometer (PLN / km) using the current prices of diesel, gasoline, LPG, H2 and electricity. Timetables were adopted as an average fuel consumption, taking into account manufacturers data, and appropriate approximation measures were performed with a slight statistical error. All costs related to the maintenance, repair and operation of the vehicle were also taken into account. The costs of periodic and aperiodic repairs are an important parameter in the economic balance of vehicle use over a given distance and under given conditions. The latter group largely influences the overall costs of using the vehicle. It is associated with high costs of replacing components. As that, parts consumables are not expensive, e.g., lubricants, filters, fuel additives, apart from the costs of battery replacement in BEV vehicles (depending on the total capacity of the cells), so the cost of removing an aperiodic fault is very high. These are mainly unforeseen faults related to the electronic equipment of the vehicle, the drive and transmission system, and the power supply system. The typical operating costs of electric and hydrogen vehicles have been established based on experimental and statistical studies. In particular, unforeseen stochastic phenomena, i.e., faults, were taken into account. The remaining data was taken into account on the basis of offers from automotive, insurance, repair and spare parts manufacturers.
In order to determine the TCO of costs and benefits for users related to the purchase and use of ICEV, PHEV, BEV and HFEV powered vehicles, an appropriate modeling environment must be established that integrates all additive data. Some of these data are quite precisely given in the literature, they are mainly fixed costs (provided by manufacturers of vehicles), fuels, additional power sources, registration and insurance costs. One of the key factors influencing the final value of the benefits of adopting a given solution are costs related to: fuel price, fuel consumption, vehicle energy consumption (efficiency of all mechanical and electrical systems of the vehicle’s equipment) and the frequency of periodic and aperiodic faults. The created mathematical model includes all components of the cost of ownership included in the literature, as well as additional costs that are often overlooked in such analyzes that concern unforeseen vehicle operating costs. They are related with the failure rate of individual vehicle design solutions. It should be noted that there is very little technical data on the cost and frequency of these faults for HFEV’s in the entity’s literature. Therefore, the data was obtained on the basis of an analysis of the frequency of the occurrence of particular faults on the basis of the data of repair plants that service these vehicles. The incidence of aperiodic faults was established on the basis of analytical tests and analysis of the structure of individual electrical and electronic solutions, energy storage, energy transmission and energy transfer for final mechanical work to the vehicle wheels. Such data can be obtained from a number of foreign websites of HFEV users expressing their opinion during the extended use of the vehicle. HFEV vehicles in Poland are a very minor group, and all of them will supplement the H2 energy factor outside the country, due to the lack of refueling stations. The same applies to their periodic repairs and maintenance services. Therefore, most of the data was obtained from foreign databases of car repair shops and road tests. Based on simulation models, the baseline was enriched with projected data on the longer-term operation of these vehicles, based on the PHEV and BEV models. Searching for the optimal solution and credibility of the obtained results, requires the development of the model with many additional procedures. For the purposes of the research, data on fuel consumption was obtained for individual solutions and the same vehicle classes and their additional equipment, especially comfort and safety systems. Therefore, the main factor determining the energy consumption of a given solution is the efficiency of the energy conversion and storage system (not the aerodynamics of the vehicle). Data on fuel or electricity consumption and the potential costs of driving the specified distance for a given drive system was determined on the basis of various timetables. Data for urban and extra-urban distribution were adopted. It is difficult to define for such a wide group of vehicles the data specifying very detailed conditions of energy consumption. Therefore, the data was adopted based on the collected information from a wide group of vehicle users (200) for each drive system and a given vehicle class for two driving modes. These data constitute a reliable source and on the basis of the collected information, an approximating and prognostic model was made. The model includes mainly SUVs due to the very similar parameters of the body kit and total power of the system, which is similar to the energy consumption parameters related to the geometric structure of the vehicle and its power demand. Regardless of the driving mode, it can be expected that these parameters (for different drives), will experience a slight statistical error. To a large extent, this is also due to the fact that these vehicles generate a relatively large number of aperiodic faults in the case of ICEV and PHEV drives, which will be an additional advantage during tests. The cost of the battery is based on the current vehicle manufacturer’s prices A vehicle’s residual value represents its value in the used car market and is modeled on the vehicle’s retail price at purchase and depreciating over the life of the vehicle. These prices were taken from market data. They are by far, the most reliable representation of this parameter, for each of the ICEV, PHEV, BEV and HCEV powertrains, the annual changes in these values will be significant. In particular, it results from the current technical condition, technological development of a given drive system and the need to perform its repairs and maintenance.
To a large extent, the residual value is also determined by the potential failure rate of a given vehicle and driveline for a specified model and brand, which is a common case of a sharp drop in price for ICEV, PHEV and BEV vehicles. On the basis of previous analyzes, it was established that the frequency of aperiodic failures is the highest for PHEV vehicles due to the dual drive train. On one hand, BEVs are less emergency, but on the other, the costs to be incurred in the case of battery replacement after a certain period of operation on average from 100,000–150,000 km are incomparable to the costs of occurrence and removal of periodic and aperiodic defects for ICEV and PHEV vehicles. However, for HFEVs, the cost of failure is quite high and is well known, they mainly result from the necessity to perform periodic maintenance activities, the nature and frequency of aperiodic faults including drive is a big unknown due to the small population of vehicles in use in the world and their relatively low mileage. Nevertheless, the basic criterion for the evaluation of this parameter was established and the data was brought into the model. The maintenance cost model for each vehicle type is based on a maintenance plan that includes periodic vehicle maintenance, 12-volt battery replacement, main battery replacement (BEV and PHEV), major mileage-related component replacement, and energy system maintenance costs (HFEV). The remaining operating costs for these body types, e.g., the cost of replacing tires after a certain mileage, depends on the body type and vehicle model, which in this case means the same parameters for the component. This procedure was performed on purpose, in order to limit the individual replacements of cyclical and non-cyclical components to those that indicate the nature of the work and design of a given drive system, drive train and system electricity management.
Insurance costs vary depending on the actual condition of the vehicle, insurance company, type of insurance and class of vehicle. This model represents the cost of insurance premiums with liability, comprehensive and collision insurance (limited to coverage in Poland). When determining the costs, the parameters influencing the insurance price, resulting from the visual condition of the vehicle and resulting defects during use, were omitted. In the case of Poland, the year, model, engine capacity, drive type and mileage counts. Insurance costs are modeled as a function of vehicle class and type. In order to model these costs within a vehicle class, the same or similar type of vehicle with a comparable purchase price and engine power was intentionally assumed with the least possible error. In Poland, the method of calculating the liability price in the case of BEV and HFEV vehicles is taken into account, prior to the engine capacity, but the engine power. For the group in question of vehicles, the engine power is close to each other regardless of the source of its supply and the method of energy conversion. When calculating the liability premium for BEV and HFEV vehicles, parameters that are equally important in the case of ICEV combustion vehicles and PHEV hybrid vehicles, such as the driver’s age, driving experience, place of residence and, above all, the current discounts for damage-free driving are of great importance. Thus, there are practically no major differences in the calculation of the vehicle’s compulsory insurance for different powertrains. This study estimates that insurance costs vary by 4.5 per year over the life of the vehicle. This is mainly due to the offers of insurance companies and the current market conditions.
The registration process in Poland is the same, regardless of the type of drive system. The only difference is the color of the manufactured license plates which are green for HFEV and BEV vehicles. Technical inspection is required and relevant documents required during the inspection. Therefore, it can be assumed that these costs are constant.

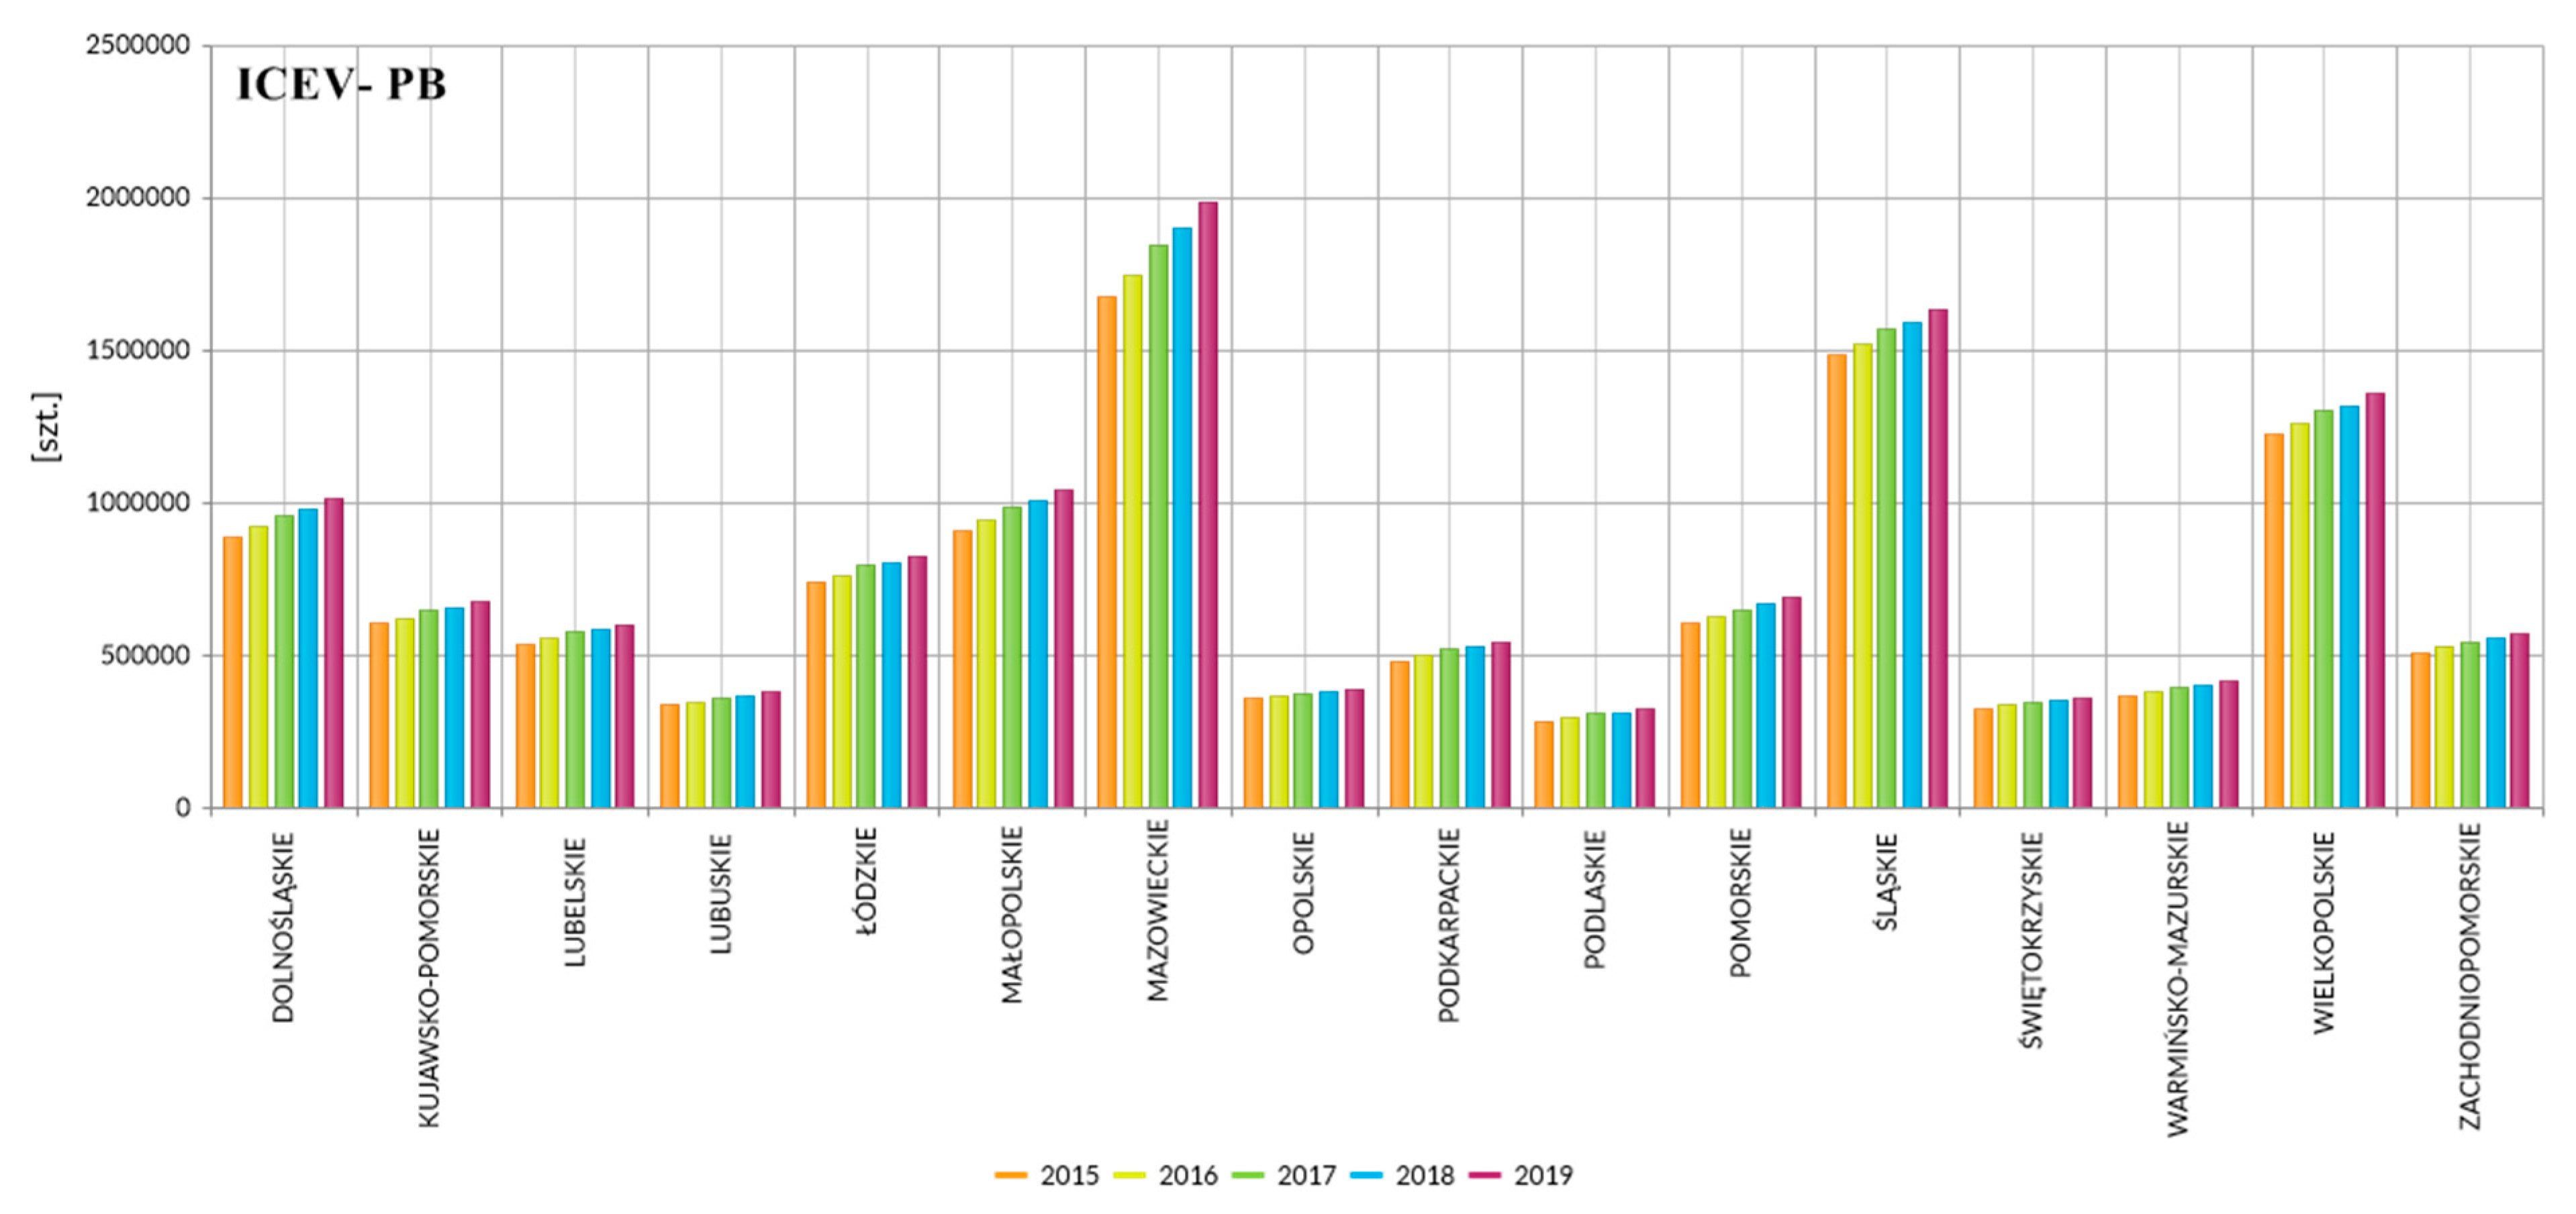
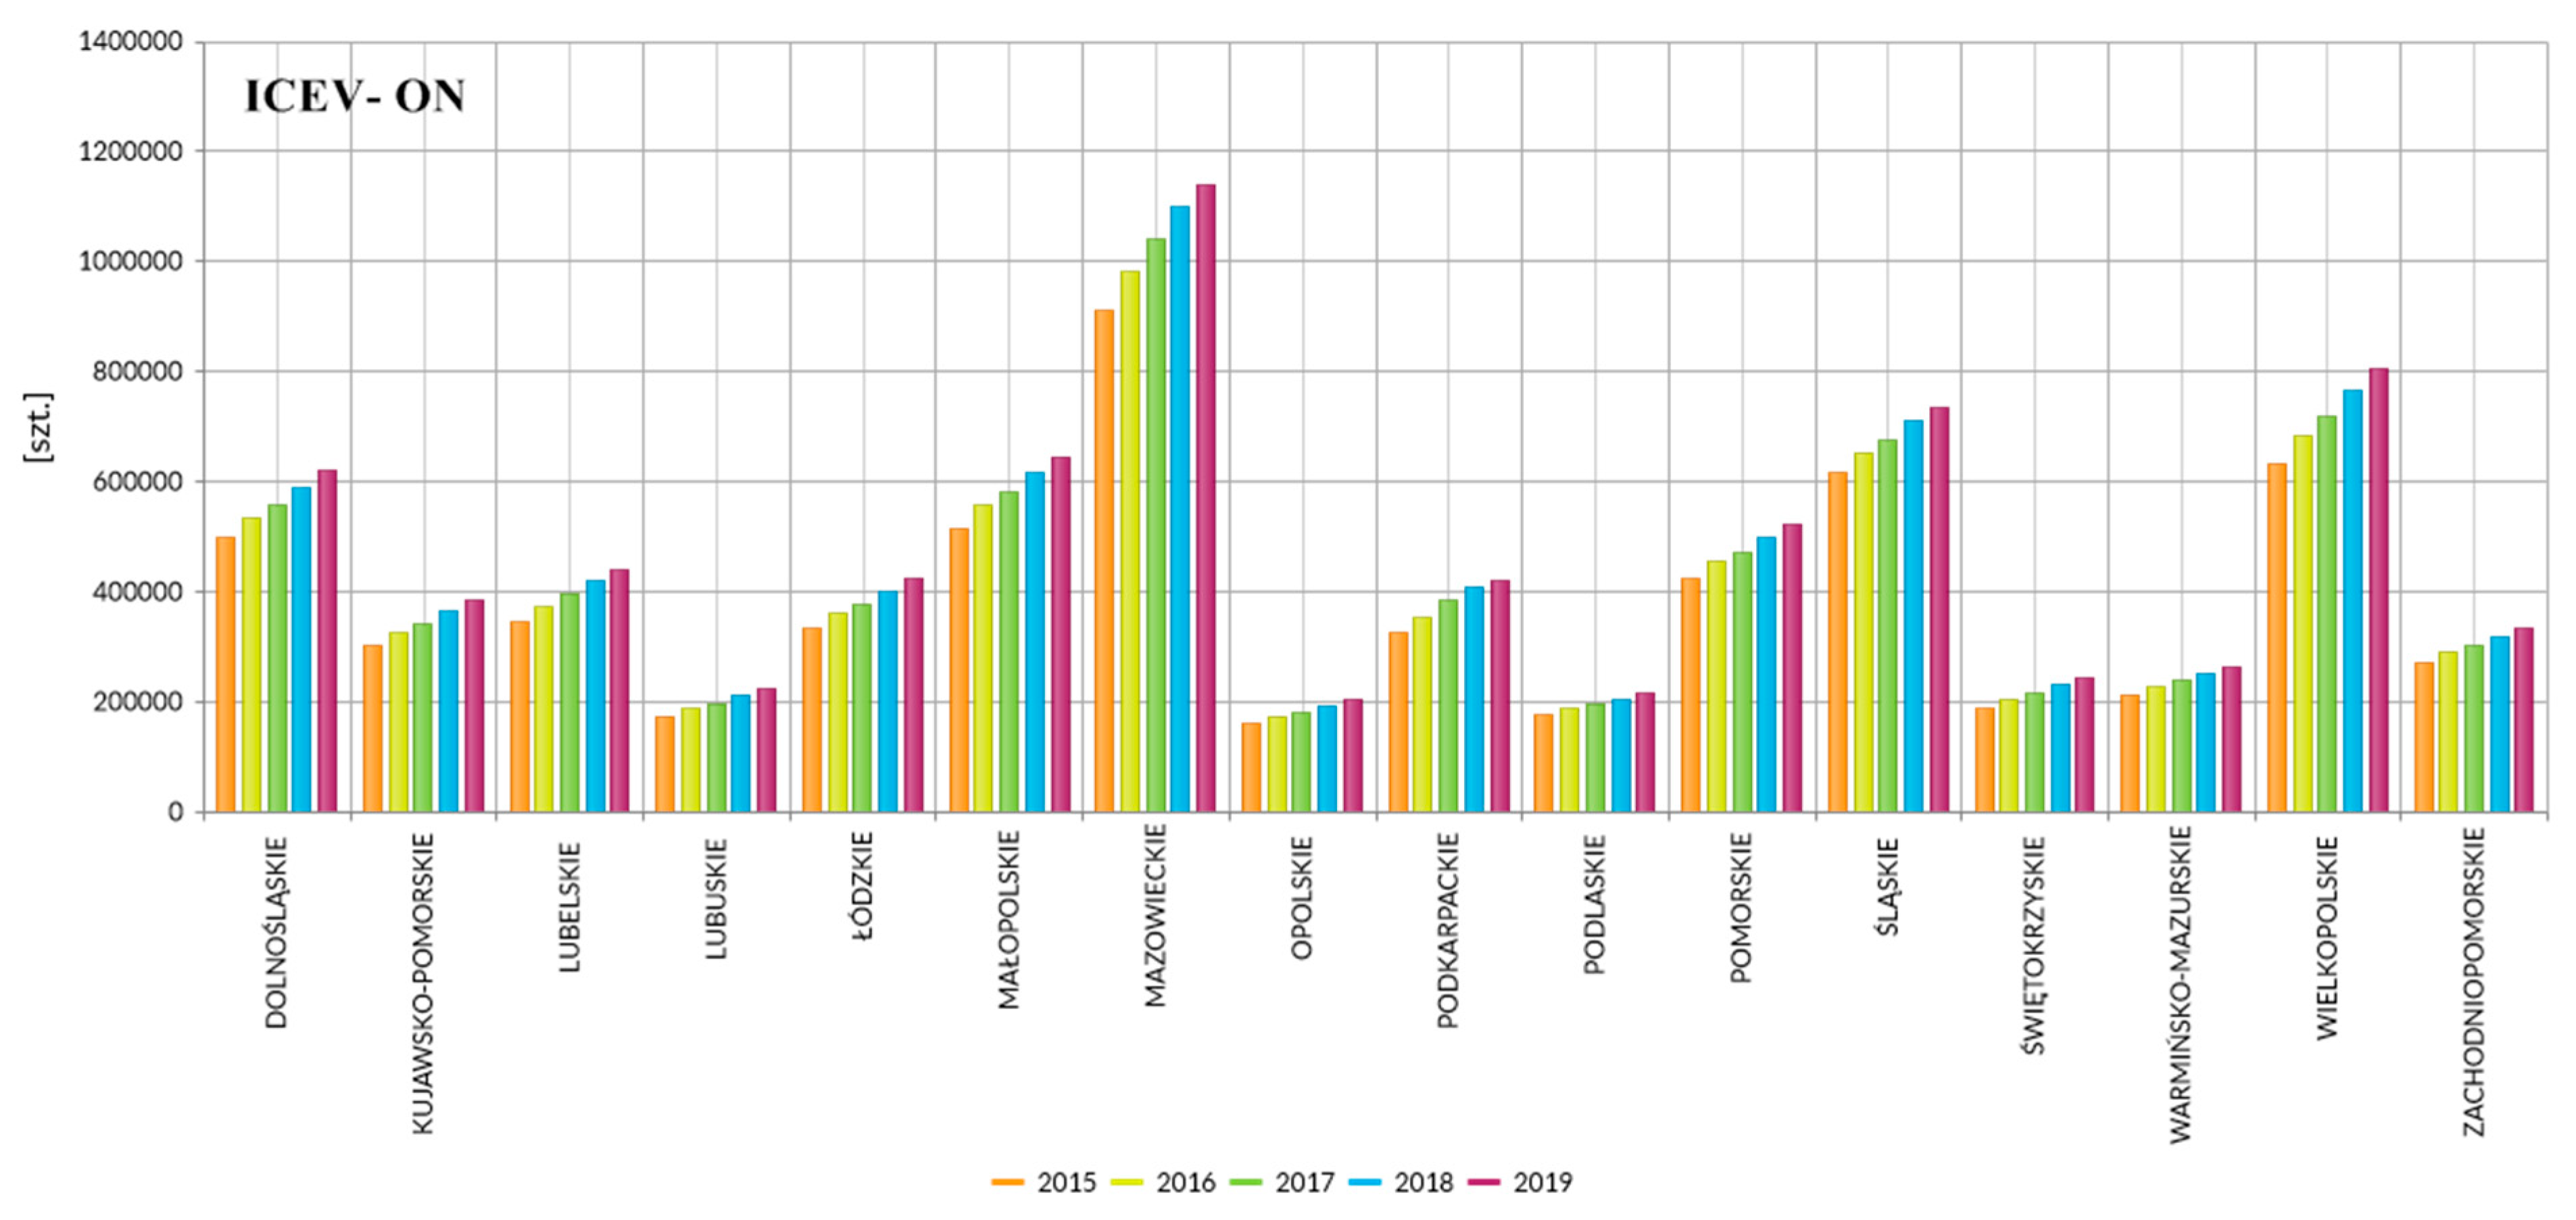
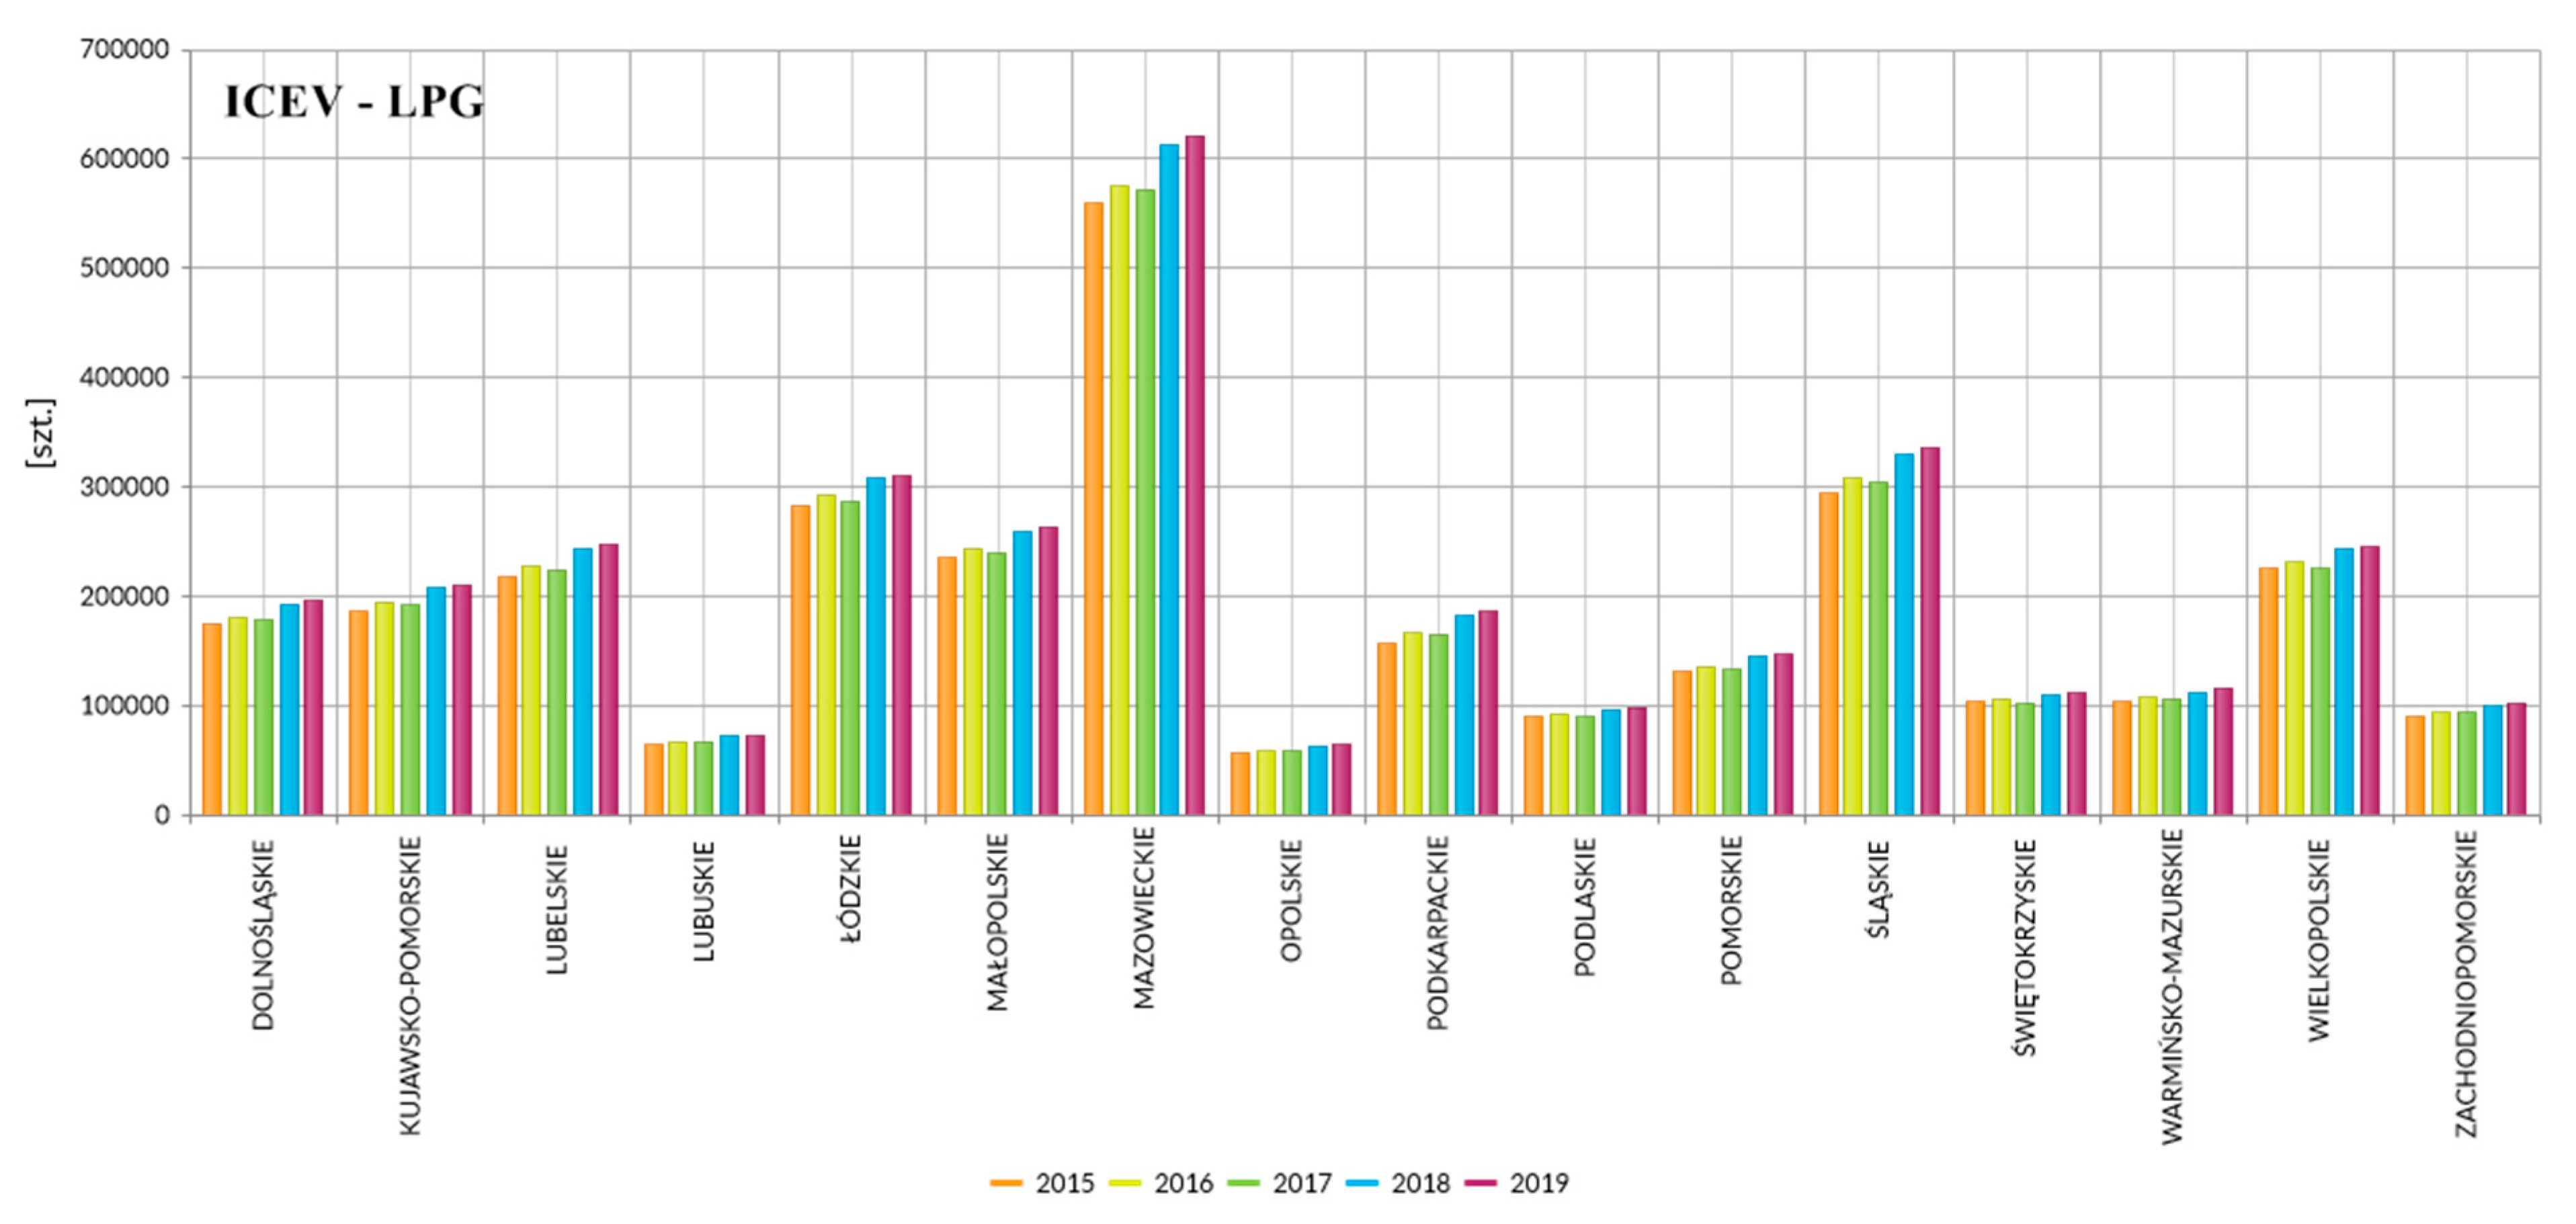
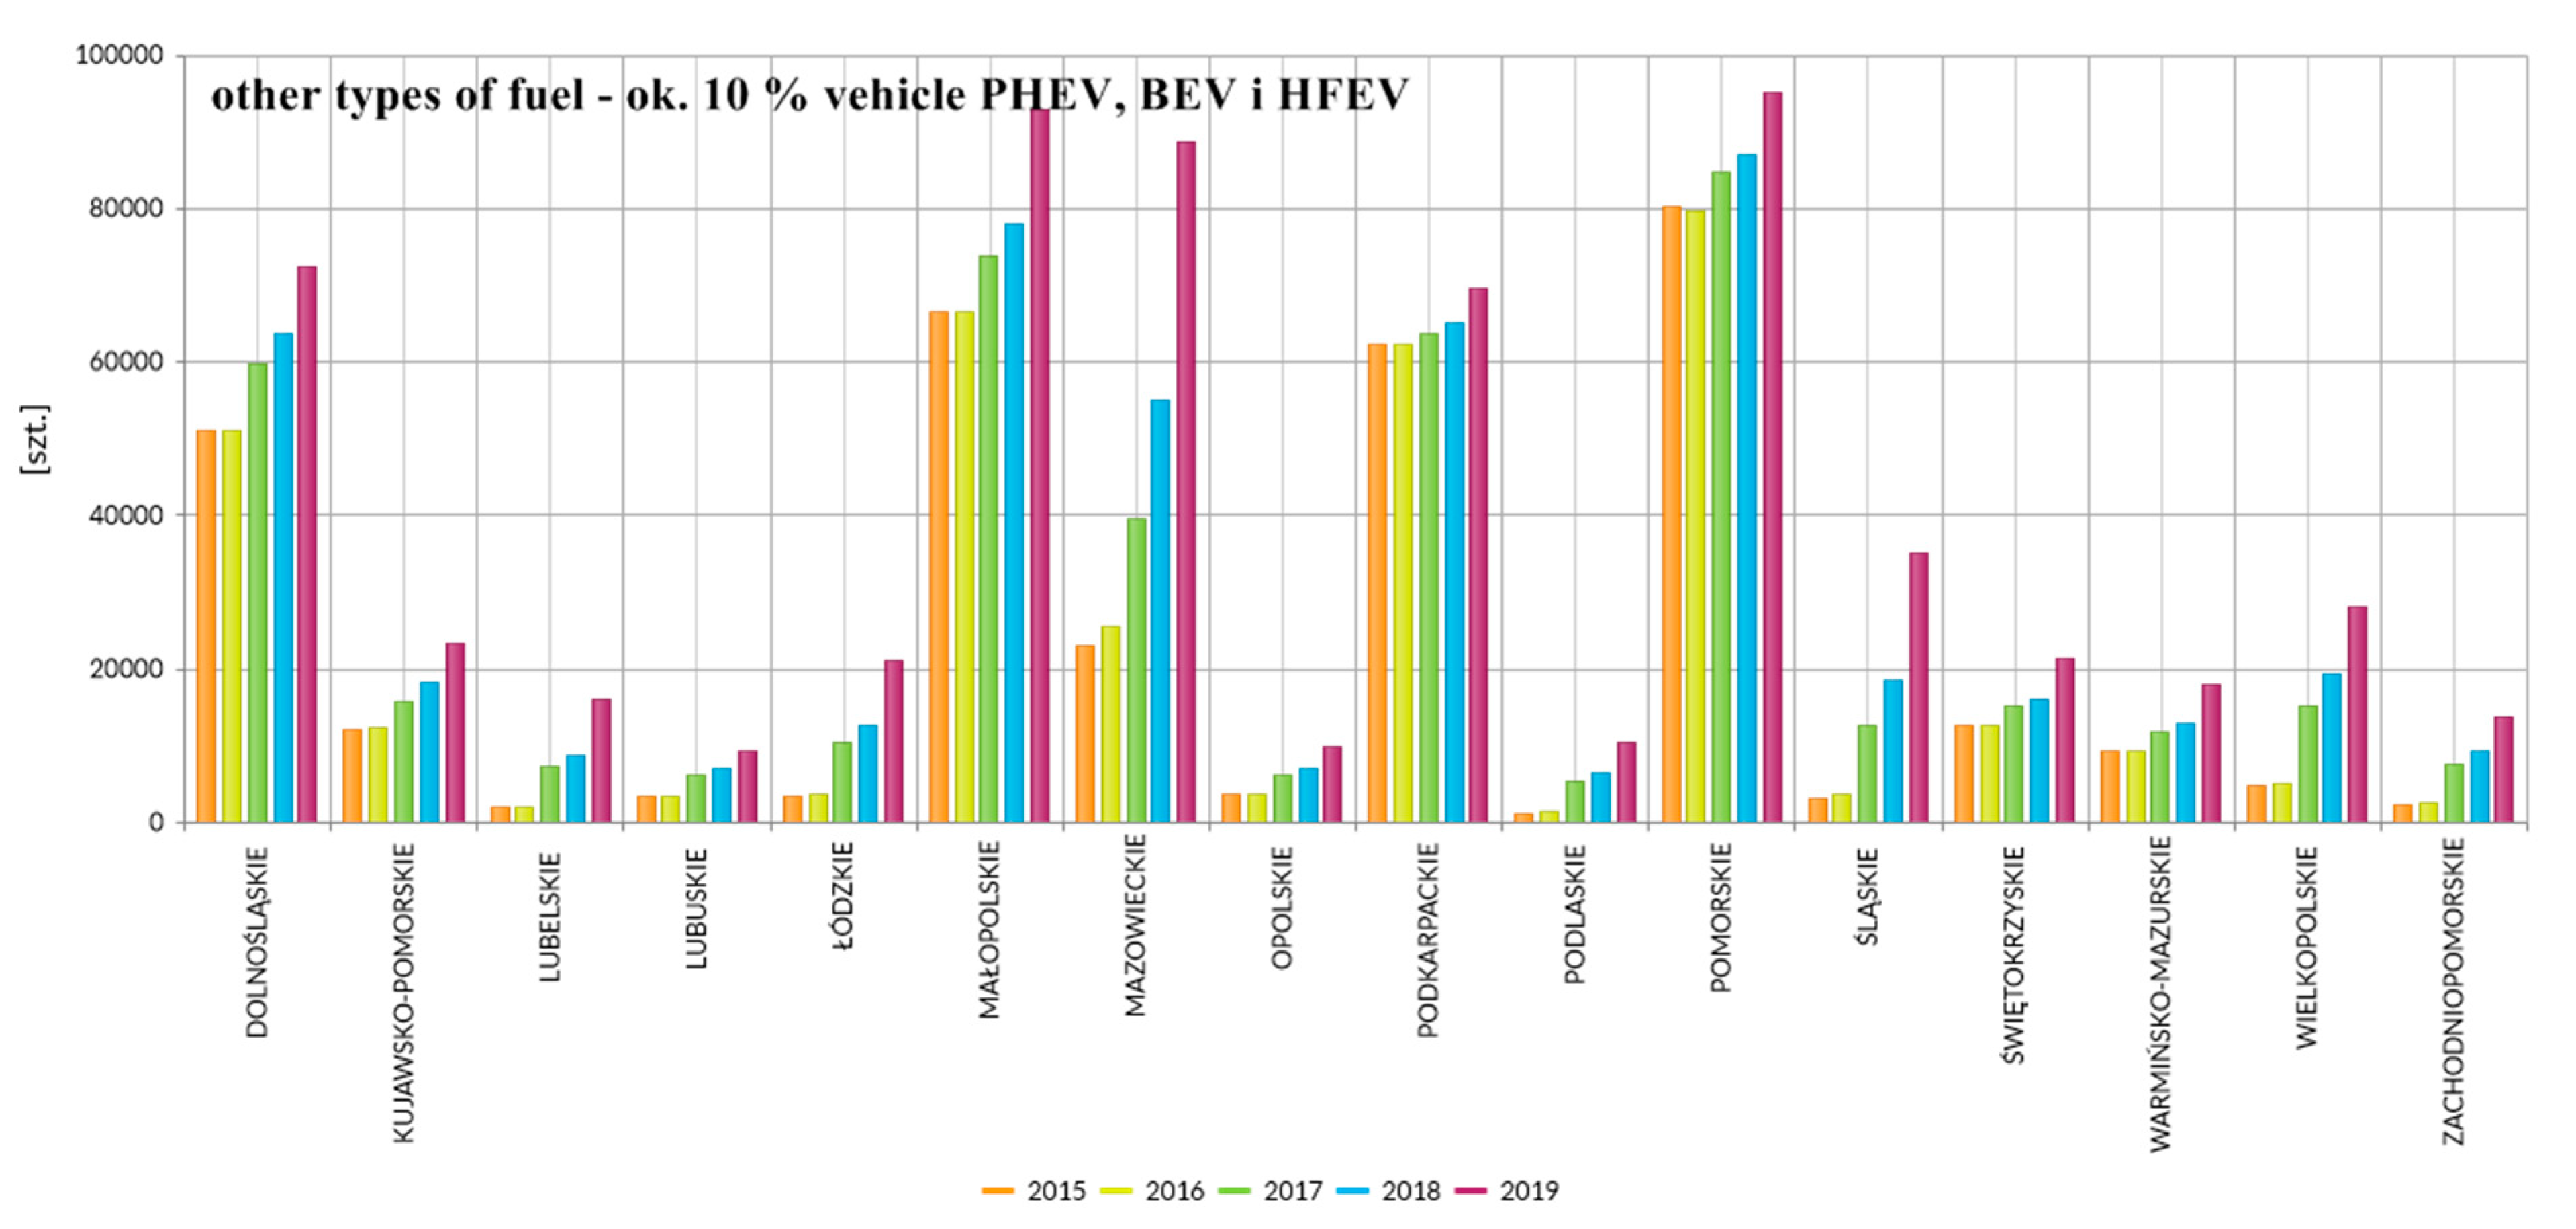
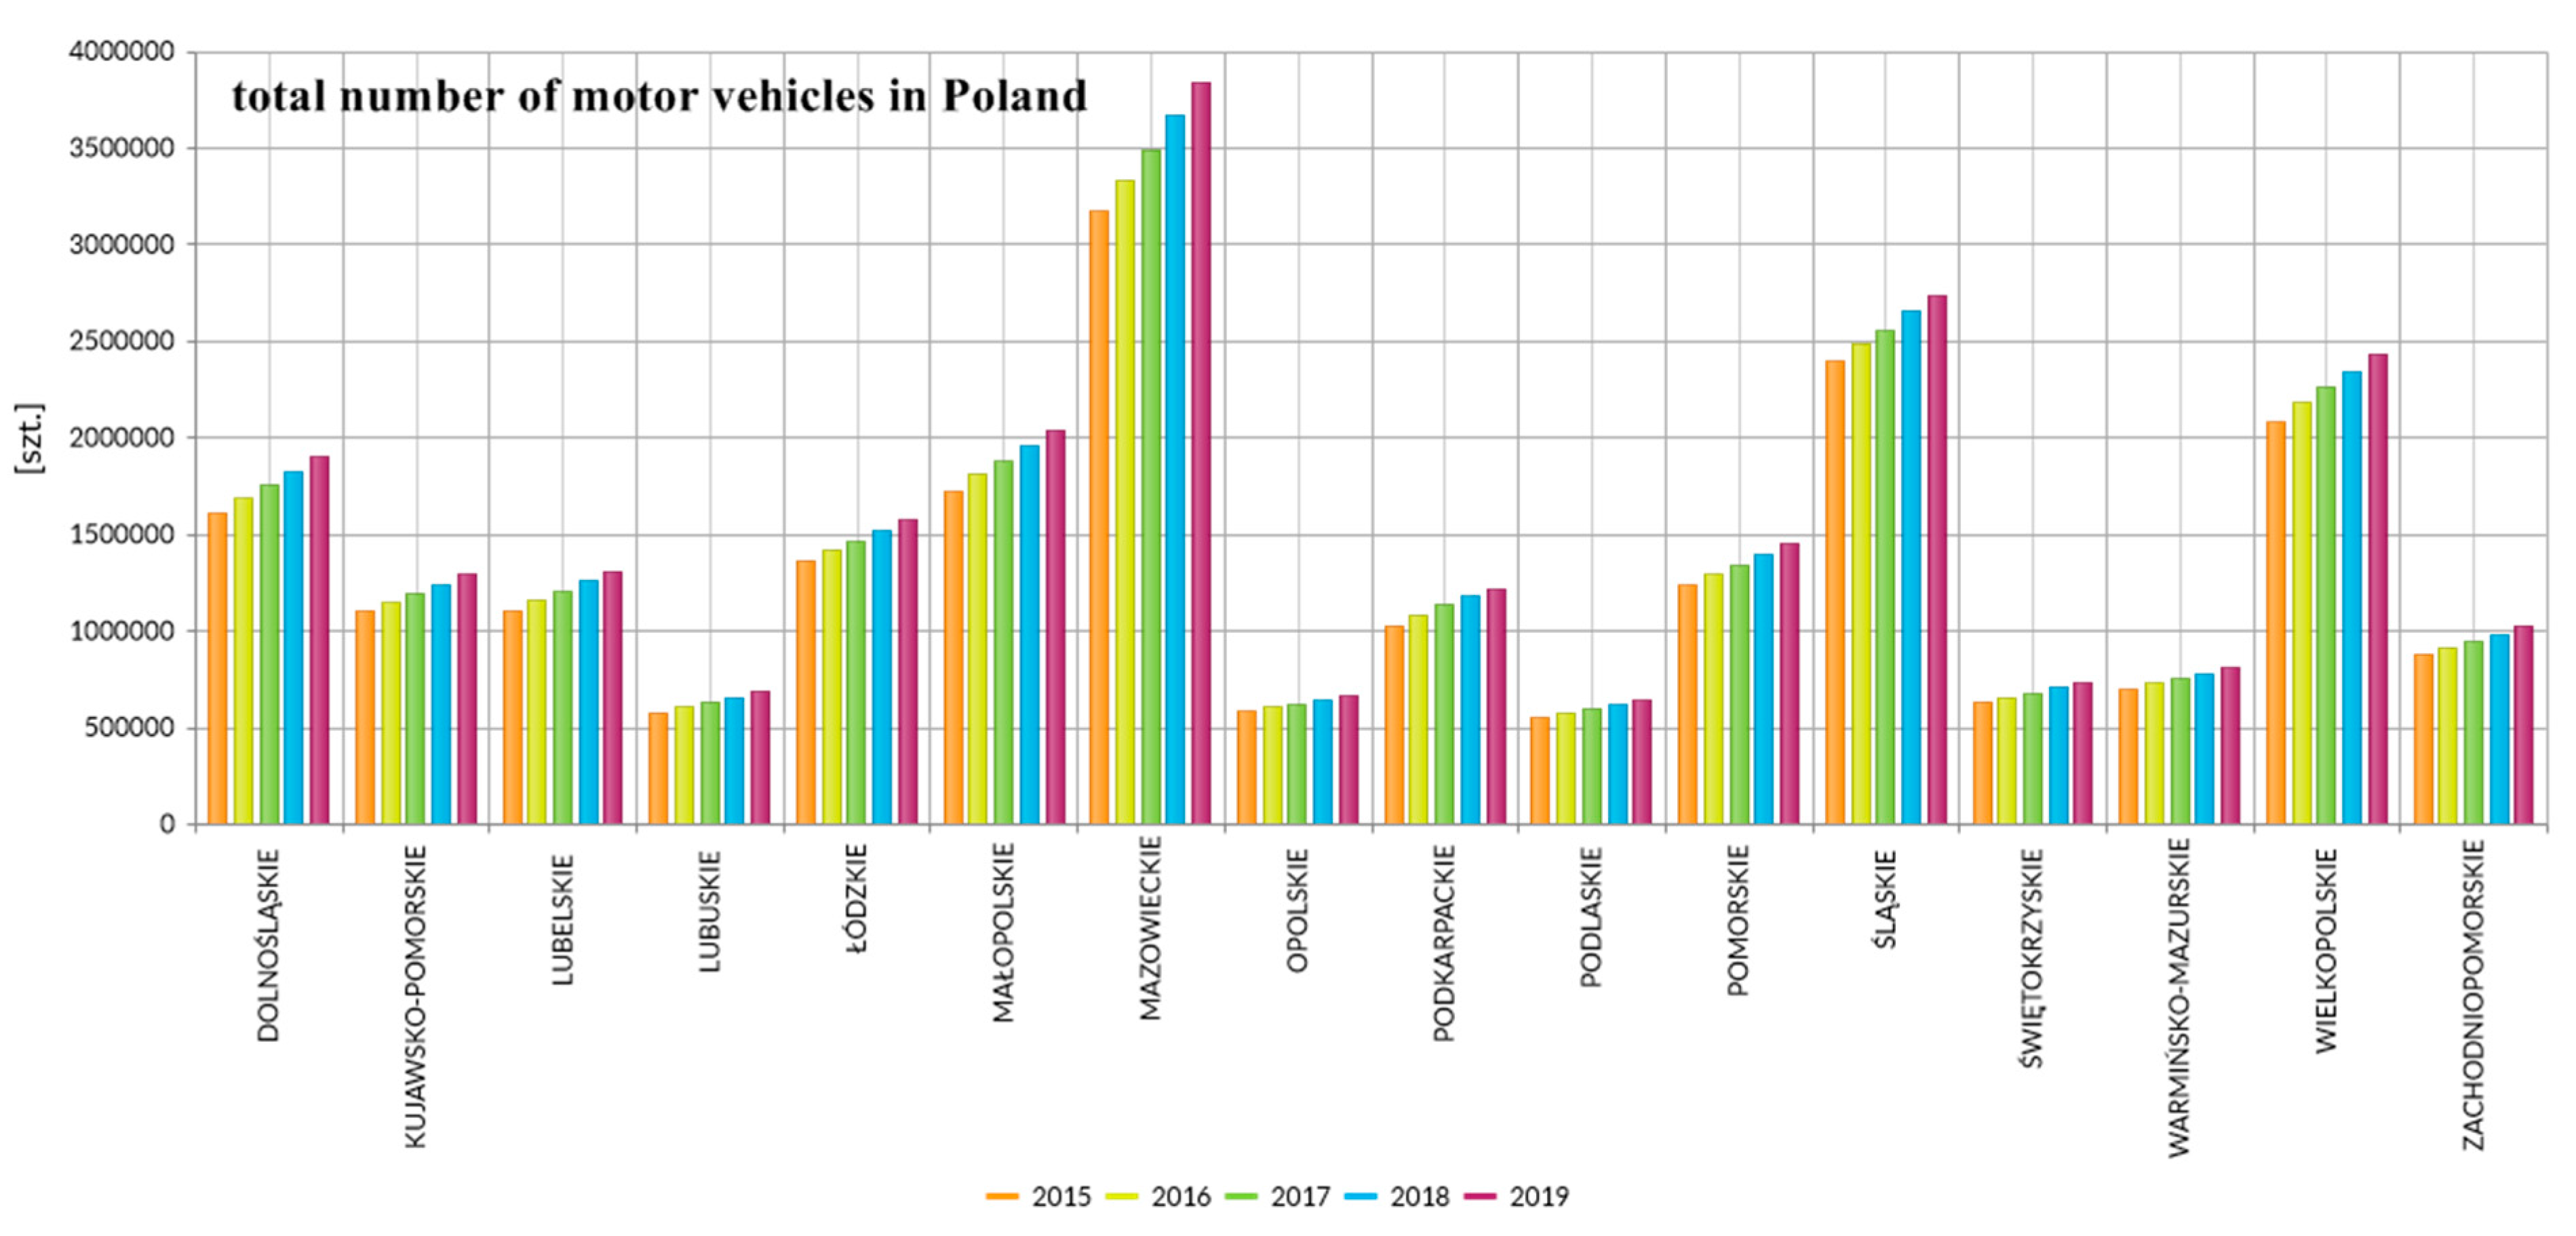
2.1. Analysis of the Number of Vehicles in Poland for Classic, Hybrid, Electric and Hydrogen Drives—A Comparative Trend of Demand for BEV and HFEV Vehicles

In order to determine the forecasted development trends in the demand for BEVs and HFEVs in Poland, an appropriate analysis was performed showing the number of registered vehicles in Poland, taking into account individual power sources and territorial distribution. Based on this analysis, it is possible to determine the development of a network of refueling stations and vehicle charging stations It can be assumed that the costs of electric and hydrogen fuel will drop with the growing interest in alternative energy sources for passenger cars. The availability of replenishment points will also increase, which will certainly translate into lower operating costs of these vehicles. The increase in the population of a given entity in the economic environment reduces the costs of indirect factors, including: the costs of replacing the main components (batteries), the costs of services (basic parts related to the propulsion system), transmission and control system, the system of intelligent monitoring of the state of charge of the batteries and their operating conditions, costs of spare parts and others related to the use of a specified drive. The number of vehicles in use in Poland, divided by voivodeships, is shown in Figure 2, Figure 3, Figure 4 and Figure 5 (based on the data of the Central Statistical Office; Warsaw, Poland).
According to available data, at the end of March 2020, exactly 10,701 electric passenger cars were registered in Poland. This list includes 6056 BEVs and 4645 PHEVs. At the beginning of May 2020, 3 HFEV vehicles were registered in Poland. Based on the assessment of the total number of vehicles in Poland for all drives, as shown in Figure 6, it can be seen that these vehicles account for only 4393 × 10–4% of the total population of passenger vehicles in Poland (BEV = 2486 × 10−4%, PHEV = 1907 × 10−4%, HFEV = 1.2 × 10⁻⁷%).
Based on this analysis, it can be concluded that the total demand for PHEV, BEV and HFEV vehicles may increase significantly. This is evidenced by the overwhelming number of BEVs on PHEVs. It is mainly related to the lower number of operational faults up to the mileage not exceeding 150,000 km where the main power batteries are not required to be replaced, which speaks for the cost of the PHEV. Nevertheless, buyers more often declare the purchase of a BEV car, which is mainly related to it’s electric range and low operating costs.

2.2. Chemical Fuel and Electricity Costs for SUVs with ICEV, PHEV, BEV and HFEV for Urban and Extra-Urban Mode

Fuel consumption for the Hyundai Tucson III for the ICEV 1.6 T-GDI177KM 130 kW with gasoline engine is about 9.4 L (average users report approximated based on 563 entries) and for the ICEV 2.0 CRDI 185 km 136 kW equipped with diesel engines stands for about 8.2 L (report average users approximated on the basis of 489 entries) in mixed mode.
The average charging cost is PLN 0.617 per 1 kWh, which includes the price of electricity and distribution services. The driving priceof a 100 km range, to a large extent depends on the nature of the engine load, dynamics and driving mode (urban or extra-urban). Electric energy required to travel a 100 km for PHEV and BEV vehicles (SUV class) ranges from 15.0–15.4 kWh/100 km-depending on the efficiency and frequency of the kinetic energy recuperation system from braking and the driving habits (no energy recovery braking in long-distance mode or increased energy consumption during acceleration in city mode and electricity consumption when stationary), 4 × 4 or single-axle drive, total vehicle weight and electronic equipment-multimedia and comfort.
The average cost of hydrogen fuel in the case of retail customers at Clean Energy Partnership stations, is approx. EUR 9.50 (approx. PLN 39.9/kg) per 1 kg of hydrogen. There are yet no refueling stations in Poland. On average, HFEV SUVs consume 1.15 kg-H2/100 km in city mode and 0.95 kg-H2/100 km in extra-urban mode. The model assumes that the vehicle will be operated in a mixed mode in the ratio (40/60 city mode/extra-city mode), it is related to the mileage ratio in individual modes and not the driving time.

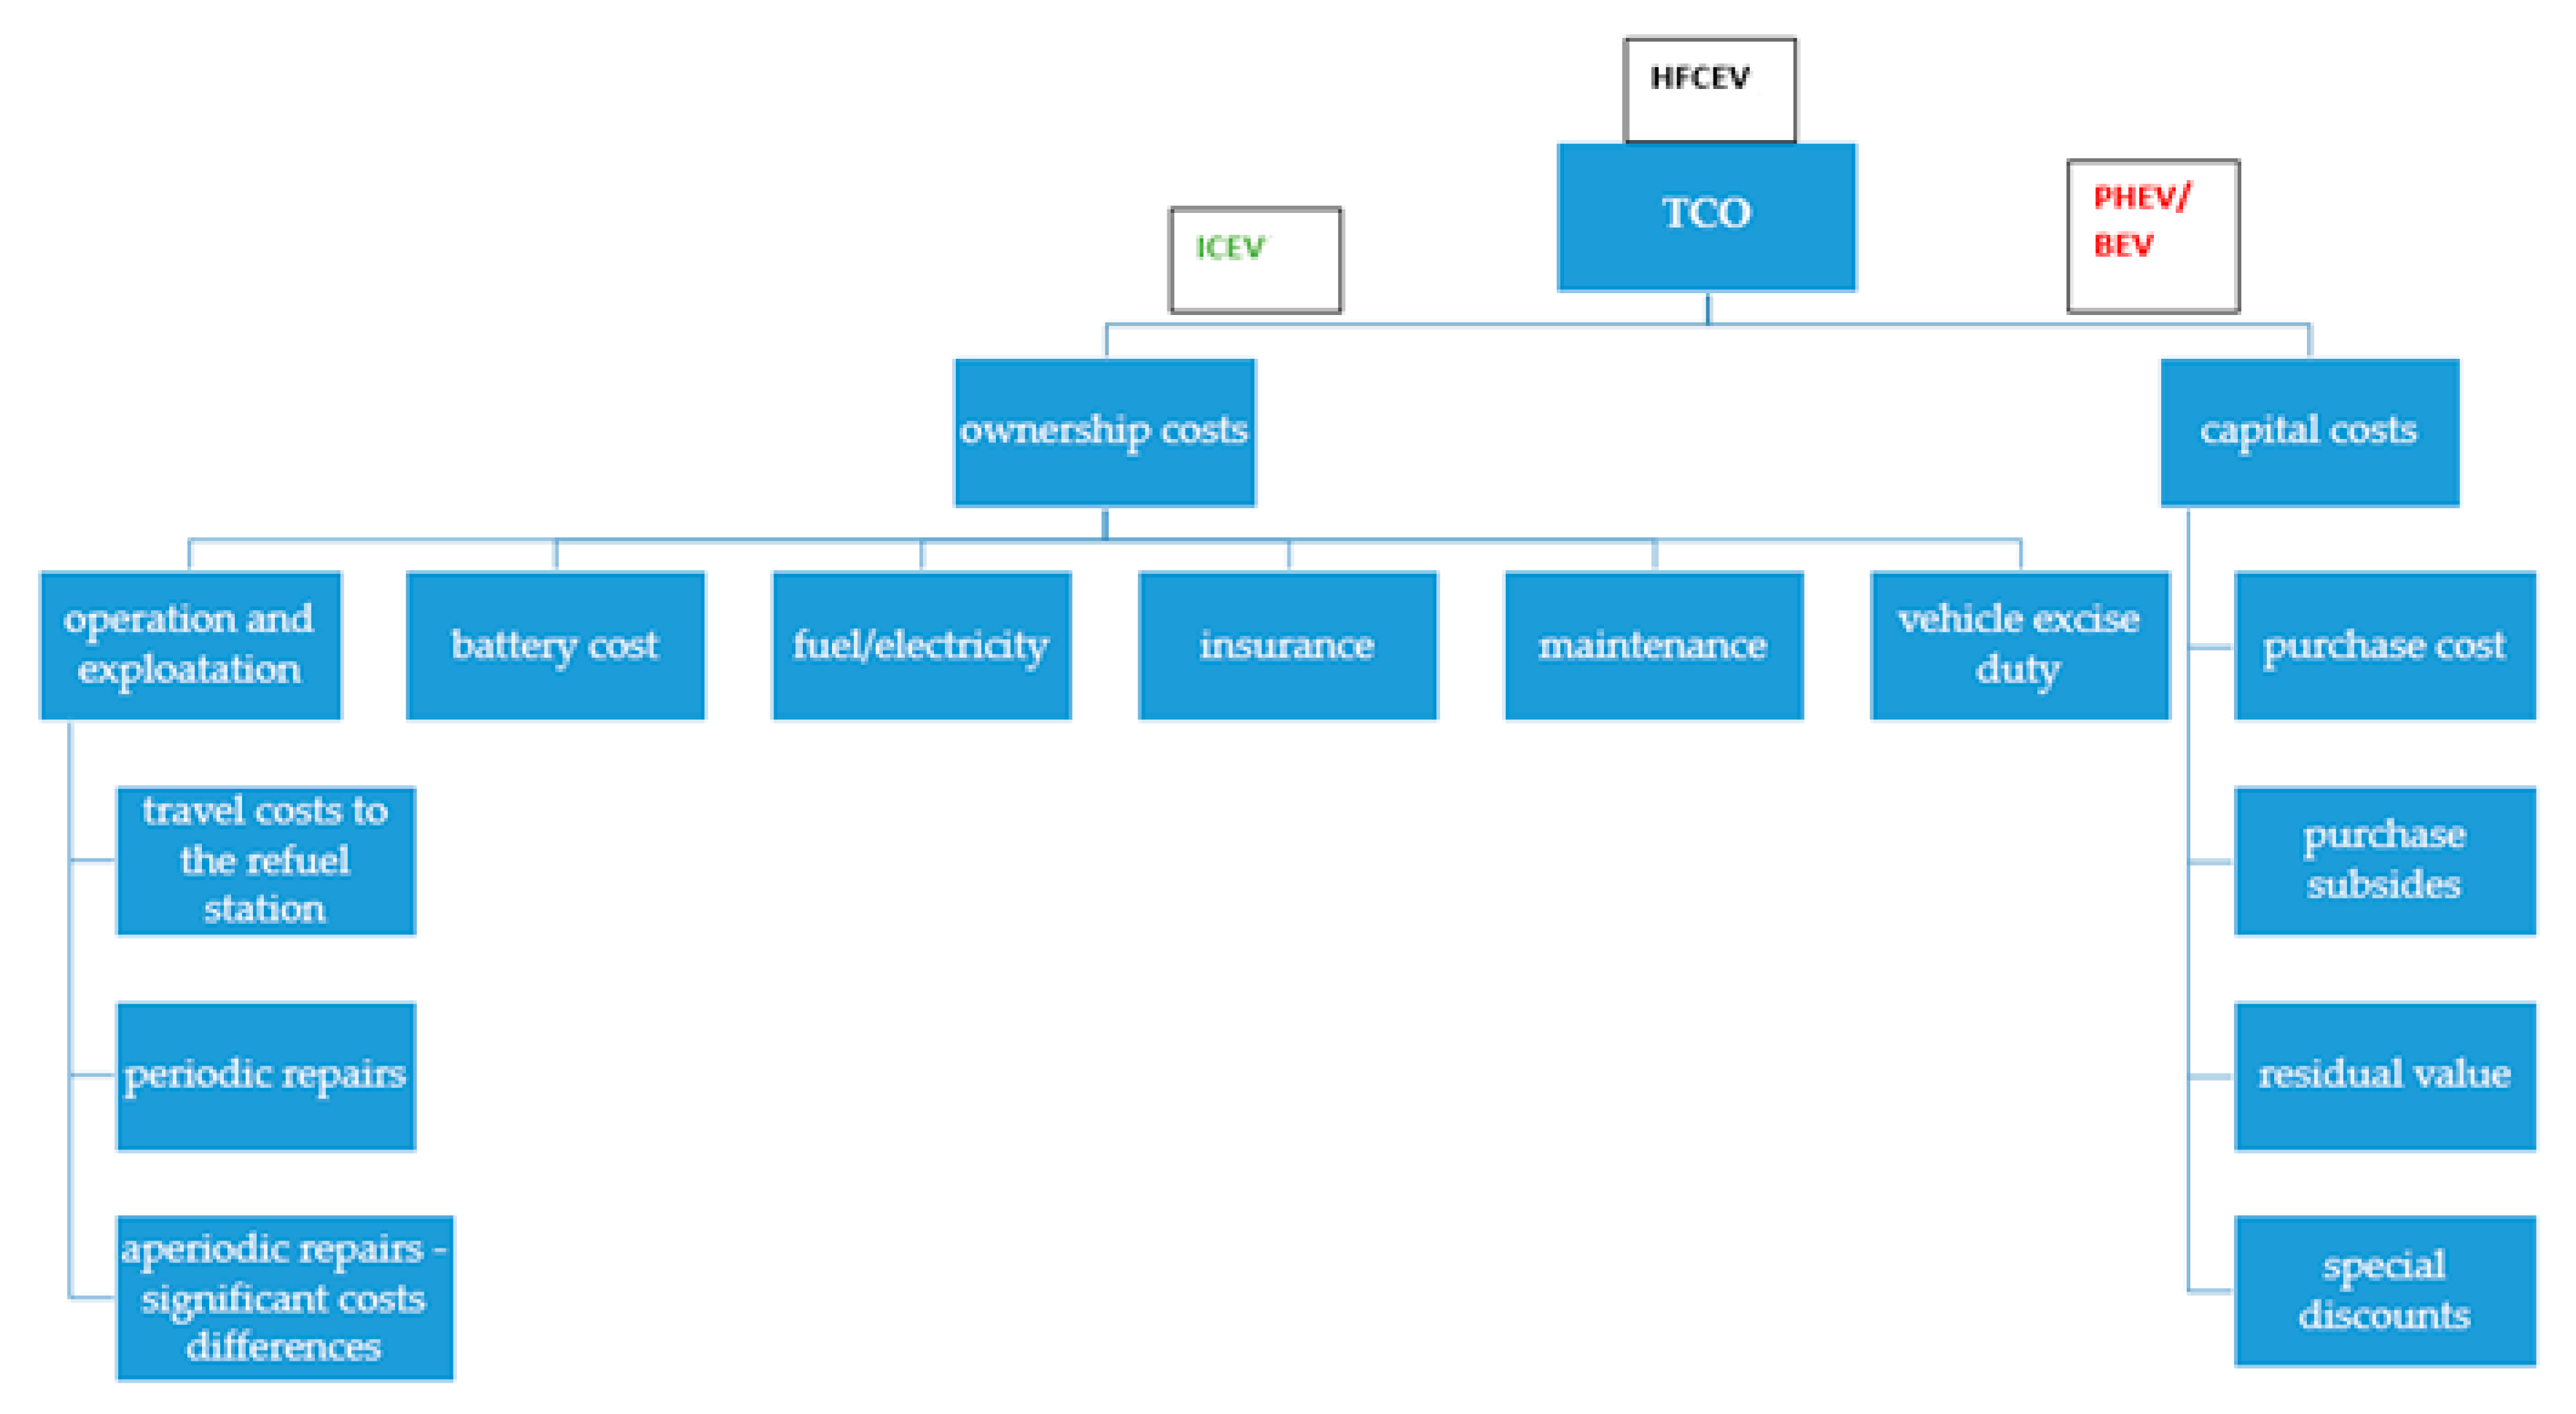
2.3. The Main TSO Module, Including Periodic and Aperiodic Operating Costs of Selected Drives in SUVs

In order for the TCO model to be reliable and to fully capture all phenomena, even those of a stochastic nature, it is very important to identify and calculate the necessary cost categories for a specific type of vehicle and drive systems. The cost of purchasing and owning a vehicle is associated with several different cost categories, in particular in the sub-category vehicle operating and repair costs.
The following TCO equation is a tailor-made approach for any passenger vehicle drive depending on the energy source:
T C O P p x ( R p x ( w t × w z × w d ) ) + E c ( w d t m ( D v e e + D v c e ) + w d t p m ( D v e e + D v c e ) w d r e k ) + C I C + P F W P f x + A F W A f x
In this case, TCO is the total cost of ownership during given period of ownership, where Pp-x is the purchase price of a new vehicle with the selected drive (to reduce the error, identical comfort equipment is assumed in the group of tested vehicles), Rp-x is the resale price of the vehicle at the end of the ownership period, the value of changes in the nature of the set of values is not linear but depends on the type of drive system and operating costs incurred. This means that the age of the vehicle w t   and the mileage w d are crucial to establish the mandatory inspection intervals, i.e., the operating distance, without incurring high periodic costs, i.e., replacing the main battery set in BEV and PHEV vehicles or replacing hydrogen tanks and energy transmission equipment in HFEV vehicles and the current state of wear of the vehicle, taking into account the design of the drive w z . The nature of the timetable is influential for energy consumption, therefore, coefficients have been introduced defining the nature of the timetable and the system load driving and energy, including kinetic energy recuperation systems for BEV and PHEV vehicles, which corresponds to: timetable coefficient for urban mode w d t m , timetable coefficient for extra-urban mode w d t m p   and the amount of energy recovered from the systems auxiliary w d r e k . As the vehicle wear and tear progresses, the final price decreases in a non-linear way, individually for the vehicle, and the difference between Pp-x and Rp-x is the vehicle depreciation value. Ec is the cost of energy equal to the cost of fuel or the cost of electricity per kilometer. Dv-ee is the total number of kilometers traveled during the lifetime of the electric vehicle, Dv-ce is the total number of kilometers traveled during the lifetime of the vehicle with an internal combustion engine, therefore E c ( D v e e + D v c e )   is the total cost of the injected energy necessary to produce the work transferred to the wheels of the vehicle. Costs operational related to indirect transactions to purchase a vehicle is characterized by: m-is the monthly interest rate, Pc-borrowed amount, n-number of monthly interest payments, Pc-borrowed amount in the case of loans, (mPc/(1 − (1 + r)−N)) N-Pc means total interest cost. Additionally, it should be added: the cost of compulsory third party liability insurance to CIC and approximate costs related to maintenance and operation, including periodic replacement of components in accordance with the recommendations of the vehicle manufacturer Pf and costs related to aperiodic faults Af. The costs of subsidies and taxes are ignored, they are not of great importance in Poland. In the current legal state, they do not apply and are identical for all vehicles. When considering the costs of Pf and Af, the analyzed range of vehicle mileage should be taken into account, eg from 0–100,000 km. The make, model and technology of the drive as well as the structure of the vehicle body also play a significant role in this system. Therefore, certain values must be entered coefficients based on actual analyzes of WPf-x periodic and aperiodic WAp-x faults within a given group of vehicles according to the opinion of services and users. This condition is also related to the timetable and operating conditions, including environmental factors.
The TCO model captures the direct costs related to the use and ownership of the vehicle depending on the type of a drive system. As a result, indirect costs, such as the cost of traveling to a charging or refueling site, will be neglected. However, it is possible to take them into account, provided that the location of the place of use and potential places for refueling are precisely presented. In the current state of development of the refueling network infrastructure, the results related to the costs of owning HFEV vehicles due to the long distance to refueling stations for these vehicles, especially outside Poland, would be biased in favor of other drives. It should be taken into account that this technology is still under development. In the case of BEV and PHEV vehicles, these costs may already be included in smaller comparative studies limited to this group of vehicles. This is justified because both versions of vehicles use the same charging network, so the distance necessary to top up electricity is identical and depends on the location of the vehicle and the charging network in a given area, e.g., within a given urban agglomeration. BEVs require long charging times due to the increased battery capacity, and charging is needed more often due to the shorter range compared to conventional ICEV fuel vehicles. The charging time of PHEV vehicles is significantly reduced compared to BEVs, but their range is incomparably shorter, which creates problems with the frequent need for replenishing energy. These vehicles are usually charged overnight at home or during the day at work, where the user is only required to perform the quick-connect procedure. In most cases, it is required to charge on site for 30–40 min, if provided charging station is available and fully operational, which leads to potential logistical problems. In case of ICEV vehicles, it requires approximately 5 min at the service station to fully charge.
Depreciation is often massive cost in a vehicle’s TCO analysis, and therefore of great importance to new vehicle buyers. Moreover, it is a complex process determined by: individual characteristics of the vehicle, including energy consumption and comfort (color, equipment, shape, quality of multimedia equipment, comfort and safety), market perception of the brand, average fuel or electricity prices in a given year, maintenance costs resulting from periodic and aperiodic exploitation phenomena, government regulations and other benefits resulting from the general social trend, e.g., the desire to reduce harmful substances to the environment. As a consequence, the depreciation rates can vary considerably depending on the make, model and driveline, in particular in the case of ICEV and HFEV vehicles.

2.4. Algorithmic Sub-Module for Periodic and Aperiodic Phenomena

The influence of periodic and aperiodic phenomena depends on the design of the drive system, energy factors class and purpose of the vehicle are difficult to determine and require complex calculations. In principle, the majority of the data can be accepted on the basis of the information provided by the manufacturer. This mainly applies to periodic phenomena such as periodic repairs, replacement of components in a given mileage range and the current prices of consumables and original and spare parts (if such are available on the automotive market). In terms of costs and availability of spare parts on the automotive market for ICEV vehicles, they are very advantageous due to a number of production companies and fierce competition. Sometimes the cost of purchasing a spare part of similar quality to the original is several times lower. The prices of parts for PHEV, BEV and HFEV vehicles are very high due to the fact that there is a very minor group of companies producing parts for these vehicles. The number of companies undertaking the process of regenerating parts of significant value, e.g., drive system components, kinetic energy recuperation, energy storage, high-pressure tanks, components of the drive train is negligible. This is due to the low number of vehicles in the automotive market during operation and the slow pace of their growth, especially in Poland. In the case of HFEV vehicles Thus, the user of this vehicle is forced to purchase spare parts exclusively from the vehicle manufacturer and sourcing them from foreign warehouses, which is very costly and significantly increases the TCO. It is of particular importance for forecasting this state. In addition, due to the small number of vehicles of this type in use, there is little data on their potential defects that were not provided or foreseen by the manufacturer when designing the vehicles.
Therefore, special models were created to predict the reliability of ICEV, PHEV, BEV and HFEV vehicles, which allow to determine the trend in the frequency of occurrence and cost of aperiodic faults after driving significant distances, even over 200,000 km. They are based on manufacturer, service, user data and modeling of reliability systems monitoring. These methods are based on acute and fuzzy algebra, adaptive, neuro-fuzzy algebra and classical prognostic metadata. Currently, drive systems are made more and more towards unification and typification. The unification and typification tendencies include entire sets of sub-assemblies and assemblies of a complex system. The complexity and individuality of the system impose specific requirements for shaping their reliability in the design, production and operation stages, taking into account various external variables. Modeling the random process of electrical and mechanical failures solves the important the issue of replacement elements, which guarantees the maintenance of the reliability of complex vehicle drive systems and the precise determination of additional costs included in the TCO. All statistical components related to the exploitation system are subjected to the active and adaptive effect of the created model. The basis for data processing are advanced statistical procedures subject to numerical calculations. The model includes parametric and non-parametric, sharp, fuzzy and neural methods, leading to the creation of high accuracy of analyzes. The data distribution in the model that can be taken into account is: Normal, exponential, logarithmic, gamma, power, Maxwell, Weibull, Erlang, Rayleigh. These procedures are used in the statistical control and forecasting of aperiodic faults occurring in a given vehicle drive system and its other executive and measuring systems.
In all options of the main model there are random generators working in given configurations. Then, on the basis of probalistic sub-models, the simulation phase is moved to the simulation phase, where random generators, based on statistical input data, simulate the frequency and failure processes in the operation of a given vehicle up to a specific mileage. The essence of using the models in relation to other models commonly used in TCO analyzes are original algorithms and computational procedures at each level of the model structure related to the analysis and prediction of the reliability of given drive systems.
Selected fragments of the calculation model in the identification of costs resulting from aperiodic faults for random variables based on experimental and statistical data (overloaded functions used):
Procedure for the linear algorithm:
1.
Identification of vehicle input parameters:
k X = b r D [ i x ] b r D [ i x 1 ] k X t ;   k Y = b r d [ i X ]
where: kX, kY, kZ-model coefficients (trend algorithms: linear, quadratic, exponential, exponential, hyperbolic and power), kXt-time base discretization step for measurements and forecasting algorithm, ix-dimension of the table containing measurement data to build a forecast, brD a table with the ix dimension containing the measurement results.
2.
Forecast based on the data provided to the model:
b r [ i I ] = k Y + k X   × ( i I + 1 ) × k X t
where: br [iI]-forecast table with the iK dimension including forecasts of the component reliability index to time iK-one step ahead, iK-forecast horizon, iI-index of the next time moment in which calculations are made for a given number of forecasts.
Procedure for the polynomial algorithm:
Identification of vehicle input parameters
where: kXi-coefficient of interpolation polynomial, i-1… n.
Forecast based on the data presented on the model or the measurement results:
b r [ i I ] = i 0 i X k X i × ( k X t ( i x + 1 ) ) i
Procedure for the exponential algorithm:
1.
Identification of vehicle input parameters:
k X = l n ( b r D [ i x ] b r D [ i X ] 1 ) k X t ;   k Y = b r D [ i X ]
2.
Forecast based on the data presented on the model or the measurement results:
b r [ i I ] = k Y × exp ( k Y × k X t × ( i x + 1 ) )
Procedure for the power algorithm:
1.
Identification of vehicle input parameters:
k X = l n ( b r D [ i x ] 1 b r D [ i X ] ) l n ( 1 1 + k X t ) ;   k Y = b r D [ i X ]
2.
Forecast based on the data presented on the model or the measurement results:
b r [ i I ] = k Y × ( k X t × ( i x + 1 ) ) k X
Or
k X = l n ( b r D [ i x ] 1 b r D [ i X ] ) l n ( 1 1 + k X t ) ;   k Y = b r D [ i X ] ;   b r [ i I ] = k Y × ( k X t × ( i x + 1 ) ) k X
Procedure for the exponential algorithm:
1.
Identification of vehicle input parameters:
k X = e x p ( l n ( b r D [ i x ] b r D [ i X ] 1 ) k X t ) ;   k Y = b r D [ i X ] k X k X t
2.
Forecast based on the data presented on the model or the measurement results:
b r [ i I ] = k Y × k X k X t ( i I + 1 )
In the version of the algorithm, based on experimental data, the equations from points 1 and 2 are used.
Analysis using a linear algorithm with disturbed parameters for individual components of the vehicle’s equipment.
Procedure:
b r [ i I ] = ( k X + k Z ) + k Y × k X t × ( i I + 1 )
Analysis using an algorithm with the use of harmonic weight for individual components of the vehicle’s equipment.
Procedure:
b r [ i I ] = k X t × ( k U 1 × b r [ i I 1 ] + k U 2 × b r [ i I 2 ] )
kU1 and kU2-harmonic weights used in the algorithm.
Adaptive forecasting algorithm based on experimental results.
Procedure:
b r [ i I + 1 ] = b r [ i I 2 ] + 1 , 5   × k X t × ( b r [ i I ] b r [ i I 1 ] )
The remaining algorithms are used as needed depending on the complexity of the team and in determining its nature of the failure frequency distribution and aperiodic costs.

3. Results and Discussion

The technical data of the ICEV reference vehicles and analyzed PHEV, BEV and HFEV in terms of energy consumption per kilometer are presented in Table 1. Other data placed into the model presented above were withdrawn from a wide group of reports (over 5000) based on users data, vehicle manufacturers and repair service enterprises.
Earlier research results and research work undertaken by other researchers indicated a greater advantage of BEV and PHEV drives over ICEVs. If many additional variables are introduced into the model, including periodic and aperiodic defects, it turns out that in the current state of the charging infrastructure and vehicle service and repair institutions, they are still uncompetitive. The introduction of these variables shows the weaknesses of these solutions and allows for a more efficient determination of what actions should be taken when implementing electromobility. In particular, the reliability of individual components for given drive systems should be assessed and the costs of their replacement reduced. This is still related to the cost of purchasing the battery base material.
The data on the failure frequency for the SUV class was also grasped from the data of other makes and models of vehicles in this class to increase the accuracy of the analyzes it was not limited to the group presented in Table 1.
In this analysis, it was assumed that their maximum power transmitted to the wheels is similar, so the energy demand is similar. The difference in the characteristics of the drive system of these vehicles consists in the differentiated efficiency of the general drive system, drive train and systems converting chemical energy into mechanical work transmitted to the wheels in HFEV and ICEV vehicles. The energy consumption-related information was obtained on the basis of reports from users and vehicle manufacturers with the introduction of statistical and forecasting algorithms based on the assumed timetables in two urban and extra-urban modes.
In Table 2, the correction coefficients of energy consumption in comparison with the reference ICEV petrol vehicle were calculated by simulation. For the model of fuel consumption from volumetric to energy units, net calorific values of 32.56 MJ/l for gasoline and 35.66 MJ/1 for diesel oil are assumed. A division into comfort classes was introduced in relation to the electrical equipment of the vehicle, which affects it’s additive energy consumption. The division was made for two modes of urban and extra-urban driving, taking into account the data of users and experimental data-appropriate correction models were introduced. The total vehicle weights are identical and the drag coefficients are very similar. The total efficiency of all components was taken into account, depending on the design of the drive system and transmission and auxiliary components.
The input data for the main model, taking into account the types of users and vehicle kilometers and the correlation of driving modes, are presented in Table 3. The calculations included data on the nature of timetables based on the correlation of mileage (percentage) in urban and extra-urban mode and the annual mileage depending on the user’s location, place of work, residence and potential locations of travel destinations. Input data: A1-professionally active people-traveling short distances in the range from several to 100 km, A2-people traveling or commuting within an average distance of up to 100 km to the place of employment, A3-people traveling long distances with high travel frequency during the day, A4-people who work intensively, often moving between cities over very long distances. The energy consumption of the vehicle and its demand for energy differ significantly depending on the urban and extra-urban driving mode. BEV and PHEV electric vehicles and derivative powertrains are more competitive in urban driving mode, therefore different types of potential users have different energy consumption. These types are verified by the annual mileage, the percentage of urban and extra-urban mileage, and the share of electrically driven mileage. The service life of the vehicle is 15 years for all types of users. On the basis of the input data concerning the nature of the vehicle operation, the values of standard deviation and standard uncertainty for the urban mode (1) and for the extra-urban mode (2) were calculated for the given groups. They define the differentiation of the approximate value from the extreme values in the statistical data. The smaller the value of the coefficient, the more similar the data values for a given group, determining the nature of the timetable. The results show very similar timetables depending on a given type of user, which facilitates the analysis. The data is based on a group of 1000 users.
Table 4 and Table 5 considers the total costs of ownership of ICEVs powered by gasoline without presuming the aperiodic phenomena and other operating circumstances that may increase operating costs and face these dependencies. It can be detect that the inclusion of this model offers vastly differences in TCO, which makes it possible to assess more reliably the actual operating costs of all types of vehicles. This model reflects the current availability status of the technical infrastructure in relation to a given drive system solution, in particular the refrigerant energy conversion system. The greatest changes in these values occur for groups A1 and A2, which proves the higher frequency of these phenomena and their removal costs in the urban mode. For the A3 and A4 flu, these costs also increase, but at a lesser level. Based on the results, it can be assumed that the impact of comfort equipment and energy consumption of individual equipment systems electrical, electronic and mechanical is also important for TCO. This is mainly due to the increased frequency of unforeseen failure of additional components and increased fuel consumption. In estimating TCO changes, in order to adopt the condition of introducing aperiodic phenomena, it is necessary to adopt very detailed data on the frequency and cost of faults occurring at a given mileage and in given operating conditions for a given vehicle, and to adopt appropriate calculation algorithms consistent with the previous arrangements for forecasting and approximating variables.
For other models, the total operating costs of the PHEV and BEV are significantly understated. This translates into a misinterpretation in relation to the profitability of their use.
An additional parameter TCO (DTCO) has to be entered in order to demonstrate the cost performance of alternative electric and hydrogen propulsion systems for the reference ICEV propulsion (TCO) (Table 6 and Table 7) In 2020, the DTCO for the ICEV with a diesel engine is negative for groups A2, A3 and A4 due to the lower unit cost of fuel purchase, which compensates for the higher purchase costs of a diesel powered vehicle. Nevertheless, operational factors approximated over a longer period of operation, bearing in mind the sub-model of aperiodic phenomena, indicate similar DTCO values in relation to ICEV vehicles powered by gasoline. In the case of group A1, which has a lower annual mileage and a high frequency of urban driving, a negative DTCO can only be identified for diesel ICEVs. Despite the immense share of the total mileage in urban mode for group A1, but assuming a slight mileage and very favorable operating conditions for vehicles using electric drive (large share of kinetic energy recuperation from braking), regardless of the capacity of the main energy source used (MHEV, FHEV, PHEV, EREV or BEV), this does not compensate for losses related to the operation and purchase of the vehicle. This can be seen in particular when considering the sub-model of aperiodic phenomena. For frequent travelers on longer distances, groups A2, A3 and A4 using a partially propelled electric system can be cost-effective. The MHEV and FHEV cars show negative DTCO values compared to the reference ICEV petrol vehicle depending on the comfort class. For BEVs, they also show positive DTCO values regardless of the comfort class and the addition of a calculation model introducing additional aperiodic variables. After substituting this data in the model and mainly the high purchase cost of components resulting from unforeseen failures, their use will not it is already so cost effective. The higher annual mileage for mainly A2–A4 groups leads to a lower Total Cost of Ownership for all alternative drives than for A1 group, as the additional repair costs for intermittent and aperiodic faults are offset by lower energy consumption.
HFEV vehicles powered by hydrogen cells are currently the least competitive, as the consumption and fuel costs are similar to ICEVs, and the operating and repair costs are very high due to the limited availability of refueling stations, service and repair workshops and spare parts. Additional measures are also required to maintain high efficiency of the installation in order to achieve high energy efficiency, which is associated with periodic replacements and repairs of the power system. For these vehicles, they can prove very competitive in ensuring greater availability of these utilities and reducing fuel costs. And such a state may already take place in 2030, as long as the technology and infrastructure will continue to be systematically introduced for general use, while increasing the availability of vehicles with this power system. It seems, however, that a lot of time and changes in social perception of this system must pass power plant to increase the number of HFEV buyers.

4. Summary and Conclusions

The paper analyzes the impact of decarbonization, i.e., a systematic process of reducing carbon dioxide (CO2) emissions to the atmosphere by analyzing the impact of energy efficiency and indirect costs related to the implementation of HFEV vehicles, as an alternative to ICEV, PHEV and BEV for passenger cars.The results manifest that with the current indirect costs related to the production process, expansion of the refueling network infrastructure, the implementation and operation of HFEV vehicles is still a more expensive solution than for PHEV and BEV vehicles. It must be taken into account that even if the costs of H2 distribution are omitted and the network of refueling stations and infrastructure is not available in larger urban agglomerations in Poland, especially in rural areas, the HFEV drive is still economically inefficient. It must be mentioned that currently there are no H2 refueling stations in Poland, as well as service and repair workshops.
The lack of an adequately developed network of EFEV service and repair vehicles significantly increases the costs of maintenance and repair activities, which negatively suggests the mass implementation of this type of drive system in Poland. At present, the operating costs are several times higher than in the case of ICEV, PHEV and BEV vehicles. However, they may be a good alternative to these propulsion systems in the future, but with a more advanced degree of expansion of the intermediate infrastructure.
The results also express that the continuous improvement of H2 production systems provides increasing system adaptation flexibility, with the intensification of production with surplus RES, in line with the current H2 production system efficiency and power system modernization methods.
The analysis display that the willingness to mass introduce HFEV vehicles in the case of passenger vehicles and public transport vehicles must be based on a sustainable system introducing infrastructure solutions for the expansion of the production system network, raw material distribution and refueling network, based on the growth of vehicles used on the Polish market.
The most important consideration for implementing these vehicles is the H2 production economy and the energy efficiency of HFEV powertrains. If it is assumed that, irrespective of the design solution, the structure of the ICEV, PHEV, BEV and HFEV vehicle body remains very similar geometrically for a given model and brand, then the legitimacy of using a given solution depends on: Efficiency and operating costs of the energy storage system, efficiency and failure frequency of drive systems and transmission, overall efficiency of the drive unit and the purchase cost of a given fuel energy unit.
The nature of the timetable and the operating conditions of a given drive system also have a great impact on the legitimacy of using a given drive system, which largely determines the number of aperiodic faults, which have an economic share in the case of using these vehicles.
The development of H2 fuel cell technology producing electricity for engines of passenger vehicles and heavy vehicles generates a real opportunity for the development of the energy market in Poland, but with the optimal combination of the gradual development of production and infrastructure with the costs of own contribution and potential economic benefits in a given area. It is assumed that the real development of this technology with sufficient network expansion may take place only in a dozen or so years (if it occurs).
Currently, in the production area in Poland, despite the production of over 1.0 million tons of hydrogen per year, there is no technology for producing hydrogen with the purity grade necessary for the safe and effective use of current vehicle drive systems. It is not until the end of 2021 that several refueling stations are planned, which significantly discourages potential customers from purchasing HFEV vehicles.
Only the co-optimization of many energy sectors of the economy in Poland, with reasonable planning of investments in the power system, can contribute to the effective use of synergy of these sectors and reduction of the costs of production potential in terms of reducing H2 fuel prices.
The use of H2 fuel in road transport to a large extent makes the fuel market independent of crude oil imports and the production of petroleum fuels, which will certainly translate into a reduction in CO2 emissions to the environment and will cause economic losses in the petroleum fuel sector. Therefore, the introduction of this technology requires a careful calculation of profits and losses in the global approach to the energy sector in Poland.

Author Contributions

Conceptualization, Methodology, Validation, Formal Analysis, Investigation, Writing. P.W., W.L. and W.D.; Original Draft Preparation, Visualization: P.W., W.L., W.D. and J.D.; Writing–Review and Editing, Supervision P.W., W.L. and W.D.; Project Administration: P.W., W.L. and W.D. All authors have read and agreed to the published version of the manuscript.

Funding

This research is funded by University of Szczecin; Research Center for Management of Energy Sector, Institute of Management, Cukrowa Street 8, 71-004 Szczecin, Poland.

Institutional Review Board Statement

Not applicable.

Informed Consent Statement

Not applicable.

Data Availability Statement

Not applicable.

Conflicts of Interest

The authors declare no conflict of interest.

Abbreviations

TCOTotal Cost of Ownership.
Pp−xpurchase price of a new vehicle with the selected drive.
Rp−xresale price of the vehicle at the end of the ownership period.
w t vehicle age.
w d vehicle mileage.
w z current state of vehicle wear, taking into account the design of the drive.
w d t m timetable coefficient for urban mode.
w d t m p timetable coefficient for extra-urban mode.
w d r e k the amount of energy recovered from auxiliary systems.
Ecthe cost of energy is equivalent to the cost of fuel or the cost of electricity per kilometer.
DveeTotal kilometers traveled during the lifetime of the electric vehicle.
Dvcethe total number of kilometers traveled during the lifetime of the vehicle powered by the internal combustion engine.
mis the monthly interest rate.
nnumber of monthly interest payments.
Pcamount borrowed in the case of loans.
Ninterest cost.
CICCompulsory Insurance Cost.
Pfcost periodic faults.
Afcost of aperiodic faults.
WPf−xPeriodic Failure Cost Factor.
WAf−xPeriodic Failure Cost Factor
kX, kY, kZmodel coefficients (trend algorithms: linear, quadratic, exponential, exponential, hyperbolic and power).
kXttime base discretization step for measurements and forecasting algorithm. ix-dimension of the table containing the measurement data for the development of the forecast
brDa table with the ix dimension containing the measurement results.
br [iI]a table of forecasts with the iK dimension including forecasts of the component reliability index up to the moment iK-a step forward.
iKforecasting horizon.
iIindex of the next time instant in which calculations are made for a given number of forecasts.
kXicoefficient of interpolation polynomial, i − 1 … n.
kU1 and kU2harmonic weights used in the algorithm

References

  1. Jeon, C.M.; Amekudzi, A.A.; Guensler, R.L. Evaluating Plan Alternatives for Transportation System Sustainability: Atlanta Metropolitan Region. Int. J. Sustain. Transp. 2010, 4, 227–247. [Google Scholar] [CrossRef]
  2. Cidell, J. Sustainable Transportation: Accessibility, Mobility, and Derived Demand. In Sustainability: A Comprehensive Foundation, Textbook Initiative; Theis, T., Tomkin, J., Eds.; Connexions: Kolkata, India, 2012; pp. 566–576. [Google Scholar]
  3. Miller, P. Sustainability and Public Transportation: Theory and Analysis. Ph.D. Thesis, University of Calgary, Calgary, AB, Canada, 2014. [Google Scholar]
  4. Adell, E.; Ljungberg, C. The Poly-SUMP Methodology. How to Develop a Sustainable Urban Mobility Plan for a Polycentric Region. In European Platform on Sustainable Urban Mobility Plans; European Commission: Brussels, Belgium, 2014. [Google Scholar]
  5. Russo, F.; Comi, A. City Characteristics and Urban Goods Movements: A Way to Environmental Transportation System in a Sustainable City. Procedia Soc. Behav. Sci. 2012, 39, 61–73. [Google Scholar] [CrossRef]
  6. Lewicki, W.; Stankiewicz, B.; Olejarz-Wahba, A.A. The Role of Intelligent Transport Systems in the Development of the Idea of Smart City. In Smart and Green Solutions for Transport Systems. TSTP 2019. Advances in Intelligent Systems and Computing; Sierpiński, G., Ed.; Springer: Berlin, Germany, 2020; Volume 1091, pp. 26–36. [Google Scholar]
  7. Tarapata, Z. Modeling and Analysis of Transportation Networks Using Complex Networks: Poland Case Study. Arch. Transp. 2015, 36, 55–65. [Google Scholar] [CrossRef]
  8. Settou, B.; Settou, N.; Gouareh, A.; Negrou, B.; Mokhtara, C.; Messaoudi, D. GIS-Based Method for Future Prospect of Energy Supply in Algerian Road Transport Sector Using Solar Roads Technology. Energy Procedia 2019, 162, 221–230. [Google Scholar] [CrossRef]
  9. Schill, W.P. Electric Vehicles in Imperfect Electricity Markets. In the case of Germany, Energy Policy; Elsevier: Amsterdam, The Netherlands, 2011; Volume 39, pp. 6178–6189. [Google Scholar]
  10. Robinius, M.; Otto, A.; Syranidis, K.; Ryberg, D.S.; Heuser, P.; Welder, L.; Grube, T.; Markewitz, P.; Tietze, V.; Stolten, D. Linking the Power and Transport Sectors—Part 2: Modelling a Sector Coupling Scenario for Germany. Energies 2017, 10, 957. [Google Scholar] [CrossRef] [Green Version]
  11. Figenbaum, E. Perspectives on Norway’s supercharged electric vehicle policy. Environ. Innov. Soc. Transit. 2017, 25, 14–34. [Google Scholar] [CrossRef] [Green Version]
  12. Connolly, D. Economic Viability of Electric Roads Compared to Oil and Batteries for All Forms of Road Transport. Energy Strat. Rev. 2017, 18, 235–249. [Google Scholar] [CrossRef]
  13. Smith, W. Can EV (electric vehicles) Address Ireland’s CO2 Emissions from Transport? Energy 2010, 35, 4514–4521. [Google Scholar] [CrossRef]
  14. Act of January 11, 2018 on Electromobility and Alternative Fuels. Ministry of Energy. Available online: http://dziennikustaw.gov.pl/du/2018/317/1 (accessed on 10 April 2021).
  15. Viesi, D.; Crema, L.; Testi, M. The Italian Hydrogen Mobility Scenario Implementing the European Directive on Alternative Fuels Infrastructure (DAFI 2014/94/EU). Int. J. Hydrog. Energy 2017, 42, 27354–27373. [Google Scholar] [CrossRef]
  16. Webb, J. The Future of Transport: Literature Review and Overview. Econ. Anal. Policy 2019, 61, 1–6. [Google Scholar] [CrossRef]
  17. Haasz, T.; Vilchez, J.J.G.; Kunze, R.; Deane, P.; Fraboulet, D.; Fahl, U.; Mulholland, E. Perspectives on Decarbonizing the Transport Sector in the EU-28. Energy Strat. Rev. 2018, 20, 124–132. [Google Scholar] [CrossRef]
  18. Kupczyk, A.; Mączyńska, J.; Redlarski, G.; Tucki, K.; Bączyk, A.; Rutkowski, D. Selected Aspects of Biofuels Market and the Electromobility Development in Poland: Current Trends and Forecasting Changes. Appl. Sci. 2019, 9, 254. [Google Scholar] [CrossRef] [Green Version]
  19. Cansino, J.M.; Sánchez-Braza, A.; Sanz-Díaz, T. Policy Instruments to Promote Electro-Mobility in the EU28: A Comprehensive Review. Sustainability 2018, 10, 2507. [Google Scholar] [CrossRef] [Green Version]
  20. Bradley, T.H.; Frank, A.A. Design, Demonstrations and Sustainability Impact Assessments for Plug-in Hybrid Electric Vehicles. Renew. Sustain. Energy Rev. 2009, 13, 115–128. [Google Scholar] [CrossRef]
  21. Samaras, C.; Meisterling, K. Life Cycle Assessment of Greenhouse Gas Emissions from Plug-in Hybrid Vehicles: Implications for Policy. Environ. Sci. Technol. 2008, 42, 3170–3176. [Google Scholar] [CrossRef] [Green Version]
  22. O’Driscoll, R.; Stettler, M.E.; Molden, N.; Oxley, T.; ApSimon, H.M. Real World CO2 and NOx Emissions from 149 Euro 5 and 6 Diesel, Gasoline and Hybrid Passenger Cars. Sci. Total. Environ. 2018, 621, 282–290. [Google Scholar] [CrossRef]
  23. Plötz, P.; Árpád, F.S.; Jochem, P. The Impact of Daily and Annual Driving on Fuel Economy and CO2 Emissions of Plug-in Hybrid Electric Vehicles. Transp. Res. Part A Policy Pract. 2018, 118, 331–340. [Google Scholar] [CrossRef]
  24. Shankar, R.; Marco, J. Method for Estimating the Energy Consumption of Electric Vehicles and Plug-in Hybrid Electric Vehicles Under Real-World Driving Conditions. IET Intell. Transp. Syst. 2013, 7, 138–150. [Google Scholar] [CrossRef]
  25. The ICCT, Real-World Usage of Plug-In Hybrid Electric Vehicles: Fuel Consumption, Electric Driving, and CO2 Emissions. 2020. Available online: https://theicct.org/publications/phev-real-world-usage-sept2020 (accessed on 17 November 2020).
  26. Teixeira, A.C.R.; Sodré, J.R. Impacts of Replacement of Engine Powered Vehicles by Electric Vehicles on Energy Consumption and CO2 Emissions. Transp. Res. Part D Transp. Environ. 2018, 59, 375–384. [Google Scholar] [CrossRef]
  27. Berylls Strategy Advisor Battery Production Today and Tomorrow: Too Many Manufacturers, Too Few Customers. 2018. Available online: https://www.berylls.com/wp-content/uploads/2018/03/20180323_Studie_E-Mobilitaet_EN.pdf (accessed on 17 November 2020).
  28. Radovic, U. Effects of Electric Vehicles on the Polish Power Generation System, Emissions of CO2 and Other Air Pollutants, The Bulletin of The Mineral and Energy Economy Research Institute of the Polish Academy of Sciences. Zesz. Naukowe Inst. Gospod. Surow. Miner. Energ. Polskiej Akad. Nauk 2018, 104, 69–84. [Google Scholar]
  29. Ni, M.; Leung, M.K.; Leung, D.Y.; Sumathy, K. A Review and Recent Developments in Photocatalytic Water-Splitting Using TiO2 for Hydrogen Production. Renew. Sustain. Energy Rev. 2007, 11, 401–425. [Google Scholar] [CrossRef]
  30. Shin, J.; Hwang, W.-S.; Choi, H. Can Hydrogen Fuel Vehicles be a Sustainable Alternative on Vehicle Market? Comparison of electric and Hydrogen Fuel Cell Vehicles. Technol. Forecast. Soc. Chang. 2019, 143, 239–248. [Google Scholar] [CrossRef]
  31. Contestabile, M.; Offer, G.J.; Slade, R.L.; Jaeger, F.; Thoennes, M. Battery Electric Vehicles, Hydrogen Fuel Cells and Biofuels. Which Will be the Winner? Energy Environ. Sci. 2011, 4, 3754–3772. [Google Scholar] [CrossRef]
  32. Achtnicht, M.; Bühler, G.; Hermeling, C. The Impact of Fuel Availability on Demand for Alternative-Fuel Vehicles. Transp. Res. Part D Transp. Environ. 2012, 17, 262–269. [Google Scholar] [CrossRef]
  33. Puškár, M.; Kopas, M. System Based on Thermal Control of the HCCI Technology Developed for Reduction of the Vehicle NOX Emissions in Order to Fulfil the Future Standard Euro 7. Sci. Total. Environ. 2018, 643, 674–680. [Google Scholar] [CrossRef] [PubMed]
  34. Granovskii, M.; Dincer, I.; Rosen, M.A. Economic and Environmental Comparison of Conventional, Hybrid, Electric and Hydrogen Fuel Cell Vehicles. J. Power Sour. 2006, 159, 1186–1193. [Google Scholar] [CrossRef]
  35. Ezzat, M.; Dincer, I. Development and Assessment of a New Hybrid Vehicle with Ammonia and Hydrogen. Appl. Energy 2018, 219, 226–239. [Google Scholar] [CrossRef]
  36. Van Vliet, O.P.; Kruithof, T.; Turkenburg, W.C.; Faaij, A.P. Techno-Economic Comparison of Series Hybrid, Plug-in Hybrid, Fuel Cell and Regular Cars. J. Power Sour. 2010, 195, 6570–6585. [Google Scholar] [CrossRef]
  37. Tromaras, A.; Aggelakakis, A.; Margaritis, D. Car Dealerships and Their Role in Electric Vehicles’ Market Penetration—A Greek Market Case Study. Transp. Res. Procedia 2017, 24, 259–266. [Google Scholar] [CrossRef]
  38. Hidrue, M.K.; Parsons, G.R.; Kempton, W.; Gardner, M.P. Willingness to Pay for Electric Vehicles and Their Attributes. Resour. Energy Econ. 2011, 33, 686–705. [Google Scholar] [CrossRef] [Green Version]
  39. Larson, P.D.; Viáfara, J.; Parsons, R.V.; Elias, A. Consumer Attitudes about Electric Cars: Pricing Analysis and Policy Implications. Transp. Res. Part A Policy Pract. 2014, 69, 299–314. [Google Scholar] [CrossRef]
  40. Ellram, L. Total Cost of Ownership—An Analysis Approach for Purchasing. Inter. J. Phys. Distrib. Logist. Manag. 1995, 25, 4–23. [Google Scholar] [CrossRef]
  41. De Jong, G.; Fox, J.; Daly, A.; Pieters, M.; Smit, R. Comparison of Car Ownership Models. Transp. Rev. 2004, 24, 379–408. [Google Scholar] [CrossRef]
  42. Al-Alawi, B.M.; Bradley, T.H. Total Cost of Ownership, Payback, and Consumer Preference Modeling of Plug-in Hybrid Electric Vehicles. Appl. Energy 2013, 103, 488–506. [Google Scholar] [CrossRef]
  43. Guo, Z.; Zhou, Y. Residual Value Analysis of Plug-in Vehicles in the United States. Energy Policy 2019, 125, 445–455. [Google Scholar] [CrossRef]
  44. Leard, B.; Linn, J.; McConnell, V. Fuel Prices, New Vehicle Fuel Economy, and Implications for Attribute-Based Standards. J. Assoc. Environ. Resour. Econ. 2017, 4, 659–700. [Google Scholar] [CrossRef]
  45. Ajanovic, A.; Haas, R.; Wirl, F. Reducing CO2 Emissions of Cars in the EU: Analyzing the Underlying Mechanisms of Standards, Registration Taxes and Fuel Taxes. Energy Effic. 2016, 9, 925–937. [Google Scholar] [CrossRef]
  46. Hagman, J.; Ritzén, S.; Stier, J.J.; Susilo, Y. Total Cost of Ownership and Its Potential Implications for Battery Electric Vehicle Diffusion. Res. Transp. Bus. Manag. 2016, 18, 11–17. [Google Scholar] [CrossRef] [Green Version]
  47. Lebeau, P.; Macharis, C.; Van Mierlo, J.; Lebeau, K. Electrifying Light Commercial Vehicles for City Logistics? A Total Cost of Ownership Analysis. Eur. J. Transp. Infrastruct. Res. 2015, 15, 551–569. [Google Scholar]
  48. Jin, W.; Deng, Y.; Jiang, H.; Xie, Q.; Shen, W.; Han, W. Latent Class Analysis of Accident Risks in Usage-Based Insurance: Evidence from Beijing. Accid. Anal. Prev. 2018, 115, 79–88. [Google Scholar] [CrossRef] [PubMed]
  49. Roda, I.; Garetti, M. Application of a Performance-Driven Total Cost of Ownership (TCO) Evaluation Model for Physical Asset Management (WCEAM), 9th ed.; Springer: Cham, Switzerland, 2016; pp. 11–23. [Google Scholar]
  50. Bubeck, S.; Tomaschek, J.; Fahl, U. Perspectives of Electric Mobility: Total Cost of Ownership of Electric Vehicles in Germany. Transp. Policy 2016, 50, 63–77. [Google Scholar] [CrossRef]
  51. Propfe, B.; Kreyenberg, D.; Wind, J.; Schmid, S. Market Penetration Analysis of Electric Vehicles in the German Passenger Car Market Towards 2030. Int. J. Hydrog. Energy 2013, 38, 5201–5208. [Google Scholar] [CrossRef]
  52. Weiss, M.; Patel, M.K.; Junginger, M.; Perujo, A.; Bonnel, P.; Van Grootveld, G. On the Electrification of Road Transport-Learning Rates and Price Forecasts for Hybrid-Electric and Battery-Electric Vehicles. Energy Policy 2012, 48, 374–393. [Google Scholar] [CrossRef]
  53. Kennedy, D.; Philbin, S.P. Techno-Economic Analysis of the Adoption of Electric Vehicles. Front. Eng. Manag. 2019, 6, 538–550. [Google Scholar] [CrossRef]
  54. Wróblewski, P. Effect of Asymmetric Elliptical Shapes of the Sealing Ring Sliding Surface on the Main Parameters of the Oil Film; VII International Congress on Combustion Engines; Combustion Engines: Poznan, Poland, 2017; Volume 168, pp. 84–93. [Google Scholar]
  55. Wróblewski, P.; Iskra, A. Problems of Reducing Friction Losses of a Piston-Ring-Cylinder Configuration in a Combustion Piston Engine with an Increased Isochoric Pressure Gain; SAE Technical Paper Series; SAE International: Warrendale, PA, USA, 2020. [Google Scholar] [CrossRef]
  56. Wróblewski, P. The Effect of the Distribution of Variable Characteristics Determining the Asymmetry of the Sealing Rings Sliding Surfaces on the Values of Friction Loss Coefficients and Other Selected Parameters of Oil Film. Aim Your Enthus. Target. Increased Middle Class Health Insur. Tax Credits 2017, 171, 107–116. [Google Scholar] [CrossRef]
  57. Lewicki, W. The Case Study of the Impact of the Costs of Operational Repairs of Cars on the Development of Electromobility in Poland. Arch. Automot. Eng. 2017, 78, 107–116. [Google Scholar]
  58. Wróblewski, P. The Impact of the Asymmetric Shapes of Sliding Surfaces of Sealing Rings on the Mechanical Efficiency of the Reciprocating Combustion Engine. In Doctoral Dissertation; Publishing House of Poznań University of Technology: Poznań, Poland, 2018. [Google Scholar]
  59. Wróblewski, P. Technology for Obtaining Asymmetries of Stereometric Shapes of the Sealing Rings Sliding Surface for Selected Anti-Wear Coatings, Event: SAE Powertrains, Fuel & Lubricants Meeting; SAE Technical Paper; SAE International: Warrendale, PA, USA, 2020; Volume 1. [Google Scholar] [CrossRef]
  60. Csiszár, C. Demand Calculation Method for Electric Vehicle Charging Station Locating and Deployment. Period. Polytech. Civ. Eng. 2019, 63, 255–265. [Google Scholar] [CrossRef]
  61. Vita, V.; Koumides, P. Electric Vehicles and Distribution Networks: Analysis on Vehicle to Grid and Renewable Energy Sources Integration. In Proceedings of the 11th Electrical Engineering Faculty Conference (BulEF), Varna, Bulgaria, 11–14 September 2019. [Google Scholar] [CrossRef]
Figure 1. Breakdown of the total cost of ownership of vehicles equipped with different types of drives due to different indirect costs.
Energies 14 02131 g001
Figure 2. Number of ICEV petrol vehicles.
Energies 14 02131 g002
Figure 3. Number of ICEV diesel vehicles.
Energies 14 02131 g003
Figure 4. Number of ICEV LPG fueled vehicles.
Energies 14 02131 g004
Figure 5. Number of vehicles powered by other energy source, e.g., PHEV, BEV and HFEV vehicles (they represent about 10% of the population).
Energies 14 02131 g005
Figure 6. The total number of passenger vehicles registered in Poland at the end of 2019-24,360,166.
Energies 14 02131 g006
Table 1. Characteristics of selected vehicles.
Vehicle ModelEngine PowerReal-World Energy Consumption
UrbanExtra-Urban
Hyundai Tuscon L4 1.6l T-GDI ICEV SUV177 KM 130 kW9.40 l/100 km7.80 l/100 km
Hyundai Tuscon L4 2.0 CRDI ICEV SUV185 KM 136 kW8.40 l/100 km7.50 l/100 km
Hyundai Tuscon HFEV SUV134 KM (98.56 kW)1.15 kg-H2 kg/100 km0.95 kg-H2 kg/100 km
Kia Niro Crossover PHEV 1.6 GDI Hybrid141 KM (104 kW)13.70 kWh/100 km12.40 kWh/100 km
BEV Hyundai Kona Electric SUV64 kWh battery power
204 KM (150.04 kW)
15.40 kWh/100 km14.20 kWh/100 km
Table 2. Coefficients correcting the energy consumption in comparison with ICEV vehicles (spark-ignition and compression-ignition engines).
Energy Analysis for SUVs Based on a Reference Group of 5000 Vehicles and Own Simulation Calculations
Drive modeUrbanExtra-Urban
Vehicle comfort equipment class-energy consumption-correctionVehicle comfort equipment class-energy consumption-correction
PrimaryAverageHighPrimaryAverageHigh
Petrol ICEV1.0001.0001.0001.0001.0001.000
Diesel ICEV0.7210.7370.7450.6340.6710.693
Petrol MHEV0.8320.8450.8570.7320.7690.797
Diesel MHEV0.5830.5920.5970.5130.5390.555
Petrol FHEV0.7450.7550.7680.6560.6870.714
Diesel FHEV0.5120.5230.5340.4510.4760.497
Petrol EREV0.7480.7550.7670.6580.6870.713
Diesel EREV0.5120.5220.5340.4510.4750.497
Petrol PHEV0.7350.7480.7630.6470.6810.710
Diesel PHEV0.5080.5190.5260.4470.4720.489
BEV 10.1870.2260.2420.1650.2060.225
BEV 20.1960.2340.2590.1720.2130.241
HFEV0.3310.3730.3560.2910.3390.331
* BEV 1 and BEV2-classes of small and large capacity batteries, which is associated with the correction of the efficiency of the electrical system.
Table 3. Input data for the main model, taking into account the types of users and vehicle-kilometers as well as the correlation of driving modes.
TypeAnnual [vkm]Urban Mileage [%]Extra-Urban [%]Standard Deviation 1Standard Deviation 1Standard Uncertainty 1Standard Uncertainty 2
A1789262.237.80.0280124970.0430034880.0114360540.017556101
A215,16243.856.20.0216494800.0233880310.0088383630.009548124
A331,08920.179.90.0188547080.0294297130.0076974020.012014630
A446,78914.485.60.0266139060.0400599550.0108650820.016354408
Table 4. Total cost of ownership of the reference vehicle with ICEV petrol engine for 3 equipment classes depending on the types of users, excluding the sub-model related to aperiodic faults and other unforeseen circumstances of use (EUR2020/km).
Total Cost of Ownership of the Reference Vehicle SUV with an ICEV Petrol Engine-No Fault Model
Drive modeTypVehicle comfort equipment class-energy consumption-correction
PrimaryAverageHigh
Petrol ICEVA10.7520.7650.783
A20.4120.4240.445
A30.3210.3330.366
A40.2730.2920.319
Table 5. Total cost of ownership of the reference vehicle with ICEV gasoline engine for 3 equipment classes depending on the types of users with the introduction of the sub-model related to aperiodic failures and other unforeseen circumstances of use (EUR2020/km).
Total Cost of Ownership of the Reference Vehicle SUV with an ICEV Petrol Engine-with the Fault Model
Drive modeTypVehicle comfort equipment class-energy consumption-correction
PrimaryAverageHigh
Petrol ICEVA10.8980.9470.992
A20.5450.5710.599
A30.4110.4320.475
A40.2930.3160.323
Table 6. Total cost of use of DTCO for various drives of SUVs depending on the equipment class and without taking into account the model covering aperiodic phenomena for a given group for 2020.
Differential Total Cost of Ownership of DTCO for Given Vehicle Groups Compared to the ICEV Reference Group Petrol SUV Category [EUR-ct-2020/km]
Drive ModeTypComfort and Equipment Class
PrimaryAverageHigh
FromToFromToFromTo
Diesel ICEVA1
A2
A3
A4
−0.987
−1.235
−2.783
−4.436
−0.675
−1.123
−1.345
−2.856
−0.783
−1.009
−2.456
−4.234
−0.329
−0.775
−1.023
−2.508
−0.231
−0.562
−1.830
−3.341
0.445
−0.321
−0.675
−1.952
Petrol MHEVA1
A2
A3
A4
−0.592
−0.741
−1.670
−2.662
−0.378
−0.629
−0.753
−1.599
−0.438
−0.565
−1.375
−2.371
−0.181
−0.426
−0.563
−1.379
−0.132
−0.320
−1.043
−1.904
0.694
−0.180
−0.378
−1.093
Diesel MHEVA1
A2
A3
A4
−0.807
−2.322
−2.733
−3.999
0.765
0.564
0.118
−0.112
−0.710
−1.880
−1.866
−3.337
1.165
1.464
0.318
0.136
−0.070
−1.178
−1.460
−2.630
5.311
2.730
0.607
−0.457
Petrol FHEVA1
A2
A3
A4
0.397
−0.496
−1.119
−1.784
3.434
1.245
0.834
0.234
0.693
−0.379
−0.921
−1.589
4.979
1.805
1.209
0.339
0.688
−0.214
−0.699
−1.276
6.490
2.353
1.576
0.442
Diesel FHEVA1
A2
A3
A4
0.596
−0.694
−1.343
−2.141
4.151
1.743
1.001
0.181
1.140
−0.531
−1.105
−1.707
7.469
2.527
1.351
0.407
1.532
−0.300
−0.839
−1.231
9.735
3.294
1.891
0.530
Petrol EREVA1
A2
A3
A4
14.523
6.523
3.78
1.24
32.214
12.234
9.673
4.569
15.103
6.783
3.931
1.289
33.503
12.723
10.060
4.752
15.406
6.920
4.010
1.315
34.508
13.105
10.362
4.894
Diesel EREVA1
A2
A3
A4
15.234
6.733
4.346
1.456
36.749
14.675
9.673
4.890
15.843
7.002
4.520
1.514
38.219
15.262
10.060
5.086
16.160
7.142
4.610
1.545
39.366
15.720
10.362
5.238
Petrol PHEVA1
A2
A3
A4
12.173
5.467
3.168
1.039
27.060
10.277
8.126
3.838
13.005
5.841
3.385
1.110
28.782
10.930
8.643
4.083
13.148
5.906
3.422
1.122
29.566
11.228
8.878
4.193
Diesel PHEVA1
A2
A3
A4
12.769
5.643
3.643
1.221
30.869
12.327
8.126
4.108
13,642
6.030
3.892
1.304
32.834
13.112
8.643
4.369
13.791
6.095
3.934
1.318
33.728
13.469
8.878
4.488
BEV 1A1
A2
A3
A4
20.245
7.231
6.237
5.648
48.111
16.239
14.673
10.237
21.055
7.520
6.486
5.874
50.035
16.889
15.260
10.646
21.476
7.671
6.616
5.991
51.537
17.395
15.718
10.966
BEV 2A1
A2
A3
A4
20.447
7.346
6.423
5.743
50.035
16.889
15.260
10.646
21.265
7.640
6.680
5.973
52.036
17.565
15.870
11.072
21.690
7.793
6.814
6.092
53.597
18.091
16.347
11.404
HFEVA1
A2
A3
A4
30.245
14.134
8.672
3.214
80.324
42.124
25.239
17.328
31.455
14.699
9.019
3.343
83.537
43.809
26.249
18.021
32.084
14.993
9.199
3.409
86.043
45.123
27.036
18.562
* BEV 1 and BEV2-classes of small and large capacity batteries, which is associated with the correction of the efficiency of the electrical system.
Table 7. Total cost of DTCO use for various drives of SUVs depending on the equipment class and taking into account the model including aperiodic and other phenomena that may affect the TCO for a given group for 2020.
Differential Total Cost of Ownership of DTCO for Given Vehicle Groups Compared to the ICEV Reference Group Petrol SUV Category [EUR-ct-2020/km]
Drive ModeTypComfort and Equipment Class
PrimaryAverageHigh
FromToFromToFromTo
Diesel ICEVA1
A2
A3
A4
−0.621
−0.893
−2.102
−3.076
−0.456
−0.649
−0.902
−2.134
−0.546
−0.723
−1.435
−2.567
0.127
−0.563
−0.783
−1.489
−0.054
−0.453
−1.123
−2.023
1.235
0.175
−0.467
−1.121
Petrol MHEVA1
A2
A3
A4
−0.311
−0.447
−1.051
−1.538
−0.219
−0.312
−0.433
−1.024
−0.257
−0.340
−0.674
−1.206
0.058
−0.259
−0.360
−0.685
−0.022
−0.181
−0.449
−0.809
1.976
0.680
0.587
0.448
Diesel MHEVA1
A2
A3
A4
−0.541
−1.556
−1.831
−2.679
0.513
0.378
0.079
−0.075
−0.398
−1.053
−1.045
−1.869
1.829
2.298
0.499
0.214
−0.042
−0.707
−0.876
−1.578
7.435
3.822
0.850
−0.640
Petrol FHEVA1
A2
A3
A4
−0.210
−0.263
−0.593
−0.946
3.846
1.394
0.934
0.262
−0.147
−0.190
−0.461
−0.795
6.672
2.419
1.620
0.454
−0.020
−0.049
−0.161
−0.293
14.473
5.247
3.514
0.986
Diesel FHEVA1
A2
A3
A4
0.775
−0.278
−0.537
−0.856
5.396
2.266
1.301
0.235
1.482
−2.124
−4.420
−6.828
9.710
3.285
1.756
0.529
1.992
−0.126
−0.352
−0.517
12.656
4.282
2.458
0.689
Petrol EREVA1
A2
A3
A4
15.975
7.175
4.158
1.364
38.657
14.681
11.608
5.483
17.067
7.666
4.442
1.457
40.538
15.395
12.173
5.750
17.255
7.750
4.491
1.473
41.064
15.595
12.330
5.824
Diesel EREVA1
A2
A3
A4
16.757
7.406
4.781
1.602
44.099
17.610
11.608
5.868
17.903
7.913
5.107
1.711
46.245
18.467
12.173
6.154
18.099
7.999
5.163
1.730
46.845
18.707
12.330
6.233
Petrol PHEVA1
A2
A3
A4
13.025
5.850
3.390
1.112
30.037
11.407
9.020
4.260
14.123
6.343
3.676
1.205
32.322
12.274
9.706
4.585
14.371
6.455
3.740
1.226
33.469
12.710
10.050
4.746
Diesel PHEVA1
A2
A3
A4
13.663
6.038
3.898
1.306
34.265
13.683
9.020
4.560
14.815
6.549
4.227
1.416
36.873
14.725
9.706
4.906
15.074
6.662
4.300
1.441
38.180
15.247
10.050
5.080
BEV 1A1
A2
A3
A4
22.270
7.954
6.861
6.213
58.214
19.649
17.754
12.387
23,792
8.498
7.330
6.638
59.842
20.199
18.251
12.733
24.053
8.591
7.410
6.710
60.658
20.474
18.500
12.907
BEV 2A1
A2
A3
A4
21.469
7.713
6.744
6.030
53.187
17.953
16.221
11.317
22.647
8.136
7.114
6.361
54.846
18.513
16.727
11.670
22.688
8.151
7.127
6.372
56.170
18.960
17.131
11.951
HFEVA1
A2
A3
A4
37.201
17.385
10.667
3.953
95.586
50.128
30.034
20.620
39.004
18.227
11.183
4.145
112.775
59.142
35.436
24.329
40.105
18.742
11.499
4.262
134.227
70.392
42.176
28.956
* BEV 1 and BEV2-classes of small and large capacity batteries, which is associated with the correction of the efficiency of the electrical system.
Publisher’s Note: MDPI stays neutral with regard to jurisdictional claims in published maps and institutional affiliations.

