
Quality and Reliability-Exploitation Modeling of Power Supply Systems


1
Faculty of Transport, Warsaw University of Technology, Koszykowa 75, 00-662 Warsaw, Poland
2
Faculty of Electronic, Military University of Technology, gen. S. Kaliskiego 2, 00-908 Warsaw, Poland
3
Institute of Telecommunications, Warsaw University of Technology, Nowowiejska 15/19, 00-665 Warsaw, Poland
*
Author to whom correspondence should be addressed.
Energies 2021, 14(9), 2727; https://doi.org/10.3390/en14092727
Submission received: 11 March 2021
/
Revised: 3 May 2021
/
Accepted: 7 May 2021
/
Published: 10 May 2021
(This article belongs to the Section G: Energy and Buildings)
Abstract
:This article describes the issues related to the analysis of the reliability-exploitation of power supply systems in transport telematics devices (PSSs in TTDs). This paper characterizes solutions, which are applied in supply systems, and describes a PSS in a TTD from a main source and a standby one. This enables determining the dependencies denoting the probabilities of the system staying in full ability state, safety threat state, and safety unreliability state. A quality analysis of the PSS in TTD was conducted, and the indicator value of the supply continuity quality was evaluated. This indicator allows the demonstration of continuity quality of power supply (CQoPS) dependency on many quality dimensions, not just reliability. An example demonstrates the calculation of CQoPS factor for both the main and the standby power supply, employing three observations, each influencing the quality. The presented considerations in the field of quality and reliability-exploitation modeling of a PSS can be applied as well in other public utility facilities (including those classified as critical infrastructure). The character of functions performed by critical infrastructure facilities demands an operating continuity of these systems at an appropriate level. The co-first authors of the article once again address the issue of determining CQoPS factor, this time on the basis of modeling using mathematical evidence. TTD is an example in this article, because the presented methods can be used in any kind of system, especially in the power source of critical systems.
1. Introduction
During the exploitation of power supply systems in transport telematics devices (PSSs in TTDs), there are many diverse external factors, whose impact means that each of the systems might stop being exploitable at a different moment after activation. In order to provide an appropriate level of security of operated transport services [1,2], solutions are introduced that enable increasing the value of probability of maintaining exploitability of the system. This article presents a reliability-exploitation and quality analysis of PSS in TTD.
From a range of general reflections on the theory of reliability, many outstanding literary works [3,4] can be listed. These publications include, e.g., the analyses of a variety of reliability structures (series, parallel, and series-parallel). There are also numerous publications in the field of rationalization of the system exploitation process [5,6]. Knowing the reliability structure of a system, a transition graph between the featured exploitation states could be depicted taking into account the defined relationships between them. Subsequently applying the Chapman–Kolmagorov equations [7] and the Laplace transform yields equations enables counting the probability values of a system being in the exemplified exploitation states. Such an approach will be adopted in reliability-exploitation analyses of PSSs in TTDs.
There is a large number of publications [8,9,10] in which the functioning and designing of power supply systems were characterized. Yet, these works belong to rather generic ones. The character of technical solutions and requirements in regard to power supply systems applied in transport demands ensuring appropriate values of the quality and reliability-exploitation indicators [11]. Exactly this is the topic of the subsequent sections of this article. Such an approach can be considered novel in the analysis of power supply systems in transport telematics devices.
2. Review of Literature in the Area of Reliability-Exploitation and Quality Analysis of Power Supply Systems
Issues regarding the analysis of power supply system reliability have appeared in many papers. The most important studies’ content [12,13] (describes classical reliability analysis of power supply systems), despite the passage of time, is still up to date and provides a basis for advanced mathematical considerations in currently prepared publications.
The demand to provide an appropriate power supply in order to achieve reliable functioning of transport telematics devices imposes an application of redundant power supplies. There is a study [14] that describes static and dynamic systems of standby supply. Such solutions facilitate the increase of the value of the system readiness. They do not yet take into account the specific conditions in which power supply systems in transport telematics devices function.
An essential issue is the exploitation of the power system. There is a publication [12] that describes the influence of financial investments on the increase of reliability indicator values. Scientifically interesting are the reliability models presented by authors that regard the supply systems and probability distribution of chosen reliability indicators. They can be adopted in the assessment of currently operating systems.
Apart from the reliability of supply systems, the quality of power supply is vital. The study described in [13] proves that values of chosen reliability indicators can be applied to a variety of types of power grids. This study also includes calculations concerning reliability-exploitation of power grids. The given figures are included in this article with regard to quality analysis of power supply systems in transport telematics devices.
Currently there are numerous studies that aim is to optimize power supply. The presented research models take into account economical aspects. Due to this, rational functioning of power supply is possible [15,16]. The approach adopted in these studies does not take into account the quality aspects of the functioning of power supply systems.
It is essential to obtain the required indicators of reliability-exploitation values in power supply systems in transport telematics devices. As it has been mentioned before, it is vital to apply redundant power supplies. For this reason, standby power supplies are introduced next to the main ones [17,18,19,20]. Most frequently, these are generating sets or renewable sources of energy (PV systems, wind turbines). Their application leads to the improvement of the values of the power supply reliability-exploitation indicators. Control systems, which are responsible for switching from the main power supply to the redundant one, in such solutions are essential together with management and power grid control systems [21]. The conducted reliability-exploitation analysis in these studies justified the application of such solutions.
Power supply systems in transport telematics devices (PSSs in TTDs) should feature much better technical parameters than those that are applied in offices or homes. This results from the fact that they serve as traffic control and thus influence the level of traffic safety (road, rail, and air) [22].
Today, while designing PSSs in TTDs, one cannot overlook the adoption of renewable sources of energy. Regarding this matter, there is a scientifically valuable publication [23]. It provides an analysis of several dozens of studies in the field of supply systems using PV. Some authors devoted part of their research to reliability analysis to achieve appropriate values of supply system reliability-exploitation indicators.
One of the most crucial issues is the application of renewable sources of energy (e.g., PV) in PSSs in TTDs. This mainly concerns facilities located far from main traffic management centers. One publication [24] explores the modeling of control methods in those types of supply systems, taking specifically into account diverse states of unreliability.
Another important issue in providing appropriate PSSs in TTDs is the problem of power supply redundancy for facilities located in non-residential areas. An example of such is a base transceiver station (BTS) for digital mobile telecommunication system applied in traffic management (e.g., rail transport). Usually, the redundant power supply consists of a power generating unit. An article [25] delves into additionally applying PV systems. The conducted analyses and simulations (both concerning power supply reliability and economic aspects) confirm the validity of applying such solutions.
PSSs in TTDs cooperate with the environment. Thus, their reliability-exploitation indicators, which describe them, should have adequate values for the type of transport facility. Therefore reliability-exploitation analysis is vital [26]. The electromagnetic compatibility of the applied electrical and electronic devices [27,28,29] in PSSs is equally essential. Due to the extensiveness of this issue, the authors do not refer to it in this article. When designing PSSs, the impact of electromagnetic interference should be taken into account.
All above-mentioned issues hardly determine the usefulness of power supplies on the basis of reliability-exploitation parameters calculated using Kolmogorov–Chapman Equations. Power supply quality assessment allows for a bigger number of factors, which can influence the result of this system’s assessment and which especially in classical evaluations are omitted due to the complexity of calculations [30,31]. Applying quality assessment, one can also perform a subjective evaluation, i.e., regarding it only from the standpoint of service requirement, in this case, the power supply.
Therefore, this article describes a more refined method, which enables determining quality indicators of systems as presented in several publications [32,33].
To that end, a broader view on the topic was applied by introducing a quality analysis of PSSs in TTDs and evaluating the values of power supply continuity quality with the adoption of the Dempster–Shafer mathematical theory of evidence (DS) [34,35,36]. Quality is a degree to which a set of inherent characteristics meets requirements [37], and a quality measure can be objective, but it often remains subjective and relative [38,39] and can consist of many elements. Considering all these characteristics, the uncertainty model integrating quality measures [40] could be an appropriate model to describe quality. This is exactly the modeling method applied in this publication. Not only can it be employed in systems describing power supply quality [34], but also the ones that provide a description of information quality in telematics and in transport as well as in non-technical fields.
The co-first authors of the article [41] presented a different approach to the evaluation of the supply system based on the modelling of CQoPS factor. Namely, they employed uncertainty modelling, i.e., the certainty factor (CF) of the hypothesis. The authors applied a model based on uncertainty calculations using DS mathematical evidence [34,35]. The methods presented in this paper can be treated as novel, because there is a lack of publications, which simultaneously analyze PPSs in TTDS with regard to reliability-exploitation aspects together with the quality evaluation. This is precisely what the authors of this article have scrutinized.
3. Reliability-Exploitation Analysis of Power Supply Systems
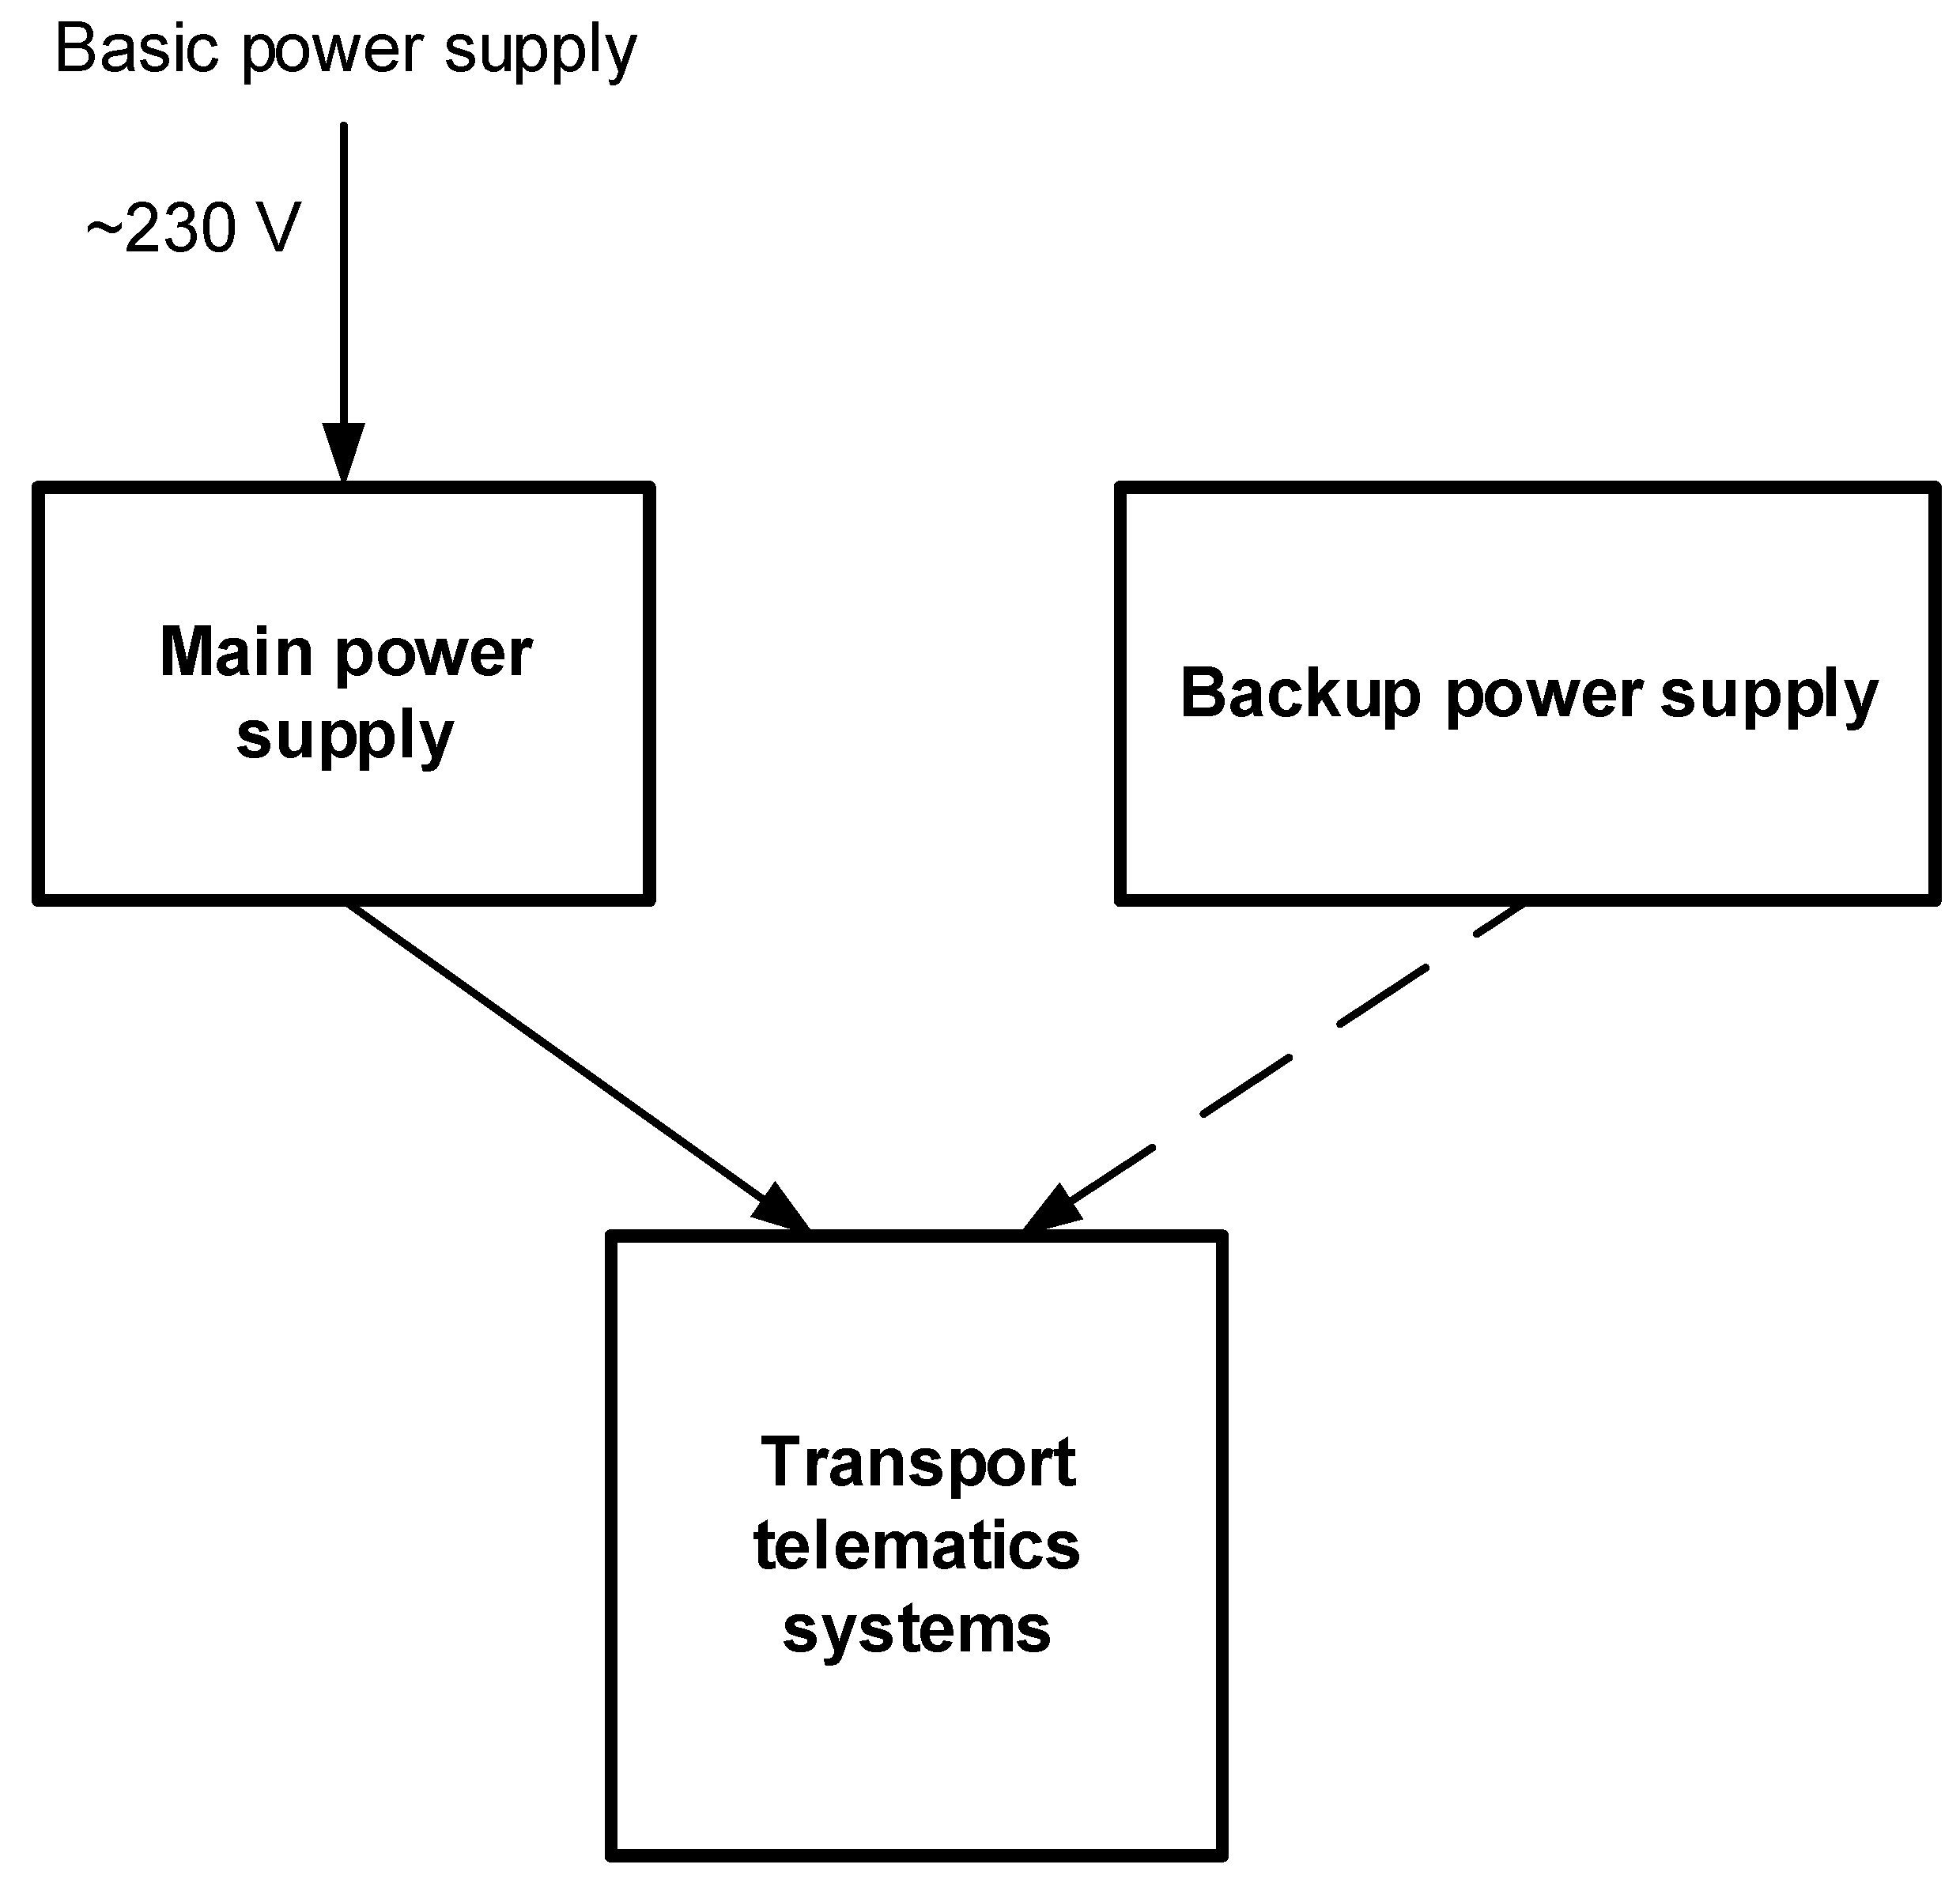
PSSs in TTDs perform many functions, which enable the transport process to work efficiently. Appropriate power supply of the individual complementary devices is required in order to ensure reliable functioning [42,43]. Their failure may lead to malperformance of the whole system or of its part [44,45]. That is why, among others, in TTDs the supply is provided from two independent sources. The first one is the main power supply, whereas the second one is redundant. In the case of incapacity of the main source, it automatically switches to the redundant supply. A structural sketch of a power supply consisting of these two independent sources of power, meant for PSSs in TTDs, is shown in Figure 1.
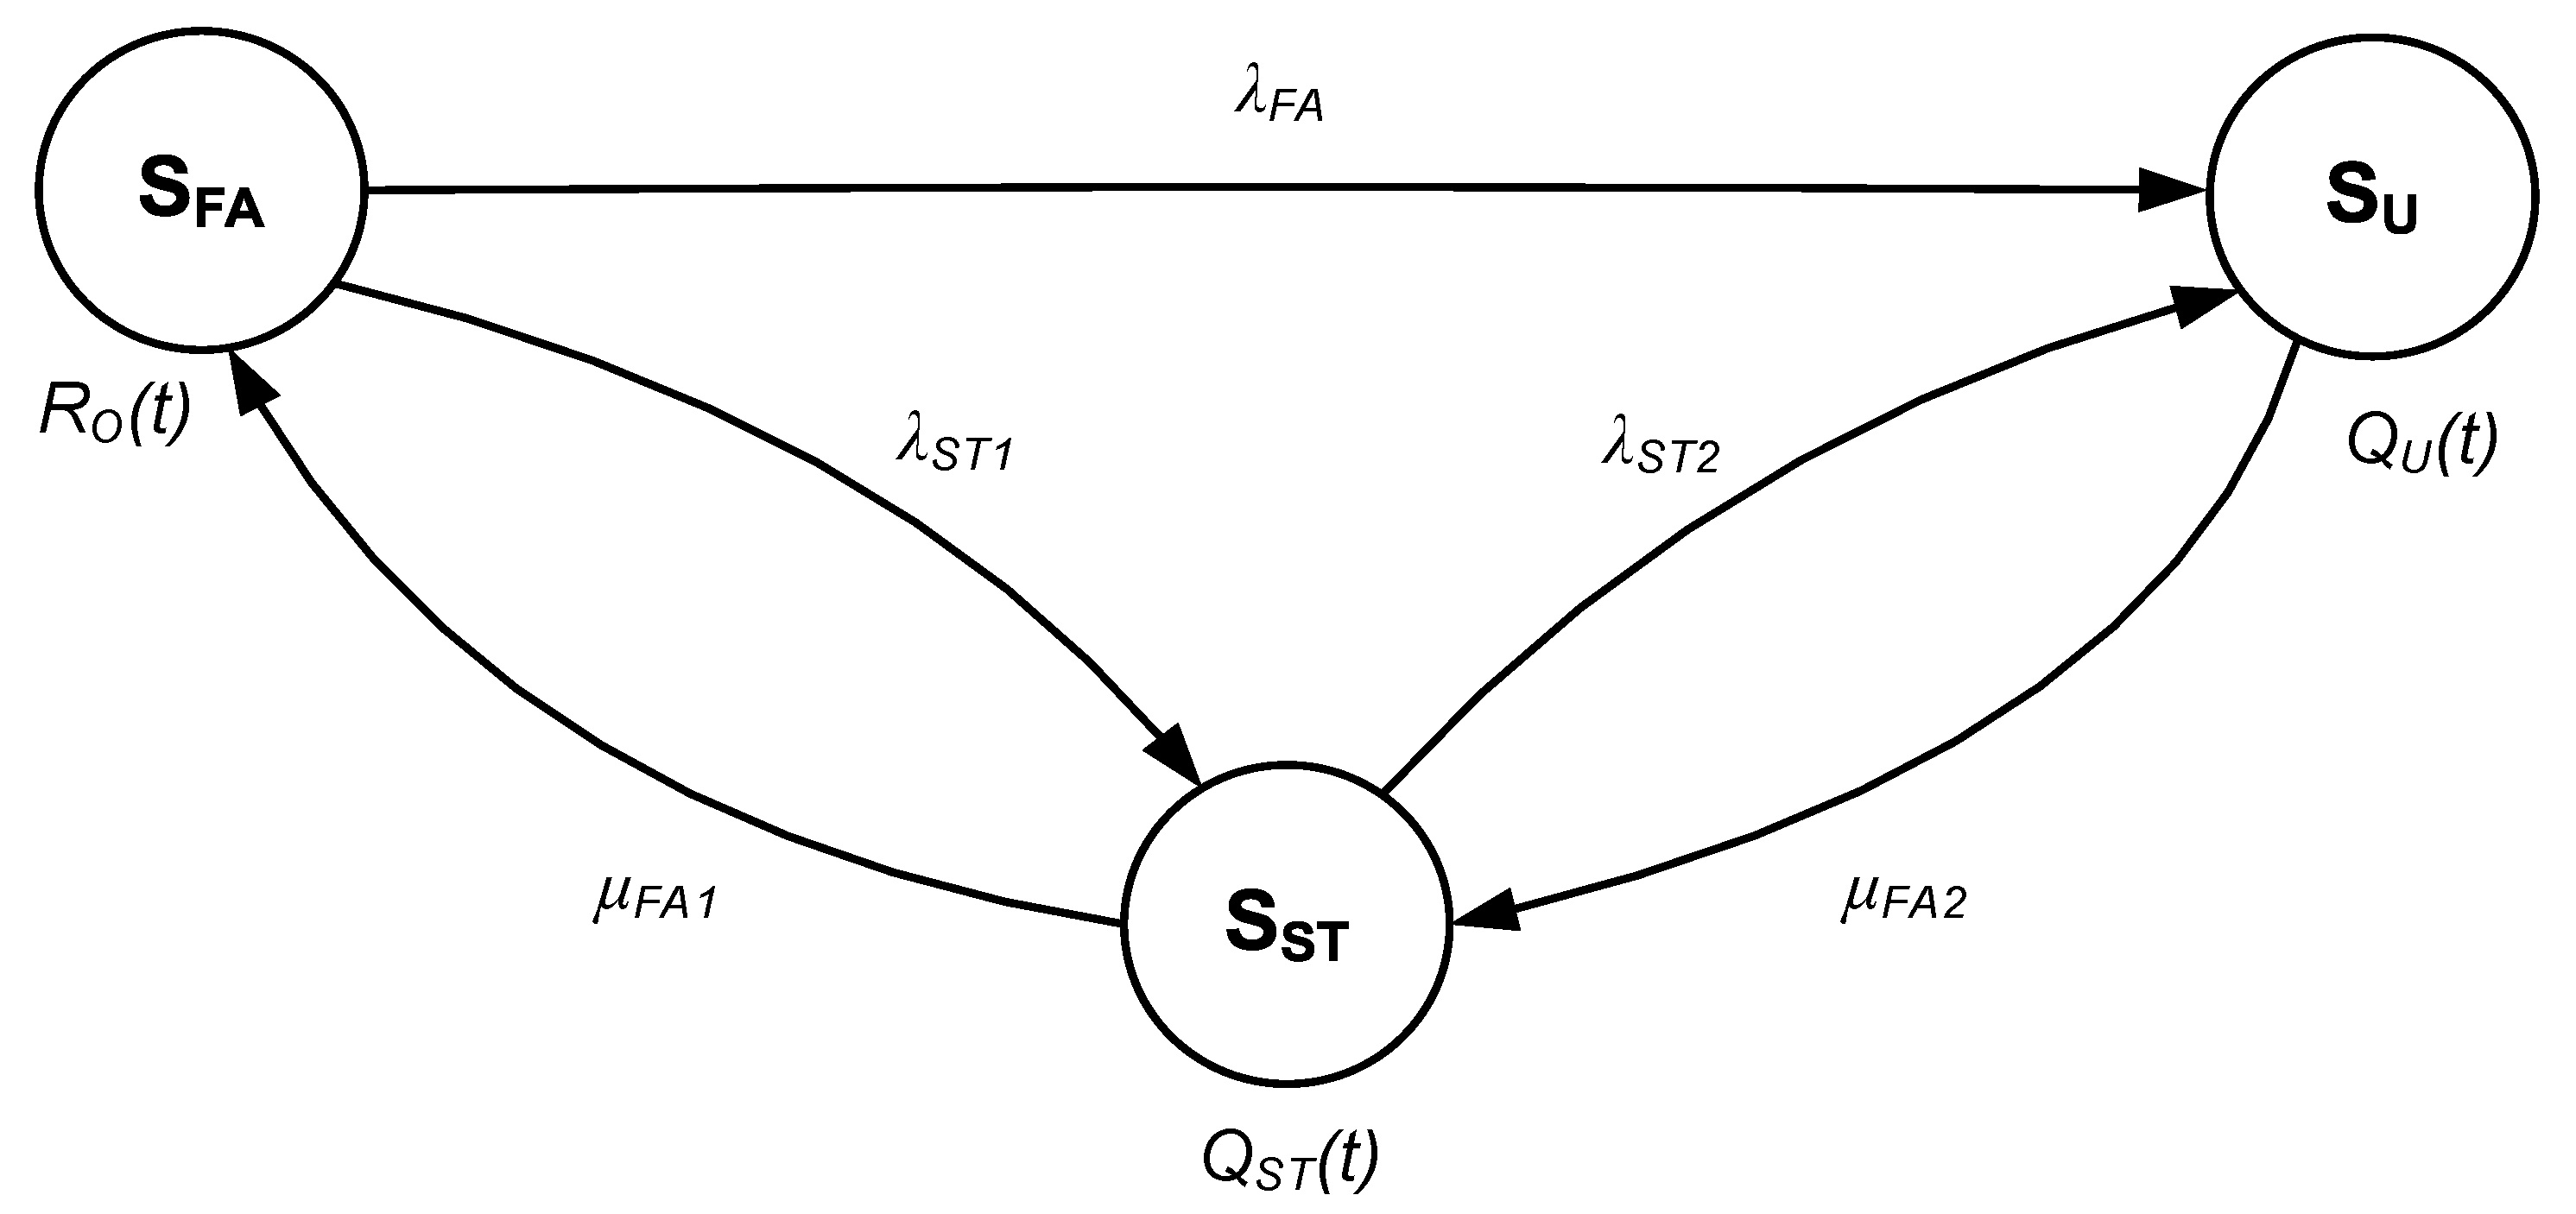
Conducting an analysis of the PSS in TTD depicted in Figure 1, one can claim that relations occurring in it with regard to reliability-exploitation analysis can be described as in Figure 2. A model of supplying a critical system, i.e., telematics transport system supply, has been used as an example.
Symbols in Figure 2 represent:
- RO(t)—probability function of the system occurring in full ability state SFA,
- QST(t)—probability function of the system occurring in safety threat state SST,
- QU(t)—probability function of the system occurring in unreliability of safety state SU,
- λST1—transitions rate from full ability state SFA to safety threat state SST,
- μFA1—transitions rate from safety threat state SST to full ability state SFA,
- λST2—transitions rate from safety threat state SST to unreliability of safety state SU,
- μFA2—transitions rate from unreliability of safety state SU to safety threat state SST,
- λFA—transitions rate from full ability state SFA to unreliability of safety state SU.
Full ability state SFA is a state in which both power supplies in TTDs function correctly (both the main and the redundant one). Safety threat state SST represents a situation when the main power supply is unfit. Unreliability of safety SU state occurs when both sources of power supply are unfit.
If in the case of a state of full ability SFA of a PSS in TTD, a failure of power supply circuit occurs, then the system switches to the state of safety threat SST with λST1 intensity rate. When a PSS in TTD is in a state of safety threat SST, it is possible to transfer to full ability state SFA by undertaking measures to restore the ability state in the main power supply circuit.
If in the case of safety threat state SST the standby power supply fails, then a transition into the state of safety unreliability occurs at λST2 intensity rate. A return transition from the safety unreliability state to the safety threat state becomes possible if appropriate actions are taken to restore ability state to the standby power supply unit.
If in the case of full ability state SFA both sources of power supply fail, then direct transition to the state of safety unreliability SU occurs.
The system presented in Figure 2 can be described with the following Chapman–Kolmogorov Equations:
Adopting the following initial conditions:
and applying Laplace transform yields the following system of linear equations:
The probabilities that the PSS in TTD stays in the given functional states appear in symbolic (Laplace) terms as follows:
Solution to the equation set (4) in the time domain is the next stage of this analysis, yet it is not discussed in this article.
4. Exploitation Process Modeling of PSSs in TTDs
Computer simulations allow determining quite quickly the influence of value changes of various reliability-exploitation indicators of specific subsystems on the values of indicators, describing the whole analyzed PSS.
Probability values of the PSS in TTD in full ability state SFA, safety threat state SST, and safety unreliability state SU were determined employing computer aid (like in example 1).
An example 1
The following values were chosen to define the analyzed PSS in TTD:
- test duration—1 year:
- reliability of main power supply:
- reliability of the redundant power supply:
- transition rate from safety threat state to full ability state:
- transition rate from unreliability of safety state to safety threat state:
- transition rate from full ability state to unreliability of safety state:
Knowing the reliability value , it is possible to evaluate the transition rate from full ability state to safety threat state. Employing the simplest exponential distribution model of reliability time, we can take advantage of the following dependency:
so
For and yields the result:
Knowing the reliability value , it is possible to evaluate the transition rate from safety threat state to unreliability of safety state.
Employing exponential distribution, we obtain:
so
For and we obtain:
For the initial values given in example 1 and adopting Equation (4) and inverse Laplace transform, we obtain:
Transition rate from limited ability state to full ability state is—as is obvious in the case of exponential distribution—the inverse of time :
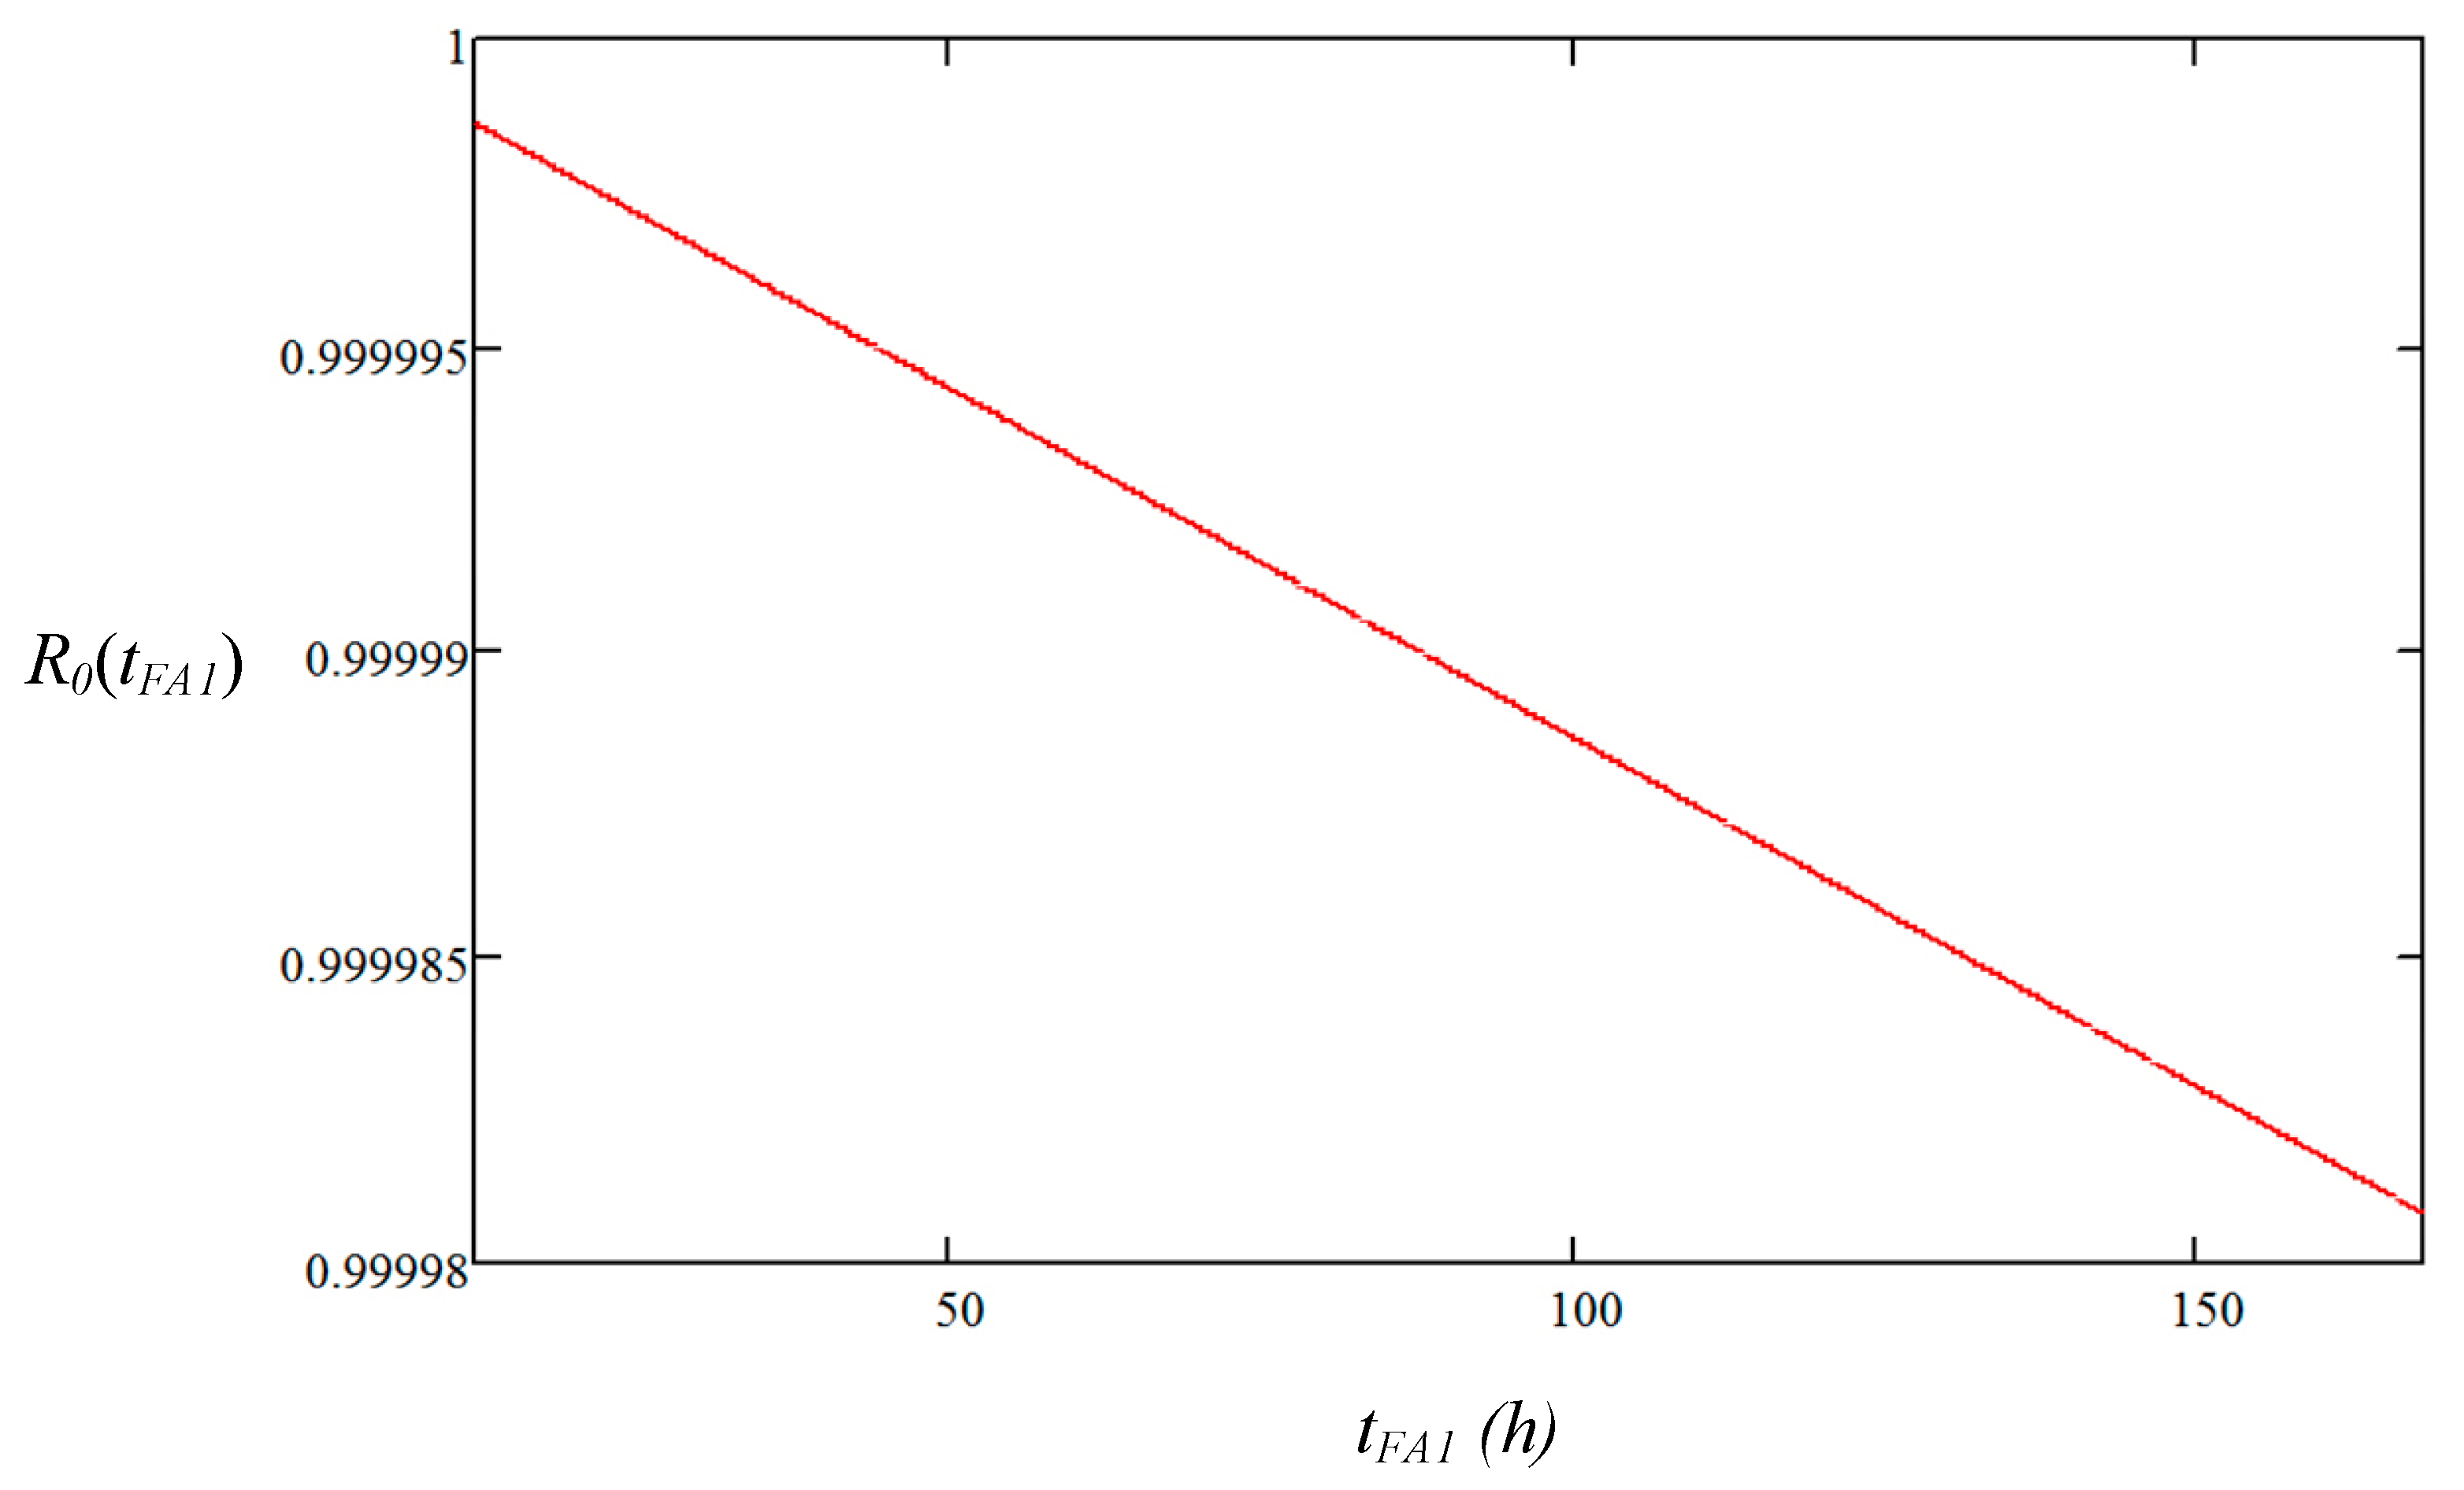
Assuming that the time of restoring the full ability state is enclosed in a bounded interval (that is, within days ), the probabilities of the analyzed system staying in full ability state are presented in Figure 3. The time value is defined on the basis of real power supply system observation [46,47,48]. The time depends on the service delivery, which aims to fix the system.
On the basis of the diagram in Figure 3, the rationalisation of activities connected with restoring a full ability state can be achieved (e.g., maintaining services that guarantee the system repair in a given time).
The conducted analysis of PSS in TTD allows an evaluation of the level of safety of the employed solutions in transport facilities and structures. It can also be applied to evaluate solutions considered for the purpose of modernizing PSS. These will enable an improvement of the reliability indicator values and rationalization of the exploitation process [49].
5. Quality Analysis of PSS in TTD
At the beginning of this article, it is claimed that it is not possible to fully determine the usability of the power supplies on the basis of reliability-exploitation parameters calculated using Kolmogorov–Chapman Equations. Therefore, a more refined method was suggested, which enables determining reliability indicator values of systems as presented in studies [32,33,50]. This method derives from the quality assessment of the energy supply system.
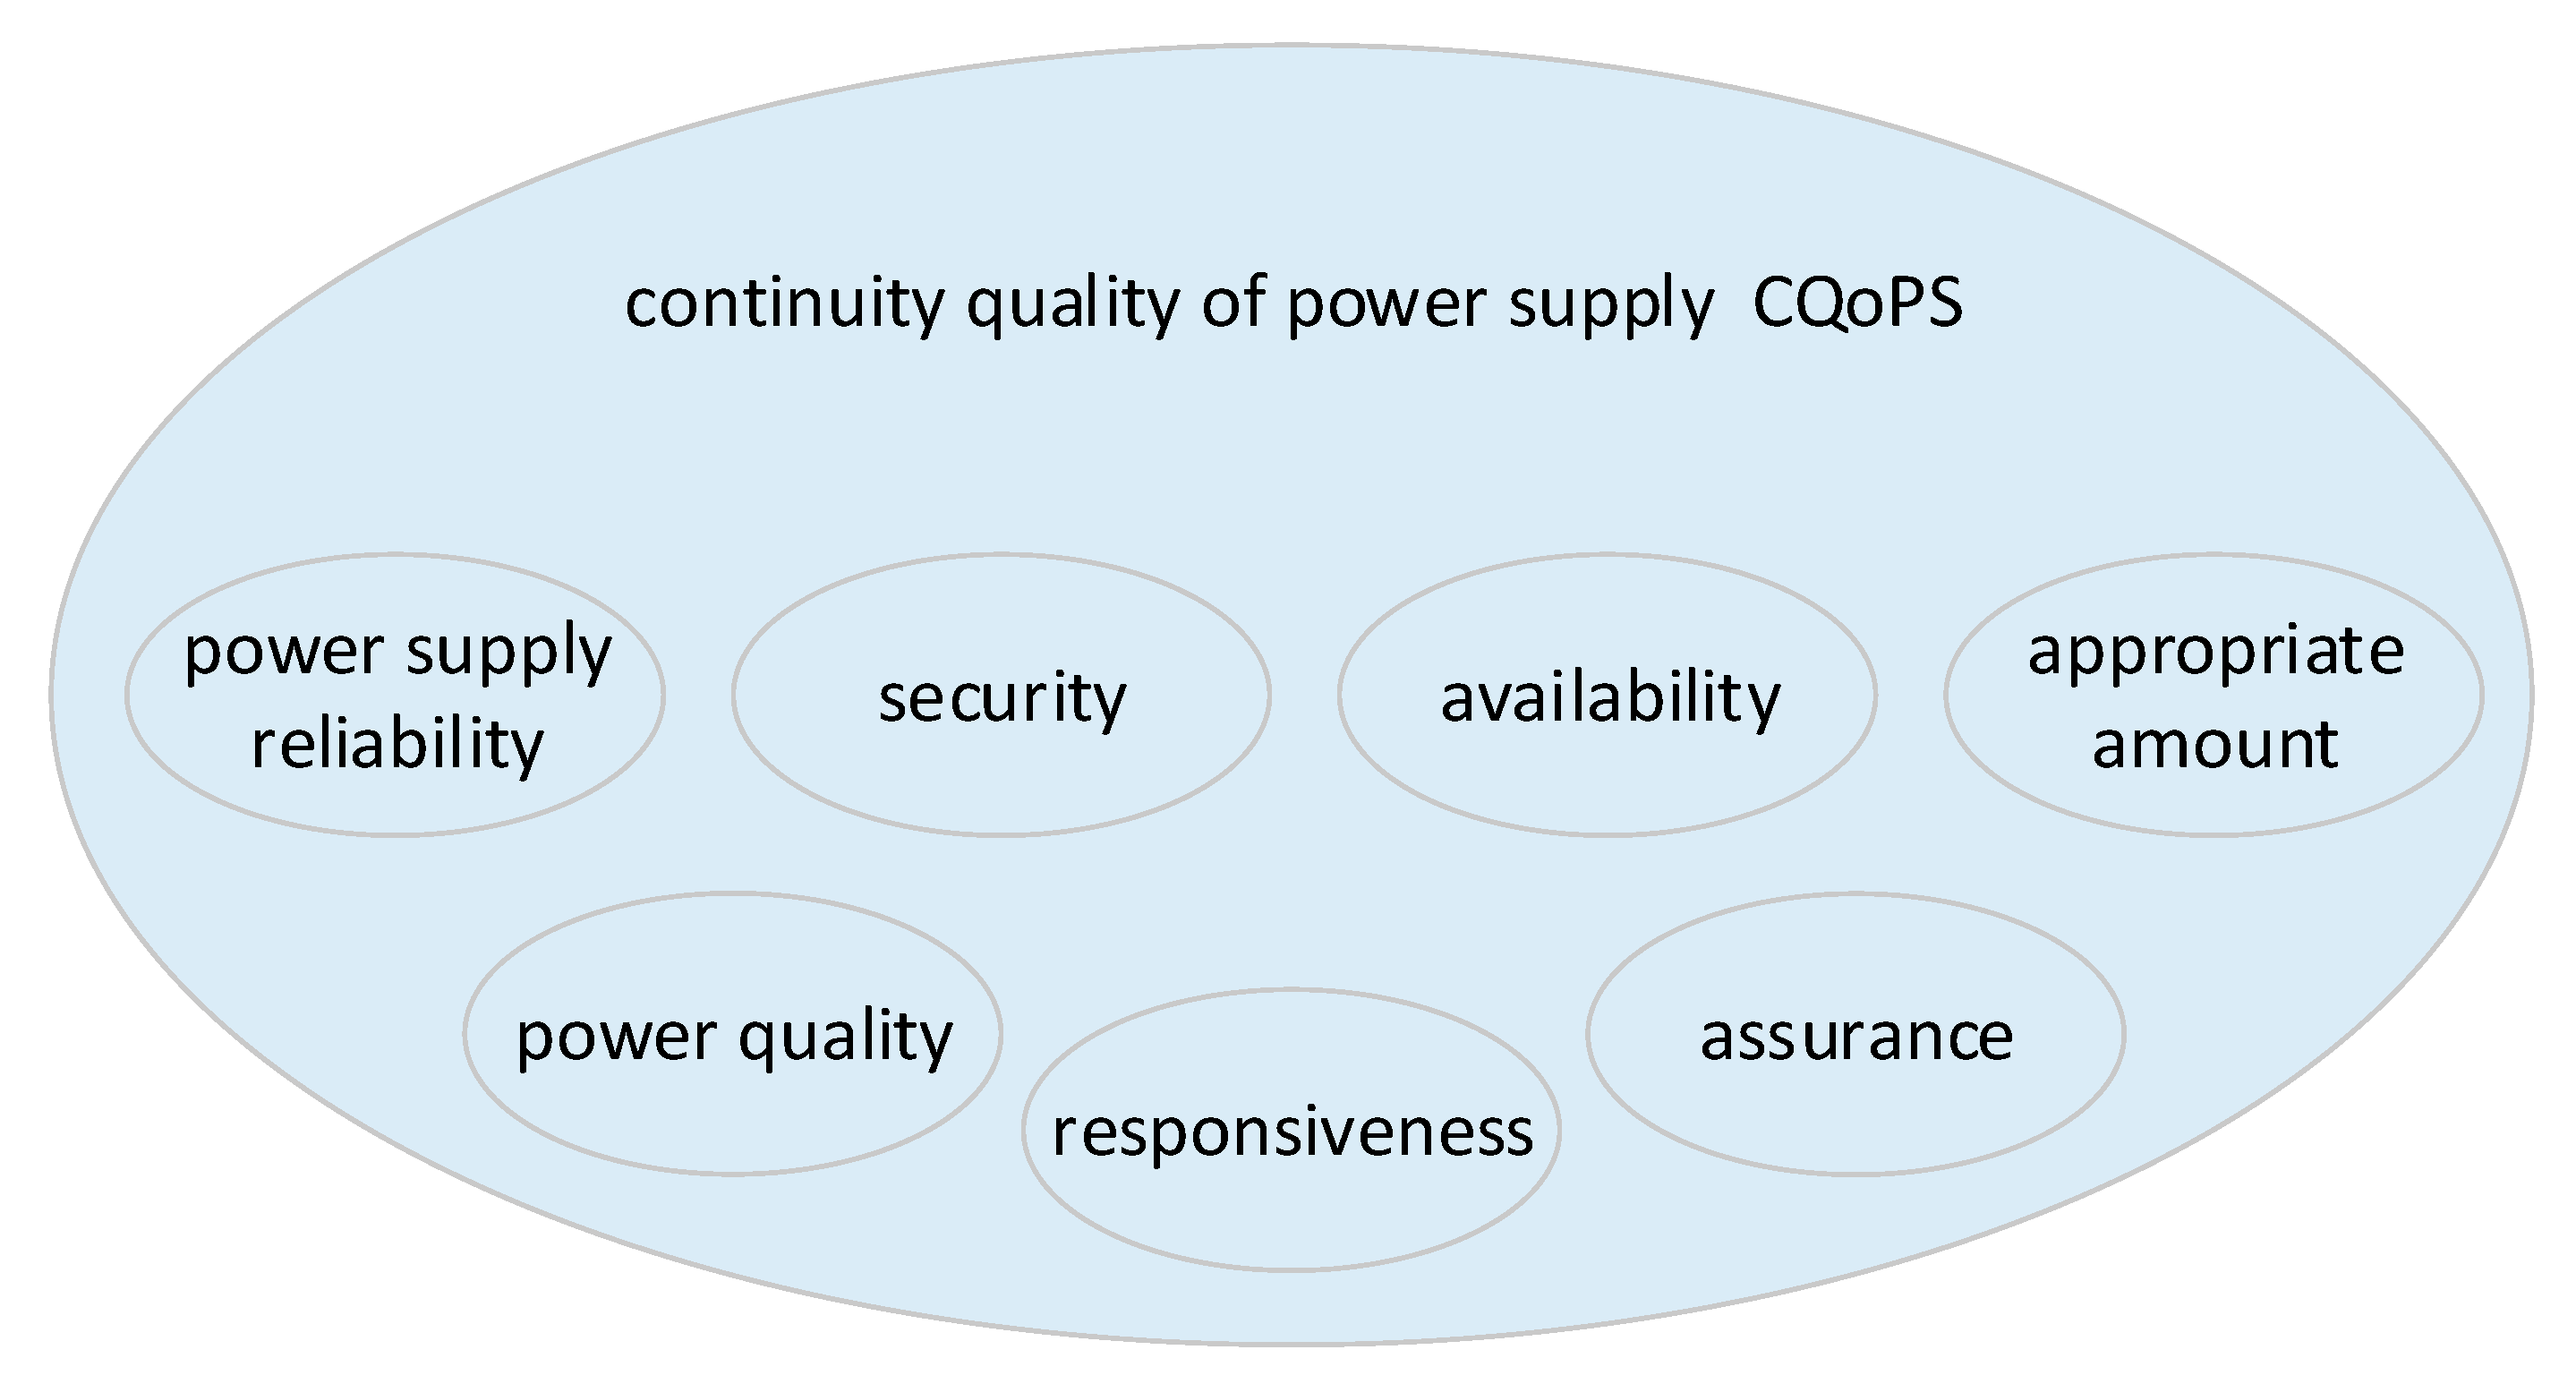
Quality assessment in this article is founded on the perceptions of quality presented in MITIQ related publications (Massachusetts Institute of Technology Information Quality Program [51]). The developed information quality model based on sixteen dimensions and about a hundred properties [51] fits quite well with the issues analyzed in this article. On the basis of the research and analysis conducted at MITIQ [51] as well as on our own study [36,50], the CQoPS model is established on seven dimensions of quality (Figure 4) [40,41]. Here is a list of these dimensions:
- Power supply reliability (Dpsr)—a dimension that determines that the reliability of the power system is at an appropriate level to perform a particular task.
- Security (Dse)—a dimension that determines adequate protection of the power supply systems against external factors.
- Availability (Dav)—a dimension that defines the possibility of using electricity on demand, at a given time and by an authorized process. This dimension is directly related to power security.
- Appropriate amount (Daa)—a dimension that determines how much energy is adequate to complete the task, at the same time indicating that the amount is sufficient and that power surplus could reduce the quality.
- Power quality (Dpq)—a dimension that defines the supplied power quality.
- Responsiveness (Dres)—a dimension that determines requested energy availability and whether the supply system will meet this demand.
- Assurance (Das)—a dimension that determines energy availability for the task.
The coefficient of each of the above-mentioned dimensions can be the result of modelling multiple layers into which many properties of that dimension can be positioned. This enables the creation of an open, multi-layer CQoPS dimension model. Adopted parameters related to power can be the dimension properties, e.g., for the Dpq dimension, parameters describing the quality of power can be added.
Each of the dimensions listed above affects CQoPS directly. Yet, it must be established that:
- The value of each dimension (dimension coefficient) can range from 0 to 1.
- The dimension not affecting CQoPS will have the value 1.
- The dimension that significantly reduces CQoPS will have the value 0.
CQoPS can be determined using statistical methods (e.g., the probability of error Pe can be used as the dimension coefficient. Power quality = 1 − Pe) using <0.1> intervals. However, better ways for determining CQoPS are methods of estimating uncertainty, such as mathematical evidence based on Dempster–Shafer theory or certainty factor (CF) modeling [32,50] and other methods of estimating uncertainty.
In general, it can be assumed that the CQoPS measure consists of many times repeated dimensions from Figure 4. Thus, CQoPS can be described by the formula:
where:
CQoPS = f(w1,w2,…,wm),
- m—number of dimensions, quality components (equals 7 in accordance with the number of the above-mentioned dimensions),
- w—a variable defining the influence of a given dimension (e.g., value in the range ˂0,1>).
The above considerations lead to a conclusion that this method uses directed graphs, and the calculations of the dimension coefficients are performed using uncertainty modeling. This type of modeling is presented later in this article.
Employing the data from the previous section and data formulated in the scientific literature [52,53,54,55,56], it is possible to perform a quality analysis of PSS in TTD and reduce many dimensions of power supply continuity quality to one value [54]. The quality model was devised on the basis of a flat form model like in the studies about information quality modeling [40]. The continuity quality of power supply (CQoPS) developed in that way evaluating the model was based on the observation of factors influencing power supply continuity [36]. This type of modeling was previously presented by the co-first authors [41], with the difference that reliability was not considered there as one of the dimensions. Taking reliability into account as one of the dimensions enables a relatively simple comparison of the proposed method of assessing power supply systems with the methods used so far. It also clearly displays how the CQoPS-based method is more accurate than the reliability-based method currently in use.
There are two independent groups of factors influencing power supply continuity:
- Factors connected with the main source of supply. In this case, the source could be the power installation. This group of factors will include main power supply reliability [57], power availability (whether sufficient power is provided), and service errors. Factors connected with source of supply will influence the value of intermediate hypothesis h1.
- Factors connected with a standby source of supply. In this case, the source could be a local power-generating unit. This group of factors will include standby power supply reliability [4,32], power availability (whether sufficient power is provided), and service errors of the local power-generating unit. Factors connected with standby power supply will influence the value of intermediate hypothesis h2.
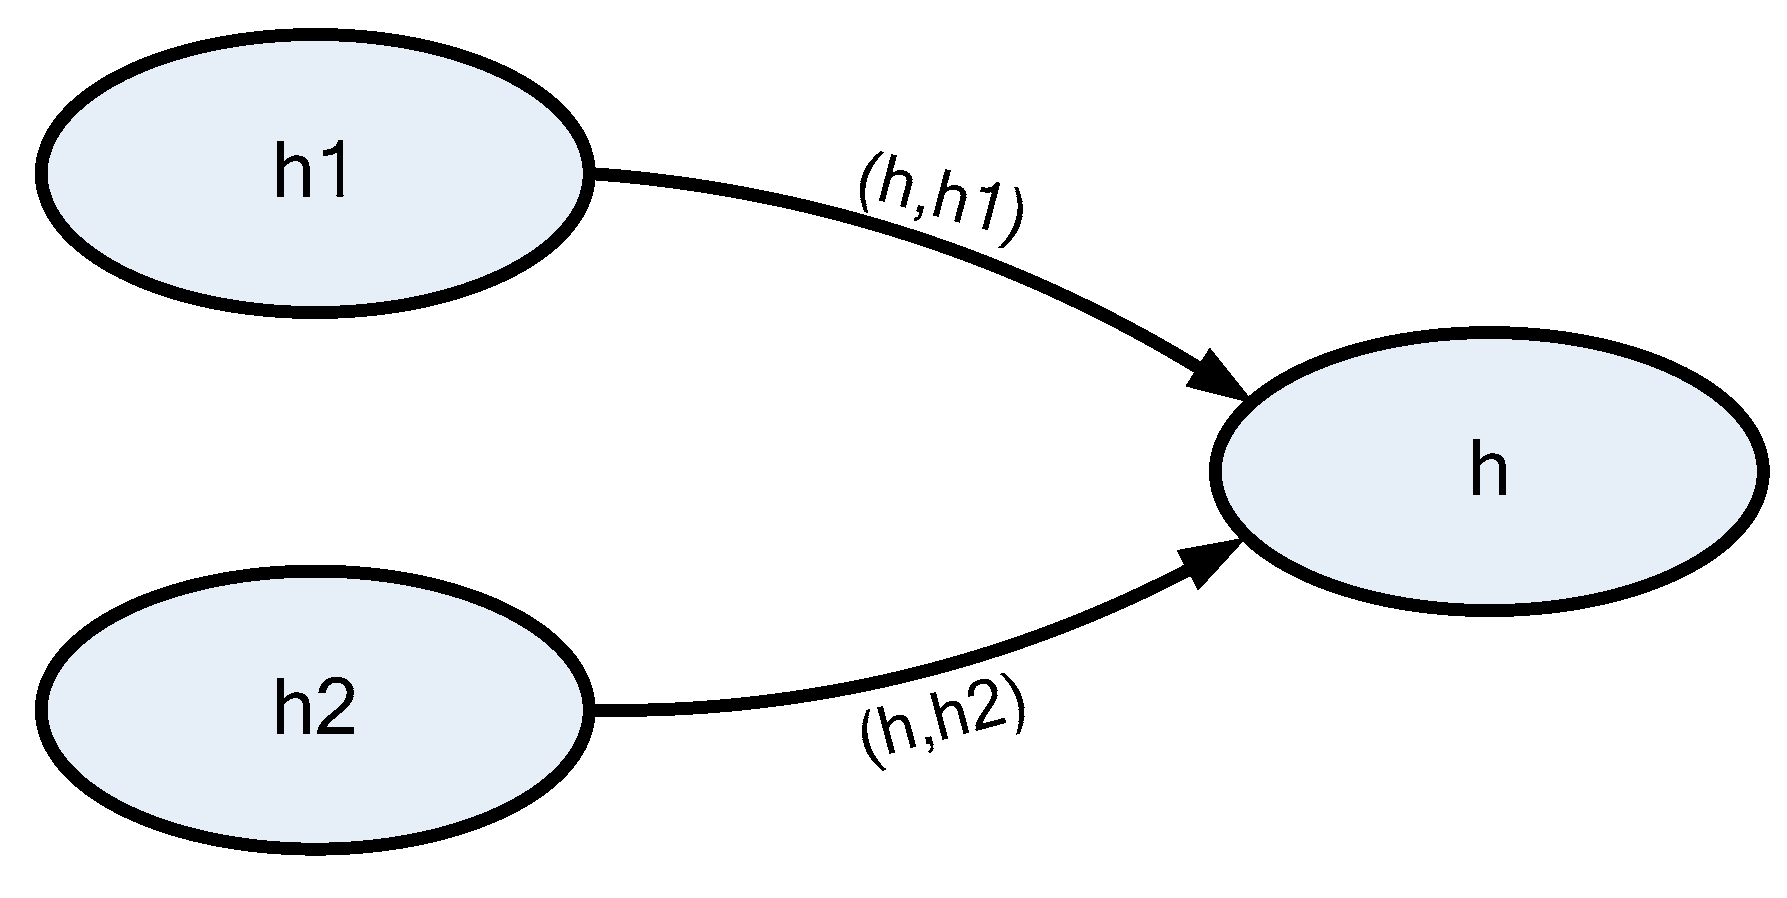
Where h = CQoPS stands for the final hypothesis, the transport power supply system in transport telematics devices works well. CQoPS is the quality assessment subjective indicator of power supply, because the target hypothesis h indicates the power supply’s existence but does not state which source is active. Hypothesis h consists of dependent intermediate hypotheses (Figure 5):
- h1—Main source of supply provides electrical power (on the basis of observation e1),
- h2—Standby source of supply provides power (on the basis of observation e2).
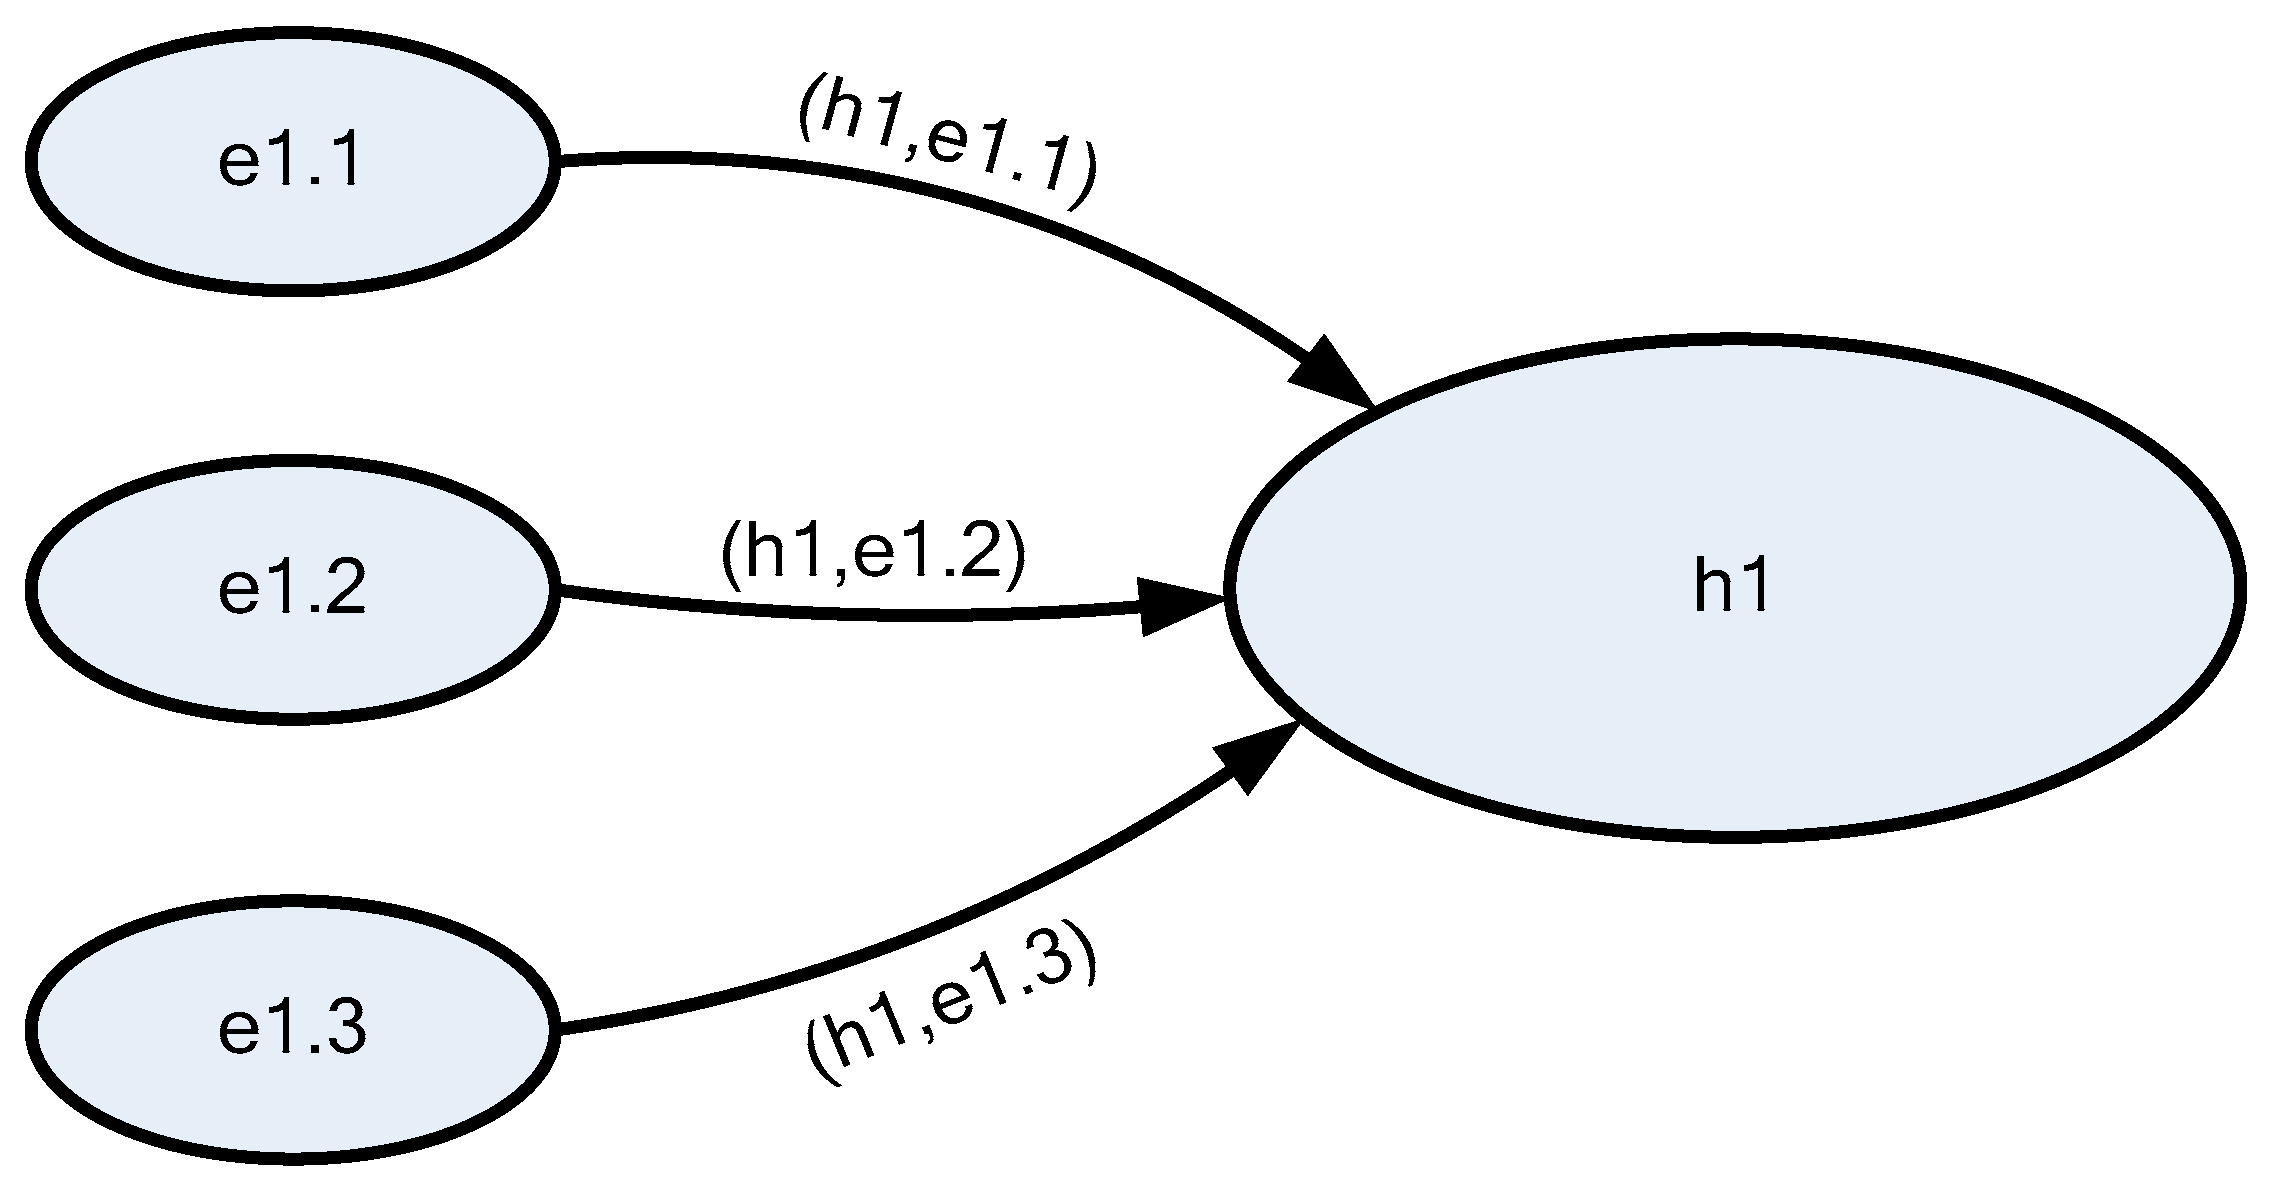
Each of the intermediate hypotheses formulated on the basis of observation results from observing factors in every particular category. The number of observations was limited to three, which is enough to describe the method.
The intermediate hypothesis h1 formulated on the basis of observation e1 consists of the following independent observations:
- e1.1—main supply system functions correctly,
- e1.2—failure of external supply system,
- e1.3—lack of external power.
The intermediate hypothesis h2 formulated on the basis of observation e2 consists of the following independent observations:
- e2.1—standby power supply system functions correctly,
- e2.2—power shortage from standby source (e.g., poorly designed supply network),
- e2.3—power shortage from standby source (e.g., poorly designed supply network).
All above-mentioned observations regard a system with a redundant power supply source.
Figure 6 demonstrates a graph of a model for intermediate hypothesis h1. Graph of the intermediate hypotheses h2 would look analogously. It is assumed that the value of the definite factor h will be the indicator of the continuity quality of power supply CQoPS.
6. Uncertainty Modeling
Methods of evaluating uncertainty can be applied to determine CQoPS. The model described in the previous section requires calculation of factors in an independent system. The method based on the theory of evaluating uncertainty using mathematical evidence DS (Dempster and Shafer theory) suits this purpose best. Modeling based on DS method is the topic of the next two sections.
Uncertainty modeling on the basis of mathematical evidence
One of the methods applied to model uncertainty based on the mathematical theory of evidence was used to determine the CQoPS value. This method enables the aggregation of independent information obtained from various sources [8,16,34,35]. The formulas presented below describe this method [34,35]:
where the following stand for:
- A, B, and C—are the sources of observation which represent the subset of Θ set,
- m1im2—sets of masses,
- m3—a new set of mass.
This synthesis is called Dempster’s rule of combination [34]. Basic belief assignment BBA is formed in the following way [34,35]:
Belief denoted in brief by Bel ∈ [0, 1] measures the strength of acquired observations supporting the belief in the authenticity of the examined set of hypotheses [34,35].
Plausibility denoted in brief by Pl ∈ [0, 1] determines how much the belief in the authenticity A is limited by supporting evidence ¬A [34,35].
This leads to an assumption that Bel value will be the value of CQoPS.
7. Applying Mathematical Evidence in Evaluating CQoPS Modeling
Modeling described in Section 5 and Section 6 was applied to evaluate CQoPS. Observation factor values for all intermediate hypotheses are specified in Table 1, Table 2, Table 3, Table 4 and Table 5. These values, except values e1.1 and e2.1, prepared by the authors [53,54] are exemplary and are used to demonstrate the potential of the presented in this article methods. Values e1.1 and e2.1 are assigned, respectively: basic power supply free from damage: and auxiliary supply free from damage: , as in the given example in Section 4.
Table 3, Table 4 and Table 5 display observation analysis to calculate Bel (e1.1) as an example for both intermediate hypotheses h1 and h2.
Θ = {e1.1,e1.2,e1.3}; m1 (Θ) = 1
Above is an example of observation analysis for one of the intermediate hypotheses, namely for the intermediate hypothesis h1. For the latter intermediate hypothesis, the analysis will be the same, yet the parameters will be taken from Table 2. Having calculated intermediate hypothesis factors, we obtain: h1 = 0.84, h2 = 0.86. Having established Bel for both intermediate hypotheses, it is possible to determine CQoPS using the same method. Because we are checking credibility of h (the PSS in TTD functions correctly), we substitute h1 and h2, respectively, with h1` = 1 − h1 = 0.16 and h2` = 1 − h2 = 0.14. The result is h` (h = 1 − h`).
Θh = {h1`, h2`}; m1 (Θh`) = 1
Having calculated factors of both intermediate hypotheses and final hypothesis we obtain:
CQoPS = h = 1 − h` = 0.8869.
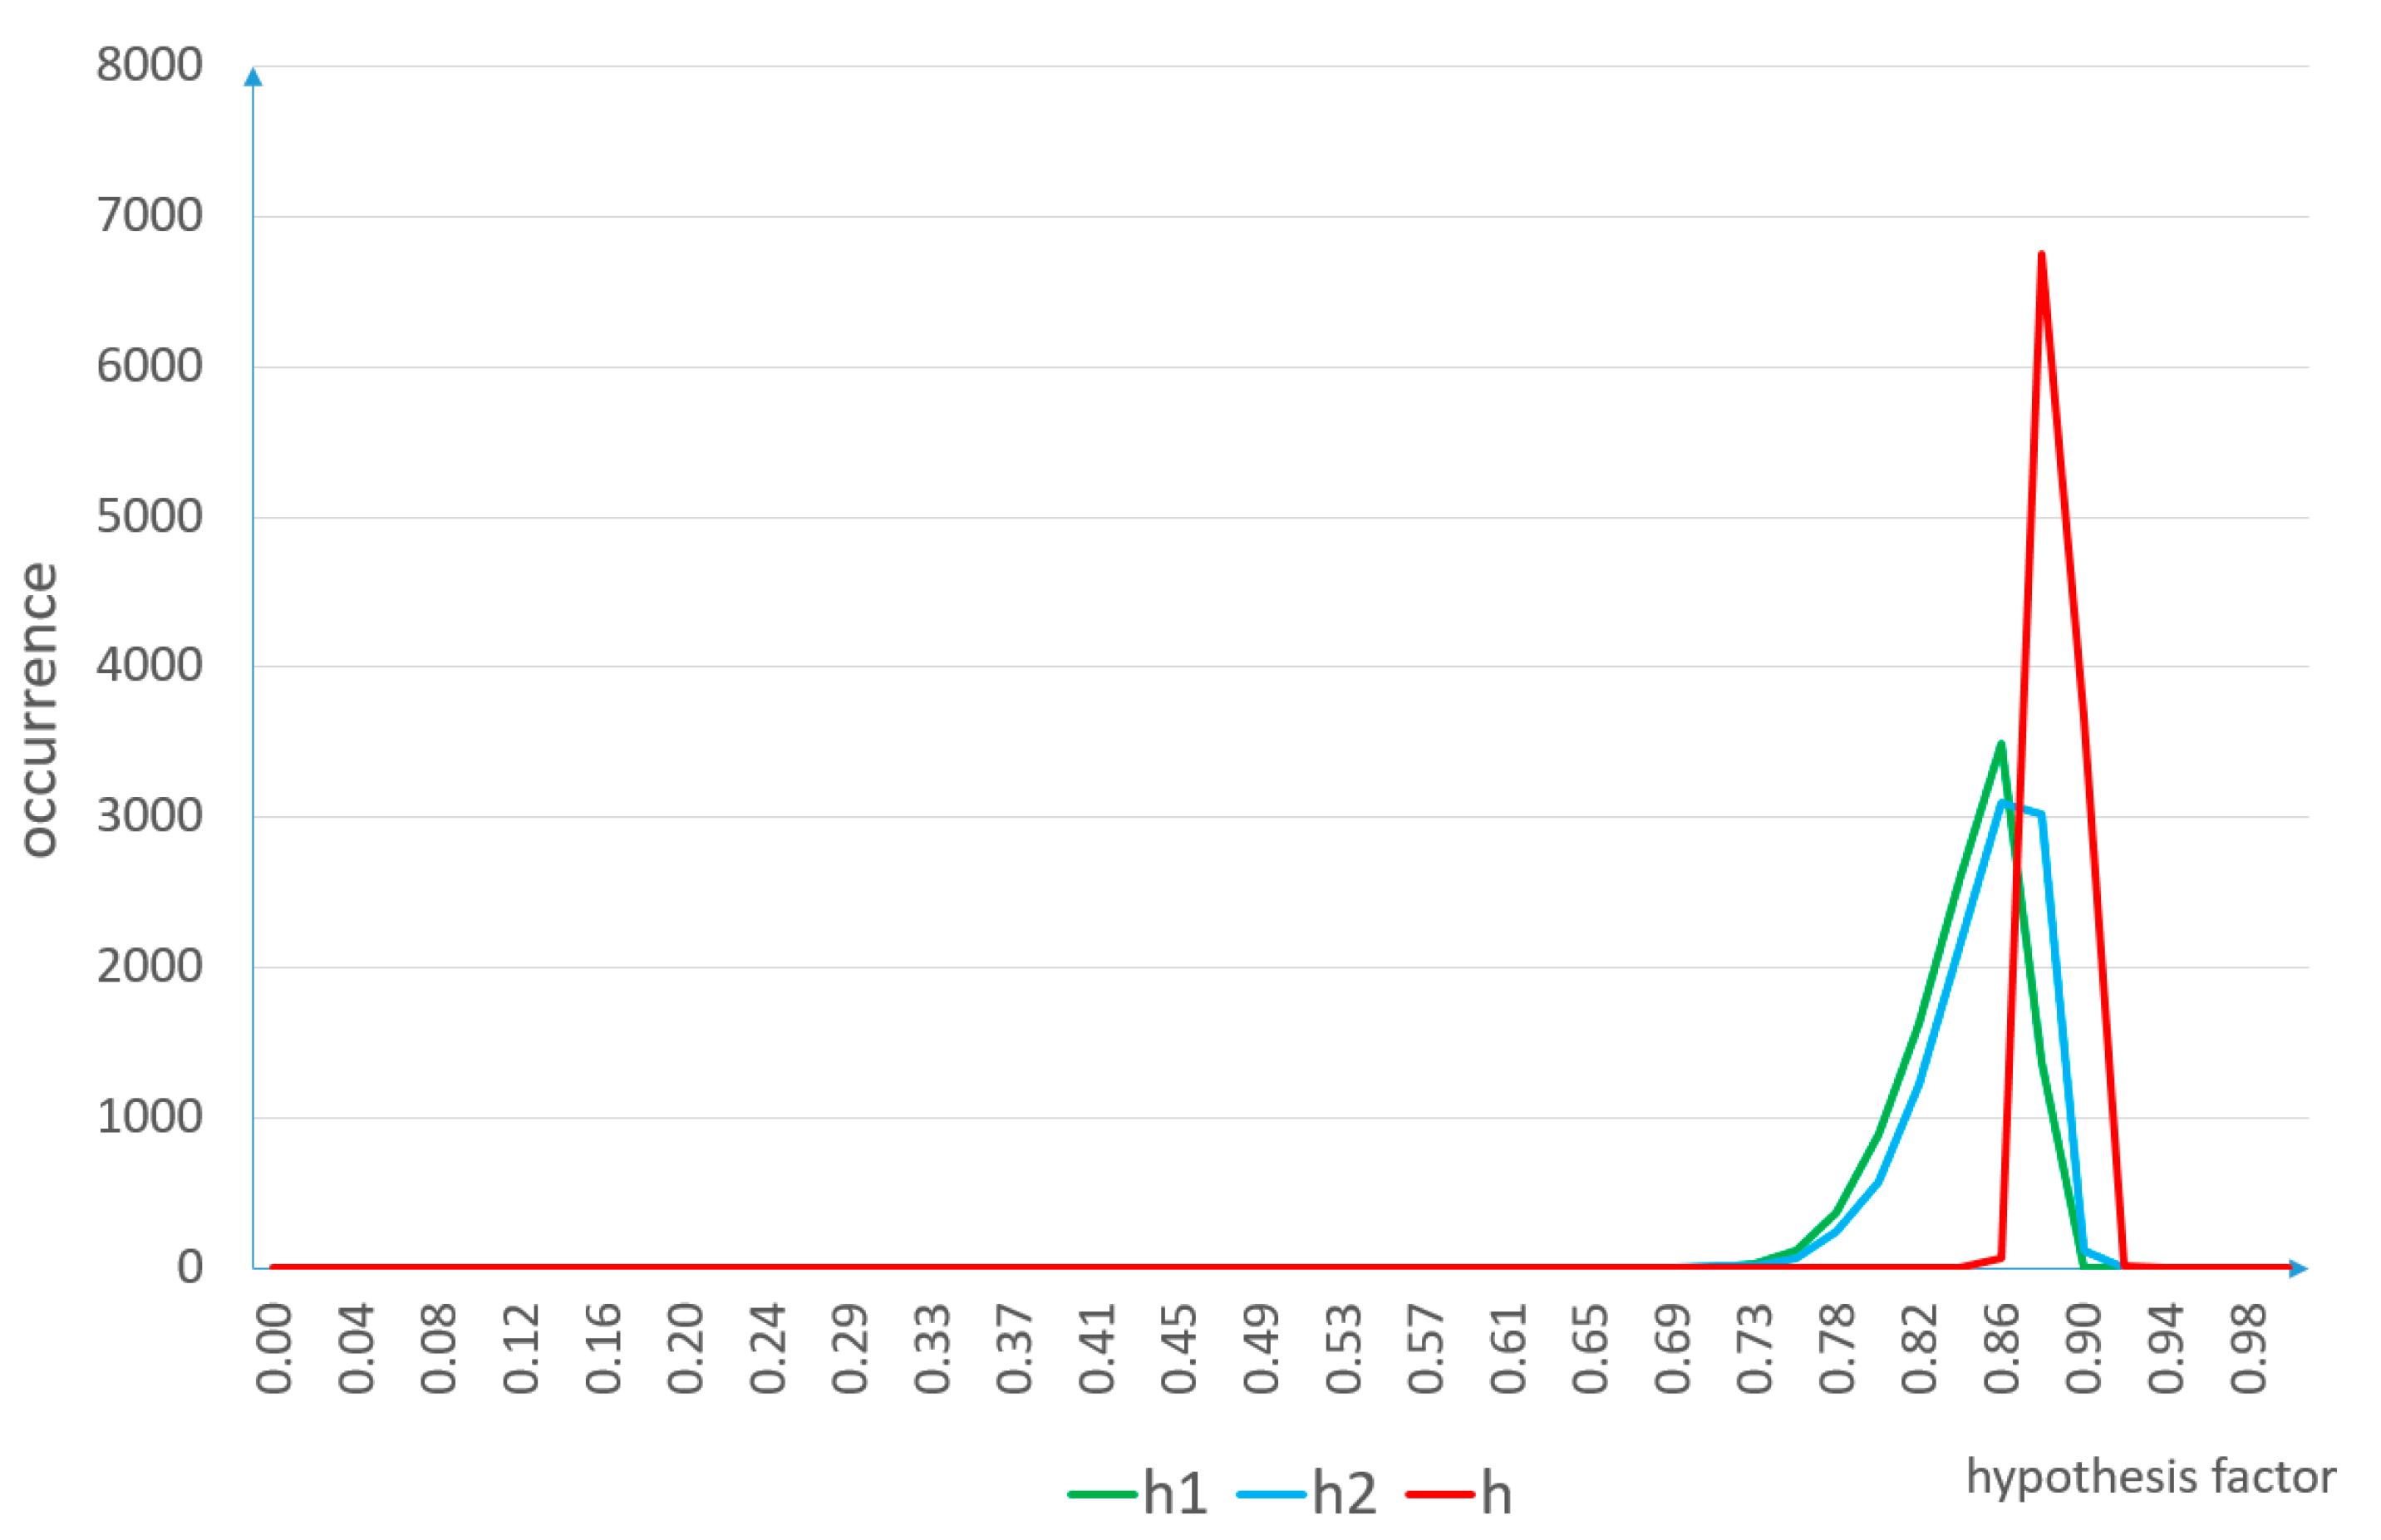
8. CQoPS Simulation and its Results
Simulation of determining h` (CQoPS = h = 1 − h`) was conducted in order to determine the dependency between initial parameters and the results. Simulation was run for the observation values from Table 1 and Table 2 as average values of normal distributions. The standard deviation was determined at 10% average value. The purpose of carrying out this simulation was to test the exchanges of the final value h = 1 − h` depending on the observation factors. Simulation software was specifically written for the sake of this article (This software was created by Marek Stawowy, one of the authors of this article. The software, under the name CFDS, enables calculations for uncertainty models applying CF method (certainty factor hypothesis) and DS (mathematical evidence).
Figure 7 illustrates the final hypothesis h and intermediate hypotheses h1 and h2. This figure shows that the final hypothesis h assumes higher values than intermediate hypotheses h1 and h2. This proves that the influence of redundancy (Figure 1) on the CQoPS coefficient has been correctly taken into account.
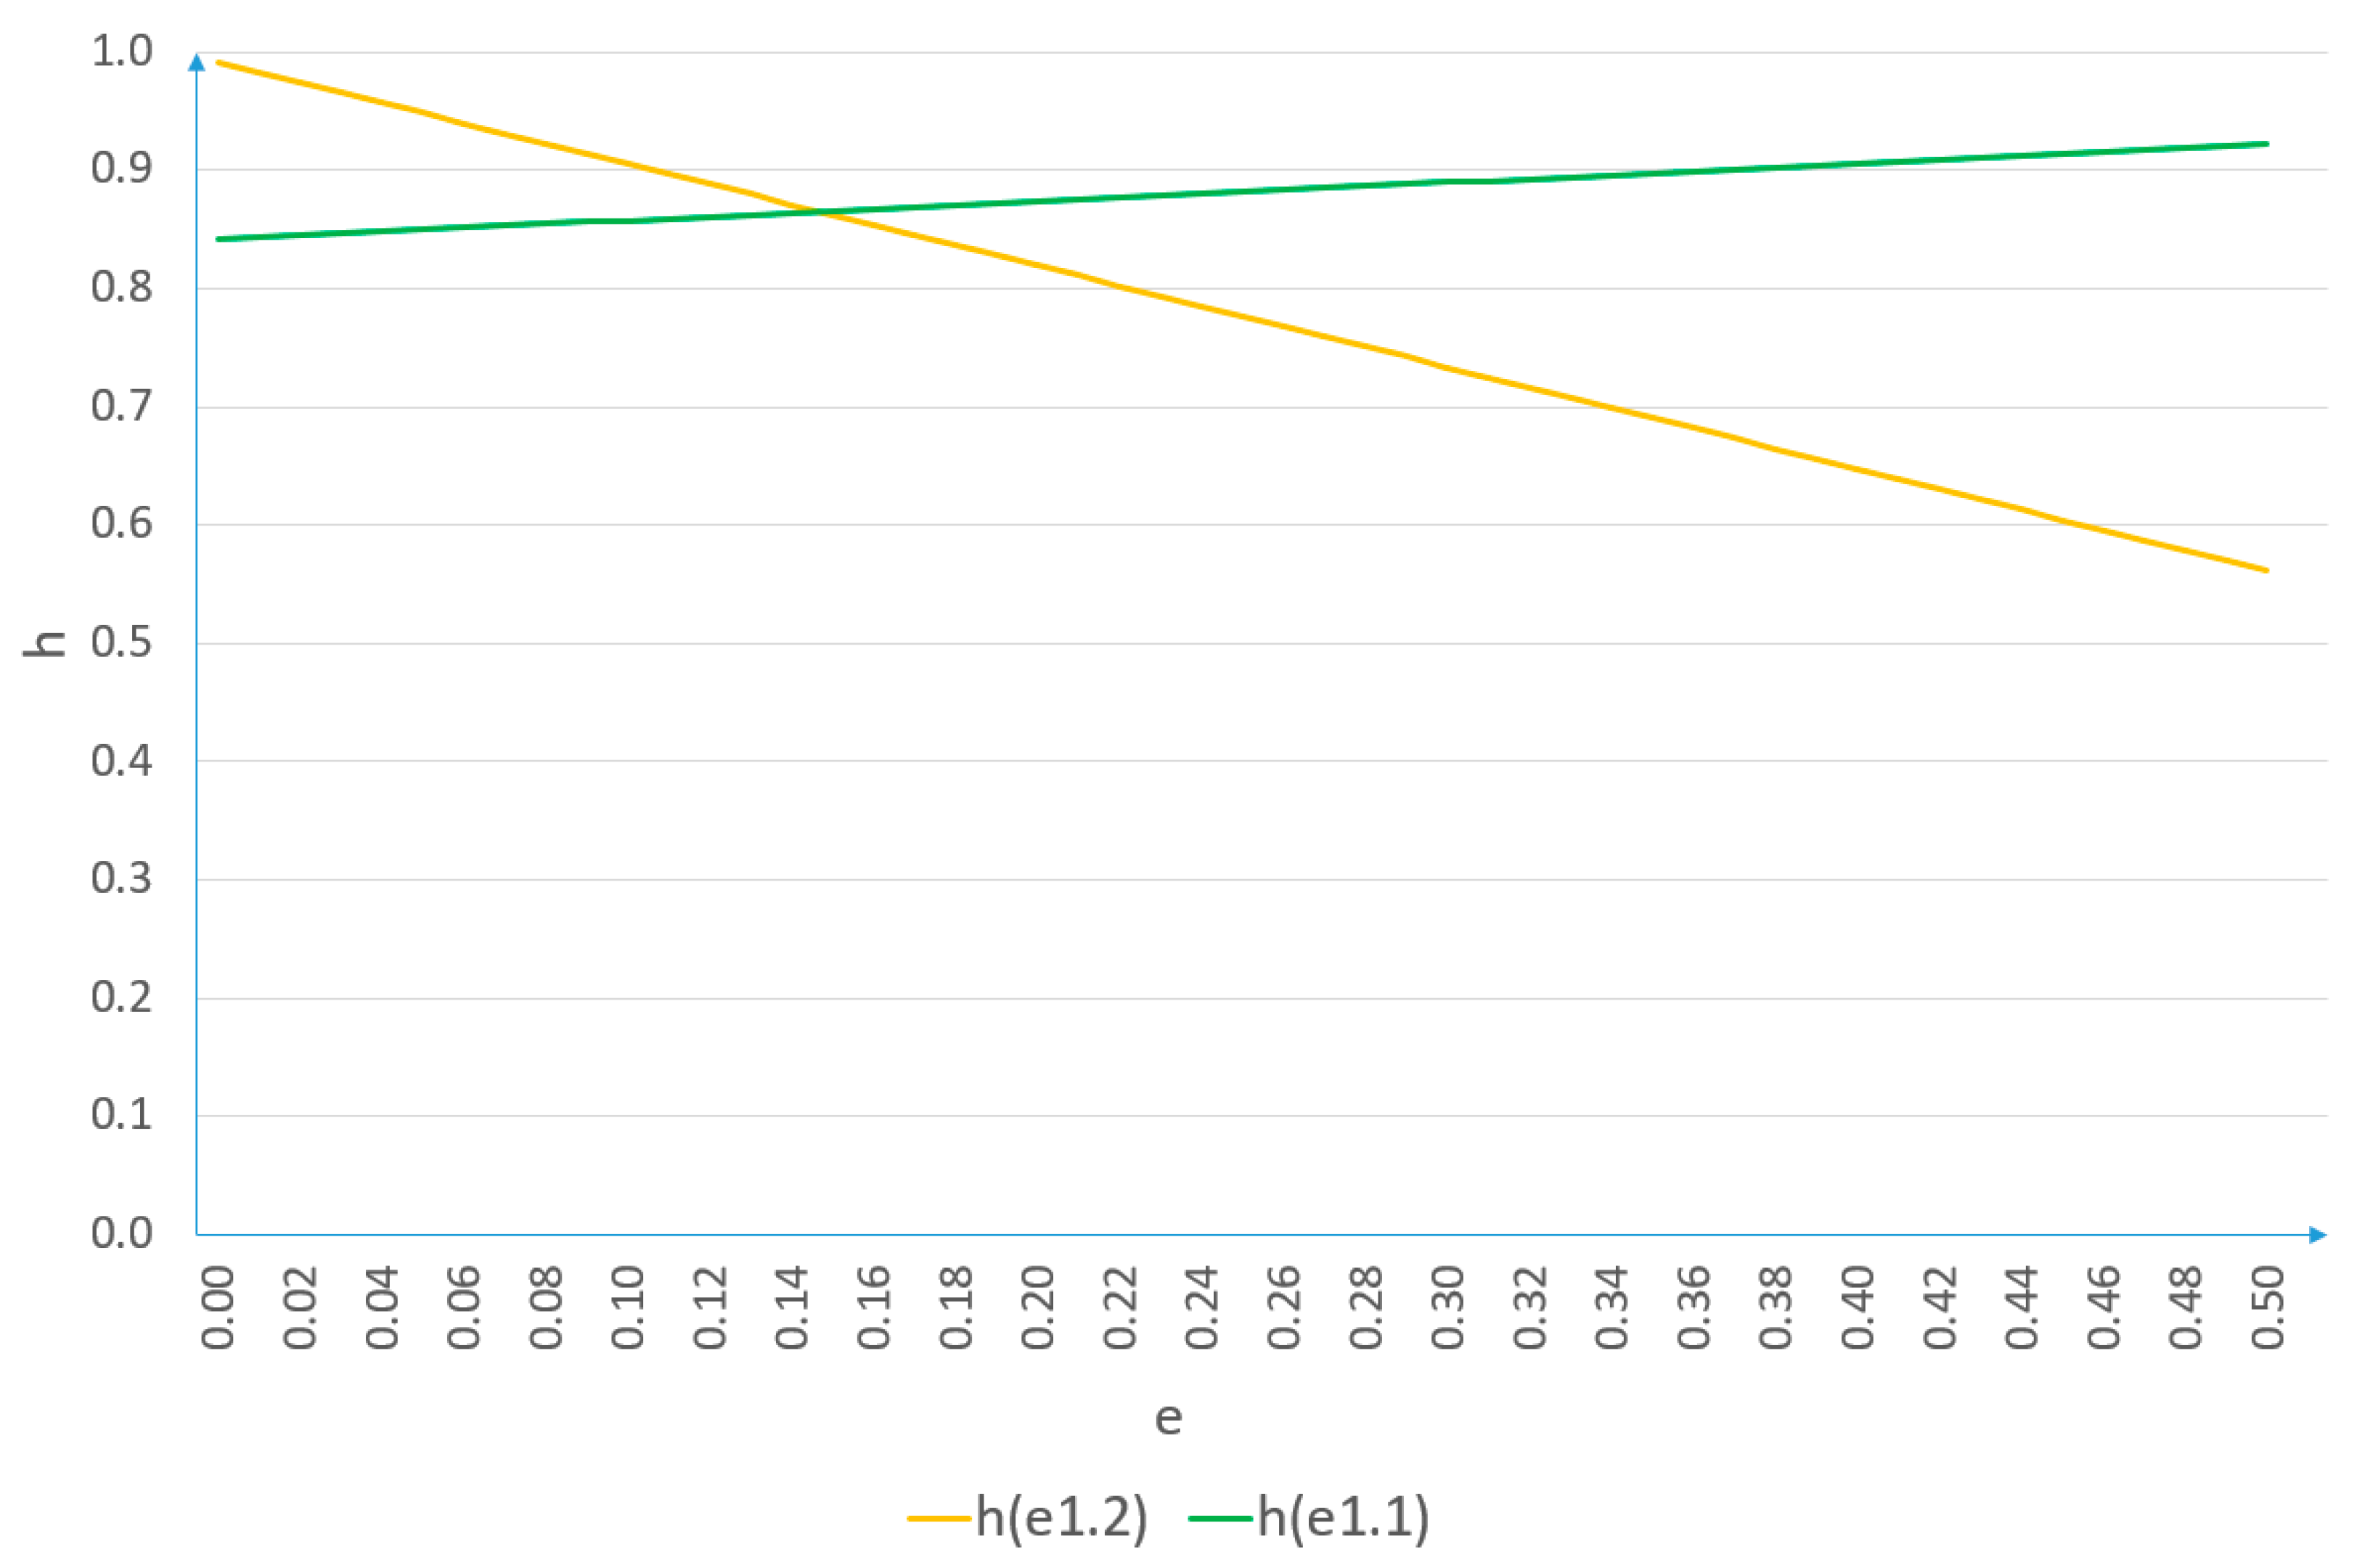
Figure 8 shows the dependencies of h hypothesis values in change of observations e1.1 and e1.2 values function. The analysis of these figures leads to an assumption that it is possible to determine the quality factor of CQoPS when adopting the presented method. The change of observation factors lead to the change of intermediate hypotheses and final hypotheses. Observation e1.1 has a positive influence on the change of the final hypothesis, whereas observation e1.2 has a negative influence on the change of the final hypothesis. These results confirm the logical correctness of the proposed method, because it is the observation of e1.1 that indicates the correct operation of the PSS, and the observation of e1.2 indicates the failure of the PSS.
9. Conclusions
In the article, the authors analyzed the reliability and exploitation of power supply systems (PPSs) that are used, among others, in transport telematics systems (TTSs). It was assumed that the PSS consists of a primary source and a backup source. When analyzing the functioning of the examined system, it was possible to describe it with the Kolmogorov–Chapman Equations. Using a specific mathematical apparatus, the dependencies determining the probability of the considered PSS staying in the assumed functional states (full ability, safety threat ability and unreliability) were defined in symbolic terms. Further considerations made it possible to determine the dependence of the probability of the PSS remaining in the full ability state RO in the time function of restoring the state tPZ1.
This article provides the determination of the indicator value of the continuity quality of power supply (CQoPS) (as in [41] with the difference that the modeling uses the mathematical evidence method and takes into account reliability as a dimension in the basic model). This indicator allows the demonstration of CQoPS dependency on many quality dimensions, not just reliability. An example demonstrates the calculation of CQoPS factor for both the main and the standby power supply, employing three observations, each influencing the quality. The same reliability factors as in the method of determining the probability dependence of PSS in TTD staying in full ability state SFA were employed. The CQoPS indicator value is lower, because when determining the quality factor, different criteria were applied, not only the reliability-exploitation ones.
The presented considerations in the field of quality and reliability-exploitation modeling of PSS can be applied as well in other public utility facilities (including those classified as critical infrastructure [58]). The character of functions performed by critical infrastructure facilities demands operating continuity of these systems on an appropriate level.
The authors plan to do further research in this field by considering the influence of the costs of restoring full ability state on the probability of the PPS staying in the given states.
Author Contributions
Conceptualization, M.S. (Marek Stawowy), A.R., M.S. (Mirosław Siergiejczyk) and K.P.; methodology, M.S. (Marek Stawowy) and A.R.; software, M.S. (Marek Stawowy); validation, M.S. (Mirosław Siergiejczyk) and K.P.; formal analysis, A.R. and M.S. (Mirosław Siergiejczyk); investigation, M.S. (Marek Stawowy) and M.S. (Mirosław Siergiejczyk); resources, M.S. (Marek Stawowy) and K.P.; data curation, M.S. (Marek Stawowy) and K.P.; writing—original draft preparation, M.S. (Marek Stawowy), A.R., M.S. (Mirosław Siergiejczyk) and K.P.; writing—review and editing, A.R. and M.S. (Mirosław Siergiejczyk); visualization, M.S. (Marek Stawowy) and K.P.; supervision, A.R. All authors have read and agreed to the published version of the manuscript.
Funding
This research received no external funding.
Institutional Review Board Statement
Not applicable.
Informed Consent Statement
Not applicable.
Data Availability Statement
The data presented in this study are available on request from the corresponding author.
Conflicts of Interest
The authors declare no conflict of interest.
References
- Heras-Molina, J.; Gomez, J.; Vassallo, J.M. Drivers’ adoption of electronic payment in the Spanish toll road network. Transportation 2019, 46, 931–955. [Google Scholar] [CrossRef]
- Jacyna, M.; Żak, J.; Gołębiowski, P. The EMITRANSYS model and the possibilities of its application for the analysis of the development of sustainable transport systems. Combust. Engines 2019, 179, 243–248. [Google Scholar] [CrossRef]
- Jin, T. Reliability Engineering and Service; John Wiley & Sons: Hoboken, NJ, USA, 2019. [Google Scholar]
- Verma, A.K.; Ajit, A.; Karanki, D.R. Reliability and Safety Engineering; Springer: London, UK, 2010. [Google Scholar]
- De Almeida, A.T.; Cavalcante, C.A.V.; Alencar, M.H.; Ferreira, R.J.P.; De Almeida-Filho, A.T.; Garcez, T.V. Multicriteria and Multiobjective Models for Risk, Reliability and Maintenance Decision Analysis; Springer International Publishing: Cham, Switzerland, 2015. [Google Scholar]
- Duffuaa, S.; Raouf, A. Planning and Control of Maintenance Systems. Modeling and Analysis; Springer International Publishing: Cham, Switzerland, 2015. [Google Scholar]
- Grabski, F. Semi-Markov Processes: Applications in System Reliability and Maintenance; Elsevier: Amsterdam, The Netherlands, 2015. [Google Scholar]
- Corsi, S. Voltage Control and Protection in Electrical Power Systems: From System Components to Wide-Area Control; Springer: New York, NY, USA, 2015. [Google Scholar]
- Sumper, A.; Baggini, A. Electrical Energy Efficiency: Technologies and Applications; John Wiley & Sons: Hoboken, NJ, USA, 2012. [Google Scholar] [CrossRef]
- Wiatr, J.; Boczkowski, A.; Orzechowski, M. Overvoltage Protection, Selecting Wires and Their Protection in Low Voltage Wiring Systems; MEDIUM Publishing House: Warsaw, Poland, 2010. [Google Scholar]
- Feng, D.; Lin, S.; He, Z.; Sun, X.; Wang, Z. Failure Risk Interval Estimation of Traction Power Supply Equipment Considering the Impact of Multiple Factors. IEEE Trans. Transp. Electrif. 2018, 4, 389–398. [Google Scholar] [CrossRef]
- Billinton, R.; Allan, R.N. Reliability Evaluation of Power Systems; Plenum Press: New York, NY, USA, 1996. [Google Scholar]
- Sozański, J. Reliability and Operating Quality of Electric Power System; WNT: Warsaw, Poland, 1990. [Google Scholar]
- Baggini, A. (Ed.) Handbook of Power Quality; John Wiley & Sons: Hoboken, NJ, USA, 2008. [Google Scholar]
- Borlase, S. (Ed.) Smart Grids: Infrastructure, Technology, and Solutions; Taylor & Francis Group: Abingdon, UK, 2012. [Google Scholar]
- Buchholz, B.M.; Styczynski, Z. Smart Grids—Fundamentals and Technologies in Electricity Networks; Springer: Berlin/Heidelberg, Germany, 2014. [Google Scholar]
- Keyhani, A.; Marwali, M. Smart Power Grids; Springer: Berlin/Heidelberg, Germany, 2011. [Google Scholar]
- Lobov, B.N.; Kolpakhch’yan, P.G.; Belokopytov, S.A.; Madzhid, A.D.R.A. A choice of the structure of the photovoltaic system for power supply. Russ. Electr. Eng. 2015, 86, 398–402. [Google Scholar] [CrossRef]
- Mahmoud, M.S.; AL-Sunni, F.M. Control and Optimization of Distributed Generation Systems; Springer International Publishing: Cham, Switzerland, 2015. [Google Scholar]
- Wiatr, J. Generating Sets in Building Emergency Power Systems; MEDIUM Publishing House: Warsaw, Poland, 2009. [Google Scholar]
- Wang, L. (Ed.) Modeling and Control. of Sustainable Power Systems; Springer: London, UK, 2012. [Google Scholar]
- Dattatraya Shinde, K.; Mane, P.B. Augmenting rooftop solar energy penetration ratio with secondary distribution network using smart inverter for maximum power transfer capacity for subordinate grid—A review. Energy Sources Part A 2019, 41, 713–733. [Google Scholar] [CrossRef]
- Miler, R.K.; Kisielewski, M.J.; Brzozowska, A.; Kalinichenko, A. Efficiency of Telematics Systems in Management of Operational Activities in Road Transport Enterprises. Energies 2020, 13, 4906. [Google Scholar] [CrossRef]
- Nagaraja, Y.; Vijaya Kumar, M.; Deva Raju, T. Analysis and design of a robust controller for a grid-connected photovoltaic power plant. Int. J. Ambient Energy 2018, 1–8. [Google Scholar] [CrossRef]
- Jahid, A.; Monju, K.H.; Hossain, S.; Hossain, F. Hybrid power supply solutions for off-grid green wireless networks. Int. J. Green Energy 2019, 16, 12–33. [Google Scholar] [CrossRef]
- Werbińska-Wojciechowska, S. Technical System Maintenance. Delay-Time-Based Modeling; Springer International Publishing: Cham, Switzerland, 2019. [Google Scholar]
- Klimczak, T.; Paś, J. Basics of Exploitation of Fire Alarm Systems in Transport Facilities; Military University of Technology: Warsaw, Poland, 2020. [Google Scholar]
- Paś, J.; Rosiński, A.; Chrzan, M.; Białek, K. Reliability-Operational Analysis of the LED Lighting Module Including Electromagnetic Interference. IEEE Trans. Electromagn C 2020, 62, 2747–2758. [Google Scholar] [CrossRef]
- Siergiejczyk, M.; Paś, J.; Dudek, E. Reliability analysis of aerodrome’s electronic security systems taking into account electromagnetic interferences. In Risk, Reliability and Safety: Innovating Theory and Practice: Proceedings of ESREL 2016; Walls, L., Revie, M., Bedford, T., Eds.; CRC Press/Balkema: London, UK, 2017; pp. 2285–2292. [Google Scholar]
- Duer, S. Artificial neural network in the control process of object’s states basis for organization of a servicing system of a technical objects. Neural Comput. Appl. 2012, 21, 153–160. [Google Scholar] [CrossRef]
- Duer, S.; Zajkowski, K. Taking decisions in the expert intelligent system to support maintenance of a technical object on the basis information from an artificial neural network. Neural Comput. Appl. 2013, 23, 2185–2197. [Google Scholar] [CrossRef]
- Stawowy, M. Comparison of uncertainty models of impact of teleinformation devices reliability on information quality. In Safety and Reliability: Methodology and Applications—Proceedings of the European Safety and Reliability Conference ESREL 2014; Nowakowski, T., Młyńczak, M., Jodejko-Pietruczuk, A., Werbińska–Wojciechowska, S., Eds.; CRC Press/Balkema: London, UK, 2015; pp. 2329–2333. [Google Scholar]
- Stawowy, M. Model for information quality determination of teleinformation systems of transport. In Safety and Reliability: Methodology and Applications-Proceedings of the European Safety and Reliability Conference ESREL 2014; Nowakowski, T., Młyńczak, M., Jodejko-Pietruczuk, A., Werbińska–Wojciechowska, S., Eds.; CRC Press/Balkema: London, UK, 2015; pp. 1909–1914. [Google Scholar]
- Dempster, A.P. Upper and lower probabilities inducted by a multi-valued mapping. Ann. Math. Stat. 1967, 38, 325–339. [Google Scholar] [CrossRef]
- Shafer, G. A Mathematical Theory of Evidence; Princeton University Press: Princeton, NJ, USA, 1976. [Google Scholar]
- Siergiejczyk, M.; Stawowy, M. Modelling of uncertainty for continuity quality of power supply. In Proceedings of the Risk, Reliability and Safety: Innovating Theory and Practice; Walls, L., Revie, M., Bedford, T., Eds.; CRC Press/Balkema: London, UK, 2017; pp. 667–671. [Google Scholar]
- International Organization for Standardization. Quality Management Systems—Requirements; ISO/IEC 9001:2015; ISO: Geneva, Switzerland, 2015. [Google Scholar]
- International Organization for Standardization. Data Quality—Part 8: Information and Data Quality: Concepts and Measuring; ISO/IEC 8000-8:2015; ISO: Geneva, Switzerland, 2015. [Google Scholar]
- International Organization for Standardization. Quality Management Systems—Fundamentals and Vocabulary; ISO/IEC 9000:2015; ISO: Geneva, Switzerland, 2015. [Google Scholar]
- Fisher, C.; Lauria, E.; Chengalur-Smith, S.; Wang, R. Introduction to Information Quality; Authorhouse: Bloomington, IN, USA, 2011. [Google Scholar]
- Stawowy, M.; Rosiński, A.; Paś, J.; Klimczak, T. Method of Estimating Uncertainty as a Way to Evaluate Continuity Quality of Power Supply in Hospital Devices. Energies 2021, 14, 486. [Google Scholar] [CrossRef]
- Kuznetsov, V.; Lyubarskyi, B.; Kardas-Cinal, E.; Yeritsyan, B.; Riabov, I.; Rubanik, I. Recommendations for the selection of parameters for shunting locomotives. Arch. Transp. 2020, 56, 119–133. [Google Scholar] [CrossRef]
- Szmel, D.; Zabłocki, W.; Ilczuk, P.; Kochan, A. Selected issues of risk assessment in relation to railway signalling systems. WUT J. Transp. Eng. 2019, 127, 81–91. [Google Scholar] [CrossRef]
- Suproniuk, M.; Paś, J. Analysis of electrical energy consumption in a public utility buildings. Przegląd Elektrotechniczny 2019, 95, 97–100. [Google Scholar] [CrossRef]
- Zhang, D.; Wang, L.Y.; Jiang, J.; Zhang, W. Load Prediction and Distributed Optimal Control of On-Board Battery Systems for Dual-Source Trolleybuses. IEEE Trans. Transp. Electrif. 2017, 3, 284–296. [Google Scholar] [CrossRef]
- Paś, J.; Buchla, S. Exploitation of electronic devices—Selected issues. J. KONBiN 2019, 49, 125–142. [Google Scholar] [CrossRef] [Green Version]
- Jacyna, M.; Szczepański, E.; Izdebski, M.; Jasiński, S.; Maciejewski, M. Characteristics of event recorders in Automatic Train Control systems. Arch. Transp. 2018, 46, 61–70. [Google Scholar] [CrossRef]
- Suproniuk, M.; Paś, J. Analysis of electrical energy consumption on the example of a selected building. Biuletyn WAT 2019, LXVIII, 165–174. [Google Scholar] [CrossRef]
- Nakagawa, T.; Zhao, X. Maintenance Overtime Policies in Reliability Theory. Models with Random Working Cycles; Springer International Publishing: Cham, Switzerland, 2015. [Google Scholar]
- Stawowy, M. Method of Multilayer Modeling of Uncertainty in Estimating the Information Quality of ICT Systems in Transport; Publishing House Warsaw University of Technology: Warsaw, Poland, 2019. [Google Scholar]
- Massachusetts Institute of Technology Information Quality (MITIQ) Program. Available online: http://mitiq.mit.edu (accessed on 2 May 2020).
- Geng, H.; Loeffler, C.; Spears, E. Uninterruptible power supply system. In Data Center Handbook; Geng, H., Ed.; John Wiley & Sons: Hoboken, NJ, USA, 2015; pp. 495–521. [Google Scholar]
- Wiatr, J.; Miegoń, M. UPS Power Supplies and Accumulator Batteries in Emergency Power Systems; MEDIUM Publishing House: Warsaw, Poland, 2008. [Google Scholar]
- Stawowy, M.; Olchowik, W.; Rosiński, A.; Dąbrowski, T. The Analysis and Modelling of the Quality of Information Acquired from Weather Station Sensors. Remote Sens. 2021, 13, 693. [Google Scholar] [CrossRef]
- Addabbo, T.; Fort, A.; Mugnaini, M.; Vignoli, V.; Simoni, E.; Mancini, M. Availability and reliability modeling of multicore controlled UPS for data center applications. Reliab. Eng. Syst. Saf. 2016, 149, 56–62. [Google Scholar] [CrossRef]
- Polak, R.; Laskowski, D.; Matyszkiel, R.; Łubkowski, P.; Konieczny, Ł.; Burdzik, R. Optimizing the Data Flow in a Network Communication between Railway Nodes. In Research Methods and Solutions to Current Transport Problems; Siergiejczyk, M., Krzykowska, K., Eds.; Springer: Cham, Switzerland, 2020; pp. 351–362. [Google Scholar]
- Stawowy, M.; Perlicki, K.; Sumiła, M. Comparison of uncertainty multilevel models to ensure ITS Services. Safety Reliab. Theory Appl. 2017, 382, 2647–2652. [Google Scholar] [CrossRef]
- Johansson, J.; Hassel, H.; Zio, E. Reliability and vulnerability analyses of critical infrastructures: Comparing two approaches in the context of power systems. Reliab. Eng. Syst. Saf. 2013, 120, 27–38. [Google Scholar] [CrossRef]
Figure 1.
An example of a PSS in TTD from a main source and a redundant one.

Figure 2.
Relations in a PSS in TTD.

Figure 3.
The probability dependence of PSS in TTD staying in full ability state SFA in the time function of restoring full ability state tFA1.
Figure 3.
The probability dependence of PSS in TTD staying in full ability state SFA in the time function of restoring full ability state tFA1.

Figure 4.
CQoPS components (own elaboration on the basis of [41]).
Figure 4.
CQoPS components (own elaboration on the basis of [41]).

Figure 5.
Model for hypothesis h.

Figure 6.
Model for intermediate hypothesis h1.

Figure 7.
Simulation results of hypothesis h and intermediate hypotheses h1 and h2 (operation result of the software written by one of the authors of the article).
Figure 7.
Simulation results of hypothesis h and intermediate hypotheses h1 and h2 (operation result of the software written by one of the authors of the article).

Figure 8.
The result of final hypothesis simulation in observation function (operation result of the software written by one of the authors of the article).
Figure 8.
The result of final hypothesis simulation in observation function (operation result of the software written by one of the authors of the article).


Table 1.
Assignment of particular values for observing h1 (prepared by the authors).
| Observation | Value |
|---|---|
| e1.1 | 0.999 |
| e1.2 | 0.1 |
| e1.3 | 0.02 |
Table 2.
Assignment of particular values for observing h2 (prepared by the authors).
| Observation | Value |
|---|---|
| e2.1 | 0.9999 |
| e2.2 | 0.08 |
| e2.3 | 0.03 |
Table 3.
Observation e1.1.
| m2 ({e1.1}) = 0.999 m2 (Θ) = 0.001 | m2 ({e1.1}) | m2 (Θ) |
|---|---|---|
| m1 (Θ) | m3 ({e1.1}) | m3 (Θ) |
Table 4.
Observation e1.2.
| m4 ({e1.2}) = 0.1 m4 (Θ) = 0.9 | m4 ({e1.2}) | m4 (Θ) |
|---|---|---|
| m3 ({e1.1}) | m5 ({Ø}) | m5 ({e1.1}) |
| m3 (Θ) | m5 ({e1.2}) | m5 (Θ) |
Table 5.
Observation e1.3.
| m6 ({e1.3}) = 0.02 m6 (Θ) = 0.98 | m6 ({e1.3}) | m6 (Θ) |
|---|---|---|
| m5 ({Ø}) | m7 ({Ø}) | m7 ({Ø}) |
| m5 ({e1.2}) | m7 ({e1.2}) | m7 ({e1.2}) |
| m5 ({e1.1}) | m7 ({Ø}) | m7 ({e1.1}) |
| m5 (Θ) | m7 ({e1.3}) | m7 (Θ) |
Table 6.
Intermediate hypothesis h1`.
| m2 ({h1`}) = 0.16 m2 (Θh`) = 0.84 | m2 ({h1`}) | m2 (Θh`) |
|---|---|---|
| m1 (Θh`) | m3 ({h1`}) | m3 (Θh`) |
Table 7.
Intermediate hypothesis h2`.
| m4 ({h2`}) = 0.14 m4 (Θh`) = 0.86 | m4 ({h2`}) | m4 (Θh`) |
|---|---|---|
| m3 ({h1`}) | m5 ({Øh`}) | m5 ({h1`}) |
| m3 (Θh`) | m5 ({h2`}) | m5 (Θh`) |
Publisher’s Note: MDPI stays neutral with regard to jurisdictional claims in published maps and institutional affiliations. |
© 2021 by the authors. Licensee MDPI, Basel, Switzerland. This article is an open access article distributed under the terms and conditions of the Creative Commons Attribution (CC BY) license (https://creativecommons.org/licenses/by/4.0/).
Share and Cite
MDPI and ACS Style
Stawowy, M.; Rosiński, A.; Siergiejczyk, M.; Perlicki, K. Quality and Reliability-Exploitation Modeling of Power Supply Systems. Energies 2021, 14, 2727. https://doi.org/10.3390/en14092727
AMA Style
Stawowy M, Rosiński A, Siergiejczyk M, Perlicki K. Quality and Reliability-Exploitation Modeling of Power Supply Systems. Energies. 2021; 14(9):2727. https://doi.org/10.3390/en14092727
Chicago/Turabian StyleStawowy, Marek, Adam Rosiński, Mirosław Siergiejczyk, and Krzysztof Perlicki. 2021. "Quality and Reliability-Exploitation Modeling of Power Supply Systems" Energies 14, no. 9: 2727. https://doi.org/10.3390/en14092727
Note that from the first issue of 2016, this journal uses article numbers instead of page numbers. See further details here.