Article

The Security of Energy Supply from Internal Combustion Engines Using Coal Mine Methane—Forecasting of the Electrical Energy Generation

Faculty of Mining and Geoengineering, AGH University of Science and Technology, 30-059 Kraków, Poland
*
Author to whom correspondence should be addressed.
Energies 2021, 14(11), 3049; https://doi.org/10.3390/en14113049
Submission received: 31 March 2021 / Revised: 5 May 2021 / Accepted: 13 May 2021 / Published: 24 May 2021
(This article belongs to the Special Issue Recent Advances in Internal Combustion Engines)

Abstract

:
Increasing emissions from mining areas and a high global warming potential of methane have caused gas management to become a vital challenge. At the same time, it provides the opportunity to obtain economic benefits. In addition, the use of combined heat and power (CHP) in the case of coalbed methane combustion enables much more efficient use of this fuel. The article analyses the possibility of electricity production using gas engines fueled with methane captured from the Budryk coal mine in Poland. The basic issue concerning the energy production from coalbed methane is the continuity of supply, which is to ensure the required amount and concentration of the gas mixture for combustion. Hence, the reliability of supply for electricity production is of key importance. The analysis included the basic characterization of both the daily and annual methane capture by the mine’s methane drainage system, as well as the development of predictive models to determine electricity production based on hourly capture and time parameters. To forecast electricity production, predictive models that are based on five parameters have been adopted. Models were prepared based on three time variables, i.e., month, day, hour, and two values from the gas drainage system-capture and concentration of the methane. For this purpose, artificial neural networks with different properties were tested. The developed models have a high value of correlation coefficient. but showed deviations concerning the very low values persisting for a short time. The study shows that electricity production forecasting is possible, but it requires data on many variables that directly affect the production capacity of the system.

1. Introduction

Methane has been emitted into the atmosphere for centuries, but industrial development has increased the concentration of methane in the atmosphere. It is one of the most important greenhouse gases with a significant global warming potential (GWP). Methane absorbs infrared radiation to a greater extent when compared to carbon dioxide, which translates into a GWP that is up to 28 times higher over a 100-year period [1]. The high level of coalbed methane emissions, as well as increased public concern for the environment, including efforts to reduce greenhouse gases emissions, increased interest in technologies for the capture, and use of methane. In view of the significant calorific value of the gas released and its impact on the environment, systems for methane capture and use of mine gases are becoming increasingly popular.

1.1. Methane Emitted from Mines

The energy sector is considered to be the second largest source of methane emissions (the one largest is agriculture) [
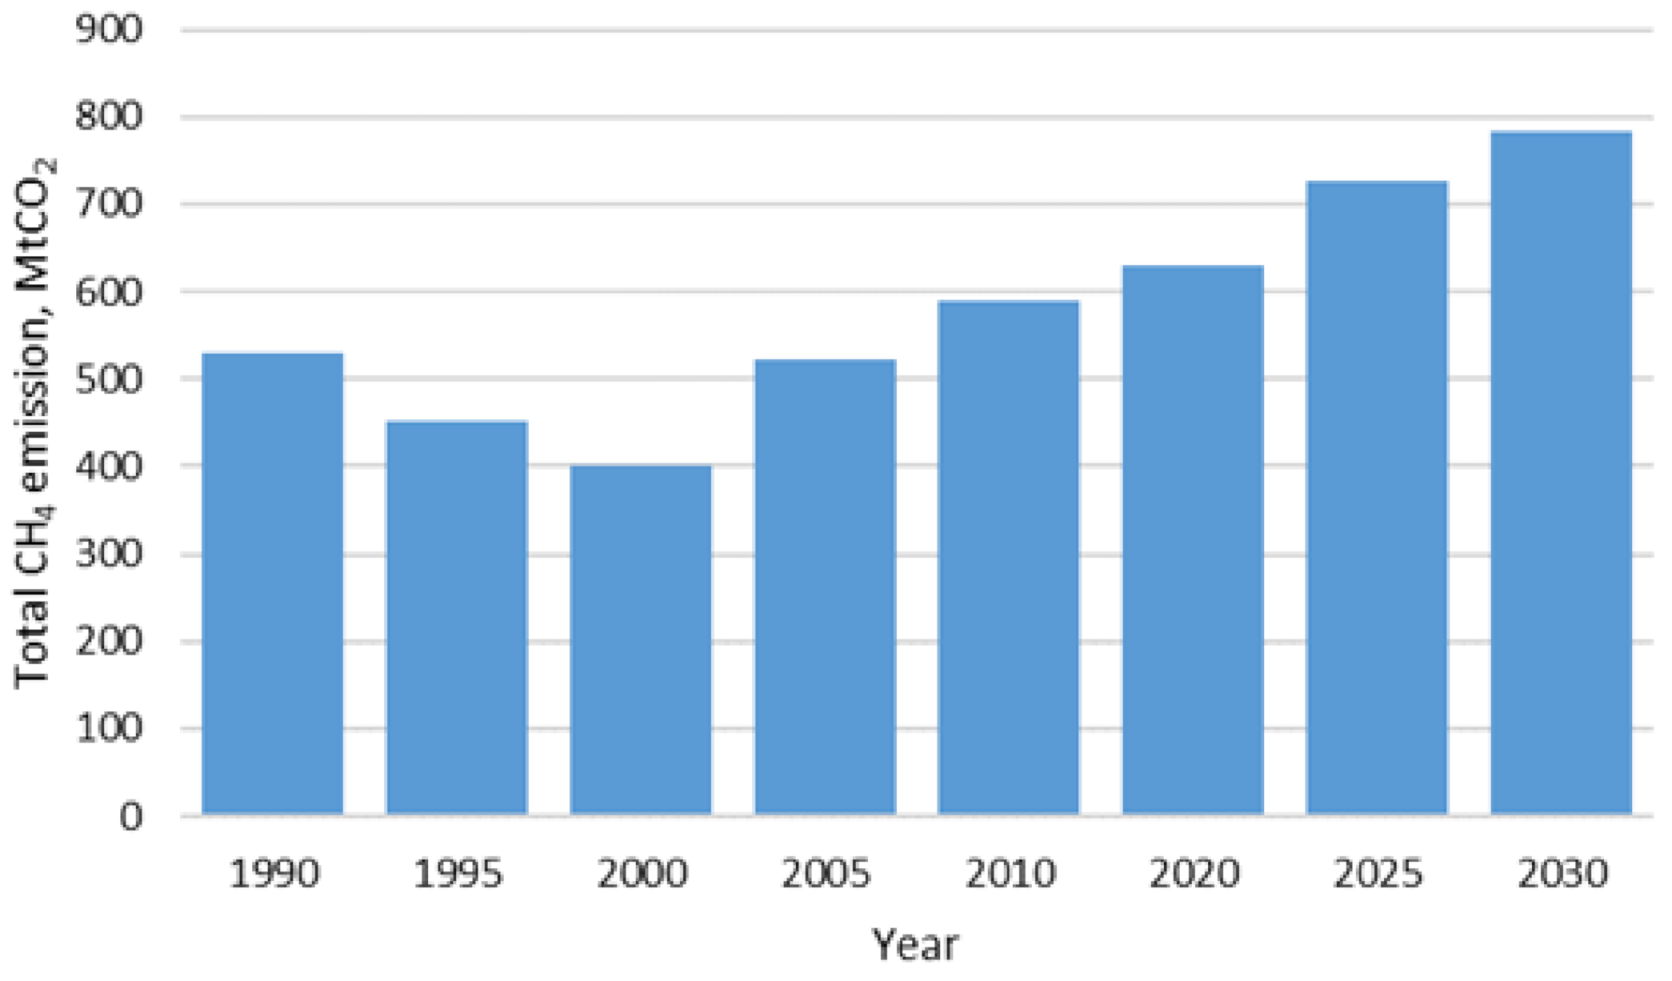
2]. Mining activity has a large share in this sector. It is estimated that, globally, methane emissions from mining activities will continue to increase (Figure 1). The increase between 2005 and 2030 may be as high as 50% [3,4]. Globally, it is estimated that the mining sector is responsible for 8% of methane emissions [5].
The figure above presents both historical results and predictions of future values of the global emission. Methane emissions from mines have declined in OECD (Organisation for Economic Cooperation and Development) countries, Europe, and Asia, due to the reduction of coal extraction and implementation of further projects limiting the environmental impact of mines. The situation is different in non-OECD Asian countries, where the level of emissions related to the activity of mines is growing dynamically. The largest increase in methane emission is expected in the non-OECD countries of Asia. Between 1990 and 2005, the value of emissions in these regions was nearly doubled. According to the EPA report [3], China is expected to account for a majority of the increase in world coal production and the consequent increase in methane emission from mining activities.
It was found that, in Poland in 2019, total methane emissions from coal seams where mining was performed amounted to 916.1 million m3, which means that, on average. 1742.9 m3 of methane was released into the atmosphere per minute. The average efficiency of methane drainage from coal seams was 34.6% and the efficiency of utilization of captured methane was 64.1% [6]. 502 million m3 of methane were captured using the methane drainage systems [7]. Because of the harmful effect of methane on the atmosphere, its emission will be increasingly limited. The European Commission has published a communication on a strategy to reduce methane emissions [8]. Legislative proposals are expected to be introduced in 2021 that will facilitate taking stronger measures to reduce methane emissions in all sectors, including energy. More precise measurement and reporting methods by companies are expected to be introduced. Greater use is to be made of satellite and airborne monitoring. Concerning Poland, the first airborne measurements of estimated methane emissions have already been carried out [9]. The European Commission indicates that, in relation to coal mines, the greatest benefits can be achieved by reducing methane emission to the atmosphere and gas flaring, and reducing the methane leaks from coal mines. Therefore, the management and efficient use of captured methane is becoming increasingly important. This mainly applies to existing mines, but also to closed mines [10], the proportion of which will increase in the coming years. The first works on capturing and utilization of methane from abandoned mines are already underway [11].

1.2. Use of Methane Emitted from Mines

Methane is a valuable fuel, and its capture and utilization can significantly increase the profitability of mining operations. The captured methane can be used directly to generate electricity or heat, which, in turn, can bring economic benefits to the mine in the form of energy sales or reduced operating costs. The capture and use of mine methane can be a fundamental part of a corporate social responsibility strategy, which is a very important advantage at a time of growing global concern regarding the impact of climate change and the sustainability of the mining industry [12]. There are several options for electricity production from coal mine methane and at present, there is no single approach that is suitable for all projects. The proper system must be determined on a case-by-case basis, as each system has its own requirements as well as advantages and disadvantages [13]. The potential use of Capture Mine Methane (CMM) in the range of 30% to 100% methane is possible using various technologies. The most common solutions are the use of methane as fuel in industrial furnaces, boilers, and burners, powering engines or turbines for electricity production, injection into gas pipelines, and use as feedstock in the fertilizer industry or as vehicle fuel. For off-site gas applications, especially for individual customers, storage tanks are sometimes built to ensure that peak demand can be met and to buffer supply in the event of a gas production outage. Because of the high costs, the area required, visual effects, and risks associated with storing large quantities of flammable gas mixtures, off-site use of methane is generally avoided, hence it is most often used directly in the mining facility. The use of discharged methane depends on the quantity and quality of the gas produced. In the past, a methane concentration of at least 30% was required. In recent years, internal combustion engines have started to appear on the market that can use mine gas with a methane concentration below 30%. The guidelines distinguish the medium/high and low concentration (<30%) methane use from drainage, as the transport of low concentration gas is extremely dangerous and should be avoided [12]. The amount of methane captured is directly influenced by the methane drainage system used, the technical solutions employed, and a drainage roadway location [14]. Work on increasing the efficiency of energy production, the use of low-methane fuel or the management of coal mine methane in new, previously unused energy systems is still in progress. For example, the use of Stirling engines that reduce the problem of instability of the fuel source is being tested [15,16]. A good method to increase the efficiency might be combining electrical systems using methane with others (e.g., mine water desalination system) [17] or combined systems with fuel cells and steam turbines [18]. In many systems, there is an issue concerning fluctuations in the concentration of methane in the fuel. This often requires the methane concentration to be adjusted for proper operation—an example is the use of mine gas in high temperature fuel cells [19]. Different combustion system solutions for changing methane concentration in the fuel are analyzed—e.g., combustion system with a swirl chamber [20] or the combined combustion of methane from ventilation air (VAM) and methane from methane drainage (CMM) [21].
Methods of the use of methane gas that is produced during mining are the subject of many works [10,12,22,23]. The most common use of methane is electricity production and the sale of methane to the gas network [1]. Solutions that have recently attracted a lot of interest are CHP) and trigeneration (CCHP) systems that are used both in industrial and commercial buildings. Cogeneration, as compared to separate electricity and heat generation, reduces primary energy consumption by 15% to 30% [24]. Cogeneration can reduce the cost of producing final energy. When discussing the benefits of cogeneration, it should be remembered that the CHP technology also contributes to the reduction of greenhouse gas emissions into the atmosphere, which, in the era of more expensive carbon dioxide emission allowances, makes its use even more attractive. An important advantage of CHP systems is their simple structure. Because of their small size and wide range of power values (from a few kilowatts to several megawatts), these systems are an excellent tool for the development of distributed energy, and the possibility of locating them close to the end user reduces grid losses. Usón et al. [6] presented an analysis of the “ecological footprint” of trigeneration systems that are powered by different types of fuel, being expressed in terms of thermo-ecological cost. The results of the study concerning the use of coal mine methane proved to be good. Although methane is a non-renewable resource, the methane capture system reduces the free gas emissions to the atmosphere, which lowers the thermo-ecological cost. As a result, this type of power supply for cogeneration systems achieves much better environmental performance than the use of natural gas. Therefore, the use of methane from mining plants provides a double environmental benefit. Such a solution brings both savings on non-renewable raw material resources, e.g., natural gas, as well as a reduction of free methane emissions from excavations. CH4 is converted to carbon dioxide during combustion of the captured methane, which has a much lower GWP index. Meybodi and Behnia [16] proposed the use of Stirling engines in CHP systems of a local coal mine in Australia. The results indicate that the use of the modelled system not only leads to a significant reduction in GHG emissions, but also to an improvement in economic efficiency. The study considered emissions of carbon dioxide, methane, and nitrous oxide expressed in CO2 equivalent. The use of three 1.5 MW engines was proposed. The results show that the inclusion of a CHP system based on a Stirling engine leads to a 65.4% reduction in annual greenhouse gas emissions. In 1998, in Lünen in the Ruhr, a CHP system was installed using methane from an abandoned mine (closed in 1990). In the installed generator set, a gas engine enables the simultaneous generation of electricity (374 kW) and heat (538 kW). The electricity generated is fed into the grid of the local energy supplier via a transformer station. Because of the satisfactory results, two years later the generator set was replaced by a unit with an electrical capacity of 941 kW [25]. Additionally, a cogeneration system was implemented at the abandoned Lothringen mine in Bochum. The system consists of cogeneration units, a compression station, medium voltage equipment, and a connection to the local district heating system. The Bochum plant uses 2000 m3/h of methane and reduces CO2-eq emissions by 200 kt per year. The energy produced, which can satisfy the needs of more than 13,000 households, is provided into the district heating system. At the beginning of 2004, the plant was connected to the Bochum district heating network [
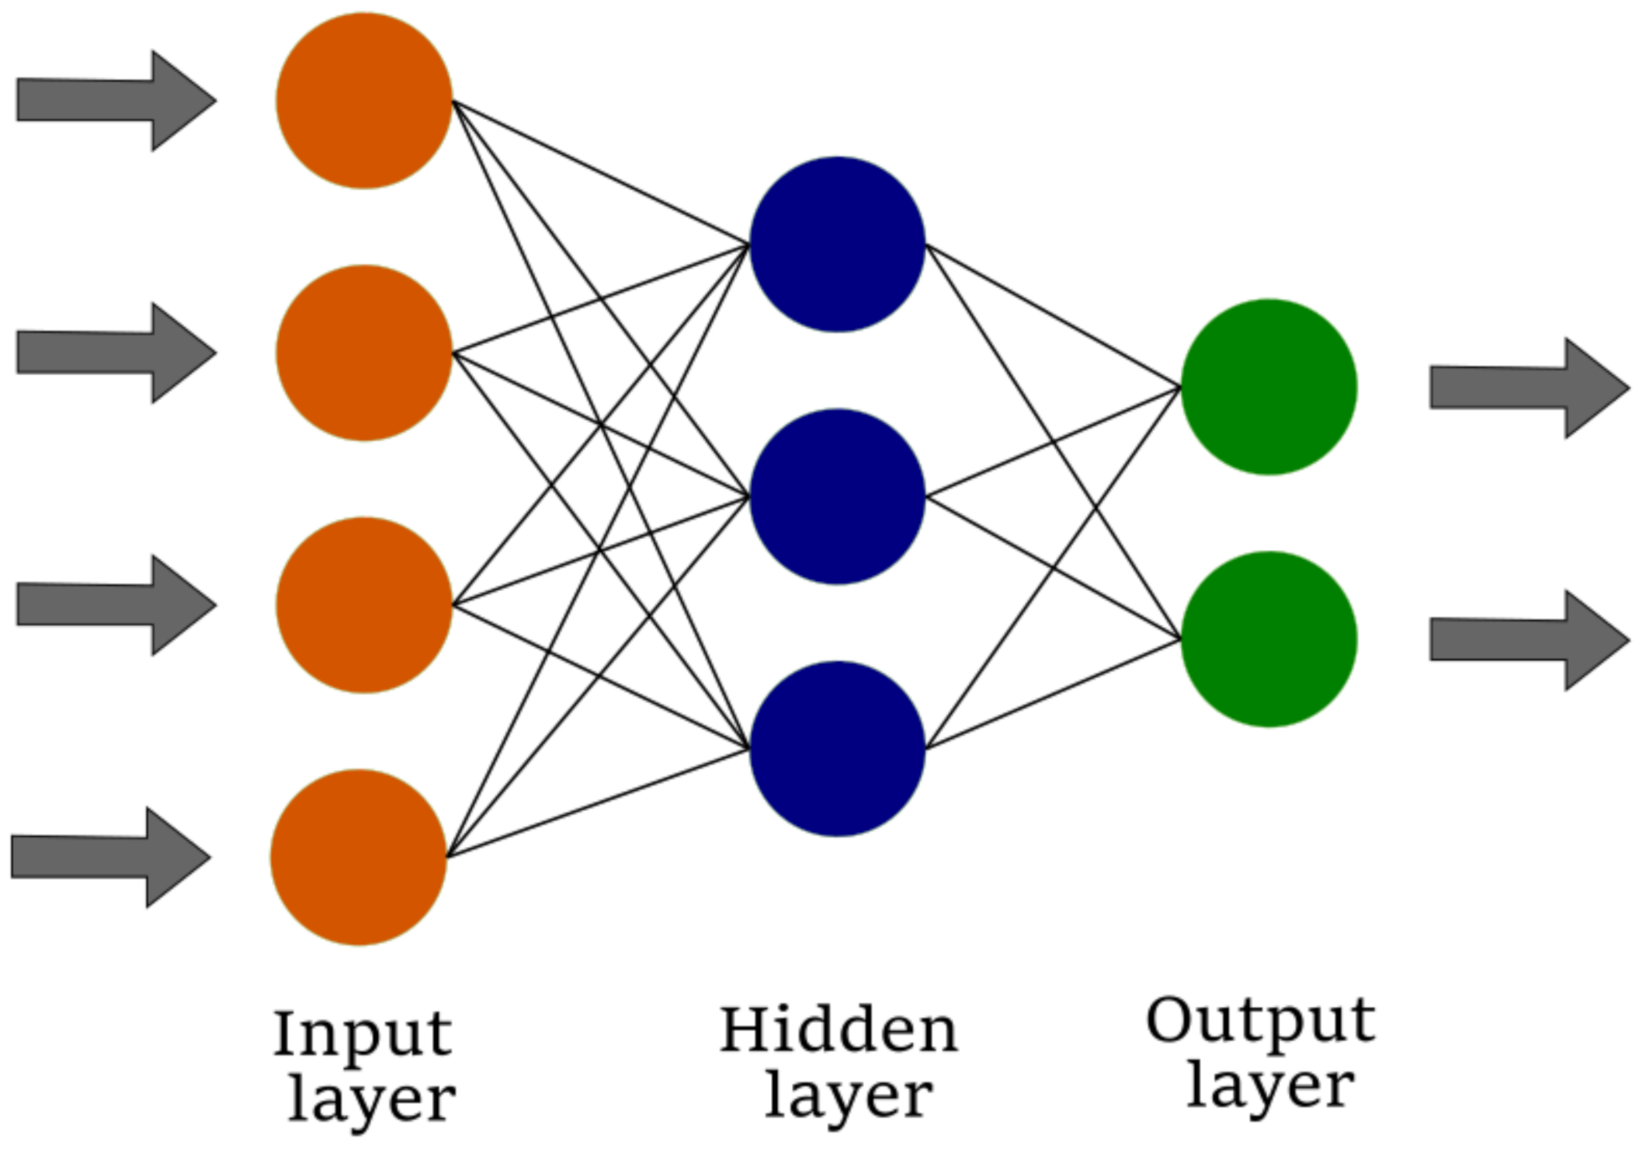
13]. Above, the authors presented a literature review on the general use of methane. Because of the total gas emissions and the impact of methane on the environment, the analyzed topic is crucial, and the development of this field is prospective. In the literature, only a few publications on the prediction of electricity generated by gas engines fueled with methane are provided. The use of ANN to model the power produced from the generator is an interesting solution. Ashraf et al. [26] proposed an ANN model to construct a generator power curve for a coal power plant based on twenty-four operating parameters. Similar forecasting methods are widely used in predicting generated electricity, but, usually, these studies include electricity consumption forecasting. There are also papers on the power prediction of renewable energy sources, such as photovoltaic panels [27,28,29] and wind turbines [30,31]. The proposed publication fills the literature gap that has been noticed by the authors.
Mine gas is drained for the operational safety of the mine. Recently, efforts have focused on industrial capture methane from coal seams. Interest in this topic is increased because the captured methane can be used, for example, in the production of electricity. Many factors affect methane intake and cause its fluctuation. Gas quality will affect the efficiency of the engine. Nevertheless, mine gas has similar parameters and it contains a constant amount of pollutants in a given location, which results from the exploitation of seams with similar parameters. The quality of the gas also affects the durability of the engine. The exploitation of coal bed methane is more effective when the mines are operating. It is possible to further capture methane for electricity production after the closure of a mine and finishing of the exploitation of coal seams. Using gas engines is profitable and, depending on the amount of methane, the investment payback period is several years. The profitability of investments increases with the taxation of carbon dioxide emissions. In Poland, about 64.1% of the captured methane was used in 2019—primarily as fuel for gas engines or gas boilers to produce electricity and heat. Currently, there are more than 40 gas engines in operation in the Polish mining industry that use methane from methane drainage systems [32]. The operation of gas engines requires both an adequately high methane concentration in the fuel (minimum 25–40%, depending on the system [12,19,33]) and stability of the volume flux supply [34]. Methods of the mine methane use based on the example of Polish coal mining company JSW S.A. are presented in detail in paper [35]. In 2017, the company used 103,648.8 thousand m3 of methane from methane drainage systems. 57,248.8 thousand m3 of methane were utilized as combustion in gas engines for energy production.
This paper presents predictive models of electricity generation using coal mine methane based on artificial neural networks. The paper contains a statistical analysis of methane-air mixture capture, methane capture, and electricity production in the year 2020. The structure of this study is organized, as follows. The above section describes methane capture and the methods of its use. It also describes the solutions used in coal mines including cogeneration and trigeneration systems. Section 2 presents the characteristics of the mine analyzed and a description of the method used. The methane capture system and the engines used for its utilization are described in detail. The data collection system and parameters used for the ANN models are also discussed. Section 3 and Section 4 present both the parameter analysis at different time horizons and the prediction results using the proposed models. In this section, actual data and predicted electricity production are compared. The models are also compared and evaluated using the indicators that are discussed earlier. Section 5 presents conclusions and key observations.

2. Materials and Methods

2.1. Use of Methane Emitted from Mines

The Budryk mine is one of the newest hard coal mines concerning the ones located in the Silesian Province. The focal point of the research is a methane utilization system that is based on TBG 620 V 20 K gas engines in the Budryk mine, which belongs to the Upper Silesian Coal Basin (southern Poland). Table 1 presents the basic characteristic of the TBG gas engine.
In 2017, 19,927.9 thousand m3 of methane were captured at the Budryk mine, of which 11,825.9 thousand m3 (59%) were utilized. In the TBG 620 V 20 K gas engines, 9672.0 thousand m3 were disposed of and in the WR-10 boilers 2153.9 thousand m3 [37]. Figure 2 presents the TBG 620 V 20 K gas engine and the gas engines in the Budryk mine.
In the year 2020, 33,009,267.2 m3 of the methane–air mixture was captured at the Budryk mine with the simultaneous capture of pure methane amounting to 18,019,344.4 m3. The average annual concentration of methane in the mixture was 51.1%. The extracted methane is used to produce electricity and heat. Figure 3 shows a schematic diagram of the cogeneration system producing electricity and heat.
The measurement system for cogeneration combustion of methane in the Budryk mine makes it possible to continuously analyze the basic parameters of the gas (pressure P, temperature T, humidity H, gas volume flowrate F, methane volume flowrate F, and methane quality Q) and current information on the production of electricity. Figure 4 shows the location of measuring points.

2.2. Methodology and Data Collection

2.2.1. Data Collection

An analysis of coalbed methane capture was carried out based on data that were collected from the methane drainage system. The data were collected from 1 January to 31 December 2020. Because of the high frequency of readings, it was decided to carry out an analysis of electricity production based on hourly average values of each parameter. In total, the analysis included 8276 measurement series. Six parameters were identified, whose impact on electricity production was verified. Two groups were distinguished among the variables. Time variables include the month, day of the week, and hour of measurement. The second type of variables defines the methane emission, namely methane capture, methane concentration, and methane–air mixture capture. Table 2 presents the parameters, together with the units.
The collected data were compiled in different daily cycles and the mutual relationships between the parameters were then determined. For this purpose, Statistica software and an Excel spreadsheet were used.

2.2.2. Neural Networks

Artificial neural networks (ANNs) are popular machine learning techniques that simulate the mechanism of learning in biological organisms. The human nervous system contains cells, which are called neurons. Nowadays, ANNs are a rapidly growing field of data analysis methods, which are applied in economic research, forecasting of electricity production or energy demand, among others. An artificial neural network calculates the input data function, propagating the calculated values from the input neurons to the output neurons and using weights as intermediate parameters [39]. Neurons are distributed in different layers, including the input layer, hidden layers, and output layer. The number of neurons and layers in the ANN model depends on the complexity of the system dynamics. ANN learns the relationship between inputs and outputs of the system through an iterative process, called training. The input layer is used for input variable values. Each hidden and output neuron is connected to all elements of the previous layer [40]. Each input to a neuron has an associated weight. The weights are adjustable numbers that are determined during training. The selection of appropriate parameters as inputs and outputs of ANNs is very important in creating an accurate and reliable model. The availability of data for the selected parameters, knowledge of the system to identify the relationships between different parameters, and the objectives of model execution are the primary factors in selecting appropriate inputs and outputs. The accuracy of the selected output parameters can be checked using sensitivity analysis [41]. Figure 5 shows a simplified diagram of the neural network.
There are many types of neural networks with varying levels of sophistication. They can be classified according to their structures and learning algorithms. In terms of structure, neural networks can be divided into two types: feedforward networks and recurrent networks. In terms of learning algorithms, there are two main types of learning algorithms: supervised and unsupervised learning algorithms. In addition, there is a third type, reinforcement learning, which can be seen as a type of supervised learning. The multilayer perceptron (MLP) is one of the most well-known types of feedforward networks. This type of network consists of input, hidden, and output layers. The first of the layer includes the input variables on which the expected value depends. The last-mentioned layer, called the output layer, contains the predicted values. The hidden layers are intermediate neurons between input and output variables. The input layer neurons forward the raw data to the hidden layer. Subsequently, hidden neurons process signals using appropriately assigned weights. Commonly used activation functions are threshold function, sigmoidal, hyperbolic tangent, or radial basis function [42].
The Statistica software (Statistica 13, StatSoft, Tulsa, OK, USA) [43] was used to provide ANN models that are based on the analyzed variables. The use of the artificial neural network package enabled learning and testing models. The least-squares approach was used to find the best fit for the dataset. Therefore, different combinations of activation functions and the number of hidden units were tested to find the optimal values. The functions were selected among four types: linear, hyperbolic tangent, logistic, and exponential. Regarding the number of the hidden units, the optimal value was searching in the range from five to 500 neurons. The Broyden–Fletcher–Goldfarb–Shanno (BFGS) optimization algorithm was implemented for training the proposed neural networks. Three groups of data were extracted from the entire set of collected data: training, testing, and validation samples. 70% of the entire data set was used for training. The remaining data were divided equally (15% each) into two parts for validation and testing. The paper presents the results for five models with the best accuracy of the fitting. Particular attention is given to the model with the best results according to the proposed evaluation indicators.

2.2.3. Evaluation of the Model

The purpose of training neural networks is to minimize the error of the model against the actual values. Minimizing the error means improving the training performance and obtaining a more accurate model. When training ANNs, various definitions and types of error can be considered. For example, absolute error is defined as the difference between actual performance and predicted performance. During MLP learning, the mean squared error (MSE) or root mean squared error (RMSE) is often used [41]. The accuracy of the given models was tested using five fit indices: the correlation coefficients (r), the mean absolute error (MAE), root mean squared error (RMSE), and mean absolute percentage error (MAPE) and weighted absolute percentage error (WAPE). MAE and RMSE both provide information on the mean prediction error in models according to the observed variable. MAPE is a common measure for calculating the forecast error in time series analysis that reflects the percentage variation between forecast variables, while WAPE is equivalent to the MAPE index, but it represents the weighted error. The indices are calculated using the equations that are shown below:
r = c o v E A , E P σ E A σ E P
M A E = 1 n i = 1 n E A , i E P , i
R M S E = 1 n i = 1 n E A , i E P , i 2
M A P E = 1 n i = 1 n E A , i E P , i E A , i
W A P E = i = 1 n E A , i E P , i i = 1 n E A , i
where cov is the covariance, σ means the standard deviation, n is the entire number of observations, EA denotes the actual value, and EP represents the predicted value.

3. Results

3.1. Preliminary Analysis

The initial stage of the research was a preliminary analysis of the obtained results both concerning the statistics and data distribution during the analyzed period. Table 3 presents the statistical analysis of all the identified parameters.
Because three of the analyzed variables characterize the flow of gases that are drained from hard coal seams, it was decided that the correlations between them are so significant that not all of them should be included in the analysis. Methane capture was considered to be the most significant parameter, so, at the next stage, the relationship between this parameter and two others was examined: methane-air mixture capture and methane concentration. Figure 6 shows this relationship and the correlation coefficient r.
As one might see, the relationship between methane capture and mixture capture is clear and the correlation coefficient is 0.97. A relationship with methane concentration might also be spotted, but with a lower correlation coefficient of 0.59. On this basis, methane–air mixture capture was not further analyzed, as the correlation between this parameter and methane capture is so high that it will not be significant for the prediction models being developed. Moreover, the concentration level is very important due to its influence on the stability of gas engine operation.
In further steps, the distribution of the parameters over time was developed. Figure 7 presents the variations of the three crucial parameters throughout the year 2020. Electricity production, mixture and methane capture, and methane concentration in the methane–air mixture were considered.
As one might see, the values of energy production, as marked on the figure with a dotted line, vary from very low, even below 200 kWh/h to 10,000 kWh/h. The clean methane capture varies in this period from almost 0 to less than 90 m3/h. The methane concentration is the most stable variable. The values of this parameter vary in the range from 30 to more than 90%; however, most of the measurements are in the range from 45% to 65%. Lower or higher readings are individual. When analyzing the figure, a clear trend can be observed in the annual cycle, where much higher indications of both methane capture and electricity production were recorded in winter. On the other hand, these parameters are even three times lower in summer.
In the next stage, the variability of parameters in daily cycles was analyzed. For this purpose, two days were selected—one in summer and one in winter. Figure 8 shows the distribution of methane concentration, methane capture, and electricity production on 4 January and 4 December.
As can be concluded from the figures, there is no clear daily trend and the values of the parameters presented are relatively stable. At this stage, no relationship between parameters was observed. In the next stage, the data were analyzed in a monthly cycle. Figure 9 shows the values of the most significant parameters, i.e., methane capture, and electricity in each of the months. The main aim of these graphs is to present the variability of these parameters throughout the whole year. Figure 9a presents the electricity production in the form of a box plot by month. Figure 9b shows the methane capture and electricity production by month.
The monthly methane capture varies over a very wide range from 587,692 m3 per month in July, to 2,749,247 m3 per month in November. This translates into electricity production of 2120 MWh and 6960 MWh, respectively. In the analysis, in addition to developing a predictive model, the authors presented the environmental impact of methane capture and electricity production using methane. Methane capture affects the reduction of emissions directly to the atmosphere, which is particularly important in the case of methane, which is characterized by a high GWP factor (ranging from 25 to 30, according to various sources). Table 4 shows a detailed summary of methane capture values and corresponding CO2 emissions.
Even when assuming that the GWP factor is 28, in July, when the capture was the lowest, it results in emissions of approx. 10,811 tonnes of CO2eq. However, in November, the obtained values were the highest—50,575 tonnes CO2eq. Adding up the monthly values, annual methane capture from the analyzed mine of 18,019,344.4 m3, which results in the emission of 331,484 tonnes CO2eq per year, was obtained. The methane emissions associated with the extraction are very significant and can influence the greenhouse effect, as shown in the table above. Therefore, the capture, destroy or use (e.g., combustion) of methane is a crucial environmental issue.
The analysis of the variability distribution over time in different time horizons was the first stage of the work. Subsequently, the relationships between all of the variables analyzed in this study were determined. For this purpose, a correlation matrix was prepared to present the relationships between both the input parameters and the sought electricity production value. Table 5 presents the matrix.
An analysis of the above table shows that methane capture and methane–air mixture capture are the two parameters with the greatest impact on energy production. As previously described, due to the high correlation between these parameters, only methane capture was accepted for further analysis, as it is characterized by a higher correlation coefficient. While the results may lead one to assume that the day of the week would be the least relevant factor when creating a model, this parameter has also been included in it. The month and hour of measurement are characterized by similar correlation coefficients at about 0.26, but, based on Figure 10, it is presumed that the month may play a particularly vital role in the predictive model. Summarizing the above consideration, five variables were selected for MLP models. Models consider three-time parameters (month, day of the week, and hour) and two parameters characterizing methane capture in the analyzed mine (methane capture and methane concentration). The preliminary analysis also focused on examining the relationship between electricity production and the parameter with the highest correlation coefficient, i.e., methane capture. Figure 10 provides a detailed analysis of this relationship. Figure 10a shows the dependence of electricity on clean methane capture in a box plot form, where the independent variables are divided into value intervals every 10 m3/min. Figure 10b shows the same relationship, but in a simple form of a regression graph with histograms.

3.2. Neural Network Models

The predictive models were prepared using Statistica software, as described in detail in Section 2.2.2. Three datasets were used for the creation of the models: training, validation, and test part. Groups represent 70%, 15%, and 15% of the total data in the analysis, respectively. The selection of the optimal parameters, i.e., the type of the functions and number of hidden units, was made possible by multiple tests of the possible combinations. The error function during the network learning process was chosen to be the sum of the squares. The five selected networks with the best fit coefficient were retained for further analysis. Table 6 shows detailed data on the proposed networks.

3.3. Prediction Results—Evaluation

Indicators that made it possible to evaluate the proposed predictive models were determined based on the formulas defined in Section 2.2.3. Table 7 shows the full summary for each of the five models.
As shown by the analysis, the best fit coefficient was obtained using the MLP 1 model. While the differences between the proposed models were minor, due to the smallest values of all error indicators and the highest correlation coefficient, it was determined that using this model would result in obtaining the most accurate values. The fit coefficient of the MLP 1 model was 0.958, with a mean error of 437.79 kWh/h and a weighted absolute percentage error of 7.82%.
A sensitivity analysis was developed for each parameter to check how the specific inputs affect the prepared models. Table 8 shows the sensitivity indices of the five inputs for each of the proposed models. Although no clear trends in the distribution of electricity production were observed in the daily cycle, the hour parameter played a major role in each of the models. The month of measurement—another parameter that seemed important as early as the initial stage—was similar in this regard. For obvious reasons, methane capture was another significant parameter for all of the models. The day of measurement and methane concentration had the smallest impact on the results obtained.
Because the MLP 1 model produced the best results, as shown in Table 8, the prediction results based on this model were used for further analysis. Irrespective of the fact that the fit results that are shown in the table are largely indicative of the quality of the networks developed, the results were also presented in a graphical form. Figure 11 shows the variation of actual and predicted values as a function of time, as well as the relationship between the two quantities. As one can see in the figure, the model’s performance is the worst in the case of spikes and very low values deviating from the mean.

4. Discussion

The subject of this paper is the production of electricity using gas engines fueled by methane from coal mine “Budryk”. Analyzed mine is located in southern Poland. The article presents issues that are related to capturing methane and using it to generate electricity. According to the results of the conducted analysis, methane capture by the drainage system in the Budryk mine varies in range from 587,692 m3 to 2,749,247 m3 per month. These values correspond to monthly electricity production by the gas engines ranging from 2120 MWh to 6960 MWh, respectively. Throughout one year, 18,019,344 m3 of methane was captured at this mine, which amounts to 331,484 tonnes of CO2eq.
The authors proposed five MLP prediction models with very similar predictive accuracy. The models differed in regard to their activation functions and the number of hidden neurons. The correlation coefficients obtained range from 0.95 to 0.96. The presented models have an average prediction error between 437.79 and 469.34. On the other hand, the mean percentage error ranged from 15.47% to 16.48%. The evaluation indicators made it possible to select the most accurate network—MLP 1—that had a MAPE of 15.47% and a WAPE of 7.82%. In this model, hyperbolic tangent was used as an activation function for the hidden layer, while logistic was selected for the output layer. The total number of hidden units amounts to 293. The sensitivity analysis shows that electricity production is affected by many factors, including the quantity and concentration of the methane-air mixture. Time factors, such as the hour of measurement, were also significant, which is due to the cycle of extracting the coal from coal seams. At designated times, a process is in place that increases the emission of methane, which can then be captured and transferred to the methane drainage system. Its emission during the months in which the given values were recorded was related to the production schedules. Production was reduced during the summer, which also affected the amount of methane captured. It may also be related to the reduction in mining during the peak infection period among mine workers during the COVID-19 pandemic. In the proposed models, the prediction was strongly affected by the time parameters –hour and month of measurement. Of course, methane capture also played a major role in each model. The prepared models were designed to estimate the level of produced electricity based on five variables. As with any predictive model, model accuracy is critical. Forecasting how much electricity can be obtained from systems utilizing captured methane is essential for the proper management of mine energy resources.

5. Conclusions

The topic of environmental emissions never ceases to be relevant. Therefore, the capture of methane, which is a high-GWP gas, is the subject of much research work. Methane emissions carry a high risk to both the workers and the environment. However, properly captured and used methane can be a valuable energy source. Based on the solutions implemented and methane resources available in Poland, it is evident that the economic use of mine methane resources can become a vital energy source for it. This paper presents an annual analysis of methane capture by the methane drainage station at the Budryk mine, as well as electricity production from its combustion. The analysis of the monthly values from the drainage system shows that methane capture ranges from 587,692 m3 to 2,749,247 m3 per month using the utilization system with described gas engines allowed generating from 2120 MWh to 6960 MWh of electricity, respectively. The annual methane capture from the analyzed mine in 2020 amounts to 18,019,344.4 m3. It corresponds to the emission of 331,484 tonnes CO2eq per year.
Analyses over various periods have shown that the values examined—both methane capture and electricity generation—are affected by numerous factors. As noted before, energy production depends on such factors as the time of measurement and the type of gas used in energy systems, among others. Artificial neural networks make it possible to estimate the desired value with specific input parameters. Consequently, this requires distinguishing the parameters that determine a given value. The proposed predictive models can estimate electricity production with satisfactory accuracy, depending on methane capture and concentration, as well as the day, month, and hour of its measurement. Extreme values pose the most significant problem for the proposed models, especially the instantaneous minimum values, which are difficult to explain using the variables identified. The best accuracy was obtained by using the logistic function for the output and hyperbolic tangent function for the hidden layer. The total number of hidden neurons for this model was 293. The correlation coefficient of this model is 0.958, while the mean error and weighted absolute percentage error amount to 437.79 and 7.82%, respectively. The proposed models make it possible to determine the predicted electricity production with satisfactory accuracy. Based on the predicted values, proper energy management on the mine is possible. The estimation of the amount of energy required from other sources (e.g., the power grid) is crucial. Moreover, operators could predict an excess of generated electricity, i.e., when and how much produced energy will not be used by systems on the mine site.
Predicting electricity production is vital in ensuring effective management of energy resources at mining sites. Technical solutions to support the capture and use of methane remain a topic of interest to coal mining companies, which constantly try to upgrade their existing methane installations. It is necessary to identify further factors that can help fill the research gap and improve the predictive model, so that it can forecast electricity production with the greatest accuracy possible. Forecasting electricity production is crucial due to the financial aspects that are related to settlements between gas suppliers and electricity producers. Gas suppliers must provide a minimum amount of the methane mixture under the right pressure to maintain the minimum required amount of electricity generated. In the analyzed case, a minimum methane concentration of 40% had to be maintained to ensure the proper operation of the gas engines to prevent their shutdown. The amount of methane captured is also important for the methane supplier, as the supplier is bound by a contract.

Author Contributions

Conceptualization, M.B. and K.Z.; methodology, P.Ż.; software, K.Z.; validation, R.Ł., Z.K. and P.Ż.; formal analysis, R.Ł.; investigation, K.Z., P.Ż. and M.B.; resources, Z.K.; data curation, Z.K.; writing—original draft preparation, K.Z., P.Ż.; writing—review and editing, M.B.; visualization, K.Z.; supervision, Z.K.; project administration, R.Ł.; funding acquisition, M.B. All authors have read and agreed to the published version of the manuscript.

Funding

The article was supported by the program “Excellence initiative—research university” for the AGH University of Science and Technology.

Institutional Review Board Statement

Not applicable.

Data Availability Statement

Restrictions apply to the availability of these data. Data was obtained from JSW S.A. and are available from authors with the permission of JSW S.A.

Conflicts of Interest

The authors declare no conflict of interest.

Nomenclature

CMethane concentration, %
EpElectricity production, kWh/h
FMethane-air mixture capture, m3/min
FCH4Methane capture, m3/min
HRelative humidity of gas, %
PPressure of the methane-air mixture, kPa
TTemperature of gas, °C

Abbreviations

ANNArtificial Neural Network
BFGSBroyden–Fletcher–Goldfarb–Shanno algorithm
CCHPCombined Cooling, Heating and Power
CHP Combined Heating and Power
CMM Coal Mine Methane
GWPGlobal Warming Potential
MAEMean Absolute Error
MAPEMean Absolute Percentage Error
MLPMultilayer Perceptron
MSEMean Squared Error
RMSERoot Mean Squared Error
TBGGas Engine TBG
VAMVentilation Air Methane
WAPEWeighted Absolute Percentage Error

References

  1. UNECE. Best Practice Guidance for Effective Methane Recovery and Use from Abandoned Coal Mines; ECE Energy Series No. 64; United Nations: Geneva, Switzerland, 2019; ISBN 978-92-1-117216-4. Available online: https://unece.org/DAM/energy/images/CMM/CMM_CE/Best_Practice_Guidance_for_Effective_Methane_Recovery_and_Use_from_Abandoned_Coal_Mines_FINAL__with_covers_.pdf (accessed on 24 March 2021).
  2. Aydin, G.; Karakurt, I.; Aydiner, K. Analysis and Mitigation Opportunities of Methane Emissions from the Energy Sector. Energy Sources Part A Recovery Util. Environ. Eff. 2012, 34, 967–982. [Google Scholar] [CrossRef]
  3. EPA. Global Anthropogenic Non-CO2 Greenhouse Gas Emissions: 1990–2030. Office of Atmospheric Programs; Climate Change Division, U.S. Environmental Protection Agency, 1200 Pennsylvania Avenue, NW: Washington, DC, USA, December 2012. Available online: https://www.epa.gov/sites/production/files/2016-08/documents/epa_global_nonco2_projections_dec2012.pdf (accessed on 18 March 2021).
  4. Talkington, C.; Pilcher, R.C.; Ruiz, F.A. Addressing barriers to global deployment of best practices to reduce methane emissions from coal mines. Carbon Manag. 2015, 5, 587–594. [Google Scholar] [CrossRef]
  5. Gunning, P.M. The Methane to Markets Partnership: An international framework to advance the recovery and use of methane as a clean energy source. Environ. Sci. 2007, 2, 361–366. [Google Scholar] [CrossRef] [Green Version]
  6. Usón, S.; Kostowski, W.J.; Stanek, W.; Gazda, W. Thermoecological cost of electricity, heat and cold generated in a trigeneration module fuelled with selected fossil and renewable fuels. Energy 2015, 92, 308–319. [Google Scholar] [CrossRef]
  7. WUG. Ocena Stanu Bezpieczeństwa Pracy, Ratownictwa Górniczego Oraz Bezpieczeństwa Powszechnego w Związku z Działalnością Górniczo-Geologiczną w 2019 Roku. Wyższy Urząd Górniczy, Katowice. 2020. Available online: https://wug.intracom.com.pl/download/WUG_Stan_bhp_19,7247.pdf (accessed on 16 March 2021).
  8. European Commission. Communication from the Commission to the European Parliament, the Council, the European Economic and Social Committee and the Committee of the Regions on an EU Strategy to Reduce Methane Emissions. Brussels, 14.10.2020 COM (2020), 663. Available online: https://eur-lex.europa.eu/legal-content/EN/TXT/HTML/?uri=CELEX:52020DC0663&from=EN (accessed on 17 March 2021).
  9. Fiehn, A.; Kostinek, J.; Eckl, M.; Klausner, T.; Gałkowski, M.; Chen, J.; Gerbig, C.; Röckmann, T.; Maazallahi, H.; Schmidt, M.; et al. Estimating CH4, CO2 and CO emissions from coal mining and industrial activities in the Upper Silesian Coal Basin using an aircraft-based mass balance approach. Atmos. Chem. Phys. 2020, 20, 12675–12695. [Google Scholar] [CrossRef]
  10. Karacan, C.Ö.; Ruiz, F.A.; Cotè, M.; Phipps, S. Coal mine methane: A review of capture and utilization practices with benefits to mining safety and to greenhouse gas reduction. Int. J. Coal Geol. 2011, 86, 121–156. [Google Scholar] [CrossRef]
  11. Wierzbiński, K. Intelligent Mine Closure; A Case Study of the AMMUSCB Project, a First AMM Capture and Use Project in Poland. XXIX School of Underground Exploitation, Krakow, Poland, 24–26 February 2020. Available online: https://www.igg.pl/sites/default/files/2020-12/59.%20AMMUSCB_SEP_26.02.2020_KWierzbinski_bez-def_EN.pdf (accessed on 17 March 2021).
  12. UNECE. Best Practice Guidance for Effective Methane Drainage and Use in Coal Mines, 2nd ed.; ECE Energy Series No. 47; United Nations: Geneva, Switzerland, 2016; Available online: https://www.unece.org/fileadmin/DAM/energy/cmm/docs/BPG_2017.pdf (accessed on 21 March 2021).
  13. Sloss, L. Power Projects Using Methane from Coal Mines; IEA Clean Coal Centre: London, UK, 2006; ISBN 92-9029-428-0. [Google Scholar]
  14. Borowski, M.; Cała, M. Method for a drainage roadway location determination for an overlying methane drainage system. J. Pol. Miner. Eng. Soc. 2020, 1, 201–207. [Google Scholar]
  15. Zhang, B.S.; Chen, N.; Song, Z.C. New technology for coalbed methane power generation based on Stirling engine driven by porous burner. Procedia Earth Planet. Sci. 2009, 1, 1480–1483. [Google Scholar] [CrossRef] [Green Version]
  16. Aghaei Meybodi, M.; Behnia, M. Australian coal mine methane emissions mitigation potential using a Stirling engine-based CHP system. Energy Policy 2013, 62, 10–18. [Google Scholar] [CrossRef]
  17. Ostrowski, P.; Pronobis, M.; Remiorz, L. Mine emissions reduction installations. Appl. Therm. Eng. 2015, 84, 390–398. [Google Scholar] [CrossRef]
  18. Mallick, N.; Prabu, V. Energy analysis on Coalbed Methane (CBM) coupled power systems. J. CO2 Util. 2017, 19, 16–27. [Google Scholar] [CrossRef]
  19. Brinkmann, T.; Scholles, C.; Wind, J.; Wolff, T.; Dengel, A.; Clemens, W. Processing of coal mine gas with low methane concentrations for use in high-temperature fuel cells. Desalination 2008, 224, 7–11. [Google Scholar] [CrossRef] [Green Version]
  20. Zuo, C.; Qian, Y.; Tan, J.; Xu, H. An experimental study of combustion and emissions in a spark-ignition engine fueled with coal-bed gas. Energy 2008, 33, 455–461. [Google Scholar] [CrossRef]
  21. Postrzednik, S. Combined use of coal mine gases for efficient energy generation. Arch. Thermodyn. 2016, 37, 37–53. [Google Scholar] [CrossRef]
  22. Borowski, M.; Kuczera, Z.; Chudy, J. Pro-Ecological use of methane from methane drainage for the production of electricity and heat. J. Pol. Miner. Eng. Soc. 2018, 19, 255–261. [Google Scholar]
  23. Napieraj, S.; Borowski, M.; Karch, M. Ecologically and economically effective methods of coal bed methane using. J. Pol. Miner. Eng. Soc. 2019, 21, 279–286. [Google Scholar]
  24. Timmerman, J.; Deckmyn, C.; Vandevelde, L.; Van Eetvelde, G. Low Carbon Business Park Manual: A Guide for Developing and Managing Energy Efficient and Low Carbon Businesses and Business Parks; Ghent University: Ghent, Belgium, 2014. [Google Scholar]
  25. Backhaus, C.; Mroz, A.; Willenbrink, B. Coal mine gas from abandoned mines, Polish Geological Institute Special Papers. In Proceedings of the IV European Coal Conference, Ustron, Poland, 26–28 September 2000; pp. 33–40. [Google Scholar]
  26. Ashraf, W.M.; Uddin, G.M.; Farooq, M.; Riaz, F.; Ahmad, H.A.; Kamal, A.H.; Anwar, S.; El-Sherbeeny, A.M.; Khan, M.H.; Hafeez, N.; et al. Construction of Operational Data-Driven Power Curve of a Generator by Industry 4.0 Data Analytics. Energies 2021, 14, 1227. [Google Scholar] [CrossRef]
  27. Hassan, M.A.; Bailek, N.; Bouchouicha, K.; Nwokolo, S.C. Ultra-Short-Term exogenous forecasting of photovoltaic power production using genetically optimized non-linear au-to-regressive recurrent neural networks. Renew. Energy 2021, 171, 191–209. [Google Scholar] [CrossRef]
  28. Luo, X.; Zhang, D.; Zhu, X. Deep learning based forecasting of photovoltaic power generation by incorporating domain knowledge. Energy 2021, 225, 120240. [Google Scholar] [CrossRef]
  29. López Gómez, J.; Ogando Martínez, A.; Troncoso Pastoriza, F.; Febrero Garrido, L.; Granada Álvarez, E.; Orosa García, J.A. Photovoltaic Power Prediction Using Artificial Neural Networks and Numerical Weather Data. Sustainability 2020, 12, 10295. [Google Scholar] [CrossRef]
  30. Nielson, J.; Bhaganagar, K.; Meka, R.; Alaeddini, A. Using atmospheric inputs for Artificial Neural Networks to improve wind turbine power prediction. Energy 2020, 190, 116273. [Google Scholar] [CrossRef]
  31. Meka, R.; Alaeddini, A.; Bhaganagar, K. A robust deep learning framework for short-term wind power forecast of a full-scale wind farm us-ing atmospheric variables. Energy 2021, 221, 119759. [Google Scholar] [CrossRef]
  32. Borowski, M.; Łuczak, R.; Życzkowski, P. Increase of methane intake through methane intake system with drainage excavation during longwall mining operations on a selected example. In Archives of Mining Sciences; Wydawnictwo Instytutu Mechaniki Górotworu PAN: Krakow, Poland, 2019; pp. 81–92. ISSN 0860-7001. ISBN 978-83-953913-2-3. [Google Scholar]
  33. CoMeth. Coal Mine Methane—New Solutions for Use of CMM—Reduction of GHG Emissions. Final Publishable Summary Report FP7 Project No. TREN/FP7/EN/218935. Available online: https://www.cometh.info/downloads/218935_CoMeth_Final_publishable_summary_report_051212.pdf (accessed on 16 April 2019).
  34. Borowski, M.; Życzkowski, P.; Łuczak, R.; Karch, M.; Cheng, J. Tests to Ensure the Minimum Methane Concentration for Gas Engines to Limit Atmospheric Emissions. Energies 2020, 13, 44. [Google Scholar] [CrossRef] [Green Version]
  35. Borowski, M.; Życzkowski, P.; Cheng, J.; Łuczak, R.; Zwolińska, K. The Combustion of Methane from Hard Coal Seams in Gas Engines as a Technology Leading to Reducing Greenhouse Gas Emissions—Electricity Prediction Using ANN. Energies 2020, 13, 4429. [Google Scholar] [CrossRef]
  36. DEUTZ ENERGY GmbH. TBG620. The Gas Engine. Available online: http://www.rieanpishroco.com/wp-content/uploads/2015/04/TBG-620.pdf (accessed on 21 March 2021).
  37. Data Provided by JSW S.A. Unpublished work.
  38. Nawrat, S.; Kuczera, Z.; Łuczak, R.; Życzkowski, P.; Napieraj, S.; Gatnar, K. Utylizacja Metanu Z Pokładów Węgla W Polskich Kopalniach Podziemnych; Uczelniane Wydawnictwa Naukowo-Dydaktyczne AGH: Krakow, Poland, 2009. [Google Scholar]
  39. Aggarwal, C.C. Neural Networks and Deep Learning; Springer: Cham, Switzerland, 2018; pp. 1–30. [Google Scholar]
  40. Zgurovsky, M.; Sineglazov, V.; Chumachenko, E. Artificial Intelligence Systems Based on Hybrid Neural Networks: Theory and Applications, 1st ed.; Springer: Cham, Switzerland, 2021; pp. 1–12. [Google Scholar]
  41. Asgari, H.; Chen, X. Gas Turbines Modeling, Simulation, and Control: Using Artificial Neural Networks, 1st ed.; CRC Press: Boca Raton, FL, USA, 2015; pp. 47–60. [Google Scholar]
  42. Pham, D.T.; Liu, X. Neural Networks for Identification, Prediction and Control; Springer: London, UK, 1995; pp. 1–10. [Google Scholar]
  43. StatSoft. STATISTICA (Data Analysis Software System); StatSoft, Inc.: Tulsa, OK, USA, 2017; Available online: www.statsoft.pl (accessed on 5 March 2021).
Figure 1. Total CH4 Emissions from Coal Mining [3].
Energies 14 03049 g001
Figure 2. Gas engines (a) TBG 620V gas engine [38]; (b) in the Budryk mine.
Energies 14 03049 g002
Figure 3. Combined heat and power generation system at the Budryk mine.
Energies 14 03049 g003
Figure 4. Measurement system for methane utilisation in the Budryk mine with measurement points of gas parameters: P—Pressure; T—Temperature measurement; H—Humidity; Q—Quality; F—Flowrate.
Energies 14 03049 g004
Figure 5. Simplified diagram of the neural network.
Energies 14 03049 g005
Figure 6. Methane concentration and methane-air mixture capture as a function of methane capture.
Energies 14 03049 g006
Figure 7. Variability of generated electricity, capture, and concentration of the methane in the analyzed period.
Energies 14 03049 g007
Figure 8. The daily course of variables in the analyzed period during the day by hour—An example of diagram (a) for summer period 4 June; (b) for winter period 4 December.
Energies 14 03049 g008
Figure 9. Variation of electricity production and methane capture by month throughout the analyzed year (a) box plot for electricity; (b) regression graph with histograms.
Energies 14 03049 g009
Figure 10. Electricity production as a function of methane capture (a) box plot with eight methane capture ranges; (b) regression graph with histograms.
Energies 14 03049 g010
Figure 11. The prediction result of MLP 1 (a) Actual and predicted values for analyzed period; (b) Regression performance of model—predicted against the actual values.
Energies 14 03049 g011
Table 1. General specifications of TBG 620V gas engine [36].
ParameterUnitValue
Engine powerkW1875
Mean effective pressure bar16.9
Exhaust temperature (approx.) °C420
Generator efficiency%96.9
Electrical powerkW1817
Electrical efficiency%40.9
Thermal efficiency%43.1
Total efficiency%84.0
Table 2. Identified variables and outputs.
ParameterUnit
Day of the week -
Month-
Hourh
Methane capture, FCH4m3/min
Methane concentration, C%
Methane-air mixture capture, Fm3/min
Electricity production, Ep kWh
Table 3. Basic statistical parameters of variables.
VariableUnitMinimum MaximumMeanMedian
Month-From January to December
Day-From Monday to Sunday
Hour-From 0:00 to 23:00
Methane capture FCH4m3/min0.0286.2835.1026.59
Methane concentration C%19.8993.9253.0551.85
Methane-air mixture capture Fm3/min0.39130.4064.4755.87
Electricity power EpkWh135.009991.005601.514983.00
Table 4. Monthly summary of methane capture and emission expressed in CO2 equivalent.
MonthMethane Capture, m3/MonthEmission, Tonnes of CO2eq
January2,337,720.443,004.7
February2,488,802.445,784.0
March1,812,867.133,349.5
April920,231.416,928.6
May785,181.914,444.2
June666,233.512,256.0
July587,692.410,811.2
August776,021.114,275.7
September802,078.814,755.0
October2,081,505.038,291.4
November2,749,247.450,575.2
December2,011,763.037,008.4
Year 202018,019,344.4331,483.9
Table 5. Matrix of the correlation coefficients.
MonthDay of the WeekHourMethane-Air Mixture CaptureMethane CaptureMethane ConcentrationElectricity
Month1.000
Day of the Week−0.0121.00
Hour0.9970.0111.000
Methane-air mixture capture−0.1240.0780.1211.000
Methane concentration0.0040.1150.0070.9751.000
Methane capture0.3540.1600.3530.4510.5911.000
Electricity0.2580.1140.2590.8220.8570.5801.000
Table 6. Details of the selected MLP models.
NetworkHidden Layer Activation-FunctionNumber of Hidden UnitsOutput Layer Activation-Function
MLP 1Logistic293Logistic
MLP 2Hyperbolic tangent250Logistic
MLP 3Logistic494Logistic
MLP 4Hyperbolic tangent139Logistic
MLP 5Hyperbolic tangent280Logistic
Table 7. Comparisons of forecasting accuracy for analyzed models.
Evaluation FactorsNumber of the MLP Model
12345
r0.9580.9540.9520.9570.951
MAE437.79441.96465.74445.26469.34
RMSE764.71796.94812.27771.32823.38
MAPE15.47%15.87%16.48%15.69%16.52%
WAPE7.82%7.89%8.31%7.95%8.38%
Table 8. Sensitivity analysis of variables.
Input ParameterNumber of the MLP Model
12345
Month28.4117.7911.2821.4010.36
Day1.931.661.521.991.62
Hour63.5544.2226.3136.6422.32
Methane capture16.177.507.4716.808.16
Methane concentration1.781.641.531.921.44
Publisher’s Note: MDPI stays neutral with regard to jurisdictional claims in published maps and institutional affiliations.

