Article

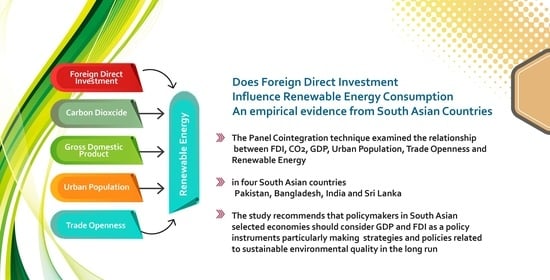
Does Foreign Direct Investment Influence Renewable Energy Consumption? Empirical Evidence from South Asian Countries

1
Department of Financial Engineering, School of Economics, Sichuan University, No. 24, South Section 1, Yihuan Road, Chengdu 610065, China
2
Department of Management Sciences, COMSATS University Islamabad, Islamabad 45550, Pakistan
3
Department of Management Sciences, Islamia College University, Peshawar 25120, Pakistan
4
Department of Management Sciences, University of Swabi, Swabi 23430, Pakistan
5
Department of Management Science, Institute of Business and Management Sciences (IBMS), University of Agriculture, Peshawar 21530, Pakistan
*
Author to whom correspondence should be addressed.
Energies 2021, 14(12), 3470; https://doi.org/10.3390/en14123470
Submission received: 6 May 2021 / Revised: 1 June 2021 / Accepted: 7 June 2021 / Published: 11 June 2021

Abstract

:
In selected South Asian countries, the study intends to investigate the relationship between urban population (UP), carbon dioxide (CO2), trade openness (TO), gross domestic product (GDP), foreign direct investment (FDI), and renewable energy (RE). Fully modified ordinary least square (FMOLS) and dynamic ordinary least square (DOLS) models for estimation were used in the study, which covered yearly data from 1990 to 2019. We used Levin–Lin–Chu, Im–Pesaran–Shin, and Fisher PP tests for the stationarity of the variables. The outcomes of the panel cointegration approach looked at whether there was a long-run equilibrium nexus between selected variables in Pakistan, Bangladesh, India, and Sri Lanka. The FMOLS approach was also used to assess the relationship, and the results suggest that there is a significant and negative nexus between FDI and renewable energy in south Asian nations. The study’s findings reveal a strong and favorable relationship between GDP and renewable energy use. In South Asian nations (Sri Lanka, Pakistan, India, and Bangladesh), the FMOLS and DOLS findings are nearly identical, but the authors used the DOLS model for robustification. According to the findings, policymakers in South Asian economies (Sri Lanka, Pakistan, India, and Bangladesh) should view GDP and FDI as fundamental policy instruments for environmental sustainability. To reduce reliance on hazardous energy sources, the government should also reassure financial sectors to participate in renewable energy.

Graphical Abstract

1. Introduction

Energy plays a crucial role in fulfilling many basic human requirements and promoting the manufacturing, transport, and agricultural activities that contribute to economic growth [1,2]. A nation’s economic development depends on a continuous supply of energy to meet all required demands. Energy efficiency and government energy policy must encourage energy security that plays a key role in maintaining a country’s economic growth [3,4]. Due to climate change, governments have gradually realized that they cannot proceed with energy business as usual (BaU). Therefore, they are designing policies that leverage renewable energy sources. Implementing these policies is not difficult since the region is blessed with a vast potential of producing massive amounts of electricity. South Asia is classified as a region having the lowest per capita consumption of energy. South Asian countries generate less than 50 percent of their potential available electricity [4]. Progress has been sluggish and slow in the region with respect to regional economic integration, and investment issues have not yet been addressed.
Consequently, South Asian countries have yet to fulfill their potential fully to attract regional FDI, particularly intraregional FDI. Strong economic growth has generated momentum for regional integration in the leading economies in the subregion since the mid-2000s. South Asian economies have gradually understood that regional integration is instrumental in improving the business and investment environment [5]. The investment agenda might be critical to regional incorporation and, in particular, the formation of a regional investment field (UNCTAD, 2013). To overcome the global warming problem, the usage of renewable energy, for example, solar power, wind, biomass, hydroelectricity, etc. is emphasized. Global warming is generally recognized as a significant challenge to humankind’s potential well-being. Despite the target of higher renewable energy usage, the plan for using sustainable energy to avoid environmental pollution may be undermined by the decline of RE used in the particular four South Asian countries. The 13th South Asian Regional Cooperation Association (SAARC) Summit sanctioned the establishing of the SAARC Energy Center (SEC) at Islamabad in 2005, emphasizing the vital part that power serves in socioeconomic development. By establishing coordinated policies and coordination, the SEC is now obligated to strengthen energy capacity in its member nations. The SEC can also be a driver for economic development by developing regional capabilities. The leadership of the SAARC Energy Center (SEC) is collaborating to tackle the regional problems of energy.
South Asian countries are listed among the economically fast-growing countries in the world. The region experienced relatively high population growth, especially among the middle class with a substantial increase in prime energy usage and increased per capita income. The South Asian Regional Cooperation Association (SAARC) represents eight member countries, with a 4.21% share of the global GDP, i.e., USD 3.31 trillion [6,7]. The region has 24% of the world’s population, which is over 1.5 billion. The critical energy usage of South Asian countries is changing dramatically in terms of volume and mix. Each country has different goals, depending on energy accessibility, economic and business viability, the key geopolitical scenario, the degree of power sector commerce, and the technology accessible for energy surveys. It has also been reported that diesel-powered automobile sales have increased from 4% to 11% in recent years. In emerging countries, energy reserves are fast depleting [8]. Using quarterly data for Indonesia from 1975Q1 to 2011Q4, Shahbaz et al. (2013) investigate the links between wealth creation, power usage, economic development, commerce transparency, and carbon footprint. According to the findings, economic development and power usage boost CO2 emissions, making them more compatible with economic development and commerce openness. The vector error correction model (VECM) verified the hypothesis of bidirectional causation between energy consumption and greenhouse gases, as well as the link between EG and air pollution. Carbon emissions are caused by financial expansion.
FDI can play a curial role in a country’s economic growth by providing high technology, capital, and employment opportunity [9]. In the past, scholars focused more on FDI to determine its influence on economic growth [10,11,12,13,14,15,16]. However, recent studies focus on the importance of renewable energy consumption. This issue has been deliberated in advanced economies such as the USA, UK, Canada, France, but it has remained least researched in South Asian countries [10,13,14,17]. According to the China Global Investment Tracker (CGIT), renewable energy accounts for the vast majority of FDI in South Asia. Most of the FDI in South Asian countries consists of investment in energy sectors. Therefore, the pros and cons of FDI must still need a serious concern. Extant literature has discussed the association between renewable energy, quality of life, climate changes, sustainable development, and economic growth [18,19,20]. Despite this, none of them looks at the link between FDI, renewable energy, and economic growth. Even the geographical gap is noticeable. Only a few studies are reported but with a limited scope, such as Naz et al. (2019) and Fan and Hao (2020) [21,22].
This research work has a number of contributions. First, it is comprehensive and is different in several ways from previous studies conducted in South Asian countries. Due to mixed study evidence, the influence of foreign direct investment on renewable energy usage is still a huge phenomenon across the world. The reason for these contradictory results could be that most of the prior literature did not look at the effect of FDI on fuel efficiency across random samples. As a result, the researchers add to and supplement the current literature in the issues outlined below. From the perspective of a few South Asian countries, this research examines the impact of FDI on energy intensity. Moreover, the study explores the channels of the effect of foreign direct investment on renewables usage. Furthermore, the researchers intend to employ the panel FMOLS and DOLS models to reveal the nonlinear mechanism of FDI on renewable energy consumption (REC), enriching the theoretical research on REC.
Second, this study examines the relationship of the urban population, CO2, trade openness, GDP, FDI, and renewable energy consumption in Bangladesh, India, Sri Lanka, and Pakistan using dynamic panel data from 1990 to 2019. The study treats the data under a panel setup. The following section is arranged as follows. The Section 2 contains a short literature review. The model specification and methodology are described in the Section 3. The empirical results are discussed in the Section 4. The paper’s Section 5 is discussion of the results. Furthermore, the sixth section concluded with a conclusion and policy implications. Objectives of the Study
(1)
To investigate the impact of FDI on renewable energy consumption;
(2)
To investigate the impact of trade openness on renewable energy consumption;
(3)
To investigate the impact of GDP growth on renewable energy consumption;
(4)
To investigate the impact of the urban population on renewable energy consumption;
(5)
To investigate the impact of CO2 on renewable energy consumption.

2. Literature Review

The study examines the relations among determinants of renewable energy using econometric tools. Due to the easy availability of data, the early studies focused mainly on developed countries than developing countries [23]. Those studies aimed to create a relationship between the environment and the economy both for the short and long term. For instance, by creating a set of growth variables, Shahbaz et al. (2012) from 1971 to 2011, investigate the relationship between economic growth and energy usage in China [24]. In his causality investigation, Granger reveals unidirectional causation between economic growth on power usage, as well as bidirectional causation between trade and energy consumption.
Kumaran et al. (2020) examine the factors that influence renewable energy consumption in ASEAN countries, including GDP, CO2 emissions, FDI, trade transparency, urban sprawl, and governance performance [7]. The results of long-term elasticities revealed that the use of FMOLS and DOLS found a strong positive influence on renewable power. The long-lasting elasticity findings indicate the significant negative impact of GDP and free trade on renewables, while FDI is not essential for the use of renewables. Hossain (2015) explores the complex causal relations for three SAARC countries, in the period 1976–2009, between the economic growth, consumption of electricity, export values, and send-offs [25]. The result indicates two-way causal interactions between economic growth and export prices, but there is no proof of long-term causality relations since no evidence of this was found.
Similarly, Mudakkar, et al. (2013) explore the causal connection between power usage, industrialization, destruction of the atmosphere, and depletion of resources (i.e., lack of minerals) [26]. The findings show that unidirectional causation exists between renewables and industrial GDP, green technology and water resources, and renewable energy and air pollution, but not the other way around. Even there is a variation in the previous studies [27,28,29,30]. Moreover, Granger’s electricity consumption induces GDP for agriculture, but not elsewhere, and the bidirectional trigger is present in Pakistan for electricity consumption and population density. The Granger fossil fuel delivers industrial GDP, and the causes of fossil fuel are bidirectional to population density.
Alper and Oguz (2016) reveal that the most vital characteristics of green power are lower air pollution, help to save the atmosphere, decrease in reliance on overseas resources for domestic energy sources, and more jobs [31]. Energy is crucial to a country’s economy. Zhang (2017) claims that developing nations are transitioning from traditional energy use to RE resources to counter the potential adverse environmental hazardous effects of fossil energy [32]. Chen et al. (2020) point out that the improvement in the economy significantly contributes to the use of renewable energy [33].
Using the autoregressive distributed lag (ARDL) and error correction (ECM) models, Zhoa and Lou (2016) find that in the long run, renewable energy consumption increases the GDP per capita [34]. Per capita income is employed to build green technologies that could further raise renewable energy consumption [35,36]. In contrast, Akar and Prof (2016) point out that GDP had a negative influence on the use of renewable energy in the Balkans between 1998 and 2011, using panel unit root tests and system generalized method of moment estimate [37]. According to Omri and Nguyen (2015), there is no relationship between EG and the use of RE in low-income countries and the world since GDP has no importance for the consumption of renewable energy. They examine factors of renewable energy in the sample of 64 countries from 1990 to 2011 [38].
The impact of trade openness on renewable energy consumption has been shown to be statically important. Openness to trade positively contributes towards technology transfer and helps nations to accept and adopt modern technologies for renewable energy infrastructure. Moreover, it enhances domestic economic activities. Akar’s (2016) report shows that trade openness had a positive effect on the consumption of RE in the Balkans between 1998 and 2011 [37]. Similarly, Chen (2018) notes that trade significantly influences China’s energy consumption [39,40]. Exports will cause further renewable energy production because the rise in the number of exports would stimulate the consumption of renewable energy [41], subsequently increasing demands for the supply of more power and renewable energy from external sources.
Past studies have concentrated mainly on the monetary impact of FDI and its influence on the environment. Doytch and Narayan (2016) report FDI as an essential determinant of the growth of sustainable use of energy for upper-middle-income countries (UMICs) [42]. In contrast, the effect of sectoral FDI on lower center wage nations (LMICs) is minor. On the other hand, no evidence exists for a statistically significant association between FDI inflows and the use of renewable energy [43]. There have been many studies that examined the association between urbanization and renewable energy use. Chen (2018) claims urbanization positively impacts renewable energy consumption, particularly in highly urbanized areas. Under the study of 30 selected provinces from 1996 to 2013 in China, he applied a dynamic system-GMM panel model [39]. Corruption has been found to be the main barrier to the creation of renewable energy sources [16]. Corruption exploits the public fund and hinders the phase of public funding.
Many recent studies (e.g., Khan et al., 2014) focused on globalization, economic development, and power usage, emphasizing the importance of FDI in globalization and economic development [44]. There is a mix of evidence that FDI has an impact on energy consumption. For example, a study Goldemberg supports the link between FDI and energy savings [45]. They also acknowledge the technological innovation in developed countries to reduce overall usage, though the study’s small sample size of 20 countries and study period of 1970–80 may be a limitation. In the fixed-effect approach of the panel data model, Hübler and Keller (2010) find no evidence of a connection between FDI and GDP. The current study contends that adjusting for endogeneity with a dynamic panel approach enhances the results. To account for the proposed technique/technology better, the study also suggests evaluating differential effects on renewable and nonrenewable resources [46]. With the FDI hypothesis, Sadorsky (2010) is unable to prove the energy-saving relationship [47].
Using GMM methodologies, the author examines the influence of stock market growth and FDI on power usage in a panel of 22 emerging nations. Financial gain has a statistically significant influence on stock market capitalization, stock value swapped, and the turnover ratio on energy demand, according to Sadorsky, whereas FDI has no effect. Chang (2015) widens this survey to include nonlinear analysis, and the findings are similar to those reported by Sadorsky for a sample of 53 countries. Sadorsky repeated the survey in nine central and eastern European economies in 2011 [48]. There was a favorable effect of FDI on the energy usage country’s panel after adding banking variables. Coban and Topcu (2013) used a system GMM estimator to assess the impact of economic development on power usage in EU27 countries and found similar results [49]. The authors aggregated FDI as part of some model specifications in the study, which focused on the stock market and bank system development. Similar to Sadorsky [50], Alam [51] show a considerable positive effect of FDI on energy use. In the majority of situations, according to the few country-specific studies that incorporate FDI in their power use, FDI reduces renewables utilization. In South Africa and Malaysia, Dube (2009) and Foon Tang (2009) [52,53] show a cointegrated relationship between energy usage and FDI, respectively, while according to He et al. (2012), FDI and power consumption have reciprocal impacts [53].
Furthermore, in Thailand, Malaysia, and Indonesia, Alshamsi and Azam, (2015) examine that FDI and GDP have a significant connection [54]. The differences in the relation between FDI and energy intensity in different geographic locations indicate that regions have different abilities to absorb and gain environmental spillovers. To analyze the relationship between FDI, green power use, free trade, and greenhouse gases. The disparities in previous research on the influence of FDI on renewable power usage may be due to different samples used in other conditions. As a result, this research contributes to the existing literature by investigating the impact of FDI on renewable energy consumption in selected South Asian countries.
For the period 1990–2011, Atiaoui et al. (2017) look at the impact of per capita carbon footprint and per capita GDP on RE consumption in 22 African countries, using the fuel renewable energy ratio of total energy and the autoregressive distribution-pooled average category [55]. They find that REC does not significantly affect GDP, although the negative impact of CO2 emissions on REC is positive. In contrast, Sadorsky (2009a) notes that higher per capita real GDP contributes to greater per capita REC in the G7 countries [56]. A rise in oil prices is less significant but negative, while CO2 emissions are positively impacted. In another survey, RE consumption per capita for 18 emergent economies note the same positive influence from GDP per capita [53]. For a panel of 64 nations, Omri et al. (2015) find the same impact of actual GDP per capita on energy consumption per capita [57]. They also show that trade openness promotes the REC per capita, despite the fact that the short-term and long-term causality between trade and the REC has yet to be proven [58]. Financial openness and free trade, according to Rasoulinezhad and Saboori (2018), have a positive effect on renewables consumption [59]. Marques and Fuinhas (2012) have noted that there seems to be a difference between the country and time of study regarding RE use and EG [60]. They contend that the omitted variable bias may contribute to the fact that the analysis does not involve the simultaneous use of fossil fuels. Therefore, this study does not include the major countries that produce oil and export, for instance, Nigeria, Angola, and Algeria in the African region.

3. Research Methodology

3.1. Data

This study examines the nexus between UP, CO2, trade openness, GDP, FDI, and renewable energy consumption (REC) in selected South Asian nations, using dynamic panel data from 1990 to 2019. Renewable energy consumption is a dependent variable measured as a percentage of total final energy consumption. In contrast, foreign direct investment (FDI) is the net inflow (% GDP), gross domestic product (GDP) is economic growth, Trade openness (TO) means exports plus imports/GDP, carbon dioxide (CO2) is calculated as a metric ton per capita, and urban population (UP) growth (annual %) are independent variables. The research data for this article are collected from the “World Bank Development Indicators” for the following four economies: Pakistan, India, Sri Lanka, and Bangladesh. The remaining South Asian countries have no longer a long set of data. Table 1 is measurement of variables used in this study. The details about all variables is mentioned bellow.

3.2. Methodology

This study contributed to the consideration that it incorporates for the first-time urban population as a factor of REC in the four target countries of South Asia. The link between urban population (UP) and renewable energy consumption (REC) has not been explored in South Asian countries in prior studies. However, in this analysis, the authors examine the influence of the urban population, CO2, trade openness, GDP, FDI of an economy on renewable energy consumption in the short and long term in South Asian countries. The data are analyzed using econometric tools such as descriptive statistics, stationarity tests, FMOLS model, and cointegration tests. For robustification, the authors also employ the DOLS model to explore the association. The study employs Pedroni tests and KAO tests for cointegration, while the Panel unit test (IPS), LLC, and Fisher PP are used to check either the variables are classified as I (1). The study continues with panel cointegration tests if all variables are stationary at the initial difference. The method applied in the paper is not subject to any endogeneity issue [61,62].
The association can be expressed in the following manner:
RE = f FDI , CO 2 , GDP , UP , TO
In regression form,
Y R E = α + β   1 F D I + β   2 C O 2 + β   3 G D P + β   4 U P + β   3 T O + ε
where β   1 , β   2 , β   3 all indicate coefficients, and ε is the residual. Similarly, REC means renewable energy consumption, FDI represents foreign direct investment, TO is trade openness, UP means urbanization population, GDP is a gross domestic product, and CO2 means carbon dioxide.
First of all, it is vital to know the unit root order for cointegration panel testing in the sequence. Cointegration panel testing can only be conducted between a series of the same integration order. Secondly, if the presence of panel cointegration is not confirmed, the unit-based order of the series is necessary to eliminate fake regression hazards. In this case, unit root test results help transform the series by first or second variations in stationary form. Alternatively, the use of not cointegrated nonstationary series would contribute to the estimation of biased coefficients. In order to describe the step-by-step methods of FMOLS and DOLS, it is very important to check the stationarity of variables and convert them into the first difference, which gives room to check panel cointegration tests. After confirming cointegration between variables, the next step is to employ FMOLS and DOLS to check the long-run nexus. The entire process is explained step by step below.

3.3. Stationarity Tests

Panel unit tests such as (Levin et al., 2002) [63], (Im et al., 2003) [64], Fisher ADF, and Fisher PP tests are used to determine whether the variables are stationary (1). The investigation will continue with panel cointegration tests if all of the variables are stationary at the first difference.
Δ Y   i = α i + ρ i   yi , t , 1 + + j = 1 p i β i j Δ   Y i , t , j + ϵ i t
where i = 1 , , N   a n d   t = 1 , , T .
Unit root tests are separately utilized for total cross-section units through IPS. Their test is found on the averaged statistics of augmented Dickey–Fuller (ADF) in the groups. After investigating ADF regressions individually, the mean of t-statistics for P1 from each augmented Dicky–Fuller regressions tiTi (Pi).
t ¯   NT = 1 N   i = 1 N     t i T P i β i
The t-bar is then normalized, and as N and T both go to infinity, it reverts to the standard normal distribution. The t-bar test, according to Im et al. (2014) [65], performs better than other tests when N and T are less in the panel model. They proposed a cross-sectional type of both tests for estimating panel unit root, which is used in the case of errors in diverse regressions that contain a unit time-specific component.

3.4. Panel Cointegration Tests

Unless the separation of two nonstationary series, the combination could be stationary. “Economically speaking, two variables will be co-integrated if they have a long-term or equilibrium relationship between them” [66]. Panel unit root tests are used to examine whether the sequence is stationary or nonstationary, which is the standard method to start. Cointegration analyzes if the research will continue with the analysis after the presentation of the methodology. In the nonstationary case, the series is not mean reversing, i.e., the character does not die of a shock (innovation). It is defined as the long memory of the nonstationary sequence [67]. The linear combinations of nonstationary series may cause spurious regressions to be estimated, with the estimated coefficients partially calculated [66]. In this context, it is essential in two aspects to define the presence and order of nonstationarity (unit root). First, it is important to know the unit root order for panel cointegration testing in the sequence. Cointegration panel testing can only be performed between a series of the same integration order. Secondly, if the presence of panel cointegration is not confirmed, the unit-based order of the series is necessary to eliminate fake regression hazards. In this case, unit root test results are helpful in transforming the series by taking first or second variations in stationary form. Alternatively, the use of not cointegrated nonstationary series would contribute to the estimate of spurious coefficients. To analyze the long-run link, this study uses two tests—the Padroni test and the Kao test.
  • H0: No cointegration exists;
  • H1: Cointegration exists.
If the above tests confirm that cointegration exists among the variables, this study will use the panel FMOLS and DOLS models.

3.5. Panel Full Modified OLS

After finding long-term relationships among the panel set, the size and sign of these relationships have to be assessed. In other words, only the presence of long-term relations between eight models is verified by the cointegration analysis. To allow definitions and correlations, quantitative values are essential. The OLS (fixed-effect estimator) and dynamic OLS approaches are defined as parametric approaches in the estimation literature on tables. In contrast, the OLS approach is not a parametric approach for a fully modified (FM) model. There has been no consensus among researchers in the panel root and cointegration tests as to which method of investigation is less biological and robust coefficients and works better. For instance, (Kao and Chaing, 2000) [68] explored that FMOLS might be more partial than DOLS, for more than 60 observations, and Benerjee (1999) [69] concluded that FMOLS or DOLS are equivalent asymptotically. In this analysis, the FMOLS and DOLS approaches introduced by Pedroni (2000) [70] are used to resolve this deficiency. FMOLS and DOLS approaches are established after the series that has a long-run relation through the least square method, which shows deviated results. The process FMOLS corrects the problems of autocorrelation and endogeneity by a nonparametric approach, while the autocorrelation is removed in the DOLS method.
FMOLS Pedroni’s method is constructed as follows:
β ^   F M       β = i = 1 N Ω ^   22   2   i t = 1 T     x   i t   x ^   t   2     i = 1 N     Ω ^ 11 i   1       Ω ^     22 i   1 t = 1 T     x i t     x t ¯     e i t     T   γ ^   i
e ^   i t = e   i t   Ω ^   22     1   Ω ^   21 i ,           γ ^   i = Γ ^   22 i + Ω ^   22 i   0     Ω ^     21 i   0   Ω ^     21 i   Γ ^     22 i + Ω ^     22 i     0
The covariance matrix can be broken down as Ω ^   1 = Ω ^   1 + Γ ^   i + Γ ^   i , where Ω ^   0 is the concurrent covariance matrix and Γ ^   i is a weighted summation of autocovariance. The Ω ^     i 0 denotes suitable estimator of Ω ^     i 0 .
There may be some drawbacks of these methods, which are required to be mentioned. To assess the presence of unit root, the tests to define first-generation unit root should be performed first. However, in the case of cross-section dependency, first-generation tests fail. In that case, second-generation unit root tests such as SURADF, CADF, and CIPS must be run, while Wester Lund panel cointegration tests are used for cointegration because Pedroni and Kao tests have failed and cannot capture the long-run association between variables. Cross-sectional dependence can be implemented in sense of linear panel. In economics, it means that in a situation where there is an economic shock, the associated goods and services are also affected.

3.6. Sample and Population

A population is the total number of observations available in any setting for the research or investigation. The population in this study are all south Asian countries. The study applied a random sampling technique for the data collection. The study sample includes four countries, i.e., Pakistan, India, Bangladesh, and Sri Lanka.

4. Data Estimation

4.1. Descriptive Statistics

Before statistical analysis of panel data, the selected variables are subjected to a thorough statistical examination. The authors observe (Table 2) that renewable energy in these countries during 1990 and 2014 ranges from the maximum and minimum of 70.76032 and 23.31428, respectively, with an average of 46.59536 and standard deviation of 9.730805. Further, GDP ranges from 10.22000 to 0.100000, with values of mean and standard deviation being 4.003253 and 2.586282, respectively. The mean value for the urban population is 2.574191, with a standard deviation of 1.161469. FDI has the lowest standard deviation value of 0.727059 along with variables of urban population and CO2. Moreover, the trade openness (TO) variable has the highest standard deviation of 17.46902, with a range value from a minimum of 15.50626 to a maximum of 88.63644.

4.2. Results of Panel Unit Root

It is critical to determine the order in which selected variables are integrated. For this purpose, three different tests have been applied that are LLC, Fisher PP, and IPS. These tests reveal that RE, CO2, GDP, UP, TO, and FDI are not stationary at the level of 5% level of significant. Table 3 is the details information about results of Panel Unit Root However, at a 5% significance level, all of the indicated variables become stationary while transforming into the first difference. As all of the series are nonstationary at the level but become stationary in the first difference, the Pedroni test for cointegration may be used. We also use the Kao test to check the cointegration of the variables for robustness.

4.3. Cointegration Analysis

After panel unit root tests, approaches to cointegration are used to identify the long-run association among RE and GDP, FDI, TO, UP, and CO2 please see Table 4. Hence, for this aim, the authors apply the Padroni (1999), and Kao (1999) approaches. In the case of all variables being stationary on the first difference, Padroni and KAO cointegration approaches are performed. The cointegration approach discovered by Padroni (1999) computes five within-group and one between-group cointegration statistics. The details of these tests can be found in Table 5 and Table 6. According to the Padroni technique result, the majority of the tests do not accept the null hypotheses of no cointegration and describe a long-run association amid RE and other underlying variables. The Kao test reconfirms this result. The Kao test also discovers that RE and its determinants are associated in the long run. To put it another way, it may be inferred that renewable energy consumption has a long-term steady relationship with FDI, GDP, trade openness, urban population, and CO2 emissions.

4.4. FMOLS and Panel Dynamic Least Squares Results

The results, according to FMOLS and DOLS findings, are congruent with the findings of (Muhammad Adnan Hye and Riaz, 2008) [71] and (Atif and Siddiqi, 2012) [72]. Consequently, the Carbon emission coefficient is 9.629, which is quite substantial at the 1% level. Table 7 shows FMOLS results with dependent variable as a (RE). This suggests that a 1% upsurge in carbon footprint leads to a 9.629 percent rise in green power use, both directly and indirectly. The model suggests a positive GDP coefficient, and two models have shown that there is a significant connection between EG and RE in selected South Asian nations. As these nations are not overly reliant on polluting types of energy, such as coal and fossil fuels, their recent experience of significant economic growth may lead to a surge in RE usage. The model shows that the population has a positive and significant nexus. This means that a one percent upsurge in urban population increases RE by 15.21% and is in line with the findings of the previous studies [73,74,75]. The conclusion of the same model also shows that there exists a negative and momentous nexus with renewable energy at the 5% level. One percent upsurge in FDI would decrease renewable energy by −3.36%. On the other hand, there is an insignificant nexus of trade openness with renewable energy consumption. The FMOLS and DOLS results match to a great extent in the case of South Asian countries. In other words, both FMOLS and DOLS provide the same results concerning coefficient signs as well as significance in the case of targeted countries, please check Table 8 for more details.

5. Discussion

Both FDI and renewable energy usage have a negative association. It could be because FDI does have the potential to promote economic growth by facilitating technology integration and also some spillover effects and productivity gains. Technological innovations and improved managerial skills could facilitate host countries in lowering their reliance on renewable energy. According to the study, the South Asian region is a major producer of fossil fuels, while the rest is a major importer. The positive effect of economic growth on energy usage has been demonstrated. As a result, long-term growth in renewable energy is implied as a result of economic growth. It shows a 1.096 percent increase in energy consumption as a result of a 1% rise in economic growth. The findings of the current study are consistent with Qazi and Riaz (2008) [71] and Atif and Siddiqi (2010) [72]. As a result, the CO2 emissions coefficient is 9.62, which is highly significant at the 1% level. According to the study, a 1% increase in CO2 emissions increases energy consumption by 9.62 percent, both directly and indirectly. CO2 emissions in the four South Asian nations might lead to a greater level of renewable energy consumption if governments worldwide impose taxes on fossil fuels to stimulate the development and usage of clean energy. The relationship between urban population and energy consumption is strong, implying that city people consume more energy than those who live in rural areas. It confirms a distinct link between urbanization and renewable energy consumption. According to Worldometer (2018) [76], the South Asian urban population was 49.25 percent in 2018 and is expected to rise to 63.7 percent in 2050, indicating that policies to promote smart cities, solar infrastructure, and water consumption are needed. This policy is in line with one of the SDGs, which emphasizes affordable, reliable, and modern energy access. According to FMOLS and DOLS estimates, trade openness has a negative relationship with renewable energy consumption. More trade openness in a few South Asian countries could help to reduce reliance on polluting energy sources while also lowering demand for renewables.

6. Conclusions and Policy Recommendations

Global warming is currently a severe environmental problem, mainly due to greenhouse gas emissions [77,78]. CO2 emissions differ from country to country in Asia. Countries should promote renewable energy sources to alleviate climate change [79]. This research overviews the demand of energy scenario in selected South Asian nations and finds that the use of nonfossil energy in these countries is growing. This research examines the nexus between renewable energy and FDI, trade openness (TO), urban population (UP), gross domestic product (GDP), and CO2 emissions. The stationarity of the variables was checked through LLC Fisher–ADF and Fisher–PP tests [64].
In the context of selected South Asian nations (Sri Lanka, Pakistan, India, and Bangladesh), the results of the panel cointegration model demonstrate the existence of long-run nexus among the variables. To examine the relationship between the variables, the FMOLS and DOLS methodologies were used. Our major findings from 1990 to 2019 reveal that in South Asian nations, there is a strong and negative relationship between FDI and RE, as well as a positive relationship between GDP and green energy usage. It is confirmed in two models that the GDP growth of South Asian countries has a positive association with RE consumption. Huge economic growth in these economies leads to an upsurge of RE consumption as the countries do not rally on heavily polluted types of energy such as coal and fossil fuels. Our study further finds that an upsurge in CO2 will raise RE consumption. However, the study shows a positive effect of urban population on RE consumption, while trade openness (TO) has a negative association with renewable energy consumption in the South Asian selected economies. For robustification, we performed the DOLS model. The FMOLS and DOLS results match to a great extent in the case of South Asian economies. In other words, both FMOLS and DOLS show the same results concerning coefficient signs as well as significance in the case of South Asian countries (Sri Lanka, Pakistan, India, and Bangladesh).
FDI injects funds into an economy to grow. A plethora of literature on the relationship between FDI and energy use has been widely studied, but many questions need to be answered. Foreign direct investment has an adverse upshot on RE demand, implying that FDI decreases energy consumption in a number of South Asian countries. Technological innovation and sharing, economic consequences, and productivity enlargement can all be related to FDI as a source of economic development. Aside from that, new processes and managerial skills could help host countries reduce their renewable energy consumption. As a result of such policies, renewable energy consumption in South Asian countries has increased. To begin, each country should implement policies that encourage FDI because it promotes advanced technology and capital for innovation. Furthermore, efficient energy consumption could help to reduce energy demand. Second, in order to make efficient use of resources, south Asian countries should focus on technological innovation.
Based on the empirical evidence, we conclude some policy implications concerning environmental objectives in the mentioned countries for policymakers. However, a new dataset could be used, and the model of this paper may be estimated for developing countries as future research. Moreover, the study can be employed on the developed and developing countries concerning the relation among economic development, remittance, RE in the form of renewable and fossil, FDI, and carbon emissions. One of the most significant advantages of RE is considered that it does not release toxic gases. However, it is indispensable that more money should be allocated for research and development to innovate less expensive energy resources for the safety of the environment in selected South Asian economies.
The policy ramifications of our findings are numerous. Governments all around the globe can charge taxes on fossil fuels to encourage the use of green energy to the point where the four South Asian countries’ carbon footprints lead to increased renewable energy use. They may, for example, provide incentives and subsidies of R and D credits, close to zero financing, and manufacturing tax credits to help renewable energy goods grow faster. Global trade and commerce have an expressive influence on the spread of green technologies in high-income nations, resulting in higher renewable energy consumption. As a result, economic policies should emphasize the promotion of global international commerce and the removal of trade barriers. Since trade openness could impede the use of renewable electricity, policymakers should ensure that trade between South Asian countries and trading partners includes the transfer or use of renewable energy technologies.
Furthermore, our findings help to stimulate the use of renewable electricity and economic growth. It is critical for South Asian countries to develop economic policies that promote robust growth. However, in future research, the consequences of various policy actions can be carefully investigated.

Author Contributions

Conceptualization, X.K. and F.U.; methodology, R.U.; software, F.U.K.; validation, F.U.K., M.A.; S.U.R. and F.U.; formal analysis, F.U.K.; investigation, M.A.; resources, X.K. and F.U.; data curation, R.U.; writing—original draft preparation, F.U.; writing—review and editing, X.K. and S.U.R.; visualization, S.U.R. and F.U.; supervision, R.U.; project administration, R.U., M.A. and S.U.R.; funding acquisition, X.K. All authors have read and agreed to the published version of the manuscript.

Funding

There is no financial sponsorship or assistance for these writers to publish.

Institutional Review Board Statement

Not applicable.

Informed Consent Statement

Not applicable.

Data Availability Statement

Data is available on request.

Conflicts of Interest

The authors declare that there are no conflict of interest regarding the publication of this paper.

References

  1. Shafie, S.; Mahlia, T.M.I.; Masjuki, H.; Andriyana, A. Current energy usage and sustainable energy in Malaysia: A review. Renew. Sustain. Energy Rev. 2011, 15, 4370–4377. [Google Scholar] [CrossRef]
  2. Zhao, X.; Gu, B.; Gao, F.; Chen, S. Matching Model of Energy Supply and Demand of the Integrated Energy System in Coastal Areas. J. Coast. Res. 2020, 103, 983–989. [Google Scholar] [CrossRef]
  3. Zuo, X.; Dong, M.; Gao, F.; Tian, S. The modeling of the electric heating and cooling system of the integrated energy system in the coastal area. J. Coast. Res. 2020, 103, 1022–1029. [Google Scholar] [CrossRef]
  4. Iqbal, K.M.J.; Tabish, M.I. Energy Policy in SOUTH ASIA: The Way Forward to Prompt Regional Trade; SAARC Chamber of Commerce and Industry: Islamabad, Pakistan, 2012. [Google Scholar]
  5. Li, J.; Hu, Z.; Shi, V.; Wang, Q. Manufacturer’s encroachment strategy with substitutable green products. Int. J. Prod. Econ. 2021, 235, 108102. [Google Scholar] [CrossRef]
  6. Abbas, S.Z.; Kousar, A.; Razzaq, S.; Saeed, A.; Alam, M.; Mahmood, A. Energy management in South Asia. Energy Strategy Rev. 2018, 21, 25–34. [Google Scholar] [CrossRef]
  7. Kumaran, V.V.; Ridzuan, A.R.; Khan, F.U.; Hussin, A.; Zam, Z.M. An empirical analysis of factors affecting renewable energy consumption in association of Southeast Asian Nations-4 countries. Int. J. Energy Econ. Policy 2020, 10, 48. [Google Scholar] [CrossRef]
  8. Rahman, M.M.; Velayutham, E. Renewable and non-renewable energy consumption-economic growth nexus: New evidence from South Asia. Renew. Energy 2020, 147, 399–408. [Google Scholar] [CrossRef]
  9. Lin, C.P.; Xian, J.; Li, B.; Huang, H. Transformational Leadership and Employees’ Thriving at Work: The Mediating Roles of Challenge-Hindrance Stressors. Front. Psychol. 2020, 11, 1400. [Google Scholar] [CrossRef] [PubMed]
  10. Buhari, D.Ğ.A.; Lorente, D.B.; Nasir, M.A. European commitment to COP21 and the role of energy consumption, FDI, trade and economic complexity in sustaining economic growth. J. Environ. Manag. 2020, 273, 111146. [Google Scholar]
  11. Degong, M.; Ullah, F.; Ullah, R.; Arif, M. An empirical nexus between exchange rate and China’s outward foreign direct investment: Implications for Pakistan under the China Pakistan economic corridor project. Q. Rev. Econ. Financ. 2020, in press. [Google Scholar] [CrossRef]
  12. Ma, D.; Lei, C.; Ullah, F.; Ullah, R.; Baloch, Q.B. China’s one belt and one road initiative and outward Chinese foreign direct investment in Europe. Sustainability 2019, 11, 7055. [Google Scholar] [CrossRef] [Green Version]
  13. Nasir, M.A.; Canh, N.P.; Le, T.N.L. Environmental degradation & role of financialisation, economic development, industrialisation and trade liberalisation. J. Environ. Manag. 2021, 277, 111471. [Google Scholar] [CrossRef]
  14. Nasir, M.A.; Huynh, T.L.D.; Tram, H.T.X. Role of financial development, economic growth & foreign direct investment in driving climate change: A case of emerging ASEAN. J. Environ. Manag. 2019, 242, 131–141. [Google Scholar] [CrossRef]
  15. Redmond, T.; Nasir, M.A. Role of natural resource abundance, international trade and financial development in the economic development of selected countries. Resour. Policy 2020, 66, 101591. [Google Scholar] [CrossRef]
  16. Shahbaz, M.; Nasir, M.A.; Roubaud, D. Environmental degradation in France: The effects of FDI, financial development, and energy innovations. Energy Econ. 2018, 74, 843–857. [Google Scholar] [CrossRef] [Green Version]
  17. Shahbaz, M.; Nasir, M.A.; Hille, E.; Mahalik, M.K. UK’s net-zero carbon emissions target: Investigating the potential role of economic growth, financial development, and R&D expenditures based on historical data (1870–2017). Technol. Forecast. Soc. Chang. 2020, 161, 120255. [Google Scholar]
  18. Nguyen, C.P.; Nasir, M.A. An inquiry into the nexus between energy poverty and income inequality in the light of global evidence. Energy Econ. 2021, 99, 105289. [Google Scholar] [CrossRef]
  19. Pham, N.M.; Huynh, T.L.D.; Nasir, M.A. Environmental consequences of population, affluence and technological progress for European countries: A Malthusian view. J. Environ. Manag. 2020, 260, 110143. [Google Scholar] [CrossRef] [PubMed]
  20. Shahbaz, M.; Kablan, S.; Hammoudeh, S.; Nasir, M.A.; Kontoleon, A. Environmental implications of increased US oil production and liberal growth agenda in post-Paris Agreement era. J. Environ. Manag. 2020, 271, 110785. [Google Scholar] [CrossRef]
  21. Naz, S.; Sultan, R.; Zaman, K.; Aldakhil, A.M.; Nassani, A.A.; Abro, M.M.Q. Moderating and mediating role of renewable energy consumption, FDI inflows, and economic growth on carbon dioxide emissions: Evidence from robust least square estimator. Environ. Sci. Pollut. Res. 2019, 26, 2806–2819. [Google Scholar] [CrossRef]
  22. Fan, W.; Hao, Y. An empirical research on the relationship amongst renewable energy consumption, economic growth and foreign direct investment in China. Renew. Energy 2020, 146, 598–609. [Google Scholar] [CrossRef]
  23. Akarca, A.T. Relationship between energy and GNP: A reexamination. J. Energy Dev. 2017, 5, 326–331. [Google Scholar]
  24. Shahbaz, M.; Khan, S.; Tahir, M.I. The dynamic links between energy consumption, economic growth, financial development and trade in China: Fresh evidence from multivariate framework analysis. Energy Econ. 2013, 40, 8–21. [Google Scholar] [CrossRef]
  25. Hossain, S. Multivariate Granger Causality between Economic Growth, Electricity Consumption, Exports and Remittance for the Panel of Three SAARC Countries. Glob. J. Manag. Bus. Res. 2012, 12, 41–54. [Google Scholar]
  26. Mudakkar, S.R.; Zaman, K.; Shakir, H.; Arif, M.; Naseem, I.; Naz, L. Determinants of energy consumption function in SAARC countries: Balancing the odds. Renew. Sustain. Energy Rev. 2013, 28, 566–574. [Google Scholar] [CrossRef]
  27. He, X.; Zhang, T.; Xue, Q.; Zhou, Y.; Wang, H.; Bolan, N.S.; Jiang, R.; Tsang, D.C.W. Enhanced adsorption of Cu (II) and Zn (II) from aqueous solution by polyethyleneimine modified straw hydrochar. Sci. Total Environ. 2021, 778, 146116. [Google Scholar] [CrossRef]
  28. Zhu, B.; Ma, S.; Xie, R.; Chevallier, J.; Wei, Y.M. Hilbert spectra and empirical mode decomposition: A multiscale event analysis method to detect the impact of economic crises on the European carbon market. Comput. Econ. 2018, 52, 105–121. [Google Scholar] [CrossRef]
  29. Hu, P.; Cao, L.; Su, J.; Li, Q.; Li, Y. Distribution characteristics of salt-out particles in steam turbine stage. Energy 2020, 192, 116626. [Google Scholar] [CrossRef]
  30. Zhang, Z.; Liu, S.; Niu, B. Coordination mechanism of dual-channel closed-loop supply chains considering product quality and return. J. Clean. Prod. 2020, 248, 119273. [Google Scholar] [CrossRef]
  31. Alper, A.; Oguz, O. The role of renewable energy consumption in economic growth: Evidence from asymmetric causality. Renew. Sustain. Energy Rev. 2016, 60, 953–959. [Google Scholar] [CrossRef]
  32. Zhang, D.; Wang, J.; Lin, Y.; Si, Y.; Huang, C.; Yang, J.; Huang, B.; Li, W. Present situation and future prospect of renewable energy in China. Renew. Sustain. Energy Rev. 2017, 76, 865–871. [Google Scholar] [CrossRef]
  33. Chen, C.; Pinar, M.; Stengos, T. Renewable energy consumption and economic growth nexus: Evidence from a threshold model. Energy Policy 2020, 139, 111295. [Google Scholar] [CrossRef]
  34. Zhou, B.; Li, W.; Chan, K.W.; Cao, Y.; Kuang, Y.; Liu, X.; Wang, X. Smart home energy management systems: Concept, configurations, and scheduling strategies. Renew. Sustain. Energy Rev. 2016, 61, 30–40. [Google Scholar] [CrossRef]
  35. Li, X.; Li, Z.; Jia, T.; Yan, P.; Wang, D.; Liu, G. The sense of community revisited in Hankow, China: Combining the impacts of perceptual factors and built environment attributes. Cities 2021, 111, 103108. [Google Scholar] [CrossRef]
  36. Omri, A.; Nguyen, D.K. On the determinants of renewable energy consumption: International evidence. Energy 2014, 72, 554–560. [Google Scholar] [CrossRef]
  37. Akar, B.G. The Determinants of Renewable Energy Consumption: An Empirical Analysis for the Balkans. Eur. Sci. J. ESJ 2016, 12, 594–607. [Google Scholar] [CrossRef]
  38. Omri, A.; Daly, S.; Nguyen, D.K. A robust analysis of the relationship between renewable energy consumption and its main drivers. Appl. Econ. 2015, 47, 2913–2923. [Google Scholar] [CrossRef]
  39. Chen, Y. Factors influencing renewable energy consumption in China: An empirical analysis based on provincial panel data. J. Clean. Prod. 2018, 174, 605–615. [Google Scholar] [CrossRef]
  40. Lv, X.; Liu, Y.; Xu, S.; Li, Q. Welcoming host, cozy house? The impact of service attitude on sensory experience. Int. J. Hosp. Manag. 2021, 95, 102949. [Google Scholar] [CrossRef]
  41. Yuan, H.; Wang, Z.; Shi, Y.; Hao, J. A dissipative structure theory-based investigation of a construction and demolition waste minimization system in China. J. Environ. Plan. Manag. 2021, 1–27. [Google Scholar] [CrossRef]
  42. Doytch, N.; Narayan, S. Does FDI influence renewable energy consumption? An analysis of sectoral FDI impact on renewable and non-renewable industrial energy consumption. Energy Econ. 2016, 54, 291–301. [Google Scholar] [CrossRef]
  43. Lee, J.W. The contribution of foreign direct investment to clean energy use, carbon emissions and economic growth. Energy Policy 2013, 55, 483–489. [Google Scholar] [CrossRef]
  44. Khan, M.A.; Khan, M.Z.; Zaman, K.; Irfan, D.; Khatab, H. RETRACTED: Questing the three key growth determinants: Energy consumption, foreign direct investment and financial development in South Asia. Renew. Energy 2014, 68, 203–215. [Google Scholar] [CrossRef]
  45. Mielnik, O.; Goldemberg, J. Foreign direct investment and decoupling between energy and gross domestic product in developing countries. Energy Policy 2002, 30, 87–89. [Google Scholar] [CrossRef]
  46. Hübler, M.; Keller, A. Energy savings via FDI? Empirical evidence from developing countries. Environ. Dev. Econ. 2009, 15, 59–80. [Google Scholar] [CrossRef] [Green Version]
  47. Sadorsky, P. The impact of financial development on energy consumption in emerging economies. Energy Policy 2010, 38, 2528–2535. [Google Scholar] [CrossRef]
  48. Chang, S.-C. Effects of financial developments and income on energy consumption. Int. Rev. Econ. Financ. 2015, 35, 28–44. [Google Scholar] [CrossRef] [Green Version]
  49. Çoban, S.; Topcu, M. The nexus between financial development and energy consumption in the EU: A dynamic panel data analysis. Energy Econ. 2013, 39, 81–88. [Google Scholar] [CrossRef]
  50. Sadorsky, P. Financial development and energy consumption in Central and Eastern European frontier economies. Energy Policy 2011, 39, 999–1006. [Google Scholar] [CrossRef]
  51. Alam, A.; Malik, I.A.; Abdullah, A.B.; Hassan, A.; Awan, U.; Ali, G.; Zaman, K.; Naseem, I. Does financial development contribute to SAARC’s energy demand? From energy crisis to energy reforms. Renew. Sustain. Energy Rev. 2015, 41, 818–829. [Google Scholar] [CrossRef]
  52. Dube, S. Foreign direct investment and electricity consumption on economic growth: Evidence from South Africa. Econ. Int. 2009, 62, 175–200. [Google Scholar]
  53. He, W.; Gao, G.; Wang, Y. The relationship of energy consumption, economic growth and foreign direct investment in Shanghai. Adv. Appl. Econ. Financ. 2012, 507, 507–512. [Google Scholar]
  54. Alshamsi, K.H.; Azam, M. The impact of inflation and GDP per capita on foreign direct investment: The case of United Arab Emirates. Invest. Manag. Financ. Innov. 2015, 12, 132–141. [Google Scholar]
  55. Yahiaoui, N.; Chéron, J.J.; Ravelomanantsoa, S.; Hamza, A.A.; Petrousse, B.; Jeetah, R.; Poussier, S. Genetic diversity of the Ralstonia solanacearum species complex in the Southwest Indian Ocean islands. Front. Plant Sci. 2017, 8, 2139. [Google Scholar] [CrossRef] [PubMed] [Green Version]
  56. Sadorsky, P. Renewable energy consumption, CO2 emissions and oil prices in the G7 countries. Energy Econ. 2009, 31, 456–462. [Google Scholar] [CrossRef]
  57. Sadorsky, P. Renewable energy consumption and income in emerging economies. Energy Policy 2009, 37, 4021–4028. [Google Scholar] [CrossRef]
  58. Ben Aïssa, M.S.; Ben Jebli, M.; Ben Youssef, S. Output, renewable energy consumption and trade in Africa. Energy Policy 2014, 66, 11–18. [Google Scholar] [CrossRef] [Green Version]
  59. Rasoulinezhad, E.; Saboori, B. Panel estimation for renewable and non-renewable energy consumption, economic growth, CO2 emissions, the composite trade intensity, and financial openness of the commonwealth of independent states. Environ. Sci. Pollut. Res. 2018, 25, 17354–17370. [Google Scholar] [CrossRef]
  60. Marques, A.C.; Fuinhas, J.A. Is renewable energy effective in promoting growth? Energy Policy 2012, 46, 434–442. [Google Scholar] [CrossRef]
  61. Ullah, S.; Akhtar, P.; Zaefarian, G. Dealing with endogeneity bias: The generalized method of moments (GMM) for panel data. Ind. Mark. Manag. 2018, 71, 69–78. [Google Scholar] [CrossRef]
  62. Ullah, S.; Zaefarian, G.; Ullah, F. How to use instrumental variables in addressing endogeneity? A step-by-step procedure for non-specialists. Ind. Mark. Manag. 2020. [Google Scholar] [CrossRef]
  63. Levin, A.; Lin, C.-F.; Chu, C.-S.J. Unit root tests in panel data: Asymptotic and finite-sample properties. J. Econ. 2002, 108, 1–24. [Google Scholar] [CrossRef]
  64. Im, K.S.; Pesaran, M.; Shin, Y. Testing for unit roots in heterogeneous panels. J. Econ. 2003, 115, 53–74. [Google Scholar] [CrossRef]
  65. Meng, M.; Im, K.S.; Lee, J.; Tieslau, M.A. More powerful LM unit root tests with non-normal errors. In Festschrift in Honor of Peter Schmidt; Springer: New York, NY, USA, 2014; pp. 343–357. [Google Scholar]
  66. Gujarati, D.N.; Porter, D.C. Basic Econometrics; McGrew Hill Book, Co.: Singapore, 2003. [Google Scholar]
  67. Zhu, T.; Harris, J.M.; Biondi, B. Q-compensated reverse-time migration. Geophysics 2014, 79, S77–S87. [Google Scholar] [CrossRef] [Green Version]
  68. Kao, C.; Chiang, M.-H. On the estimation and inference of a cointegrated regression in panel data. Econom. Netw. 2004, 15, 179–222. [Google Scholar] [CrossRef] [Green Version]
  69. Leigh, J.; Johnson, A.E.; DeFanti, T.A.; Brown, M.; Ali, M.D.; Bailey, S.; Banerjee, A.; Benerjee, P.; Chen, J.; Curry, K.; et al. A review of tele-immersive applications in the CAVE research network. In Proceedings of the IEEE Virtual Reality (Cat. No. 99CB36316), Houston, TX, USA, 13–17 March 1999; pp. 180–187. [Google Scholar]
  70. Pedroni, P. Fully modified OLS for heterogeneous cointegrated panels. In Nonstationary Panels, Panel Cointegration, and Dynamic Panels; Emerald Group Publishing Limited: Bingley, UK, 2001. [Google Scholar]
  71. Hye, Q.M.A.; Riaz, S. Causality between energy consumption and economic growth: The case of Pakistan. Lahore J. Econ. 2008, 13, 45–58. [Google Scholar]
  72. Atif, S.M.; Siddiqi, M.W. The Electricity Consumption and Economic Growth Nexus in Pakistan: A New Evidence. 2010. Available online: https://papers.ssrn.com/sol3/papers.cfm?abstract_id=1569580 (accessed on 2 March 2018).
  73. Batliwala, S.; Reddy, A.K. Energy Consumption and Population. Int. Energy Initiat. 2010, 34, 1–10. [Google Scholar]
  74. Huang, H.; Rong, H.; Li, X.; Tong, S.; Zhu, Z.; Niu, L.; Teng, M. The crystal structure and identification of NQM1/YGR043C, a transaldolase from Saccharomyces cerevisiae. Proteins Struct. Funct. Bioinform. 2008, 73, 1076–1081. [Google Scholar] [CrossRef]
  75. Islam, T.; Khan, S.U.R.; Ahmad, U.N.B.U.; Ali, G.; Ahmed, I.; Bowra, Z.A. Turnover Intentions: The Influence of Perceived Organizational Support and Organizational Commitment. Procedia Soc. Behav. Sci. 2013, 103, 1238–1242. [Google Scholar] [CrossRef] [Green Version]
  76. Worldometer (2018): Nigeria Population. Available online: http://www.worldometers.info/world-population/nigeriapopulation/ (accessed on 2 March 2018).
  77. Wei, W.; Li, J.; Chen, B.; Wang, M.; Zhang, P.; Guan, D.; Meng, J.; Qian, H.; Cheng, Y.; Kang, C.; et al. Embodied greenhouse gas emissions from building China’s large-scale power transmission infrastructure. Nat. Sustain. 2021, 1–9. [Google Scholar] [CrossRef]
  78. Xu, X.; Xia, Z.; Liu, Y.; Liu, E.; Müller, K.; Wang, H.; Luo, J.; Wu, X.; Beiyuan, J.; Fang, Z.; et al. Interactions between methanotrophs and ammonia oxidizers modulate the response of in situ methane emissions to simulated climate change and its legacy in an acidic soil. Sci. Total Environ. 2021, 752, 142225. [Google Scholar] [CrossRef] [PubMed]
  79. Zhang, T.; Wu, X.; Shaheen, S.M.; Rinklebe, J.; Bolan, N.S.; Ali, E.F.; Li, G.; Tsang, D.C. Effects of microorganism-mediated inoculants on humification processes and phosphorus dynamics during the aerobic composting of swine manure. J. Hazard. Mater. 2021, 416, 125738. [Google Scholar] [CrossRef] [PubMed]
Table 1. Measurement of Variables.
VariableDescription TypeMeasurement Technique and Proxy
RERenewable Energy ConsumptionDV% of total final energy consumption
FDIForeign Direct InvestmentIVNet inflow a % of GDP
UPUrban population IVUrban population growth (annual %)
TOTrade opennessIVExports + imports/GDP
CO2Carbon dioxideIV(metric tonnes per capita)
GDPGross domestic productIVGross domestic product
Table 2. Descriptive Statistics.
VariablesREGDPFDITOUPCO2
Mean46.595364.0032531.04976942.182942.5741911.545186
Median46.518124.5064080.91347537.748692.7280530.740280
Maximum70.7603210.220003.66832388.636444.8875007.135673
Minimum23.314280.1000000.00449115.506260.0465870.123995
Std. Dev. 9.7308052.5862820.72705917.469021.1614691.839591
Skewness−0.1720800.0599701.2281330.936492−0.5007991.665012
Kurtosis3.3799311.9936605.1939683.0092112.2596444.650763
Jarque-Bera1.313972
0.518411
5.135527
0.076707
54.23369
0.000000
17.54079
0.000155
7.756621
0.020686
69.07043
0.000000
Table 3. Results of Panel Unit Root.
Variablesl(0)I(1)
LLCIPSPPFLLCIPSPPF
RE−1.88302−0.135046.03117−6.29743−4.3156672.9788
−0.1298−0.4463−0.6437000
GDP−1.29256−1.2692512.5698−10.2861 −10.025798.7446
−0.0981−0.1022−0.1275000
FDI−2.34333−3.9355631.4435−7.24142−8.34691−7.86036
−0.0796−0.0621−0.0601000
TO−0.470420.238215.47797−7.97700−7.30568−6.42491
−0.319−0.5941−0.7055000
UP−1.00713−0.252909.00348−4.23632−5.2555632.6778
−0.1569−0.4002−0.34200−0.0001
CO2−0.28429−0.632358.42147−6.48526−7.5773464.8688
−0.3881−0.2636−0.3934000
Table 4. Cointegration Analysis.
Pedroni Cointegration Approach
StatisticProb.W. StatisticProb.
Panel v-Statistic1.9036400.02852.1210210.0170
Panel-rho-Statistic2.5324030.99432.2056440.9863
Panel-PP-Statistic0.3042460.61950.2838110.0117
Panel-ADF-Statistic−2.0939580.0181−1.8129000.0349
Table 5. Group Statistics.
Group Statistics
StatisticProb.
Group-rho-Statistic2.9150810.9982
Group-PP-Statistic−0.2932290.3847
Group-ADF-Statistic−2.1298530.0166
Table 6. Kao-Residual Cointegration Approach.
Kao-Residual Cointegration Approach
T-StatisticProb.
ADF−2.0286860.0212
Table 7. FMOLS Table.
Method: FMOLS Dependent Variable (RE)
VariableCoefficientStd. Errort-StatisticProb.
TO−0.0774920.084936−0.9123550.3636
FDI−3.3683871.645419−2.0471310.0430
GDP1.0960720.06863815.968840.0000
UP15.215051.11448113.652140.0000
CO29.6292093.1133863.0928410.0251
Table 8. Panel Dynamic Least Squares (DOLS) Dependent Variable (RE).
Method: Panel Dynamic Least Squares (DOLS) Dependent Variable (RE)
VariableCoefficientStd. Errort-StatisticProb.
TO−0.1857480.347030−0.5352520.5942
FDI−9.8732364.080039−2.4198880.0179
GDP1.6638110.8686251.9154540.0492
UP9.7860891.6436435.9539020.0000
CO232.9112312.016472.7388420.0077
Publisher’s Note: MDPI stays neutral with regard to jurisdictional claims in published maps and institutional affiliations.

