
A Critical Look at Coulomb Counting Approach for State of Charge Estimation in Batteries


1
Department of Electrical and Computer Engineering, University of Windsor, Windsor, ON N9B 3P4, Canada
2
Department of Electrical and Computer Engineering, University of Connecticut, Storrs, CT 06269, USA
*
Author to whom correspondence should be addressed.
Energies 2021, 14(14), 4074; https://doi.org/10.3390/en14144074
Submission received: 4 June 2021
/
Revised: 24 June 2021
/
Accepted: 29 June 2021
/
Published: 6 July 2021
(This article belongs to the Special Issue Enhancement of Battery Lifespan, Safety, and Performance through Estimation and Control Theory and Algorithms)
Abstract
:In this paper, we consider the problem of state-of-charge estimation for rechargeable batteries. Coulomb counting is a well-known method for estimating the state of charge, and it is regarded as accurate as long as the battery capacity and the beginning state of charge are known. The Coulomb counting approach, on the other hand, is prone to inaccuracies from a variety of sources, and the magnitude of these errors has not been explored in the literature. We formally construct and quantify the state-of-charge estimate error during Coulomb counting due to four types of error sources: (1) current measurement error; (2) current integration approximation error; (3) battery capacity uncertainty; and (4) timing oscillator error/drift. It is demonstrated that the state-of-charge error produced can be either time-cumulative or state-of-charge-proportional. Time-cumulative errors accumulate over time and have the potential to render the state-of-charge estimation utterly invalid in the long term.The proportional errors of the state of charge rise with the accumulated state of charge and reach their worst value within one charge/discharge cycle. The study presents methods for reducing time-cumulative and state-of-charge-proportional mistakes through simulation analysis.
1. Introduction
Rechargeable batteries are becoming an integral part of the future energy strategy of the globe. The use of rechargeable batteries is steadily on the rise in wide-ranging applications, such as electric vehicles, household equipment, robotics, power equipment, consumer electronics, aerospace, and renewable energy storage systems. Accurate estimation of a battery’s state of charge (SOC) is crucial for battery management that is safe, efficient, and reliable [1,2,3,4].
It was found that there are three different methods for the SOC estimation of the lithium–ion battery [5]: (i) The current-based method. (ii) The voltage-based method. (iii) The fusion of voltage/current-based approaches. The fusion-based approaches seek to retain the benefits of both voltage-based and current-based approaches by employing non-linear filters, such as the extended Kalman filter, in order to fuse the information obtained through the voltage and current measurements.
The voltage-based SOC estimation approach is basically a table look-up method. Battery terminals’ voltage is matched with the SOC according to the OCV-SOC characterization curve [6]. In more generic terms, we have the following:
where the function refers to the open circuit voltage model that relates the OCV of the battery to SOC and accounts for the voltage-drop within the battery cell, due to hysteresis and relaxation effects. Challenges in voltage-based SOC estimation arise due to the fact that the functions and are usually non-linear and that there is a great amount of uncertainty as to what those functions might be [6,7]. For instance, the parameters can be modeled through electrical equivalent circuit models (ECM) [8,9] or electrochemical models [10], each of which can result in numerous reduced-order approximations. The voltage based approach suffers from the following three types of errors:
- (i)
- OCV-SOC modeling error. The OCV-SOC relationship of a battery can be approximated through various models [6]: linear model, polynomial model and combined models are a few examples. Reducing the OCV-SOC modeling error is an ongoing research problem—in [11], a new modeling approach was reported that resulted in the “worst case modeling error” of about 10 mV. It must be mentioned that the OCV modeling error is not identical in all voltage regions of the battery.
- (ii)
- (iii)
- Voltage measurement error. Every voltage measurement system comes with errors; this translates into a SOC estimation error.
In order to reduce the effect of uncertainties in voltage-based SOC estimation, it is often suggested to rest the battery before taking the voltage measurement for SOC lookup [9]—when the current is zero for sufficient time the voltage-drop also approaches zero. However, all the other sources of errors mentioned above (OCV-SOC modeling error, hysteresis, and voltage measurement error) cannot be eliminated by resting the battery.
Coulomb counting method is the well-known term that is used for the current-based method [9]. In this method, SOC can be calculated as the ratio between the remaining Coulombs and the battery capacity that is assumed to be known. The Coulomb counting approach to SOC estimation can be approximated as follows (see Section 2 for details):
where indicates the SOC at time k, is the sampling time, is the current through the battery at the at time k, and is the battery capacity in ampere hours (Ah).
The Coulomb counting method does not require offline OCV-SOC characterization [6]; however, it is susceptible to the following sources of errors:
- Initial SOC: This methods requires initial SOC to start with.
- Current measurement error: The measurement error will affect the computed SOC.
- Current integration error: The Coulomb counting method uses a very simplified approximation to integration, which will result in errors.
- Timing oscillator error: Any error in the timing oscillator will affect the computed SOC.
The fusion-based approach seeks to retain the best features of both voltage and current-based approaches. This is achieved by creating the following state-space model:
where (3) is the process model that is derived from the Coulomb counting Equations (2), (4) is the measurement model that is is derived from the voltage measurement Equation (1), is the process noise, is the measured voltage across the battery terminals, is the OCV characterization function [6] that represents the battery voltage as a function of SOC, is the voltage drop due to impedance and hysteresis within the battery, and is the measurement noise corresponding to the model (4). The goal from the above state-space model is to recursively estimate the SOC, given the voltage and current measurements.
The state-space model described in (3) and (4) is non-linear, due to the OCV-SOC model and the different approximate representations for voltage-drop models [7]. If the models are known, a non-linear filter, such as the extended Kalman filter [16], can yield a near-accurate estimate of SOC in real time. The filter selection is based on the following model assumptions:
- (I)
- Kalman filter. Here, the following assumptions need to be met. The state-space model is known and linear, i.e., the functions and in (4) are linear in terms of SOC, and the ‘parameter’ and the current in (4) are known with negligible uncertainty in them. The process and measurement noises, and , respectively, are i.i.d. Gaussian with known mean and variance.
- (II)
- Extended/unscented Kalman filter. Here, only the linearity assumption is relaxed, i.e., the functions and in (4) can be non-linear in terms of SOC. All other assumptions for the Kalman filter need to be met, i.e., the model parameters and the noise statistics need to be perfectly known and the process and measurement noises need to be i.i.d. Gaussian with known mean and variance.
- (III)
- Particle filter. Compared to the Kalman filter assumptions, the particle filter allows to relax both linear and Gaussian assumptions. Here, the and can be non-linear, and both process and measurement noise statistics can be non-Gaussian. It needs to be re-emphasized that, similar to the cases in (I) and (II) above, the models and and the parameters of the noise statistics need to be perfectly known.
It is important to note that the recursive filters discussed above all assume that the model, which consists of the functions , and the parameters of the noise statistics, is perfectly known. However, we discussed several ways earlier in this section in which the known-model assumptions can be violated. Indeed, the “known model” assumptions can be violated through any of the following ten ways:
- (a)
- Five sources of error in defining the process model (3), namely, the initial SOC error, current measurement error, current integration error, battery capacity error, and timing oscillator error.
- (b)
- Three sources of error in defining the measurement model (4), namely, the OCV-SOC modeling error, voltage-drop modeling and its parameter estimation error, and voltage measurement error.
- (c)
- The process noise : The statistical parameters of the process noise should be computed based on the knowledge about the statistics of the five error sources in (a) above.
- (d)
- The measurement noise : The statistical parameters of the measurement noise should be computed based on the knowledge about the statistics of the three error sources in (b) above.
The focus of the present paper is to develop detailed insights about the error sources (a) and (c), above. In a separate work [17], we discuss the noise sources (b) and (d) in detail.
1.1. Background
The classical estimation theory [16] states that when the linear–Gaussian conditions and the known model assumptions (stated under (I) in Section 1) are met, the SOC estimate will be efficient, i.e., the variance of the SOC estimation error will be equal to that of the posterior Cramér–Rao lower bound (PCRLB), which is proved to be the theoretical bound; under non-Bayesian conditions, this limit is known just as the Cramér–Rao lower bound (CRLB), that is, the PCRLB or CRLB can be used as a gold standard on performance. In this regard, some prior works in the literature [18,19,20] derived the CRLB as a measure of performance evaluation. These approaches were developed to estimate the ECM parameters of the battery; the ECM parameters are involved in the measurement model for the SOC in (1). In addition to the use in SOC estimation, ECM parameter estimation has other important applications in a battery management system. The literature review suggests that there are several model-based SOC estimation methods that exist, which are already explored by different researchers [21,22,23].
Several other approaches attempted to theoretically derive the error bound on SOC estimation separately and jointly with ECM parameter identification. In [24], a RLS-based parameter identification technique with forgetting factor was presented in which a sinusoidal current excitation made of two sinusoid component was used. According to the results, the CRLB of resistance decrease with the increase of frequencies and thus the large frequency components are preferable for higher accuracy in parameter estimation; similar observations were reported in [25]. The influence of voltage noise, current amplitude and frequency on parameter identification was illustrated in [26], where a sinusoidal excitation current was used. Here, the CRLB of the battery equivalent circuit model was derived using Laplace transform; the authors found no influence of the frequency of the excitation signal on the single-parameter identification of ohmic resistance and reported that reducing the voltage measurement noise and increasing current amplitude improves the identification accuracy. A posterior CRLB was developed to quantify the accuracy for EKF-based ECM parameter identification in which a second order battery ECM was adopted in [27]. The CRLB was determined numerically with the help of sinusoidal current excitation. It showed that the CRLB of the ohmic resistance estimation decreases with the increase of current amplitude and frequency as well. Unlike [27], the CRLB was derived in analytic expression in discrete time and Laplace transform in [28] in which a (known) sinusoidal current input was considered. A non-linear least-square based electrode parameter (e.g., electrode capacity) identification method was presented in [18] in which only the terminal voltage was considered to contain the measurement noise. This CRLB was derived and used to quantify the error bound of the estimator to determine the uncertainty of the parameter estimation. The parameter estimates were interpreted with the help of analytically derived confidence levels. Here, the noise was assumed to be Gaussian white noise with standard deviation 10 mV in the demonstrations. In [19], the battery SOC estimation error was derived theoretically as a function of sensor noises; the proposed approach considers measurement noise in both the current and voltage. The effect of different components involved in SOC estimation were demonstrated, using a parameter sensitivity analysis in [29], and the effect of bias and noise were reported in [30] as well.
The five sources of error in Coulomb counting have been recognized in the literature and some remedies were proposed. In [31], the initial SOC was modeled as a function of the terminal voltage, temperature and the relaxation time. The authors in [32] proposed the use of neural networks to gain a better estimate of the initial SOC. In [33], a data fusion approach was proposed, where a H-infinity filter was used to minimize the error in the initial SOC estimate. In the battery fuel gauge evaluation approach proposed in [15], the uncertainty in initial SOC error was taken into account and the OCV lookup method [6,34] was introduced as a performance metric. It was pointed out in [35] that the accuracy of the OCV lookup method might be affected with battery age. The effect of current integration error was also recognized in the literature and remedies were proposed: in [32,36], a model-based approach was proposed to reduce current integration error; in [37], it was proposed to reset Coulomb counting when the present SOC is known when the battery is fully charged/discharged, where the “fully-charged” and “fully-empty” conditions were declared, based on the measured voltage across battery terminals; here, the authors propose a way to minimize the error due to the voltage-only-based declaration of these two conditions. Many articles recognize the imperfect knowledge of battery capacity and ways to estimate them: a neural-network-based approach to battery capacity estimation was proposed in [32]; an approach based on the charge/discharge currents and the estimated SOC for battery capacity estimation was proposed in [38]; the authors in [37] presented an idea of battery capacity estimation when SOC of battery is 100% or 0%, which can be known easily when the terminal voltage reaches the max./min. voltage, respectively; in [13], a state-space model was introduced to track battery capacity where measurements can be incorporated using multiple means, including when the battery is at rest. None of the existing works explored the effect of timing oscillator error in the estimated SOC.
In summary, the importance of theoretical performance derivation and analysis is recognized in the literature, particularly in the above-detailed publications. Considering the nature of the complexity of the real-world measurement model, the existing literature represents only a small fraction of what needs to be done for a complete understanding of the battery SOC estimation problem. For example, even though the effect of some of the five sources of Coulomb counting error (summarized earlier in this section) were noted in the literature, it was not fully incorporated into the fusion-based SOC tracking approaches. In other word, the process noise in (3) was not accurately defined in the literature. Table 1 summarizes how the process noise is defined in some notable works in the literature. Setting arbitrary values to the process noise will have the following adverse effect on the filter outcome:
- Too-small process noise: When the process noise is smaller than the reality, the filter will compute the weights such that the measurements are ignored.
- Too-large process noise: When the process noise is larger than the reality, the variance of the filtered estimates will be high.Consequently, the benefits of using a filter will be lost.
Based on Table 1, it is clear that there is a knowledge gap about the process noise in the recursive-filtering approach to SOC tracking. The focus of this paper is to derive accurate models for SOC tracking; in particular, we focus on the process model only. Similar discussions about one of the possible measurement models can be found in [17]. Model validation strategies and analyses using practical data are left for future discussion.

Table 1.
Process noise in SOC tracking.
| Publication | Filtering Method | Definition of Process Noise |
|---|---|---|
| [39] (page 279) | Extended Kalman filter | “small” |
| [40] (page 1370) | Unscented Kalman filter | “stochastic process noise or disturbance that models some unmeasured input which affects the state of the system” |
| [41] (page 7) | Kalman filter | “process noise” |
| [42] (page 334) | Frisch scheme based bias compensating recursive least squares | “zero-mean white noise with variance ” |
| [43] (page 8954) | Extended Kalman filter | “zero-mean white Gaussian process noise” |
| [44] (pages 13,205, 13,206) | Adaptive unscented Kalman filter | “zero-mean Gaussian white sequence”; “in practice, the mean and covariance of process noise is frequently unknown or incorrect” |
| [45] (page 4610) | Extended Kalman filter | “The EKF assumes knowledge of the measurement noise statistics. Moreover, any uncertainty in the system’s model will degrade the estimator’s performance” |
| [46] (page 10) | Correntropy unscented Kalman filter | “CUKF assumes that the process noise covariance and measurement noise are known. They are, however, in real time in nature and may not be obtained in advance in practice. As a result, they should be kept up to date with changes in time based on prior information.” |
| [47] (page 166,660) | Adaptive weighting Cubature particle filter | “” where is the covariance matrix. “In the process of practical application, the statistical characteristics of the process noise and measurement noise of the system are highly random and vulnerable to external environmental factors.” |
| [48] (page 8614) | Extended Kalman filter | “Model bias is one of the existing inefficiency of the model in representation of real physical systems because of the supposition and simplifications.” |
| [49] (pages 5, 8) | Adaptive square-root sigma-point Kalman filter | “ refers to process noise, which represents unknown disturbances that affect the state of the system”; “usually, covariance matrices are constant parameters determined offline before the estimation process begins. In practice, the characteristics of noises vary depending on the choice of sensors and the operating conditions.” |
1.2. Summary of Contributions
A large portion of the existing work related to battery SOC estimation in the literature lack theoretical validation. Almost all the work that employ some form of theoretical validation are summarized in Section 1.1—the number of papers in this section is insignificant compared to the number of publication in SOC estimation in the past year alone. This indicates the need to focus more on theoretical performance analyses and to understand where the remaining challenges lie in battery SOC estimation.
In this paper, we developed a mathematical model to theoretically compute the accumulated SOC error as a result of current measurement error, current integration approximation, battery capacity uncertainty, and timing oscillator error. These four sources of error are identified in [50]. In this paper, we provided the formulas for exact statistical error parameters (mean and standard deviation) that can be used to improve all existing SOC estimation methods. As such, the contributions of this paper are summarized as follows:
- Exact computation of Coulomb counting error. With realistic numerical examples, we demonstrate the errors and their severity during Coulomb counting. Further, we derive mathematical formulas to determine these errors such that the statistical confidence in the SOC estimates can be explicitly stated.
- Five different error sources in Coulomb counting are analyzed. We derive the exact standard deviation and mean error (with time), due to all five possible sources of errors during Coulomb counting: current measurement error, current integration error, battery capacity uncertainty, charge/discharge efficiency uncertainty, and timing oscillator error. It is demonstrated that the resulting error will fall into one of the following two categories: time-proportional errors and SOC-proportional errors.
- Time proportional errors increase indefinitely. We demonstrate that the standard deviation of the time-proportional error approaches infinity as the number of samples reaches infinity.
- State of charge proportional errors reach worst case within one cycle. It is shown that the errors due to battery capacity uncertainty and timing oscillator drifts reach their peak values within one discharge/charge cycle. In addition, the standard deviation of these errors vary with the accumulated SOC. The proposed exact model can be used to improve the SOC estimation by incorporating them in state-space models, e.g., the proposed model can be used to improve the extended Kalman filter-based SOC estimation techniques [3].
- Accurate state-space models for real-time state-of-charge estimation. The models were presented in a way that their applicability in state-space models is explicit. The proposed models can be used to improve the accuracy of virtually all online filtering approaches, i.e., those based on extended Kalman filter, unscented Kalman filter, particle filter, etc., that were employed for real-time SOC estimation.
The effect of the initial SOC error will remain as a bias in the Coulomb counting process and as such, it does not require any further analysis in this paper. Some initial versions of the derivations presented in this paper were reported in [51]; the present paper expands all derivations presented [50] toward a generalized state-space model.
It must be noted that all the contributions listed above will translate into an accurate process noise model in the state-space model for recursive SOC tracking. It will be shown later in this paper that the process noise variance is a significantly time-varying quantity—something never considered in the literature before. Further, even though Coulomb counting is considered an outdated approach to SOC estimation, it is still widely used in practical implementations [14,15,52]. For example, whenever the fusion based approaches encounter failures, due to unexpected measurements and errors, etc., the battery management systems are usually programmed to fall back to the Coulomb counting method as an alternative. Hence, the paper is written in a way that quantifies the error in computed SOC from Coulomb counting. Later, we discuss how the findings in this paper will be used to derive an accurate model for voltage-current fusion-based SOC tracking, using recursive filters.
1.3. Organization of the Paper
The remainder of this paper is organized as follows: Section 2 formally introduces Coulomb counting and identifies the four different error sources. The accumulated error in SOC due to current measurement error, current integration approximation, battery capacity uncertainty, and timing oscillator drift, are derived and analyzed in Section 3.1, Section 3.2, Section 3.3 and Section 3.5, respectively. A summary of individual uncertainties and their effect on the counted Coulombs is presented in Section 4. In Section 5, some practical ways are discussed as to how individual effects can be combined in the process model of recursive filter implementation for SOC tracking. Section 6 deals with the numerical analysis of the effect of current measurement error, current integration error and battery capacity uncertainty. Finally, the paper is concluded in Section 7.
2. Problem Definition
The Coulomb counting Equation is [8]
where is the Coulomb counting efficiency defined as follows:
t denotes the unit of time in seconds, is the current in amperes (A) through the battery at time t, denotes SOC at time instant , shows the SOC at time interval t, and denotes the battery capacity in ampere hours (Ah).
A discretized version of the Coulomb counting equation is given as follows:
where denotes the SOC at time instant , and shows the measured current at time instant . Approximation is done using the rectangular (backward difference) method for the integration in (7) as follows:
where , the Coulomb counting equation, is further simplified as follows: [8,9]
The Coulomb counting Equation (9) suffers from the following sources of errors:
- Measurement error in the current .
- Error because of the approximation used for the integration in (8).
- Unreliability in the battery capacity knowledge .
- Uncertainty in the knowledge of the Coulomb counting efficiency .
- Measurement error in sampling time .
In the next four sections of this paper, we provide detailed mathematical discussions about these four types of errors.
3. Individual Uncertainty Analysis
3.1. Effect of Current Measurement Error
The error in measured current can is modeled as follows:
where shows the exact current in battery and denotes the measurement error in the current, which is supposed to be zero mean with standard deviation as , i.e., the following:
By substituting the measured current (10) in (9) the Coulomb counting equation is rewritten as follows:
Let us assume the following:
Now, the SOC at time instant can be presents as follows:
Considering n consecutive samples, the SOC at time is as follows:
It can be noticed that the change in SOC can be decomposed into charging Coulombs and discharging SOC as follows:
where
where the logical quantity is defined as follows:
and the logical quantity is defined as follows:
Similarly, the error in the computed computed SOC can be split into two terms corresponding to charging and discharging, i.e., as follows:
where
It must be noted that the current measurement noise has the same characteristics during charging and discharging.
Now, it is justified that the SOC estimation error has the following characteristics:
where nc is the number of present charging current samples and nd is the number of present discharging current samples that satisfy the following:
It is seen that as , the noise variance of the estimated SOC error also tends toward infinity. Let us write the SOC noise due to current measurement error in a simplified form as follows:
where the ratio between the measurement noise standard deviation and battery capacity (in Ah), denoted in this paper as the current measurement noise coefficient (which has a unit of ), is defined as follows:
It must be noted that although the SOC is defined within , SOC is usually displayed in percentage. As such, the standard deviation of the SOC error in (27) is given as a percentage as follows:
Table 2 presents the standard deviation (s.d.) in SOC error because of the measurement error in the current at different sampling intervals. Here, it is assumed that the battery capacity is and the current measurement error standard deviation is
The SOC error presented in Table 2 is computed assuming zero uncertainties in all the other sources of error (integration, capacity, and timing oscillator) and the initial SOC .
The variance of the SOC error (29) because of the current measurement error keeps increasing with time. As such, we denote this as a time-cumulative error. For time-cumulative errors, the standard deviation of the error keeps increasing with time—if it is not reset, it will completely corrupt the estimated SOC. A possible approach that can be used for reducing the time-cumulative error is to reset the Coulomb count to zero once during a process. Considering that the reset value of SOC also comes with errors (which is not considered in this paper) it is important to select an instant where the uncertainty in the reset SOC is smaller than the uncertainty derived in (29).
3.2. Effect of Approximating Current Integration
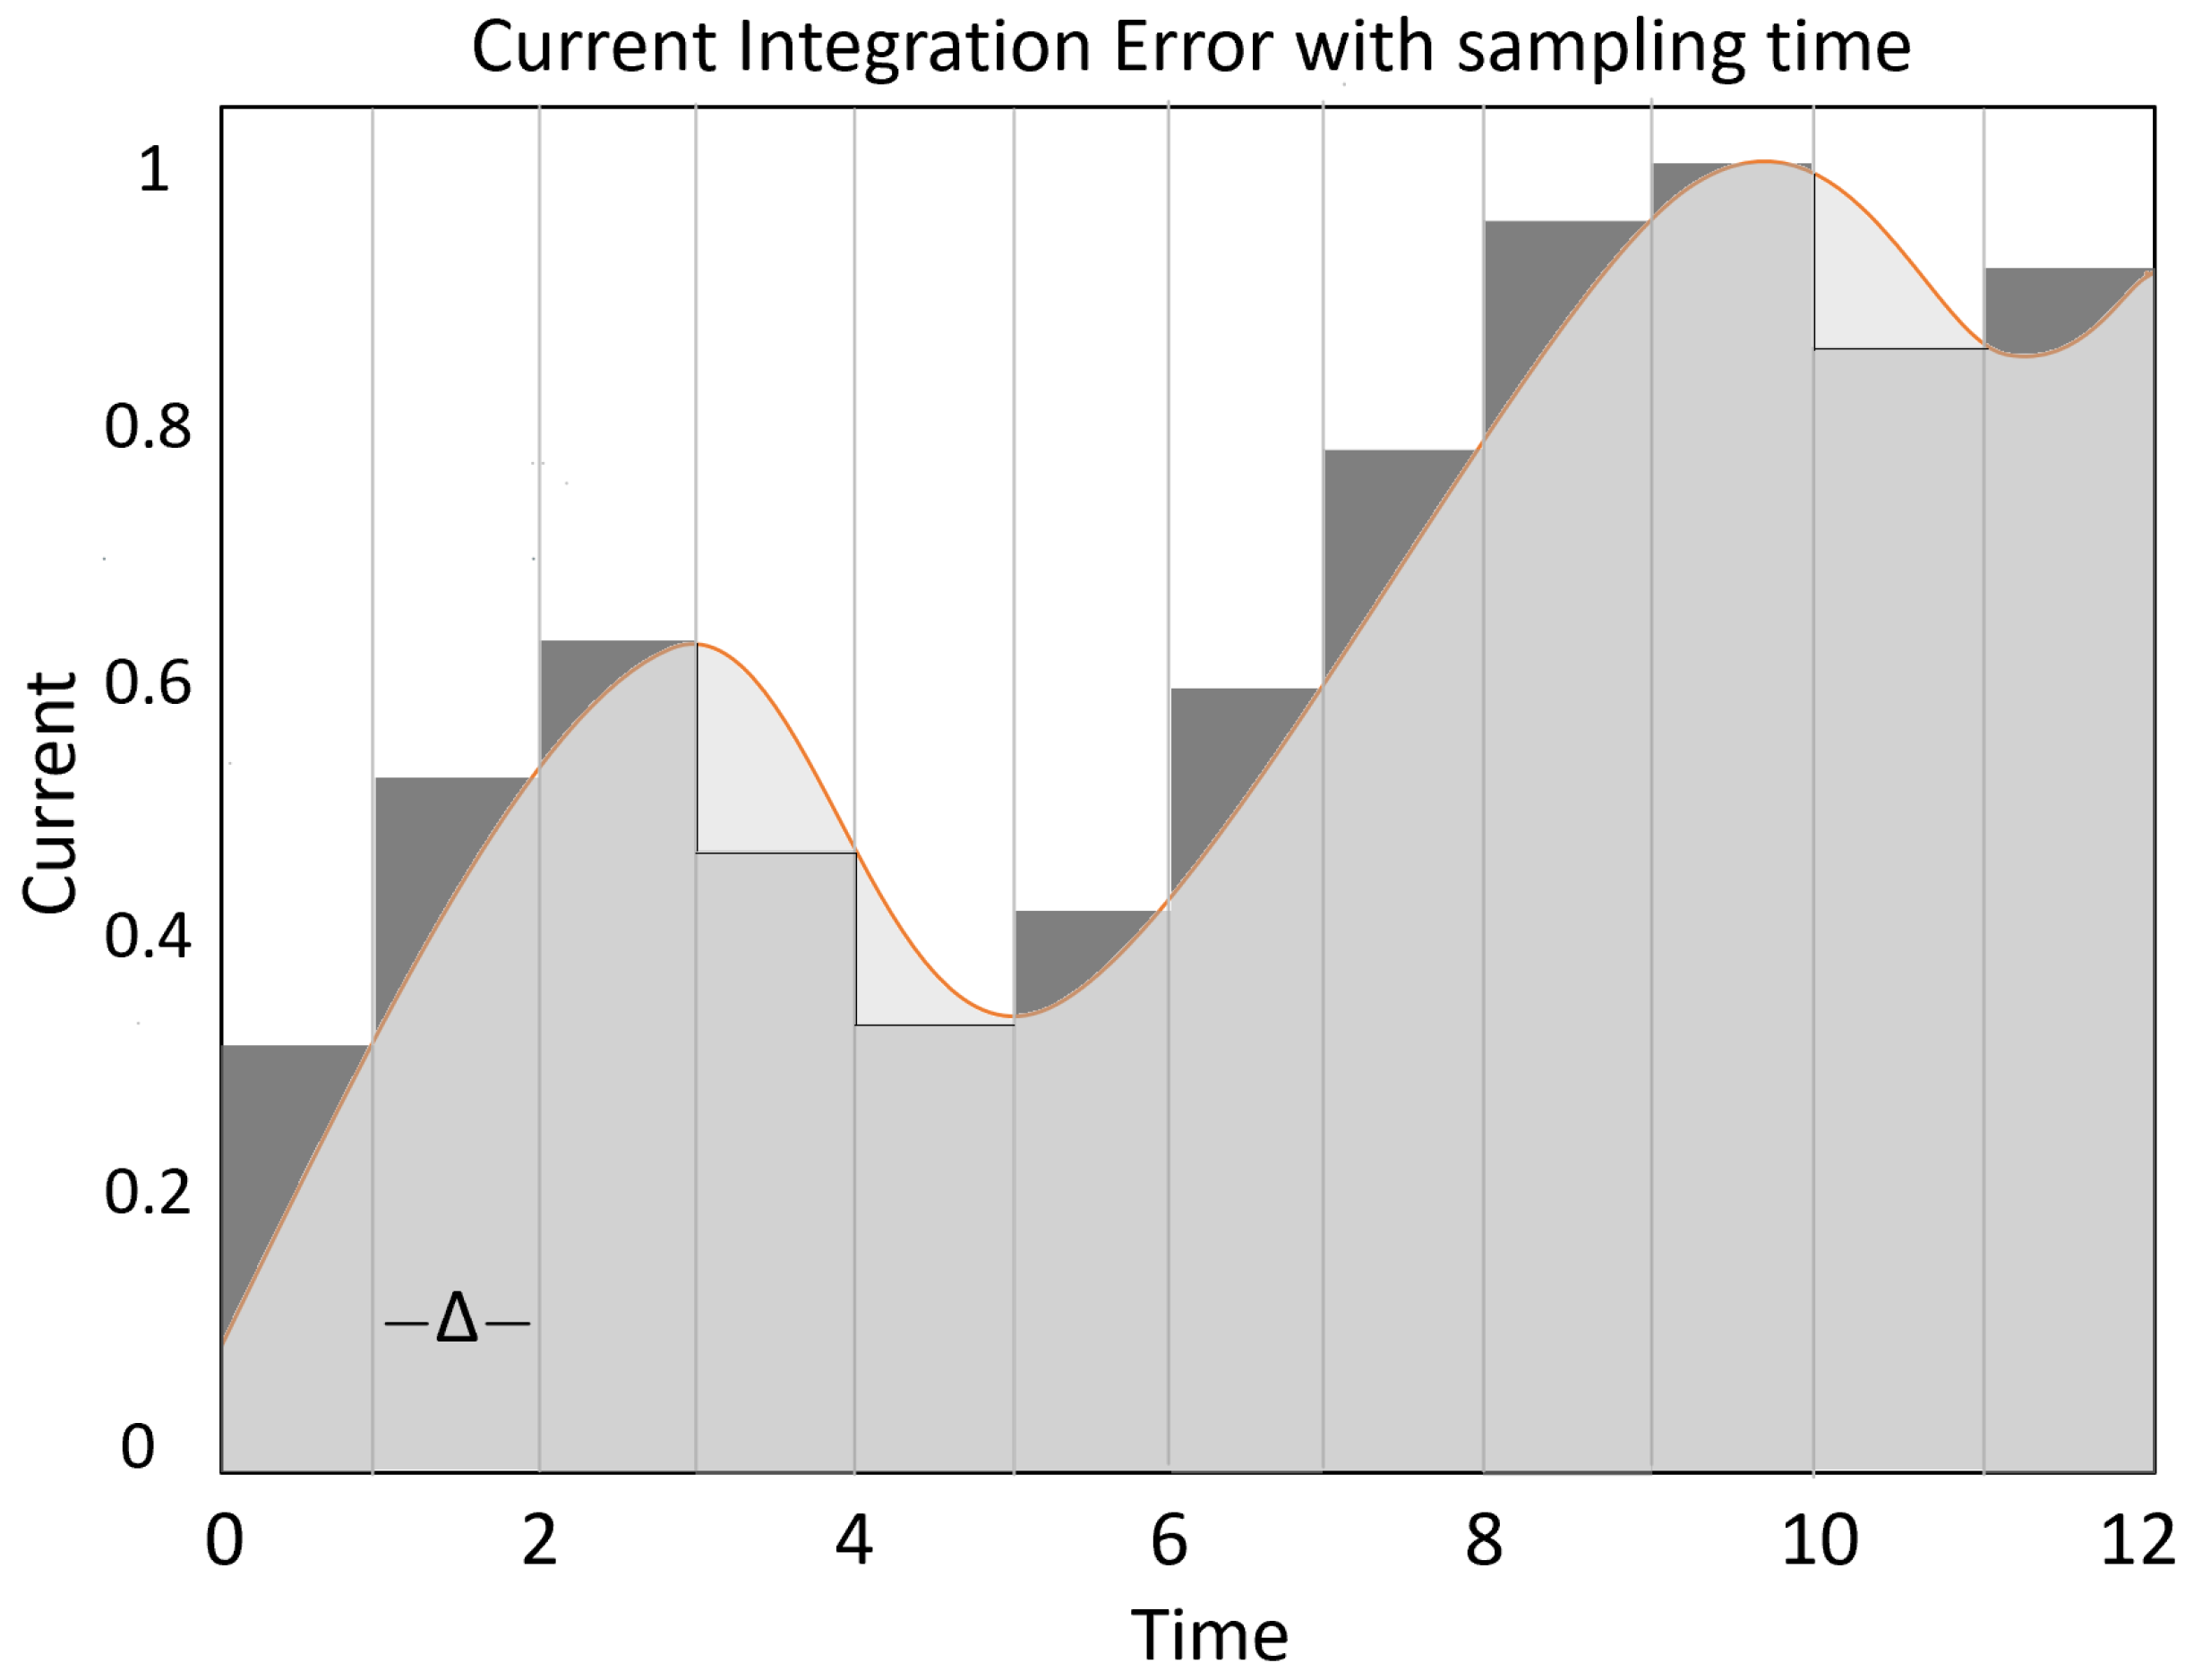
The Coulomb counting method, as described in the preceding section, uses a basic first-order (rectangular) approximation to approximate the integration of current over time (see (8)). Figure 1 shows a generic rectangular approximation to integration. For this method of approximation, the integration error can be represented mathematically as follows:
The behavior of integration error is a more important area of interest. It can be observed that, for rectangular approximation, the error is proportional to the sampling duration [53], i.e., the following:
Further, the integration error is proportional to the difference in the adjacent samples of measured current, i.e., the following:
Since, in (32) is a time varying quantity, we can approximately write the following:
where is the standard deviation of the load (or charging) current (e.g., if the current is constant, then and so is the integration error). Furthermore, when the amplitude of the current varies, the sign of the error can be positive and negative—see Figure 1 for an illustration of this. Using this observation, we can write the following:
This means that we can assume integration error to be due to rectangular approximation as the zero mean, considering the large number of samples.
Based on the discussion so far, the integration error has the following (approximate) properties:
where denotes the variance of current integration error From (31) and (33), we can write the following:
where is a constant, is the sampling time, and is the standard deviation of the load current.
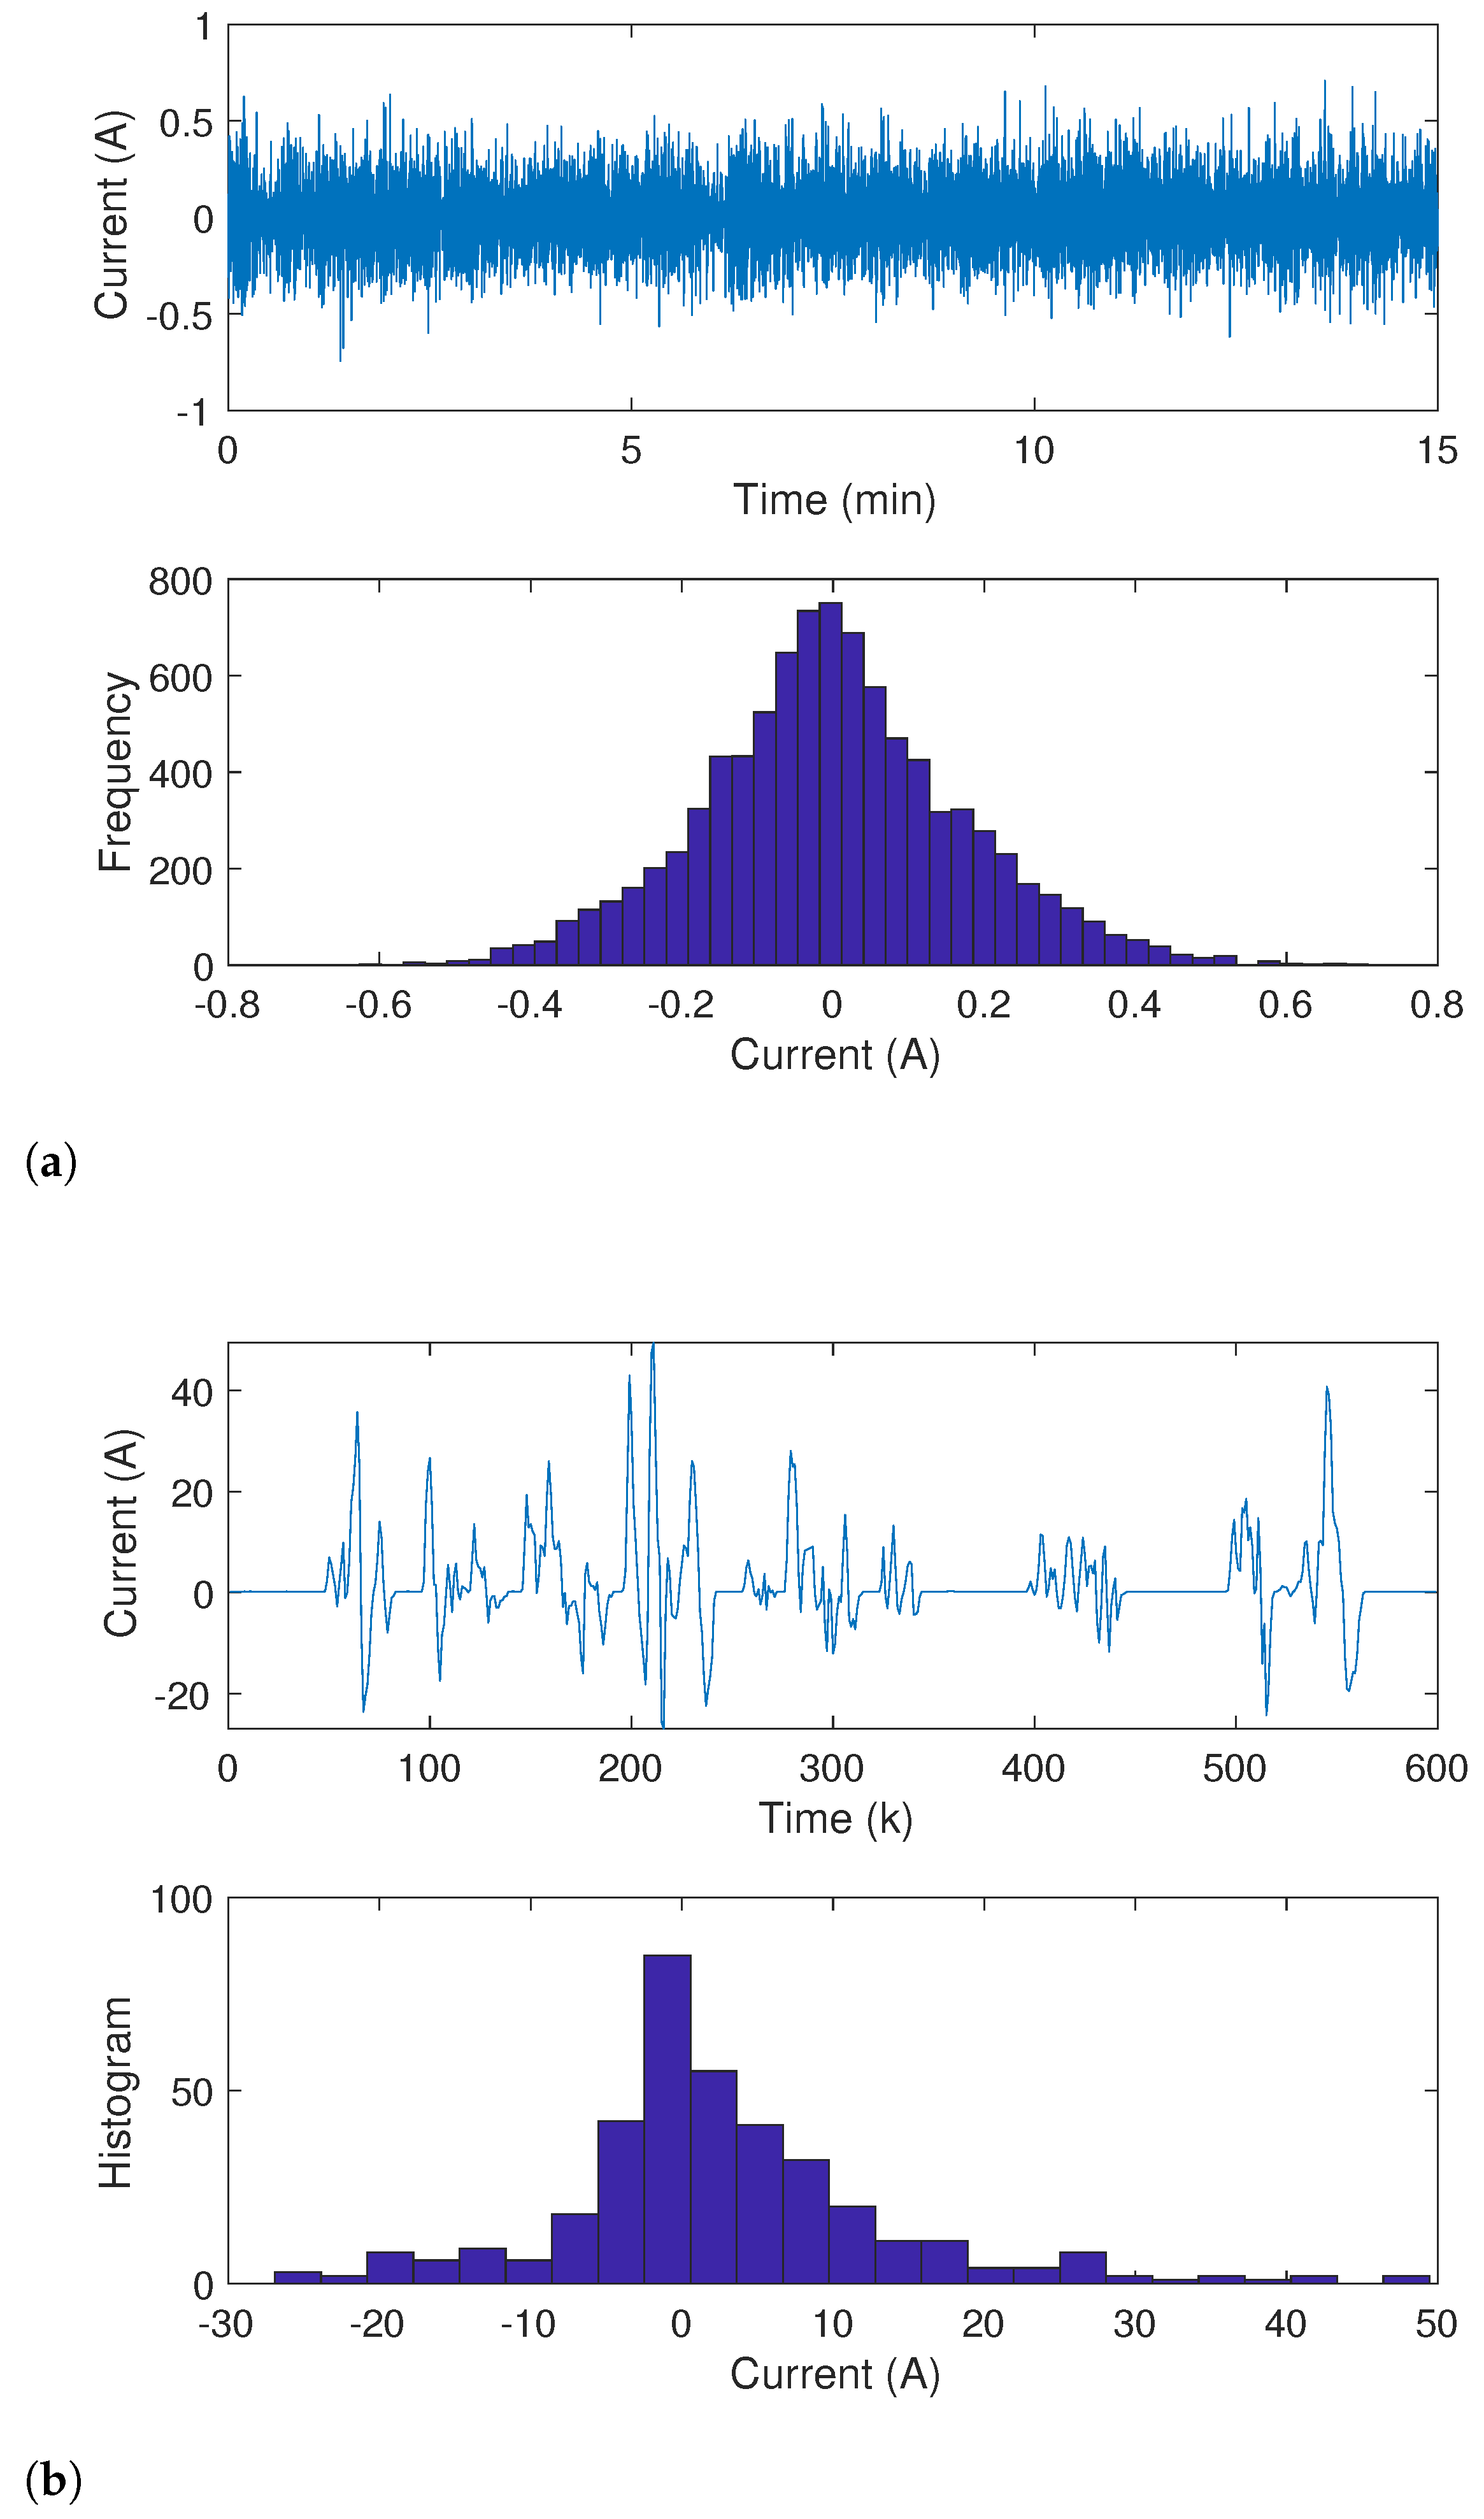
Figure 2 shows two different load current profiles from practical applications. It supports the assumption made in (32) that the current difference [] indeed is the zero mean.
On following the similar approach of Section 3.1, the computed SOC can be written in recursive form as follows:
where the integration error is incorporated based on (30). SOC at time instant can be written as follows:
The computed SOC at time instant can be written as follows:
where represents the SOC computation error due to approximation in integration.
Similar to (55)–(57), the SOC error can be decomposed, corresponding to charging and discharging, as follows:
where
The SOC error possesses the following characteristics:
Then, the standard deviation can be written as follows:
where the integration error coefficient is defined as follows:
Considering that the SOC is defined within , the standard deviation of the SOC in (43) ranges between . Usually, SOC is displayed in percentage. As such, the standard deviation of the SOC error in (44) can be displayed in percentage as follows:
Now, to simplify the above expression, some realistic assumptions need to be made for further processes. Based on the data shown in Figure 2, we have the following:
3.3. Effect of the Uncertainty in Battery Capacity
The capacity of a battery refers to the number of Coulombs that can be charged into (or discharged from) it. The capacity of a battery degrades with time [54], and the rate at which it degrades is determined by the battery’s calendar life as well as the battery’s environmental and usage trends over a lengthy period of time [55]. As a result, the true value of the battery capacity is unknown. To estimate the battery SOC, usually a measure of the battery capacity, denoted as , is employed. Such a capacity measurement is not exact, and it has the following relationship to the genuine battery capacity:
where shows the uncertainty in the prior knowledge of the true capacity of the battery . It was shown in [13] that uncertainty in battery capacity can be considered as the zero-mean Gaussian distribution, which can be represented as follows:
where is the standard deviation of the capacity estimation error.
The first order Taylor series approximation of a function around a point is given by the following:
using the above Taylor series approximation and the relationship (48), the inverse capacity can be approximated as follows:
With the above approximation to the inverse capacity, let us re-write the Coulomb counting equation as follows:
Now, SOC can be written for time instant as follows:
The computed SOC at time instant can be written as follows:
where represents SOC error due to the uncertainty in battery capacity. Similar to (55)–(57), above can be decomposed into the following two terms:
where
Now, becomes the following:
Now, due to the uncertainty in prior knowledge of the battery capacity, the SOC error can be written as follows:
where the dimensionless capacity uncertainty coefficient is defined as follows:
3.4. Effect of the Uncertainty in Charging Efficiency
Let us assume the uncertainty in charging efficiency as follows:
In summary, we may write the following:
where
Now, the measured current (10) needs to substitute in (9) and revise the Coulomb counting equation as follows:
The computed SOC at time instant can be written as follows:
where the SOC error can be expressed as the following:
where
are defined as the charging uncertainty coefficient and the discharging uncertainty coefficient, respectively. Let us model these two coefficients as and . With this assumption, the SOC error will possess the following characteristics:
3.5. Effect of the Uncertainty in Timing Oscillator
In this method, we have the following:
where represents a random parameter for timing oscillator error. It can behave like bias, which can be considered constant for a longer period of time. The timing error coefficient can be defined as follows:
Considering the assumption that the timing oscillator is off by 3 minutes in one month, then, for such a scenario, the constant can be written as follows:
The simplification of SOC estimation error can be performed as follows:
According to the following assumption that SOC at time step t = 0, it can state the following:
Therefore, the SOC variation can be shown as follows:
The SOC error is a deterministic quantity for a given battery, provided that is known. However, a realistic assumption is that the knowledge of is only probabilistic. Let us assume that . In the following circumstance, the characteristics exhibited by the SOC error can be shown as follows:
with the assumption that is a too-small number; see (73). Due to the time oscillator error, the error in SOC can be assumed to be negligible.
4. Summary of Individual Errors
This study presents a critical look at the Coulomb counting method that is employed to estimate the state of charge of a battery. The Coulomb counting approach computes the present SOC as follows:
where is the instantaneous current through the battery and is the battery capacity in ampere hours, that is, the present SOC is the summation of the initial SOC and the change in SOC, computed through the above integration. The SOC can be approximately computed in a recursive manner as follows:
where at time step k, SOC can be represented by , denotes the measured current at time step k, and represents the sampling time in seconds. The SOC at time n is the summation of the initial SOC and the accumulated SOC from time until n.
In this paper, we showed that the above (discrete) recursive approximation to computing SOC suffers from four sources of error: current measurement error, current integration error, battery capacity uncertainty and the timing oscillator error. Particularly, we computed the exact amount of the resulting SOC uncertainty as a result of the above four types of errors. Those results are as follows:
- Current measurement error: At time instant n, the computed SOC can be stated as if the current measurement error is zero-mean with standard deviation .where is the initial SOC and is the accumulated SOC from the start at . The SOC error is shown to be zero mean with standard deviation (see (25))It should be noted that, due to the current measurement noise, the variance of the Coulomb counting error is accumulative with time. As the time increases, i.e., , the standard deviation of SOC error also increases.
- Current integration error: With the consideration that approximation is done for the integration of current using the rectangular method, it can be shown that resulting approximation error is zero mean with standard deviation . As a result, at time instant n the computed SOC can be written as follows:where it can be shown that SOC error has zero mean and standard deviation as follows:Again, it must be noted that, due to the current measurement noise, the variance of the Coulomb counting error is accumulative with time.
- Uncertainty in the knowledge of battery capacity: With the consideration that uncertainty in the battery capacity has zero mean with standard deviation , the SOC at time instant n can be derived as follows:where represents SOC error as follows:where is defined as the capacity uncertainty coefficient. It should be noted that error in capacity due to uncertainty is not accumulative with time; rather, it is proportional to the accumulated SOC
- Charging efficiency error: The charging and discharging efficiencies are denoted as and , respectively. The uncertainties in charging and discharging efficiencies are denoted as and , respectively. At time step n, the SOC error can be written as follows:whereSimilar to , does not accumulate with time; rather, it accumulates with the accumulated Coulombs.
- Timing oscillator error: In the timing oscillator, considering the error of (ratio of clocked time vs. true time), the SOC at time instant n can be shown as follows:where denotes the SOC error, which is the deterministic value as follows:Similar to the error due to capacity uncertainty, is not accumulative with time and it is proportional to the accumulated SOC. It can be shown that the realistic value of is a too-small number. For example, a timing oscillator which is leading or lagging by three minutes in a month has . Therefore, the weightage of the timing oscillator error in the SOC estimation is very minimal.
In summary, the resulting four types of errors can be grouped into two categories: time-accumulative and SOC-proportional. The SOC errors due to current measurement error and integration approximation fall under the category of time-accumulative errors. The SOC errors due to the uncertainty in battery capacity and timing oscillator error fall under the category of SOC-proportional errors. Next, we briefly discuss the nature of these errors and possible ways to mitigate them.
4.1. Mitigating Time-Accumulative Errors
It must be stressed that the best way to mitigate Coulomb counting errors is to employ a state-space filter, such as the Kalman filter, with correctly derived model parameters as briefly discussed in Section 5. However, practical battery management systems are implemented through complex state diagrams [15], where at some stages, Coulomb counting is the best way to compute the SOC. Some strategies discussed below can be useful when the SOC is computed, based on Coulomb counting only.
The following strategies can be looked at to reduce time-accumulative errors.
- Over sampling. It can be noted that both and , in (80) and (81), respectively, are proportional to , where and n are related as follows:where T is the total time duration. Now, both and can be written as follows:Now, one must realize that the integration error coefficient reduces with oversampling, i.e., as decreases so does . However, the current measurement noise coefficient is unaffected by the sampling time. The conclusion is that both and reduce with higher sampling rate—however, reduces at a higher rate compared to with oversampling.
- Reinitialization. Time-accumulative errors increase with time. The growth of error can be reduced down by re-initializing the SOC.
4.2. Mitigating SOC-Proportional Errors
Intermittent re-initialization—within a single charge–discharge cycle—will help to minimize this error. However, in most practical cases, there may not be many opportunities (a rested battery) for frequent resetting within a single cycle. The knowledge of uncertainty in the battery capacity will be very useful in SOC error management. For example, if it is known that is significantly high, then the SOC can be computed solely based on the voltage approach.
Finally, it must be emphasized that the focus of this paper is exclusively on the Coulomb counting approach. As such, we did not delve into other types of approaches that are shown to be useful in improving SOC estimates, such as voltage/current based approaches through the use of nonlinear filters [3,40]. The results reported in this paper, such as the standard deviation of the Coulomb counting error for various scenarios, will help to improve the voltage/current based SOC estimations as well.
5. Combined Effect and the State-Space Model Derivation
So far, the Coulomb counting uncertainty is computed only based on individual sources of errors. In this section, we discuss how the combined effect due to all sources of error can be approximated, using a naive combination approach. Exact derivation of the combined effect can be quite lengthy, due to the non-linear relationships involved—this is left for future works.
Under the naive combination approach, at time instant n SOC can be written as follows:
where
Under the above naive assumption, the following can be shown:
With the combined noise derived above, now we are ready to redefine the state-space model (3) and (4).
Based on the detailed derived about the Coulomb counting error, the process model (3) can be written as follows:
where is the process noise that has zero-mean and variance, given by (90) when n is set to 1.
Based on the notations introduced in [7], the measurement Equation in (4) can be written in detail as follows:
where is the open circuit voltage model, approximates the voltage drop in the relaxation elements of the battery, is the parameter vector of the relaxation elements, and is the measurement noise.
6. Numerical Analysis
6.1. Effect of Current Measurement Error
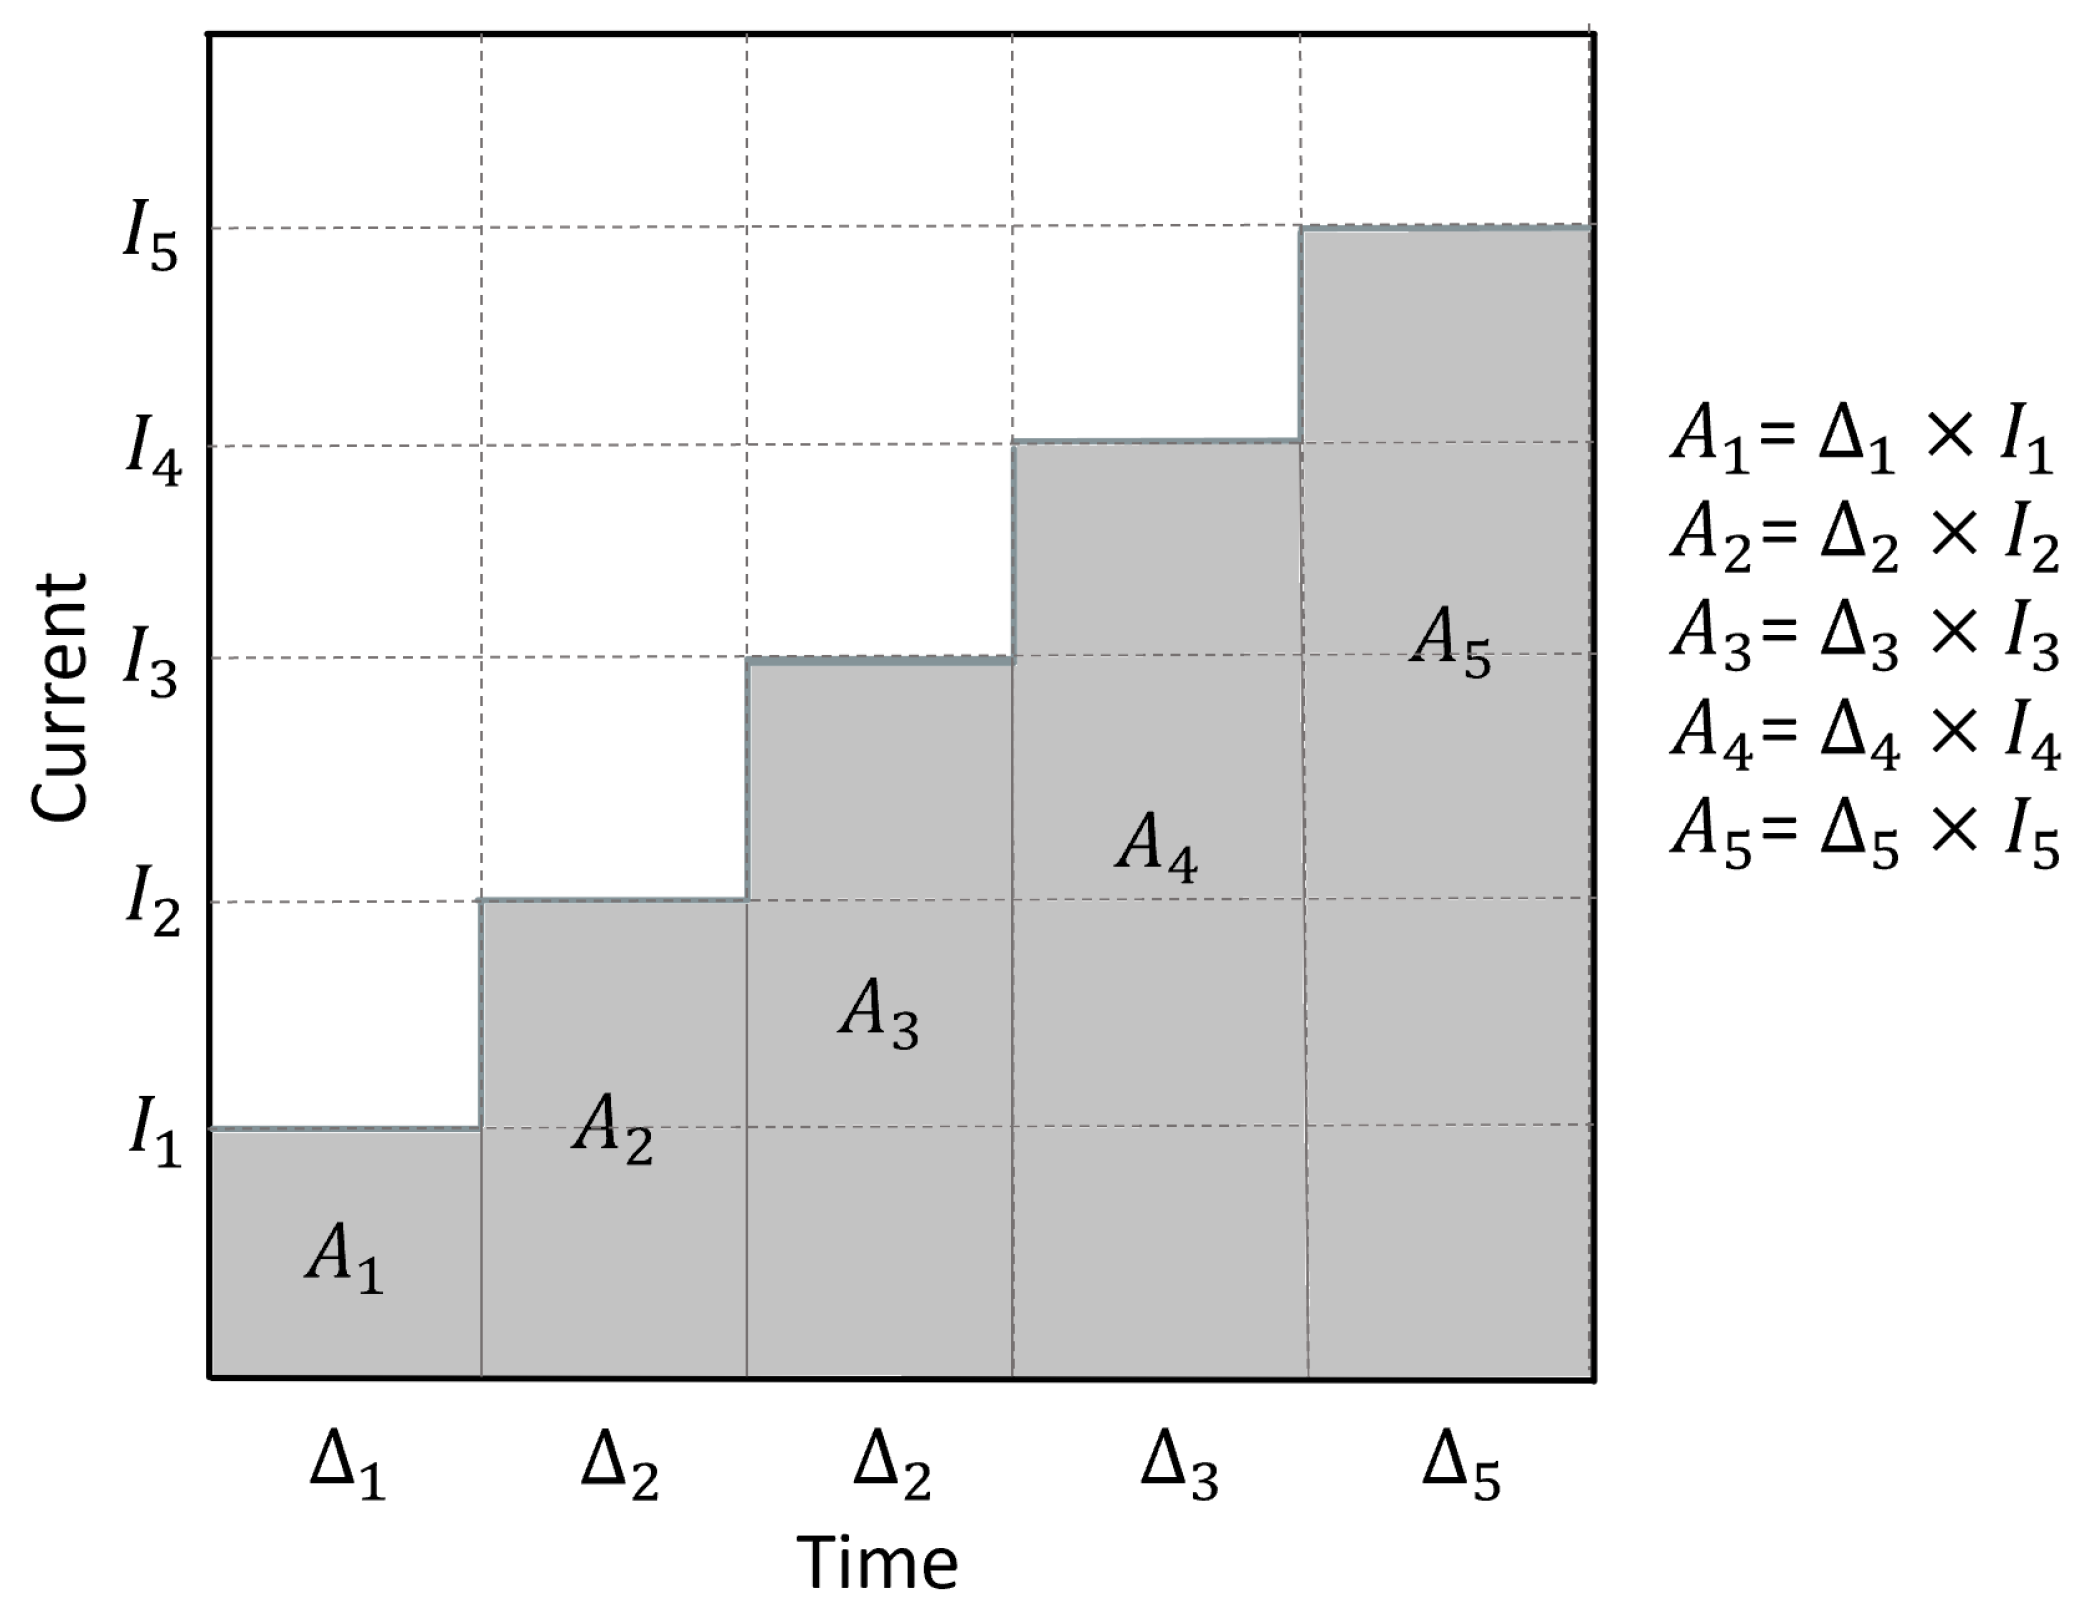
The objective in this section is to validate—using the Monte Carlo simulation approach—the standard deviation of the SOC error, due to the measurement error in the current that was derived in (29). For this experiment, errors from all the other possible sources of uncertainties (current integration error, battery capacity uncertainty, and timing oscillator error as well as initial SOC error) are assumed to be zero. In order to do this, a special current profile, shown in Figure 3, is created. For this profile, the amount of Coulombs can be perfectly computed, using geometry. Once the Coulombs are computed, the true SOC can be computed by making use of the knowledge of the true battery capacity and other noise-free quantities. The following procedure details the Monte Carlo experiment:
- Generate a perfectly integrable current profile, similar to the one shown in Figure 3. The generated current profile denotes in (10).
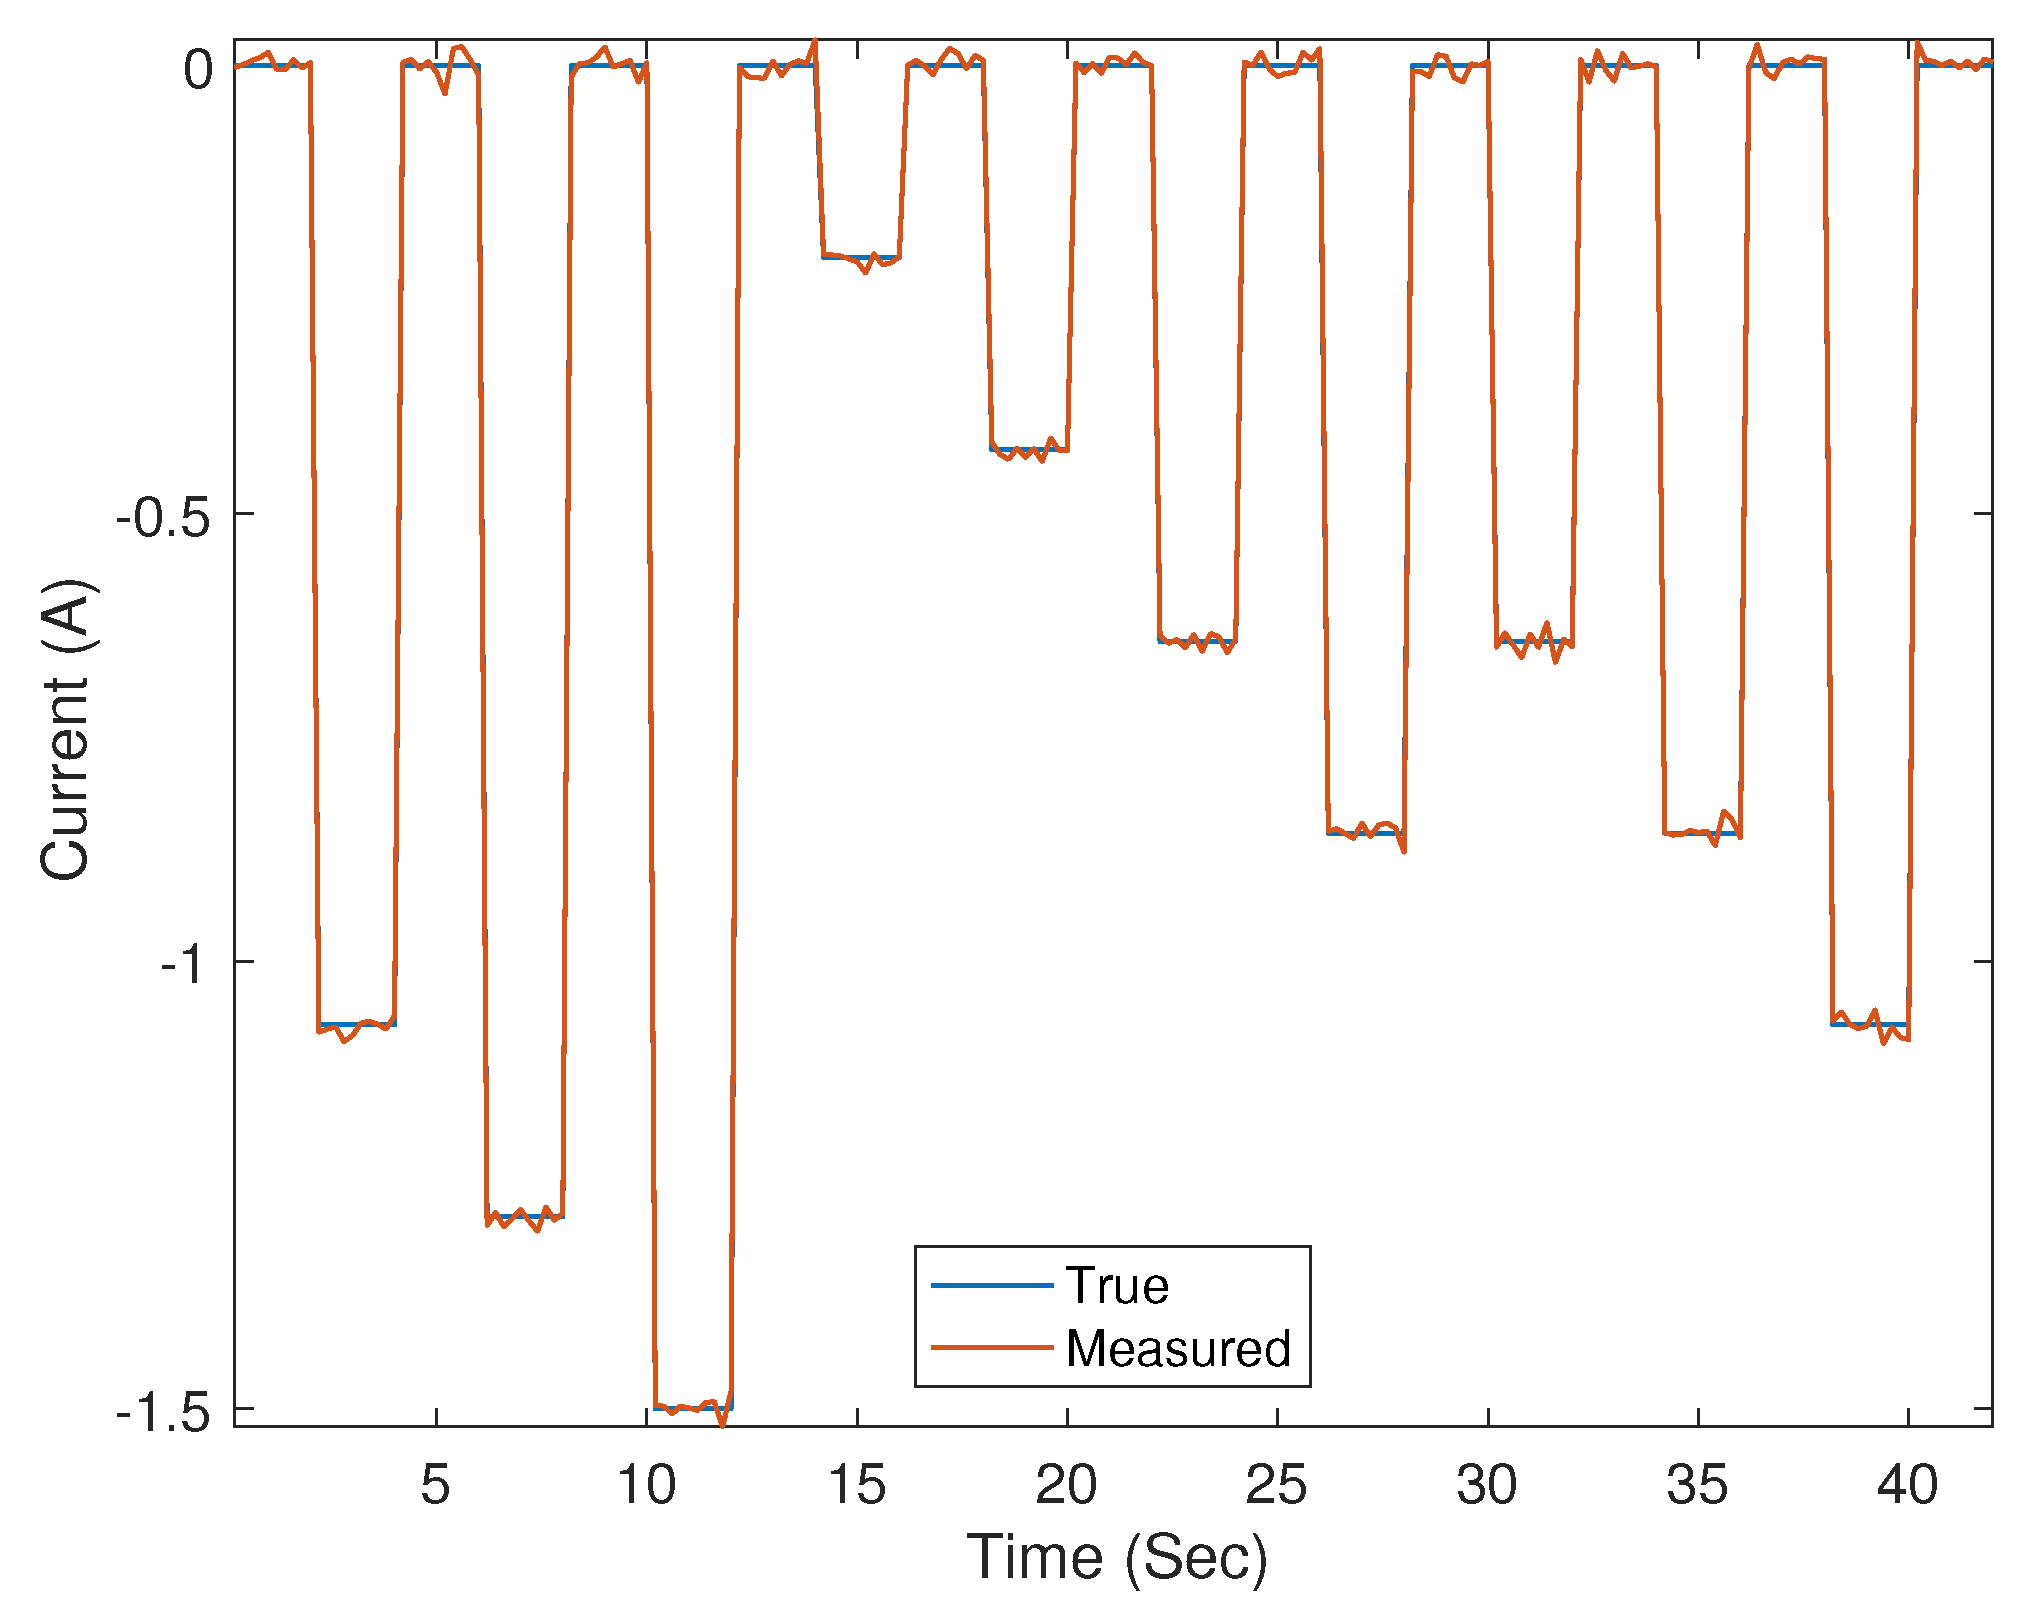
- First 40 s of the true current profile generated for the experiment is shown in Figure 4.
- Compute the true SOC at time k, , using the geometric approach, illustrated in Figure 3, for the entire duration of the profile, i.e., for where n denotes the number of samples in the entire current profile.
- Set where m denotes the index of the Monte Carlo run.
- Generate current measurement noise as zero-mean Gaussian noise with standard deviation Using this, generate the measured current profile .
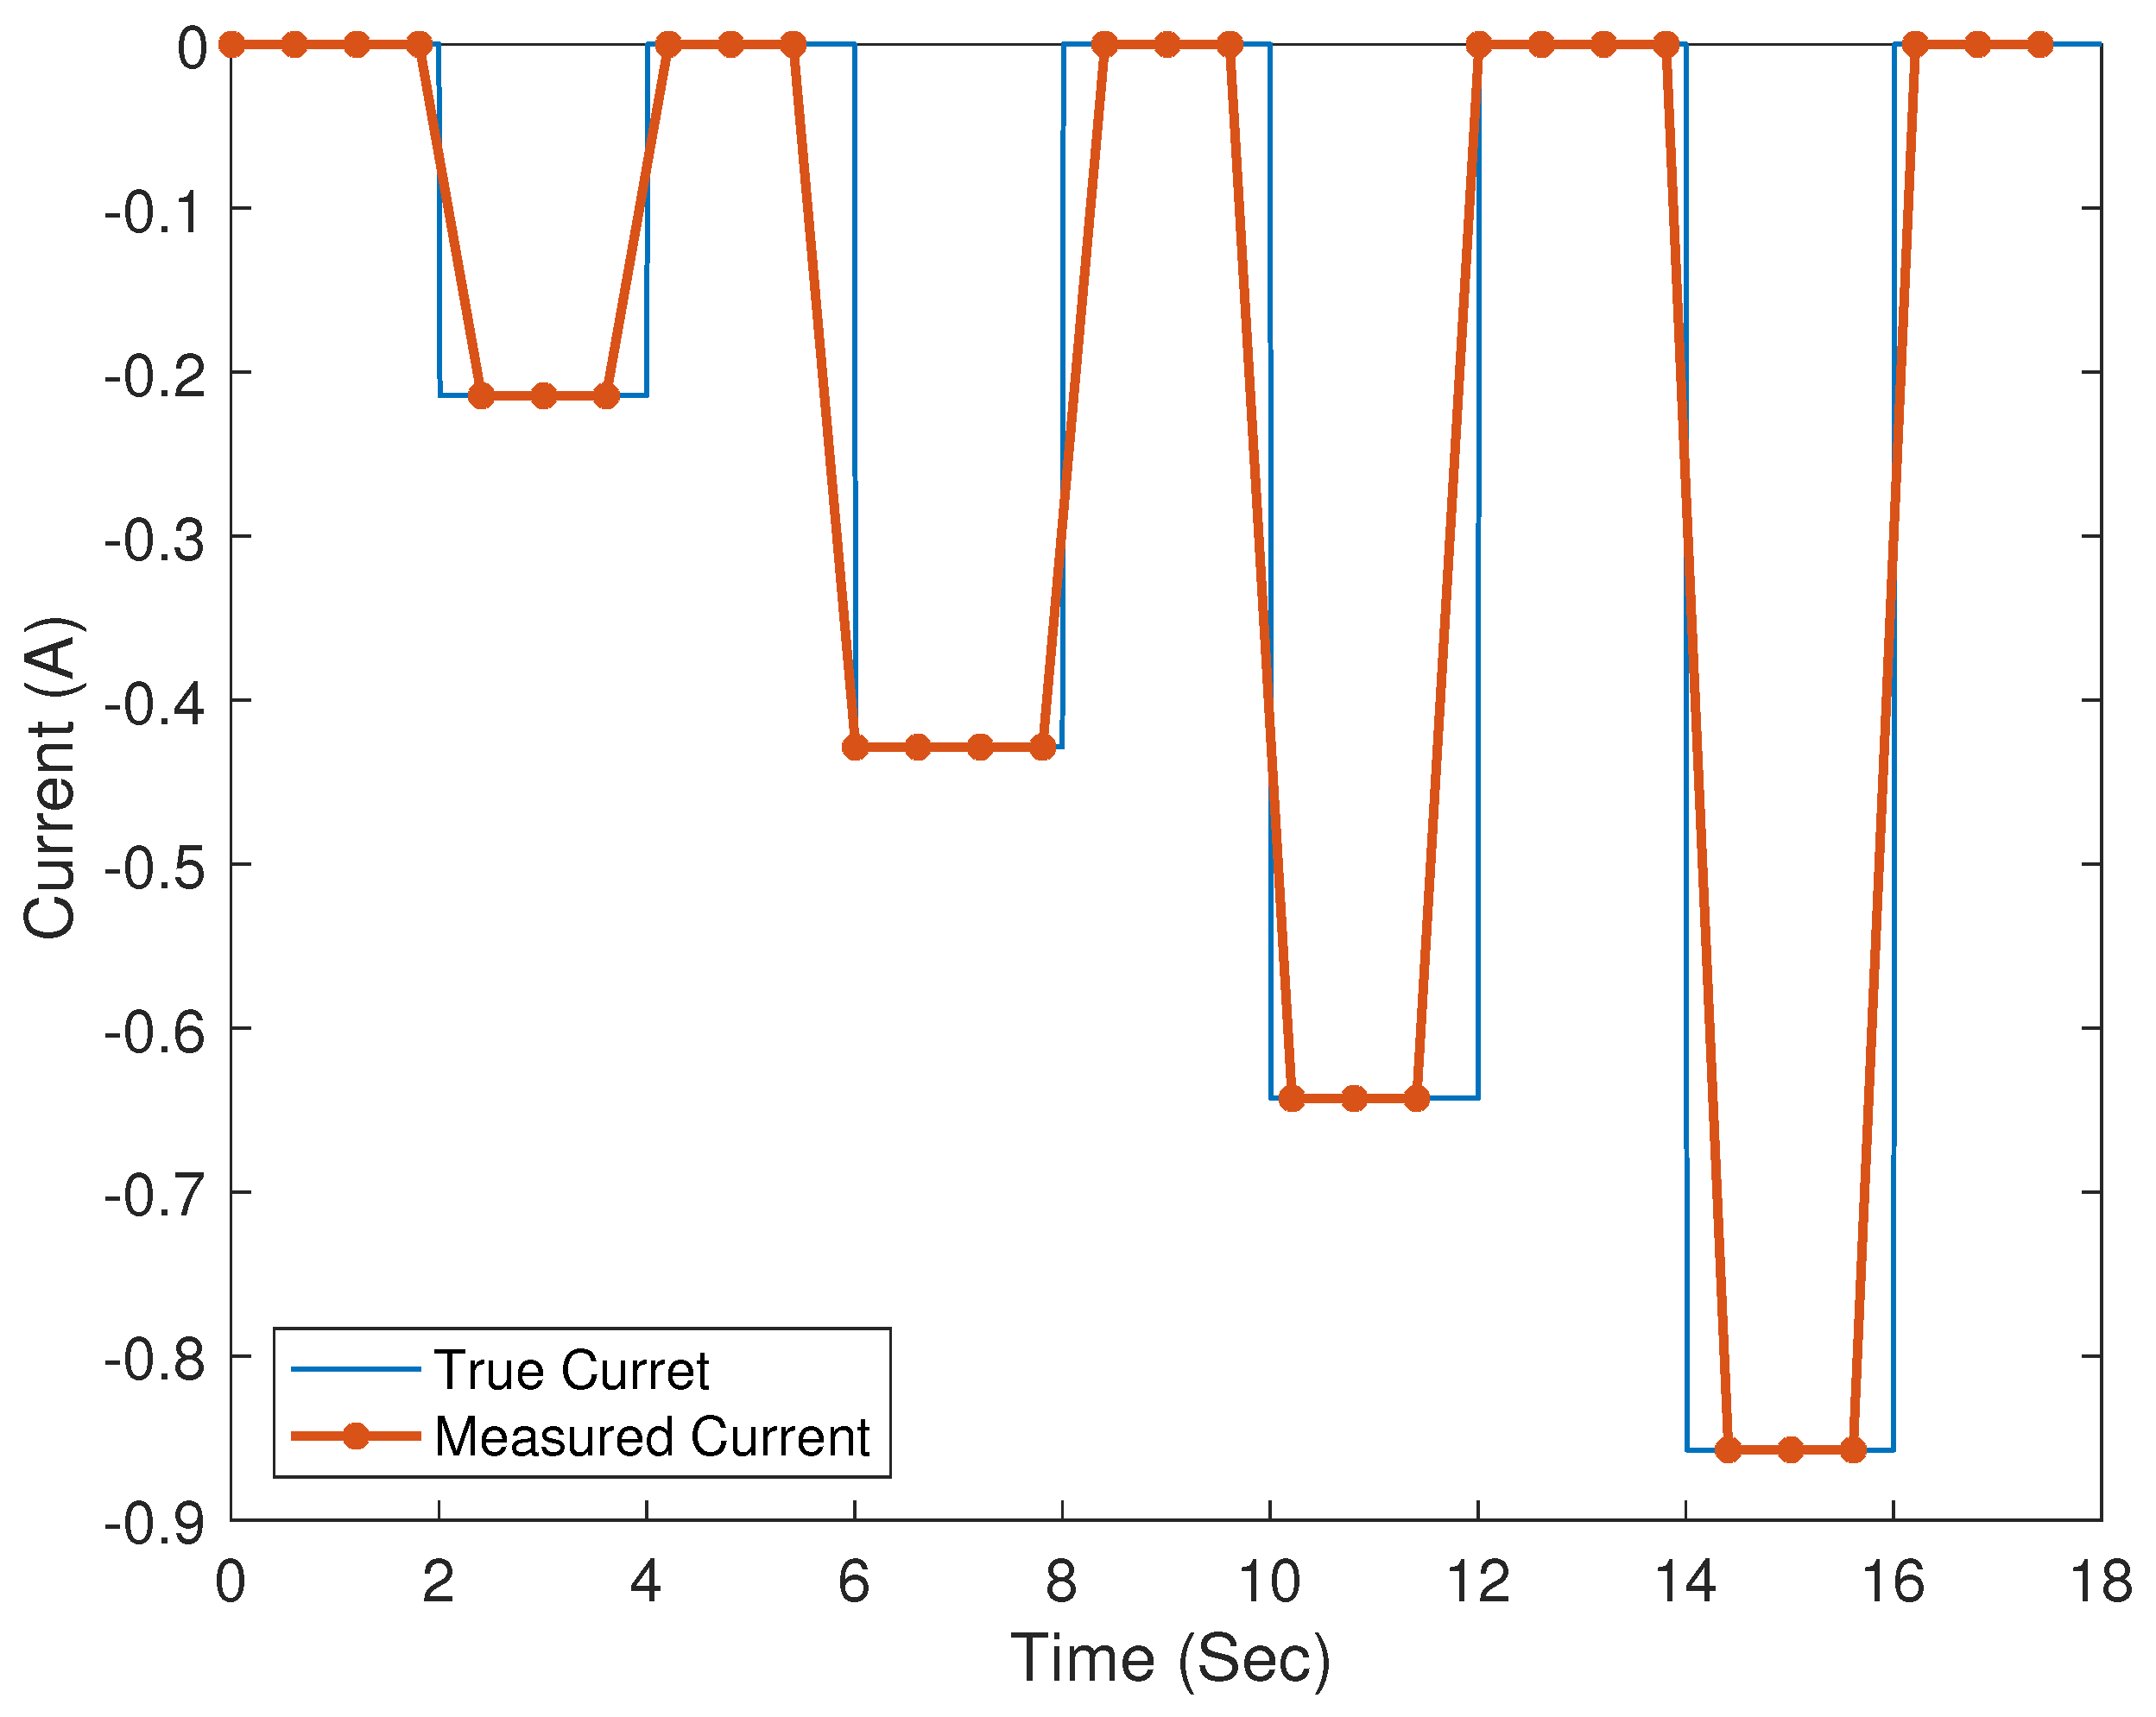
- Figure 4 shows the true current profile along with the measured current profile for a duration of 40 s.
- Compute the (noisy) SOC, using the traditional Coulomb counting equation given in (65), i.e., the following:where the subscript m denotes the Monte Carlo run.
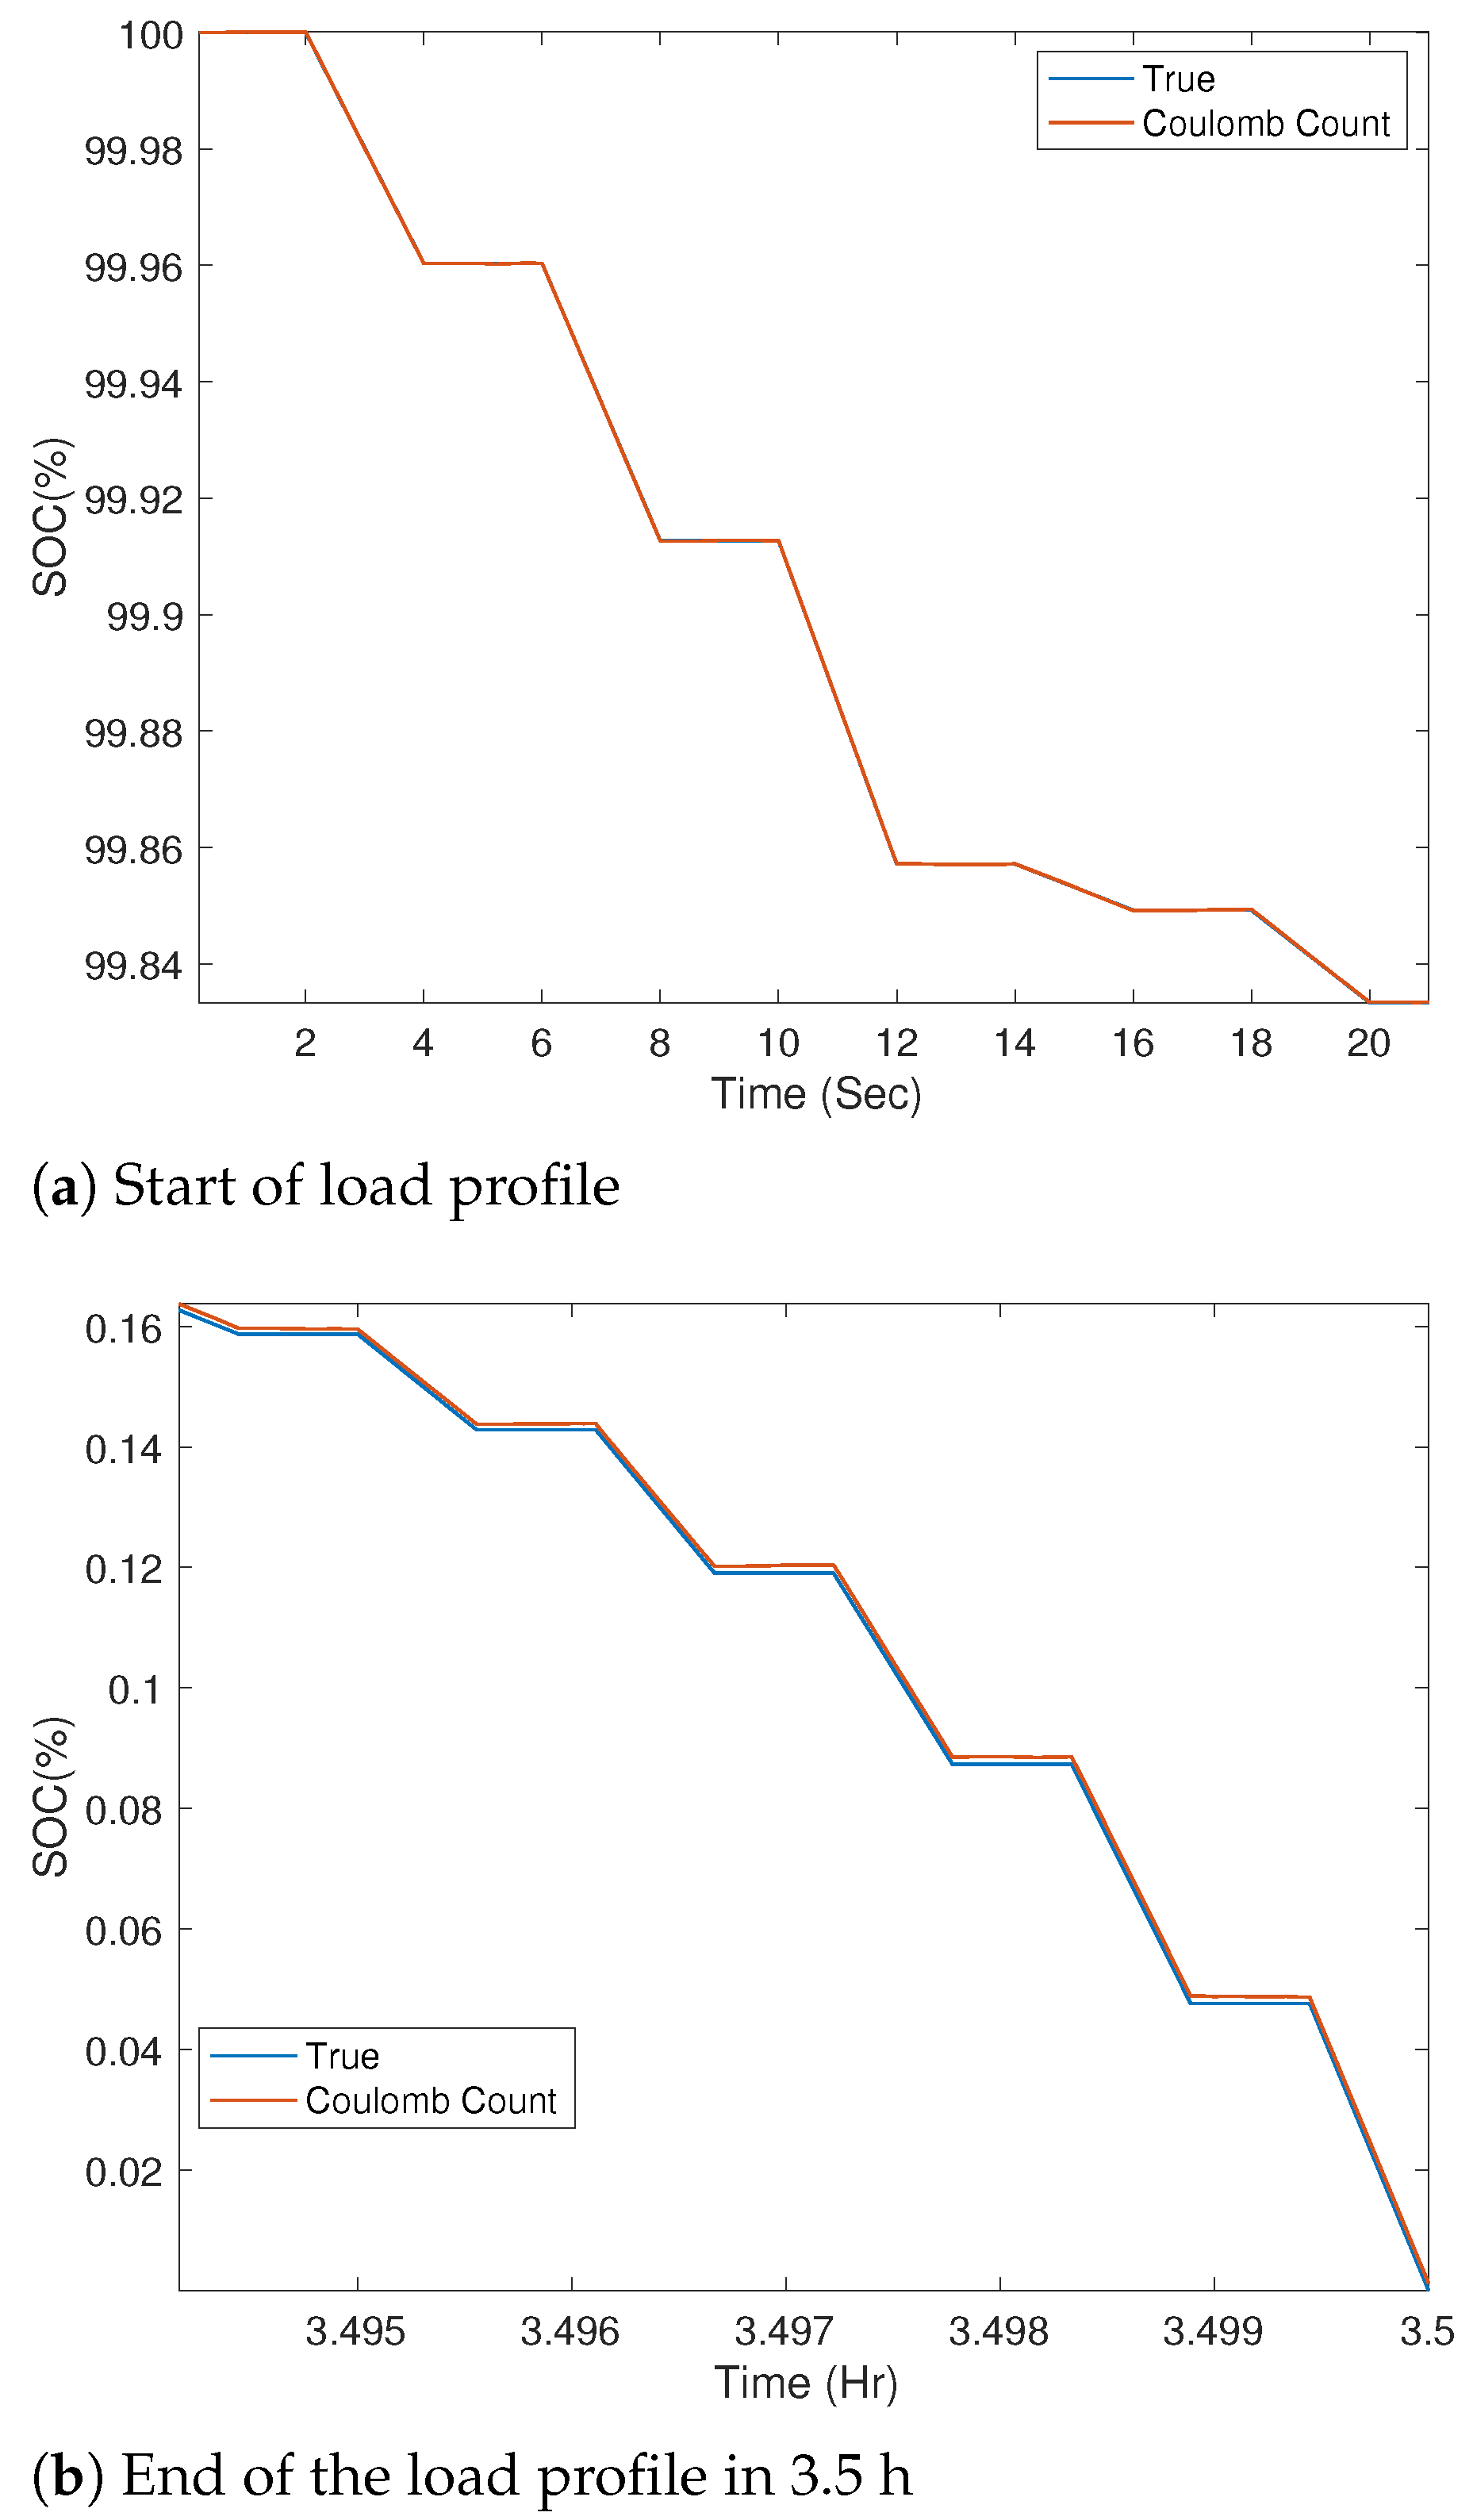
- Figure 5 shows the true SOC and the computed noisy SOC . The top plot (a) shows the SOC at the start of the current profile, and the bottom plot (b) shows the SOC toward the end of applying 3.5 h of the load profile.
- If , where M denotes the maximum number of Monte Carlo runs, go to step (g); otherwise, set and go to step (d).
- End of simulation (all the data generated during the above steps need to be stored for analysis).
After Monte Carlo runs, the standard deviation of the SOC error due to current measurement error is computed as follows:
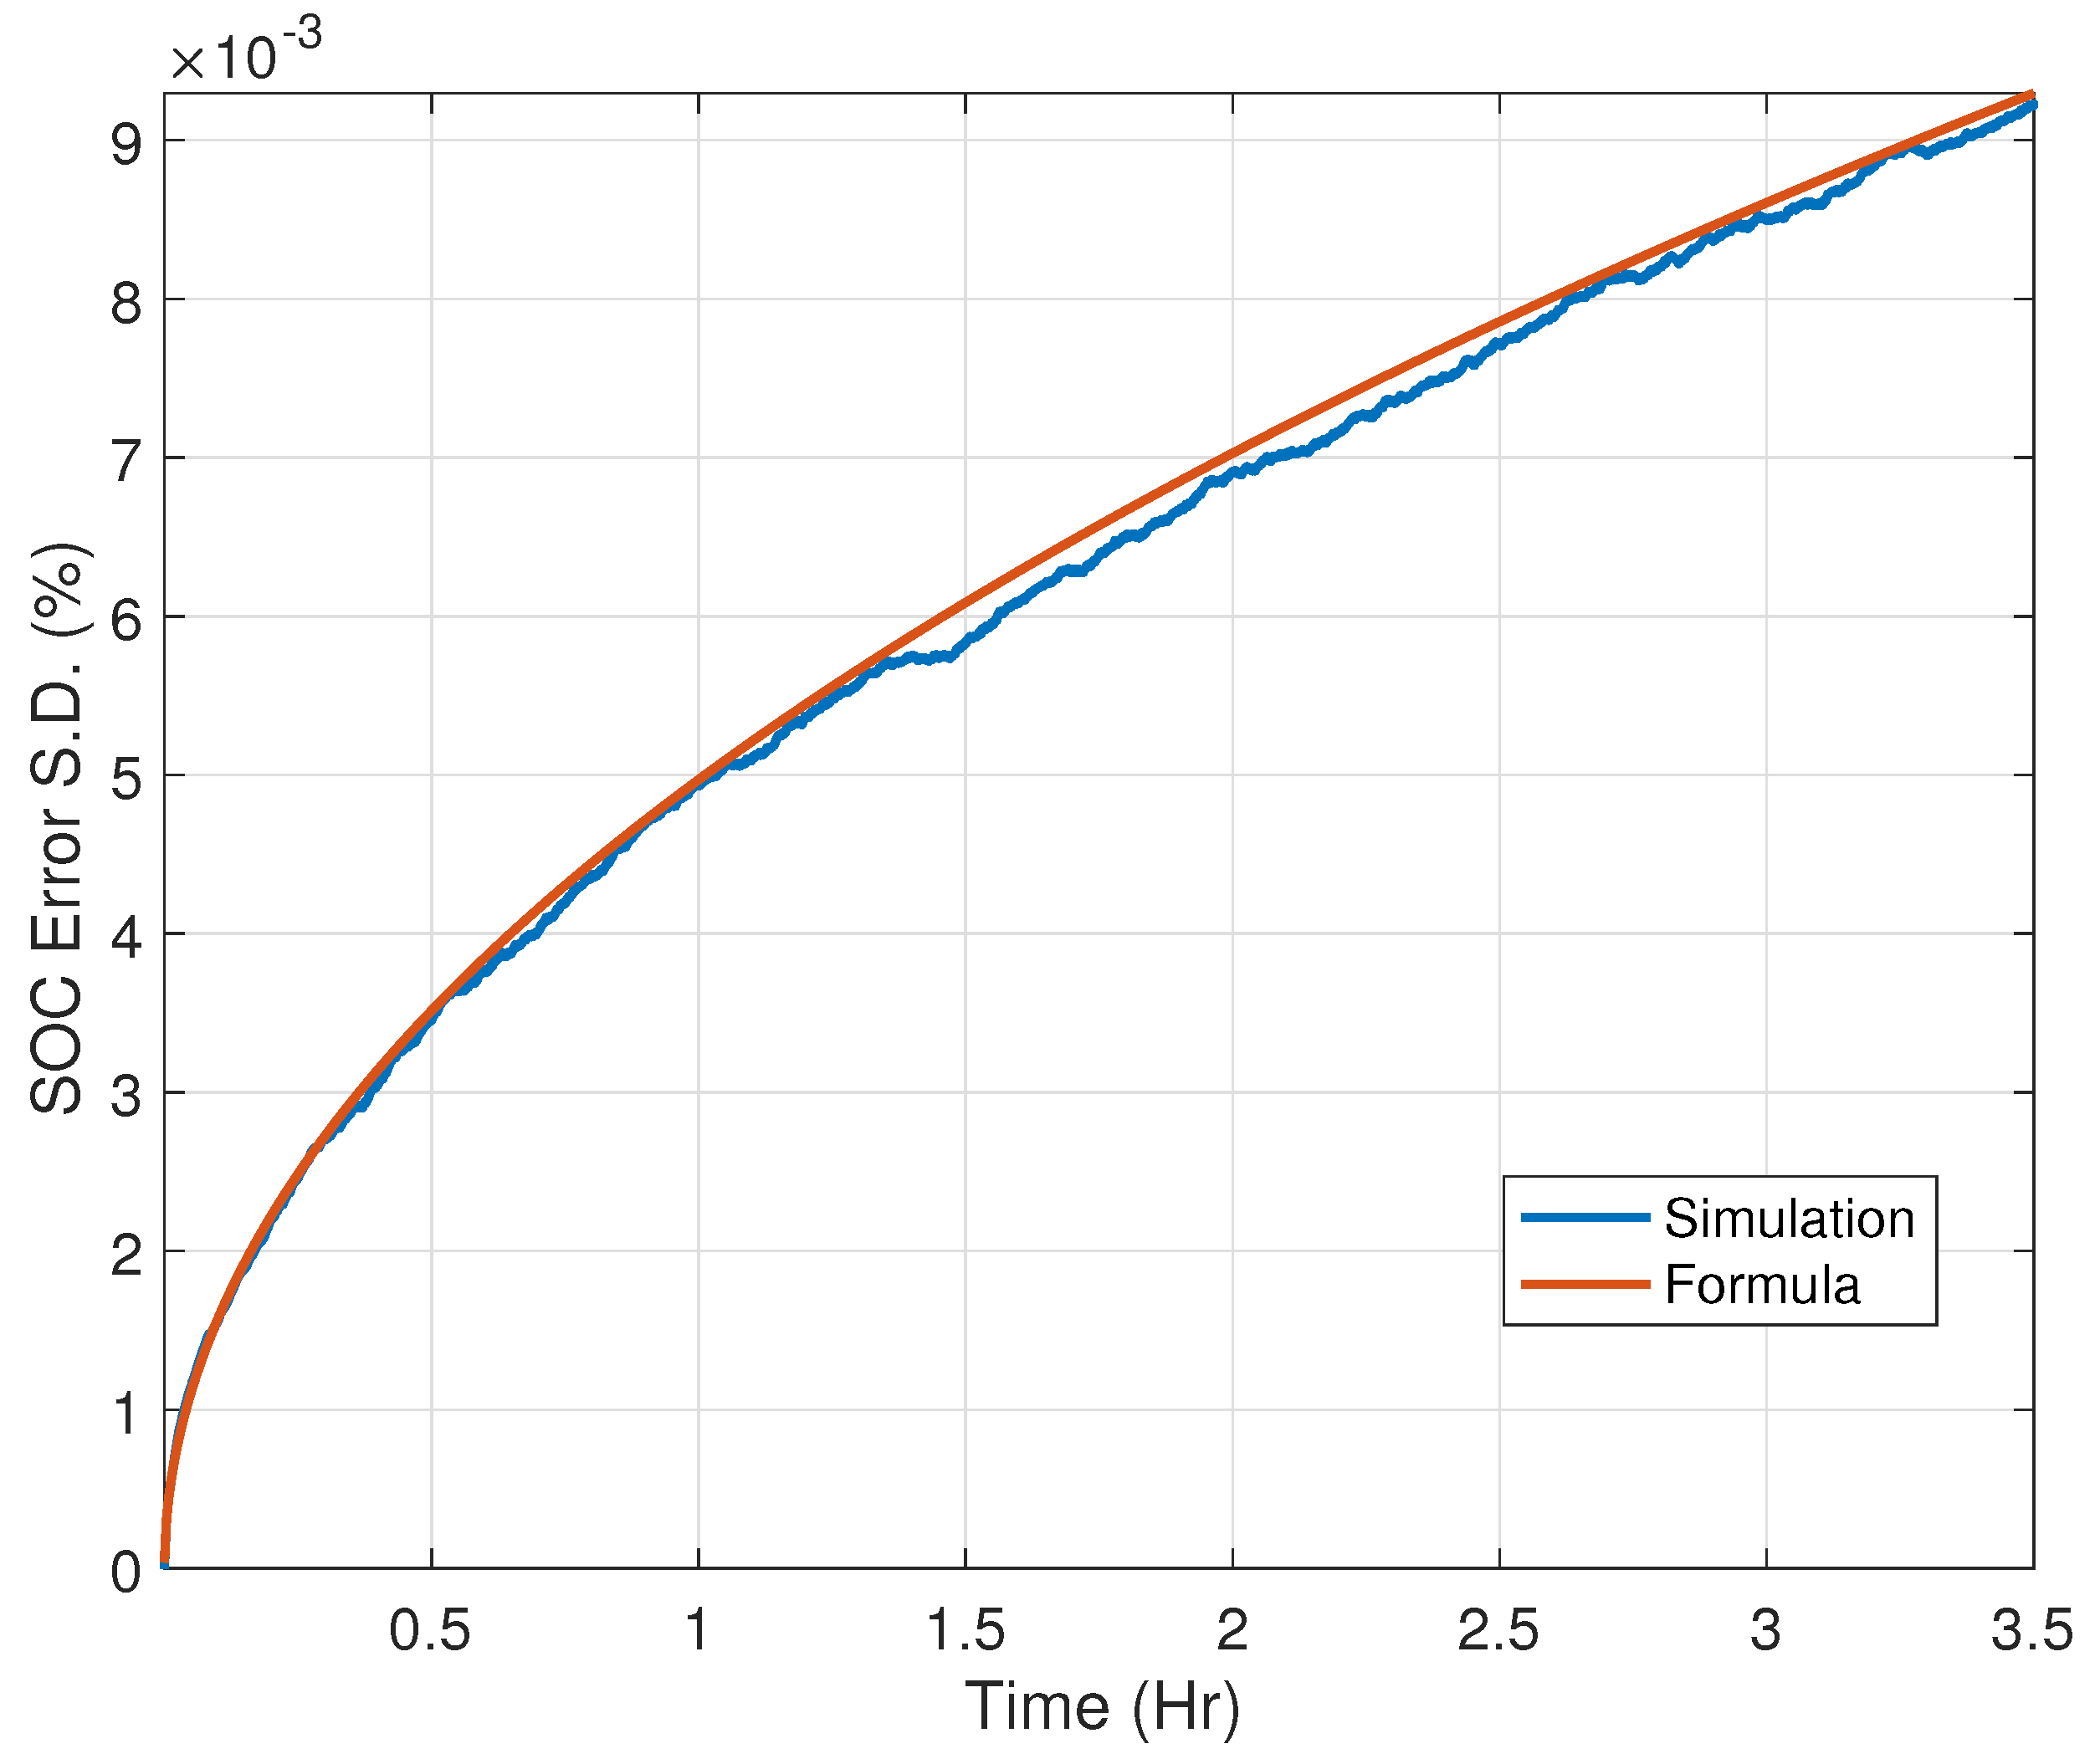
Figure 6 shows the standard deviation of the SOC error computed using the theoretical Formula (29) and the standard deviation of the SOC error computed using the Monte Carlo method detailed in (92). As expected, the theoretical derivation matches the SOC error standard deviation obtained through 1000 Monte Carlo simulations.
![Energies 14 04074 g003]()
![Energies 14 04074 g004]()
![Energies 14 04074 g005]()
![Energies 14 04074 g006]()
Figure 3.
Generic illustration to computing the true amount of Coulombs. Computing true Coulombs is challenging. Here, we assume the true current to take the above pattern; under this assumption,
Figure 3.
Generic illustration to computing the true amount of Coulombs. Computing true Coulombs is challenging. Here, we assume the true current to take the above pattern; under this assumption,

Figure 4.
Current measurement error. True vs. measured current that was simulated by assuming a current measurement error standard deviation of .
Figure 4.
Current measurement error. True vs. measured current that was simulated by assuming a current measurement error standard deviation of .

Figure 5.
Effect of current measurement error in SOC. (a) At the start of the experiment, the true SOC and the computed SOC through Coulomb counting are nearly identical. (b) Within 3.5 h, the true SOC and the computed SOC are slightly different. Simulation Parameters: current measurement error s.d. and sampling time

Figure 6.
Standard deviation of the SOC error due to measurement error in current. Simulated value is plotted in comparison with the theoretical value derived in (29) shown against time that corresponds to n.
Figure 6.
Standard deviation of the SOC error due to measurement error in current. Simulated value is plotted in comparison with the theoretical value derived in (29) shown against time that corresponds to n.

6.2. Effect of Current Integration Error
The objective in this section is to validate the standard deviation of the SOC error due to integration that we derived in (44). For this experiment, errors from all the other possible sources of uncertainties (current measurement error, battery capacity error, timing oscillator error as well as initial SOC error) are assumed to be zero. In order to do this, similar to the previous analysis, a special current profile shown in Figure 7 is made up of constant current signals of different amplitudes. For this profile, the amount of Coulombs can be perfectly computed using geometry similar to the example illustrated in Figure 3. Once the Coulombs are computed, the true SOC can be computed by making use of the knowledge of the true battery capacity. The following procedure details the Monte Carlo experiment to validate the standard deviation of the SOC error due to current integration error:
- 1.
- Generate a perfectly integrable current, where the generated current allows one to perfectly compute shown in (30).
- –
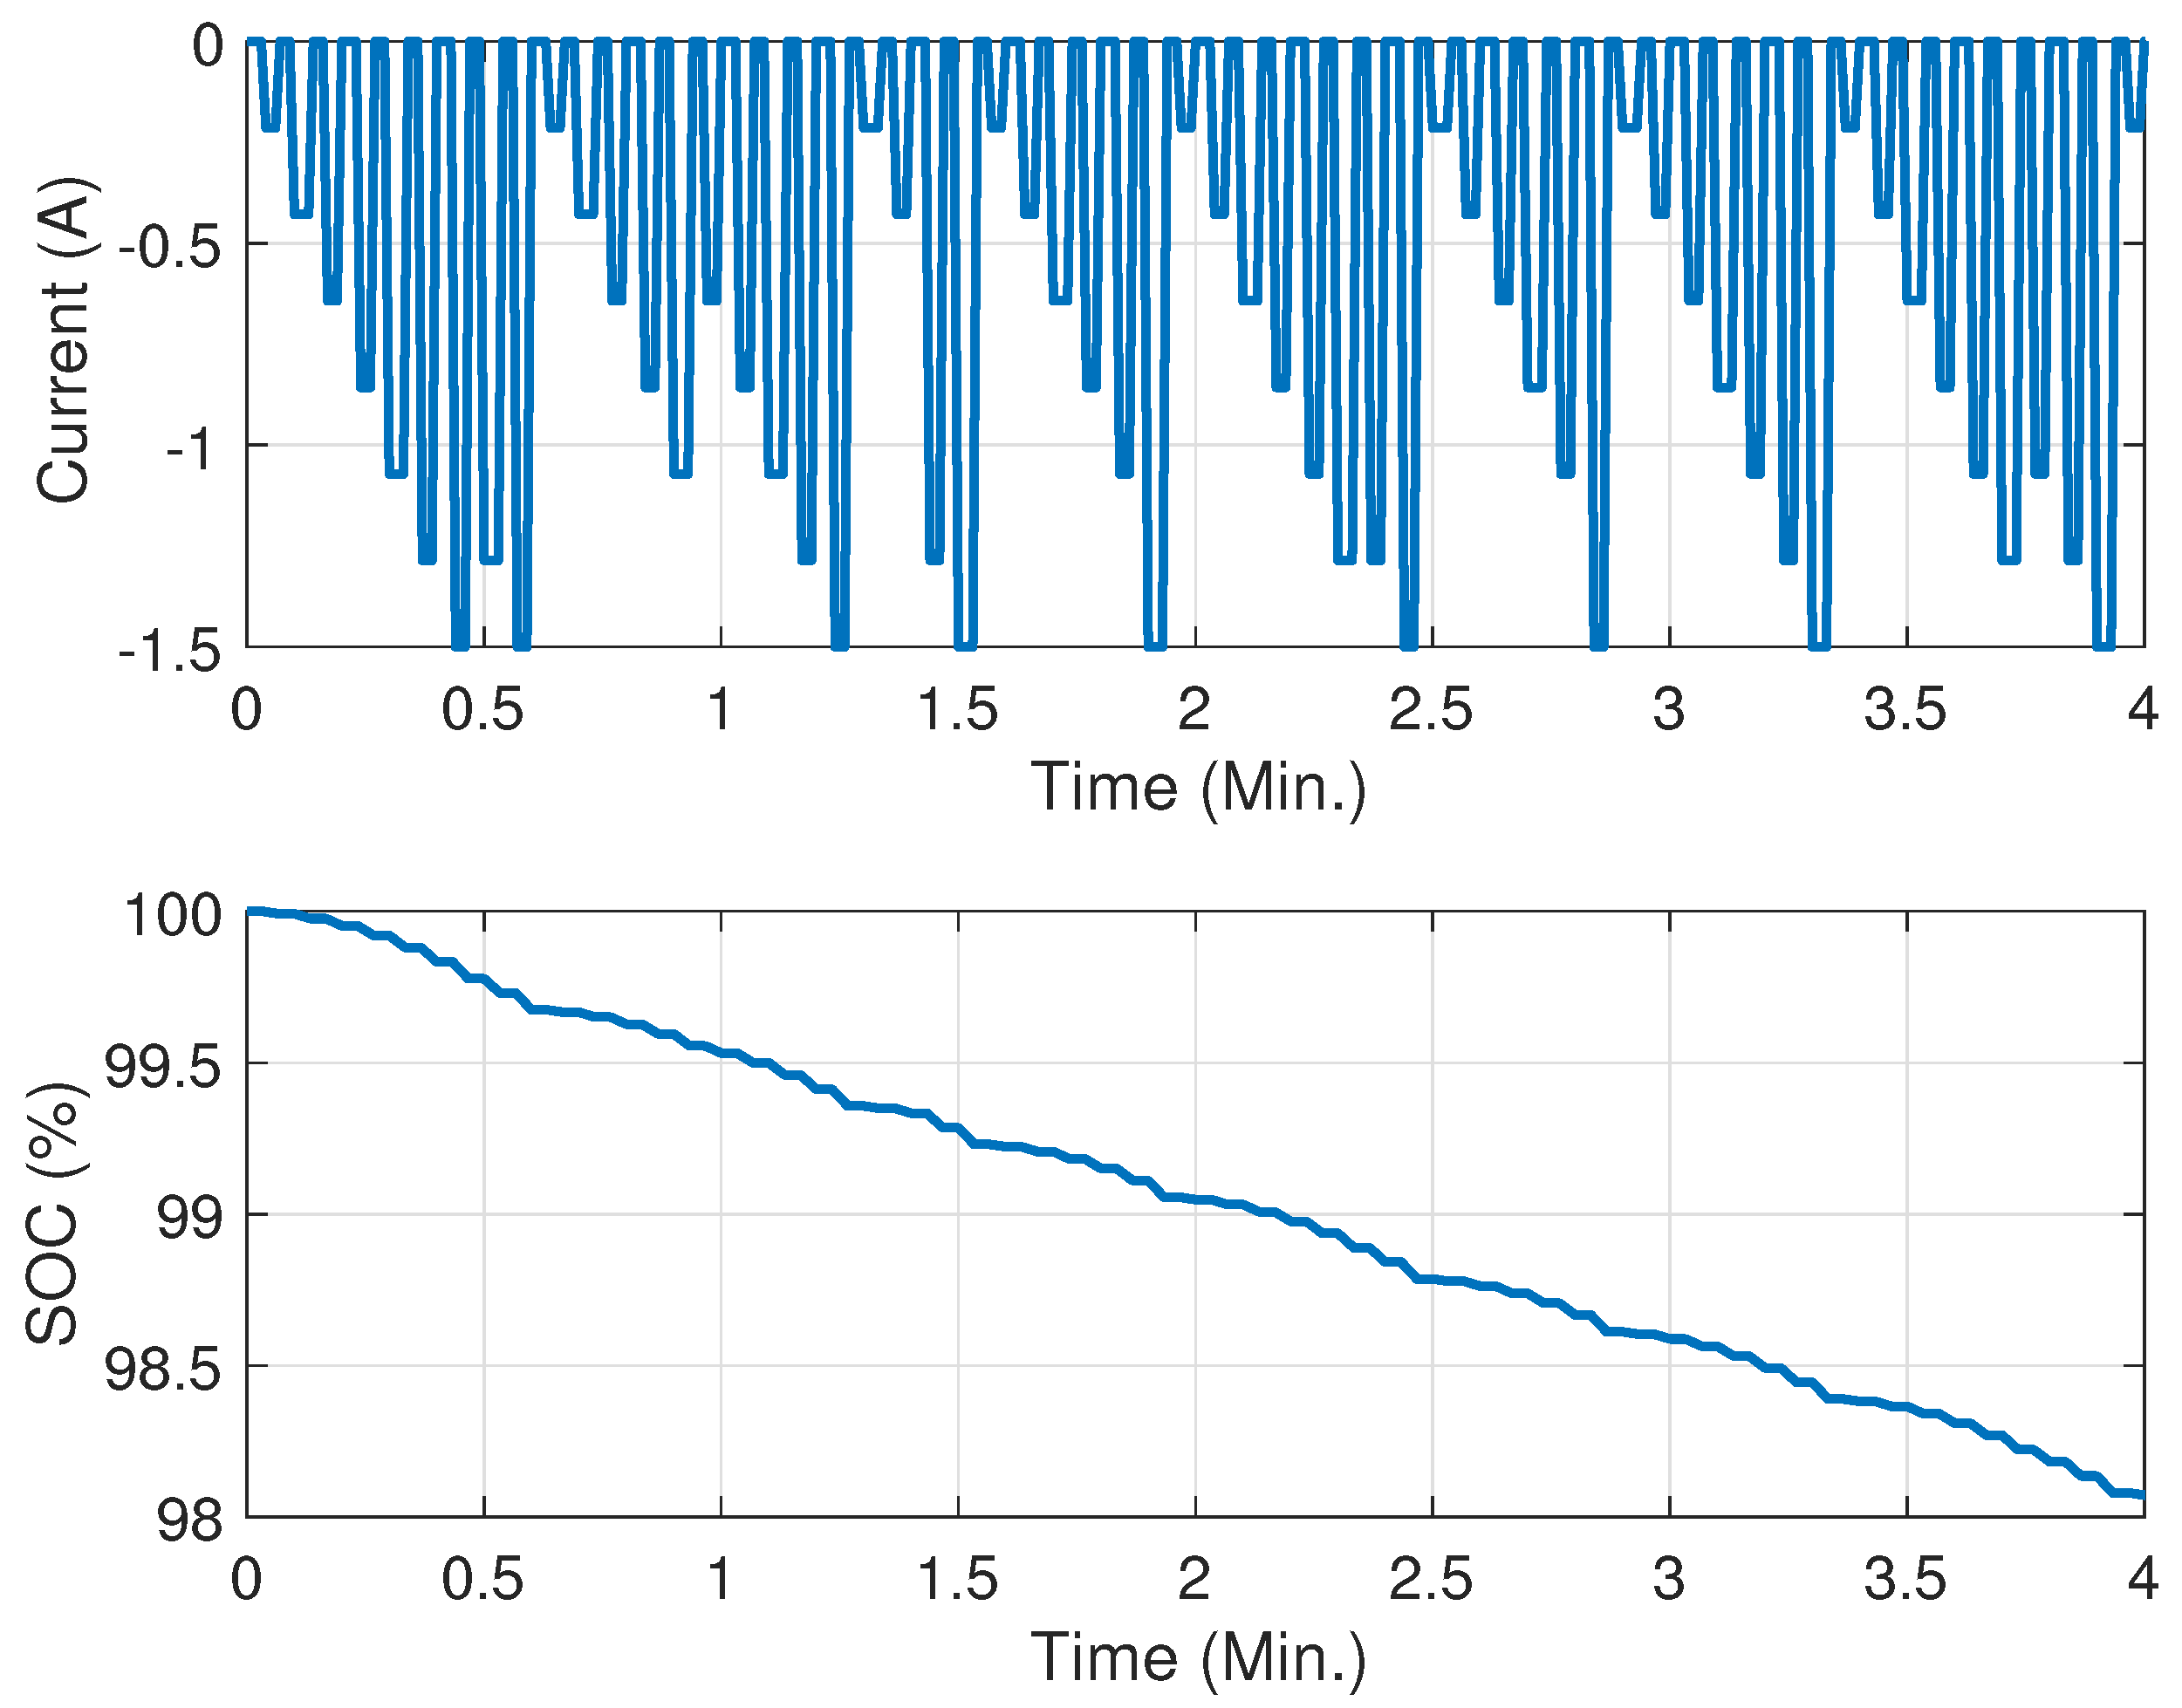
- First 18 s of the noiseless current profile is shown in red in Figure 7. Note that the true current profile is the downsampled version—this emulates the fact that the discretely measured current is always a downsampled version, and it will never be the same as the real current (shown in blue). First four minutes of the current profile along with the true SOC (assuming initial SOC =1) is shown in Figure 8.
- 2.
- Let the true battery capacity be .
- 3.
- Assuming the knowledge of the true capacity, compute the true SOC at time k, , using the geometric approach illustrated in Figure 3 for the entire duration of the profile, i.e., for where n denotes the number of samples in the entire current profile.
- –
- The second plot in Figure 8 shows the true SOC.
- 4.
- Set , where m denotes the index of the Monte Carlo run.
- 5.
- 6.
- If , where M denotes the maximum number of Monte Carlo runs, go to step (g); otherwise, set and go to step (e).
- 7.
- End of simulation (all the data generated during the above steps need to be stored for analysis).
After Monte Carlo runs, the standard deviation of the SOC error due to current measurement error is computed as follows:
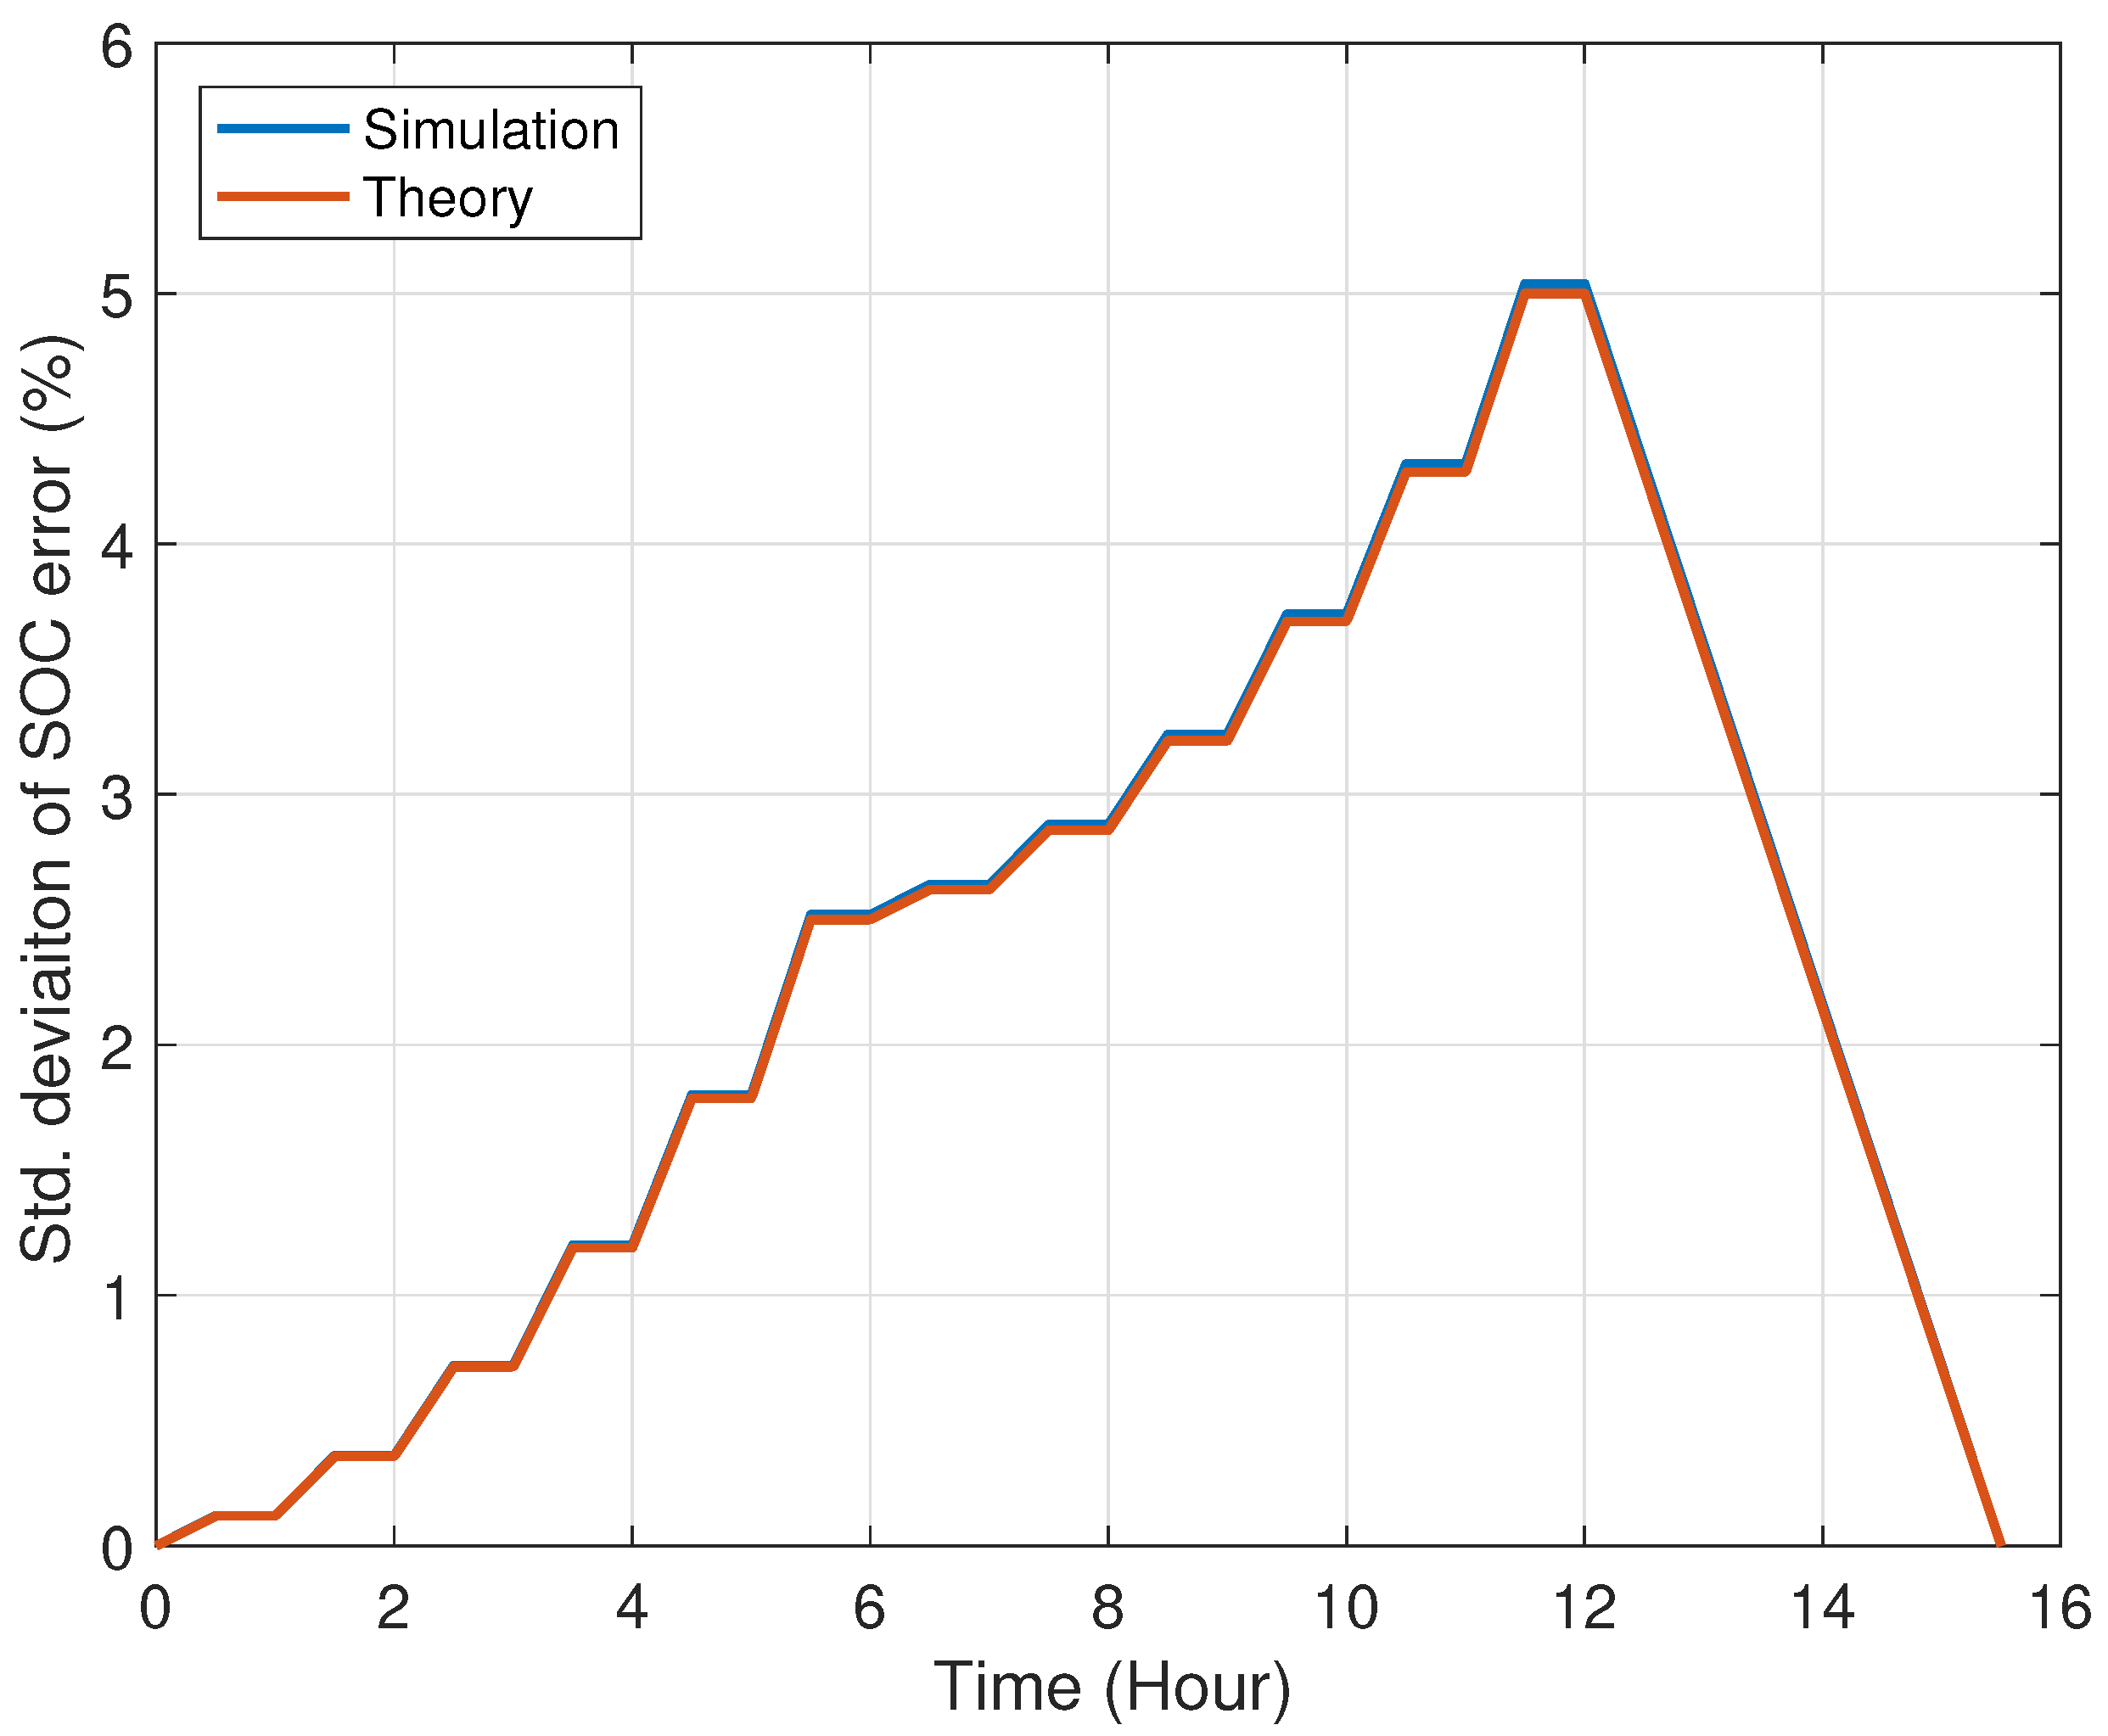
Figure 9 shows the standard deviations of error computed through the theoretical approach, in (46), and through the Monte Carlo simulation approach, (46). The constant for the theoretical approach in (46) is found to be through empirical means (i.e., different values for were used until the theoretical curve in red aligned well with the simulation curve in blue). It must be noted that will be different for different current profiles.
![Energies 14 04074 g007]()
![Energies 14 04074 g008]()
![Energies 14 04074 g009]()
Figure 7.
Perfectly integrable current profile. The blue curve shows a perfectly integrable current that is made of rectangular pulses of different amplitude; it can be integrated using the geometric approach detailed in Figure 3. The measured current, shown in red, is a downsampled version of the true current profile—this emulates the way in which discrete measurement systems measure the voltage/current in BMS.

Figure 8.
Current profile and corresponding SOC. First four minutes of the true current profile and the corresponding true SOC that is computed using the geometric approach detailed in Figure 3. Only 4 min of profiles are shown; the true profile lasted for 4 h (see Figure 9).

Figure 9.
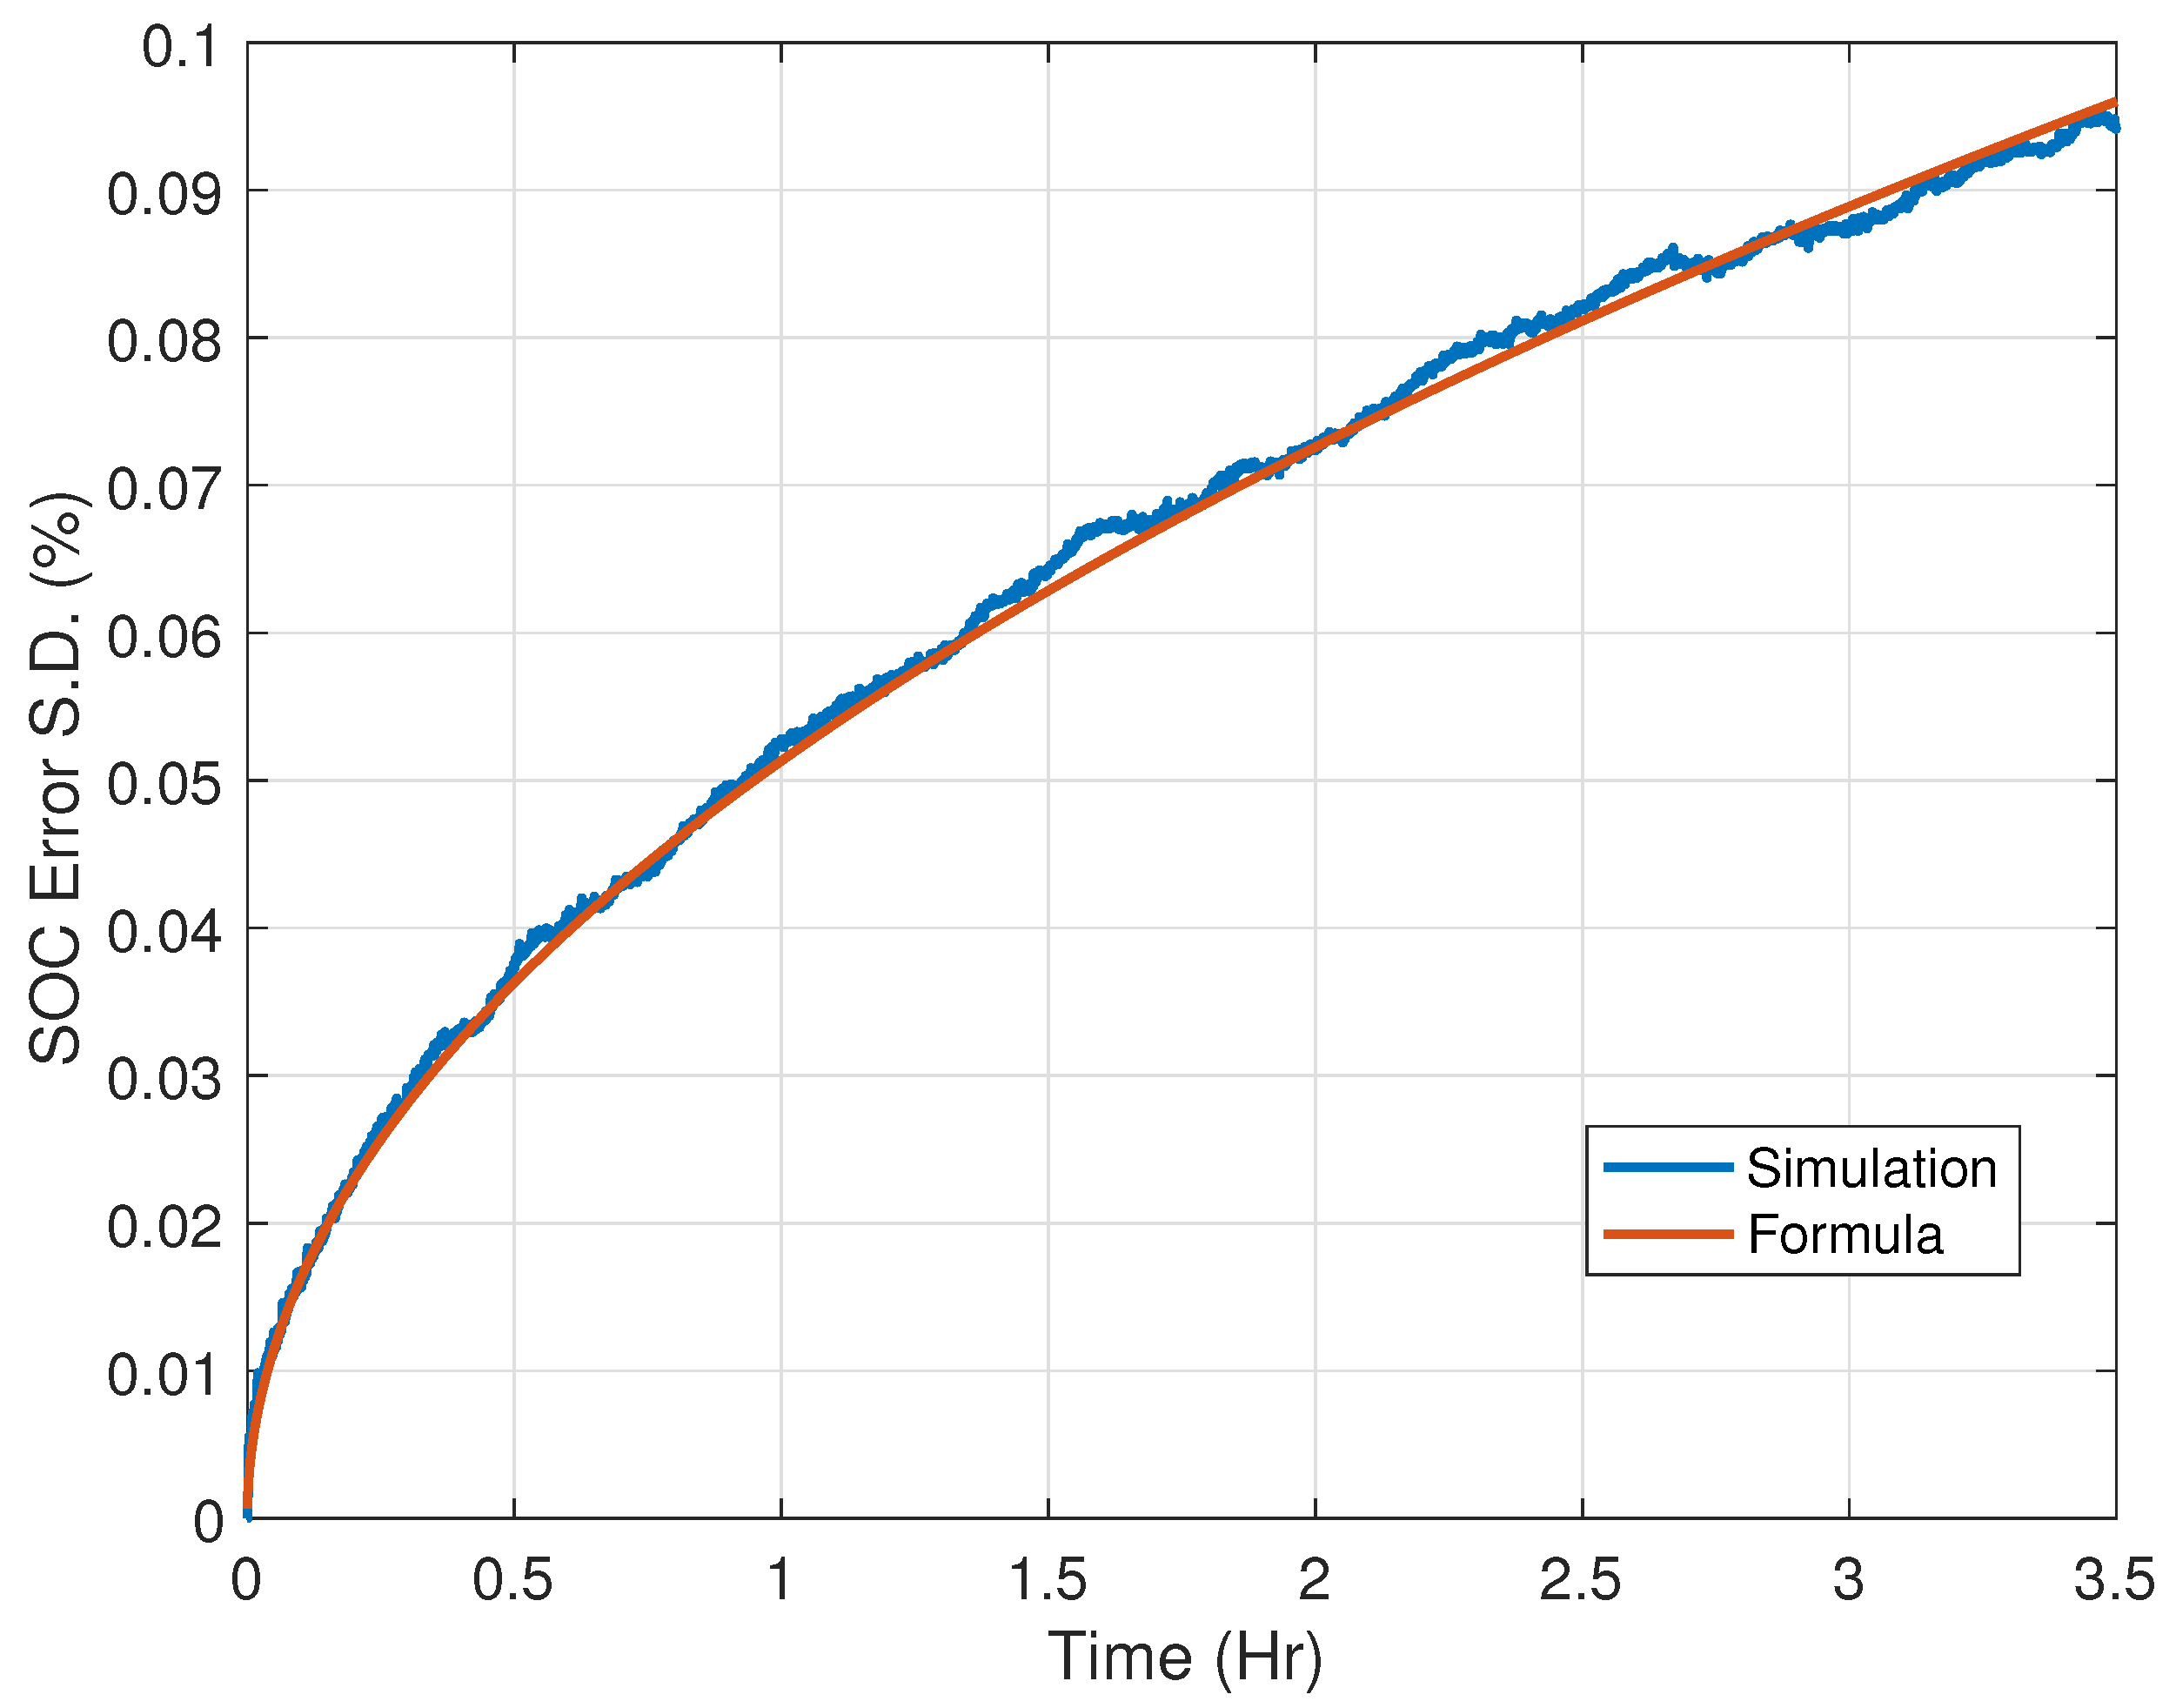
The standard deviation of SOC error because of the current integration error. The red curve is the theoretical value of the s.d. derived in (46); the blue curve shows , the s.d. obtained through Monte Carlo simulation as shown in (93). The constant is computed through empirical methods to be . It must be noted that varies for different types of current profiles.
Figure 9.
The standard deviation of SOC error because of the current integration error. The red curve is the theoretical value of the s.d. derived in (46); the blue curve shows , the s.d. obtained through Monte Carlo simulation as shown in (93). The constant is computed through empirical methods to be . It must be noted that varies for different types of current profiles.

6.3. Effect of Battery Capacity Uncertainty
The objective in this section is to validate the standard deviation of the SOC error due to the battery capacity uncertainty that we derived in (59) using the Monte Carlo simulation approach. For this experiment, errors from all the other possible sources of uncertainties (current measurement error, current integration error, timing oscillator error as well as initial SOC error) are assumed to be zero. In order to do this, similar to the previous analysis, a special current profile that is shown in Figure 10 is created. The current profile in Figure 10 is made of low frequency (constant current) signals of different amplitudes. For this profile, the amount of Coulombs can be perfectly computed using geometry similar to the example illustrated in Figure 3. Once the Coulombs are computed, the true SOC can be computed by making use of the knowledge of the true battery capacity. The following procedure is followed to perform the Monte Carlo experiment to validate the standard deviation of the SOC error, due to uncertainty in battery capacity:
- 1.
- Generate a perfectly integrable current where the generated current profile denotes in (10).
- –
- The entire true current profile generated for the experiment is shown at the top plot Figure 10.
- 2.
- Let the true battery capacity be .
- 3.
- Assuming the knowledge of the true capacity, compute the true SOC at time k, , using the geometric approach illustrated Figure 3 for the entire duration of the profile, i.e., for where n denotes the number of samples in the entire current profile.
- –
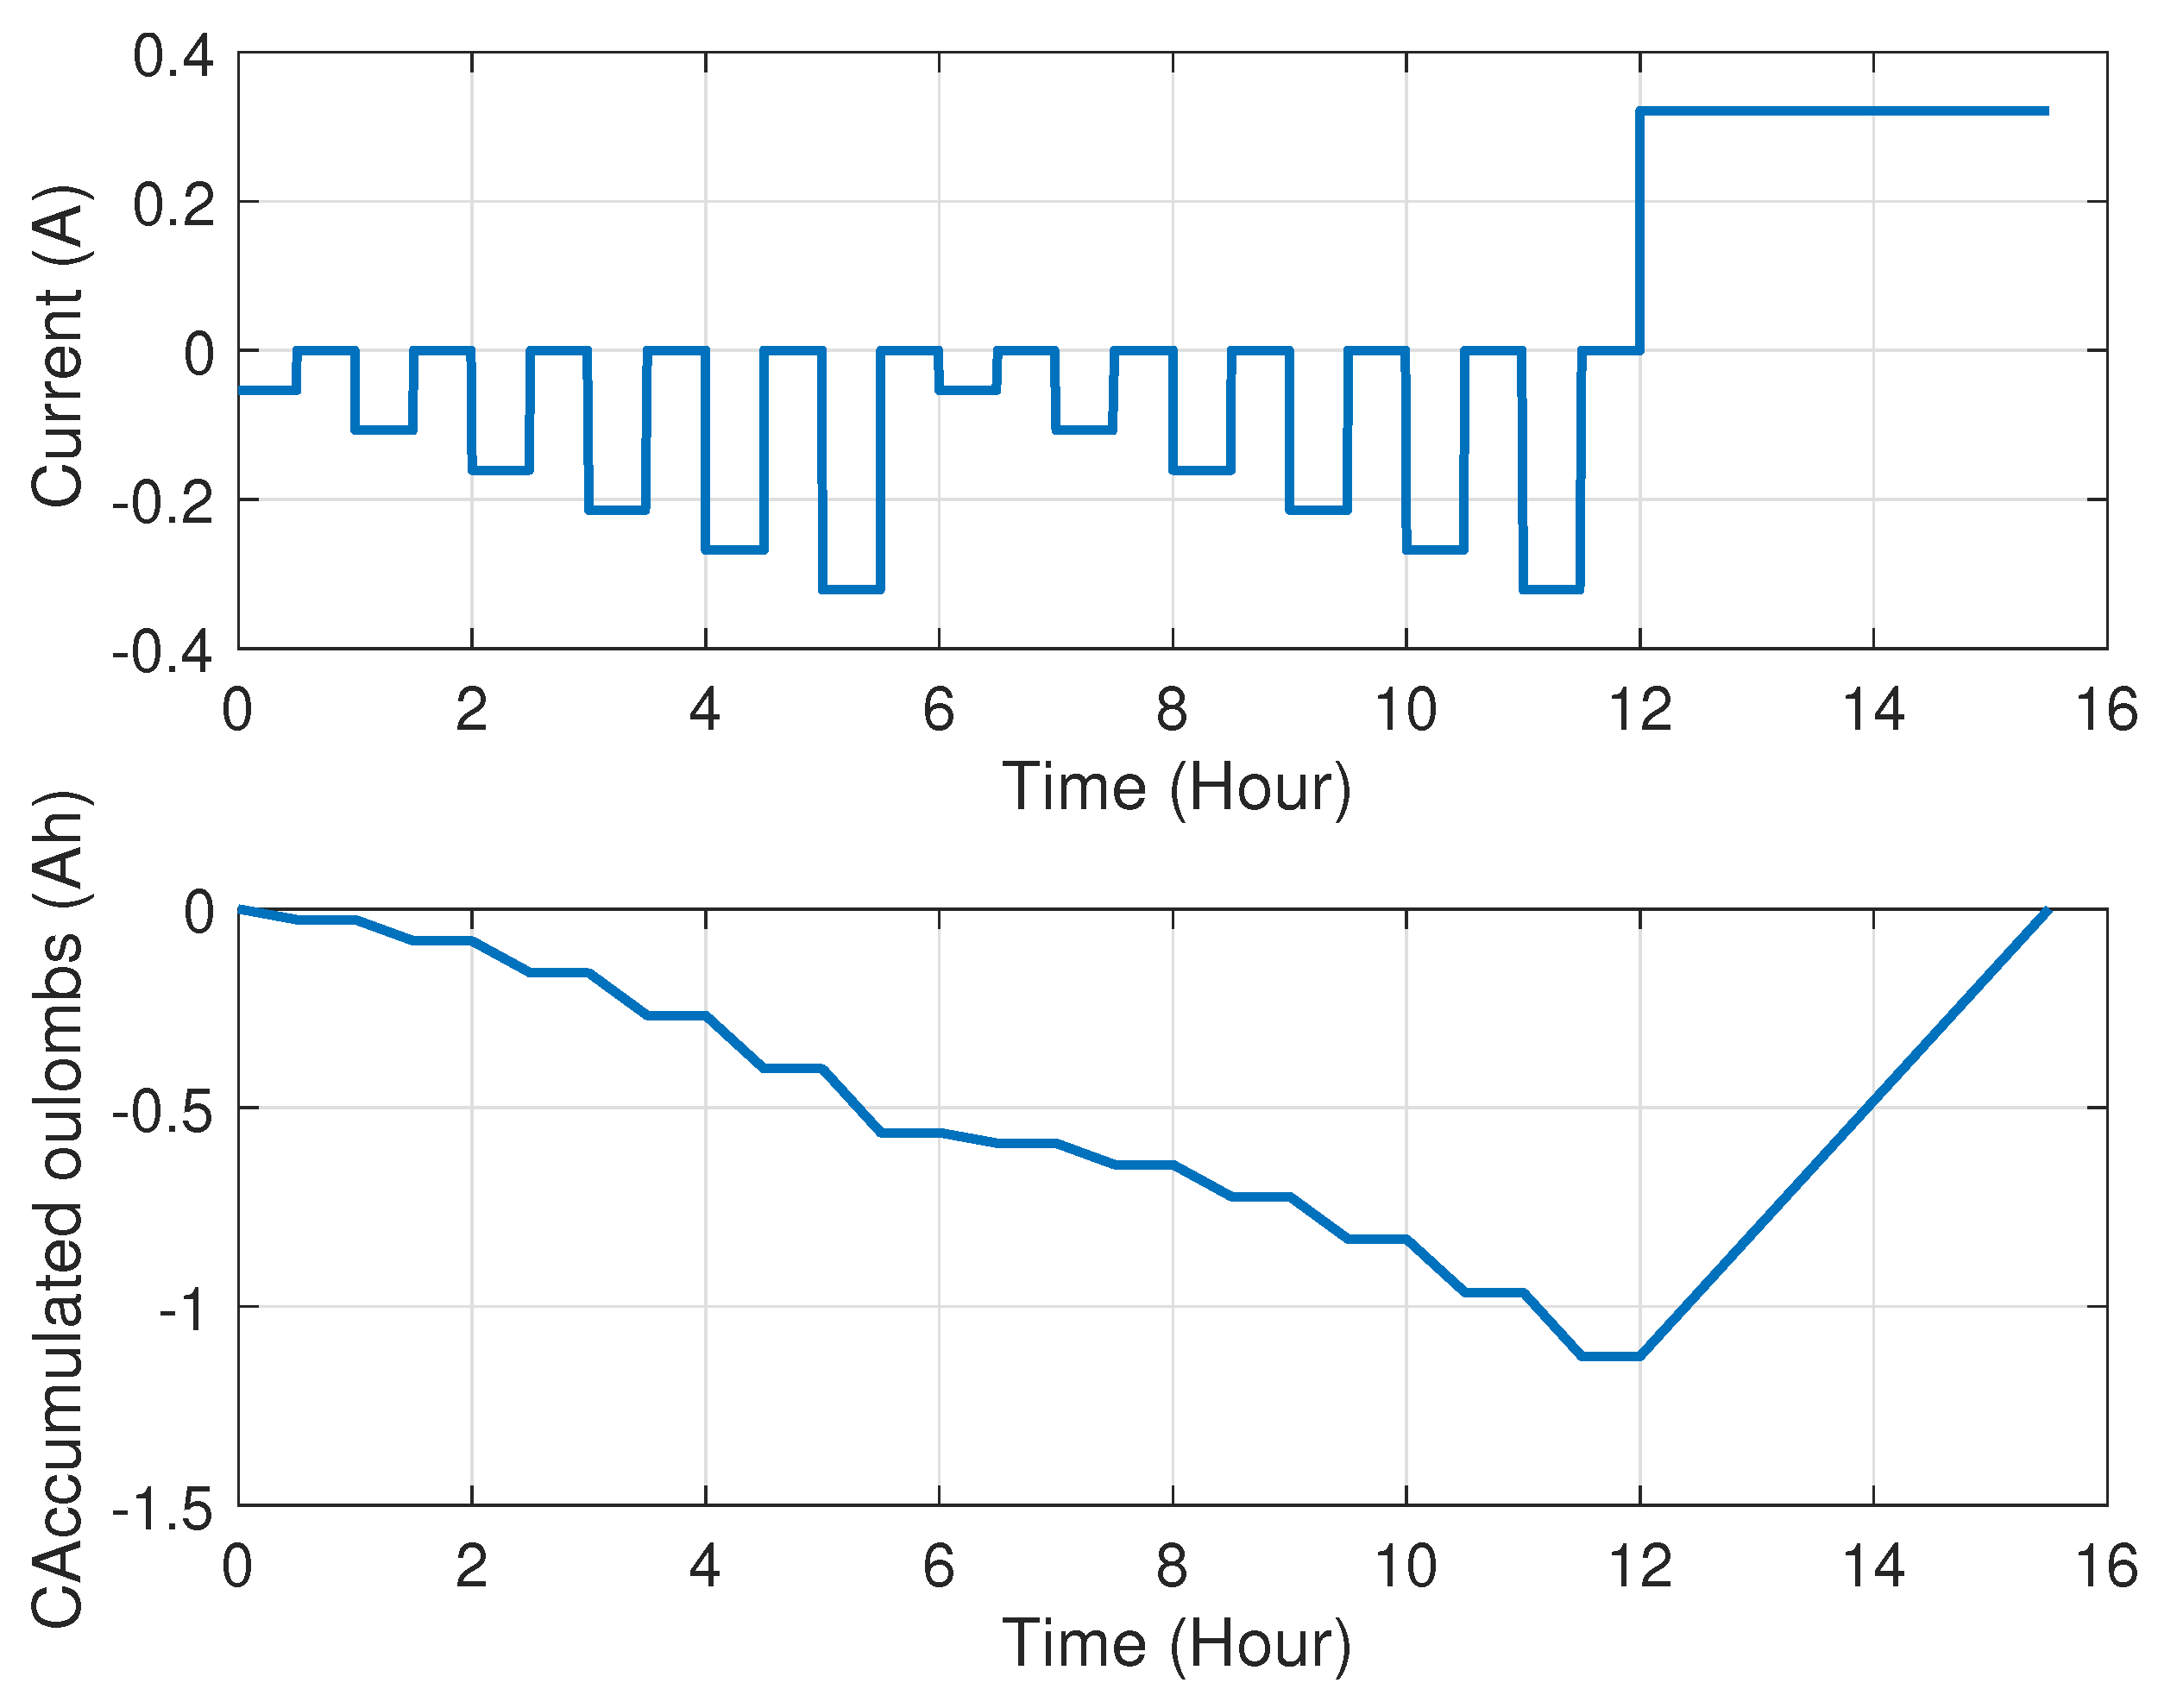
- The second plot in Figure 10 shows the accumulated Coulombs . From this, the true SOC can be computed as
- 4.
- Set , where m denotes the index of the Monte Carlo run.
- 5.
- Assuming a capacity estimation error s.d. of , use the capacity uncertainty model of (48) to compute the estimated battery capacity where it is a zero mean random number with standard deviation
- –
- Figure 11 shows all the values generated for in the form of a histogram.
- 6.
- Compute the (noisy) SOC , using the traditional Coulomb counting equation given in (65), i.e., the following:where the subscript m denotes the Monte-Carlo run.
- –
- Figure 12 shows the true SOC and the computed noisy SOC for different Monte Carlo runs.
- 7.
- If , where M denotes the maximum number of Monte Carlo runs, go to step (h); otherwise, set and go to step (e).
- 8.
- End of simulation (all the data generated during the above steps need to be stored for analysis).
After Monte Carlo runs, the standard deviation of the SOC error due to current measurement error is computed as follows:
Figure 13 shows the SOC error standard deviation obtained through the theoretical Equation (59) as well as the Monte Carlo simulation approach summarized through (94). It can be noticed that the theoretical value and the simulated values slightly differ—this can be attributed to the approximation made in (51) in order to derive the theoretical value.
![Energies 14 04074 g010]()
![Energies 14 04074 g011]()
![Energies 14 04074 g012]()
![Energies 14 04074 g013]()
Figure 10.
Simulated current profile and corresponding true SOC. This figure shows the difference between the true SOC and the SOC with battery capacity uncertainty after 100 runs of the Monte Carlo simulation.
Figure 10.
Simulated current profile and corresponding true SOC. This figure shows the difference between the true SOC and the SOC with battery capacity uncertainty after 100 runs of the Monte Carlo simulation.

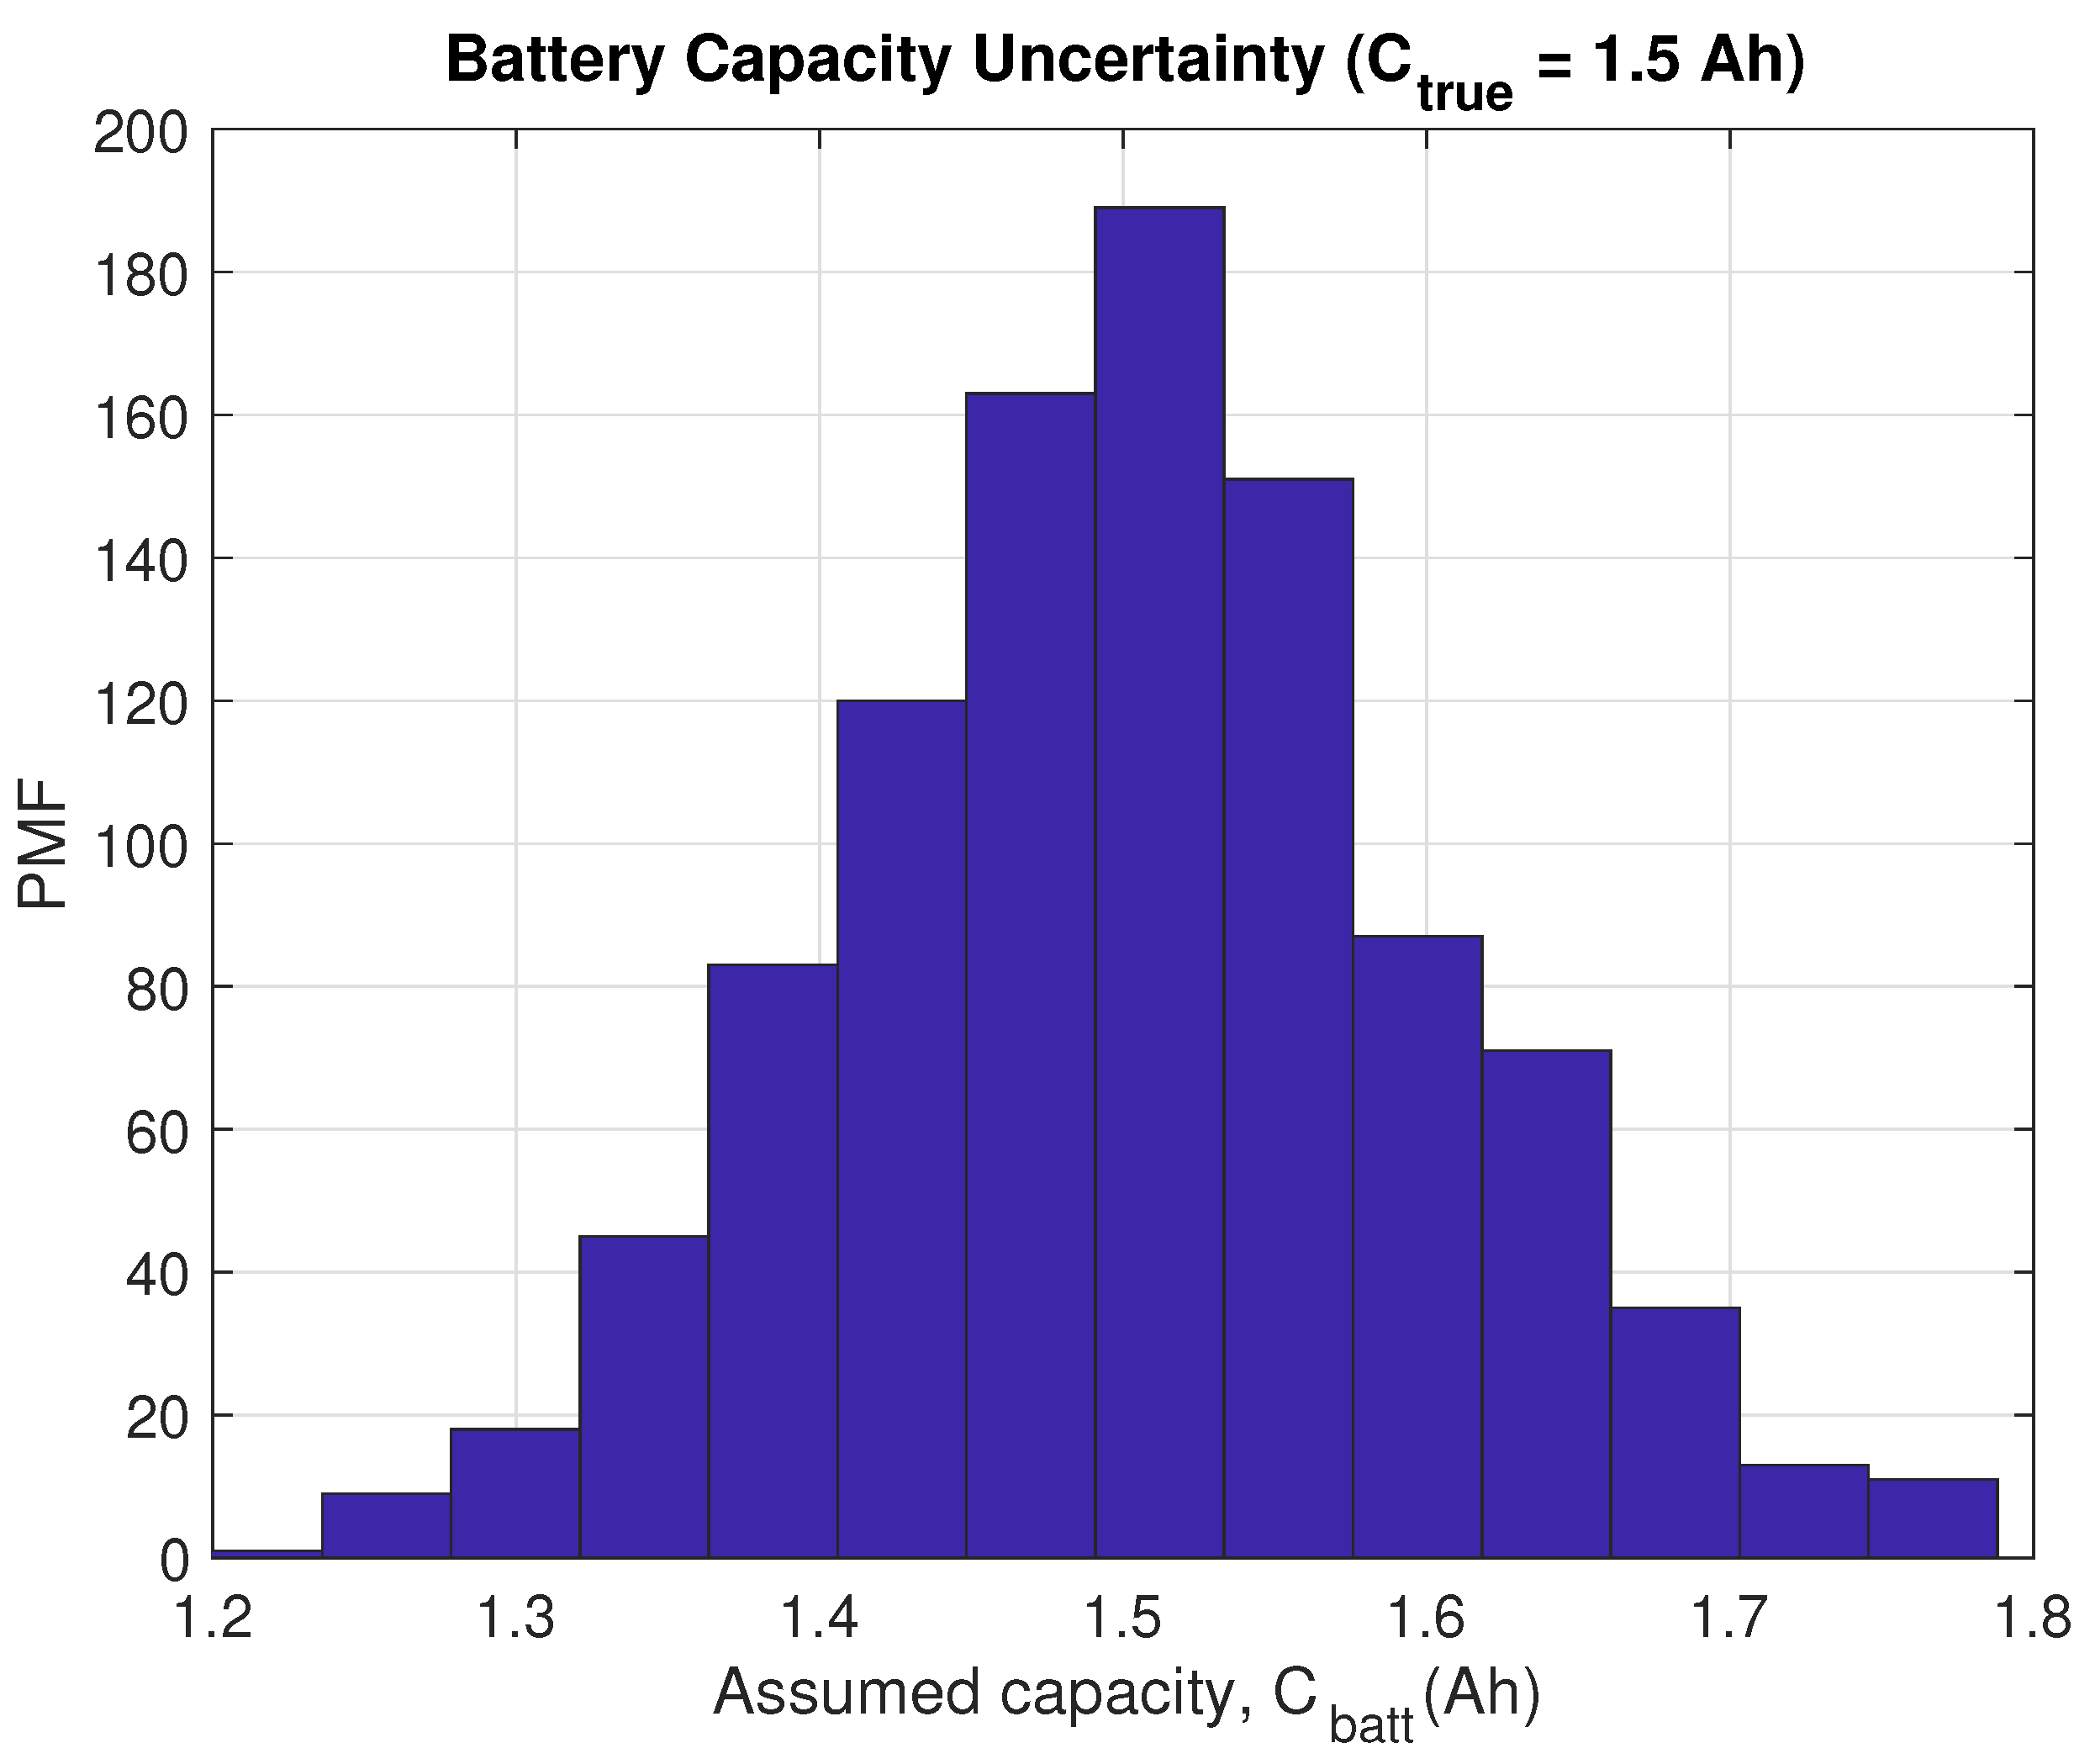
Figure 11.
The histogram of generated during 1000 Monte Carlo simulations. This graph shows that the battery capacity error that we use in our Monte Carlo runs is reasonable.
Figure 11.
The histogram of generated during 1000 Monte Carlo simulations. This graph shows that the battery capacity error that we use in our Monte Carlo runs is reasonable.

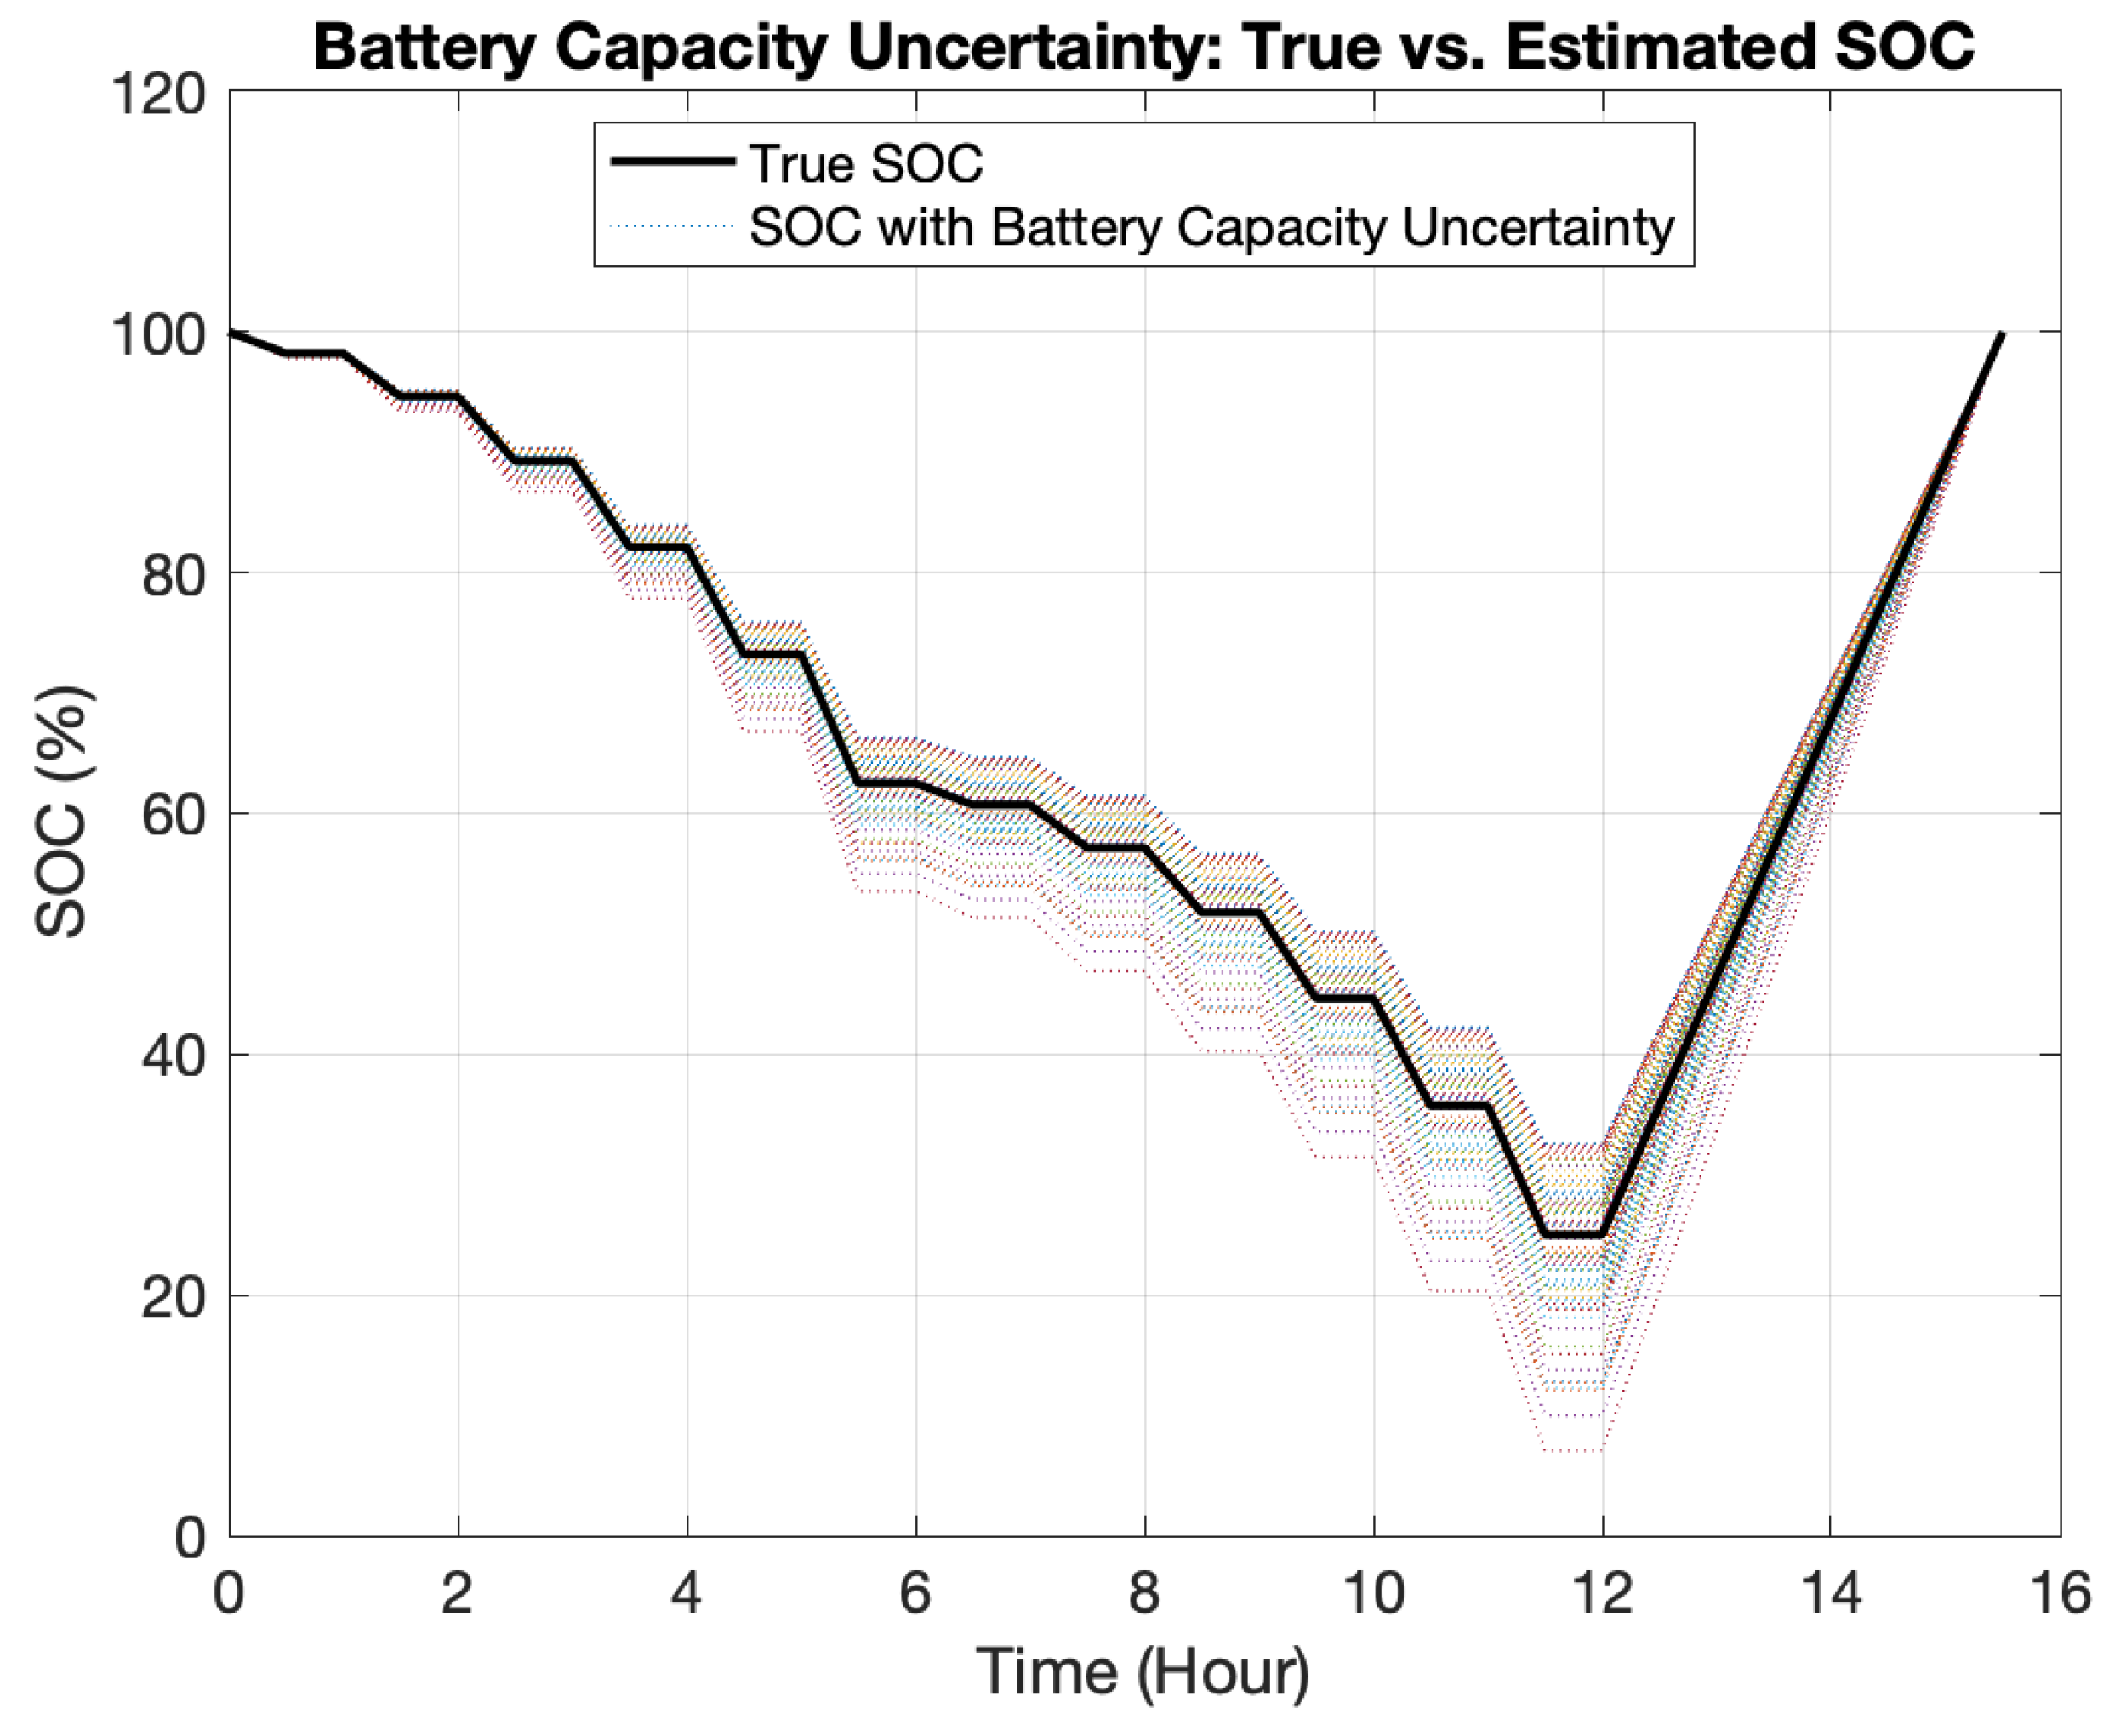
Figure 12.
SOC error due to battery capacity uncertainty. This figure shows the difference between the true SOC and the SOC with battery capacity uncertainty for different simulations. The true SOC is computed using the true battery capacity of ; each Monte Carlo run assumes a different battery that is distributed . Figure 11 shows all the during different runs.

Figure 13.
The standard deviation of SOC error due to uncertainty in battery capacity. The red curve is the theoretical value of the s.d. derived in (59); the blue curve shows , the s.d. obtained through the Monte Carlo simulation as shown in (94). Due to the approximation made in (51), the theoretical and simulated values slightly differ.

7. Conclusions and Discussion
In this paper, we developed an in-depth mathematical analysis of the Coulomb counting method for state-of-charge estimation in rechargeable batteries. In particular, we derived the exact statistical values of the state-of-charge error as a result of the following: (i) current measurement error, (ii) current integration error, (iii) battery capacity uncertainty, and (iv) timing oscillator error. The results revealed that the SOC error because of the current measurement and current integration error grows with time (time-proportional errors), whereas the SOC error due to the uncertainty in the capacity of the battery and timing oscillator error are proportional to the accumulated state of charge (SOC-proportional errors). The time proportional errors increase indefinitely with time and may result in significant errors in the long run, e.g., satellites that operate for decades. The SOC-proportional errors reach their peak within one cycle; hence, the SOC estimates should be accompanied with standard deviation of the estimation error. The models presented in this paper will be useful to improve the overall state-of-charge estimations in the majority of existing approaches; in particular, the statistics developed in this paper define the process model for Kalman filter-based approaches to SOC estimation.
Author Contributions
Conceptualization, B.B.; methodology, B.B., K.M., and A.R.; software, A.R. and B.B.; validation, B.B., and K.P.; formal analysis, B.B.; investigation, K.M.; resources, B.B.; data curation, K.M.; writing—original draft preparation, K.M., A.R., B.B.; writing—review and editing, B.B. and K.P; visualization, K.M.; supervision, B.B.; project administration, B.B.; funding acquisition, B.B. All authors have read and agreed to the published version of the manuscript.
Funding
B. Balasingam acknowledges the support of the Natural Sciences and Engineering Research Council of Canada (NSERC) for financial support under the Discovery Grants (DG) program (funding reference number RGPIN-2018-04557). Research of K. Pattipati was supported in part by the U.S. Office of Naval Research and U.S. Naval Research Laboratory under Grants #N00014-18-1-1238, #N00173-16-1-G905, #HPCM034125HQU and by the Space Technology Research Institute grant (#80NSSC19K1076) from NASA’s Space Technology Research Grants Program.
Institutional Review Board Statement
Not applicable.
Informed Consent Statement
Not applicable.
Acknowledgments
B. Balasingam acknowledges the help of Mostafa Ahmed for literature review in Section 1 of this manuscript.
Conflicts of Interest
The authors declare no conflict of interes.
Abbreviations
The following abbreviations are used in this manuscript:
| CRLB | Cramer–Rao lower bound |
| ECM | Equivalent circuit model |
| EKF | Extended Kalman filter |
| OCV | Open circuit voltage |
| PCRLB | Posterior Cramer–Rao lower bound |
| RLS | Recursive least squares |
| SOC | State of charge |
List of Notations
A list of the notations used in this paper is summarized below:
| True battery capacity (see (48)) | |
| Assumed battery capacity (5) | |
| Battery capacity uncertainty (48) | |
| Current integration error at time k (30) | |
| Sampling duration at time k (8) | |
| Sampling time that is assumed constant (14) | |
| True sampling time (71) | |
| Timing oscillator error (71) | |
| Coulomb counting efficiency (5) | |
| Charging efficiency (6) | |
| Discharging efficiency (6) | |
| Current through battery at time t (5) | |
| Sampled current through battery at time instant k (7) | |
| Current measurement noise (10) | |
| Process noise (3) | |
| Measurement noise (4) | |
| Integration error constant (36) | |
| Current measurement noise coefficient (28) | |
| Current integration noise coefficient (45) | |
| Capacity uncertainty coefficient (60) | |
| Charging uncertainty coefficient (68) | |
| Discharging uncertainty coefficient (68) | |
| Timing error coefficient (72) | |
| SOC at time t (5) | |
| Initial SOC (5) | |
| SOC at discretized time instance k (7) | |
| Change in SOC over n samples (16) | |
| Std. deviation of current measurement error (11) | |
| Std. deviation of load current changes (33) | |
| Std. deviation of battery capacity uncertainty (49) | |
| Std. deviation of charging uncertainty (70) | |
| Std. deviation of discharging uncertainty (70) | |
| Std. deviation of timing uncertainty (90) | |
| Std. deviation of (25) | |
| Std. deviation of (43) | |
| Std. deviation of (59) | |
| Std. deviation of (70) | |
| Std. deviation of (79) | |
| Std. deviation of (90) | |
| SOC error due to current measurement error (16) | |
| SOC error due to current integration error (39) | |
| SOC error due to battery capacity uncertainty(54) | |
| SOC error due to the uncertainty in c/d efficiency (66) | |
| SOC error due to timing oscillator uncertainty (75) | |
| SOC error due combined uncertainties (87) | |
| Measured current at time k (10) | |
| Measured voltage at time k (91) |
References
- Balasingam, B.; Pattipati, K. Elements of a Robust Battery-Management System: From Fast Characterization to Universality and More. IEEE Electrif. Mag. 2018, 6, 34–37. [Google Scholar] [CrossRef]
- Waag, W.; Fleischer, C.; Sauer, D.U. On-line estimation of lithium-ion battery impedance parameters using a novel varied-parameters approach. J. Power Sources 2013, 237, 260–269. [Google Scholar] [CrossRef]
- Plett, G.L. Extended Kalman filtering for battery management systems of LiPB-based HEV battery packs: Part 2. Modeling and identification. J. Power Sources 2004, 134, 262–276. [Google Scholar] [CrossRef]
- Yuan, S.; Wu, H.; Yin, C. State of charge estimation using the extended Kalman filter for battery management systems based on the ARX battery model. Energies 2013, 6, 444–470. [Google Scholar] [CrossRef]
- Balasingam, B.; Ahmed, M.; Pattipati, K. Battery Management Systems—Challenges and Some Solutions. Energies 2020, 13, 2825. [Google Scholar] [CrossRef]
- Pattipati, B.; Balasingam, B.; Avvari, G.; Pattipati, K.R.; Bar-Shalom, Y. Open circuit voltage characterization of lithium-ion batteries. J. Power Sources 2014, 269, 317–333. [Google Scholar] [CrossRef]
- Balasingam, B.; Avvari, G.; Pattipati, B.; Pattipati, K.; Bar-Shalom, Y. A robust approach to battery fuel gauging, part I: Real time model identification. J. Power Sources 2014, 272, 1142–1153. [Google Scholar] [CrossRef]
- Plett, G.L. Battery Management Systems, Volume I: Battery Modeling; Artech House Publishers: Boston, MA, USA, 2015. [Google Scholar]
- Plett, G.L. Battery Management Systems, Volume II: Equivalent-Circuit Methods; Artech House Publishers: Boston, MA, USA, 2015. [Google Scholar]
- Hariharan, K.S.; Tagade, P.; Ramachandran, S. Mathematical Modeling of Lithium Batteries: From Electrochemical Models to State Estimator Algorithms; Springer: Berlin/Heidelberg, Germany, 2017. [Google Scholar]
- Ahmed, M.S.; Raihan, S.A.; Balasingam, B. A scaling approach for improved state of charge representation in rechargeable batteries. Appl. Energy 2020, 267, 114880. [Google Scholar] [CrossRef]
- Nikdel, M.; Nikdel, M. Various battery models for various simulation studies and applications. Renew. Sustain. Energy Rev. 2014, 32, 477–485. [Google Scholar]
- Balasingam, B.; Avvari, G.; Pattipati, B.; Pattipati, K.; Bar-Shalom, Y. A robust approach to battery fuel gauging, part II: Real time capacity estimation. J. Power Sources 2014, 269, 949–961. [Google Scholar] [CrossRef]
- Balasingam, B.; Avvari, G.; Pattipati, K.; Bar-Shalom, Y. Performance analysis results of a battery fuel gauge algorithm at multiple temperatures. J. Power Sources 2015, 273, 742–753. [Google Scholar] [CrossRef]
- Avvari, G.; Pattipati, B.; Balasingam, B.; Pattipati, K.; Bar-Shalom, Y. Experimental set-up and procedures to test and validate battery fuel gauge algorithms. Appl. Energy 2015, 160, 404–418. [Google Scholar] [CrossRef] [Green Version]
- Bar-Shalom, Y.; Li, X.R.; Kirubarajan, T. Estimation with Applications to Tracking and Navigation: Theory Algorithms and Software; John Wiley & Sons: New York, NY, USA, 2004. [Google Scholar]
- Balasingam, B.; Pattipati, K. On the Identification of Electrical Equivalent Circuit Models Based on Noisy Measurements. IEEE Trans. Instrum. Meas. 2021, 70, 1–16. [Google Scholar] [CrossRef]
- Lee, S.; Mohtat, P.; Siegel, J.B.; Stefanopoulou, A.G.; Lee, J.W.; Lee, T.K. Estimation Error Bound of Battery Electrode Parameters With Limited Data Window. IEEE Trans. Ind. Inform. 2019, 16, 3376–3386. [Google Scholar] [CrossRef]
- Lin, X. Theoretical analysis of battery soc estimation errors under sensor bias and variance. IEEE Trans. Ind. Electron. 2018, 65, 7138–7148. [Google Scholar] [CrossRef]
- Bizeray, A.M.; Kim, J.H.; Duncan, S.R.; Howey, D.A. Identifiability and parameter estimation of the single particle lithium-ion battery model. IEEE Trans. Control. Syst. Technol. 2018, 27, 1862–1877. [Google Scholar] [CrossRef] [Green Version]
- Wei, Z.G.; Hu, J.; He, H.; Li, Y.; Xiong, B. Load Current and State of Charge Co-Estimation for Current Sensor-Free Lithium-ion Battery. IEEE Trans. Power Electron. 2021. [Google Scholar] [CrossRef]
- Hu, J.; He, H.; Wei, Z.; Li, Y. Disturbance-immune and aging-robust internal short circuit diagnostic for lithium-ion battery. IEEE Trans. Ind. Electron. 2021. [Google Scholar] [CrossRef]
- Wei, Z.; Zhao, J.; Ji, D.; Tseng, K.J. A multi-timescale estimator for battery state of charge and capacity dual estimation based on an online identified model. Appl. Energy 2017, 204, 1264–1274. [Google Scholar] [CrossRef]
- Song, Z.; Hou, J.; Hofmann, H.F.; Lin, X.; Sun, J. Parameter Identification and Maximum Power Estimation of Battery/Supercapacitor Hybrid Energy Storage System Based on Cramer–Rao Bound Analysis. IEEE Trans. Power Electron. 2018, 34, 4831–4843. [Google Scholar] [CrossRef]
- Song, Z.; Wang, H.; Hou, J.; Hofmann, H.; Sun, J. Combined State and Parameter Estimation of Lithium-Ion Battery with Active Current Injection. IEEE Trans. Power Electron. 2019, 35, 4439–4447. [Google Scholar] [CrossRef]
- Song, Z.; Hofmann, H.; Lin, X.; Han, X.; Hou, J. Parameter identification of lithium-ion battery pack for different applications based on Cramer-Rao bound analysis and experimental study. Appl. Energy 2018, 231, 1307–1318. [Google Scholar] [CrossRef]
- Klintberg, A.; Wik, T.; Fridholm, B. Theoretical bounds on the accuracy of state and parameter estimation for batteries. In Proceedings of the 2017 American Control Conference (ACC), Seattle, WA, USA, 24–26 May 2017; pp. 4035–4041. [Google Scholar]
- Lin, X. Analytic analysis of the data-dependent estimation accuracy of battery equivalent circuit dynamics. IEEE Control. Syst. Lett. 2017, 1, 304–309. [Google Scholar] [CrossRef]
- Zhang, L.; Lyu, C.; Hinds, G.; Wang, L.; Luo, W.; Zheng, J.; Ma, K. Parameter sensitivity analysis of cylindrical LiFePO4 battery performance using multi-physics modeling. J. Electrochem. Soc. 2014, 161, A762–A776. [Google Scholar] [CrossRef]
- Mendoza, S.; Liu, J.; Mishra, P.; Fathy, H. On the relative contributions of bias and noise to lithium-ion battery state of charge estimation errors. J. Energy Storage 2017, 11, 86–92. [Google Scholar] [CrossRef]
- Zhang, Y.; Song, W.; Lin, S.; Feng, Z. A novel model of the initial state of charge estimation for LiFePO4 batteries. J. Power Sources 2014, 248, 1028–1033. [Google Scholar] [CrossRef]
- Yang, Y.; Wang, J.; Weng, H.; Hou, J.; Gao, T. Research on Online Correction of SOC estimation for Power Battery Based on Neural Network. In Proceedings of the Advanced Information Technology, Electronic and Automation Control Conference, Chongqing, China, 12–14 October 2018; pp. 2128–2132. [Google Scholar]
- Yan, J.; Xu, G.; Qian, H.; Xu, Y. Robust State of Charge Estimation for Hybrid Electric Vehicles: Framework and Algorithms. Energies 2010, 3, 1654–1672. [Google Scholar] [CrossRef]
- Xiong, R.; Yu, Q.; Lin, C. A novel method to obtain the open circuit voltage for the state of charge of lithium ion batteries in electric vehicles by using H infinity filter. Appl. Energy 2017, 207, 346–353. [Google Scholar] [CrossRef]
- Dong, G.; Wei, J.; Zhang, C.; Chen, Z. Online state of charge estimation and open circuit voltage hysteresis modeling of LiFePO4 battery using invariant imbedding method. Appl. Energy 2016, 162, 163–171. [Google Scholar] [CrossRef]
- Cho, Y.; Jeong, Y.; Ahn, J.; Ryu, S.; Lee, B. A new SOC estimation algorithm without integrated error using DCIR repetitive calculation. In Proceedings of the International Conference on Electrical Machines and Systems, Hangzhou, China, 22–25 October 2014; pp. 865–870. [Google Scholar]
- Wu, T.H.; Moo, C.S. State-of-Charge Estimation with State-of-Health Calibration for Lithium-Ion Batteries. Energies 2017, 10, 987. [Google Scholar]
- Sepasi, S.; Ghorbani, R.; Liaw, B.Y. Inline state of health estimation of lithium-ion batteries using state of charge calculation. J. Power Sources 2015, 299, 246–254. [Google Scholar] [CrossRef]
- Plett, G.L. Extended Kalman filtering for battery management systems of LiPB-based HEV battery packs: Part 3. State and parameter estimation. J. Power Sources 2004, 134, 277–292. [Google Scholar] [CrossRef]
- Plett, G.L. Sigma-point Kalman filtering for battery management systems of LiPB-based HEV battery packs: Part 2. Simultaneous state and parameter estimation. J. Power Sources 2006, 161, 1369–1384. [Google Scholar] [CrossRef]
- Linghu, J.; Kang, L.; Liu, M.; Hu, B.; Wang, Z. An Improved Model Equation Based on a Gaussian Function Trinomial for State of Charge Estimation of Lithium-ion Batteries. Energies 2019, 12, 1366. [Google Scholar] [CrossRef] [Green Version]
- Wei, Z.; Meng, S.; Xiong, B.; Ji, D.; Tseng, K.J. Enhanced online model identification and state of charge estimation for lithium-ion battery with a FBCRLS based observer. Appl. Energy 2016, 181, 332–341. [Google Scholar] [CrossRef]
- Wadi, A.; Abdel-Hafez, M.F.; Hussein, A.A. Mitigating the Effect of Noise Uncertainty on the Online State-of-Charge Estimation of Li-Ion Battery Cells. IEEE Trans. Veh. Technol. 2019, 68, 8593–8600. [Google Scholar] [CrossRef]
- Peng, S.; Chen, C.; Shi, H.; Yao, Z. State of charge estimation of battery energy storage systems based on adaptive unscented Kalman filter with a noise statistics estimator. IEEE Access 2017, 5, 13202–13212. [Google Scholar] [CrossRef]
- El Din, M.S.; Abdel-Hafez, M.F.; Hussein, A.A. Enhancement in Li-ion battery cell state-of-charge estimation under uncertain model statistics. IEEE Trans. Veh. Technol. 2015, 65, 4608–4618. [Google Scholar] [CrossRef]
- Sun, Q.; Zhang, H.; Zhang, J.; Ma, W. Adaptive unscented kalman filter with correntropy loss for robust state of charge estimation of lithium-ion battery. Energies 2018, 11, 3123. [Google Scholar] [CrossRef] [Green Version]
- Zhang, K.; Ma, J.; Zhao, X.; Zhang, D.; He, Y. State of Charge Estimation for Lithium Battery Based on Adaptively Weighting Cubature Particle Filter. IEEE Access 2019, 7, 166657–166666. [Google Scholar] [CrossRef]
- Xi, Z.; Dahmardeh, M.; Xia, B.; Fu, Y.; Mi, C. Learning of battery model bias for effective state of charge estimation of lithium-ion batteries. IEEE Trans. Veh. Technol. 2019, 68, 8613–8628. [Google Scholar] [CrossRef]
- Bi, Y.; Choe, S.Y. An adaptive sigma-point Kalman filter with state equality constraints for online state-of-charge estimation of a Li (NiMnCo) O2/Carbon battery using a reduced-order electrochemical model. Appl. Energy 2020, 258, 113925. [Google Scholar] [CrossRef]
- Movassagh, K.; Raihan, S.A.; Balasingam, B. Performance Analysis of Coulomb Counting Approach for State of Charge Estimation. In Proceedings of the IEEE Electrical Power and Energy Conference, Montreal, QC, Canada, 16–18 October 2019. [Google Scholar]
- Movassagh, K. Performance Analysis of Coulomb Counting Approach for State of Charge Estimation in Li-Ion Batteries. 2020. Available online: https://scholar.uwindsor.ca/etd/8384/ (accessed on 12 February 2021).
- Balasingam, B.; French, B.; Yaakov, B.S.; Pattipati, B.; Pattipati, K.; Meacham, J.; Williams, T.; Avvari, G.V.; Hwang, T.S. Battery State of Charge Tracking, Equivalent Circuit Selection and Benchmarking. U.S. Patent 10664562, 26 May 2020. [Google Scholar]
- Chapra, S.C.; Canale, R.P. Numerical Methods for Engineers; Mcgraw-Hill: New York, NY, USA, 1998; Volume 2. [Google Scholar]
- Barré, A.; Deguilhem, B.; Grolleau, S.; Gérard, M.; Suard, F.; Riu, D. A review on lithium-ion battery ageing mechanisms and estimations for automotive applications. J. Power Sources 2013, 241, 680–689. [Google Scholar] [CrossRef] [Green Version]
- Spotnitz, R. Simulation of capacity fade in lithium-ion batteries. J. Power Sources 2003, 113, 72–80. [Google Scholar] [CrossRef]
Figure 1.
A representation of the current integration error. The positive integration error is shown by dark shade and negative error by light shade.
Figure 1.
A representation of the current integration error. The positive integration error is shown by dark shade and negative error by light shade.

Figure 2.
Current difference in realistic loads. (a) Smart Phone [15], and (b) Electric Vehicle [9], .

Table 2.
SOC error s.d. (%) due to current measurement error.
| 1 h | 24 h | 1 Year | |
|---|---|---|---|
| 0.0035 | 0.0172 | 0.3289 | |
| 0.0111 | 0.0544 | 1.0399 | |
| 0.0351 | 0.1721 | 3.2886 |
Table 3.
S.D. of SOC error (%) for smart phone data.
| 1 h | 24 h | 1 Year | |
|---|---|---|---|
| 0.0588 | 0.2879 | 5.5002 | |
| 0.1858 | 0.9104 | 17.3930 | |
| 0.5877 | 2.8789 | 55.0016 |
Table 4.
S.D. of SOC error (%) for EV data.
| 1 h | 24 h | 1 Year | |
|---|---|---|---|
| 0.0183 | 0.0899 | 1.7166 | |
| 0.0580 | 0.2841 | 5.4285 | |
| 0.1834 | 0.8985 | 17.1664 |
Publisher’s Note: MDPI stays neutral with regard to jurisdictional claims in published maps and institutional affiliations. |
© 2021 by the authors. Licensee MDPI, Basel, Switzerland. This article is an open access article distributed under the terms and conditions of the Creative Commons Attribution (CC BY) license (https://creativecommons.org/licenses/by/4.0/).
Share and Cite
MDPI and ACS Style
Movassagh, K.; Raihan, A.; Balasingam, B.; Pattipati, K. A Critical Look at Coulomb Counting Approach for State of Charge Estimation in Batteries. Energies 2021, 14, 4074. https://doi.org/10.3390/en14144074
AMA Style
Movassagh K, Raihan A, Balasingam B, Pattipati K. A Critical Look at Coulomb Counting Approach for State of Charge Estimation in Batteries. Energies. 2021; 14(14):4074. https://doi.org/10.3390/en14144074
Chicago/Turabian StyleMovassagh, Kiarash, Arif Raihan, Balakumar Balasingam, and Krishna Pattipati. 2021. "A Critical Look at Coulomb Counting Approach for State of Charge Estimation in Batteries" Energies 14, no. 14: 4074. https://doi.org/10.3390/en14144074
Note that from the first issue of 2016, this journal uses article numbers instead of page numbers. See further details here.