
Development of a Smart Meter for Power Quality-Based Tariff Implementation in a Smart Grid
by
 , , and
Mayurkumar Rajkumar Balwani
1, 
Karthik Thirumala
1,*,
Vivek Mohan
1,
Siqi Bu
2 and
Mini Shaji Thomas
1 1
Department of Electrical and Electronics Engineering, National Institute of Technology Tiruchirappalli, Tiruchirappalli 620015, India
2
Department of Electrical Engineering, The Hong Kong Polytechnic University, Hong Kong
*
Author to whom correspondence should be addressed.
Energies 2021, 14(19), 6171; https://doi.org/10.3390/en14196171
Submission received: 31 July 2021
/
Revised: 2 September 2021
/
Accepted: 7 September 2021
/
Published: 27 September 2021
(This article belongs to the Special Issue Power Electronics and Power Quality 2021)
Abstract
:Regarding the modern power smart grid, distribution consumers and prosumers are highly concerned about power quality (PQ). In fact, they would prefer to pay higher prices for a reliable and good quality power supply. Unfortunately, utility operators still aim for reliability alone, ignoring the quality of supply voltage and current. There are no clear guidelines for monitoring, penalizing, or implementing PQ-based tariff schemes in LV distribution systems. In addition, the implementation of a PQ-based tariff requires a real-time measuring mechanism at the user end, which is very expensive and difficult to understand for a domestic consumer. This paper presents a novel, low-cost, efficient, and user-friendly smart PQ meter to overcome these issues and limitations. It is essentially a PQ analyzer with energy metering functionality, which implements a novel PQ-based tariff scheme that penalizes consumers violating the PQ limits and provides incentives for a good PQ profile. It measures as many as 28 parameters and keeps track of the PQ for both the consumer and the grid in real-time. This paper demonstrates the specifications, design, and testing of the meter and proves the validity of the concept by practical implementation. The meter is practical, feasible, and economical for implementing PQ-based tariff schemes in LV distribution systems or smart grids.
1. Introduction
In many developing nations, a reliable power supply is a major concern and maintaining power quality (PQ) is of least priority. Although PQ issues have existed since the end of the 19th century, the severity and frequency of occurrence have increased recently because of the advent of modern power electronic devices in the distribution system. According to Brookings India’s report [1], the distribution sector in India is the weakest link in the power industry in terms of financial and operational sustainability, and poor PQ is one of the primary reasons for it. The monitoring and regulation of PQ is a big challenge for utility operators. Thus, the PQ is neither measured nor maintained by the utility companies for LV domestic consumers.
Interestingly, nowadays consumers have realized the impact of poor PQ and are willing to pay higher tariff prices for a good quality power supply [2]. The consequences of poor PQ include fluctuations in the supply voltage, which causes a flicker phenomenon in domestic lights. This flickering causes a sensation of irritation to human eyes. In addition, oscillatory and impulsive transients or surges cause damage to computers and electronic loads [3]. Voltage sag and swell also degrade the performance of electromechanical devices like fans and motors [4]. These PQ disturbances not only affect the consumers but also damage utility equipment. For example, modern consumer loads are rich in harmonics, which can cause distribution transformers to get overheated and even saturated in worst-case scenarios due to the DC offset. Harmonics in the consumer load current also cause the overheating of supply cables and shortens their life [5]. According to a European PQ survey [6], around 150 billion Euros of financial losses per year have occurred in EU-25 countries because of PQ disturbances. The Asia Power Quality Initiative’s latest report on the PQ regulation policies of India [7] declared that Indian utilities have a robust system for frequency regulation and reliable supply. However, PQ issues such as voltage variations, transients, and harmonics are not dealt with well. Hence, both the grid and consumers suffer and tolerate the consequences of poor PQ. Therefore, PQ monitoring and regulation are indispensable for utilities in modern smart grids.
The PQ regulation of an entire distribution system can be achieved with an appropriate PQ monitoring infrastructure and the introduction of a PQ-based tariff for LV distribution consumers. There is a need to initiate the penalty or incentive pricing mechanism based on PQ levels. The penalty and incentive price for reactive energy and harmonic pollution can be obtained based on the techno-economic features of poor PQ [8]. There have been several approaches in the literature to design a tariff based on the PQ level. Countries such as Belgium, Singapore, the USA, the UK, Portugal, Germany, Austria, the Philippines, and Poland have adopted reactive energy tariffs to reduce losses in their distribution systems [9,10,11]. In India, a few state electricity regulatory commissions impose a penalty to industrial consumers for reactive power violations and harmonic distortions, but these penalties have not arrived considering the techno-economic aspects of PQ violations. For instance, in the Tamil Nadu state distribution network, the consumers are liable to pay the penalty for harmonic distortion at 15% of the energy tariff [7]. Here, the penalty is fixed and is not imposed based on the amount of harmonic distortion caused. This flat penalty scheme shows a lack of consideration of techno-economic consequences of the harmonic injection while imposing the penalty. A tariff scheme is proposed in [12] based on reactive energy for domestic consumers and presents the utility’s saving for the same. This approach, however, focuses majorly on capital cost recovery, and these cost coefficients are calculated empirically. Few other tariff schemes [13,14] give reactive energy incentives based on power factor, active power, or reactive energy, but all the incentive coefficients are determined empirically. The available PQ-based penalty schemes are aimed at 11 kV consumers, and such mechanisms are not in practice for LV domestic consumers.
Implementing a PQ-based penalty/incentive scheme for LV domestic consumers requires a smart meter infrastructure for each consumer. Conventional digital or smart energy meters are specifically designed to measure specific basic parameters like power, energy, and power factor, etc. They cannot be used as such for the implementation of a PQ-based tariff scheme due to hardware and software limitations. The PQ meters should have some additional features like a sampling of voltage and current at higher rates, simultaneous sampling, noise reduction, signal processing, and handling of more data. Commercially available PQ analyzers have these features, and they assess PQ parameters such as voltage RMS, fundamental RMS, total harmonic distortion (THD), power factor, and imbalance. These PQ analyzers are sophisticated and are used mainly by engineers, electricians, and technicians to record and diagnose electrical components or sites [15]. Unfortunately, they are expensive and unrealistic for a utility company to mount at each domestic consumer’s home for PQ metering directly. Besides, it is not easy for domestic consumers to read such complex meters and interpret the quality of the power they receive. Therefore, it is necessary to develop a user-friendly smart meter with both active energy and PQ metering functionalities. In addition, the meter should be versatile, interface friendly, easy to understand, and affordable.
Recently, a lot of interesting research has been carried out in the field of PQ-based smart meters. A few of those meters are reviewed here to study their limitations and design a better meter that can satisfy all the practical implementation needs. The design considerations and desired features of a PQ-based smart meter are suggested in [16]. It lays a good foundation for the design of the meter. However, it is a conceptual design with less emphasis on practical design and implementation aspects. Another article, [17], demonstrates a smart PQ meter for domestic consumers that measures PQ indices and events related to voltage and frequency. However, it does not measure or monitor the consumer current. In addition, it needs an external computer and lacks the integration of energy metering functionality. Therefore, a separate hardware and energy metering device are required to accomplish the required functionalities of PQ and energy metering. Authors in [18] have proposed an Ethernet-based smart meter for PQ monitoring, which utilizes the LabVIEW software to assess the voltage quality. It includes a load scheduling functionality for PQ improvement in real-time. This meter also requires an external computer to run LabVIEW and does not measure distortions in the consumer current. A stand-alone smart meter proposed in [19] can detect voltage sag and swell, frequency of the supply, and power factor under linear load conditions only. However, it is suitable neither for measuring the harmonic distortion in both the voltage and current for the power-electronic energized loads nor the displacement power factor (DPF). In [20], the authors developed a Raspberry-Pi-based smart meter, which cannot measure consumer current distortion. An open-source Raspberry-Pi-based PQ analyzer presented in [21] measures the voltage parameters only. Moreover, the usage of Raspberry Pi is redundant and expensive and has a relatively higher power consumption.
A multifunctional smart meter in [22] has both energy and basic PQ metering capabilities and anti-theft features. However, it lacks the consumer current quality assessment functionality. A sophisticated FPGA-based PQ monitoring system proposed in [23] is complex and needs an external computer running LabVIEW. Another FPGA-based smart energy meter presented in [24] can be used as a stand-alone device for domestic applications. Nevertheless, this is a very complex system and is not cost-effective for domestic applications. It could be concluded that the FPGA and Raspberry-Pi-based smart meters are not stand-alone and affordable for domestic PQ monitoring applications.
Furthermore, in recent years, there have been a few data privacy concerns raised with smart meters. In some cases, smart meters can gather small pieces of information over short intervals and, therefore, give a detailed picture of which appliances are being used. This breach can lead to identifying specific characteristics that reveal information about a home’s socio-economic status, dwelling, and appliances, posing a significant threat to consumers’ privacy [25]. Data management becomes central to the development of AMI; therefore, some institutional changes are indispensable [26].
The aforementioned and a few commercially available smart PQ meters lack the features listed in Table 1. They are neither compact nor stand-alone. Additionally, they do not communicate to the server in some instances or end up being much too complex and thus expensive. The most important observation is that these meters do not have the required hybrid metering functionalities of energy and PQ metering. Therefore, there is a need to develop an efficient, low-cost PQ-based smart meter that has both energy and load PQ metering functionality.
This paper presents a novel PQ-based tariff scheme based on the techno-economic consequences of consumers’ reactive power and harmonics profiles. It imposes a fair penalty to consumers for their harmonic injection and gives them compensation for harmonic distortion in the grid voltage. The reactive energy penalty/incentive for consumers is defined based on PF limits. We designed and developed a low-cost, stand-alone smart PQ meter to efficiently implement the proposed single-phase tariff scheme. It communicates to the server quickly for data logging and implements the proposed tariff scheme.
2. Methodology
The PQ monitoring at each consumer location and penalizing for violations would help regulate PQ in the active distribution network. The following PQ-based tariff scheme is proposed for LV consumers to meet the objective.
Penalty/Incentive = a + b ∗ WQLPF + c ∗ WHckVA − d ∗ WHukVA
This tariff scheme calculates penalties or incentives based on domestic consumers’ reactive and harmonic energy profiles. This cost would be additional to their active energy cost and would be accumulated for short intervals of 10 min (settling window). The flowchart shown in Figure 1 illustrates the computation of the total penalty/incentive for a consumer. The first term, ‘a’, represents the fixed cost component of the tariff, which accounts for the costs related to the smart meter upgradation and operational and maintenance charges of ancillary services. The second term represents a penalty for violating power factor limits of 0.9. This limit is chosen as per the IEEE recommendations [27]. Here, ‘b’ is a penalty price for low PF ($/kVARh), and WQLPF is the reactive energy consumption at low PF (kVARh). The third term is the penalty to the consumer according to their harmonic pollution, where ‘c’ is the harmonic injection price ($/kVAh) and WHckVA is the nonfundamental or harmonic apparent energy (kVAh) injected by the consumer. The fourth and the last term is an incentive to the consumer due to grid harmonic distortion, where ‘d’ is the harmonic incentive price ($/kVAh) and WHukVA is the nonfundamental or harmonic apparent energy (kVAh) absorbed by the consumer due to the grid distortion. The index THD is chosen to verify the harmonic limit violation, and if violated, the penalty is based on the harmonic apparent energy. The THD of voltage and current are set to 5% in this work. However, these limits can be adjusted according to the recommendations of network operators and regulatory commissions. The value of d is chosen to be equal to the penalty price coefficient c. Thus, the consumer is penalized for the harmonic injection and given a compensation for distortion because of the grid voltage at the same price. This penalty/incentive tariff promotes good behavior from the consumer and utility and helps improve good practices for PQ regulation. The price coefficients b, c, and d are determined based on the techno-economic consequences of the consumer’s reactive power and harmonic injection to the utility [28].
3. Hardware Description
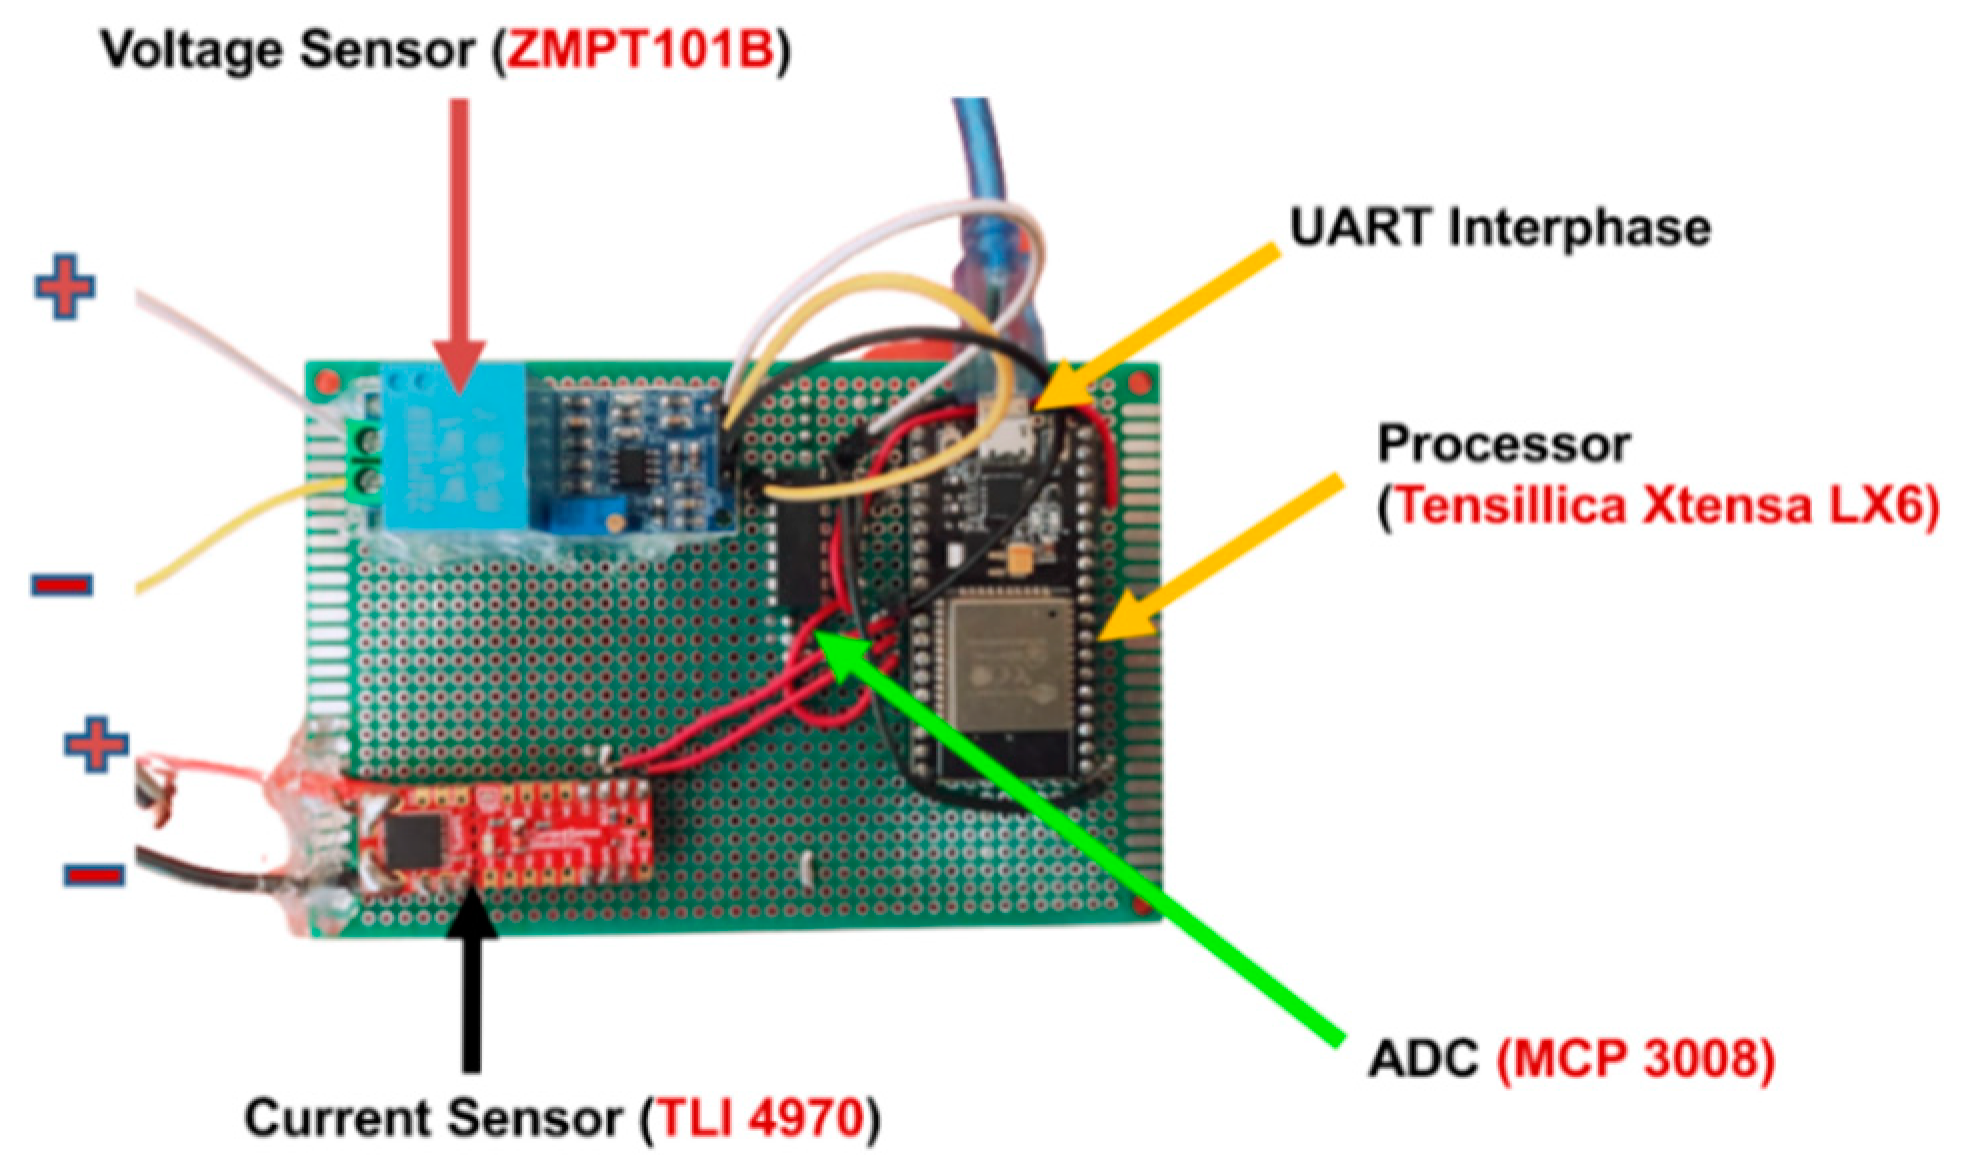
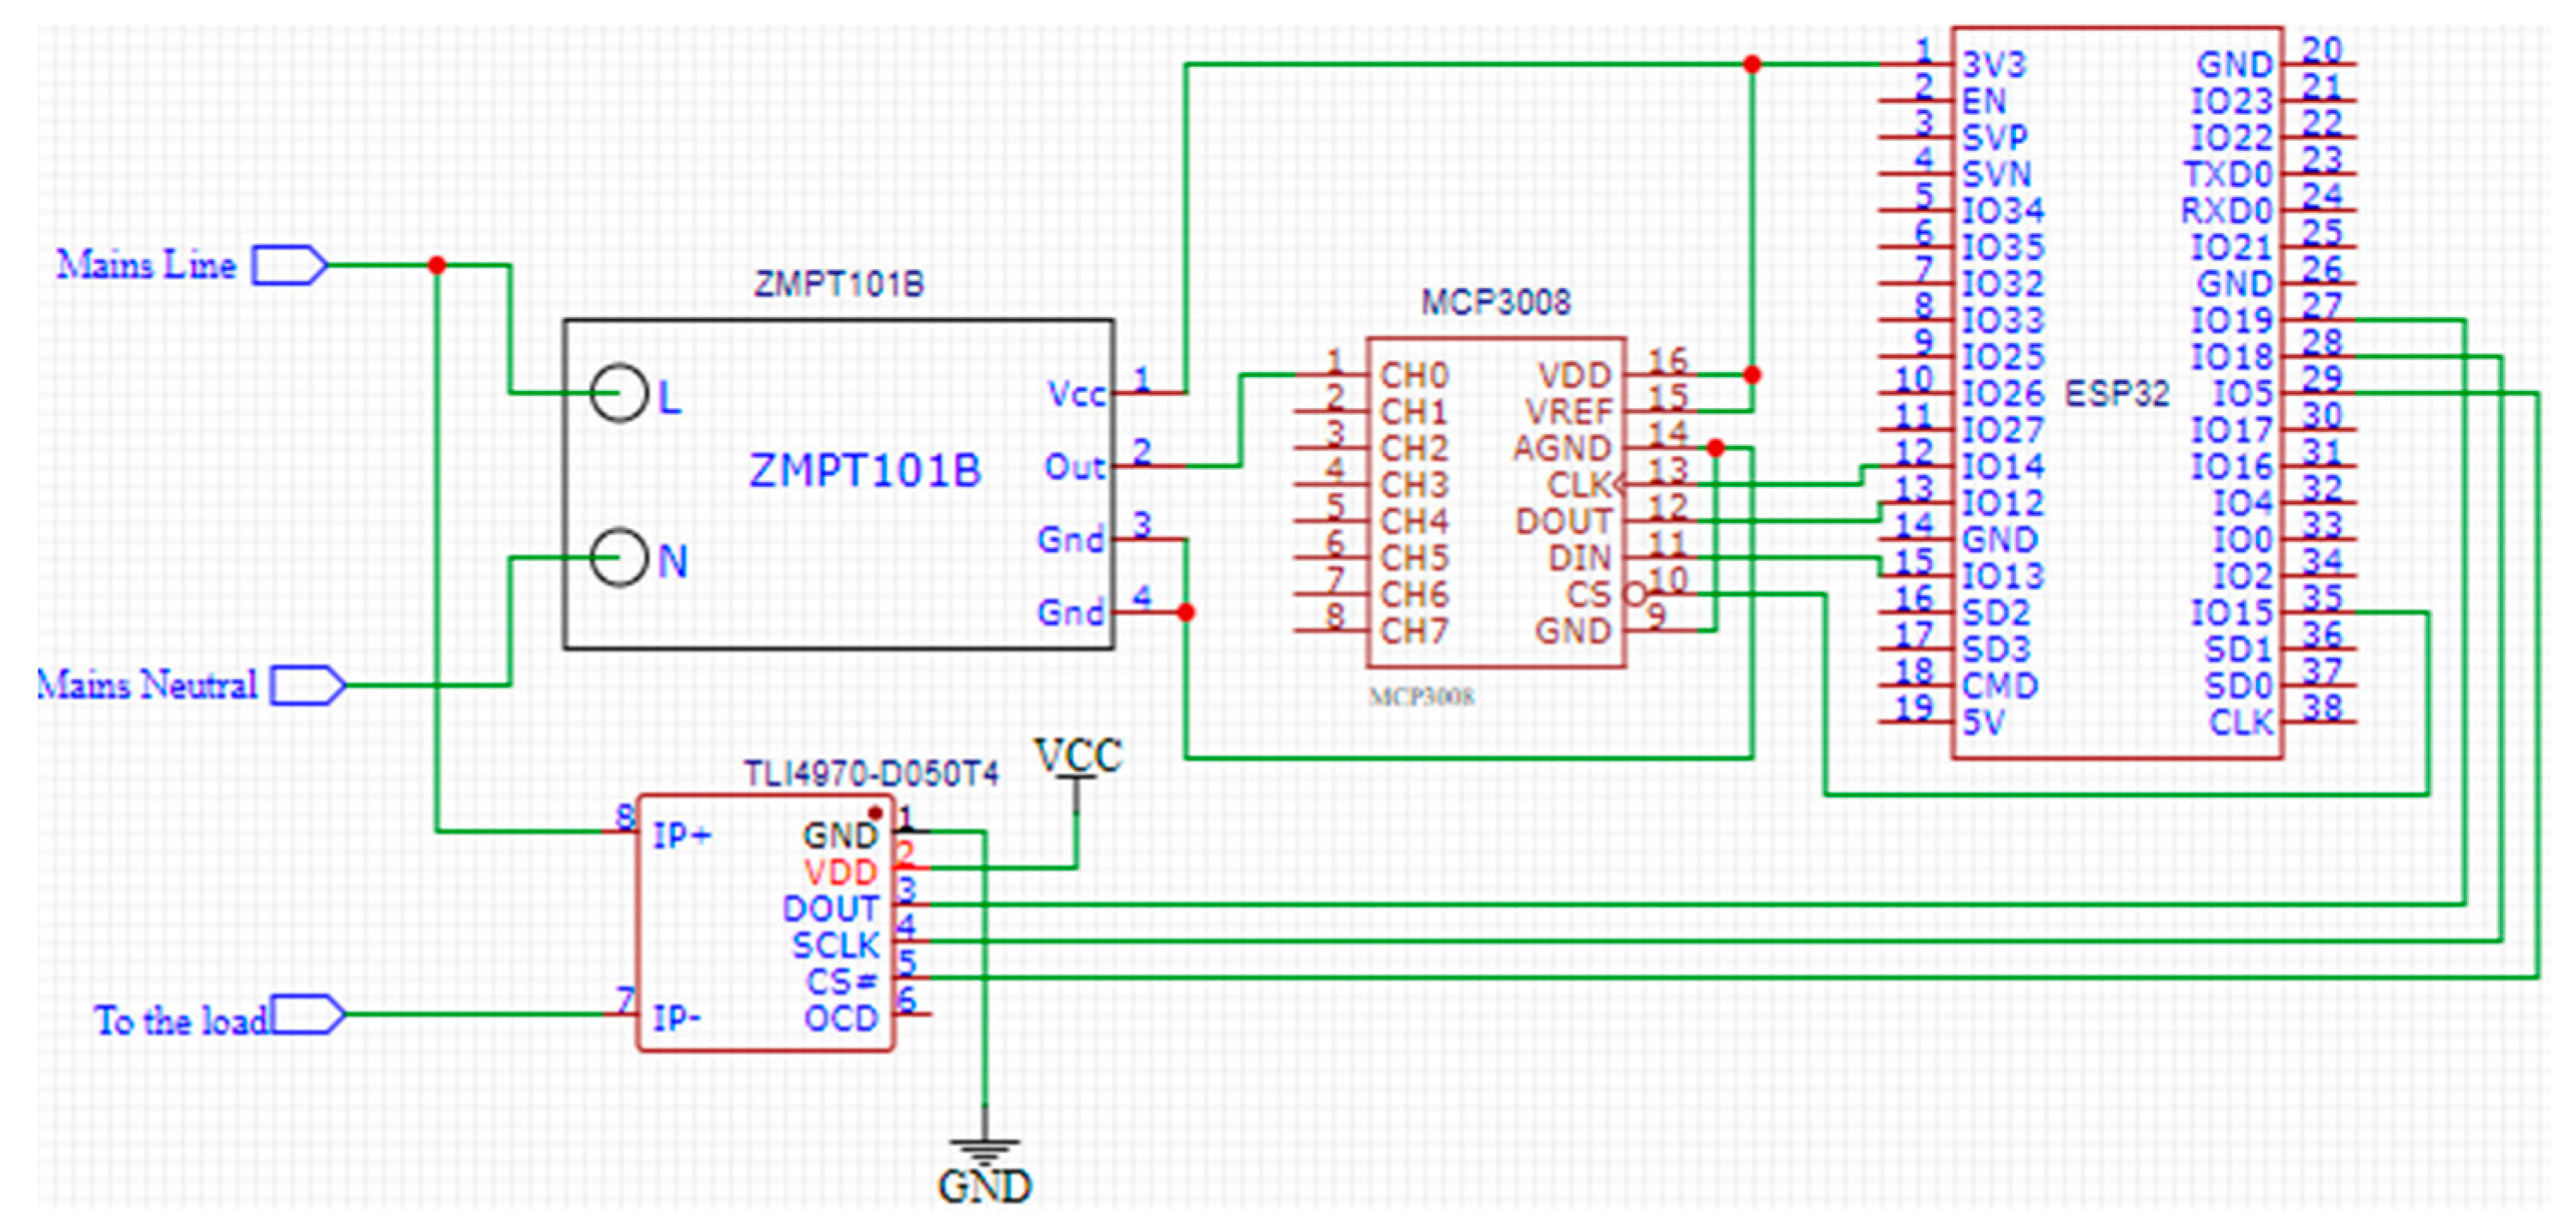
To implement the proposed PQ-based tariff, a hardware setup of the smart PQ meter has been developed. The experimental setup of the meter and its PCB schematic are shown in Figure 2 and Figure 3, respectively. This meter consists of mainly three sections: measurement, processing, and data relaying. The measurement section comprises voltage and current sensors along with an external ADC MCP3008. In most common circuits, a resistive voltage divider is used to step down and sample the line voltage, but that suffers from power line and stray noise issues. To overcome this, galvanic isolation is necessary between the power and measurement circuitry. Therefore, ZMPT101B is chosen for the voltage sensing because of its onboard potential transformer. This sensor belongs to the high-accuracy measurement class of 0.2, has a 1% linearity, and gives analog voltage output proportional to the line voltage applied across its input terminals. The ADC MCP3008 samples this output voltage, and it streams the digital readings to the dataplane processing unit (DPU) by SPI protocol. The current is measured by an integrated differential Hall-effect (Infineon TLI4970) sensor, which can measure up to 50 A of peak value with a factory calibrated 1% precision range. This current sensor chip consists of an integrated differential Hall sensor on board along with integrated stress and temperature measurement sensors to compensate the readings for chip stress and temperature variations. It utilizes onboard DSP to process and filter the measurements directly. This DSP can be configured to design a filter of the user’s choice to output the processed signal directly via the SPI bus. Both the sensors are synchronized with the help of a real-time operating system (RTOS) to avoid any significant phase angle errors.
The core of the DPU is ESP32, which has a very capable 32-bit dual-core Tensilica Xtensa LX6 microprocessor with a rich number of multiplexed and programmable GPIO pins and communication protocol support like UART, SPI, I2C, I2s, and CAN. The key feature of this module is the integrated Wi-Fi and dual-mode Bluetooth. This Wi-Fi can run in both station and access modes. It can be used to connect to the internet for data upload, and it can also host a local webpage to the users via TCP/IP to display data to the users. The Bluetooth function can also run in both classical Bluetooth and Bluetooth Low Energy (BLE) mode. The Bluetooth module can also be connected to the user’s smartphone to display the PQ measurements. It also has RTOS support, which is maintained by the manufacturer. Overall, this meter runs on a 5 V power supply and consumes significantly less power, typically around 1.5 W. It is very power efficient and can be powered from miniature power supplies like smartphone charging adapters without hassle. The power adapter can be integrated within the meter and powered from the incoming AC lines.
This MCU polls both voltage and current sensors at a high sampling rate of 2048 samples per second and computes 28 parameters from the voltage and current raw data. The parameters include fundamental frequency, actual and gross RMS values of voltage and current, magnitude and phase of voltage and currents, active power and energy, reactive power and energy, THD, DPF, voltage sag and swell, utility distortion volt-ampere, and consumer distortion volt-ampere. Finally, it calculates the penalties/incentives for the consumer based on these extracted parameters.
The meter records the PQ phenomena for monitoring and post analysis and sends all the data to the remote server every minute continuously. The meter uses the HTTP POST protocol to send the data to the specified domain address. This domain has a PHP script running, which captures this data and injects it into the MySQL database. These readings can be accessed and visualized on the webpage for both users and the utility provider. This meter can also log the data via its UART port to a PC for analysis and diagnostic purposes.
4. Algorithm
The smart meter must perform both energy and PQ metering in real time, and hence the RTOS is used to handle all the mission-critical activities. This RTOS divides all the functions into smaller tasks, which have their priority and resources assigned to them. This RTOS supports symmetrical multiprocessing (SMP) in which each core shares resources with the other and has a dedicated scheduler for task scheduling. The scheduler in the RTOS makes sure that each task gets enough computational and hardware resources according to the priority and finishes its execution in the allocated timeline. Nevertheless, this needs careful execution because sharing resources can result in deadlocks, spinlocks, and core panics. Therefore, tools like semaphores and mutexes are used to avoid these issues.
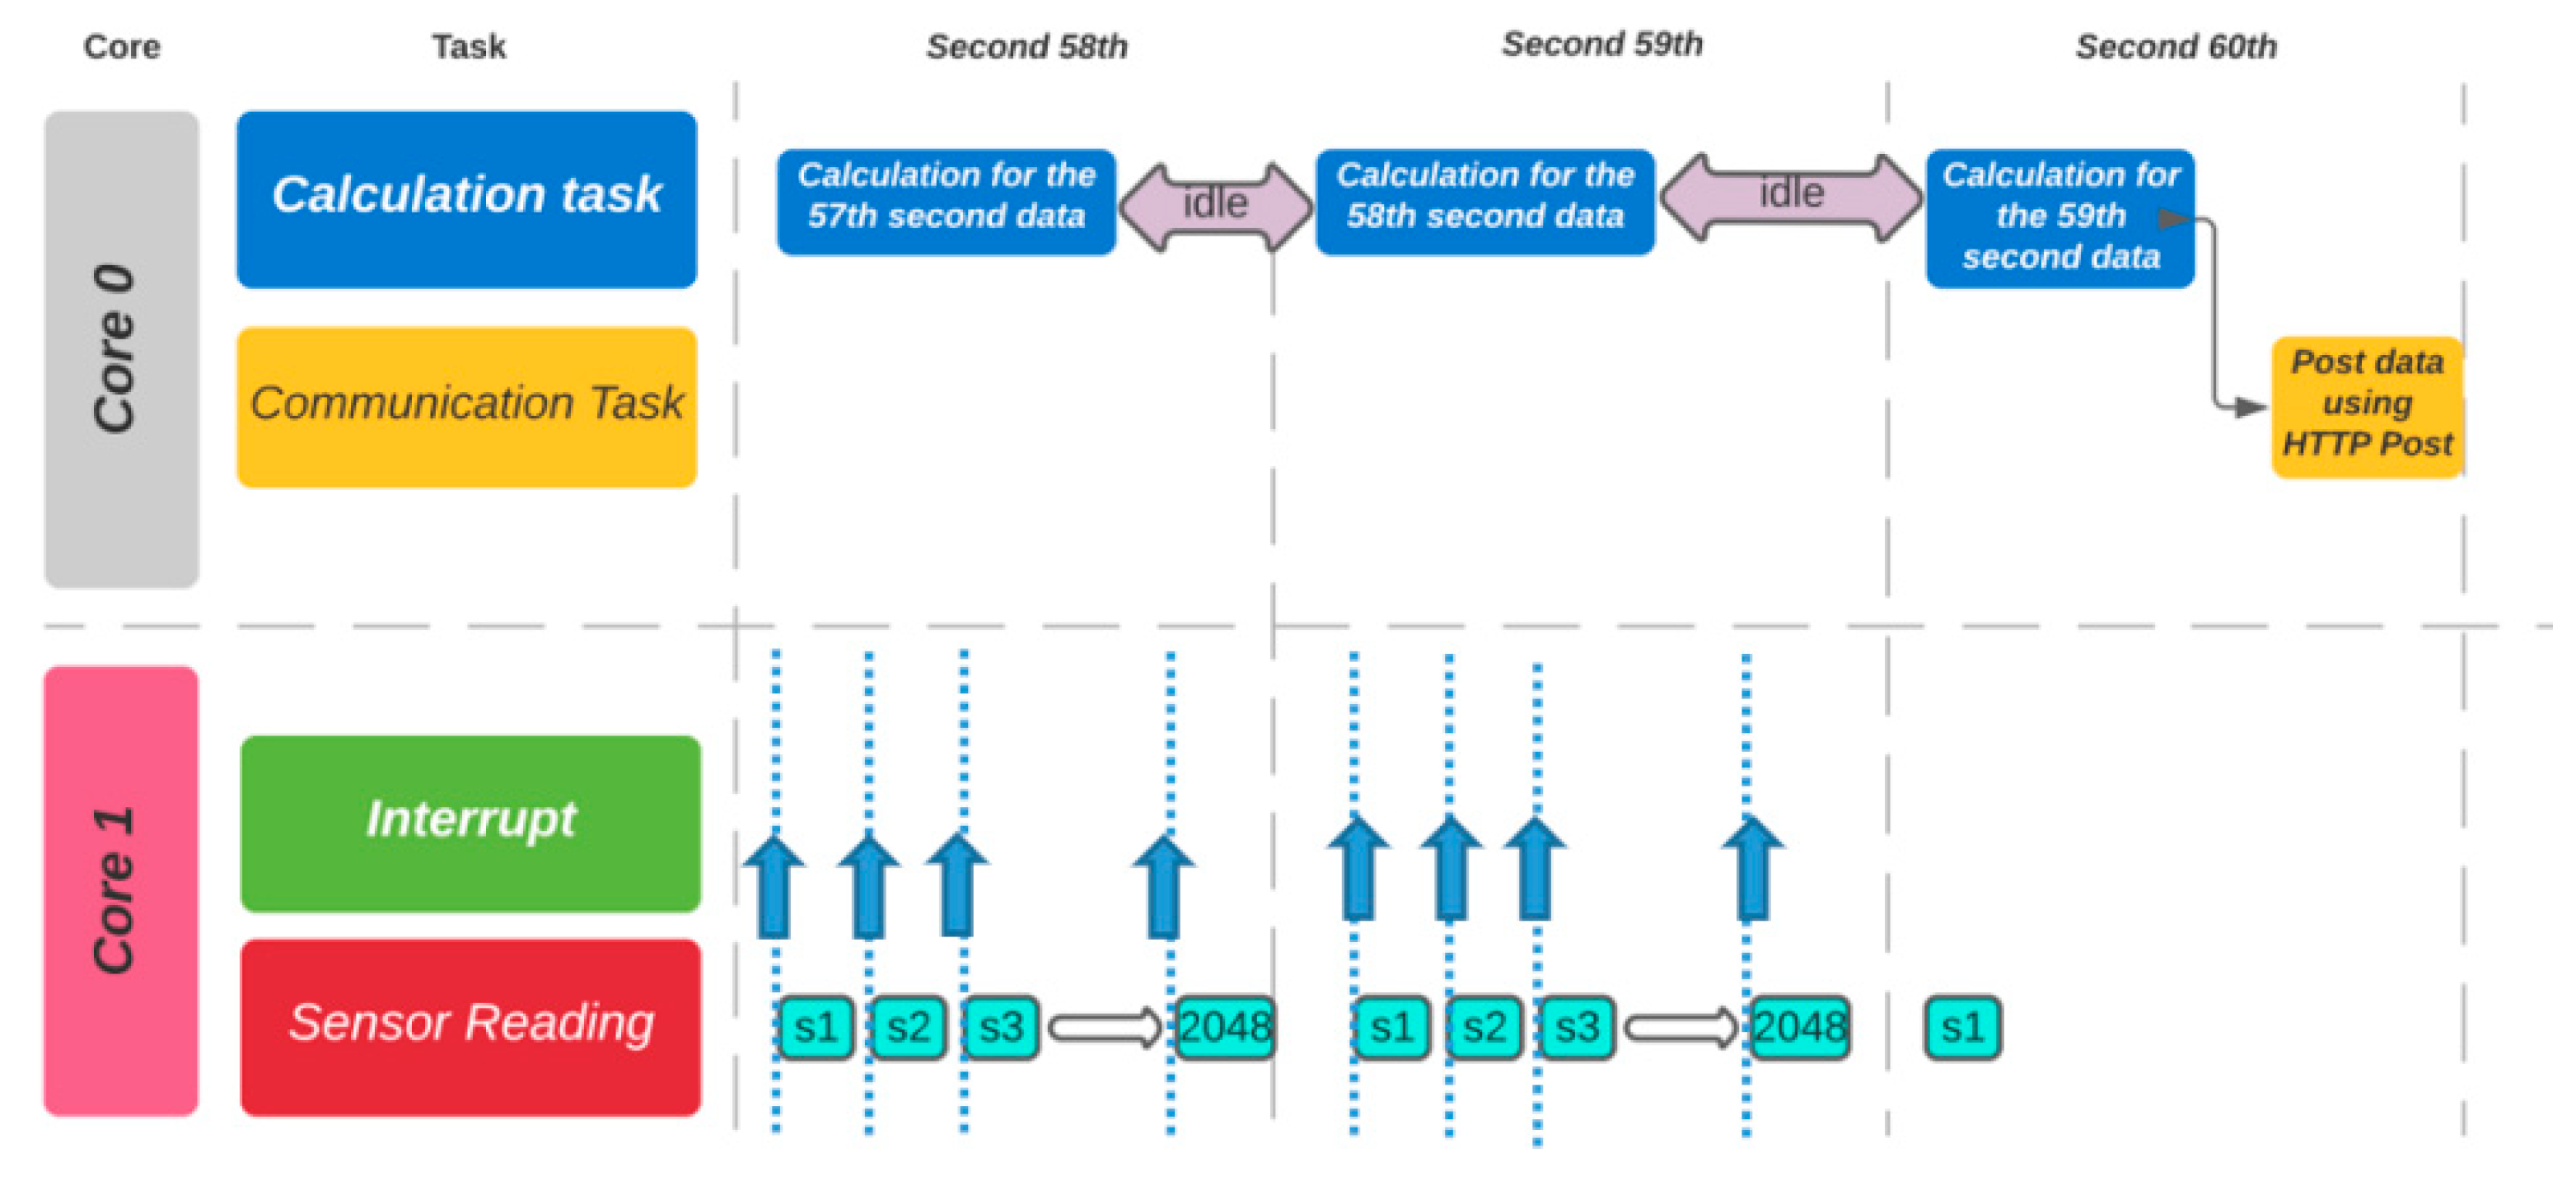
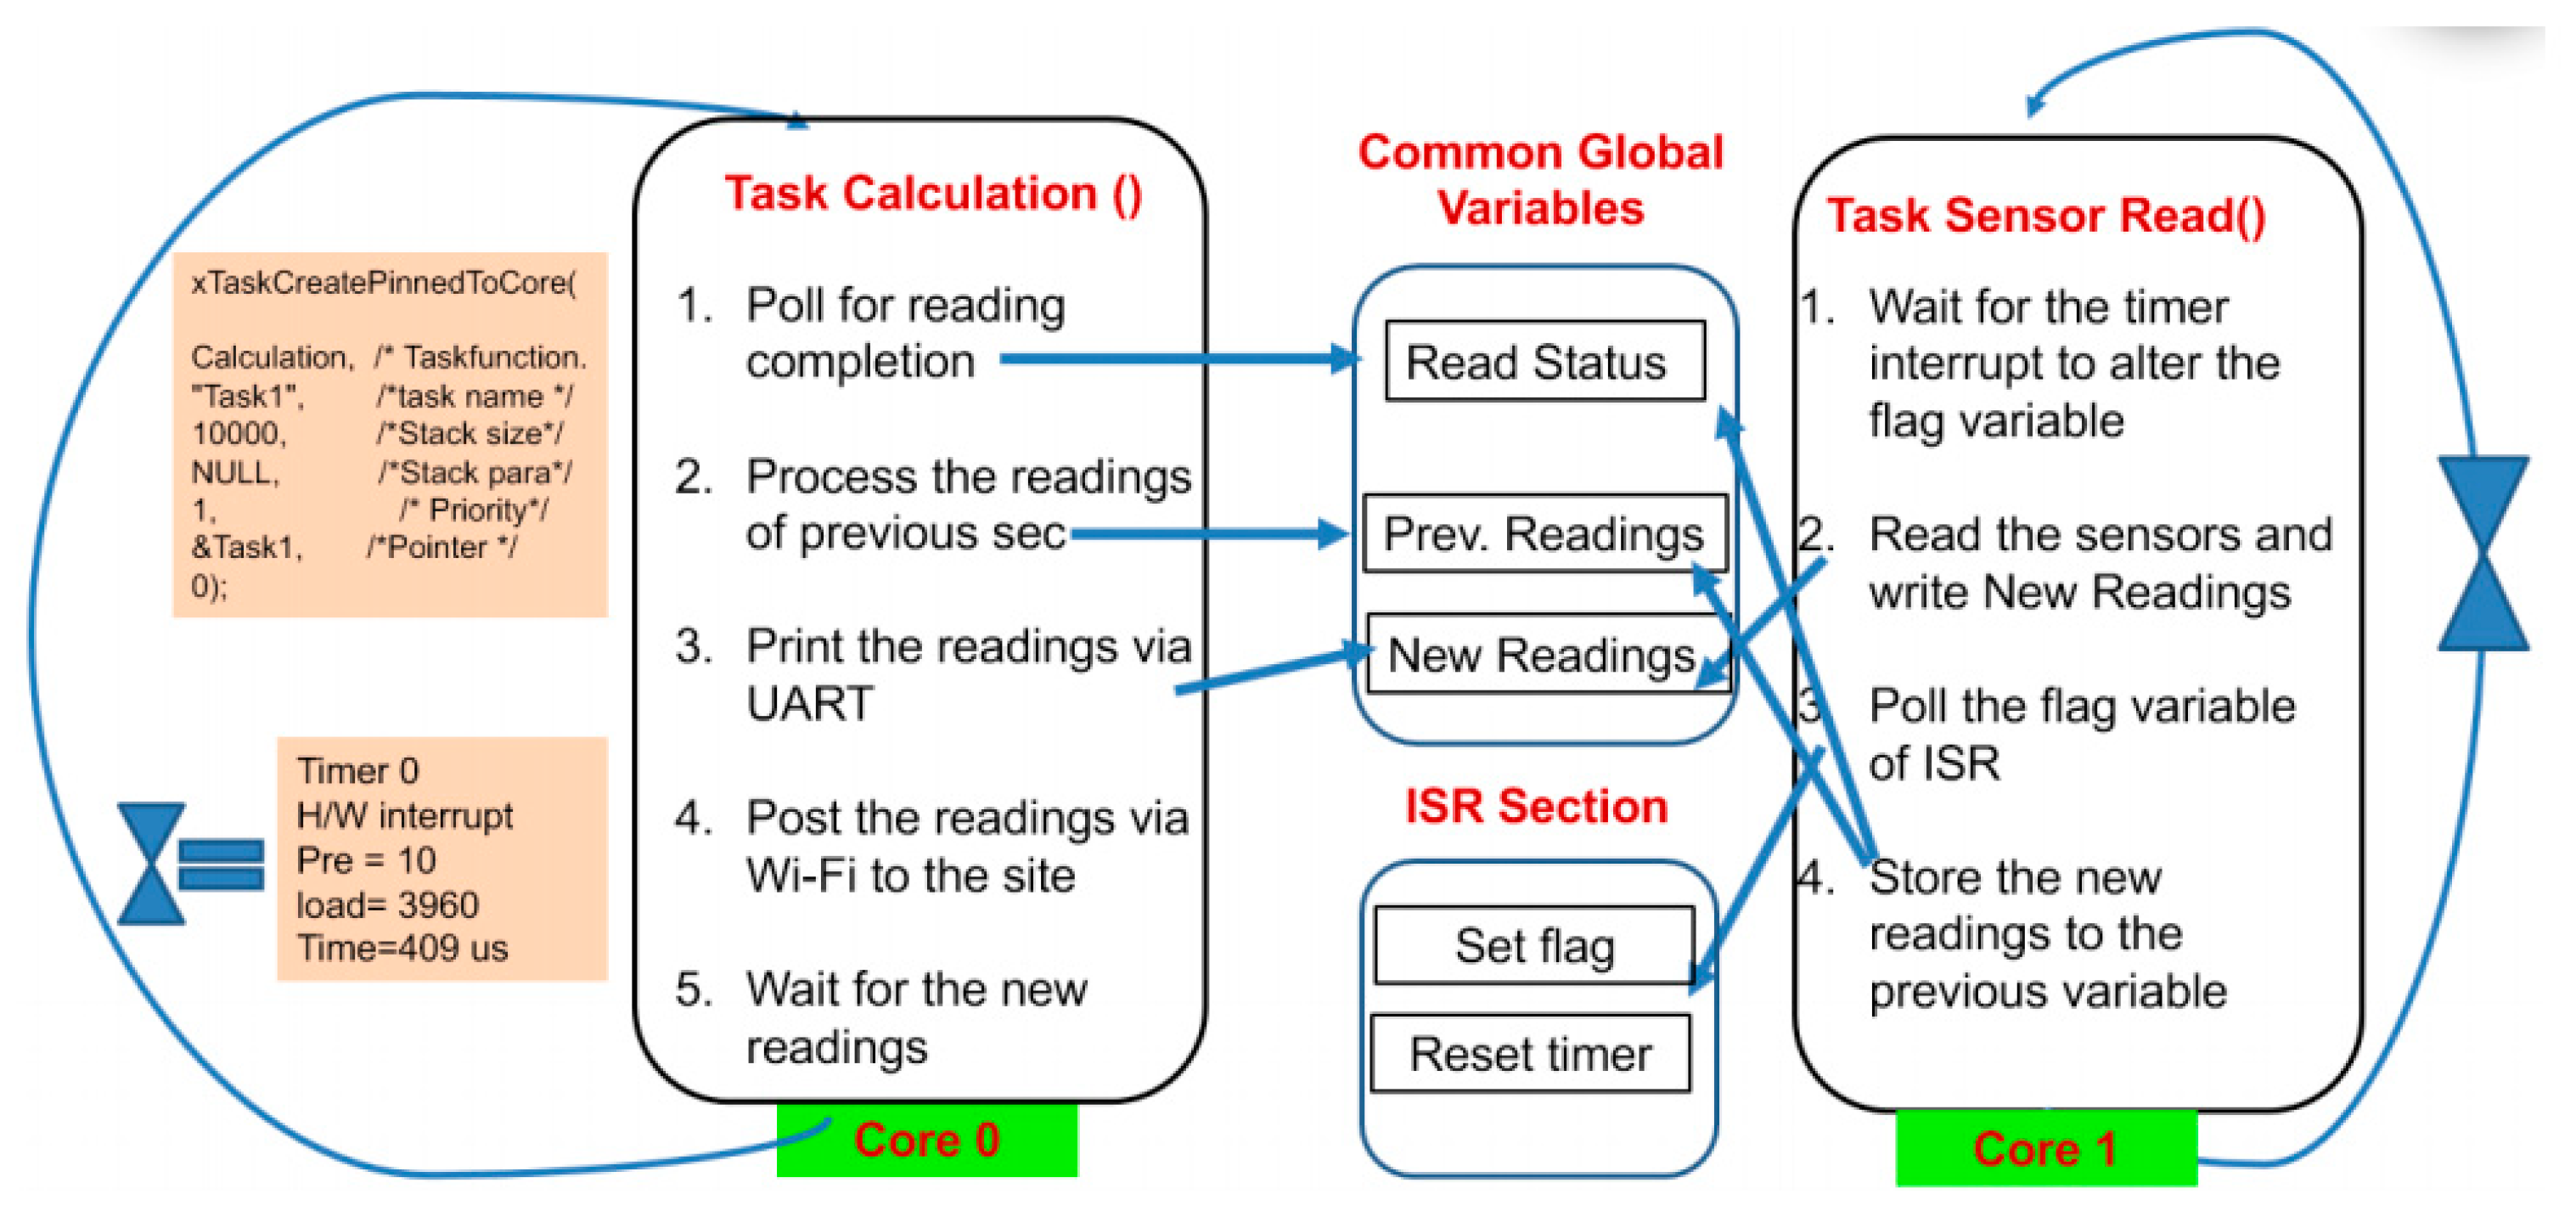
For this meter, the functions are divided into three major tasks: measurement, processing, and data relaying. The measurement task is pinned to core 1 of the CPU and is used to poll the sensors regularly and update the array containing voltage and current samples. This core samples the readings in the current instant by utilizing hardware timer interrupts. This task is very time-critical, meaning that the polling should be symmetrical and synchronous; otherwise, it may compromise the overall meter functionality. The polling task is depicted with s1, s2, s3, etc., as shown in Figure 4. Since the sampling frequency is 2048 Hz, the readings are taken at an equidistant sampling interval of 1/2048 s. With the selected sampling rate, the meter can measure the harmonics up to 20th order in both voltage and current. The second task of processing is pinned to core 0 of the CPU, processes the voltage and current readings captured in the previous second, and posts the data to the server every minute. This task has a deadline of 1 s, indicating that the readings of the previous second should be processed entirely, and the processor should be idle before the new readings arrive. The timeline of all the tasks and their respective cores are shown in Figure 4. The final task of data relaying is also pinned to core 0, and this task is executed every 60 s. This task relays both active and reactive power and energy, DPF, distortion VA of the grid and consumer, and the penalties and incentives for the PQ profiles. All the tasks run parallelly in real time, as shown in the timeline, and all the hardware resources and programming variables are shared within the two cores simultaneously.
4.1. Measurment
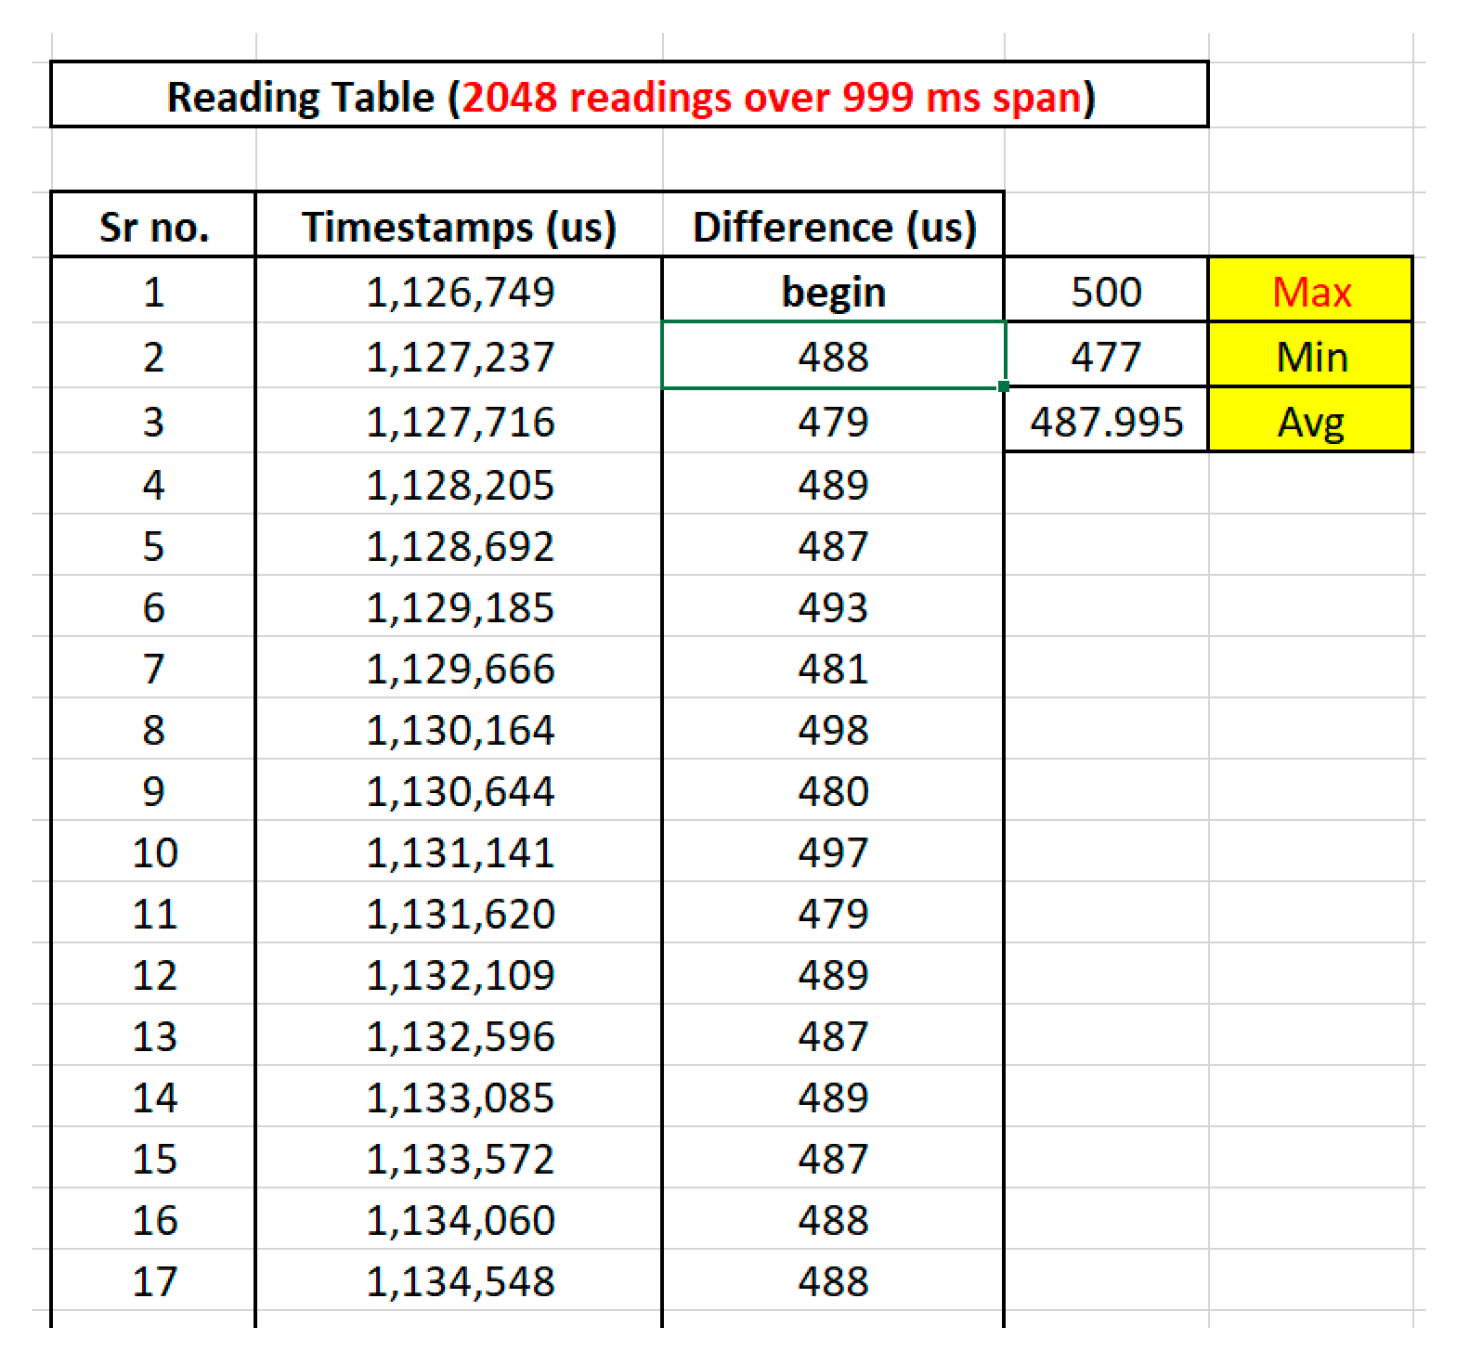
As the voltage and current waveforms are sampled at 2048 Hz, the interrupt should be generated at every 488.28 μs interval. To do so, an appropriate count is loaded in timer 1 of core 1, and this timer interrupt updates a flag variable in the interrupt service routine (ISR) upon its overflow, indicating to the core that the time has elapsed and the sensors should be polled. The sensors are polled for a complete 1 s interval like this, and the sampled readings are passed to core 0 for the calculation task. After this, polling for the next second begins again, and the process continues forever in a loop. It is a time-bound infinite loop that runs continuously in parallel to all the other tasks. The flow chart of the whole program is shown in Figure 5.
4.2. Processing
For the implementation of the penalty/incentive scheme, the following listed power, energy, and PQ parameters are measured.
4.2.1. DC Offset, Fundamental Frequency, Magnitude, and Phase Spectrum, and the DPF
A split radix FFT algorithm, a variant of the Cooley–Tukey FFT algorithm that uses a mixture of radices 2 and 4, is used to calculate the DC and fundamental frequency component of a distorted signal. Here, both the sampling frequency and the number of samples are set to 2048, which results in a sharp frequency resolution of 1 Hz. After extraction of the magnitude and phase angles of all required frequency components, the DPF can be calculated from the phase difference of the fundamental voltage and current as below.
4.2.2. True RMS Value
Unlike the conventional method, which finds the RMS value from its amplitude, this method computes the true RMS value as given in (3).
4.2.3. Active and Reactive Power
The active (P) and reactive (Q) powers can be computed by using the RMS value of the fundamental voltage and current components and the DPF value as follows.
P = V1RMS I1RMS DPF and Q = VRMS IRMS tan(cos−1(DPF))
4.2.4. Active and Reactive Energy
Similarly, the active and reactive energies can be found by multiplying the active and reactive power values with time. In this case, the time set is to 1 s, meaning that at any second, active or reactive energy being utilized is equal to active or reactive power. Here, the term ( corresponds to the phase difference between the fundamental voltage and current.
4.2.5. THD in Voltage and Current
THD, an acronym for total harmonic distortion, is a quantity defined as the ratio of harmonic RMS voltage/current to the fundamental RMS voltage/current. The THD values indicate the amount of distortion with respect to the fundamental component. The THD in voltage and current can be determined using (6), where V1, V2, V3, etc., represent the magnitudes of the fundamental, second, and third harmonic components, respectively.
4.2.6. Consumer and Grid Harmonic Distortion Power in VA
In the case of nonsinusoidal voltage and current signals, the total apparent power can be computed as in (7), per the IEEE standard [29].
where V1I1 is the fundamental apparent power, V1IH is the current harmonic distortion VA, VHI1 is the voltage harmonic distortion VA, VHIH is the harmonic distortion apparent power VA. These power values are used to find the harmonic contribution of the consumer and grid, and then the energy values WHckVA and WHukVA are derived. WHckVA corresponds to the harmonic distortion energy injected by the consumer, and it is found by multiplying the current harmonic distortion value, i.e., V1IH, with time. WHukVA is the harmonic distortion energy due to utility, and it is a product of the VHIH component and time.
S = (VI)2 = (V1I1)2 + (V1IH)2 + (VHI1)2 + (VHIH)2
4.2.7. Sag and Swell in the Utility Voltage
The percentage of voltage sag and voltage swell are monitored continuously as given in (8) and (9), respectively.
4.2.8. Penalties and Incentives for PQ violations
Finally, after assessing the power, energy, and necessary PQ parameters for a consumer and utility, these values should be checked for violations of the specified limits. If the consumer load profile adheres to the aforementioned harmonic and power factor limits, the consumer is given an incentive and penalized otherwise. In this scheme, the penalties are imposed because of harmonic limit violations and reactive power limit violations, whereas compensation is given to the consumer for grid voltage distortion due to utility. The total penalty/incentive is obtained using (1)–(9), and they are in addition to the active energy consumption charges.
4.3. Data Relaying
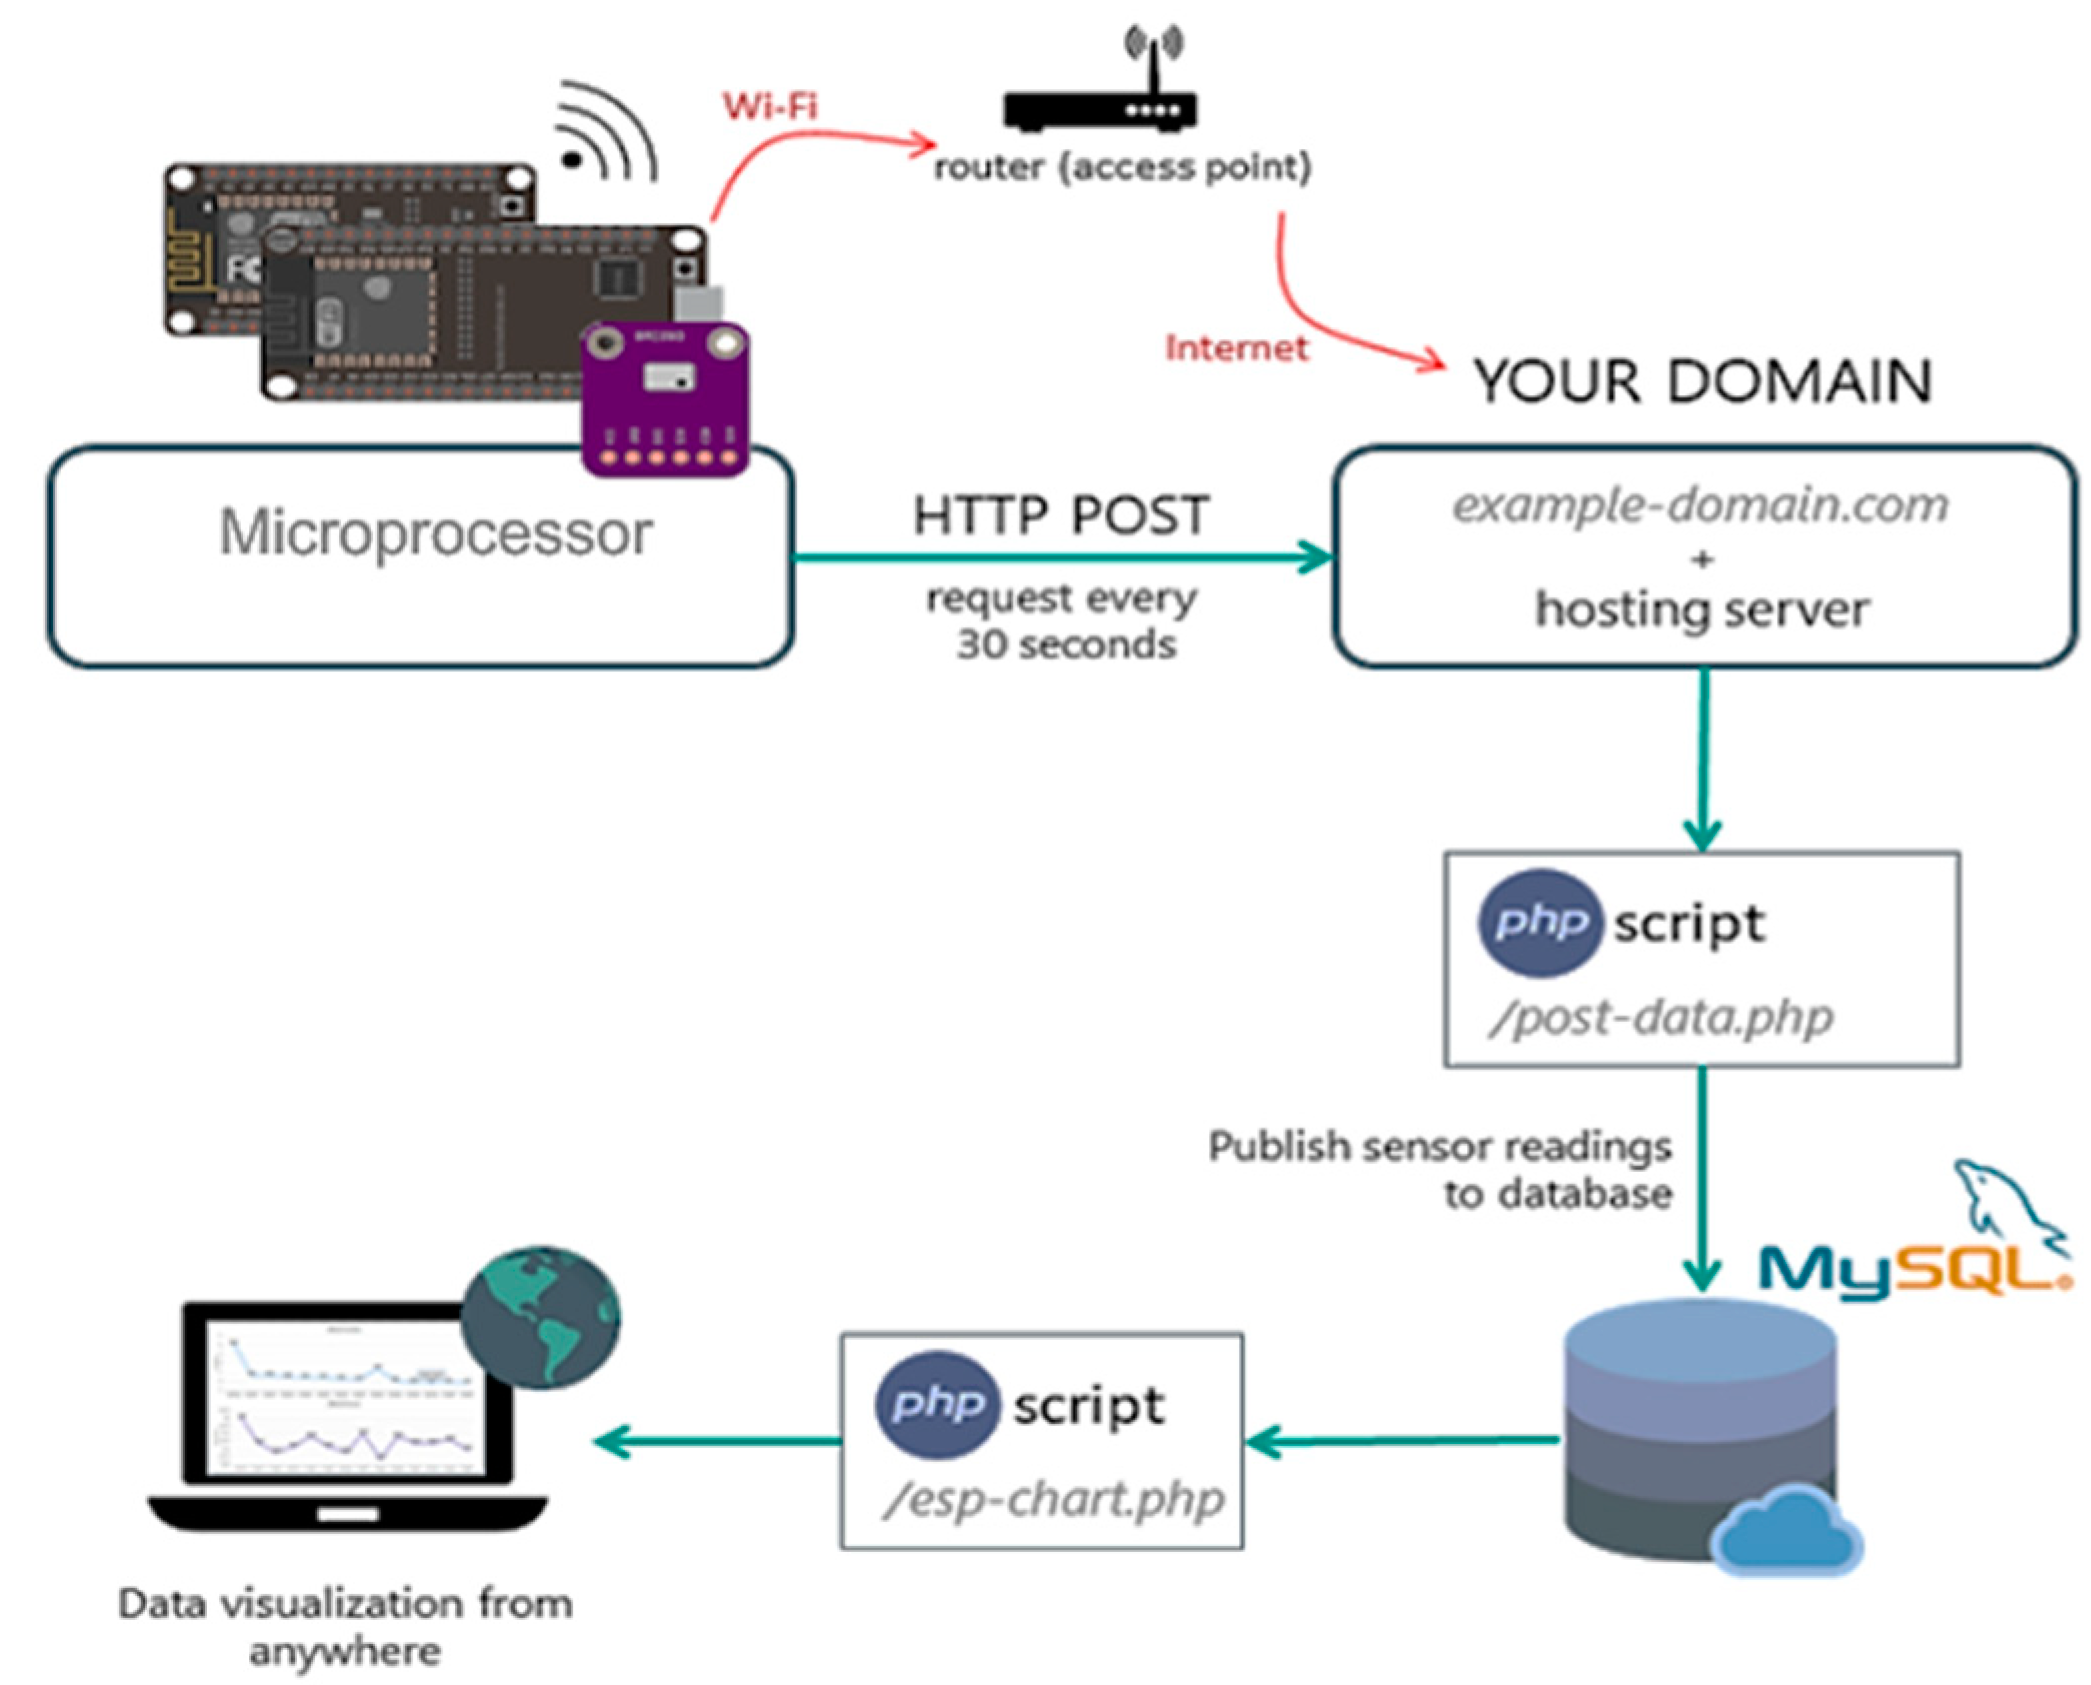
After necessary computations and processing, the PQ smart meter communicates all these quantities to a remote server. This information flow is shown in Figure 6. The meter gets connected to the Wi-Fi access point, sends an HTTP POST request to the website running the PHP script, and waits for acknowledgment. This PHP script captures the meter data, verifies the access credentials, and then transmits the captured data into the SQL database. This database is then later used for visualization by another PHP script on the website to display the data for the user.
5. Results and Discussion
5.1. Software Testing Results
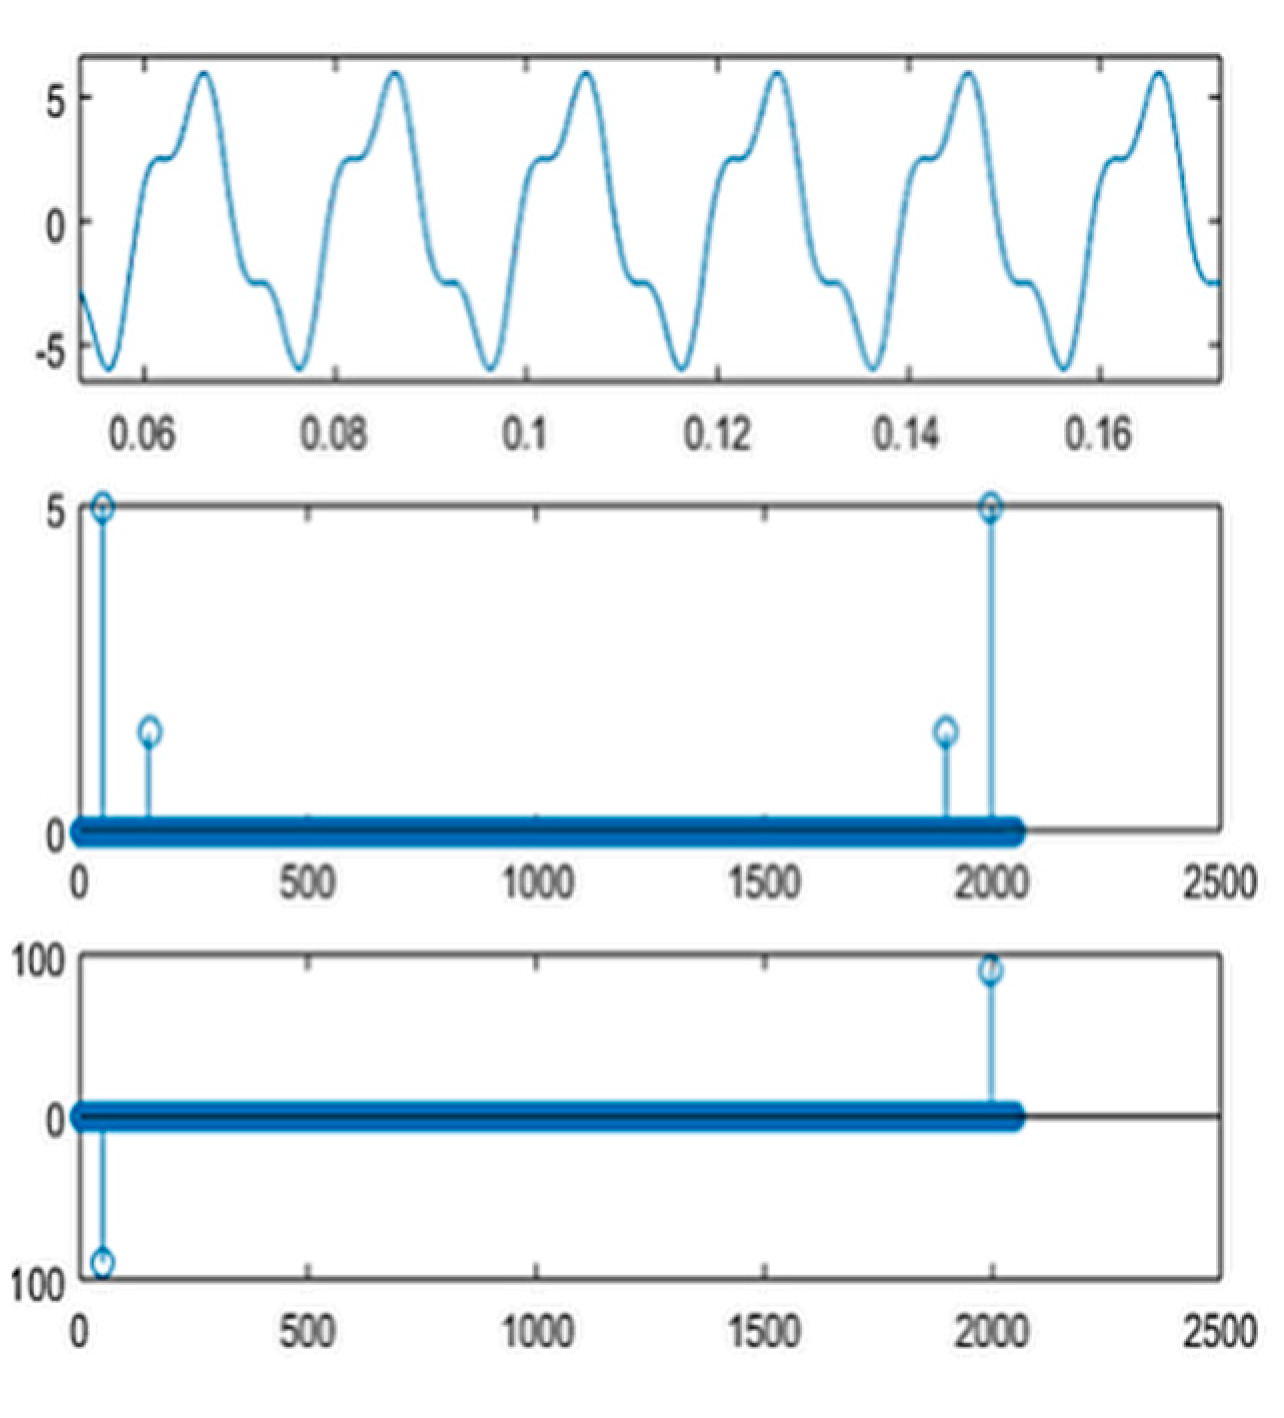
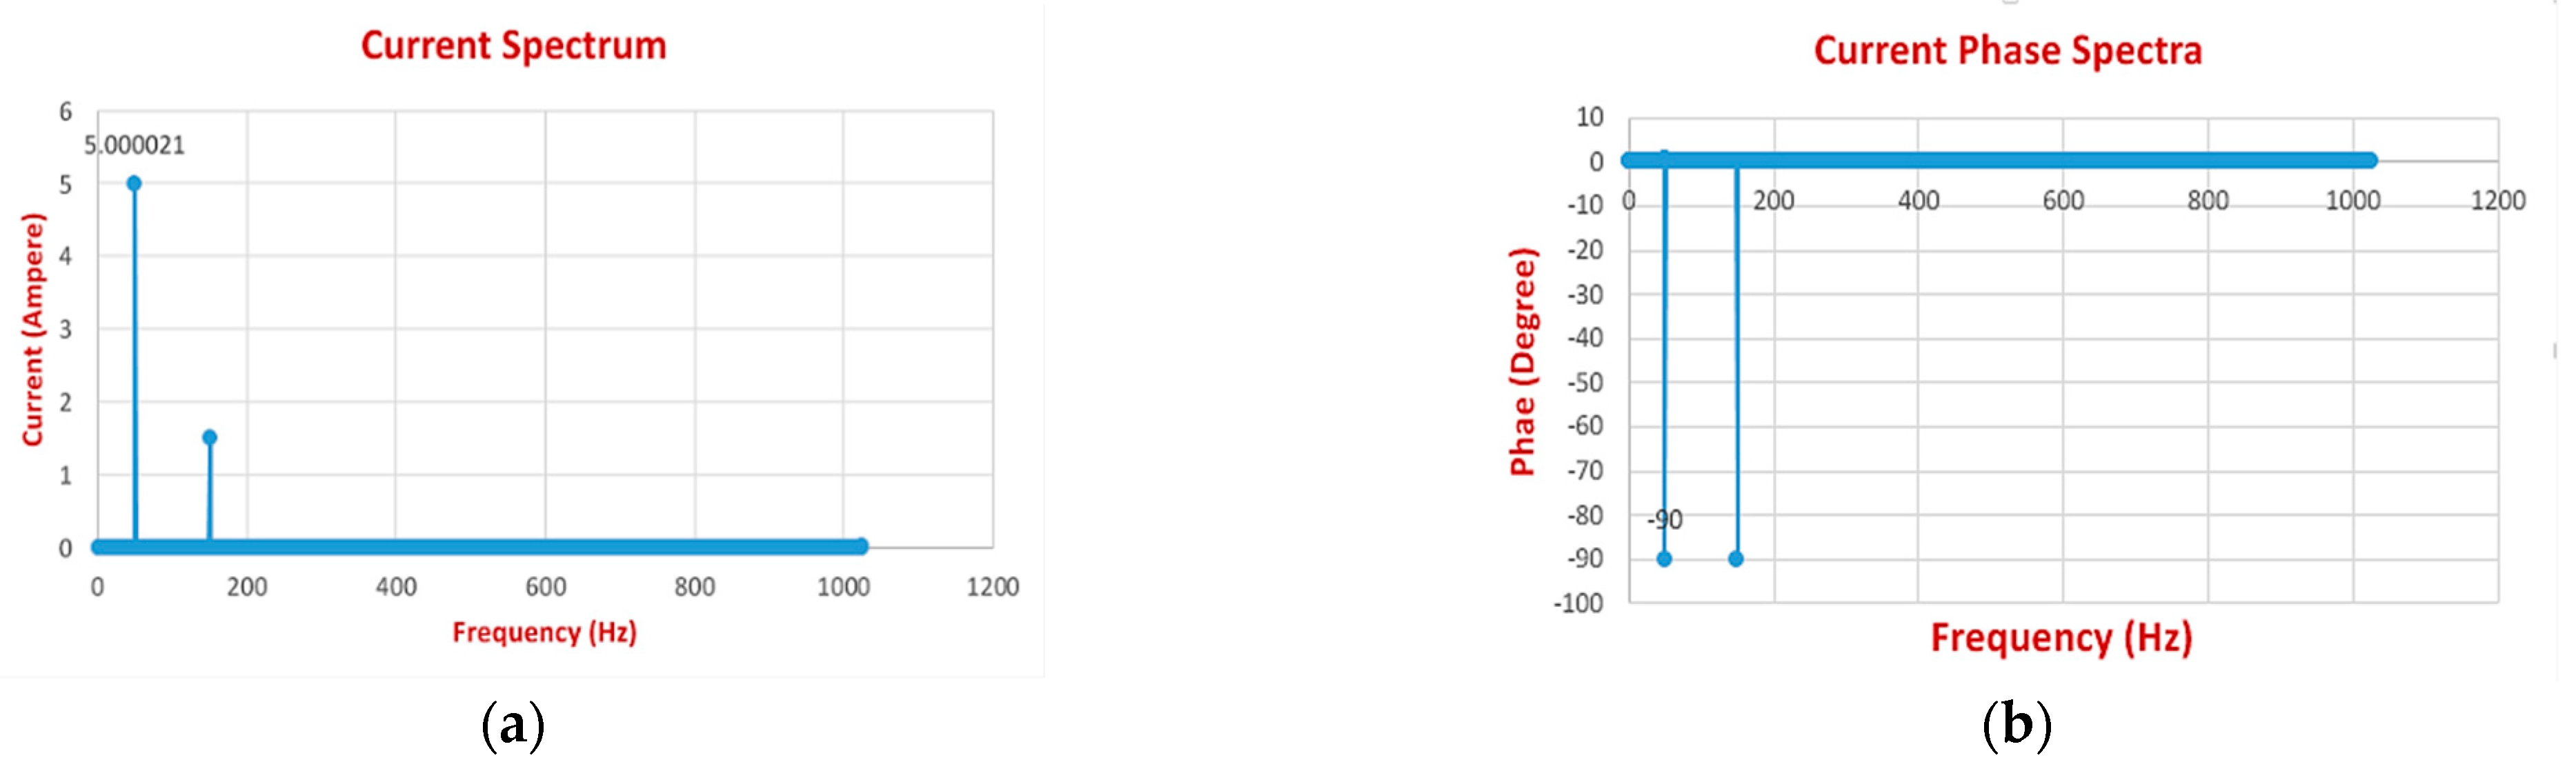
To elucidate the estimation accuracy and proof of concept of implementation of the tariff scheme, the developed smart PQ meter is verified for both simulated and real-world situations. The performance of the meter is tested under various load conditions to examine its hardware and software functionalities like the interrupt reliability, efficiency of the FFT algorithm, overall penalty/incentive calculation, PHP site, and MySQL server. Figure 7 shows how interrupts are generated every required second without fail. To test the implementation of the FFT algorithm, a digital nonsinusoidal signal, shown in Figure 8, with a mixture of third harmonic components, is loaded into the MCU, and then the obtained FFT spectrum is compared with the expected one. The calculated magnitude spectrum shown in Figure 9 exactly matches the expected spectra, and the phase relationships are found to be correct.
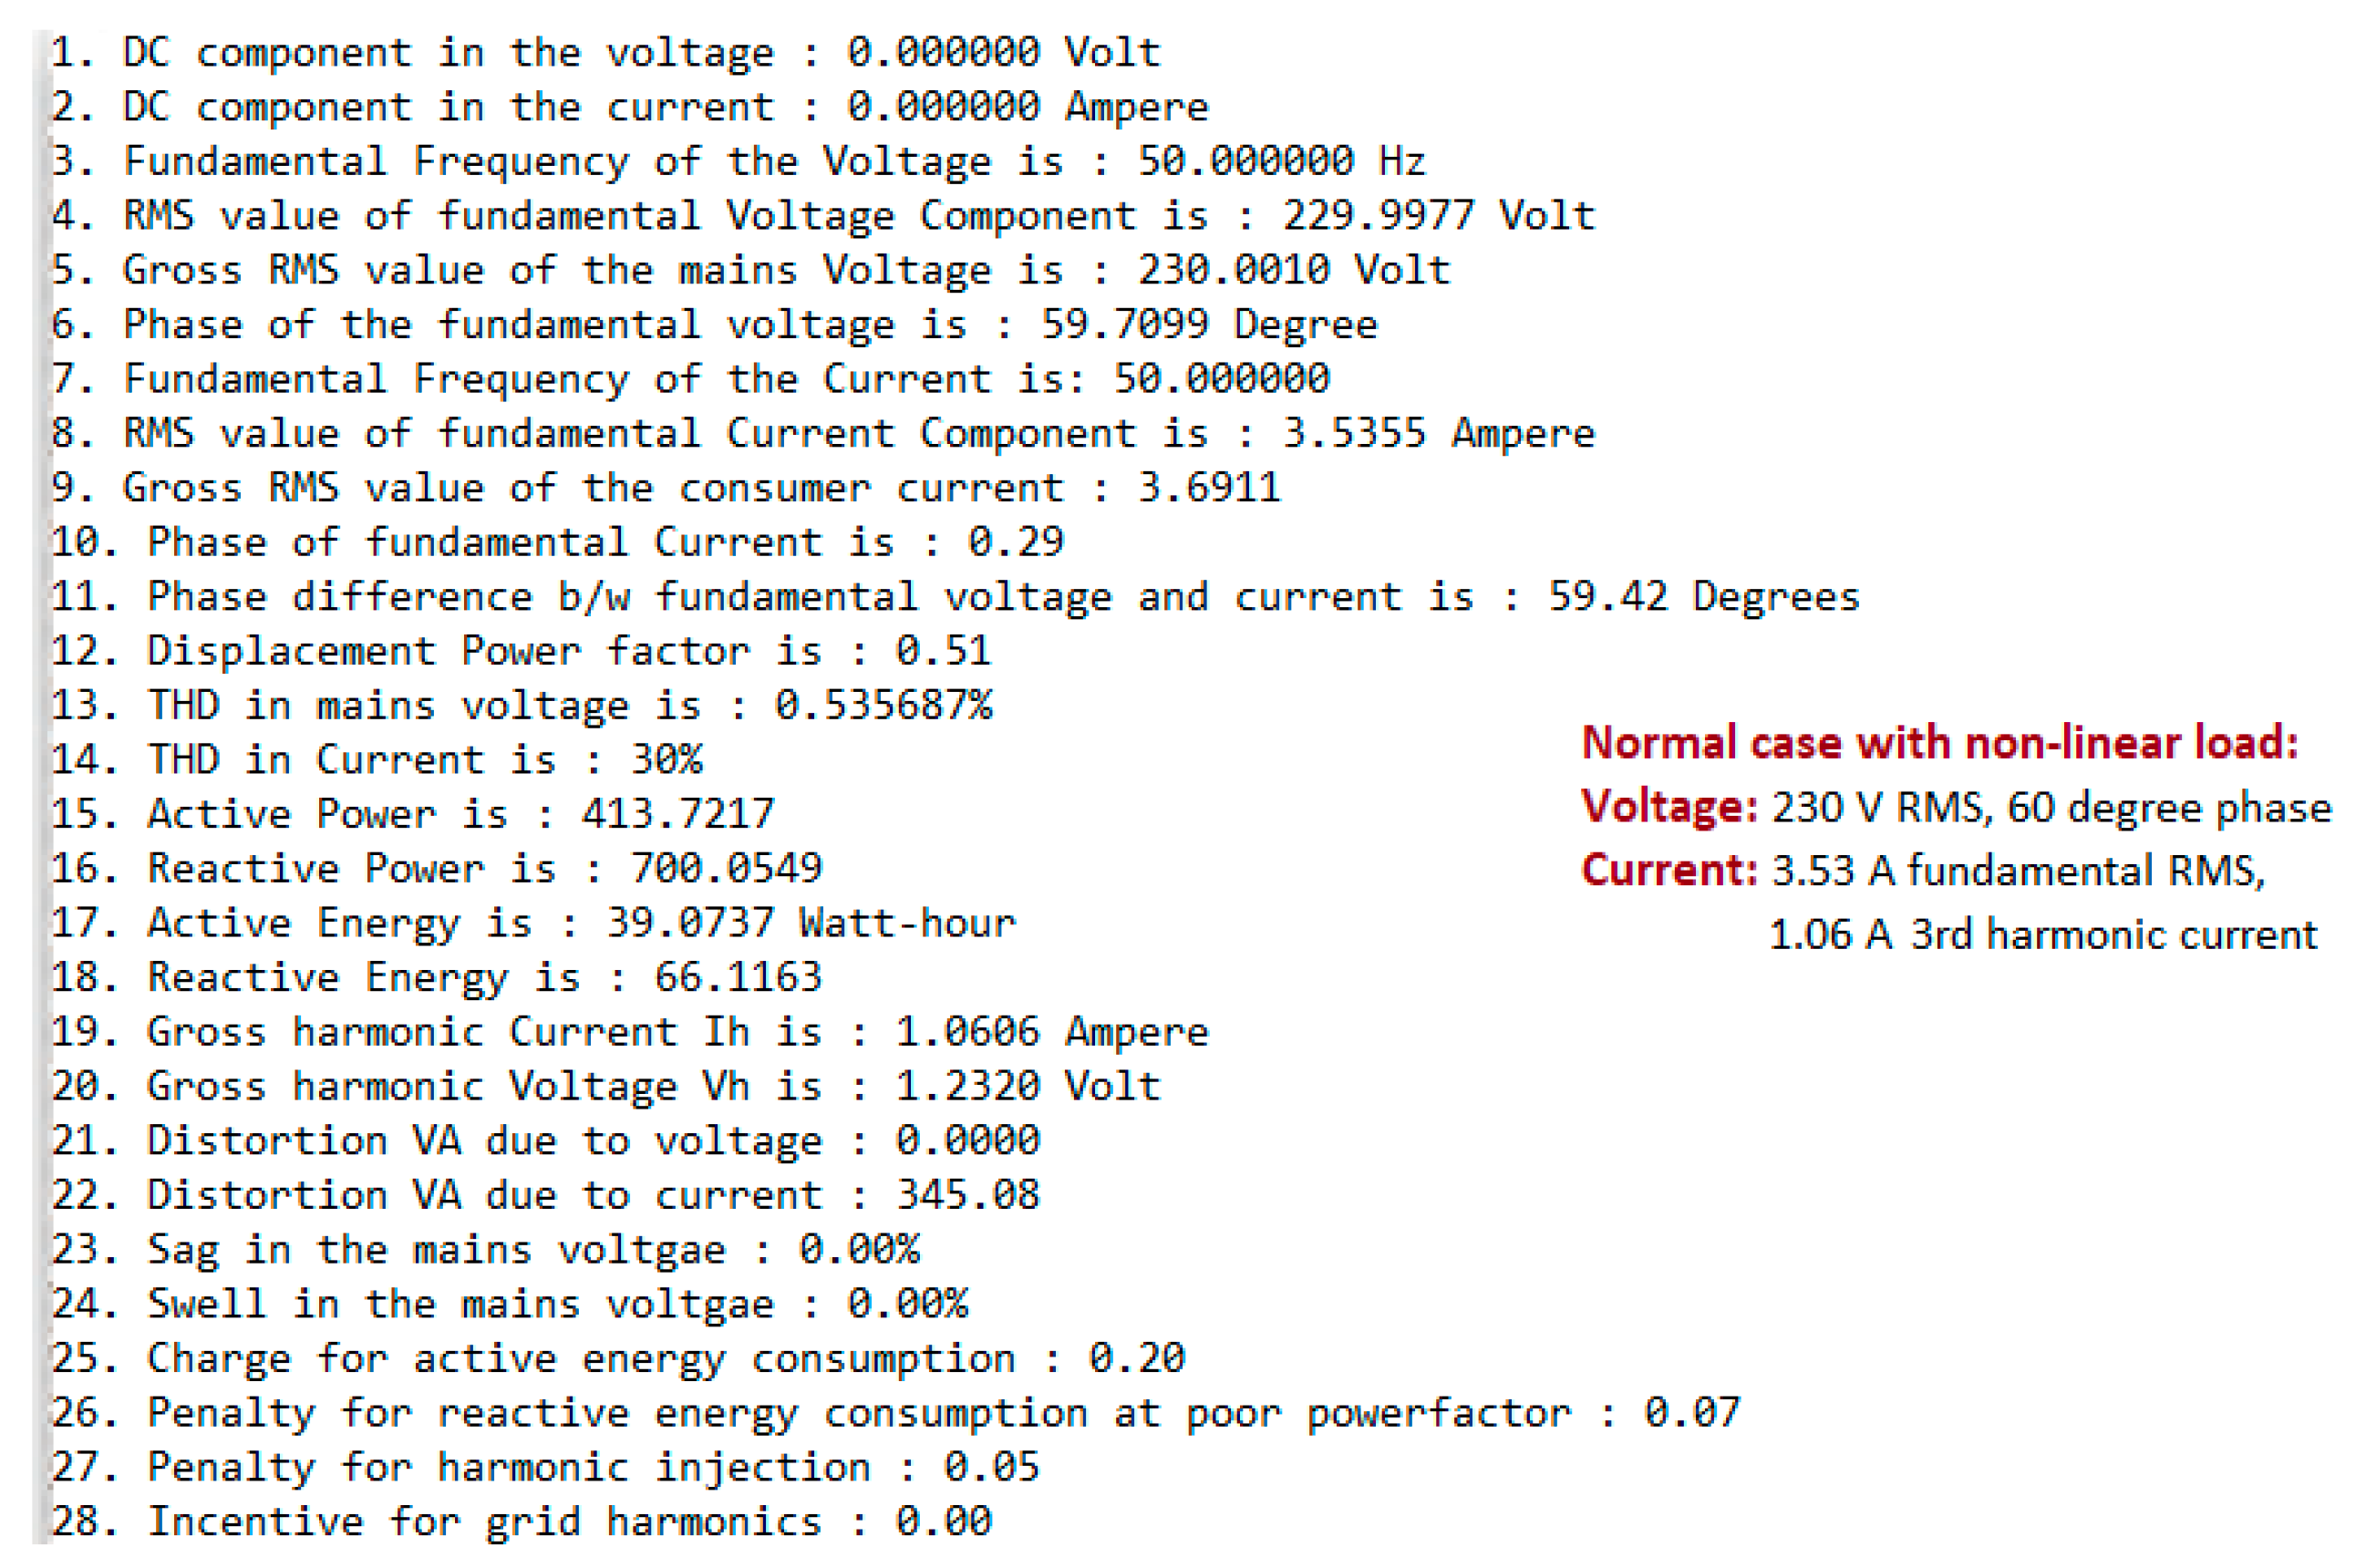
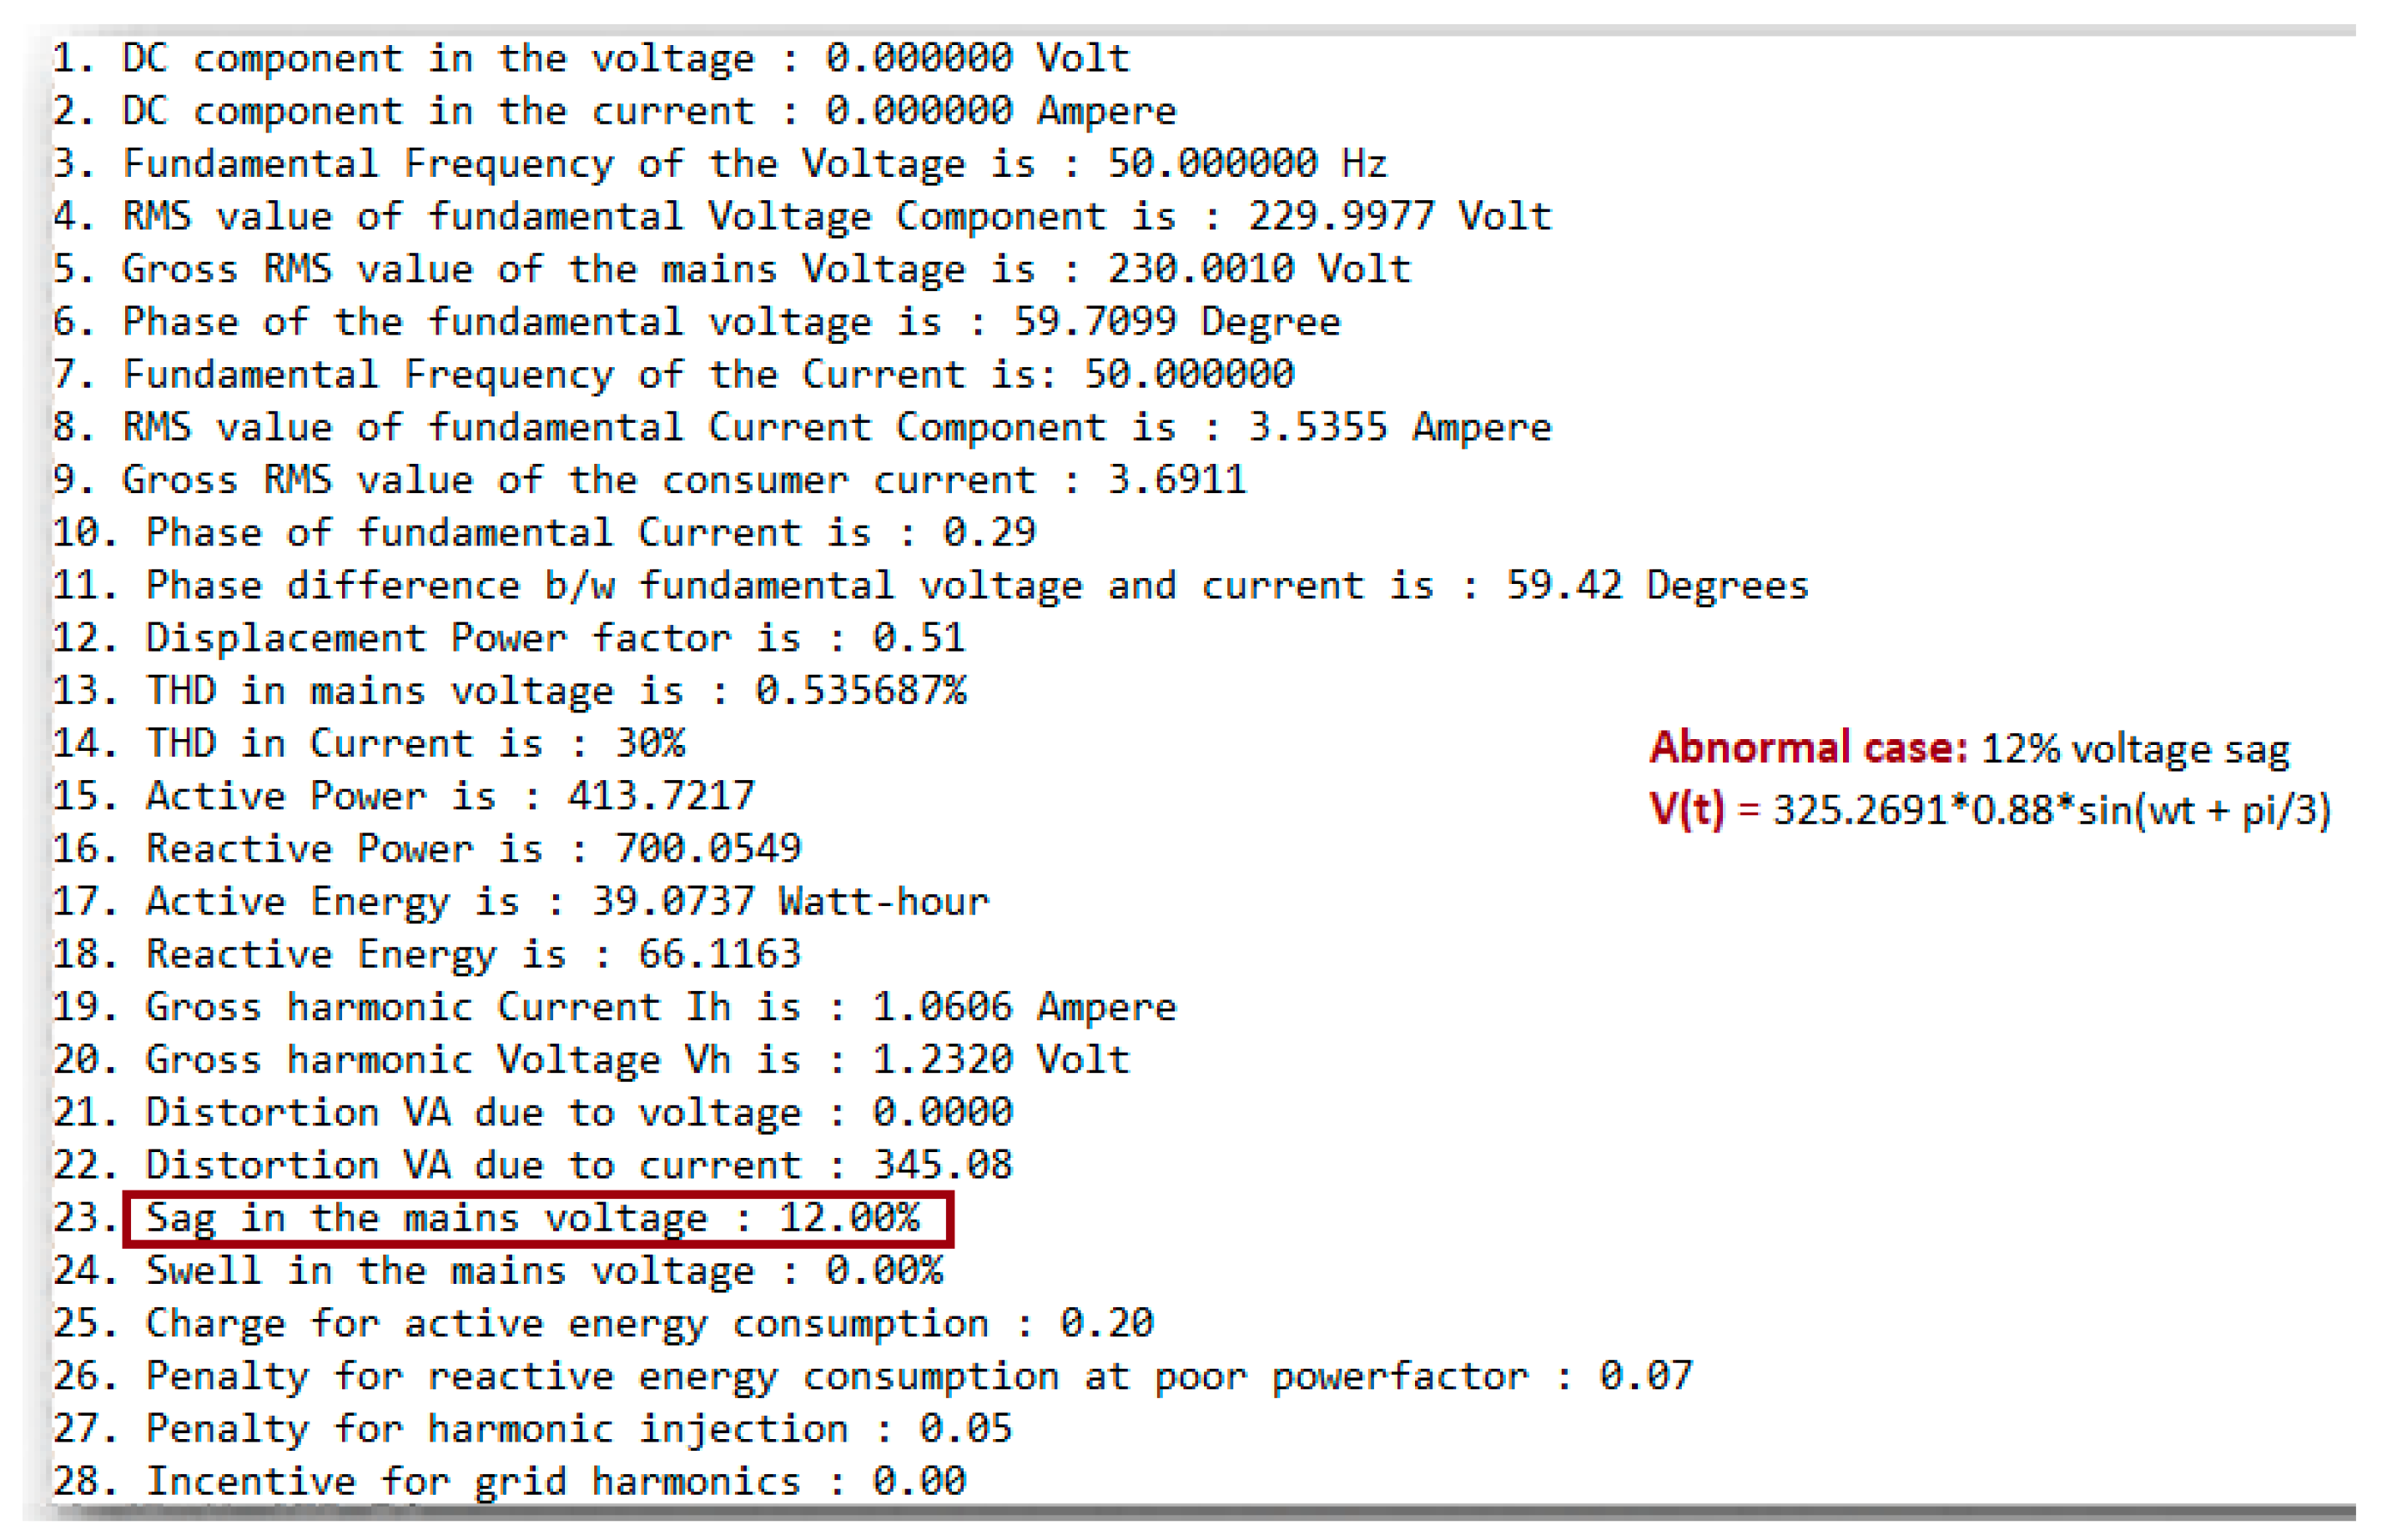
Finally, to test the data upload and visualization, the MCU is fed with sample data in two sets. The first set has digitized samples of the voltage corresponding to the RMS values of 230 V, 50 Hz, and the phase of 60° and current of the magnitude of 5 A for the fundamental and 1.5 A for third harmonic. The second set of data has digitized samples corresponding to the same voltage and current values with an additional 12% voltage sag. It is observed that all 28 parameters are calculated with very satisfactory accuracy, and the error due to floating-point arithmetic is much lower, almost negligible. The meter gets connected to a Wi-Fi network and, through HTTP POST, sends the data to the remote site and displays the parameters on the local computer as well via UART, as shown in Figure 10 and Figure 11. The website updates the readings with the arrival of every new datum, and this datum is verified to be correct.
5.2. Hardware Testing Results
To verify the efficiency of the hardware setup, the PQ meter is subjected to various operating conditions. A wave shape and phase relationship test and true RMS measurement test were carried out, and the results discussed below.
5.2.1. Waveshape and Phase Relationship Test
The meter was connected to monitor a 750 W electric iron box load to test the waveshape and the phase relationship. The load was linear and slightly inductive. The code was loaded to the MCU to visualize the voltage and current readings on the serial terminal of a computer, which is shown in Figure 12. It can be noticed from the voltage and current waveforms that the current lagged the voltage and was not contaminated with noise.
5.2.2. True RMS Measurement Test
A bulb was connected to single-phase supply mains with a fan regulator in series to test the true RMS measurement capability, as shown in Figure 13. The fan regulator acted as a potential divider and facilitated the voltage control across the bulb. The smart PQ meter readings are tabulated in Table 2, and the percentage deviation was computed with reference to the values measured from the commercially available digital multimeter (DMM). The maximum error was found to be 1.3%, which is acceptable as per the standards.
5.3. Overall Functionality Testing
Table 3 demonstrates the merit of the proposed penalty/incentive scheme considering four possible conditions. The penalty/incentive prices and the cost were derived in Indian Rupees (Rs. or INR) as per the cost of ancillary services and tariffs in the Indian electricity market. However, for a universally acceptable representation, they have been reported in USD. The price coefficients a, b, c, and d in (1) were set to 0.0012 USD/hr, 0.014 USD/kVARh, 0.021 USD/kVAh, and 0.016 USD/kVAh, respectively. The energies and thereby the penalties/incentives were computed assuming that the load was operated in a steady state for one hour. Case 1 was a purely linear and resistive load, and as expected, the consumer was not penalized for any of the violations. In case 2, the load was linear but inductive with 0.8 pf lag. Therefore, the distortion and penalty due to harmonics were zero, but the consumer was penalized for the power factor violation alone. The consumer with the reactive and nonlinear load, as presented in case 3, was penalized for both the violations. In case 4, an incentive was given to the consumer for harmonics (6% THD) in the grid voltage. The smart meter measured the voltage and current, processed the signals, computed all the necessary parameters, and penalized the consumers.
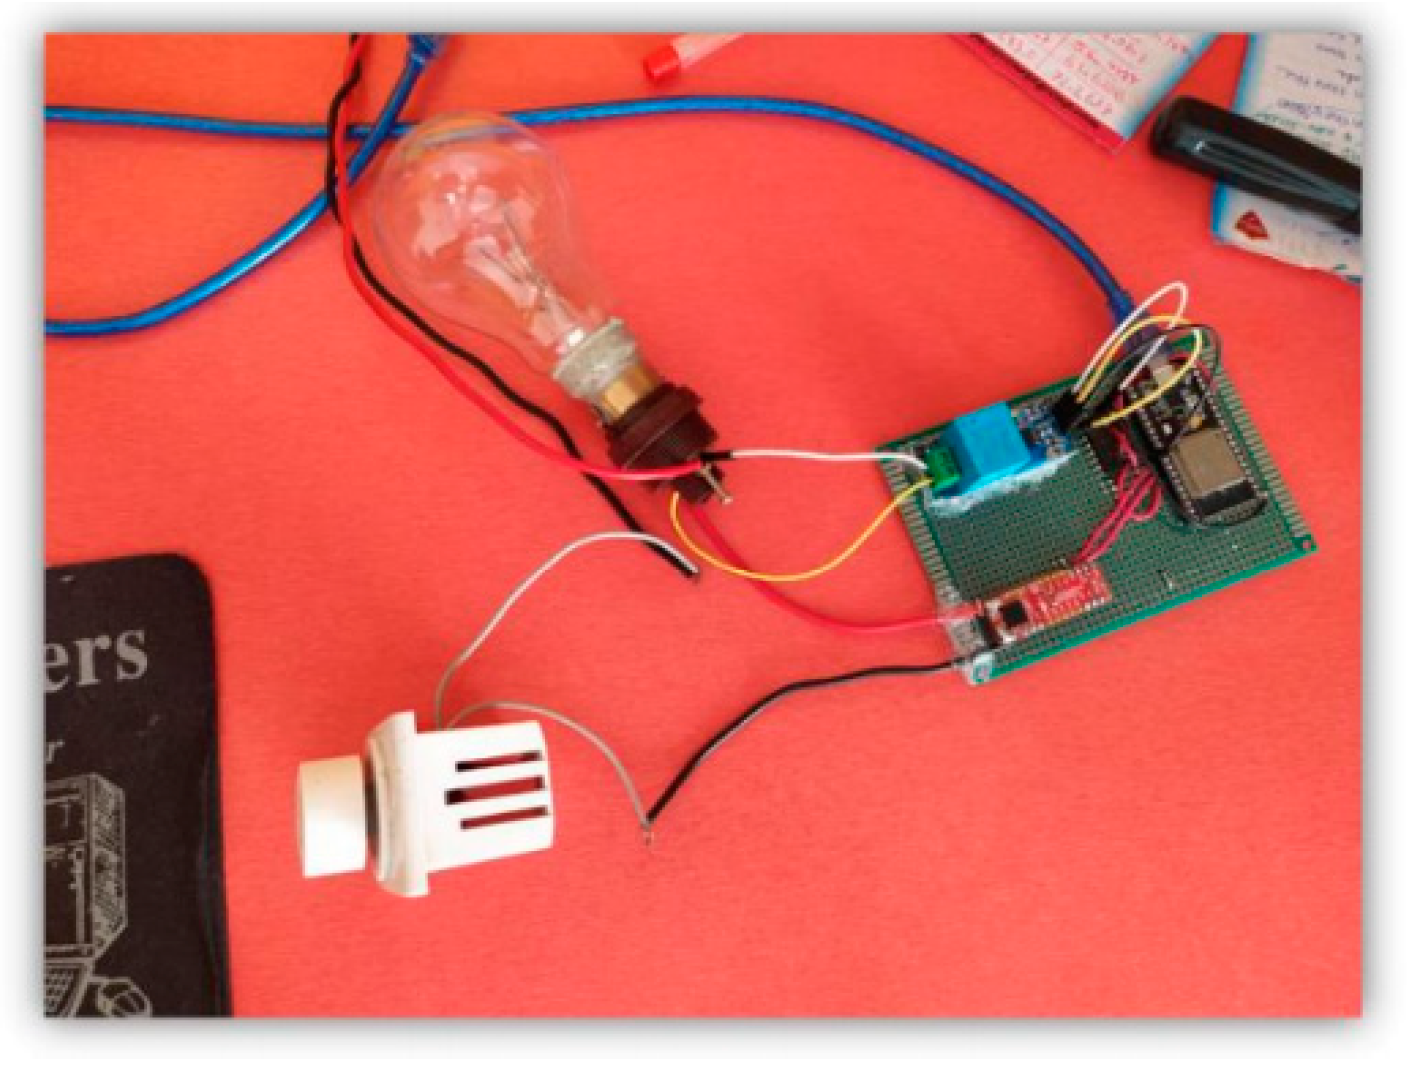
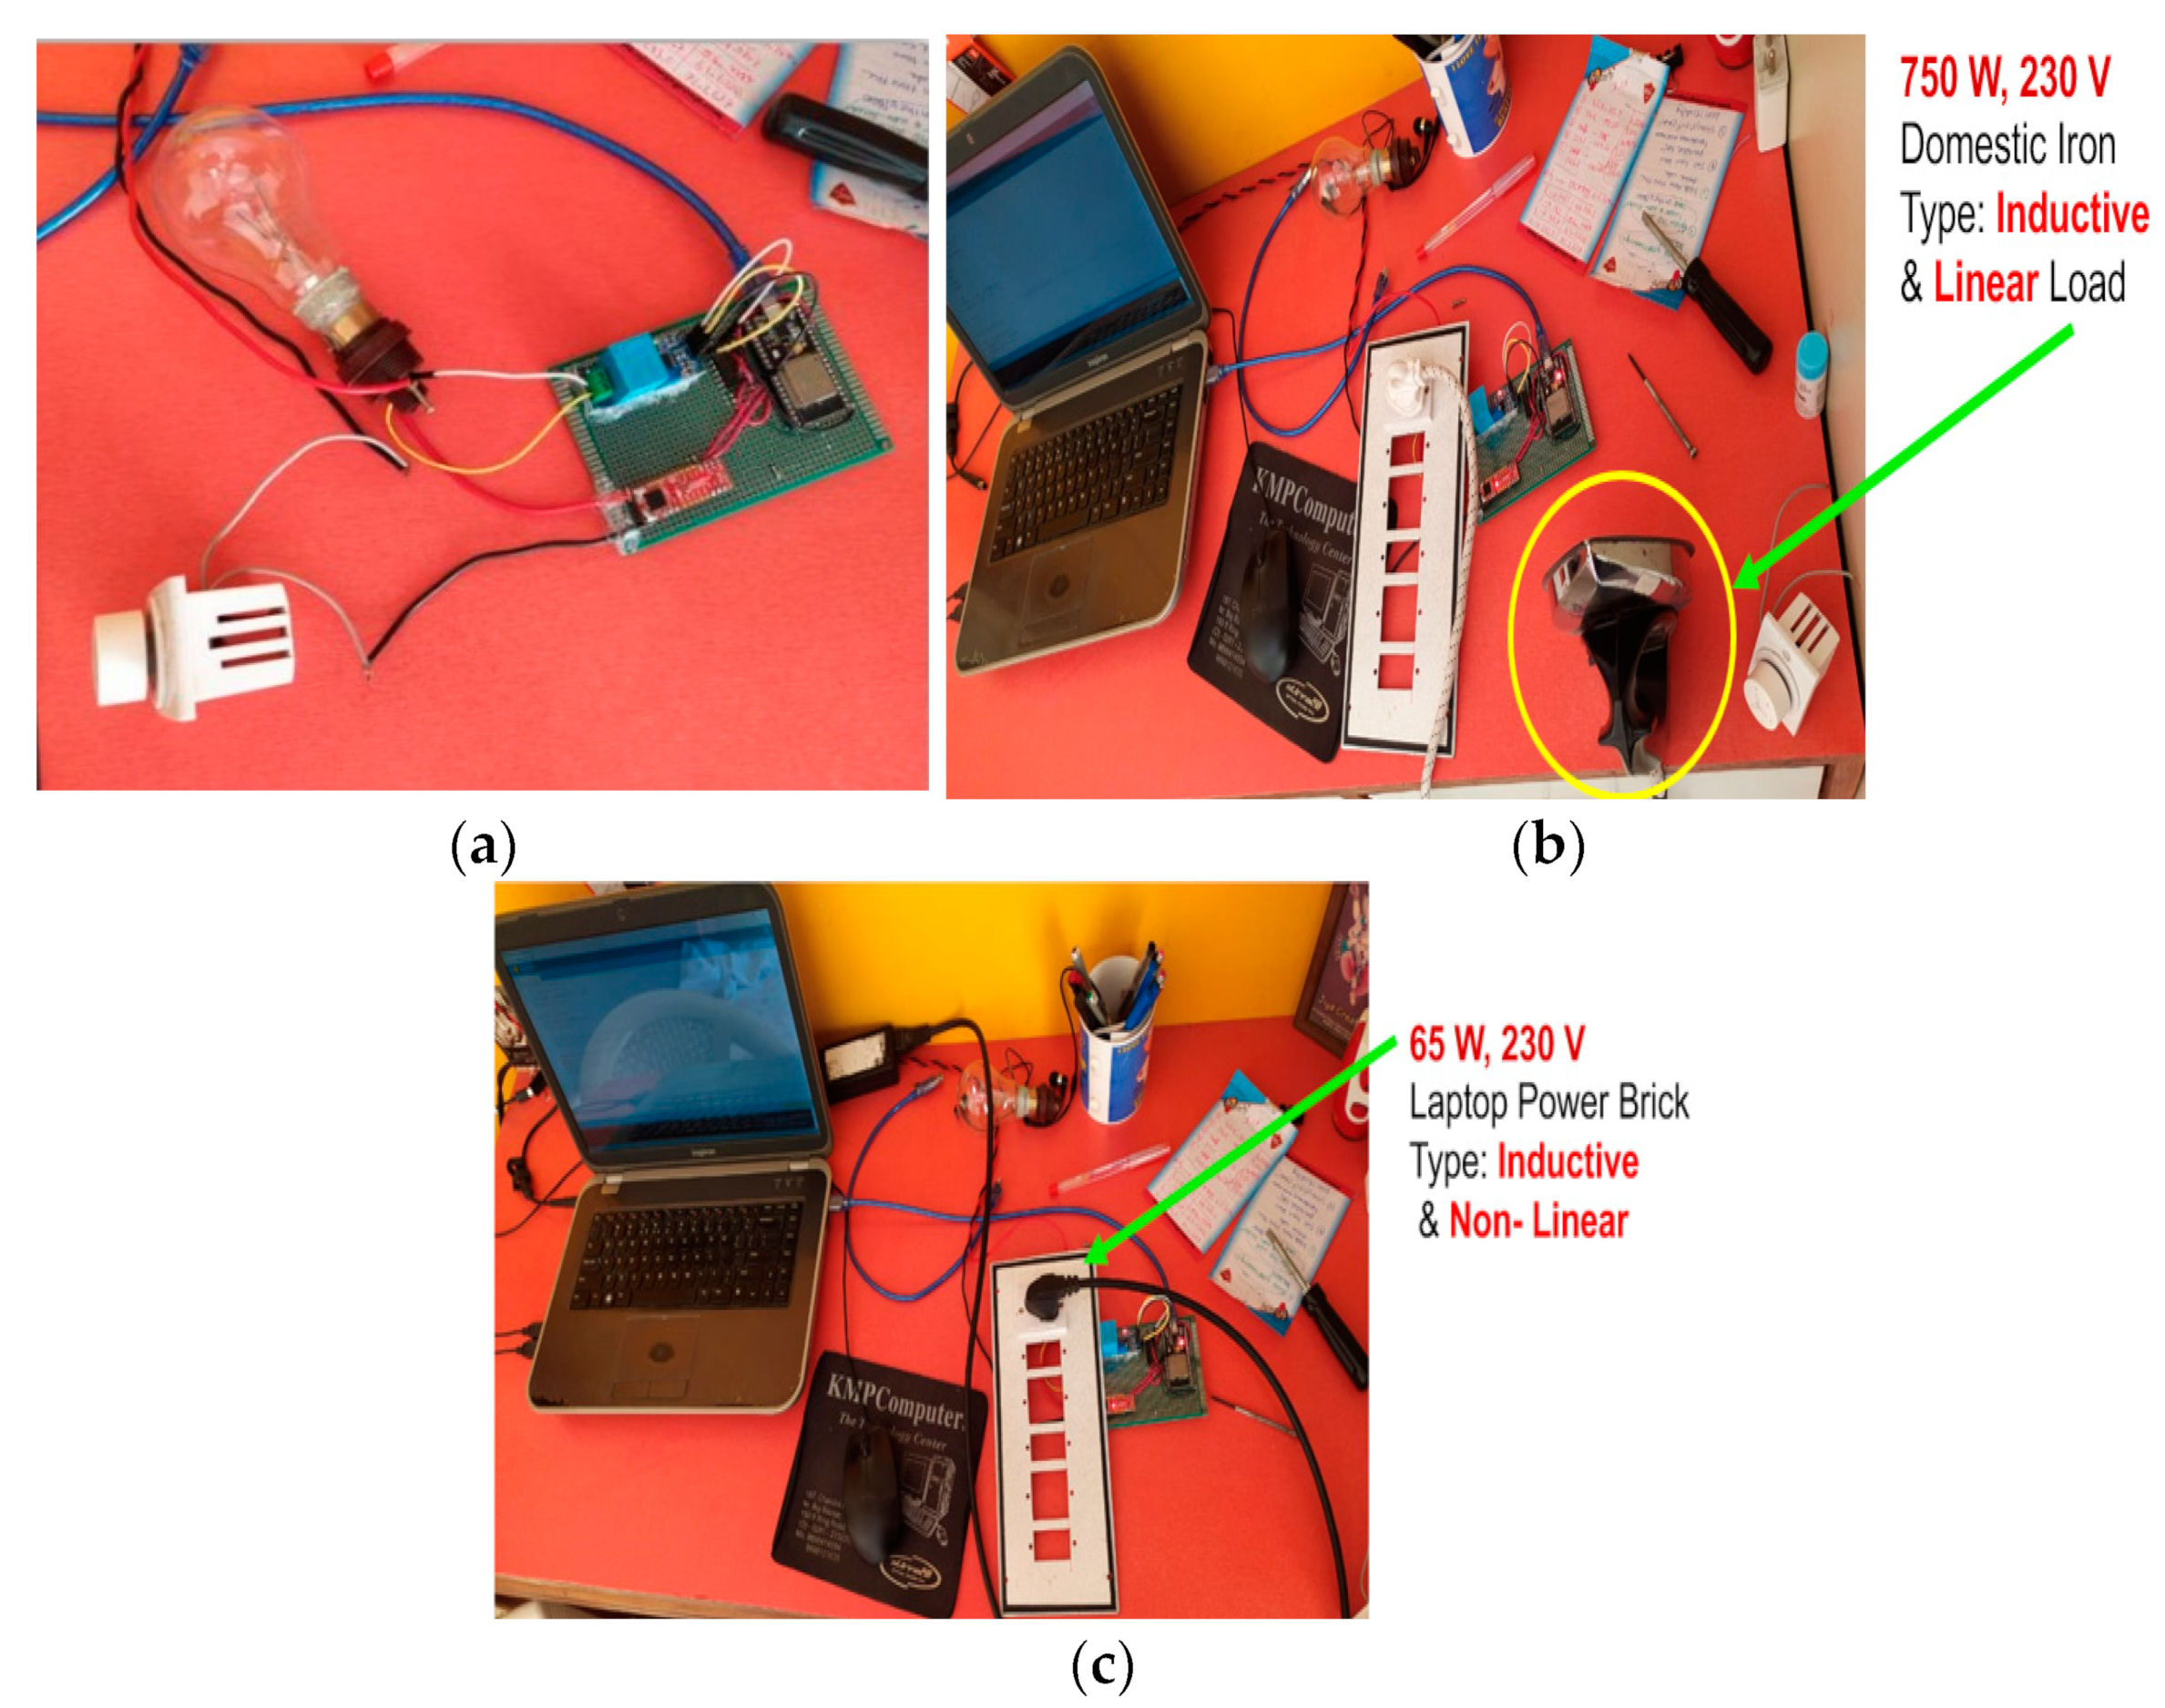
The smart PQ meter was connected to the three types of domestic loads to test the overall PQ and energy meter functionality. One was purely resistive, and the second was an RL load and a nonlinear load. The test setups of the three loads are shown in Figure 14. Figure 14a shows the experimental setup of a smart meter measuring the PQ of an incandescent bulb, which had a resistive property. Figure 14b shows the PQ measurement of a domestic iron, which was an RL-type load. The laptop charger was basically a switch-mode power supply, and, hence, the current distortion could be measured using the PQ meter, as shown in Figure 14c.
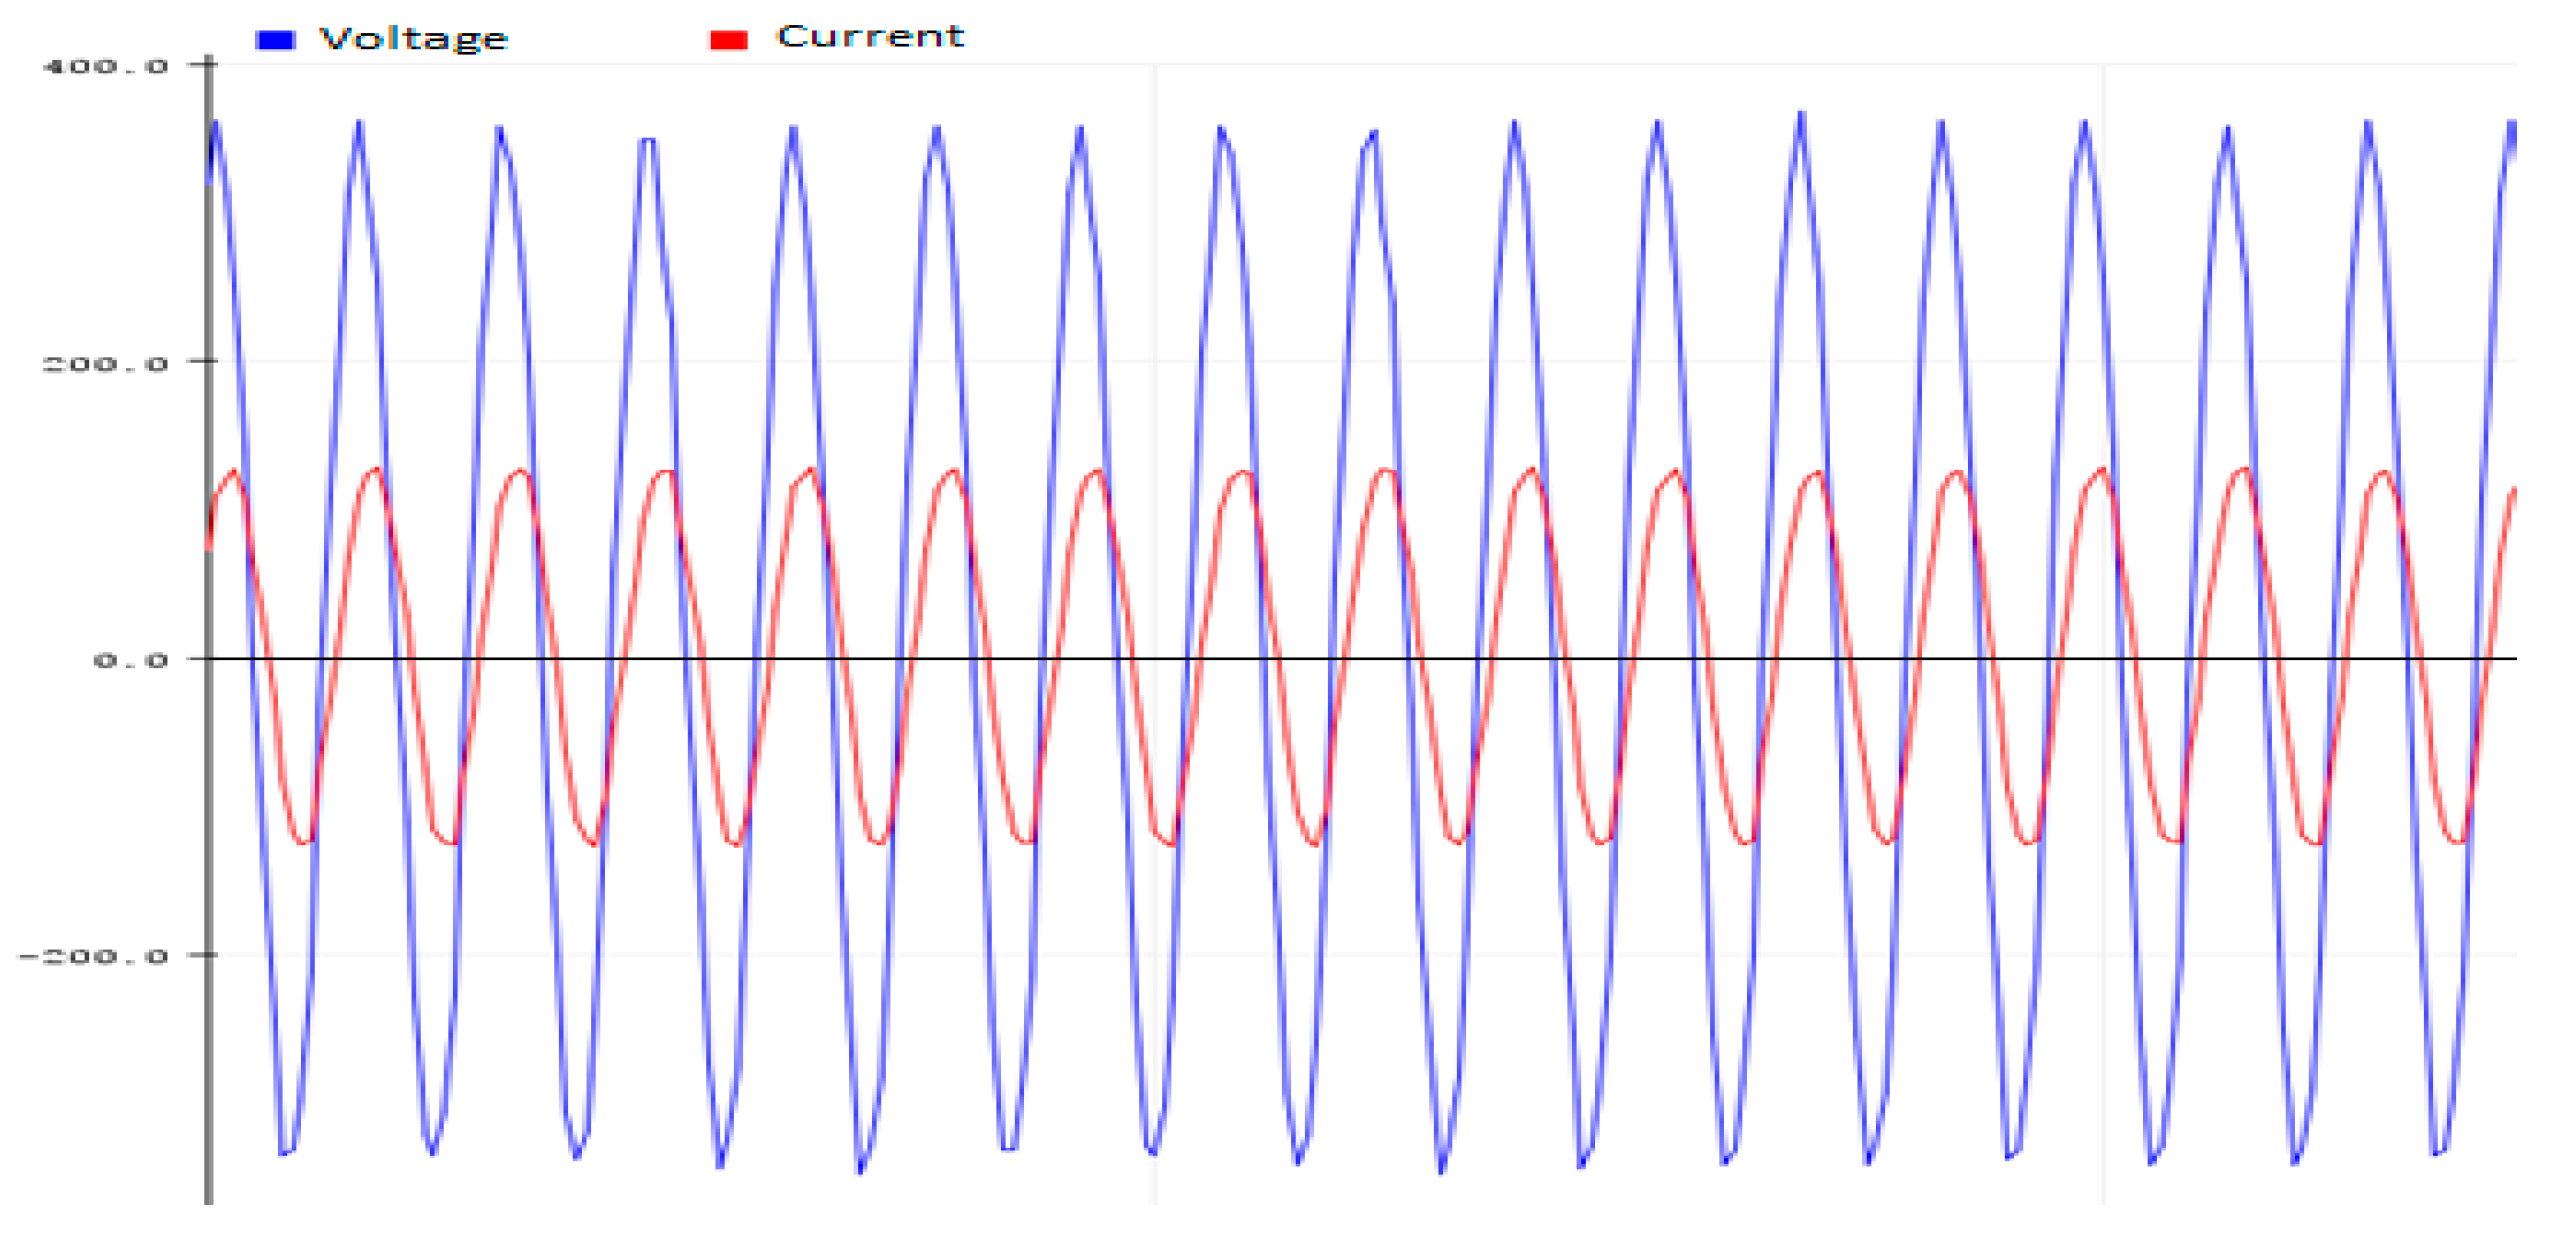
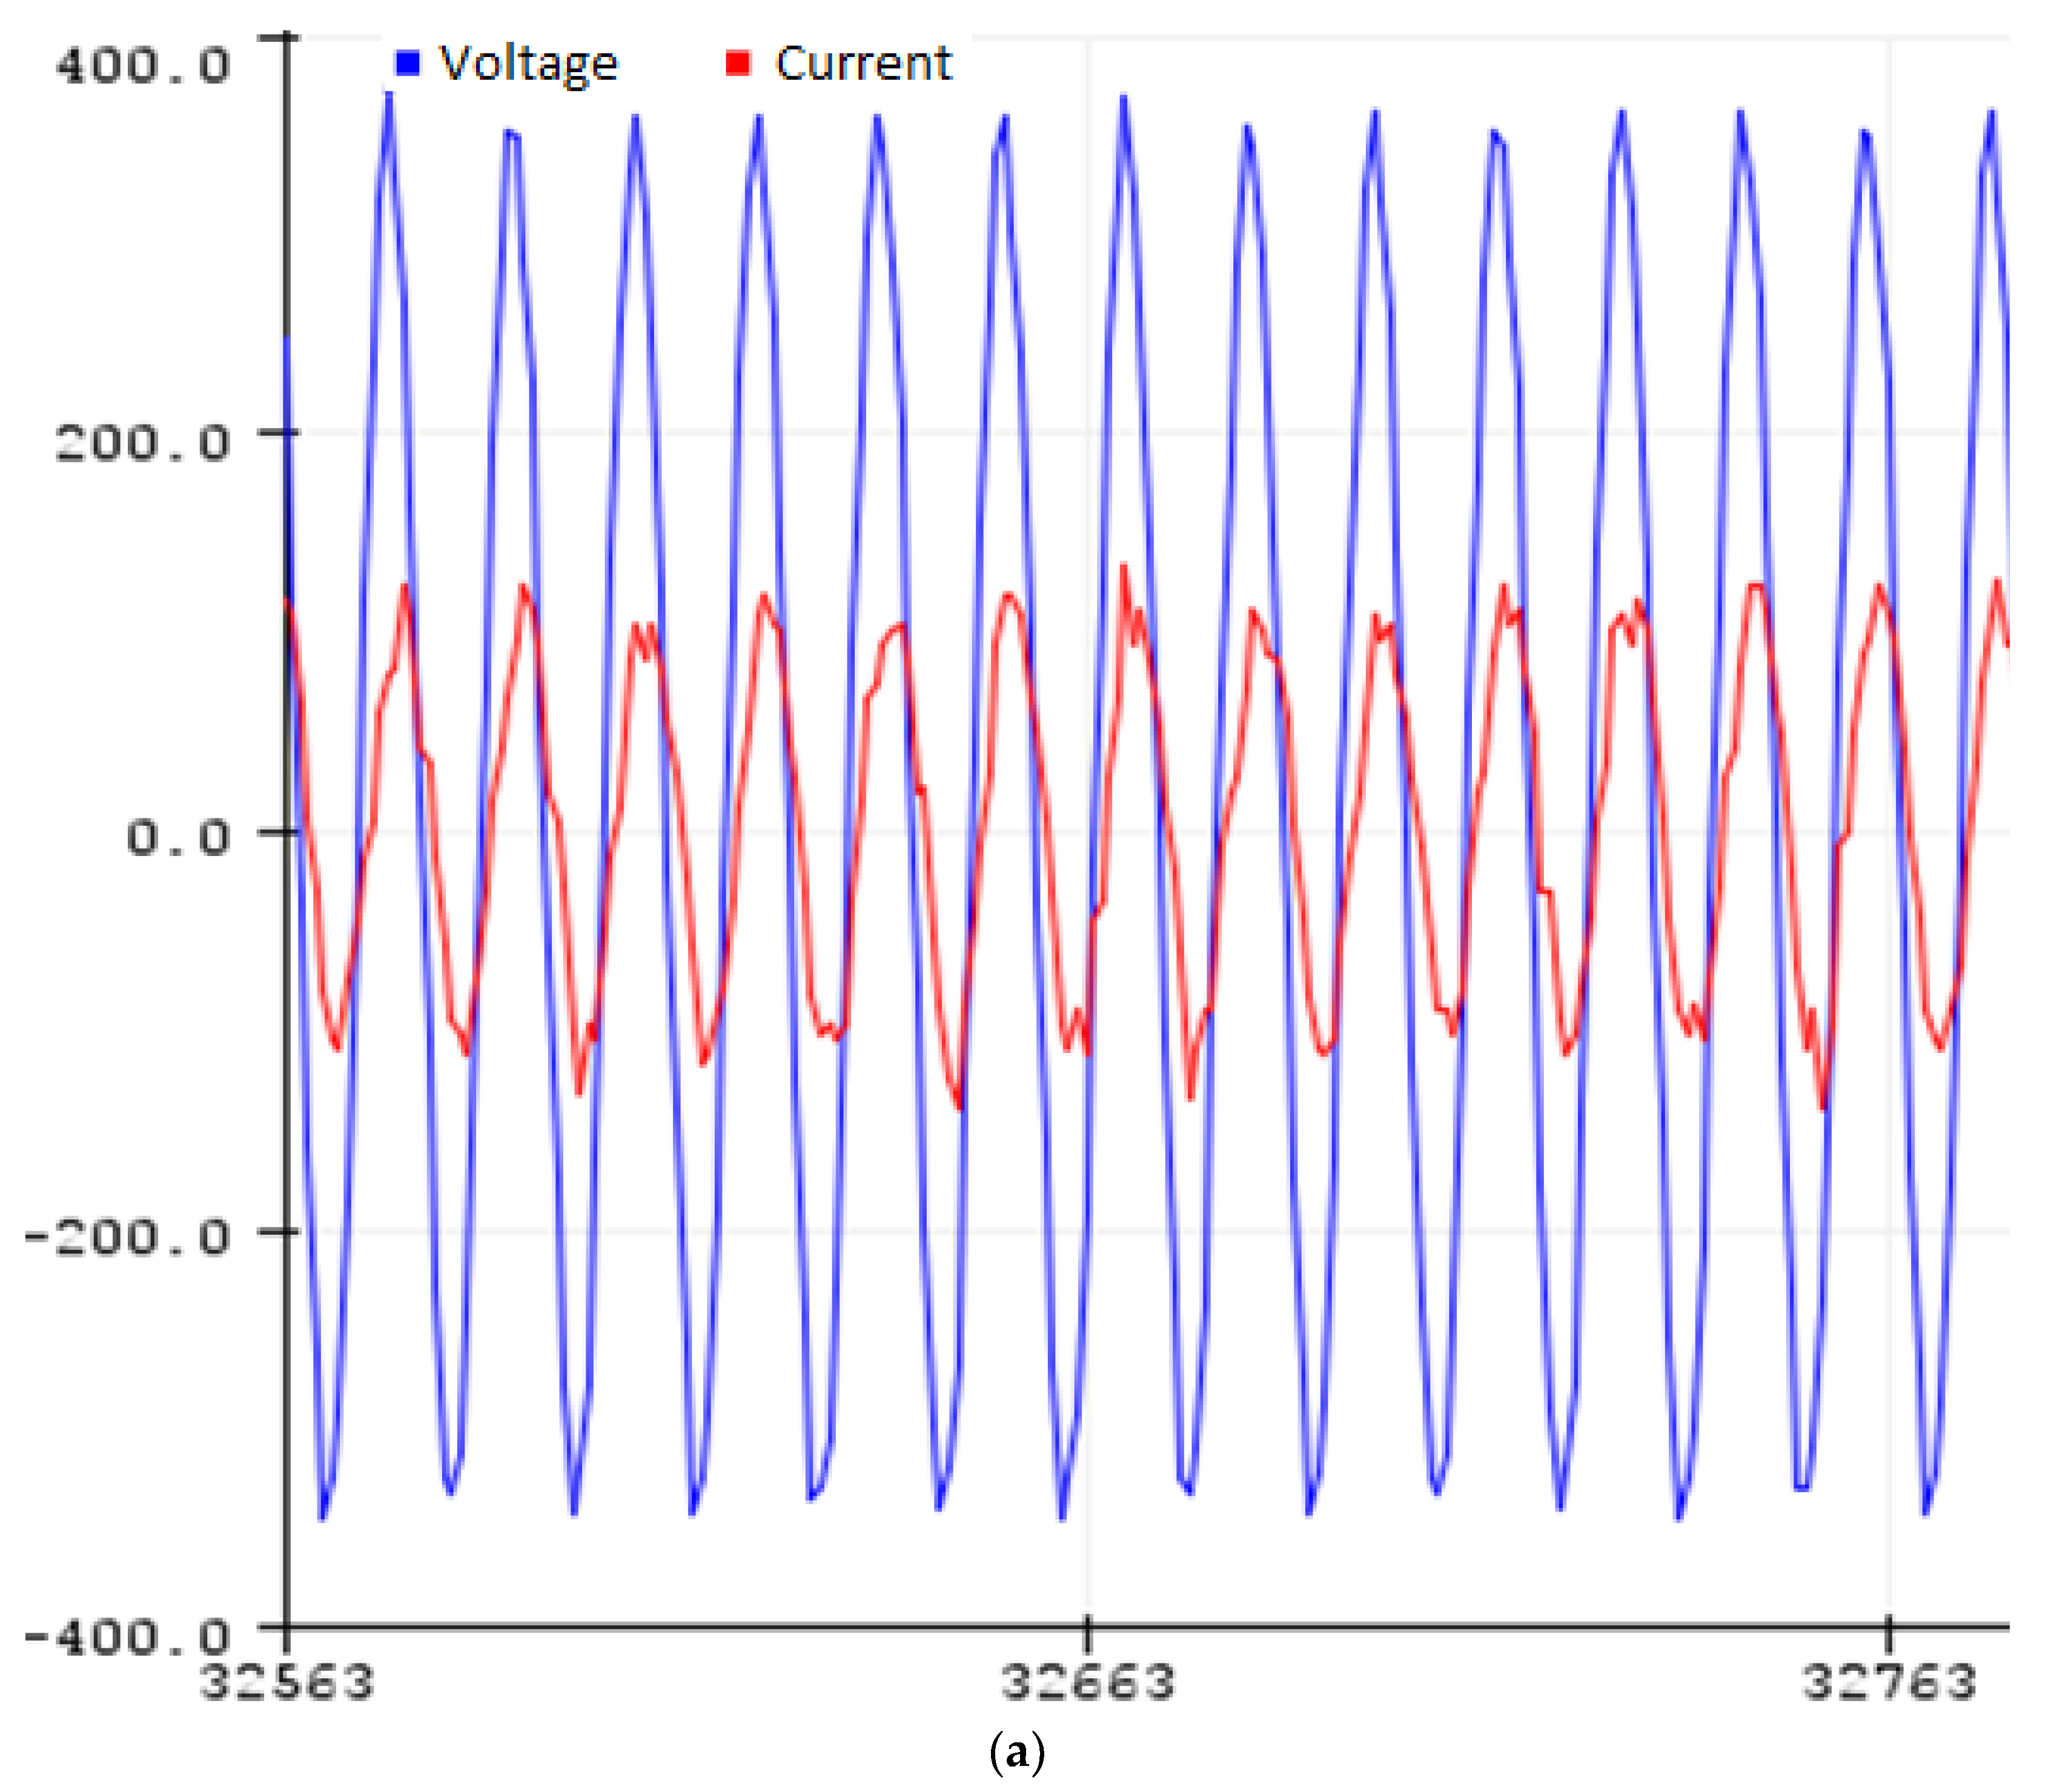
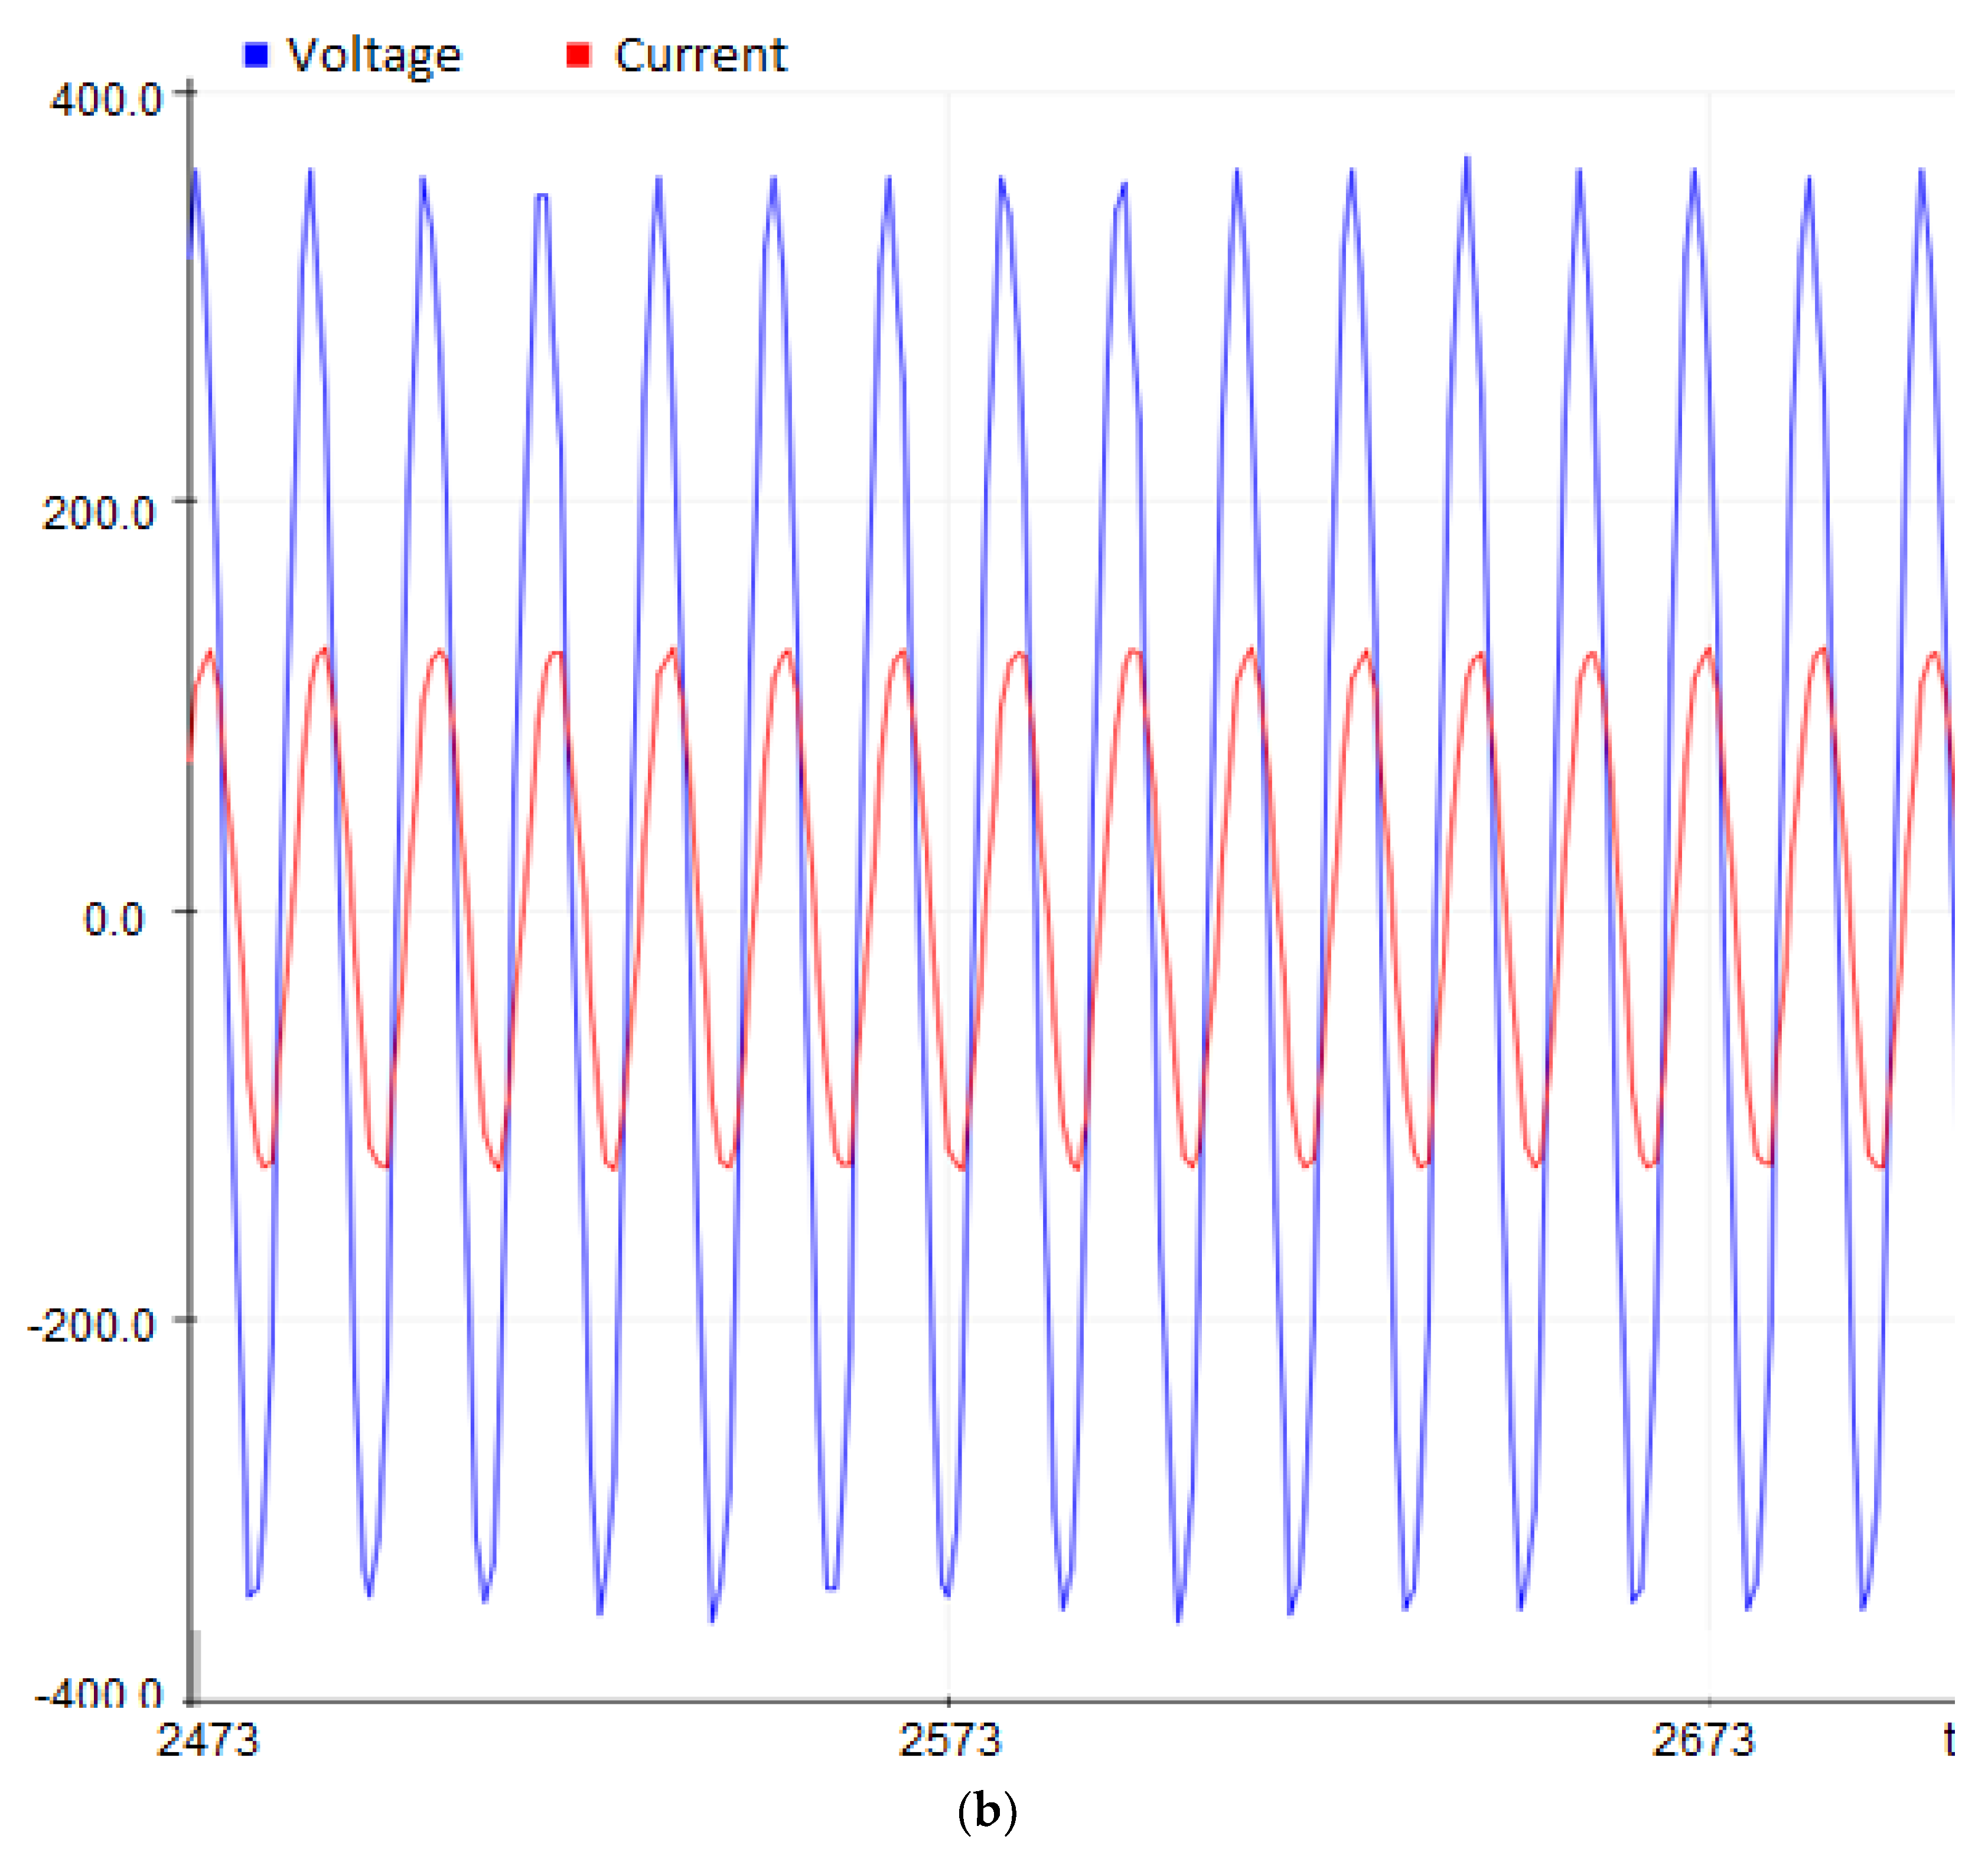
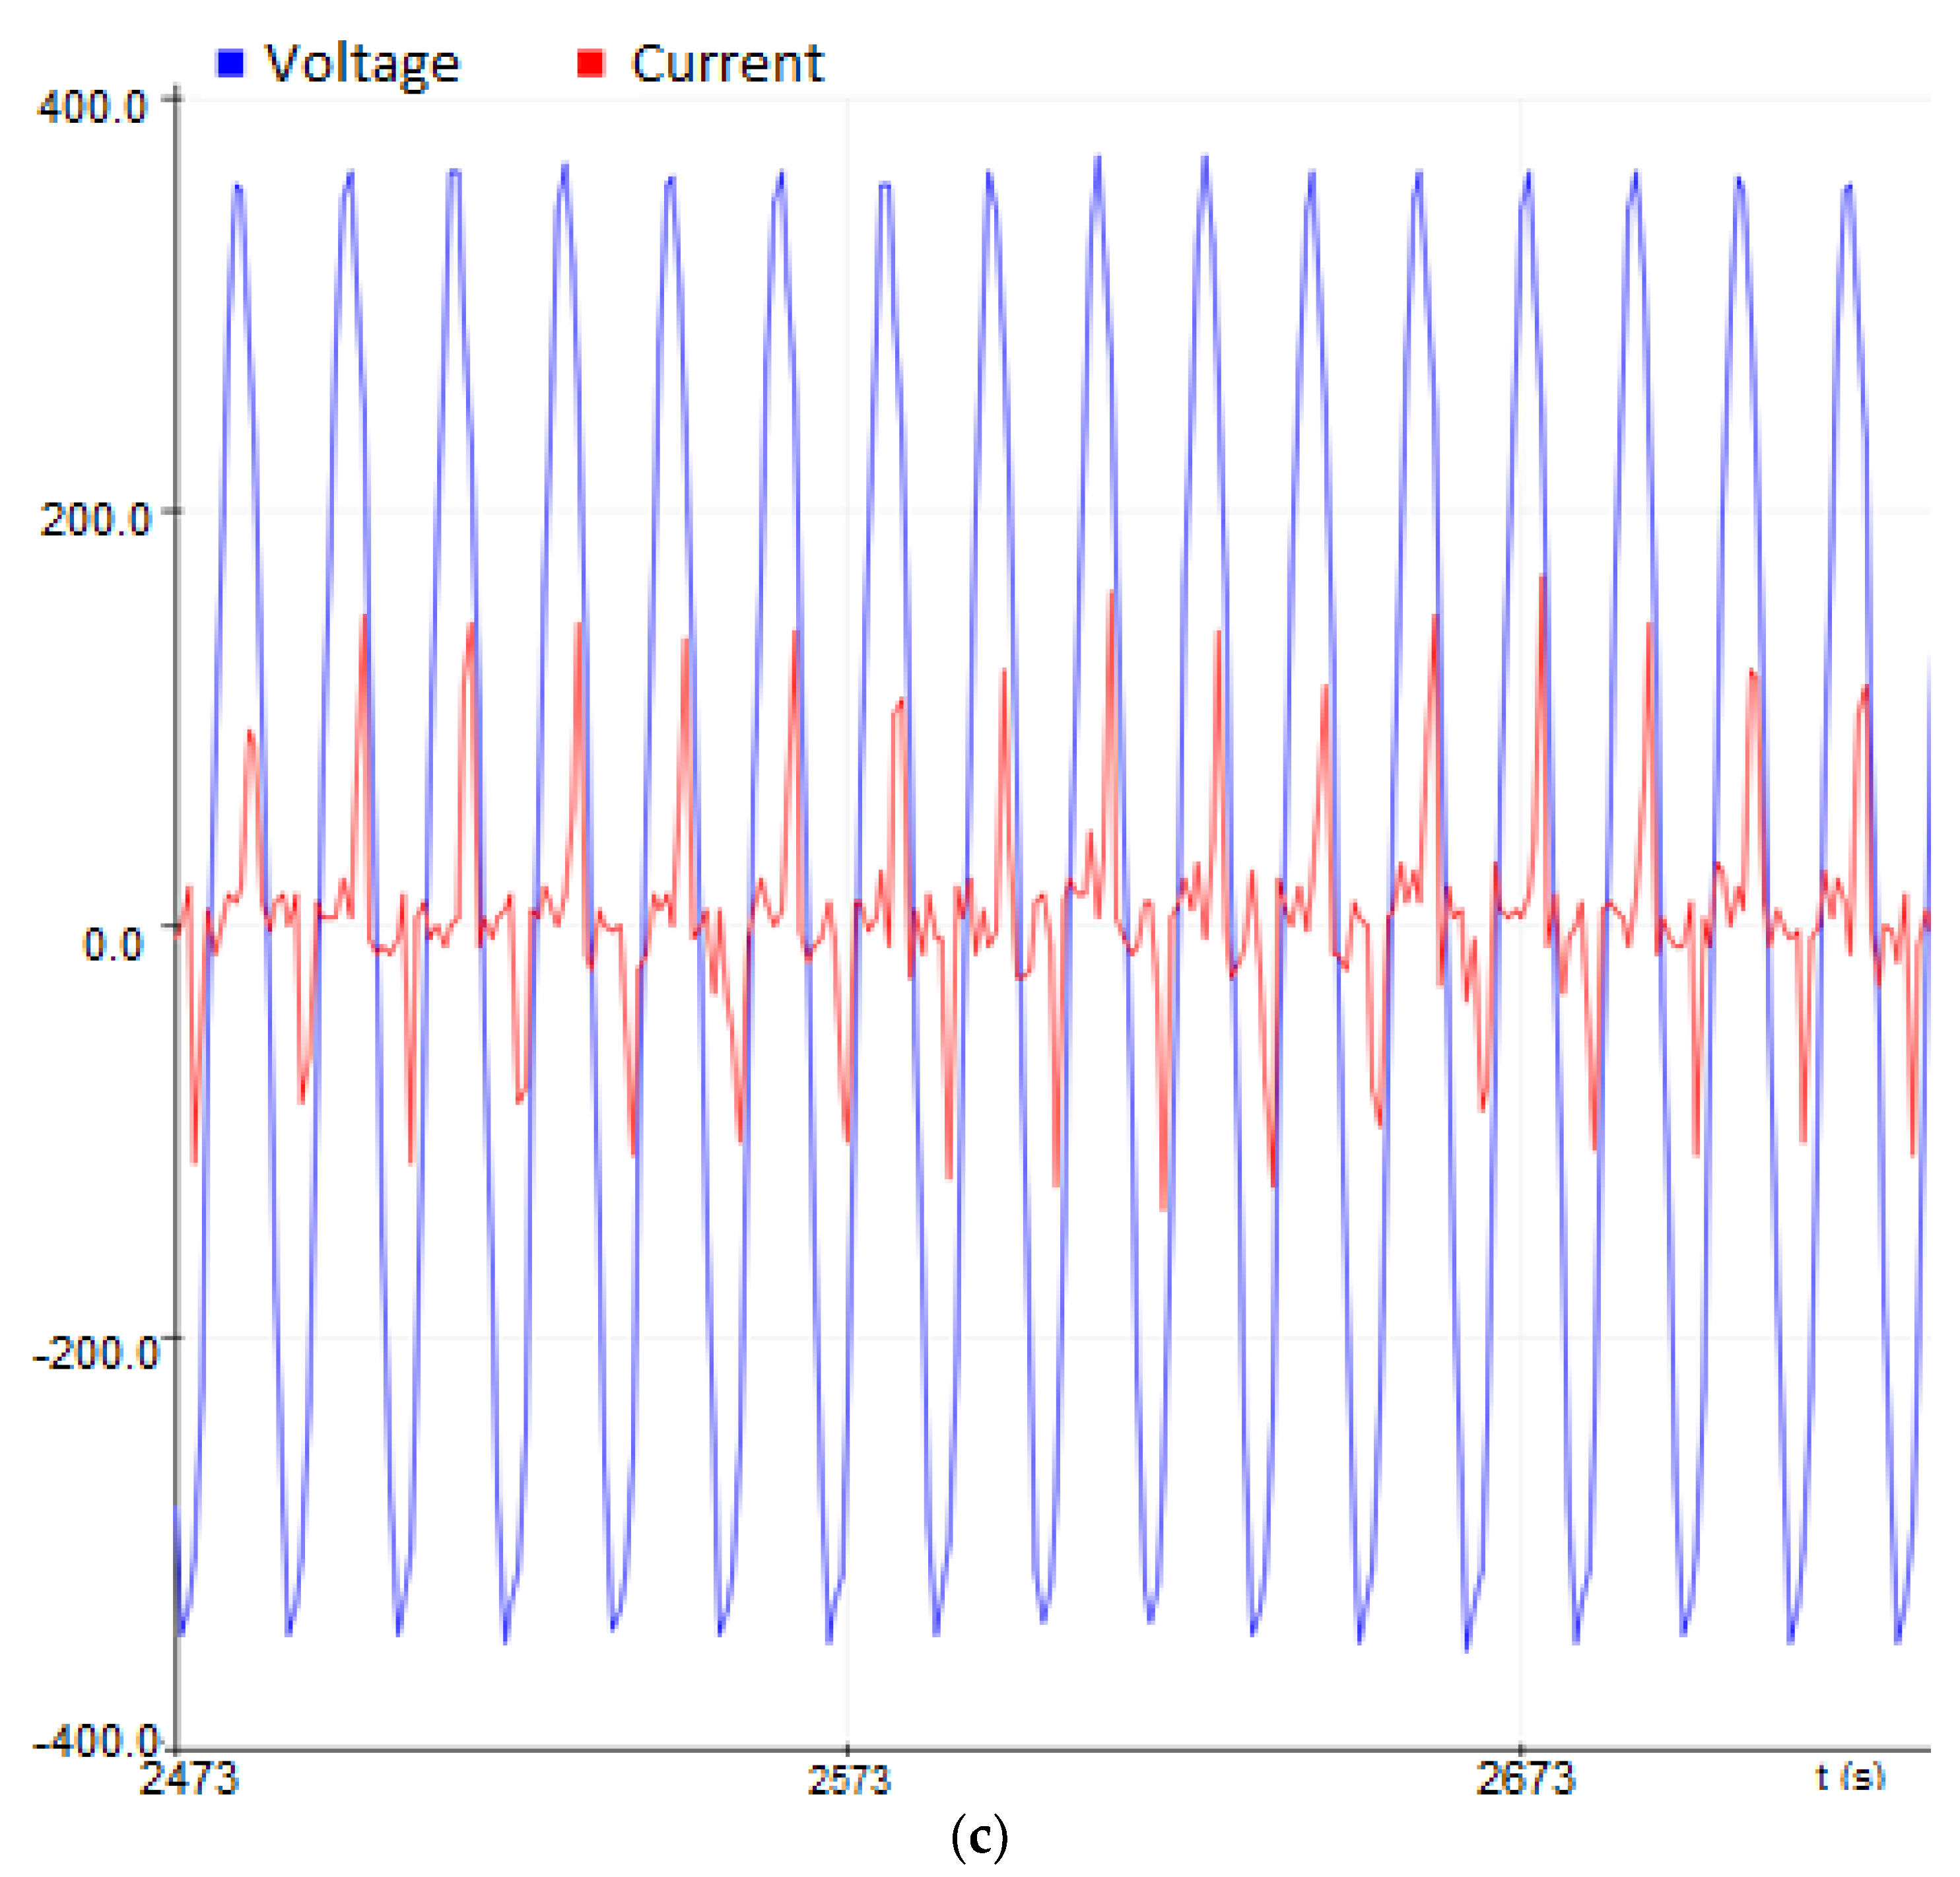
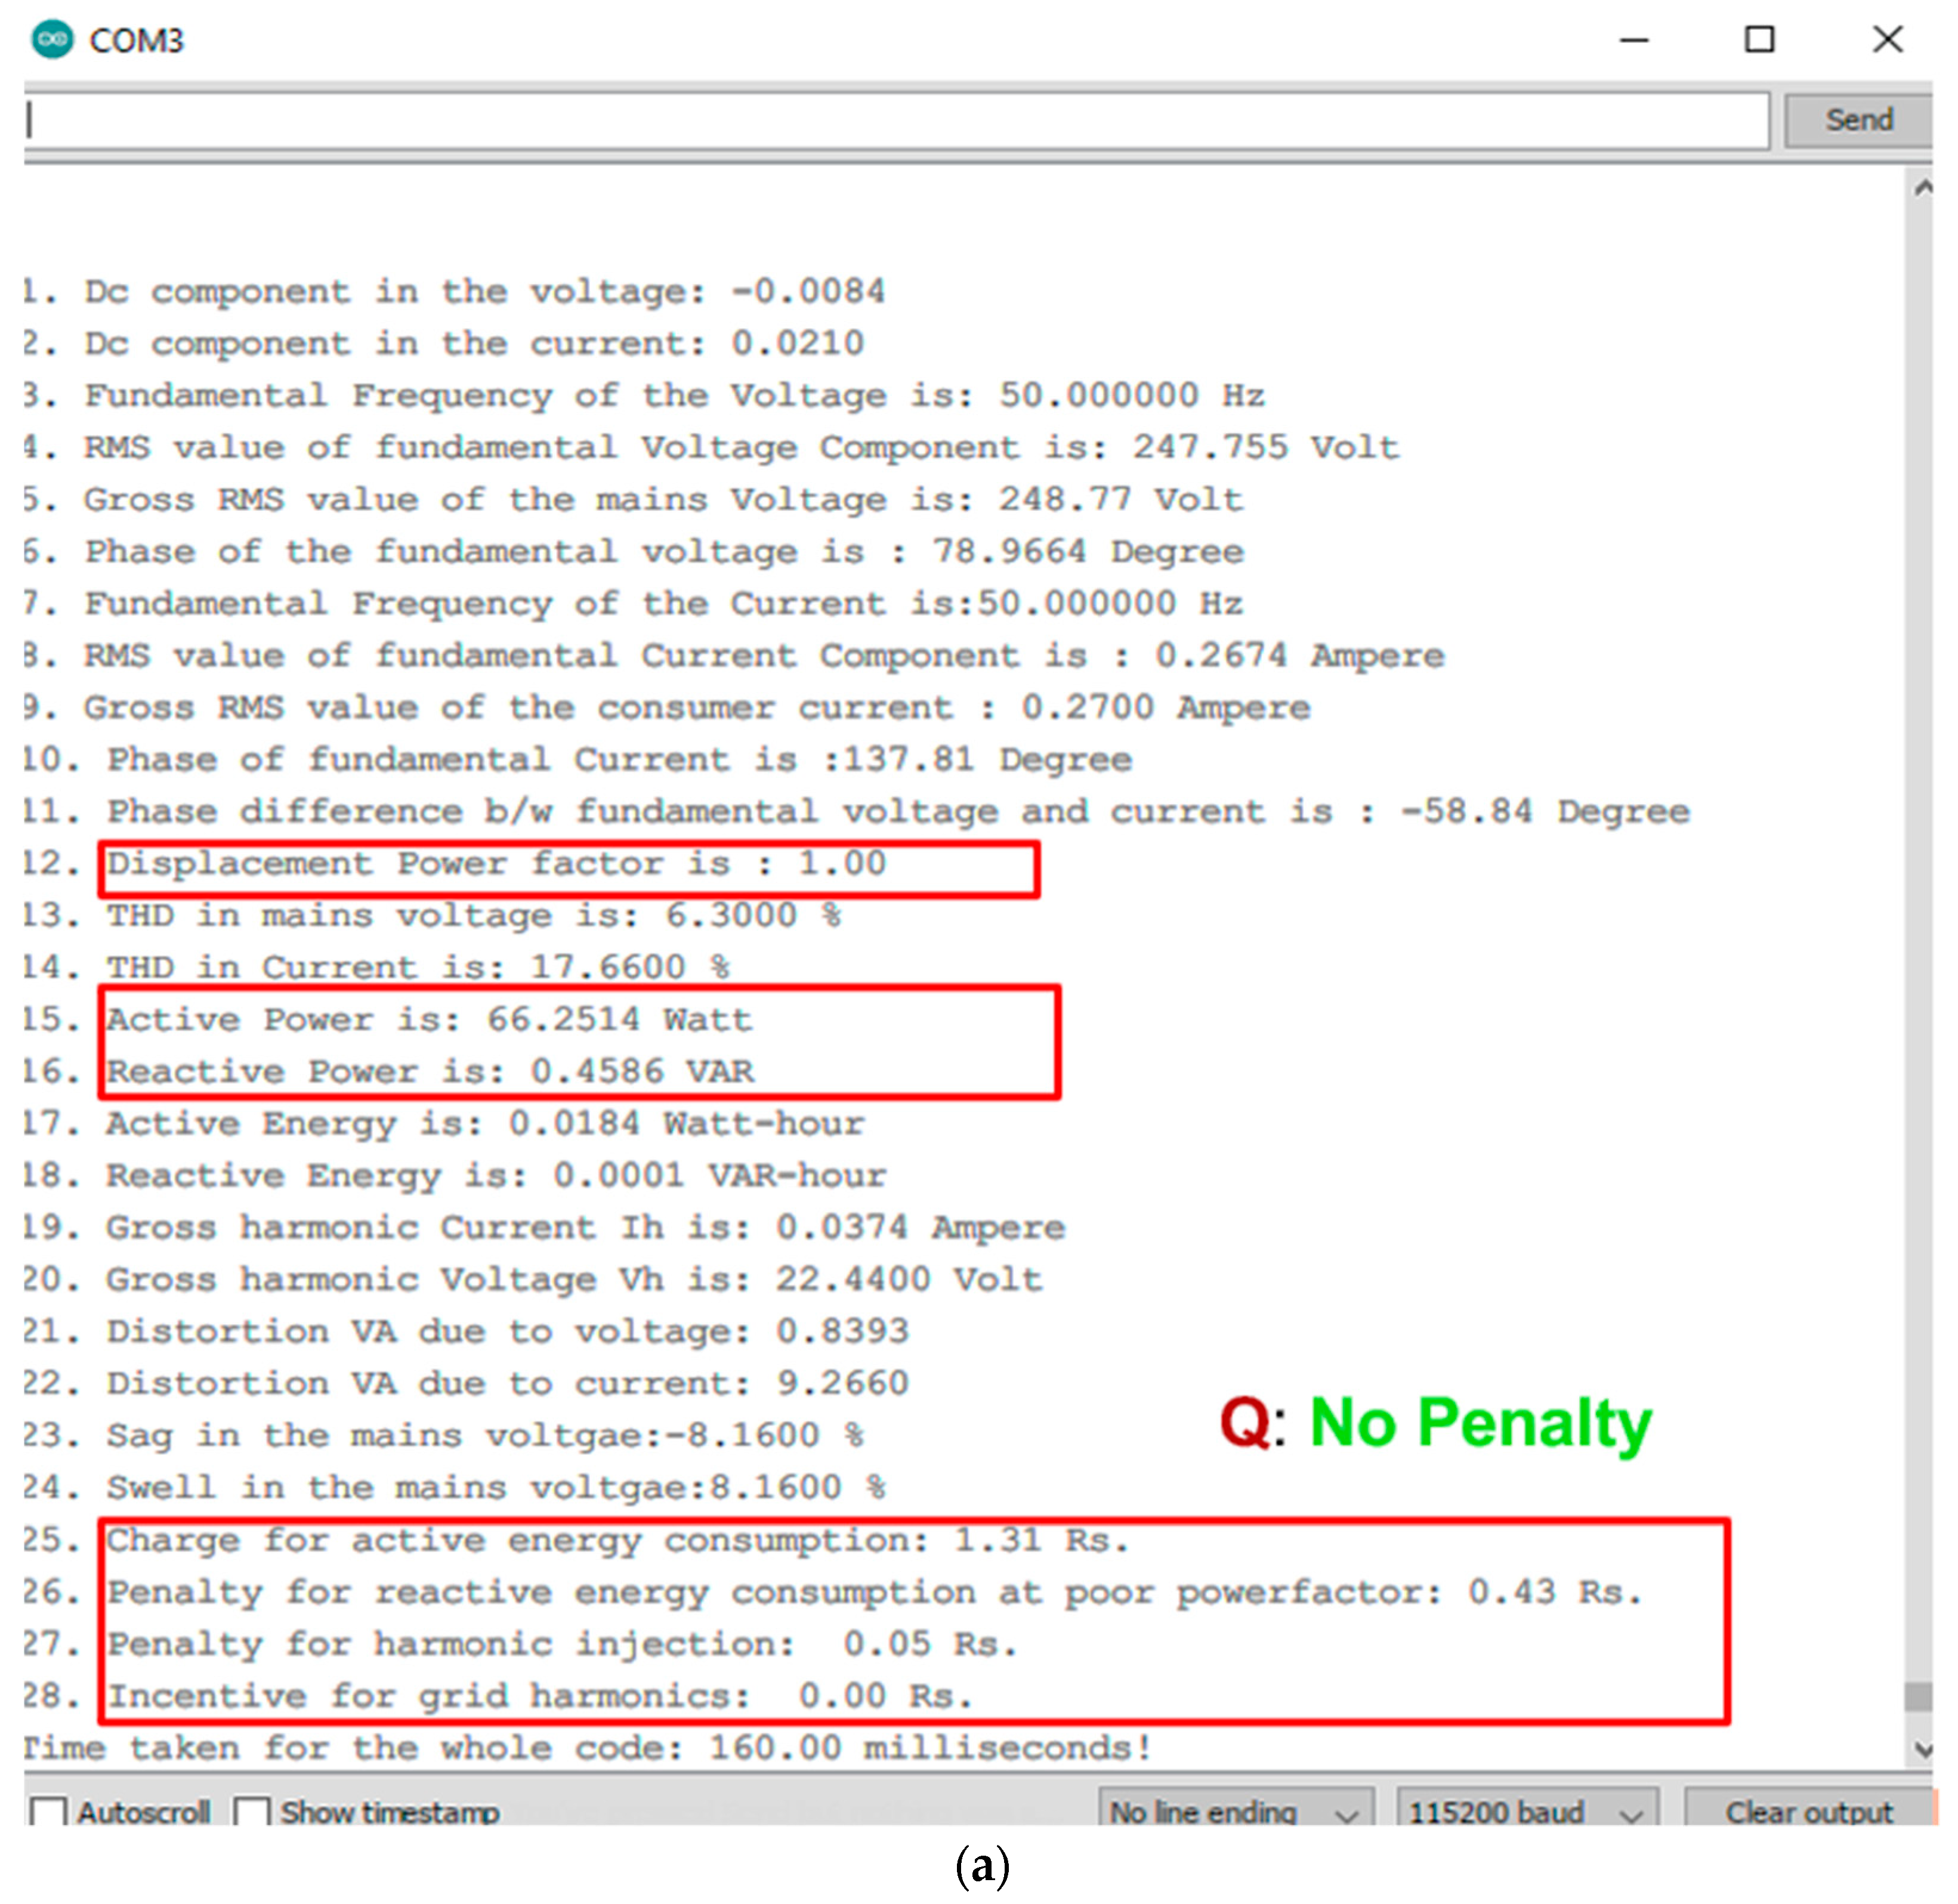
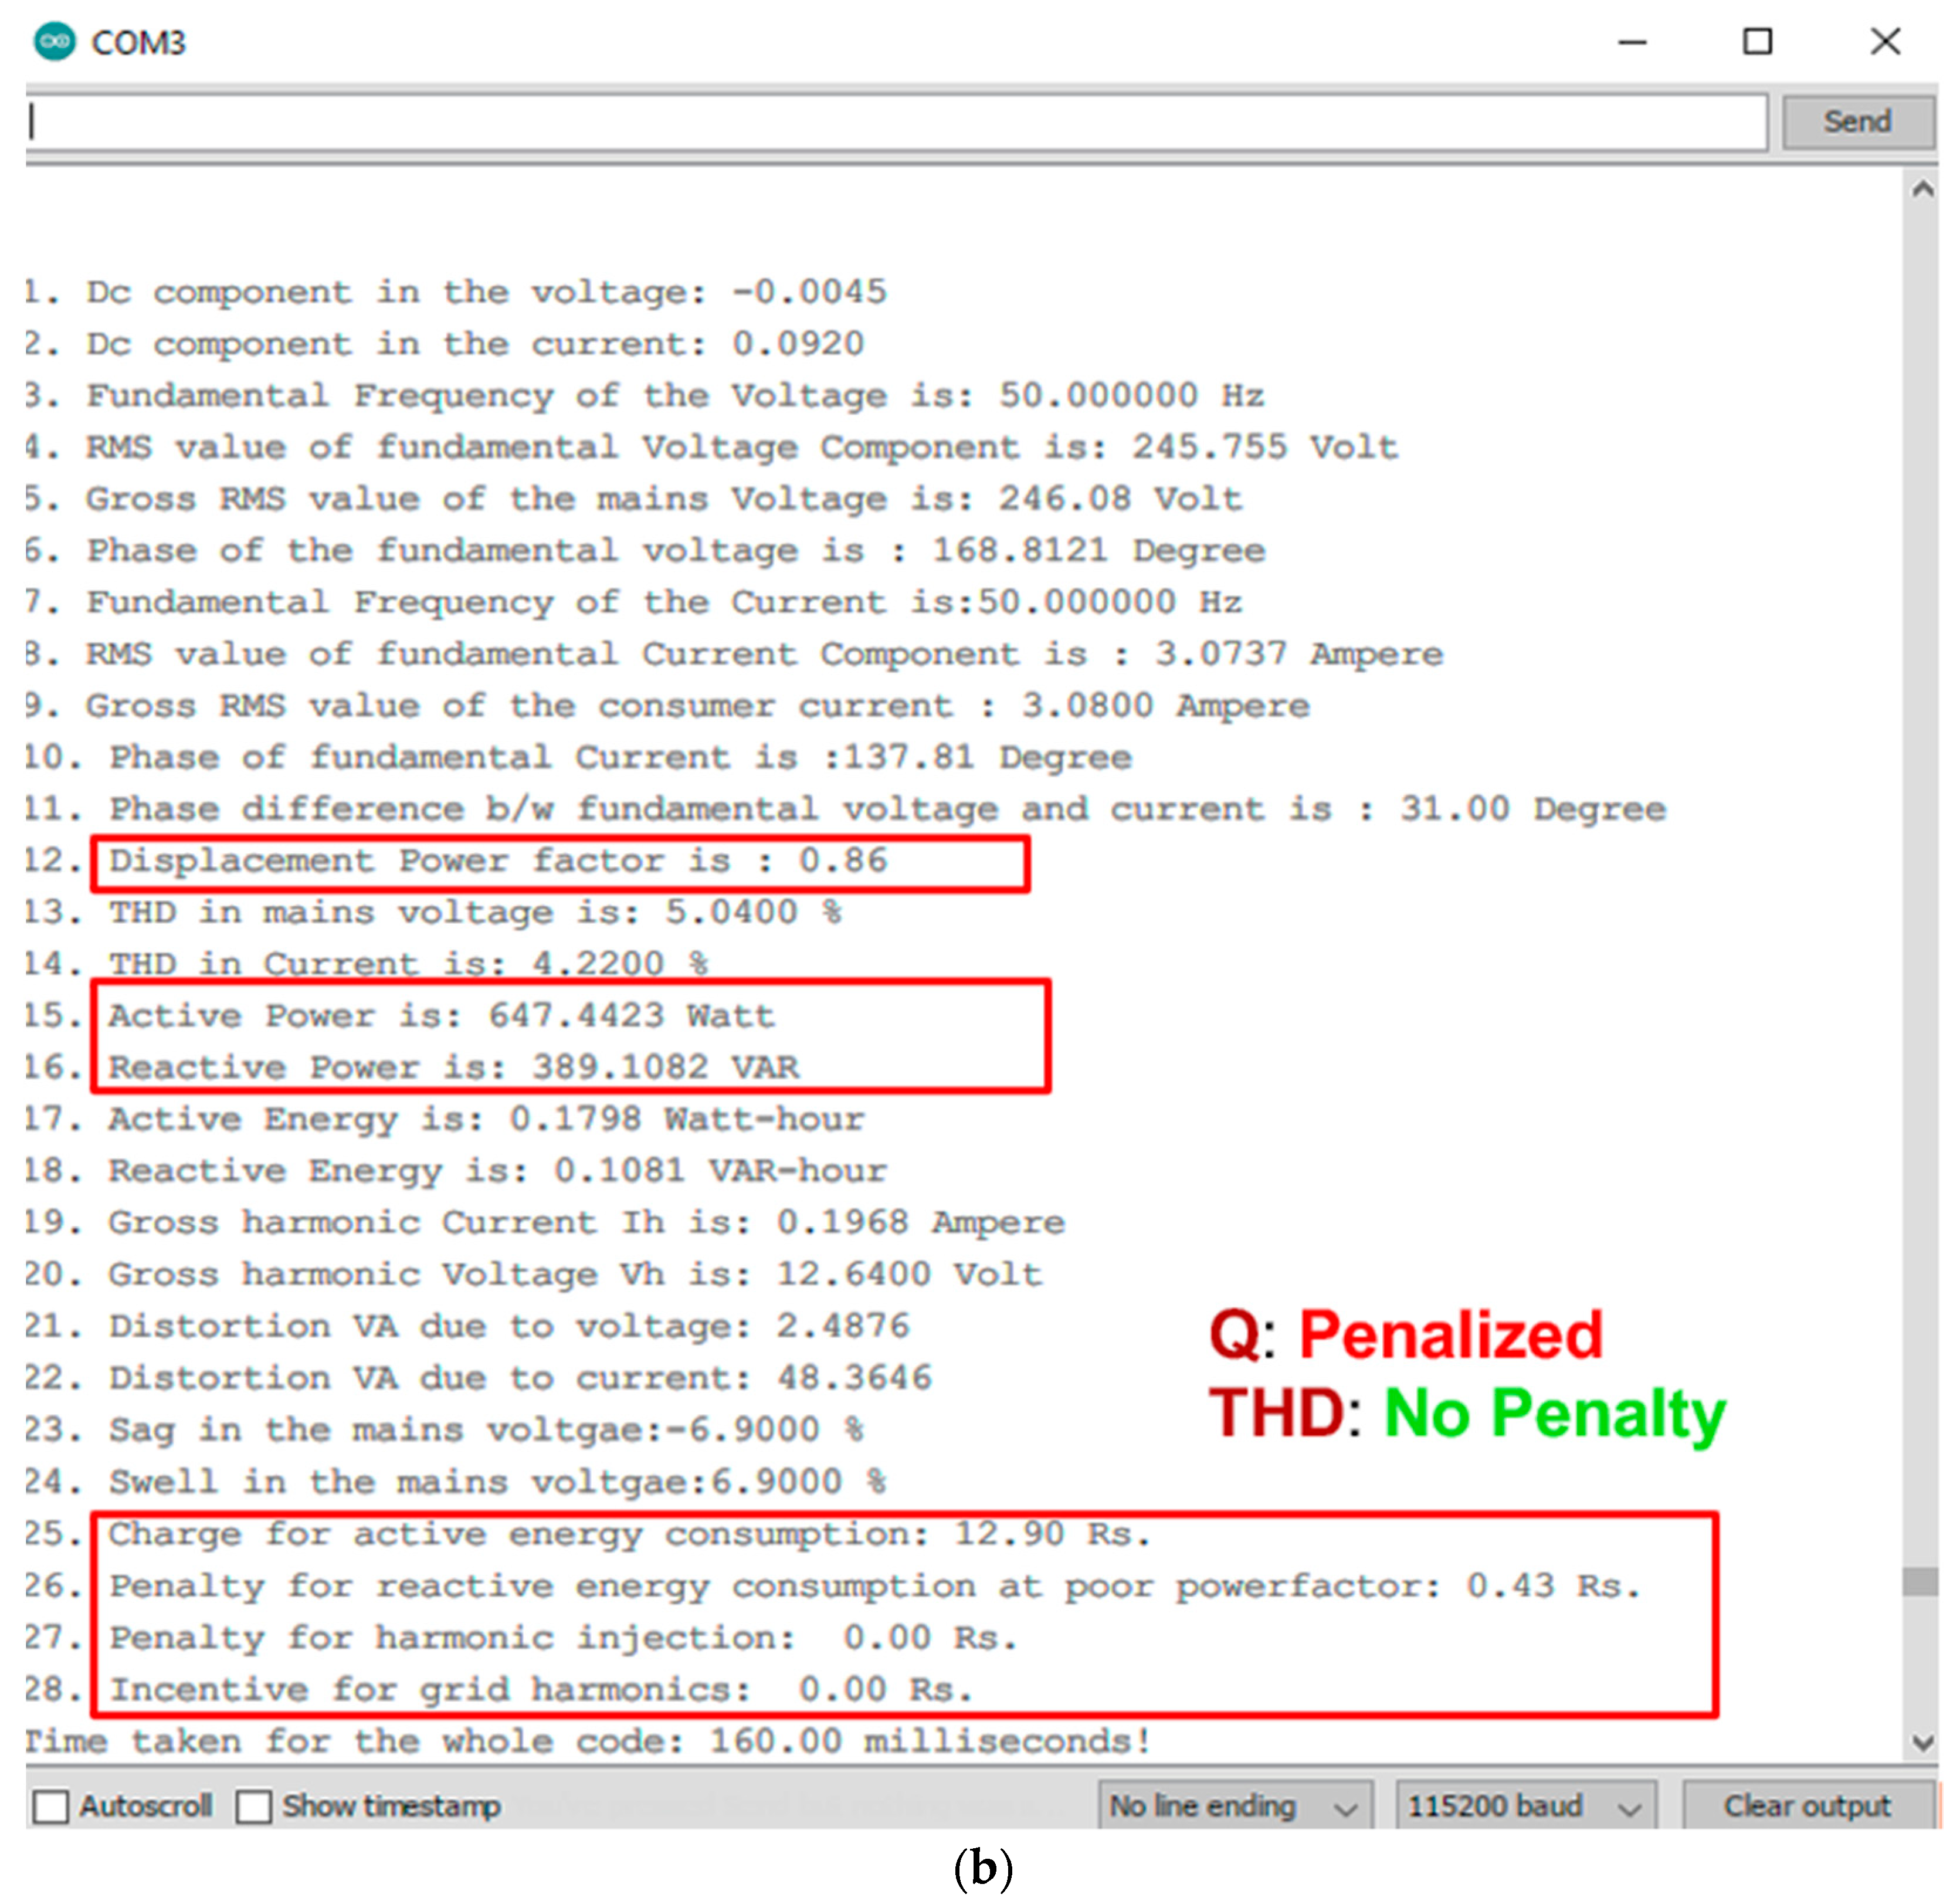
The waveforms of measured voltage and current of these loads, which were captured using a serial plotter, are shown in Figure 15. The phase relationships of the applied voltage and load current of all the loads were found to be satisfactory. These measured raw data were processed, and all 28 PQ parameters were computed as explained in Section 3 and Section 4. The parameters estimated using the smart meter were displayed on a monitor locally, as shown in Figure 16. The lamp was neither inductive nor nonlinear, and, hence, the estimated power factor was in unity and there were no additional penalties/incentives for this load. The overall computation time was around 160 ms, which indicates that the monitoring could be performed online without loss of data. The domestic iron, which was an inductive load, was penalized for its poor power factor. Since the grid voltage was sinusoidal and the load was also linear, the penalty and incentive for harmonic distortion were zero.
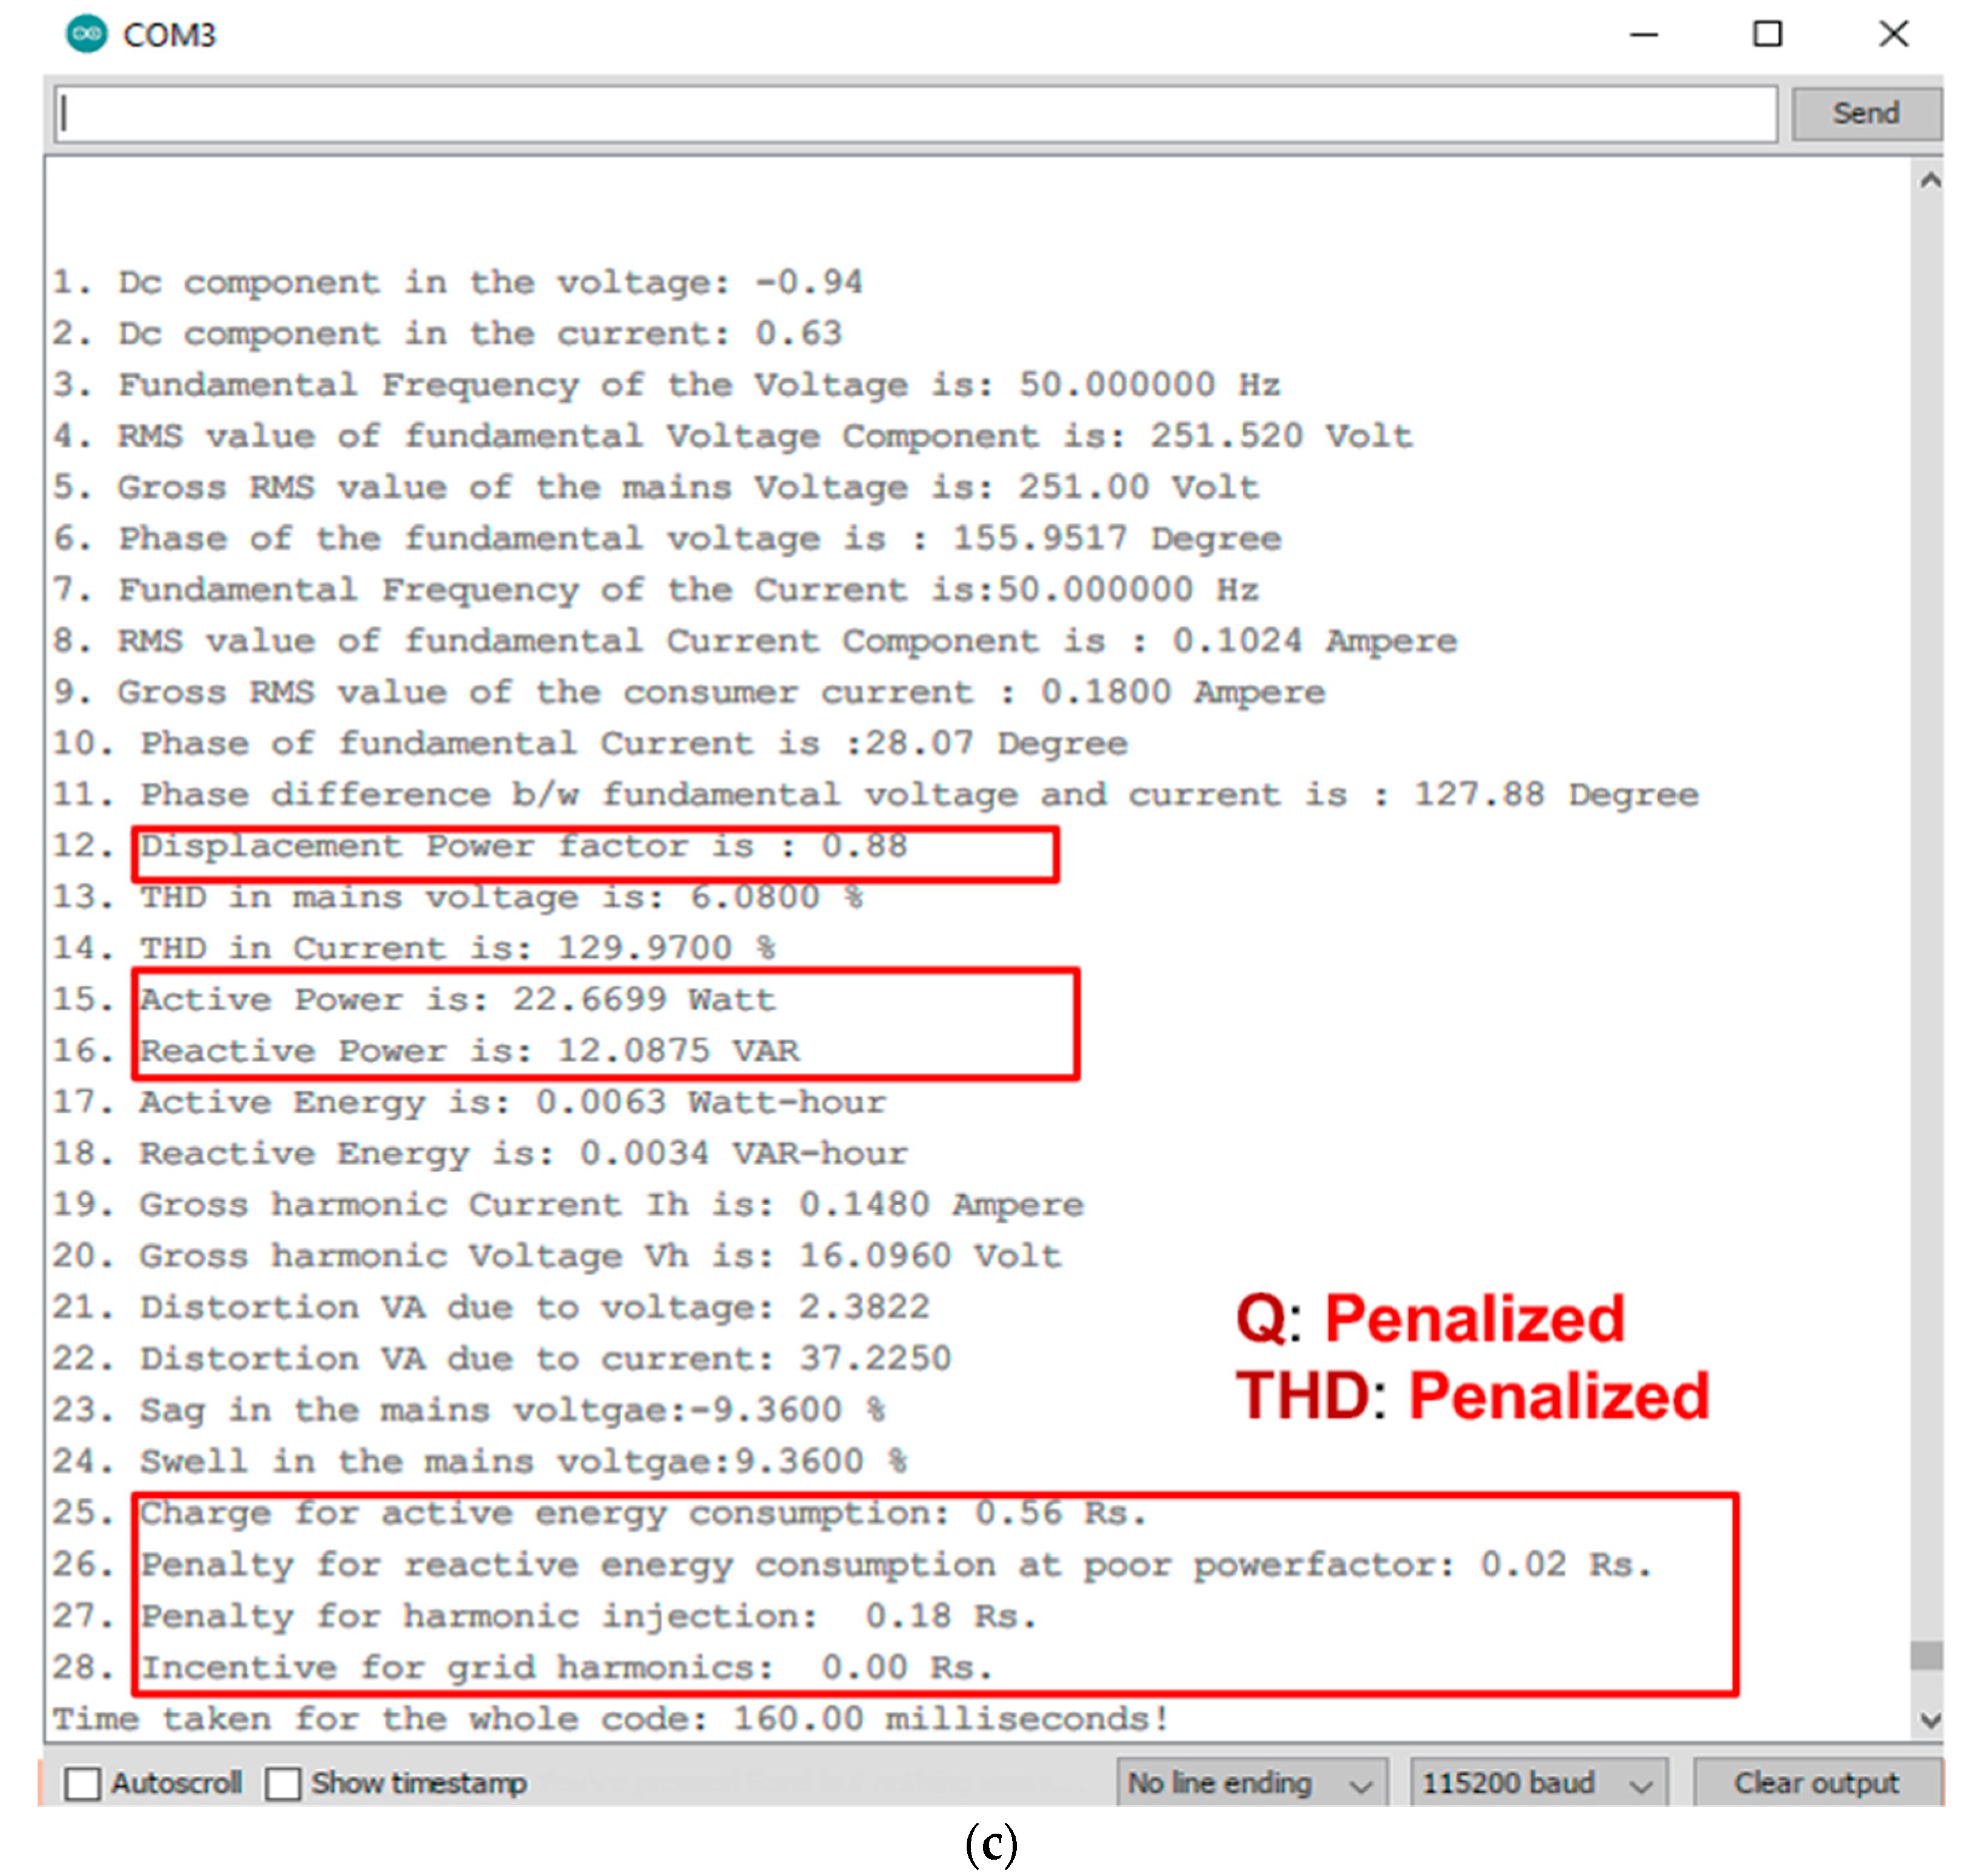
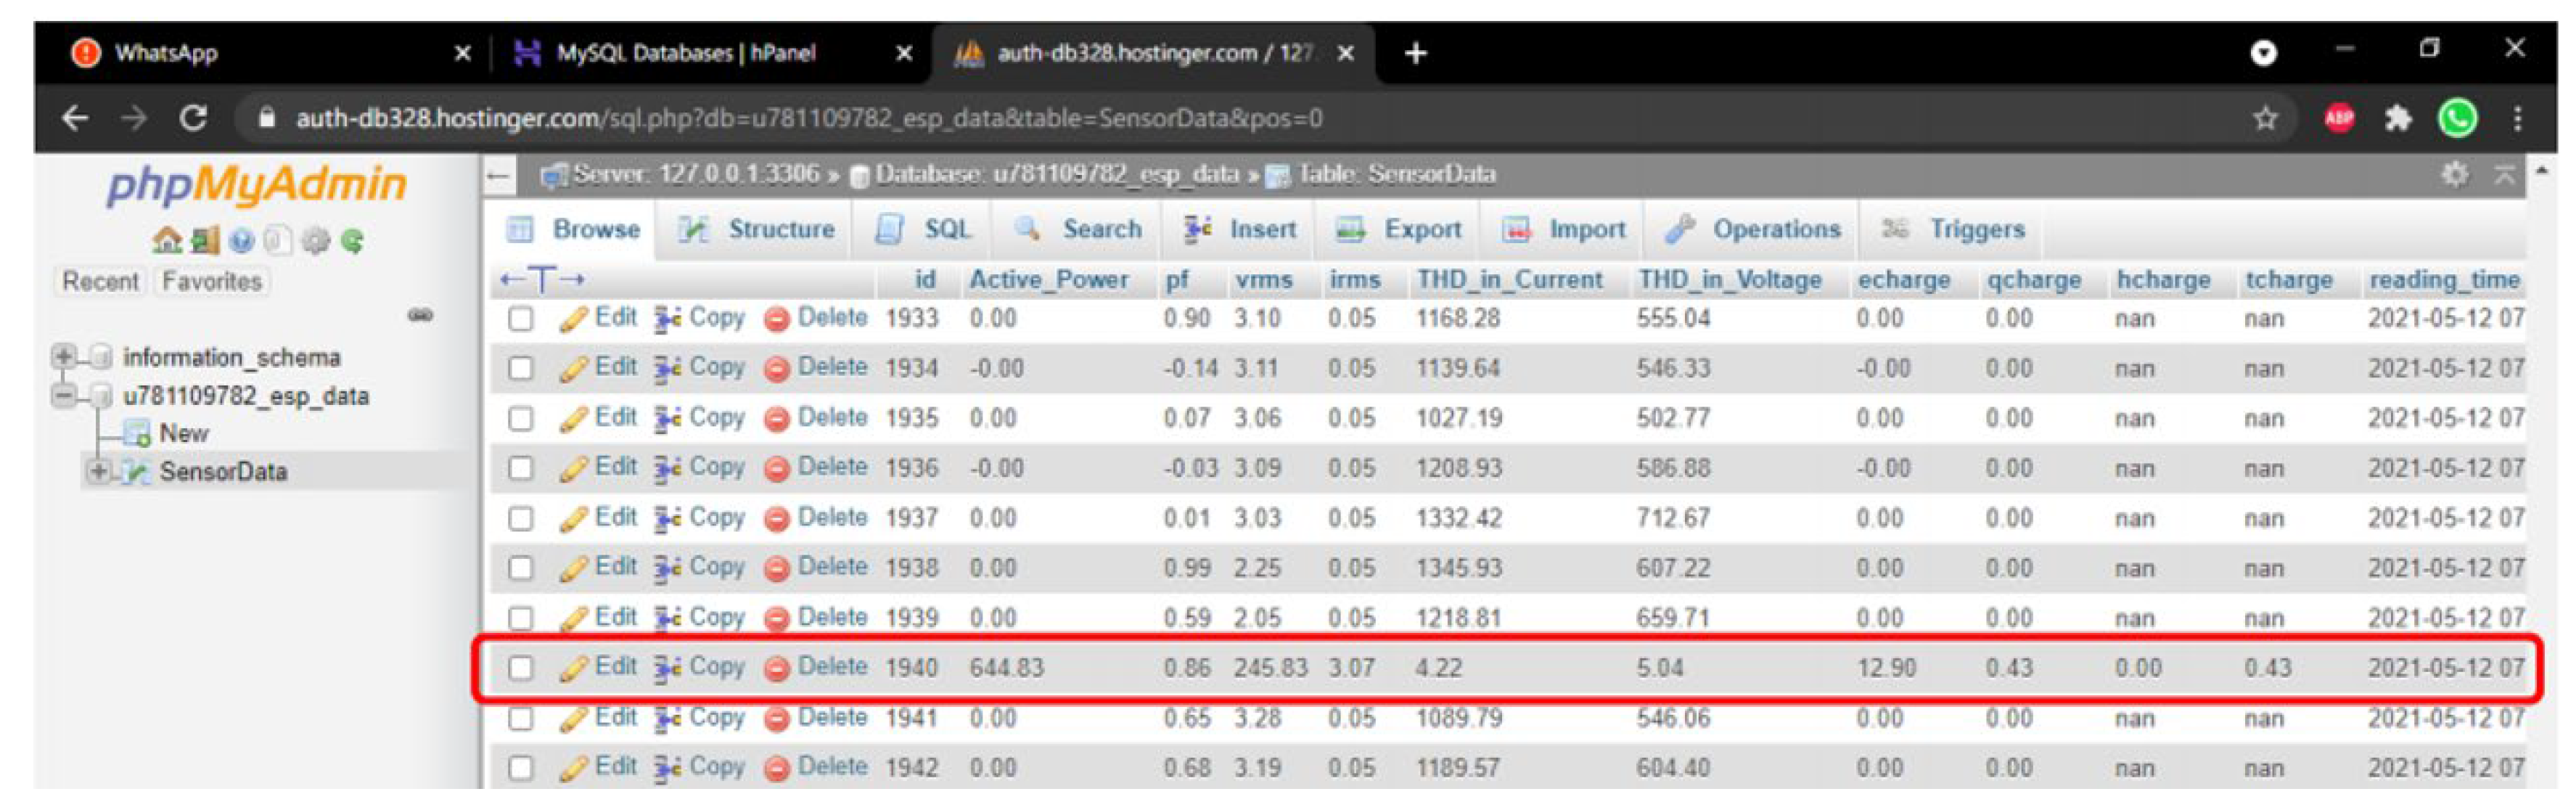
The same was evident from the results displayed in Figure 16b. The laptop charger, which was both nonlinear and had a poor input power factor, was penalized for both violations, as shown in Figure 16c. The THD of the current was estimated to be 129.76%, and there was a negligible distortion VA due to utility for all three load cases. Due to a lack of shielding, the EMI was prominent. As a result, the THD of pure sinusoidal voltage was estimated to be 3%. Therefore, the penalty was imposed if the THD was more than 8% only. As the utility voltage had an actual THD of less than 5%, the consumer received no incentive for the same. These measured and estimated parameters were uploaded to the site and visualized on the webpage, as shown in Figure 17. The results were also saved in the database with a timestamp for post-PQ analysis.
Finally, the results clearly indicated the feasibility and efficiency of the implementation of a PQ-based smart meter. It was able to measure and monitor the PQ parameters of the single-phase consumer along with the energy metering and impose a penalty/incentive to promote good PQ practices. To avoid a penalty for reactive energy consumption, the consumers can install a fixed capacitor bank for the reactive power support. Additionally, consumers can utilize energy-efficient and certified equipment only. The developed smart PQ meter also uploads data to the server to characterize the PQ profiles of both consumer and utility. Therefore, the developed PQ meter provides relevant information about the grid and user PQ profiles in real time with the help of the existing network infrastructure. This meter has a small form factor, consumes less power, around 1.5 W, and is Wi-Fi connected. In addition, the meter has cutting-edge communication technology such as a Bluetooth Low Energy (BLE) and Wi-Fi module on board, which can work in access and station modes.
The total cost of the smart meter implementation is 39 USD only and is economical compared to a commercially available smart meter, which usually costs 55–70 USD. The cost of major components is given in Table 4. This cost can be reduced further by batch production. The cost for an annual server subscription to host a website is 44 USD, which can be commonly used to monitor data from thousands of smart meters.
The proposed penalty/incentive is arrived at based on reactive and harmonic energy. Therefore, the scheme can be extended seamlessly for the three-phase consumers as well. To this end, we can adopt the “effective voltage, current, and power” concept suggested in the IEEE standard 1459 [29] to estimate the effective reactive and harmonic energies. This approach is applicable for both the balanced and unbalanced three-phase, four-wire systems. For the smart PQ meter to measure three-phase voltages and currents, all the phases should be equipped with voltage and current sensors and necessary peripheral devices for interfacing and monitoring.
6. Conclusions
This work presents a PQ-based tariff scheme for the regulation of harmonics and reactive power in an LV distribution system. Additionally, it demonstrated the implementation and merits of a smart PQ meter for the PQ-based tariff. The price coefficients of the proposed penalty/incentive scheme were arrived based on the techno-economic consequences of their PQ load profile. This meter is equipped with quality sensors and processing and wireless communication mechanisms. It is capable of estimating 28 PQ parameters from the voltage and current and even record and relay them to a remote server continuously. The results obtained from testing were satisfactory, and the PQ-based penalty assessments were realistic. It can be concluded that the developed smart PQ meter is practical and economical for installation at the supply mains of LV consumers. This continuous PQ monitoring and tariff scheme for LV consumers can help in PQ regulation and encourages the utility and consumer to improve their PQ profile. The sensitivities of penalties/incentives to variations in PF and distortion limits can be studied in the future.
Author Contributions
Conceptualization, K.T.; Data curation, M.R.B.; Funding acquisition, K.T., V.M., S.B. and M.S.T.; Investigation, M.R.B.; Methodology, M.R.B.; Project administration, V.M., S.B. and M.S.T.; Resources, K.T.; Software, M.R.B.; Supervision, K.T.; Validation, M.R.B., K.T. and V.M.; Writing—original draft, M.R.B.; Writing—review & editing, K.T., V.M., S.B. and M.S.T. All authors have read and agreed to the published version of the manuscript.
Funding
This work was supported by the SPARC project under the Ministry of Education, Government of India [SPARC/2018-2019/P921/SL].
Institutional Review Board Statement
Not applicable.
Informed Consent Statement
Not applicable.
Data Availability Statement
Not applicable.
Conflicts of Interest
The authors declare no conflict of interest.
Abbreviations
| ADC | Analog-to-digital converter |
| BLE | Bluetooth Low Energy |
| CAN | Controller area network |
| DPF | Displacement power factor |
| DPU | Dataplane processing unit |
| DSP | Digital signal processor |
| FFT | Fast Fourier transform |
| FPGA | Field programmable gate arrays |
| GPIO | General purpose input output |
| HTTP | Hypertext transfer protocol |
| I2C | Inter-integrated circuit |
| I2S | Inter-IC sound |
| ISR | Interrupt service routine |
| LV | Low voltage |
| MCU | Microcontroller |
| PCB | Printed circuit board |
| PHP | Hypertext preprocessor |
| PQ | Power quality |
| RMS | Root mean square |
| RTOS | Real-time operating system |
| SMP | Symmetrical multiprocessing |
| SPI | Serial peripheral interface |
| SQL | Structured query language |
| TCP/IP | Transmission control protocol/Internet protocol |
| THD | Total harmonic distortion |
| UART | Universal asynchronous receiver-transmitter |
References
- Nirula, A. India’s Power Distribution Sector: An Assessment of Financial and Operational Sustainability. 2019. Available online: https://think-asia.org/handle/11540/11277 (accessed on 7 July 2021).
- Abeysinghe, G. Power Quality and Reliability, Are We Satisfied? Questions EESoc, at the annual Panel Discussion. Inst. Eng. Sri Lanka News 2016, 26, 9–10. [Google Scholar]
- Seymour, J.; Horsley, T. The Seven Types of Power Problems; APC: New York, NY, USA, 2005. [Google Scholar]
- Stiles, M.; Cook, P.; Leeson, M.; Voss, L.; Jenkins, N.; Bollen, M.; Ferguson, K.; Ghassemlooy, Z.; Hartley, M.G.; Gu, I.Y.H. Book Reviews: The Virtual University: The Internet and Resource-Based Learning, Nonlinear Control Systems II, Turbo Coding, Understanding Power Quality Problems—Voltage Sags and Interruptions, Distributed Power Generation: Planning and Evaluation, Introduction to Digital Systems, Digital Mobile Communications and the TETRA System, the Correspondence of Michael Faraday, Mathematical Methods and Algorithms for Signal Processing. Int. J. Electr. Eng. Educ. 2001, 38, 84–93. [Google Scholar] [CrossRef]
- Wagner, V.; Balda, J.; Griffith, D.; McEachern, A.; Barnes, T.; Hartmann, D.; Phileggi, D.; Emannuel, A.; Horton, W.; Reid, W.; et al. Effects of harmonics on equipment. IEEE Trans. Power Deliv. 1993, 8, 672–680. [Google Scholar] [CrossRef]
- Bhattacharyya, S.; Cobben, S. Consequences of Poor Power Quality—An Overview. In Power Quality; IntechOpen, 2011; Available online: https://www.intechopen.com/chapters/14957 (accessed on 7 July 2021).
- Forum of Regulators (FOR) India Assisted by APQI. Power Quality Regulations in India [White Paper]. 2015. Available online: https://apqi.org/archives/464 (accessed on 15 August 2020).
- da Silva, R.P.B.; Quadros, R.; Shaker, H.R.; da Silva, L.C.P. Effects of mixed electronic loads on the electrical energy systems considering different loading conditions with focus on power quality and billing issues. Appl. Energy 2020, 277, 115558. [Google Scholar] [CrossRef]
- ACER European Union Agency for the Cooperation of Energy Regulatory. ACER Report on Distribution Tariff Methodologies in Europe. February 2021. Available online: https://documents.acer.europa.eu/Official_documents/Acts_of_the_Agency/Publication/ACER%20Report%20on%20D-Tariff%20Methodologies.pdf (accessed on 3 April 2021).
- Bućko, P.; Wilczyński, A. Reactive Energy Billing in Operator Tariffs in Poland. Acta Energetica 2015, 4, 4–9. [Google Scholar] [CrossRef]
- AF-Mercados, E.M.I.; Ref-E, I. Study on tariff design for distribution systems. In Tech. Rep. Prepared for: Directorate General for Energy; EU: Kathmandu, Nepal, 2015. [Google Scholar]
- Ahmad, A.; Kashif, S.A.R.; Saqib, M.A.; Ashraf, A.; Shami, U.T. Tariff for reactive energy consumption in household appliances. Energy 2019, 186, 115818. [Google Scholar] [CrossRef]
- Jay, D.; Swarup, K.S. Game theoretical approach to novel reactive power ancillary service market mechanism. IEEE Trans Power Syst. 2020, 36, 1298–1308. [Google Scholar] [CrossRef]
- Cerbantes, M.C.; Fernandez-Blanco, R.; Ortega-Vazquez, M.A.; Mantovani, J.R.S. Incorporating a Nodal Reactive Power Pricing Scheme Into the DisCo’s Short-Term Operation. IEEE Trans. Smart Grid 2018, 10, 3720–3731. [Google Scholar] [CrossRef]
- Viciana, E.; Alcayde, A.; Gil Montoya, F.; Baños, R.; Arrabal-Campos, F.M.; Zapata-Sierra, A.; Manzano-Agugliaro, F. OpenZmeter: An Efficient Low-Cost Energy Smart Meter and Power Quality Analyzer. Sustainability 2018, 10, 4038. [Google Scholar] [CrossRef] [Green Version]
- Chang, T.Y.; Wang, Y.; Sun, H.J. The Design of Smart Meter with Power Quality Monitoring. Electr. Meas. Instrum. 2012, 49, 74–77. [Google Scholar]
- Ramos, N.R.; Pereira, P.; Martins, J. Smart-meter in power quality. In Proceedings of the 2017 International Young Engineers Forum (YEF-ECE), Costa da Caparica, Portugal, 5 May 2017; Institute of Electrical and Electronics Engineers (IEEE): New York, NY, USA, 2017; pp. 42–46. [Google Scholar]
- Das, H.; Saikia, L. Ethernet based smart energy meter for power quality monitoring and enhancement. In Proceedings of the 2017 Recent Developments in Control, Automation & Power Engineering (RDCAPE), Noida, Indi, 26–27 October 2017; Institute of Electrical and Electronics Engineers (IEEE): New York, NY, USA, 2017; pp. 187–191. [Google Scholar]
- Madhu, G.M.; Vyjayanthi, C.; Modi, C.N. Design and Development of a Novel IoT based Smart Meter for Power Quality Monitoring in Smart Grid Infrastructure. In Proceedings of the TENCON 2019-2019 IEEE Region 10 Conference (TENCON), Kochi, India, 17–20 October 2019; pp. 2204–2209. [Google Scholar]
- Castello, P.; Muscas, C.; Pegoraro, P.A.; Sulis, S. Low-Cost Energy Meter with Power Quality Functionalities. In Proceedings of the 24th Imeko TC, 2020. Available online: https://www.imeko.org/publications/tc4-2020/IMEKO-TC4-2020-56.pdf (accessed on 7 July 2021).
- Medvedr, D.; Conka, Z.; Kolcun, M.; Kanalik, M.; Zbojovsky, J.; Pavlik, M. Project design of the electric power quality analyzer using an open-source platform. In Proceedings of the 2018 International IEEE Conference and Workshop in Óbuda on Electrical and Power Engineering (CANDO-EPE), Budapest, Hungary, 20–21 November 2018; pp. 000169–000172. [Google Scholar]
- Amankhan, A.; Kural, A.; Temirbek, I.; Abukhan, A.; Mukashov, D.; Azamat, A.; Kudaibergenov, K.; Bagheri, M. Multi-functional Smart Electricity Metering System. In Proceedings of the 2019 IEEE International Conference on Environment and Electrical Engineering and 2019 IEEE Industrial and Commercial Power Systems Europe (EEEIC/I&CPS Europe), Genova, Italy, 11–14 June 2019; pp. 1–6. [Google Scholar]
- Xavier, M.V.E.; Boaventura, W.D.C.; Noronha, M.D. High performance power quality monitoring system. In Proceedings of the 2016 17th International Conference on Harmonics and Quality of Power (ICHQP), Belo Horizonte, Brazil, 16–19 October 2016; pp. 974–979. [Google Scholar]
- Arenas, L.D.O.; Melo, G.D.A.E.; Canesin, C.A. A Methodology for Power Quantities Calculation Applied to an FPGA-Based Smart-Energy Meter. IEEE Trans. Instrum. Meas. 2021, 70, 1–11. [Google Scholar] [CrossRef]
- Lee, D.; Hess, D.J. Data privacy and residential smart meters: Comparative analysis and harmonization potential. Util. Policy 2021, 70, 101188. [Google Scholar] [CrossRef]
- Buchmann, M. Governance of data and information management in smart distribution grids: Increase efficiency by balancing coordination and competition. Util. Policy 2017, 44, 63–72. [Google Scholar] [CrossRef]
- IEEE Std 3001.2. IEEE Recommended Practice for Evaluating the Electrical Service Requirements of Industrial and Commercial Power Systems; IEEE: New York, NY, USA, 2017; pp. 1–76. [Google Scholar] [CrossRef]
- Mohkami, H.; Hooshmand, R.; Khodabakhshian, A. Fuzzy optimal placement of capacitors in the presence of non-linear loads in unbalanced distribution networks using BF-PSO algorithm. Appl. Soft Comput. 2011, 11, 3634–3642. [Google Scholar] [CrossRef]
- IEEE Std 1459. IEEE Standard Definitions for the Measurement of Electric Power Quantities Under Sinusoidal, Nonsinusoidal, Balanced, or Unbalanced Conditions; IEEE: New York, NY, USA, 2010; pp. 1–50. [Google Scholar] [CrossRef] [Green Version]
Figure 1.
Flowchart of the proposed incentive/penalty scheme.

Figure 2.
Stand-alone smart PQ meter.

Figure 3.
PCB schematic of the proposed smart PQ meter.

Figure 4.
Timing diagram of the tasks for both cores.

Figure 5.
Task execution loops for both cores.

Figure 6.
Data flow and communication between the smart meter and remote server.

Figure 7.
Interrupt generation.

Figure 8.
Spectrum of the test signal.

Figure 9.
Spectra of current by the smart meter, (a) magnitude and (b) phase spectrum.

Figure 10.
Display of 28 PQ parameters.

Figure 11.
Data communication from the smart meter.

Figure 12.
Waveform captured for electric iron box load.

Figure 13.
Hardware setup to test true RMS measurement capability.

Figure 14.
Hardware setups with three different loads: an (a) incandescent lamp, (b) electric iron box, and (c) laptop charger.
Figure 14.
Hardware setups with three different loads: an (a) incandescent lamp, (b) electric iron box, and (c) laptop charger.

Figure 15.
Voltage and current of three different loads: an (a) incandescent lamp, (b) electric iron box, and (c) laptop charger.
Figure 15.
Voltage and current of three different loads: an (a) incandescent lamp, (b) electric iron box, and (c) laptop charger.


Figure 16.
Measurements and penalties of three different loads: an (a) incandescent lamp, (b) electric iron box, and (c) laptop charger.
Figure 16.
Measurements and penalties of three different loads: an (a) incandescent lamp, (b) electric iron box, and (c) laptop charger.


Figure 17.
The SQL database and visualization on the website.


Table 1.
Feature comparison with existing smart PQ meters.
| Features | Proposed Meter | Flukso | Open Energy Monitor | Open Power Quality | Wibee | Geo Minim | Sense Energy Monitor |
|---|---|---|---|---|---|---|---|
| Active Energy | Yes | Yes | Yes | No | Yes | Yes | Yes |
| Reactive Energy | Yes | No | No | No | No | No | No |
| Active Power | Yes | Yes | Yes | No | Yes | Yes | Yes |
| Reactive Power | Yes | No | No | No | No | No | No |
| Frequency | Yes | No | No | Yes | No | No | No |
| RMS Voltage | Yes | No | No | Yes | Yes | No | No |
| RMS Current | Yes | No | No | No | Yes | No | No |
| FFT | Yes | No | No | Yes | No | No | No |
| THD | Yes | No | No | Yes | No | No | No |
| Voltage Events | Yes | No | No | No | No | No | No |
| IEC-62053-2-Compliant Accuracy | Yes | No | No | No | No | No | No |
Table 2.
RMS measurement of the smart PQ meter.
| Sr. No. | Knob Position | DMM Reading | PQ Meter Reading | Error (%) |
|---|---|---|---|---|
| 1 | 1 | 86.5 | 85.46 | 1.2023 |
| 2 | 2 | 150.3 | 149.32 | 0.6520 |
| 3 | 3 | 187.9 | 187.65 | 0.1330 |
| 4 | 4 | 207.2 | 207.28 | 0.0386 |
| 5 | 5 | 247.6 | 245.26 | 0.9450 |
Table 3.
Penalties for different loads.
| Case | Load Type | Fixed Cost (USD) | Reactive Energy Penalty (USD) | Consumer Harmonic Penalty (USD) | Grid Harmonic Incentive (USD) |
|---|---|---|---|---|---|
| Case 1 | 100 W, upf, linear | 0.0011 | 0 | 0 | 0 |
| Case 2 | 750 W, 0.8 pf lag, linear | 0.0011 | 0.0077 | 0 | 0 |
| Case 3 | 1150 W, 0.8 pf lag, non-linear with 1.5 A of 3rd harmonic | 0.0011 | 0.012 | 0.005 | 0 |
| Case 4 | 1150 W, 0.9 pf lag, 1.5 A of 3rd harmonic and 6% voltage harmonic | 0.0011 | 0 | 0.005 | 0.00023 |
Table 4.
Cost of implementation.
| Component | Part Number | Price (USD) |
|---|---|---|
| Processor | ESP-32 | 6.85 |
| Current Sensor | TLI-4970 | 21.91 |
| Voltage Sensor | ZMPT-101B | 2.71 |
| ADC | MCP3008 | 6.16 |
| Perforated PCB Board | Generic | 1.37 |
Publisher’s Note: MDPI stays neutral with regard to jurisdictional claims in published maps and institutional affiliations. |
© 2021 by the authors. Licensee MDPI, Basel, Switzerland. This article is an open access article distributed under the terms and conditions of the Creative Commons Attribution (CC BY) license (https://creativecommons.org/licenses/by/4.0/).
Share and Cite
MDPI and ACS Style
Balwani, M.R.; Thirumala, K.; Mohan, V.; Bu, S.; Thomas, M.S. Development of a Smart Meter for Power Quality-Based Tariff Implementation in a Smart Grid. Energies 2021, 14, 6171. https://doi.org/10.3390/en14196171
AMA Style
Balwani MR, Thirumala K, Mohan V, Bu S, Thomas MS. Development of a Smart Meter for Power Quality-Based Tariff Implementation in a Smart Grid. Energies. 2021; 14(19):6171. https://doi.org/10.3390/en14196171
Chicago/Turabian StyleBalwani, Mayurkumar Rajkumar, Karthik Thirumala, Vivek Mohan, Siqi Bu, and Mini Shaji Thomas. 2021. "Development of a Smart Meter for Power Quality-Based Tariff Implementation in a Smart Grid" Energies 14, no. 19: 6171. https://doi.org/10.3390/en14196171
Note that from the first issue of 2016, this journal uses article numbers instead of page numbers. See further details here.