
Machine Learning-Based Condition Monitoring for PV Systems: State of the Art and Future Prospects
by
 , , and
Tarek Berghout
1 ,
,
Mohamed Benbouzid
2,3,* ,
,
Toufik Bentrcia
1, 
Xiandong Ma
4,
Siniša Djurović
5 and
Leïla-Hayet Mouss
1 1
Laboratory of Automation and Manufacturing Engineering, University of Batna 2, Batna 05000, Algeria
2
Institut de Recherche Dupuy de Lôme (UMR CNRS 6027), University of Brest, 29238 Brest, France
3
Logistics Engineering College, Shanghai Maritime University, Shanghai 201306, China
4
Engineering Department, Lancaster University, Lancaster LA1 4YW, UK
5
Department of Electrical and Electronic Engineering, University of Manchester, Manchester M1 3BB, UK
*
Author to whom correspondence should be addressed.
Energies 2021, 14(19), 6316; https://doi.org/10.3390/en14196316
Submission received: 31 August 2021
/
Revised: 21 September 2021
/
Accepted: 30 September 2021
/
Published: 3 October 2021
Abstract
:To ensure the continuity of electric power generation for photovoltaic systems, condition monitoring frameworks are subject to major enhancements. The continuous uniform delivery of electric power depends entirely on a well-designed condition maintenance program. A just-in-time task to deal with several naturally occurring faults can be correctly undertaken via the cooperation of effective detection, diagnosis, and prognostic analyses. Therefore, the present review first outlines different failure modes to which all photovoltaic systems are subjected, in addition to the essential integrated detection methods and technologies. Then, data-driven paradigms, and their contribution to solving this prediction problem, are also explored. Accordingly, this review primarily investigates the different learning architectures used (i.e., ordinary, hybrid, and ensemble) in relation to their learning frameworks (i.e., traditional and deep learning). It also discusses the extension of machine learning to knowledge-driven approaches, including generative models such as adversarial networks and transfer learning. Finally, this review provides insights into different works to highlight various operating conditions and different numbers and types of failures, and provides links to some publicly available datasets in the field. The clear organization of the abundant information on this subject may result in rigorous guidelines for the trends adopted in the future.

1. Introduction
The consumption of renewable energy has received increased acceptance in a wide range of sectors due to the clear advantages it offers. The inherent environmentally friendly power generation process has stimulated global interest in the development of renewable energies as the only solution for a cleaner environment and the satisfaction of increased energy demands [1,2]. In 2020, the statistical studies of the “World Energy Data” reports stated that, in regard to the global consumption of energy, renewable energies account for 23.6% [3]. Among these multiple renewable energy resources (such as biomass, hydro, geothermal, wind, and solar), solar energy accounts for 11.44% of total spending, with the potential for increase. In addition, it is expected that photovoltaic and wind power generation technologies will become the main energy sources in the world by 2025, and photovoltaic modules are forecast to support 60% of the additional capacity [4]. However, the only appropriate means to interactively meet energy demands is via a network that takes into account the optimal distribution parameters (i.e., cost, quality, and time). Photovoltaic (PV) systems of different types (i.e., standalone, grid connected, and hybrid) are subject to numerous environmental constraints (e.g., solar radiation, ambient temperature, and dust and other droppings). As a result, the optimal distribution process is entirely dependent on a reliable condition monitoring (CM) system. The CM system must be able to assess the state of health against the continuously changing working conditions while attempting to find the best plans for maintenance decisions or an optimal automatic control process [5]. The reliability of the CM system is tightly affected by a highly sophisticated modeling process. This should produce a stable (i.e., with the largest possible confidence interval) and accurate model capable of mimicking the operating behavior of real systems. Therefore, the current tendency is to use adaptive modeling processes capable of addressing all of the dynamic variations of the operating conditions [6]. Consequently, the available literature shows that modeling based on a set of well-demonstrated laws of physics will produce a sufficiently fast and stable response, leading to increased compatibility between simulation and actual functioning behaviors [7]. Conversely, this process will only be available when the following conditions are met (see Tu et al. [8], § 5.5.1.4):
- The derived mathematical formulas are certain;
- There are no simplifications (elimination/merging of model’s elements);
- Experimental validation of the designed models is possible and can be fully achieved.
It can be understood that when many dynamically functioning components are involved in such an operation, it will be intractable for a direct physical simulation process to derive the appropriate interpretations under the aforementioned conditions [9]. Hence, to model such a complex dynamic phenomenon, switching to data-driven approximation is a prominent path that is relied upon. Due to the availability of advanced technologies in automation, networking, and sensors, e.g., Supervisory Control and Data Acquisition (SCADA), data-driven analysis with machine learning (ML) is becoming increasingly relevant for a large class of applications [10]. It also allows behavioral aspects to be mimicked by appropriately examining only the patterns driven with recorded operational history. As a result, in the field of Prognosis and Health Management (PHM) of PV systems, a multitude of ML approaches with different architectures, e.g., ensemble and hybrid, have been extensively investigated and a large number of learning paradigms, e.g., Conventional (CL) and Deep Learning (DL), have therefore been discussed.
In this paper, we endeavor to provide more details on the CM of photovoltaic systems using ML modeling. We review contributions and literatures that have been published recently, with a focus largely on the works published within the past three years. In this context, recent reviews have provided numerous insights into the exploitation of ML in the field of PHM (i.e., detection, diagnosis, and prognosis) of PV systems. The review by Sundaram et al. [11] elucidated many details relating to the application of DL tools for industrial processes encompassing PV panels. The review generally addressed DL architectures including, but not limited to, autoencoders, Convolutional Neural Networks (CNNs), Long Short-Term Memory (LSTM), Deep Stacking Networks (DSNs), and Deep Belief Networks (DBNs). It also provided information about knowledge-driven models such as Generative Adversarial Networks (GANs). The review of Zhao et al. [12] studied the use of ML for power electronic systems. The authors therefore explored multiple ML tools and paradigms according to their field of application (i.e., optimization, classification, regression, and clustering) for health condition assessment. In optimization, they explained how swarm intelligence algorithms such as Particle Swarm Optimization (PSO) can assist a physical model to achieve an adaptive control process, e.g., Maximum Power Point Tracking (MPPT). In addition, for other applications, they briefly discussed anomaly detection, Remaining Useful Life (RUL) prediction, and health level estimation for unlabeled samples. Kurukuru et al. [13] presented a general overview of the application of Artificial Intelligence (AI) tools for photovoltaic systems. Their study was not limited to CM, and also addressed the relevant aspects of control, forecasting, cyber security, design, and maintenance (see Kurukuru et al. [13], Figure 1). Accordingly, in terms of CM, they listed recently published articles regarding fault detection, mainly addressing topics related to photovoltaic panels, electronic converters, filters, and batteries. In addition, they did not discuss ML architectures and detection methods. The mini-review undertaken by Kande al et al. [14] focused on a specific detection technology (e.g., infrared thermography) for CM of PV systems. The authors further discussed types of PV array failures and briefly studied ML without examining the details of learning approaches. Mellit et al. [15] analyzed the emergence of AI and Internet of Things (IoT) technologies in the field of diagnostics and remote sensing of photovoltaic systems. In terms of CM, they mainly addressed DL architectures and conventional learning methods, and described the relevant failures of PV systems. Moreover, they provided an explanation for the use of some learning paradigms, such as supervised learning, unsupervised learning, and reinforcement learning.
In general, the reviews of the literature essentially relate to ML-based techniques for CM of PV conditions and to showcasing a global conclusion concerning their application attributes. However, most of the previous works did not pay sufficient attention to a more detailed classification of ML tools in terms of architectures and learning paradigms. Furthermore, they did not provide a consistent classification of detection methods, e.g., current-voltage (I-V) sensors, radiation sensors, temperature sensors, and thermographic cameras, and technologies (e.g., ordinary sensors, wireless sensors) when attempting to identify and locate specific faults [16,17]. Numerous aspects regarding the number and type of handled faults, and the number and state of operating conditions, require a more detailed analysis. For example, extensions to actual operating conditions other than MPPT, e.g., Intermediate Power Point Tracking (IPPT) [18], have not been fully covered. For real-world applications, numerous experimental studies have been carried out in the presence of unbalanced massive dynamic data (big data). Nevertheless, to the best of our knowledge, the topic has not been specifically addressed because it is perceived as a ML problem.
In this context, in the current paper, we aim to incorporate numerous new details in the field of CM of PV systems with ML, and review the different modes and types of PV system failure. In addition, we illustrate various adopted ML methods and their applications, and suggest paths for probable future opportunities for monitoring the health of PV systems.
This paper is organized as follows: Section 2 is dedicated to the failure types encountered in PV systems and detection technologies. Section 3 explains the classifications of the ML models used with regard to their feature extraction techniques, in addition to the problems relating to the type and number of failure modes and data dimensionality. Section 4 discusses the obtained review results. Finally, Section 5 summarizes important conclusions and suggests future directions.
2. PV Systems Failure Types and Detection Technologies
Under operating conditions, photovoltaic panels and other PV grid-related components are exposed to harsh environments [19,20]. Environmental effects, such as overheating of cells caused by higher temperatures, dirt, and droppings, can affect the health of PV system conditions. As a result, degradation of certain components (e.g., cells) may appear occur a certain period in the operating life cycle [4]. In contrast, other components (e.g., inverters) can be prone to sudden and complete failure. Therefore, different detection technologies for various components have been continuously researched and improved, with the aim of acquiring the information needed in the diagnosis/prognosis of faults. This section aims to provide insights into major fault types in PV systems and the corresponding sensing technologies used for monitoring the indicators of these faults.
2.1. PV Systems Failures
In this review, we focus on failures common to the varying aforementioned PV systems types. According to Sabbaghpur et al. [21], these failures can be classified into six different categories (i.e., shading, open-circuit, degradation, line-to-line, bypass diode, and bridging) as illustrated by Figure 1.
2.1.1. Shading
Photovoltaic systems provide electrical energy when solar cell materials are exposed to light photons of the sun. When the solar cell or photovoltaic panel is screened from the sunlight due to obstructions, electricity generation is weakened [22]. The shading phenomenon can partially or totally cover the PV modules depending on the source of the obstructions, for instance:
- Objects near PV panels, such as buildings, walls, trees, or other panels;
- The horizon of surrounding land;
- Dirt and other droppings;
- Panel aging, orientation, or soiling.
Relevant solutions in this case have been introduced to remedy the effect of shading via several alternatives, such as:
- Analysis of multiple stringing to find optimal arrangements for the PV modules (i.e., parallel and series panel installations) [26].
The example showcased in Figure 2 is a partial shading experiment on a PV module in an attempt to clearly illustrate the role of bypass diodes in MPPT. It describes both the I-V and P-V variations under three main conditions, namely: normal operating conditions (no shade), shading conditions without installed bypass diodes, and shading conditions when bypass diodes are installed. The results of this figure were obtained from separate simulation experiments which were performed in [27]. However, in the currently presented curves, the results are grouped into a single reference for each curve type (i.e., I-V and P-V) to facilitate the comparative study.
Figure 2a,b elucidates the obtained I-V and P-V results, respectively, under the three aforementioned conditions. In this case and without involving the bypass diodes, there is no power tracking or current, and it yields a near-total absence of electric energy production. In contrast, the bypass diodes show their extreme capability in handling the MPPT by identifying useful local minima to produce an acceptable amount of energy.
2.1.2. Degradation
PV modules are specifically designed to serve electric power generation for a long lifespan ranging from 25 to 30 years. It is thus clear that they are subject to a uniform rate of degradation (i.e., gradual loss in performance) over the course of each year (i.e., less than 0.8%) [4]. Generally, degradation rates can be measured through data statistical analysis using the deterioration history for such PV modules [28,29]. However, collecting the necessary damage propagation patterns is difficult due to the long lifespan. Therefore, accelerated life tests under similar working conditions are undertaken to provide prior assumptions about the health conditions.
Figure 3 elucidates common degradation modes in PV modules. In [4], a study was carried out on the common degradation types of PV modules to determine the most common form of degradation during the past 10 years. Accordingly, a listed set of occurrence percentages corresponding to various degradation types was therefore provided as follows: 33% for hot spots; 20% for the discoloration of the ribbon; 12% for glass breakage, 10% for encapsulant discoloration; 9% for cell breakage; and 8% for Potential Induced Degradation (PID).
2.1.3. Open-Circuit
When an electrical circuit in the PV module wiring installation is interrupted by a break in one of the wires or by a blown fuse, an open-circuit fault appears immediately. Moreover, an open-circuit fault may involve more than one phase and ground wire (i.e., electrical flow will pass through the ground), or may only occur between the phases themselves. The open-circuit fault can occur due to an open wire, a bad connection, or a loose terminal [30,31]. An open-circuit fault can cause more damage than a short-circuit fault because of the steady increase in the amperage flow [32].
The detection of this type of fault can be performed either via data-driven methods, such as illustrated by the works of Wang et al. [33] and Du et al. [34] (i.e., ML modeling), or through the use of physical simulation models and analysis of I-V/P-V curves, as indicated in the work of Pei et al. [31]. However, detection with ML modeling can be undertaken by means of both supervised learning (approximation) when labels are known or unsupervised learning (clustering) when data is unlabeled.
The variation example of the I-V and P-V curves for a PV module shown in Figure 4, which was obtained from [31], provides an overview of their variation with respect to different types of fault modes. It can be seen that each type of failure has its own particular characteristics, which distinguishes it from other failure types. Specifically, the I-V and P-V variations in the open circuit have more definite statistical characteristics than the other faults. Thus, the open circuit fault can be easily determined through precise indicators derived by signal processing.
2.1.4. Line-to-Line
A line-to-line fault is a type of short circuit between lines, caused when air saturated with ions reaches a defined threshold, or when lines accidentally come into contact with each other. Therefore, protective devices such as fuses must be installed to prevent significant damage to the system. When a line-to-line fault occurs in an electrical device, it generates an extremely low impedance path for current flow [35]. This yields a large current flow from the power supply, causing the relays to trip, and damaging the insulation and equipment components.
According to the review on fault classification in power transmission systems conducted by Prasad et al. [36], line-to-line faults can be detected using three principal strategies:
- Signal processing methods;
- Intelligent ML methods;
- Hybrid methods.
Figure 4 also illustrates this type of fault (short circuit), which can easily be distinguished through accurate P-V and I-V curve analysis. The experiment carried out by Padilla et al. [37] also offers a large set of comprehensible visual examples for the analysis of the current loss of short-circuited commercial PV cells. Their work mainly uses current density mapping measurements based on linear external quantum efficiency interpolation to detect the effect of this type of fault. Figure 5 demonstrates current density in both operating conditions of the solar cells (i.e., normal and line-to-line conditions). The regions of interest in Figure 5b (i.e., A, B, C, and D) are defect symptoms, which may be detected through a well-designed image segmentation and classification process.
2.1.5. Bypass Diode
Bypass diodes are widely used in PV modules to optimize electrical power generation when exposed to partial shade conditions or a non-uniform irradiance [27,38]. Shading losses can be avoided by allowing a bypass diode to be connected in parallel with PV cells in opposite polarity. In unreliable conditions, the bypass diode conducts, and immediately allows only healthy cells to operate [39].
Instinctive drops in output current in the PV modules, which is a result in switching-off of one of the cell strings, are an effect caused by the failure of at least one of the installed bypass diodes. Such incident can be caught by analyzing the I-V and P-V curves under good solar radiation. However, it is almost invisible when the PV panels are exposed to low sunlight which therefore requires more in-depth intelligent tools [40,41].
Figure 6 depicts some of the symptoms of bypass diode faults in a PV module. It is a sort of deformation in bypass diodes that takes approximately three years to appear [38]. In Figure 6b, one may notice that some traces occur due to the migration of metal into a semiconductor (white silicon layer).
2.1.6. Bridging
The bridging fault is related to the low resistance between two sets of points with different potentials in the PV stringing of the module or its wiring network [21]. Common types of bridging faults can be listed as follows:
- Short circuit of two output lines;
- Short circuit between input and output lines of different strings;
The study conducted by Ul-Haq et al. [45] targeted the determination of the amount of extracted power from PV solar modules under different fault types using P-V curve analysis. Several types of interconnections were investigated, including Series-Parallel (SP), Total-Cross-Tied (TCT), Bridge-Link (BL), and Reconfiguration Method (RM). Two types of PV panels were thoroughly exploited, namely the polycrystalline and copper indium gallium selenide panels. In the context of bridge fault type analysis, the P-V curves shown in Figure 7 were obtained.
It is convenient for Series-Parallel SP connection architectures to exhibit better performance by minimizing power loss. Accordingly, regarding RM paradigms, the complete absence of power peaks in the curves can be seen, which explains why they are not able to minimize the power loss of PV modules when a bridge fault occurs. Conversely, RM optimizes the performance of PV modules by targeting sudden decreases in the current.
2.2. Technologiesof Detection Sensors
The quality of recorded data is essential for training the prediction models of ML tools for CM of PV systems. Therefore, capturing the training patterns needed to build an accurate approximation model depends not only on the ML model itself, but also on the type and accuracy of the used sensors. In this case, many types of sensors can be used that rely on the information required by the ML developers. For example, image sensors, such as thermographic [46,47], X-ray [38,48], and electroluminescence cameras [49,50], are, in general, used to analyze the types of external defects related to degradation features by providing images of the surface of photovoltaic panels or cells. By comparison, traditional sensors such as I-V, P-V, temperature, and radiation sensors can be used to determine symptoms of both external and internal defects in the system.
Image sensors can provide a higher dimensional feature space, which cannot be easily handled by ML models. It therefore requires more complex data preprocessing, such as image segmentation, extraction, and dimensionality reduction to achieve clean, reliable, and well-distributed learning samples [51,52]. Conventional I-V/P-V sensors are easier to use because they are able to hold all of the needed information relating to both external and internal defects. However, due to the harsh environment conditions to which dynamic changing is subjected, extracting necessary patterns also requires a large signal processing phase before moving to the training process. This reduces the higher cardinality present in raw data under the form of similar patterns with distinct labels [18].
Additionally, the installation technology (wired and wireless) of sensors can also affect the training process. For instance, although wired sensors are efficient, they are expensive and difficult to manipulate in terms of installation, particularly for wide geographic distributions. On the contrary, wireless sensors may be easier to use but are subject to distortion due to environmental conditions and the presence of a higher level of electromagnetic disturbance, and are more vulnerable to cyber-attacks than wired sensors [53,54]. In addition, drone sensors, such as those found on Unmanned Aerial Vehicles (UAVs), are unstable. As a result, they are unable to deliver the same information even for two consecutive captured images for the same PV panel [55,56]. This instability in data capture creates outliers in the feature space, which also poses significant disadvantages for data processing and approximation.
In general, conventional sensors are used to analyze the system performance. This helps in the subsequent detection of both internal and external system failures, such as open-circuit failures or shading. Images sensors have been widely adopted to detect degradation in PV panels (i.e., external defects only). Figure 8 presents different types of feature space that can be encountered when building a photovoltaic CM system based on an ML model with respect to the used detection technology. It also specifies the necessary ML preprocessing and ML models required to accomplish this model reconstruction process.
3. Machine Learning for Condition Monitoring of PV Systems
It is a common practice in health condition monitoring to involve ML in the diagnosis and prognosis process, where the main function concerns the localization and identification of the causes of failures. The prognosis task refers to the earlier prediction, and hence can be classified as a kind of predictive diagnosis. Predictive modeling with machine learning is often built upon four main steps [57]:
- Data preparation;
- Training;
- Results post-processing;
- Validation.
These steps and their sub-tasks are simplified in the flow diagram of Figure 9.
The type selection of the training model is completely dependent on the complexity level of the encountered problem (see Schmidhuber [58], § 3). The more complex the problem, the more complex the solution must be. Thus, this section discusses the classification of different employed ML tools in general prediction problems, and specifically those used in CM in PV systems.
It is known that the construction of a good predictive model requires both training and testing samples extracted from the same probability distribution. However, it is impossible in practical application to achieve such an objective. Because of contemporary advanced technologies, data are becoming increasingly complicated in terms of dynamic variation. In parallel, ML modeling is also under accelerated development in an attempt to support the rapid variation of data. Therefore, ML models are divided into three main categories:
- Conventional ML;
- Advanced deep learning;
- Recent knowledge-driven methods, such as GANs and TL.
It should be noted that all the tools of these categories are subject to different learning paradigms, such as hybrid, ensemble, and reinforcement learning. Figure 10 illustrates the proposed classification introduced in this work. We also focus on the number of treated PV fault modes when describing these recent models. Furthermore, links are provided to the publicly available datasets used in the papers discussed in this work to enrich the present review content and to assist readers who aim to build ML models with similar data.
3.1. Conventional Machine Learning
Conventional ML paradigms are predictive models designed to produce the best possible approximation between inputs and targets. The procedure should take into account the generalization capacity of such a learning model. Conventional algorithms, such as the Support Vector Machine (SVM), Multilayer Perceptron (MLP), and K-Nearest Neighbor (KNN), with ordinary representation and without deeper nonlinear abstractions, belong to this class of learning models [59]. In the context of CM for the PV system with ML modeling, many approaches have therefore been established. As a result, to provide a more simplified representation for the literature review, we divided each subclass of ML models into two categories according to Figure 8, namely, ordinary and image acquisition techniques.
3.1.1. ML-Based Ordinary Sensors
Ordinary sensors, such as I-V, P-V, temperature, and radiation sensors, are commonly applied in conventional ML for condition monitoring of PV systems. For instance, Garoudja et al. [6] proposed the use of a Probabilistic Neural Network (PNN) to detect healthy and unhealthy operating conditions of a PV module. In the detection phase, they used common I-V signals on the DC converter side to investigate variations with respect to previously stored historical data. Elected learning data was retrieved from a well-designed simulation model inspired by physical modeling of a real grid-connected PV system. Four types of sub-fault modes belonging to the short-circuit fault category, with different stringing numbers and disconnection of PV modules, were therefore discussed. Momeni et al. [60] adopted a new approach to the ML-based PV fault diagnosis algorithm, in which the learning process is built in a semi-supervised learning process. Graph-Based Learning (GBSSL) was used to extract hypotheses about the labels of unseen samples by following a kind of analysis, based on a previously labeled dataset. Two types of PV fault related to different cases from line-to-line faults were investigated using the same methodology for analyzing measured I-V signals. Maaløe et al. [61] simulated learning data by considering several types of shading fault modes (10 modes) based on a computer simulation program inspired by a real PV system. Then, the Bayes Theorem (BT) was developed for clustering processes with the aim of accurately differentiating between different operation behaviors using the characteristics of conventional I-V curves. The training samples and their given labels using the BT algorithm were fed into an ordinary classifier based on stochastic gradient rise methods for a rough estimate. Lazzaretti et al. [62] used the Dynamic Adaptive Recursive Linear (DARL) model for the detection of PV fault modes. Three main cases of unhealthy state were considered, namely, line-to-line, degradation, and shading. The study was carried out using a constructive predictive model capable of circumventing the disadvantages associated with the variation in operating conditions with time. The controlled data was retrieved from a specially developed simulator of a real photovoltaic power plant. During the modeling process, the fault modes were intentionally and continuously injected into the signal models to produce enough acquired samples. Dhibi et al. [63] employed a Reduced-Kernel Random Forest (RKRF) for the detection and classification of grid-connected photovoltaic faults. Data mining was realized by sparse representations of Principal Component Analysis (PCA) to reduce the dimensionality of the data. They also used KNN clusters to decrease the number of training instances. As a result, a simulated PV system was operated to evaluate the approximation process, where nine types of I-V sensors were installed in different positions for sufficient and accurate data collection. In addition, these sensors were used to detect five different PV fault modes of different components (sensor, inverter, grid connection, PV panels, etc.). The simulated fault modes were generally classified to three categories, namely, open circuit, line-to-line, and shading. Huang et al. [64] optimized a single hidden layer feedforward neural network that was trained by the Extreme Learning Machine (ELM) algorithm using the Bee Colony (BC) metaheuristic. They utilized this optimal search algorithm to perform an accurate diagnosis of failure modes of PV systems. As a result, the shading phenomenon caused by dirt and dust was specifically studied as the main environmental variable. Eskandari et al. [65] followed a methodology similar to that of Huang et al. [64] for PV-based fault detection. However, a slightly more complex ensemble learning architecture was studied within this context. Several types of learning algorithms were used, including KNN, SVM, and Naive Bayes (NB), in unique training settings, which were concluded by a voting process to approve a final decision. Two cases of healthy and unhealthy states were treated as a classification problem, where the main studied type of fault was the line-to-line fault. In another work of Eskandari et al. [66], the same methodology was followed. However, unlike the use of ensemble learning, the authors chose to trigger the learning process on multiple classifiers, namely, SVM, NB, and Logistic Regression (LR), and selected only the best after completion of the evaluation process. Edun et al. [67] suggested a supervised and unsupervised dictionary learning approach to detect disconnect (open-circuit) faults in PV modules. Their main contribution involved the use of sparse coding algorithms, such as Singular Value Decomposition (SVD), to help locate and identify symptoms of faults in driven samples. The detection phase consisted of measuring the characteristics of the reflection signatures obtained in response to that sent in the transmission lines where reflections can appear at each point of impedance mismatch. Hajji et al. [68] developed a multivariate time series feature extraction and selection technique based on PCA for appropriate PV grid-connected data preprocessing. They fed the resulting clean data into a supervised ML model for fault classification. Five fault modes belonging to line-to-line and shading categories were simulated on several components of a PV system. The detection technologies involved the use of I-V sensors placed in several locations to collect the necessary patterns for analysis. Different classifiers were used to evaluate the learning model, and results indicated that RF has the capability to provide the best results. Harrou et al. [69] elaborated ML prediction frameworks including SVM, Gaussian Process Regression (GPR), and mapping-based kernel machines for condition monitoring of PV systems. Six fault types specified by bridging faults and partial shading, and PV module short circuits, module degradation, and line-to-line faults, were examined using P-V analysis. A more complicated analysis was performed by Bakdi et al. [18], in which supplementary operating conditions were taken into account. MPPT and IPPT were both studied under a big data environment. In contrast to the previous works, 16 failure modes were intentionally injected into a simulation model inspired by a real PV system. However, the initial data were recorded from real operating conditions rather than being randomly generated. Two I-V/P-V scenarios of normal functioning under MPPT and IPPT were therefore recorded. Fourteen other scenarios were recorded from abnormal conditions under the same condition, where fault modes were equally distributed. Learning signals are subjected to an extremely large dynamic environment that can produce deep problems. Bakdi et al. [18] attempted to solve this problem by constructing a hybrid ML model by combining a set of traditional prediction tools, namely, PCA, Kullback–Leibler Divergence (KLD), and Recursive Smooth Kernel Density (RSKD) estimation. These tools were respectively employed for dimensionality reduction, feature extraction, and supervised training.
3.1.2. ML-Based Image Acquisition
In contrast to the aforementioned works, which depend entirely on the interpretation of characteristic variations of ordinary sensor measurements such as I-V/P-V signals, other complex studies have been conducted on larger and more dynamic datasets. However, it should be noted that there is an observable scarcity in the application of conventional ML for higher-dimension image processing. For example, Ali et al. [70] applied a new detection technology based on infrared thermographic images to determine shading and degradation faults caused by hot spots in PV modules. Numerous feature extraction techniques have therefore been used to provide cleaner data. Descriptive patterns based on image processing, such as RGB, texture, Oriented Gradient Histogram (OGH), and local binary pattern (LBP), have been incorporated as a data preprocessing step. After several tests with different datasets, the higher approximation capacity of SVM has been demonstrated. Similar experiments on the degradation effects of hot spots on photovoltaic panels were conducted by Dhimish [71]. The obtained results indicate that Discriminate Classifiers (DCs) lead to better precision than SVM and other conventional machine learning methods, such as KNN and Decision Tree (DT). Table 1 summarizes the basic details in relation to the conventional machine learning models discussed in this review, with their characteristics.
3.2. Deep Learning
In the 1980s, deep learning (DL) was popularized by John Hopfield and David Rumelhart in the training of brain-inspired algorithms [59]. DL is a branch of ML that primarily focuses on feature mappings and representations. As a result, the larger the improved feature space, the more meaningful the representations.
The current DL technologies have been widely investigated in all areas of data-driven applications. Many algorithms have therefore been developed, such as Deep Belief Networks (DBNs) by Hinton [74], Long Short-Term Memory by Schmidhuber [58], Convolutional Neural Networks (CNNs) by Lecun [75], and the family of autoencoders. Subsequently, research in PV condition monitoring has flourished and many algorithms have been developed. Therefore, this subsection presents applied DL methods for CM of PV systems with respect to the previously discussed detection and acquisition technologies.
3.2.1. DL-Based Ordinary Sensors
In general, DL models are not well suited to condition monitoring based on ordinary sensors; they usually involve more complex modeling processes. In the work of Liu et al. [76], a stack of autoencoders (SAE) was used to automatically extract features from a small number of unlabeled I–V curves to distinguish between several fault types that can occur in PV modules. Feature dimensions were thereafter reduced and enhanced by t-distributed Stochastic Neighbor Embedding (t-SNE). Furthermore, the health states of similar patterns were grouped using Fast Search and Find of Density Peaks (FSFDP) and Membership Function (MF). As a result, the study investigated a powerful model that is able to handle a complex clustering process of about eleven fault types of shading, short circuit, and degradation. Appiah et al. [77] developed an automatic LSTM able to extract meaningful features with higher capability of learning through time. In this study, the authors used I-V signal analysis to address the condition monitoring problem of PV systems. In contrast to the aforementioned works (see Section 3.1), a large number of fault types (i.e., short circuiting, cable insulation breakdown, DC junction box corrosion, intra-string, and inter-string) were adopted and two main categories were taken into account, namely, line-to-line and degradation faults. To provide a full conclusion of fault detection under a big data environment, sets of 2240 and 1961 different cases for both fault types, respectively, were therefore simulated and prepared for ML application. In addition, 1866 cases of healthy operation under working conditions were collected. Gao et al. [78] used a set of recorded features (i.e., I-V, solar irradiance, temperature) to train a hybrid CNN for PV fault classification (10 types). The CNN algorithm was consolidated with a Residual Gated Recurrent Unit (Res-GRU) to provide the capability of dynamic online training. The reconstructed learning framework allowed automatic feature extraction and required less user intervention when classifying faults/hybrid faults related to line-to-line, shading, and degradation types.
3.2.2. DL-Based Image Acquisition
In contrast to conventional ML, which is mostly applied to the analysis of ordinary sensors measurements (see Section 3.1), DL models are used to investigate more complex feature spaces, including several types of higher dimensional images. For instance, Li et al. [79] discussed more complicated fault classification tasks via a realistic dataset gathered from large-scale PV farms. UAVs (i.e., drone technologies) were exploited for capturing different thermographic surface images from PV modules. They were used for the identification and classification of several types (five types) of visible PV panel faults classified to degradation and shading categories, namely, dust, shading, encapsulant delamination, glass breakage, gridline corrosion, snail trails, and yellowing. Because of the huge amount of data within the collected 2D images (i.e., 8400 images) and time varying conditions (i.e., six conditions with 1400 images for each), a DL algorithm was utilized and a CNN learning architecture was therefore adopted. In another implementation of Li et al. [80], UAV technology and a hybrid machine learning architecture were combined for PV plant fault detection, identification, and classification. In this approach, a CNN was proposed for the purpose of feature extraction due to its capability of convolutional mapping with local receptive fields. In addition, rather than fine-tuning the CNN itself, a SVM classifier was fed with the feature maps to train the prediction model. Pierdicca et al. [46] explored thermal images recorded through infrared sensors installed in a UAV to train a hybrid mask region-based CNN model for fault classification of a PV system under varying conditions. Accordingly, three fault modes (i.e., one anomaly, non-contiguous cells with anomalies, and contiguous cells with anomalies) of degradation were studied. Hwang et al. [81] designed a hybrid model that included three embedded learning systems, namely, Improved Gamma Correction Function (IGCF), CNN, and eXtreme Gradient Boosting (XGBoost) algorithm. These algorithms were combined in series to perform better preprocessing, extraction, and classification tasks, respectively. Learning samples were obtained from thermographic images provided by thermal cameras installed on the roof of the Industrial Technology Research Institute in Hsinchu, Taiwan. A total of 684 images with 240 × 320 pixels and 684 converted temperature CSV files were studied in this case. Venkatesh et al. [82] used a retrained CNN algorithm for image classification (i.e., VGG16) to extract features from thermal images obtained from UAVs. After extracting the appropriate features based on a generative model, the mappings were passed through a discriminative CNN algorithm to accomplish the approximation process. Five different degradation fault modes (i.e., burn marks, delamination, discoloration, glass breakage, and snail trails) were studied. Moradi et al. [83] implemented an encoder-decoder architecture to train a fully connected CNN to detect shading caused by bird droppings. A new detection technique using multi-copters was used to gather the necessary aerial images for training, testing, and validating the proposed network. The same VGG16 network was considered in the construction of the encoding part, whereas the reconstruction phase consisted of bird-dropping segmentation. The labeling of collected images depended on the analysis of the output current from the PV system. Manno et al. [84] targeted different big databases (see Manno et al. [84], Table 2) of thermographic images obtained from ground-based and UAV installations. The authors trained a CNN to identify multiple fault classes after well-defined data preprocessing (i.e., normalization and homogenization of pixels, grey scaling, thresholding, discrete wavelet transform, and Sobel Feldman and box blur filtering.). The fault localization and identification process depended on the binary classification problem of hot spot degradation and normal operating conditions.
For more illustrations of DL details in PV system fault classifications, Table 2 provides a summary of the discussed DL tools.
3.3. Knowledge Driven
Due to the long lifespan of PV panels, and associated computational costs, such as that of in-memory storage, it is difficult to collect the necessary patterns similar to degradation. As mentioned in Eder et al. [87], accelerated tests can be an alternative solution for reconstruction of data-driven models. However, data-driven samples of artificially aged PV panels suffer from the lack of important descriptive patterns related to deterioration or damage processes. In addition, some samples, such as I-V/P-V or thermographic images, are generally difficult or impossible to label, even for ML developers. Therefore, knowledge-driven models are used in this case to fill the gaps in uncompleted lists of unlabeled samples [88]. Two main types of ML models can be found in this type of learning, namely, generative models [89] and domain adaptation learning by considering the domain to be invariant [90,91]. Generative models are ML tools capable of generating new examples or preliminary hypotheses using training data. These new examples or preliminary hypotheses are used either to improve the representation of the features or to provide the necessary information that is assumed to be hidden in the original feature space. Similarly, domain adaptation learning by considering the domain to be invariant is an alternative solution for adjusting the data distribution in the target domain, once similar complete data are available in the source domain. Mathematical formulations of the loss term of generative models are relatively similar to domain invariant learning when feeding a discriminative model [92,93].
In recent ML modeling, specifically for condition monitoring, Generative Adversarial Networks (GANs) and Transfer Learning (TL) have been among the commonly used types of generative models and domain invariant adaptation learning approaches [94,95].
GANs represent a new effective generative adversarial learning theory specific to data augmentation. GAN is a ML technique developed by Goodfellow in 2015 [96], in which the main idea is to train a generative model, such as a deep network, to generate real examples from fake data in a form of “minimum of two players game” approach. Unlike traditional generative models that try to extract features, GANs are trained in a supervised manner by associating a discriminator to classify these representations to only the two preceding categories of fake/not fake. By comparison, TL can be applied to any learning algorithm by moving learning parameters from different distributions of the source domain to the target domain, and minimizing a common and full loss function of the entire contributed domains in the adaptation process [97,98]. Knowledge-driven models have also been investigated according to the two discussed data acquisition methods.
3.3.1. Knowledge-Driven Ordinary Sensors
To address knowledge-driven modeling using data acquired from ordinary sensors, a set of recent algorithms for PV condition monitoring are discussed in this review. For instance, Lu et al. [99], proposed a hybrid deep TL algorithm adaptable to several domain distributions using a CNN for DC arc faults (i.e., can be caused by short-circuit or ground faults) diagnosis. First, the algorithm attempts to learn representative examples from the learning samples in the source domain data. Then, a dummy generation process of new samples in the target domain is followed by the TL process using GANs. A total of 25,000 samples were collected for a real PV system (see Lu et al. [99], § III.A.2) during normal healthy operating conditions. In addition, 5000 arc fault samples were used to construct the source domain dataset. Accordingly, 20% of the randomly selected samples from healthy operating states were reserved for the validation process. Three types of arcing faults at the start, middle, and end of the PV string were considered. Lu et al. [100], in a work similar to their previous study (i.e., Lu et al. [99]), extended their experiments using almost the same training tools and frameworks by involving three additional datasets.
3.3.2. Knowledge-Driven Image Acquisition
In the context of knowledge-driven image acquisition, a number of studies can be noted. Tang et al. [101], in the study of a prediction problem using a limited number of electroluminescence images, augmented their data by combining GANs and traditional image processing techniques. Then, generated examples for data augmentation reasons were fed into a CNN fault detection algorithm of PV modules. Five types of PV cell degradation fault (i.e., micro-cracks in polycrystalline silicon, micro-cracks in monocrystalline silicon, finger interruptions in monocrystalline silicon, finger interruptions in polycrystalline silicon, and breaks) were studied. Akram et al. [102] also examined a TL-based approach to train a CNN for PV faults. However, a more complicated study was involved in this case, in which fault classification in two different datasets was considered. An electroluminescence image dataset was used to train the CNN in the source domain and infrared image datasets were used for training in the target domain. The infrared images enabled manual labeling of the degradation faults with eight types of faults, namely, failed cell interconnection, cell cracking, cracks isolating cell parts, failed/resistive soldering bonds, localized shunting in cells, high current density at bus bars, breakage of module glass, and failed cells in outdoor infrared images.
It should be noted that the use of knowledge-driven models has been lacking in PV fault detection. As a result, the attention of scientists has moved toward traditional and deep learning techniques in this field. Specifically, knowledge-guided paradigms should be considered according to these conditions:
- Because testing samples are subject to a higher level of variation, their data distribution is different from the distribution of the data used for training;
- Training data is incomplete or many labels are missing;
- Data is incomplete and subject to many outliers.
Table 3 outlines important contributions achieved to date in PV system condition monitoring using knowledge-driven paradigms.
4. Discussion
Based on the tables presented previously (i.e., Table 1, Table 2 and Table 3), we constructed a dataset to show the study focus according to three main criteria, namely, the ML categories, the detection technologies, and the treated fault types. Figure 11 emphasizes the obtained results. It can be noted from Figure 11a that most of the ML tools used in the articles selected from the literature are traditional machine learning approaches. DL models are ranked second, followed by knowledge-driven models. The studied failure modes in PV systems are focused on degradation faults and shading more than other types (Figure 11b). Figure 11c shows that, to date, prediction based on I-V/P-V detection remains the dominant technique in PV condition monitoring.
We believe that this domination of both traditional ML tools and conventional detection sensors, such as I-V and P-V, in PV systems’ CM is due to numerous factors related to the simplicity of use and installation, and the reliability of the acquired information. For example, I-V/P-V signals are used to detect all types of defects in PV systems, including external defects, because they have the ability to hold a large amount of information with less cardinality compared to images. In addition, in terms of ML production, deep complex predictors are not required, and coherent and appropriate preprocessing of data leads to an accurate approximation. In contrast, DL models require a large quantity of non-linear abstractions and mappings to acquire meaningful representations, which are more computationally expensive processes. It can also be noted that researchers have targeted degradation and shading faults more than other fault types. This also is one of the main conclusions about the most common and critical problems encountered in PV systems.
5. Conclusions and Possible Ways Forward
By interpreting the findings provided by this literature review, it can be deduced that the three main ML categories, namely, traditional ML tools, deep learning, and knowledge-driven learning with several learning paradigms (i.e., ensemble and hybrid), have numerous important characteristics, as indicated below:
- All of the ML models are subject to the MPPT conditions, excluding the work of Bakdi et al. [18], which addressed both MPPT and IPPT;
- Most of the ML models depend on data generated from simulation models;
- Traditional ML models usually have I-V/P-V signals as inputs;
- DL and knowledge-driven models are generally used to manipulate all kinds of images.
The investigation of these tools for practical purposes, where satisfactory performance measures were gained, demonstrated numerous benefits. However, some related aspects, which are the key challenges, still require a thorough evaluation. For this purpose, and as proposed solutions, further efforts need to be undertaken to provide more conclusions about using ML for CM of real PV systems, as follows:
- Launching multiple experiments on real datasets (rather than simulations only) in which heterogeneous features (i.e., I-V, P-V, temperature, radiation, etc.) and all kinds of available images (i.e., thermographic, X-ray, electroluminescence, etc.) are available;
- Providing more insights regarding the joint investigation of the huge quantity of samples and different working conditions (i.e., MPPT and IPPT), in addition to several encountered fault types;
- Assessment of DL and knowledge-driven models under this kind of complex criteria of big data and varying conditions for PV system condition monitoring;
- Using different types of data acquisition, including wired and wireless sensors, which have different sampling rates, as encountered in real CM systems.
Author Contributions
Conceptualization, T.B. (Tarek Berghout) and M.B.; methodology, T.B. (Tarek Berghout) and M.B.; validation, T.B. (Tarek Berghout), M.B., T.B. (Toufik Bentrcia), X.M., S.D. and L.-H.M.; formal analysis, T.B. (Tarek Berghout), M.B., T.B. (Toufik Bentrcia), X.M., S.D. and L.-H.M.; investigation, T.B. (Tarek Berghout) and M.B.; writing—original draft preparation, T.B. (Tarek Berghout) and M.B.; writing—review and editing, T.B. (Tarek Berghout), M.B., T.B. (Toufik Bentrcia), X.M., S.D. and L.-H.M. All authors have read and agreed to the published version of the manuscript.
Funding
This research received no external funding.
Institutional Review Board Statement
Not applicable.
Informed Consent Statement
Not applicable.
Data Availability Statement
Not applicable.
Conflicts of Interest
The authors declare no conflict of interest.
Abbreviations
| AI | Artificial Intelligence |
| BC | Bee Colony |
| BT | Bayes’ theorem |
| DARL | Dynamic Adaptive Recursive Linear |
| DBN | Deep Belief Network |
| DC | Discriminate Classifiers |
| DT | Decision Tree |
| ELM | Extreme Learning Machine |
| FSFDP | Fast Search and Find of Density Peaks |
| GANs | Generative Adversarial Networks |
| GBSSL | Graph-Based Learning |
| GPR | Gaussian Process Regression |
| IGCF | Improved Gamma Correction Function |
| IPPT | Intermediate Power Point Tracking |
| IV | Current-Voltage |
| KLD | Kullback–Leibler Divergence |
| KNN | K-Nearest Neighbor |
| LBP | Local Binary Pattern |
| LR | Logistic Regression |
| MLP | Multilayer Perceptron |
| MPPT | Maximum Power Point Trucking |
| NB | Naive Bayes |
| OGH | Oriented Gradient Histogram |
| PCA | Principal Component Analysis |
| PID | Potential Induced Degradation |
| PNN | Probabilistic Neural Networks |
| PSO | Particle Swarm Optimization |
| P-V | Power-Voltage |
| Res-GRU | Residual Gated Recurrent Unit |
| RKRF | Reduced-Kernal Random Forest |
| RSKD | Recursive Smooth Kernel Density |
| RUL | Remaining Useful Life |
| SAE | Stack of AutoEncoders |
| SP | Series-Parallel |
| SVD | Singular Value Decomposition |
| SVM | Support Vector Machines |
| t-SNE | t-distributed Stochastic Neighbor Embedding |
| UAVs | Unmanned Aerial Vehicles |
| XGBoost | eXtreme Gradient Boosting |
References
- Khadka, N.; Bista, A.; Adhikari, B.; Shrestha, A.; Bista, D.; Adhikary, B. Current Practices of Solar Photovoltaic Panel Cleaning System and Future Prospects of Machine Learning Implementation. IEEE Access 2020, 8, 135948–135962. [Google Scholar] [CrossRef]
- Benbouzid, M.; Berghout, T.; Sarma, N.; Djurović, S.; Wu, Y.; Ma, X. Intelligent Condition Monitoring of Wind Power Systems: State of the Art Review. Energies 2021, 14, 5967. [Google Scholar] [CrossRef]
- World Energy Data. World Total Final Consumption. Available online: https://www.worldenergydata.org/world-total-final-consumption/ (accessed on 15 April 2021).
- Kim, J.; Rabelo, M.; Padi, S.; Yousuf, H.; Cho, E.-C.; Yi, J. A Review of the Degradation of Photovoltaic Modules for Life Expectancy. Energies 2021, 14, 4278. [Google Scholar] [CrossRef]
- Zitouni, H.; Azouzoute, A.; Hajjaj, C.; El Ydrissi, M.; Regragui, M.; Polo, J.; Oufadel, A.; Bouaichi, A.; Ghennioui, A. Experimental investigation and modeling of photovoltaic soiling loss as a function of environmental variables: A case study of semi-arid climate. Sol. Energy Mater. Sol. Cells 2021, 221, 110874. [Google Scholar] [CrossRef]
- Garoudja, E.; Chouder, A.; Kara, K.; Silvestre, S. An enhanced machine learning based approach for failures detection and diagnosis of PV systems. Energy Convers. Manag. 2017, 151, 496–513. [Google Scholar] [CrossRef] [Green Version]
- Kang, S.; Jin, R.; Deng, X.; Kenett, R.S. Challenges of modeling and analysis in cybermanufacturing: A review from a machine learning and computation perspective. J. Intell. Manuf. 2021, 1–14. [Google Scholar] [CrossRef]
- Tu, J.; Yeoh, G.-H.; Liu, C. CFD Solution Analysis: Essentials. In Computational Fluid Dynamics; Elsevier: Amsterdam, The Netherlands, 2013; pp. 177–217. [Google Scholar]
- Willard, J.; Jia, X.; Xu, S.; Steinbach, M.; Kumar, V. Integrating Scientific Knowledge with Machine Learning for Engineering and Environmental Systems. arXiv 2020, arXiv:2003.04919. [Google Scholar]
- Lee, C.; Lim, C. From technological development to social advance: A review of Industry 4.0 through machine learning. Technol. Forecast. Soc. Chang. 2021, 167, 120653. [Google Scholar] [CrossRef]
- Sundaram, K.M.; Hussain, A.; Sanjeevikumar, P.; Holm-Nielsen, J.B.; Kaliappan, V.K.; Santhoshi, B.K. Deep Learning for Fault Diagnostics in Bearings, Insulators, PV Panels, Power Lines, and Electric Vehicle Applications—The State-of-the-Art Approaches. IEEE Access 2021, 9, 41246–41260. [Google Scholar] [CrossRef]
- Zhao, S.; Wang, H. Enabling Data-Driven Condition Monitoring of Power Electronic Systems with Artificial Intelligence: Concepts, Tools, and Developments. IEEE Power Electron. Mag. 2021, 8, 18–27. [Google Scholar] [CrossRef]
- Kurukuru, V.; Haque, A.; Khan, M.; Sahoo, S.; Malik, A.; Blaabjerg, F. A Review on Artificial Intelligence Applications for Grid-Connected Solar Photovoltaic Systems. Energies 2021, 14, 4690. [Google Scholar] [CrossRef]
- Kandeal, A.; Elkadeem, M.; Thakur, A.K.; Abdelaziz, G.B.; Sathyamurthy, R.; Kabeel, A.; Yang, N.; Sharshir, S.W. Infrared thermography-based condition monitoring of solar photovoltaic systems: A mini review of recent advances. Sol. Energy 2021, 223, 33–43. [Google Scholar] [CrossRef]
- Mellit, A.; Kalogirou, S. Artificial intelligence and internet of things to improve efficacy of diagnosis and remote sensing of solar photovoltaic systems: Challenges, recommendations and future directions. Renew. Sustain. Energy Rev. 2021, 143, 110889. [Google Scholar] [CrossRef]
- Kyi, S.; Taparugssanagorn, A. Wireless sensing for a solar power system. Digit. Commun. Netw. 2020, 6, 51–57. [Google Scholar] [CrossRef]
- Chu, Y.; Ho, C.; Lee, Y.; Li, B. Development of a Solar-Powered Unmanned Aerial Vehicle for Extended Flight Endurance. Drones 2021, 5, 44. [Google Scholar] [CrossRef]
- Bakdi, A.; Bounoua, W.; Guichi, A.; Mekhilef, S. Real-time fault detection in PV systems under MPPT using PMU and high-frequency multi-sensor data through online PCA-KDE-based multivariate KL divergence. Int. J. Electr. Power Energy Syst. 2021, 125, 106457. [Google Scholar] [CrossRef]
- Mustafa, R.J.; Gomaa, M.R.; Al-Dhaifallah, M.; Rezk, H. Environmental Impacts on the Performance of Solar Photovoltaic Systems. Sustainability 2020, 12, 608. [Google Scholar] [CrossRef] [Green Version]
- Berghout, T.; Benbouzid, M.; Ma, X.; Djurović, S.; Mouss, L.-H. Machine Learning for Photovoltaic Systems Condition Mon-itoring: A Review. In Proceedings of the IECON 2021, the 47th Annual Conference of the IEEE Industrial Electronics Society (IES), Toronto, ON, Canada, 13–16 October 2021. [Google Scholar]
- Arani, M.S.; Hejazi, M.A. The Comprehensive Study of Electrical Faults in PV Arrays. J. Electr. Comput. Eng. 2016, 2016, 8712960. [Google Scholar] [CrossRef]
- Malavya, U.; Chander, R.; Sumalatha, K. A Simple Method to Detect Partial Shading in PV Systems. In Data Engineering and Communication Technology; Lecture Notes on Data Engineering and Communications Technologies; Springer: Berlin/Heidelberg, Germany, 2021; Volume 63, pp. 17–28. [Google Scholar]
- Lin, G.; Bimenyimana, S.; Tseng, M.-L.; Wang, C.-H.; Liu, Y.; Li, L. Photovoltaic Modules Selection from Shading Effects on Different Materials. Symmetry 2020, 12, 2082. [Google Scholar] [CrossRef]
- Gosumbonggot, J.; Fujita, G. Partial Shading Detection and Global Maximum Power Point Tracking Algorithm for Photovoltaic with the Variation of Irradiation and Temperature. Energies 2019, 12, 202. [Google Scholar] [CrossRef] [Green Version]
- Gil-Velasco, A.; Aguilar-Castillo, C. A Modification of the Perturb and Observe Method to Improve the Energy Harvesting of PV Systems under Partial Shading Conditions. Energies 2021, 14, 2521. [Google Scholar] [CrossRef]
- Andrean, V.; Chang, P.C.; Lian, K.L. A Review and New Problems Discovery of Four Simple Decentralized Maximum Power Point Tracking Algorithms—Perturb and Observe, Incremental Conductance, Golden Section Search, and Newton’s Quadratic Interpolation. Energies 2018, 11, 2966. [Google Scholar] [CrossRef] [Green Version]
- Vieira, R.; de Araújo, F.; Dhimish, M.; Guerra, M. A Comprehensive Review on Bypass Diode Application on Photovoltaic Modules. Energies 2020, 13, 2472. [Google Scholar] [CrossRef]
- Frick, A.; Makrides, G.; Schubert, M.; Schlecht, M.; Georghiou, G.E. Degradation Rate Location Dependency of Photovoltaic Systems. Energies 2020, 13, 6751. [Google Scholar] [CrossRef]
- Kudelas, D.; Taušová, M.; Tauš, P.; Gabániová, L.; Koščo, J. Investigation of Operating Parameters and Degradation of Photovoltaic Panels in a Photovoltaic Power Plant. Energies 2019, 12, 3631. [Google Scholar] [CrossRef] [Green Version]
- Espionza Trejo, D.R.; Bárcenas, E.; Hernandez Díez, J.E.; Bossio, G.; Pérez, G.E. Open- and Short-Circuit Fault Identification for a Boost dc/dc Converter in PV MPPT Systems. Energies 2018, 11, 616. [Google Scholar] [CrossRef] [Green Version]
- Pei, T.; Hao, X. A Fault Detection Method for Photovoltaic Systems Based on Voltage and Current Observation and Evaluation. Energies 2019, 12, 1712. [Google Scholar] [CrossRef] [Green Version]
- Daliento, S.; Chouder, A.; Guerriero, P.; Pavan, A.M.; Mellit, A.; Moeini, R.; Tricoli, P.; Daliento, S.; Chouder, A.; Guerriero, P.; et al. Monitoring, Diagnosis, and Power Forecasting for Photovoltaic Fields: A Review. Int. J. Photoenergy 2017, 2017, 1356851. [Google Scholar] [CrossRef]
- Wang, Q.; Yu, Y.; Ahmed, H.; Darwish, M.; Nandi, A. Open-Circuit Fault Detection and Classification of Modular Multilevel Converters in High Voltage Direct Current Systems (MMC-HVDC) with Long Short-Term Memory (LSTM) Method. Sensors 2021, 21, 4159. [Google Scholar] [CrossRef] [PubMed]
- Du, B.; He, Y.; Zhang, Y. Open-Circuit Fault Diagnosis of Three-Phase PWM Rectifier Using Beetle Antennae Search Algorithm Optimized Deep Belief Network. Electronics 2020, 9, 1570. [Google Scholar] [CrossRef]
- Kumari, N.; Singh, S.; Kumari, R.; Patel, R.; Xalxo, N.A. Power System Faults: A Review. Ijert 2016, 4, 1–2. [Google Scholar]
- Prasad, A.; Edward, J.B.; Ravi, K. A review on fault classification methodologies in power transmission systems: Part—I. J. Electr. Syst. Inf. Technol. 2018, 5, 48–60. [Google Scholar] [CrossRef]
- Padilla, M.; Michl, B.; Thaidigsmann, B.; Warta, W.; Schubert, M. Short-circuit current density mapping for solar cells. Sol. Energy Mater. Sol. Cells 2014, 120, 282–288. [Google Scholar] [CrossRef]
- Shin, W.G.; Ko, S.W.; Song, H.J.; Ju, Y.C.; Hwang, H.M.; Kang, G.H. Origin of Bypass Diode Fault in c-Si Photovoltaic Modules: Leakage Current under High Surrounding Temperature. Energies 2018, 11, 2416. [Google Scholar] [CrossRef] [Green Version]
- Mishra, S.; Sharma, D. Control of photovoltaic technology. In Electric Renewable Energy Systems; Elsevier: Amsterdam, The Netherlands, 2016; pp. 457–486. [Google Scholar]
- Kebir, S.T.; Cheggaga, N.; Ilinca, A.; Boulouma, S. An Efficient Neural Network-Based Method for Diagnosing Faults of PV Array. Sustainability 2021, 13, 6194. [Google Scholar] [CrossRef]
- Allahabadi, S.; Iman-Eini, H.; Farhangi, S. Fast Artificial Neural Network based Method for Estimation of the Global Maximum Power Point in Photovoltaic Systems. IEEE Trans. Ind. Electron. 2021, 1. [Google Scholar] [CrossRef]
- Abdullah, G.; Nishimura, H.; Fujita, T. An Experimental Investigation on Photovoltaic Array Power Output Affected by the Different Partial Shading Conditions. Energies 2021, 14, 2344. [Google Scholar] [CrossRef]
- Morales-Aragonés, J.; Dávila-Sacoto, M.; González, L.; Alonso-Gómez, V.; Gallardo-Saavedra, S.; Hernández-Callejo, L. A Review of I–V Tracers for Photovoltaic Modules: Topologies and Challenges. Electronics 2021, 10, 1283. [Google Scholar] [CrossRef]
- Paul, M.M.R.; Mahalakshmi, R.; Karuppasamypandiyan, M.; Bhuvanesh, A.; Ganesh, R.J. Fault Identification and Islanding in DC Grid Connected PV System. Circuits Syst. 2016, 7, 2904–2915. [Google Scholar] [CrossRef] [Green Version]
- Ul-Haq, A.; Alammari, R.; Iqbal, A.; Jalal, M.; Gul, S. Computation of Power Extraction from Photovoltaic Arrays Under Various Fault Conditions. IEEE Access 2020, 8, 47619–47639. [Google Scholar] [CrossRef]
- Pierdicca, R.; Paolanti, M.; Felicetti, A.; Piccinini, F.; Zingaretti, P. Automatic Faults Detection of Photovoltaic Farms: solAIr, a Deep Learning-Based System for Thermal Images. Energies 2020, 13, 6496. [Google Scholar] [CrossRef]
- Ahmed, W.; Hanif, A.; Kallu, K.D.; Kouzani, A.Z.; Ali, M.U.; Zafar, A. Photovoltaic Panels Classification Using Isolated and Transfer Learned Deep Neural Models Using Infrared Thermographic Images. Sensors 2021, 21, 5668. [Google Scholar] [CrossRef] [PubMed]
- Xiao, C.; Hacke, P.; Johnston, S.; Sulas-Kern, D.B.; Jiang, C.; Al-Jassim, M. Failure analysis of field-failed bypass diodes. Prog. Photovolt. Res. Appl. 2020, 28, 909–918. [Google Scholar] [CrossRef]
- Rahman, M.R.U.; Chen, H. Defects Inspection in Polycrystalline Solar Cells Electroluminescence Images Using Deep Learning. IEEE Access 2020, 8, 40547–40558. [Google Scholar] [CrossRef]
- Akram, M.W.; Li, G.; Jin, Y.; Chen, X.; Zhu, C.; Zhao, X.; Khaliq, A.; Faheem, M.; Ahmad, A. CNN based automatic detection of photovoltaic cell defects in electroluminescence images. Energy 2019, 189, 116319. [Google Scholar] [CrossRef]
- Deitsch, S.; Christlein, V.; Berger, S.; Buerhop-Lutz, C.; Maier, A.; Gallwitz, F.; Riess, C. Automatic classification of defective photovoltaic module cells in electroluminescence images. Sol. Energy 2019, 185, 455–468. [Google Scholar] [CrossRef] [Green Version]
- Deitsch, S.; Buerhop-Lutz, C.; Sovetkin, E.; Steland, A.; Maier, A.; Gallwitz, F.; Riess, C. Segmentation of photovoltaic module cells in uncalibrated electroluminescence images. Mach. Vis. Appl. 2021, 32, 84. [Google Scholar] [CrossRef]
- Derhab, A.; Bouras, A.; Belaoued, M.; Maglaras, L.; Khan, F.A. Two-Hop Monitoring Mechanism Based on Relaxed Flow Conservation Constraints against Selective Routing Attacks in Wireless Sensor Networks. Sensors 2020, 20, 6106. [Google Scholar] [CrossRef]
- Lykou, G.; Moustakas, D.; Gritzalis, D. Defending Airports from UAS: A Survey on Cyber-Attacks and Counter-Drone Sensing Technologies. Sensors 2020, 20, 3537. [Google Scholar] [CrossRef] [PubMed]
- Henry, C.; Poudel, S.; Lee, S.-W.; Jeong, H. Automatic Detection System of Deteriorated PV Modules Using Drone with Thermal Camera. Appl. Sci. 2020, 10, 3802. [Google Scholar] [CrossRef]
- Quater, P.B.; Grimaccia, F.; Leva, S.; Mussetta, M.; Aghaei, M. Light Unmanned Aerial Vehicles (UAVs) for Cooperative Inspection of PV Plants. IEEE J. Photovolt. 2014, 4, 1107–1113. [Google Scholar] [CrossRef] [Green Version]
- Berghout, T.; Mouss, L.-H.; Bentrcia, T.; Elbouchikhi, E.; Benbouzid, M. A deep supervised learning approach for condition-based maintenance of naval propulsion systems. Ocean Eng. 2021, 221, 108525. [Google Scholar] [CrossRef]
- Schmidhuber, J. Deep learning in neural networks: An overview. Neural Netw. 2015, 61, 85–117. [Google Scholar] [CrossRef] [Green Version]
- Rao, B.K.N. The Role of Artificial Intelligence (AI) in Condition Monitoring and Diagnostic Engineering Management (COMADEM): A Literature Survey. Am. J. Artif. Intell. 2021, 5, 17. [Google Scholar] [CrossRef]
- Momeni, H.; Sadoogi, N.; Farrokhifar, M.; Gharibeh, H.F. Fault Diagnosis in Photovoltaic Arrays Using GBSSL Method and Proposing a Fault Correction System. IEEE Trans. Ind. Inform. 2020, 16, 5300–5308. [Google Scholar] [CrossRef]
- Maaløe, L.; Winther, O.; Spataru, S.; Sera, D. Condition Monitoring in Photovoltaic Systems by Semi-Supervised Machine Learning. Energies 2020, 13, 584. [Google Scholar] [CrossRef] [Green Version]
- Lazzaretti, A.E.; Da Costa, C.H.; Rodrigues, M.P.; Yamada, G.D.; Lexinoski, G.; Moritz, G.L.; Oroski, E.; De Goes, R.E.; Linhares, R.R.; Stadzisz, P.C.; et al. A Monitoring System for Online Fault Detection and Classification in Photovoltaic Plants. Sensors 2020, 20, 4688. [Google Scholar] [CrossRef]
- Dhibi, K.; Fezai, R.; Mansouri, M.; Trabelsi, M.; Kouadri, A.; Bouzara, K.; Nounou, H.; Nounou, M. Reduced Kernel Random Forest Technique for Fault Detection and Classification in Grid-Tied PV Systems. IEEE J. Photovolt. 2020, 10, 1864–1871. [Google Scholar] [CrossRef]
- Huang, J.-M.; Wai, R.-J.; Yang, G.-J. Design of Hybrid Artificial Bee Colony Algorithm and Semi-Supervised Extreme Learning Machine for PV Fault Diagnoses by Considering Dust Impact. IEEE Trans. Power Electron. 2020, 35, 7086–7099. [Google Scholar] [CrossRef]
- Eskandari, A.; Milimonfared, J.; Aghaei, M. Line-line fault detection and classification for photovoltaic systems using ensemble learning model based on I-V characteristics. Sol. Energy 2020, 211, 354–365. [Google Scholar] [CrossRef]
- Eskandari, A.; Milimonfared, J.; Aghaei, M. Fault Detection and Classification for Photovoltaic Systems Based on Hierarchical Classification and Machine Learning Technique. IEEE Trans. Ind. Electron. 2021, 68, 12750–12759. [Google Scholar] [CrossRef]
- Edun, A.S.; La Flamme, C.; Kingston, S.R.; Tetali, H.V.; Benoit, E.J.; Scarpulla, M.; Furse, C.M.; Harley, J.B. Finding Faults in PV Systems: Supervised and Unsupervised Dictionary Learning with SSTDR. IEEE Sens. J. 2021, 21, 4855–4865. [Google Scholar] [CrossRef]
- Hajji, M.; Harkat, M.-F.; Kouadri, A.; Abodayeh, K.; Mansouri, M.; Nounou, H.; Nounou, M. Multivariate feature extraction based supervised machine learning for fault detection and diagnosis in photovoltaic systems. Eur. J. Control. 2021, 59, 313–321. [Google Scholar] [CrossRef]
- Harrou, F.; Saidi, A.; Sun, Y.; Khadraoui, S. Monitoring of Photovoltaic Systems Using Improved Kernel-Based Learning Schemes. IEEE J. Photovolt. 2021, 11, 806–818. [Google Scholar] [CrossRef]
- Ali, M.U.; Khan, H.F.; Masud, M.; Kallu, K.D.; Zafar, A. A machine learning framework to identify the hotspot in photovoltaic module using infrared thermography. Sol. Energy 2020, 208, 643–651. [Google Scholar] [CrossRef]
- Dhimish, M. Defining the best-fit machine learning classifier to early diagnose photovoltaic solar cells hot-spots. Case Stud. Therm. Eng. 2021, 25, 100980. [Google Scholar] [CrossRef]
- Bakdi, A.; Guichi, A.; Mekhilef, S.; Bounoua, W. GPVS-Faults: Experimental Data for Fault Scenarios in Grid-Connected PV Systems under MPPT and IPPT Modes. Available online: https://data.mendeley.com/datasets/n76t439f65/1 (accessed on 20 September 2021).
- Lazzaretti, A.E.; da Costa, C.H.; Rodrigues, M.P.; Yamada, G.D.; Lexinoski, G.; Moritz, G.L.; Oroski, E.; de Goes, R.E.; Linhares, R.R.; Stadzisz, P.C.; et al. PV Fault Dataset. Available online: https://github.com/clayton-h-costa/pv_fault_dataset (accessed on 20 September 2021).
- Hinton, G.E. Deep belief networks. Scholarpedia 2009, 4, 5947. [Google Scholar] [CrossRef]
- LeCun, Y.; Bottou, L.; Bengio, Y.; Haffner, P. Gradient-based learning applied to document recognition. Proc. IEEE 1998, 86, 2278–2324. [Google Scholar] [CrossRef] [Green Version]
- Liu, Y.; Ding, K.; Zhang, J.; Li, Y.; Yang, Z.; Zheng, W.; Chen, X. Fault diagnosis approach for photovoltaic array based on the stacked auto-encoder and clustering with I-V curves. Energy Convers. Manag. 2021, 245, 114603. [Google Scholar] [CrossRef]
- Appiah, A.Y.; Zhang, X.; Ayawli, B.B.K.; Kyeremeh, F. Long Short-Term Memory Networks Based Automatic Feature Extraction for Photovoltaic Array Fault Diagnosis. IEEE Access 2019, 7, 30089–30101. [Google Scholar] [CrossRef]
- Gao, W.; Wai, R.-J. A Novel Fault Identification Method for Photovoltaic Array via Convolutional Neural Network and Residual Gated Recurrent Unit. IEEE Access 2020, 8, 159493–159510. [Google Scholar] [CrossRef]
- Li, X.; Yang, Q.; Lou, Z.; Yan, W. Deep Learning Based Module Defect Analysis for Large-Scale Photovoltaic Farms. IEEE Trans. Energy Convers. 2019, 34, 520–529. [Google Scholar] [CrossRef]
- Li, X.; Li, W.; Yang, Q.; Yan, W.; Zomaya, A.Y. An Unmanned Inspection System for Multiple Defects Detection in Photovoltaic Plants. IEEE J. Photovolt. 2019, 10, 568–576. [Google Scholar] [CrossRef]
- Hwang, H.P.-C.; Ku, C.C.-Y.; Chan, J.C.-C. Detection of Malfunctioning Photovoltaic Modules Based on Machine Learning Algorithms. IEEE Access 2021, 9, 37210–37219. [Google Scholar] [CrossRef]
- Venkatesh, S.N.; Sugumaran, V. Fault Detection in aerial images of photovoltaic modules based on Deep learning. IOP Conf. Ser. Mater. Sci. Eng. 2021, 1012, 012030. [Google Scholar] [CrossRef]
- Sizkouhi, A.M.; Aghaei, M.; Esmailifar, S.M. A deep convolutional encoder-decoder architecture for autonomous fault detection of PV plants using multi-copters. Sol. Energy 2021, 223, 217–228. [Google Scholar] [CrossRef]
- Manno, D.; Cipriani, G.; Ciulla, G.; Di Dio, V.; Guarino, S.; Lo Brano, V. Deep learning strategies for automatic fault diagnosis in photovoltaic systems by thermographic images. Energy Convers. Manag. 2021, 241, 114315. [Google Scholar] [CrossRef]
- Brabec, C.; Camus, C.; Hauch, J.; Doll, B.; Berger, S.; Gallwitz, F.; Maier, A.; Deitsch, S.; Buerhop-Lutz, C. A Benchmark for Visual Identification of Defective Solar Cells in Electroluminescence Imagery. In Proceedings of the 35th European PV Solar Energy Conference and Exhibition, Brussels, Belgium, 24–28 September 2018. [Google Scholar]
- Pierdicca, R.; Paolanti, M.; Felicetti, A.; Piccinini, F.; Zingaretti, P. Photovoltaic Thermal Images Dataset. Available online: https://vrai.dii.univpm.it/content/photovoltaic-thermal-images-dataset (accessed on 20 September 2021).
- Eder, G.C.; Voronko, Y.; Hirschl, C.; Ebner, R.; Ujvari, G.; Muhleisen, W. Non-Destructive Failure Detection and Visualization of Artificially and Naturally Aged PV Modules. Energies 2018, 11, 1053. [Google Scholar] [CrossRef] [Green Version]
- Berghout, T.; Benbouzid, M.; Mouss, L.-H. Leveraging Label Information in a Knowledge-Driven Approach for Rolling-Element Bearings Remaining Useful Life Prediction. Energies 2021, 14, 2163. [Google Scholar] [CrossRef]
- Theis, L.; van den Oord, A.; Bethge, M. A note on the evaluation of generative models. arXiv 2015, arXiv:1511.01844. [Google Scholar]
- Zhao, H.; des Combes, R.T.; Zhang, K.; Gordon, G.J. On learning invariant representations for domain adaptation. In Proceedings of the 36th International Conference on Machine Learning, Long Beach, CA, USA, 9–15 June 2019; pp. 12985–12999. [Google Scholar]
- Baktashmotlagh, M.; Harandi, M.T.; Lovell, B.C.; Salzmann, M. Unsupervised Domain Adaptation by Domain Invariant Projection. In Proceedings of the 2013 IEEE International Conference on Computer Vision, Nice, France, 13–16 October 2013; pp. 769–776. [Google Scholar]
- Bai, W.; Quan, C.; Luo, Z.-W. Improving Generative and Discriminative Modelling Performance by Implementing Learning Constraints in Encapsulated Variational Autoencoders. Appl. Sci. 2019, 9, 2551. [Google Scholar] [CrossRef] [Green Version]
- Song, Z.; Sun, J.; Yu, J. Object Tracking by a Combination of Discriminative Global and Generative Multi-Scale Local Models. Information 2017, 8, 43. [Google Scholar] [CrossRef] [Green Version]
- Kusiak, A. Convolutional and generative adversarial neural networks in manufacturing. Int. J. Prod. Res. 2020, 58, 1594–1604. [Google Scholar] [CrossRef]
- Serin, G.; Sener, B.; Ozbayoglu, A.M.; Unver, H.O. Review of tool condition monitoring in machining and opportunities for deep learning. Int. J. Adv. Manuf. Technol. 2020, 109, 953–974. [Google Scholar] [CrossRef]
- Goodfellow, I.J.; Pouget-Abadie, J.; Mirza, M.; Xu, B.; Warde-Farley, D.; Ozair, S.; Courville, A.; Bengio, Y. Generative Adversarial Networks. arXiv 2014, arXiv:1406.2661. [Google Scholar] [CrossRef]
- Weiss, K.; Khoshgoftaar, T.M.; Wang, D. A survey of transfer learning. J. Big Data 2016, 3, 1. [Google Scholar] [CrossRef] [Green Version]
- Long, M.; Wang, J.; Ding, G.; Pan, S.J.; Yu, P.S. Adaptation Regularization: A General Framework for Transfer Learning. IEEE Trans. Knowl. Data Eng. 2014, 26, 1076–1089. [Google Scholar] [CrossRef]
- Lu, S.; Sirojan, T.; Phung, B.T.; Zhang, D.; Ambikairajah, E. DA-DCGAN: An Effective Methodology for DC Series Arc Fault Diagnosis in Photovoltaic Systems. IEEE Access 2019, 7, 45831–45840. [Google Scholar] [CrossRef]
- Lu, S.; Ma, R.; Sirojan, T.; Phung, B.; Zhang, D. Lightweight transfer nets and adversarial data augmentation for photovoltaic series arc fault detection with limited fault data. Int. J. Electr. Power Energy Syst. 2021, 130, 107035. [Google Scholar] [CrossRef]
- Tang, W.; Yang, Q.; Xiong, K.; Yan, W. Deep learning based automatic defect identification of photovoltaic module using electroluminescence images. Sol. Energy 2020, 201, 453–460. [Google Scholar] [CrossRef]
- Akram, M.W.; Li, G.; Jin, Y.; Chen, X.; Zhu, C.; Ahmad, A. Automatic detection of photovoltaic module defects in infrared images with isolated and develop-model transfer deep learning. Sol. Energy 2020, 198, 175–186. [Google Scholar] [CrossRef]
- RETScreen International. RETScreen Software Online User Manual; CANMET Energy Technology Centre: Varennes, QC, Canada, 2005. [Google Scholar]
- Niazi, K.A.K.; Akhtar, W.; Khan, H.A.; Yang, Y.; Athar, S. Hotspot diagnosis for solar photovoltaic modules using a Naive Bayes classifier. Sol. Energy 2019, 190, 34–43. [Google Scholar] [CrossRef]
Figure 1.
Common failures types in PV systems.

Figure 2.
An example of reducing partial shading effects with bypass diodes: (a) I-V curves; (b) P-V curves. Reproduced from [27], MDPI: 2020.
Figure 2.
An example of reducing partial shading effects with bypass diodes: (a) I-V curves; (b) P-V curves. Reproduced from [27], MDPI: 2020.

Figure 3.
Illustration of common degradation types in PV modules. Reproduced from [4], MDPI: 2021.
Figure 3.
Illustration of common degradation types in PV modules. Reproduced from [4], MDPI: 2021.

Figure 4.
I-V and P-V curves for different fault types: (a) P-V curves; (b) I-V curves. Reproduced from [31], MDPI: 2019.
Figure 4.
I-V and P-V curves for different fault types: (a) P-V curves; (b) I-V curves. Reproduced from [31], MDPI: 2019.

Figure 5.
External quantum efficiency maps for healthy and faulty industrial solar cells: (a) ordinary map of a healthy cell; (b) map of a PV cell under short-circuit conditions. Reproduced from [37], Elsevier: 2014.
Figure 5.
External quantum efficiency maps for healthy and faulty industrial solar cells: (a) ordinary map of a healthy cell; (b) map of a PV cell under short-circuit conditions. Reproduced from [37], Elsevier: 2014.

Figure 6.
X-ray photos of bypass diode in normal and unhealthy condition (a) normal operating bypass diode; (b) faulty bypass diode. Reproduced from [38], MDPI: 2018.
Figure 6.
X-ray photos of bypass diode in normal and unhealthy condition (a) normal operating bypass diode; (b) faulty bypass diode. Reproduced from [38], MDPI: 2018.

Figure 7.
P-V curves under different architectures and operating conditions: (a) P-V curves under normal operating condition; (b) P-V curves under bridge fault (polycrystalline); (c) P-V curves under bridge fault (copper indium gallium selenide). Reproduced from [45], IEEE: 2020.
Figure 7.
P-V curves under different architectures and operating conditions: (a) P-V curves under normal operating condition; (b) P-V curves under bridge fault (polycrystalline); (c) P-V curves under bridge fault (copper indium gallium selenide). Reproduced from [45], IEEE: 2020.

Figure 8.
Classification of sensor types used for PV system monitoring.

Figure 9.
Different steps of constructing a machine learning predictive model. Reproduced from [57], Elsevier: 2021.
Figure 9.
Different steps of constructing a machine learning predictive model. Reproduced from [57], Elsevier: 2021.

Figure 10.
Classification of ML approaches.

Figure 11.
An overview of data distribution analysis for ML tool applications in CM of PV systems: (a) ML categories; (b) PV fault types; (c) detection method types.
Figure 11.
An overview of data distribution analysis for ML tool applications in CM of PV systems: (a) ML categories; (b) PV fault types; (c) detection method types.


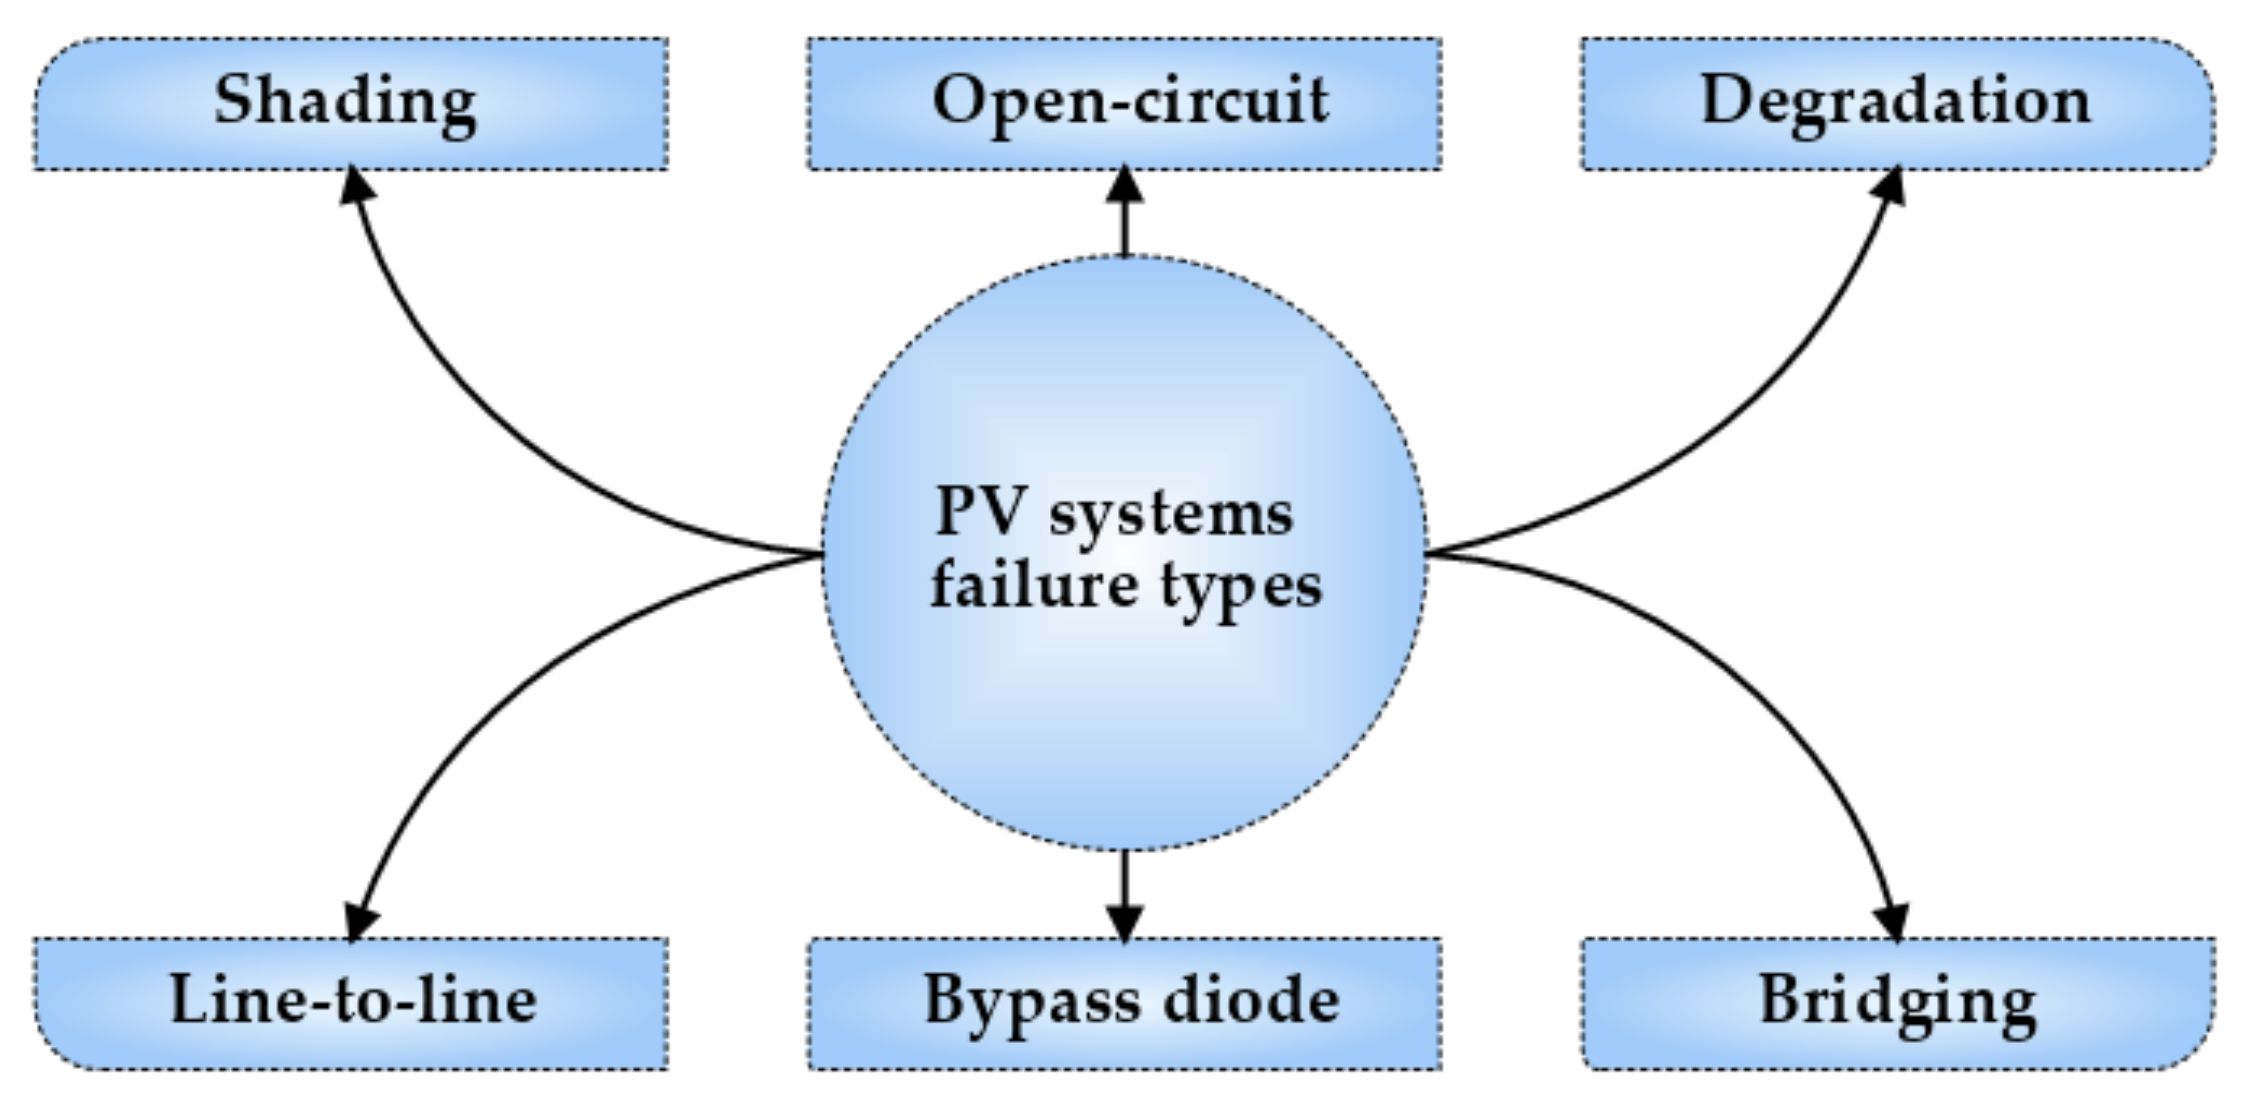
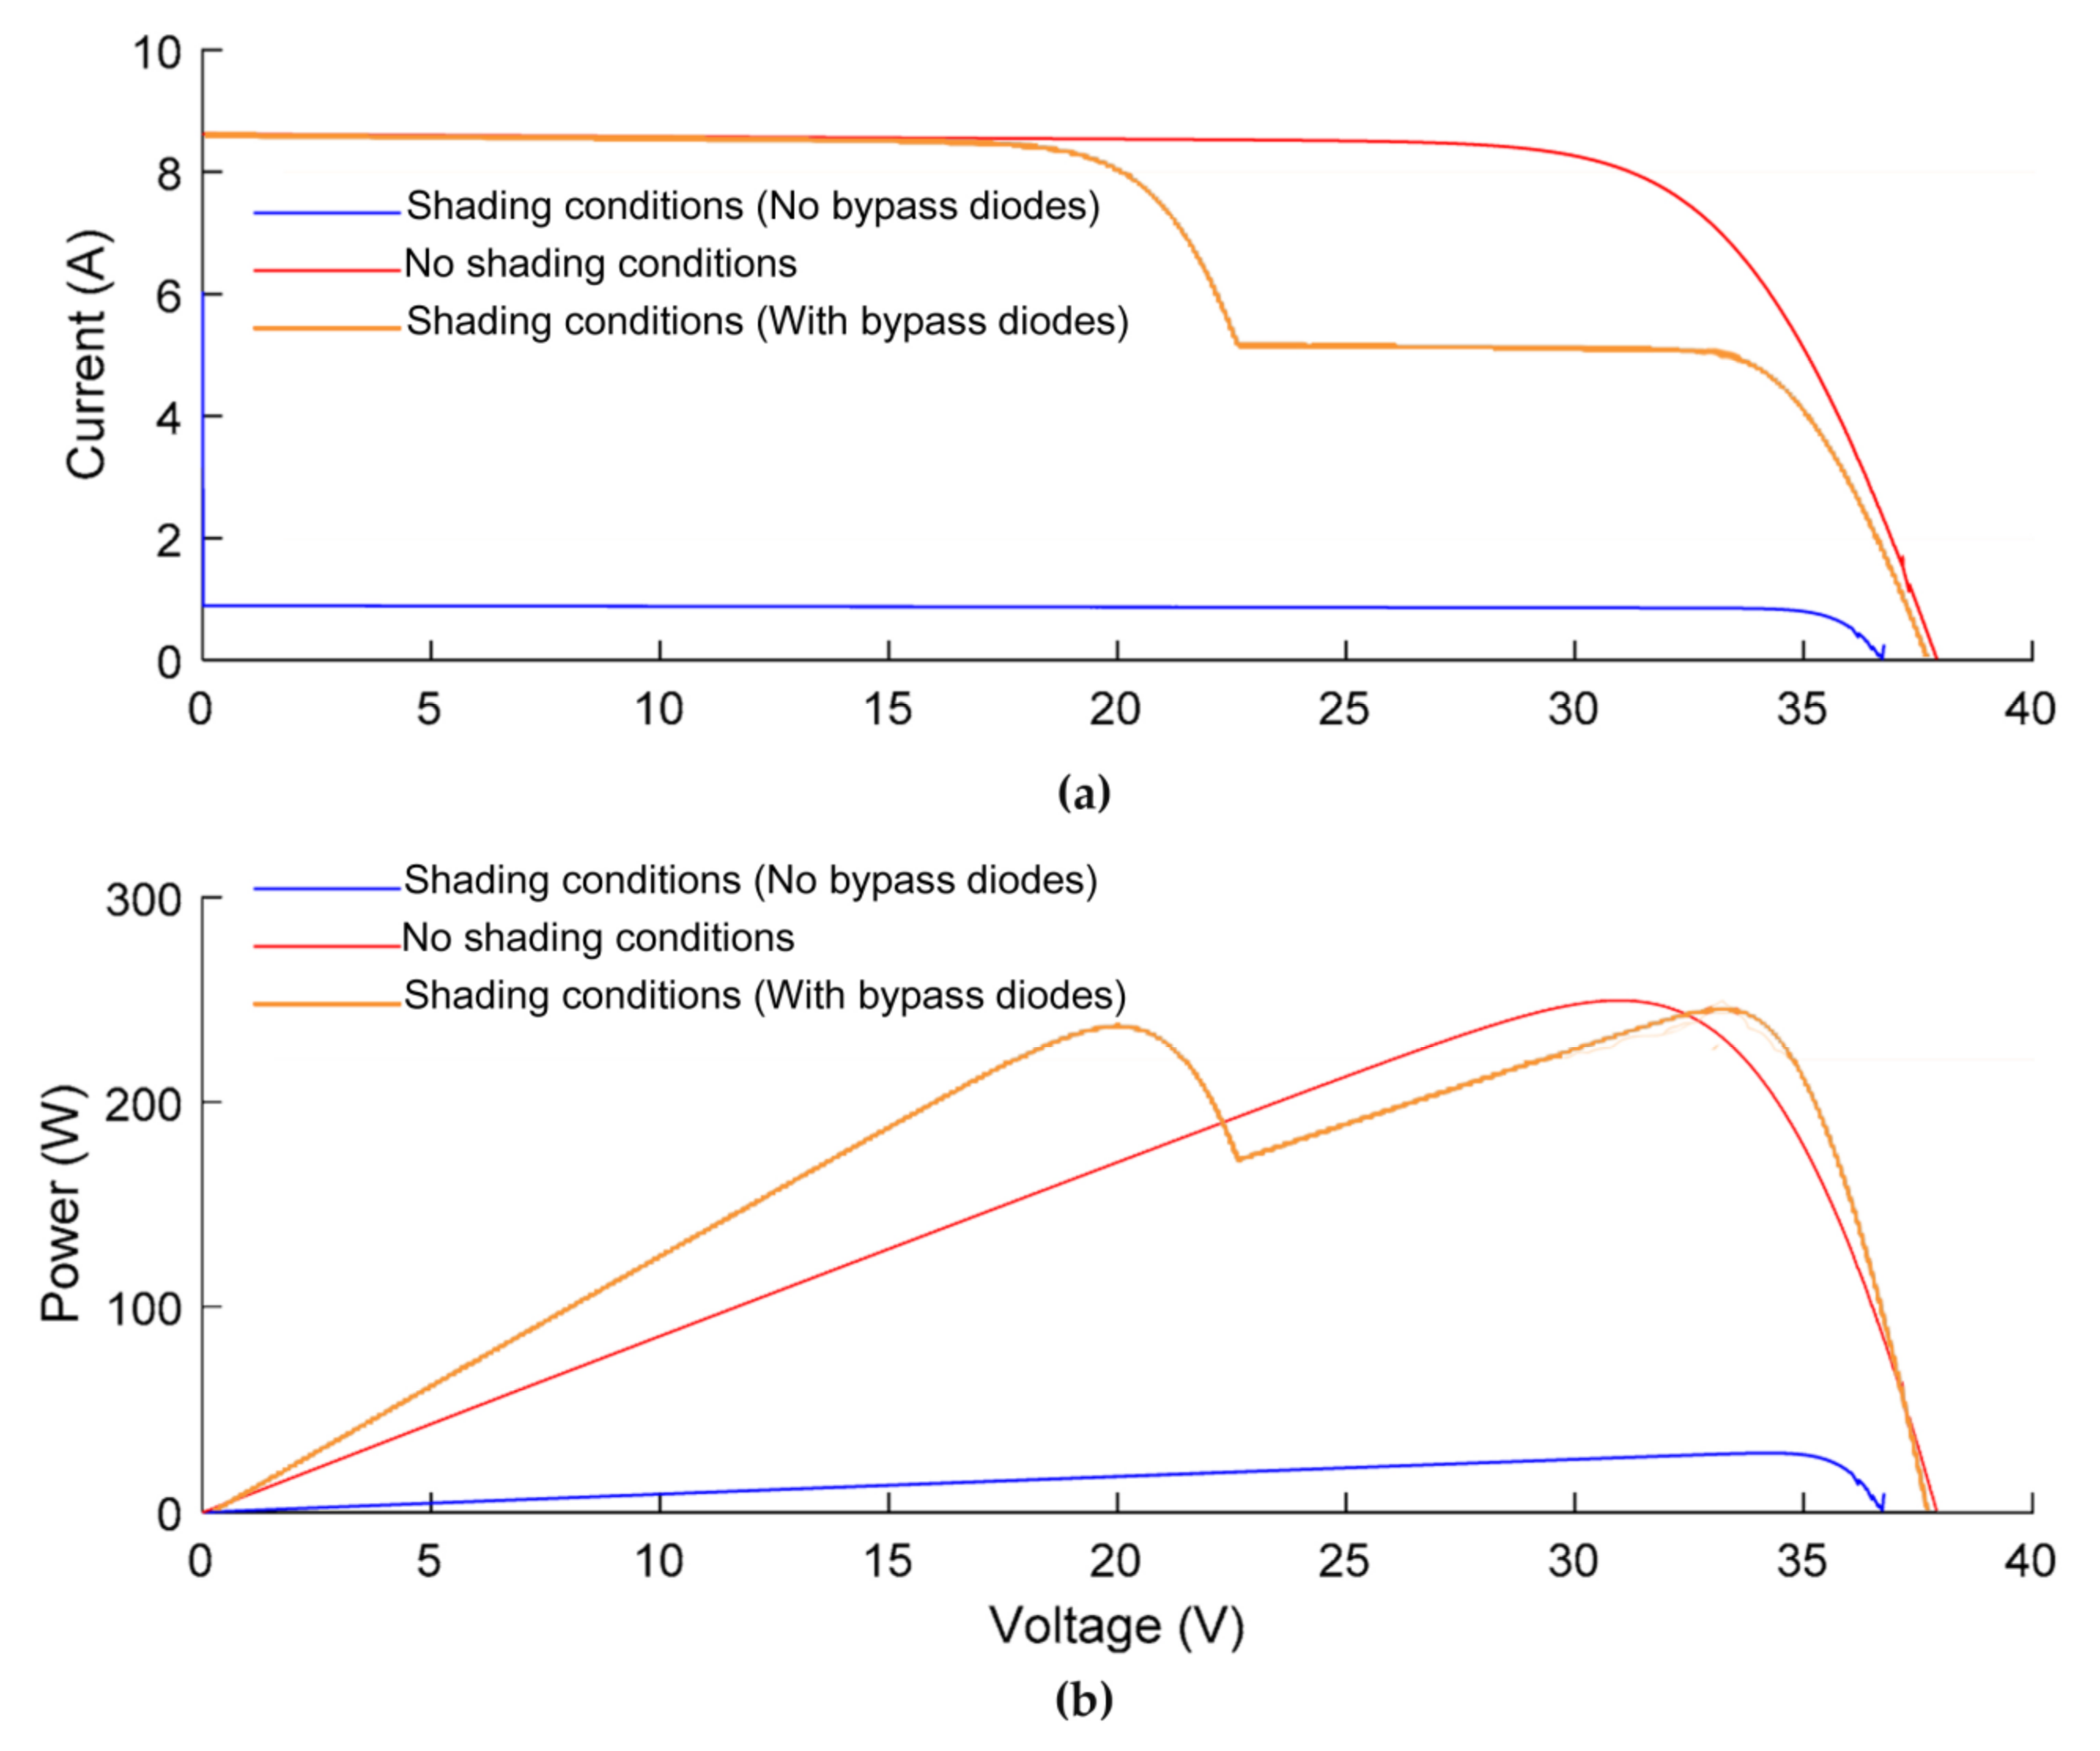
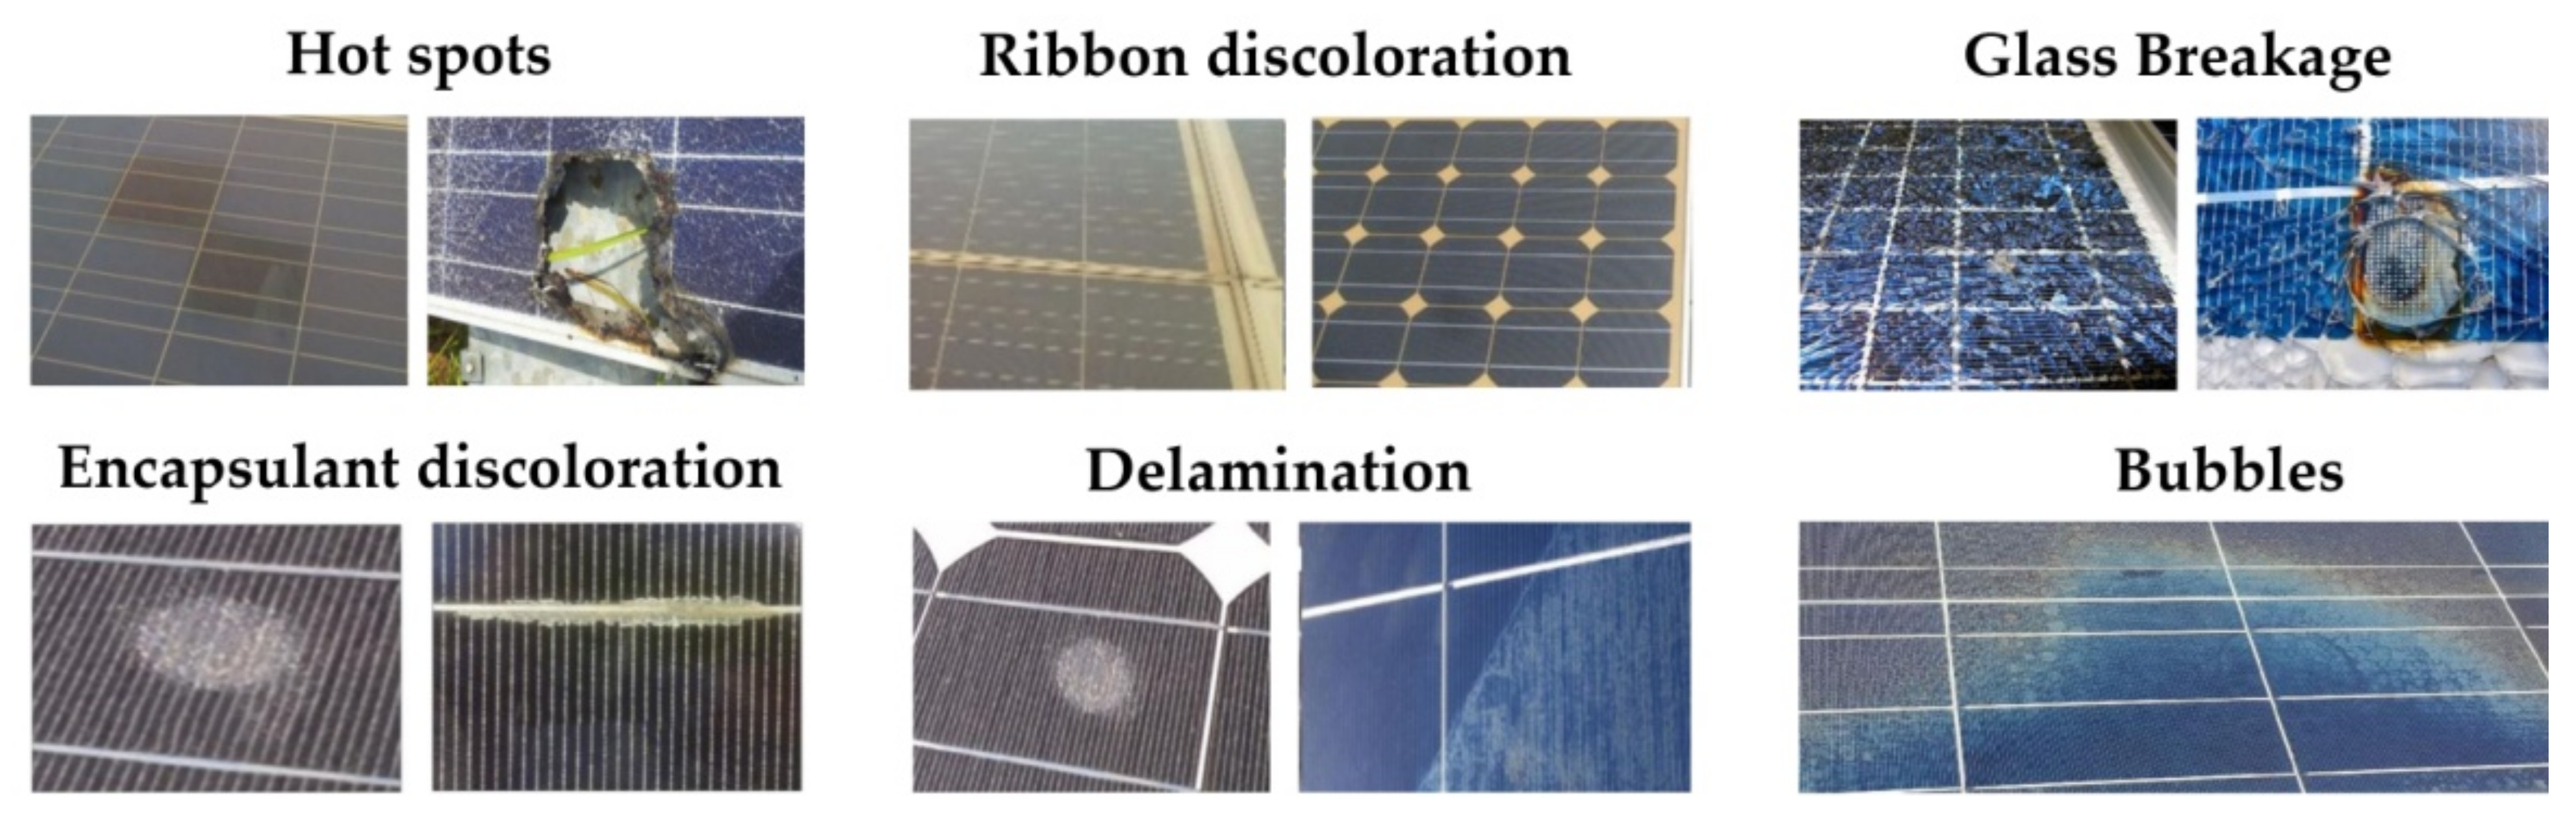
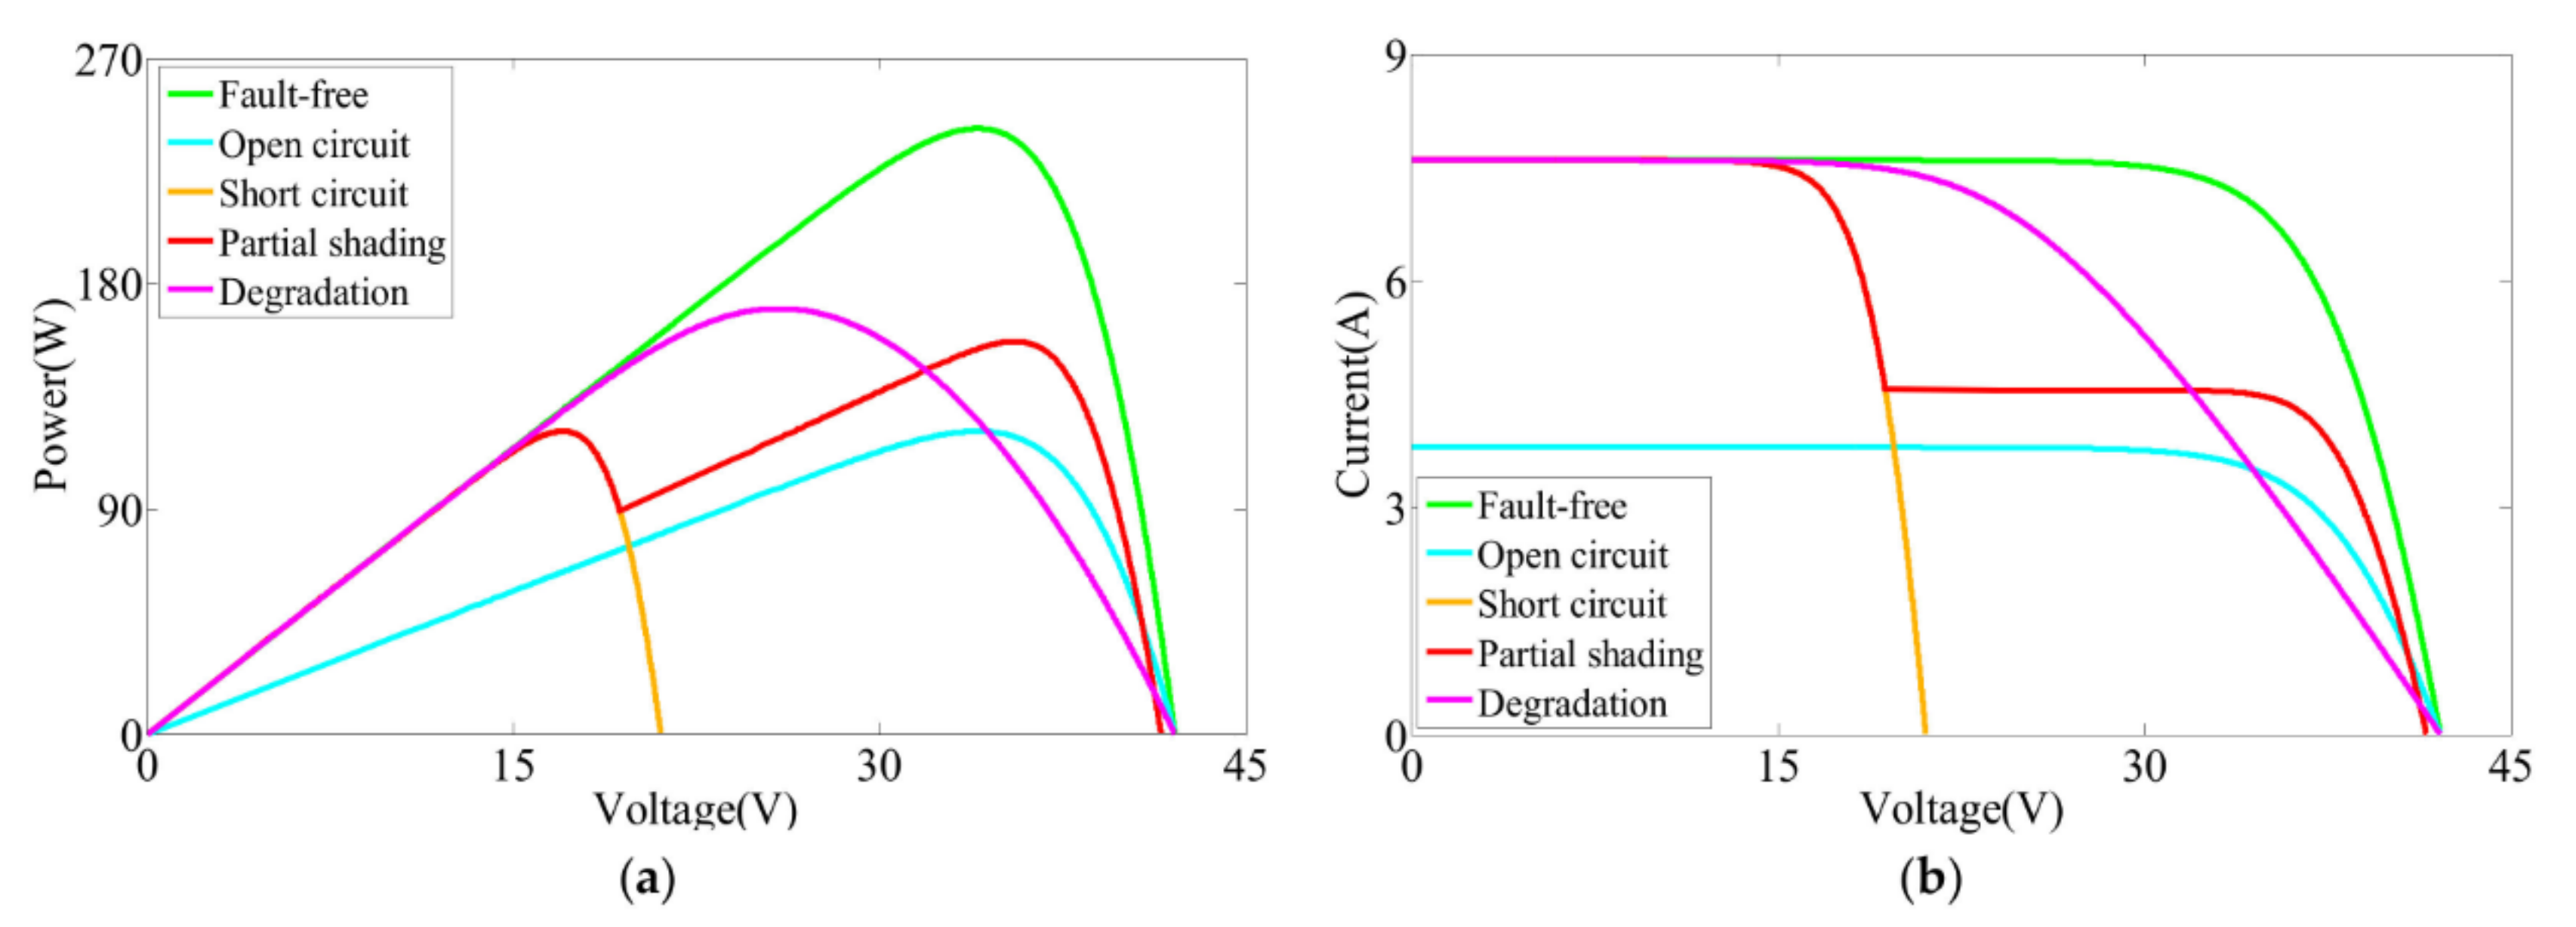
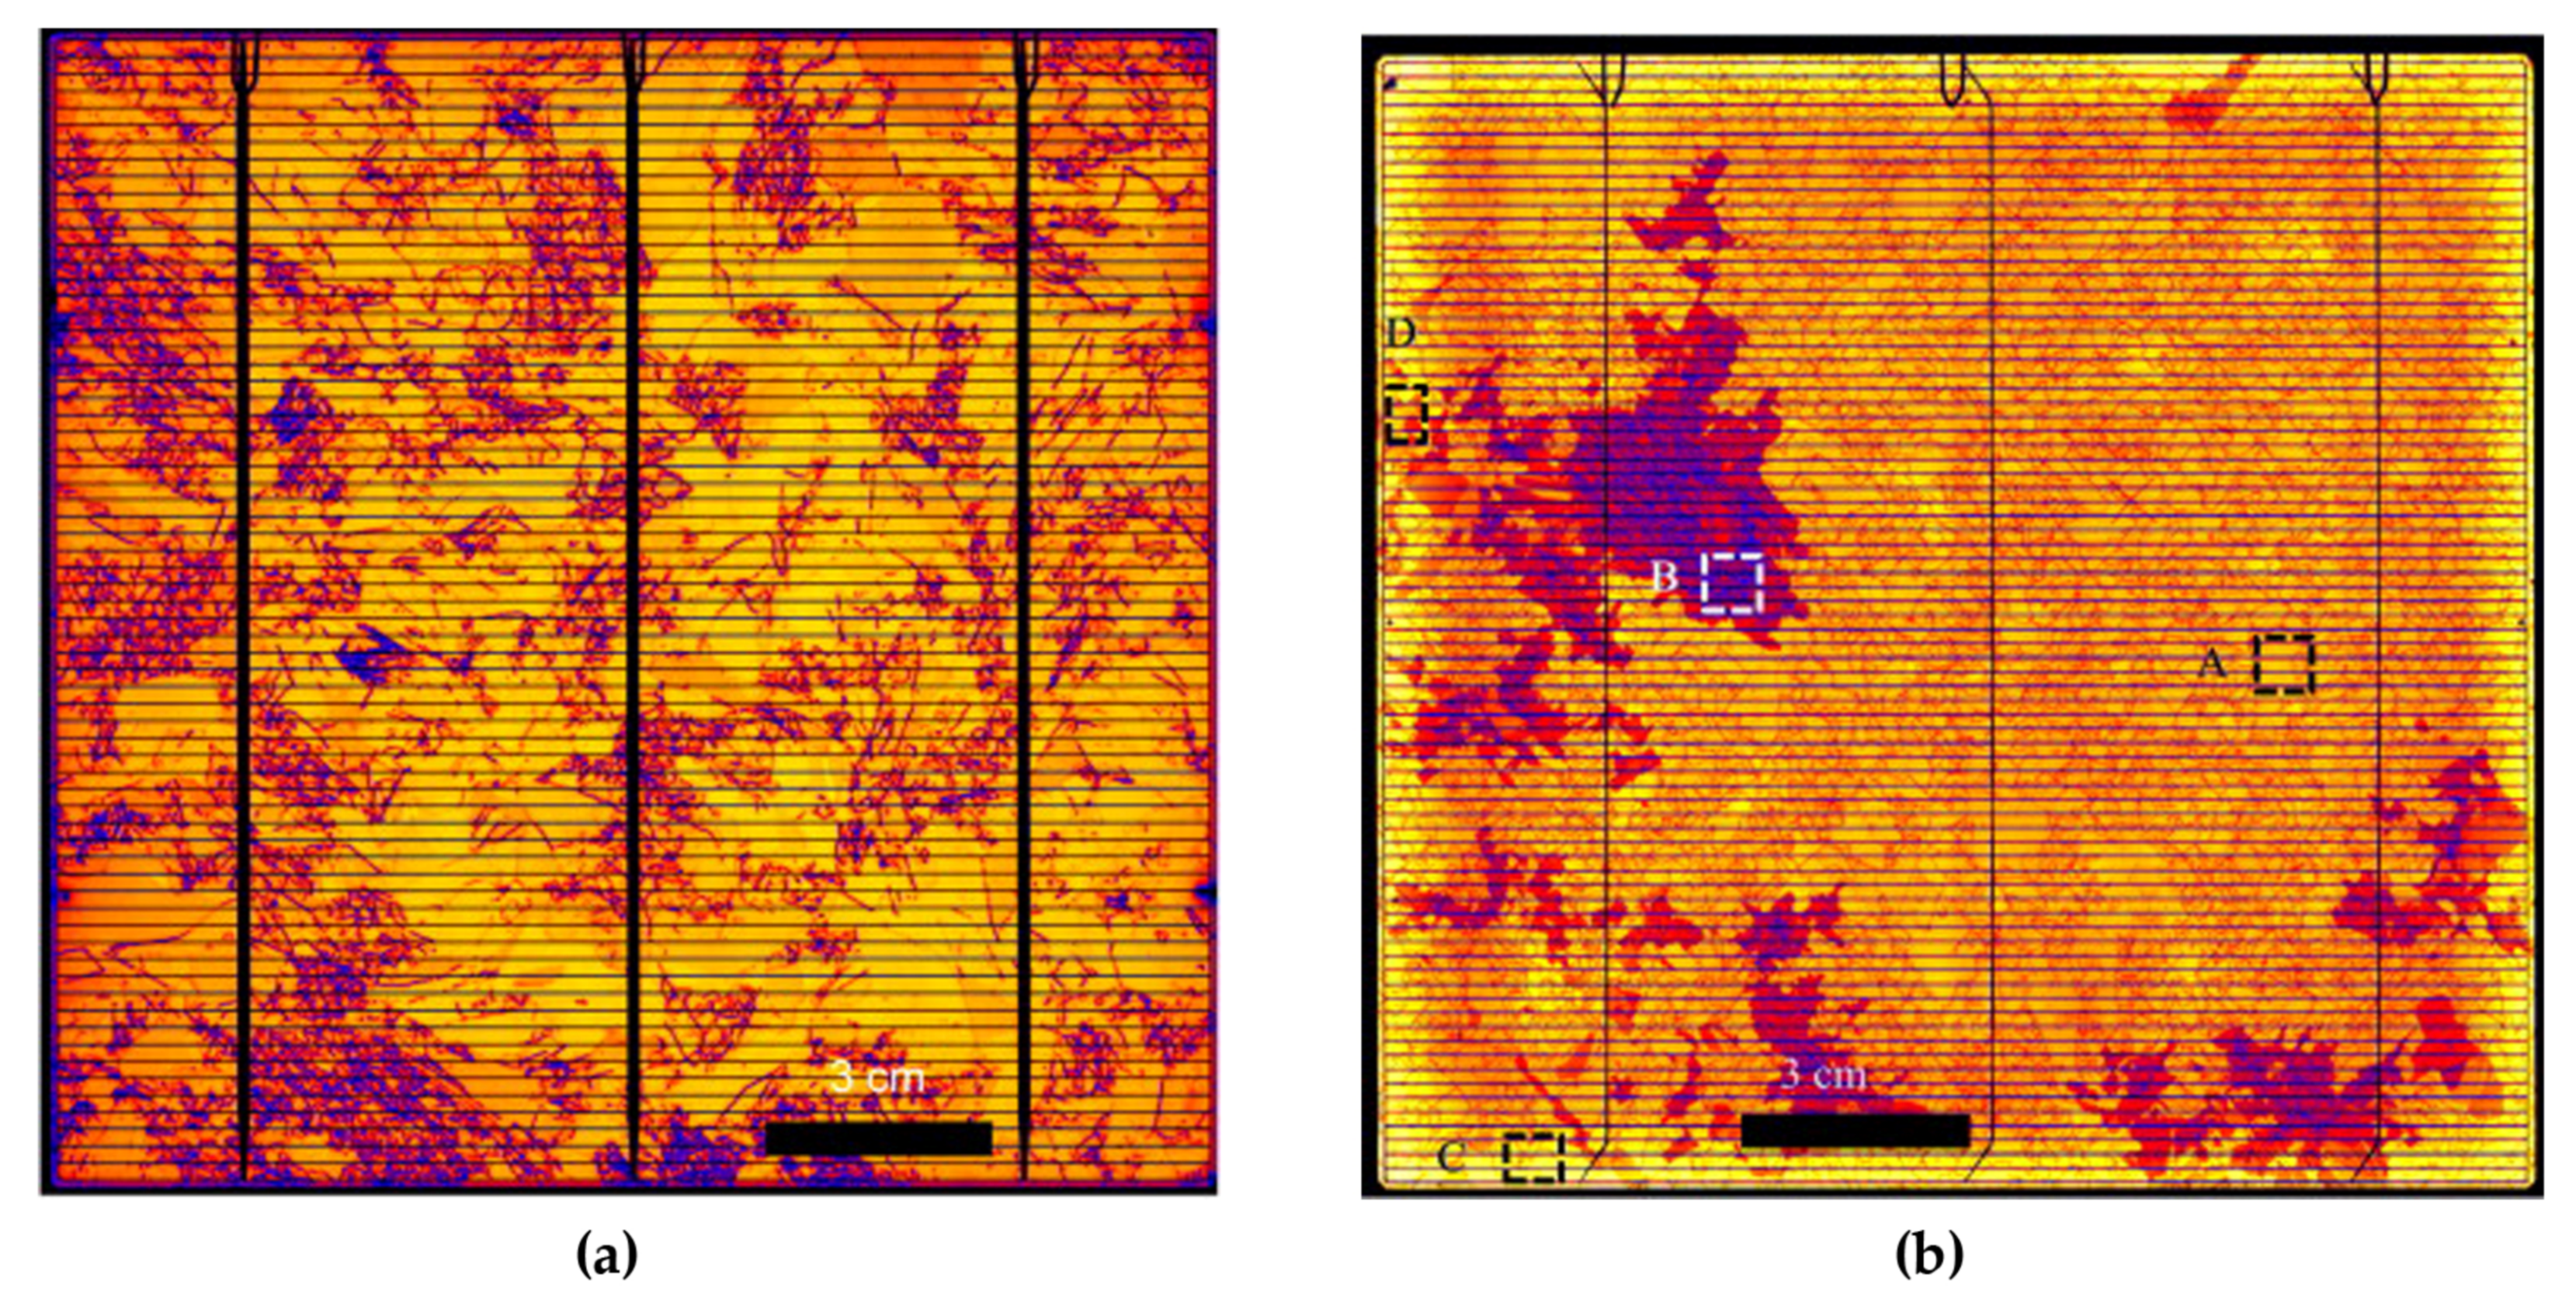
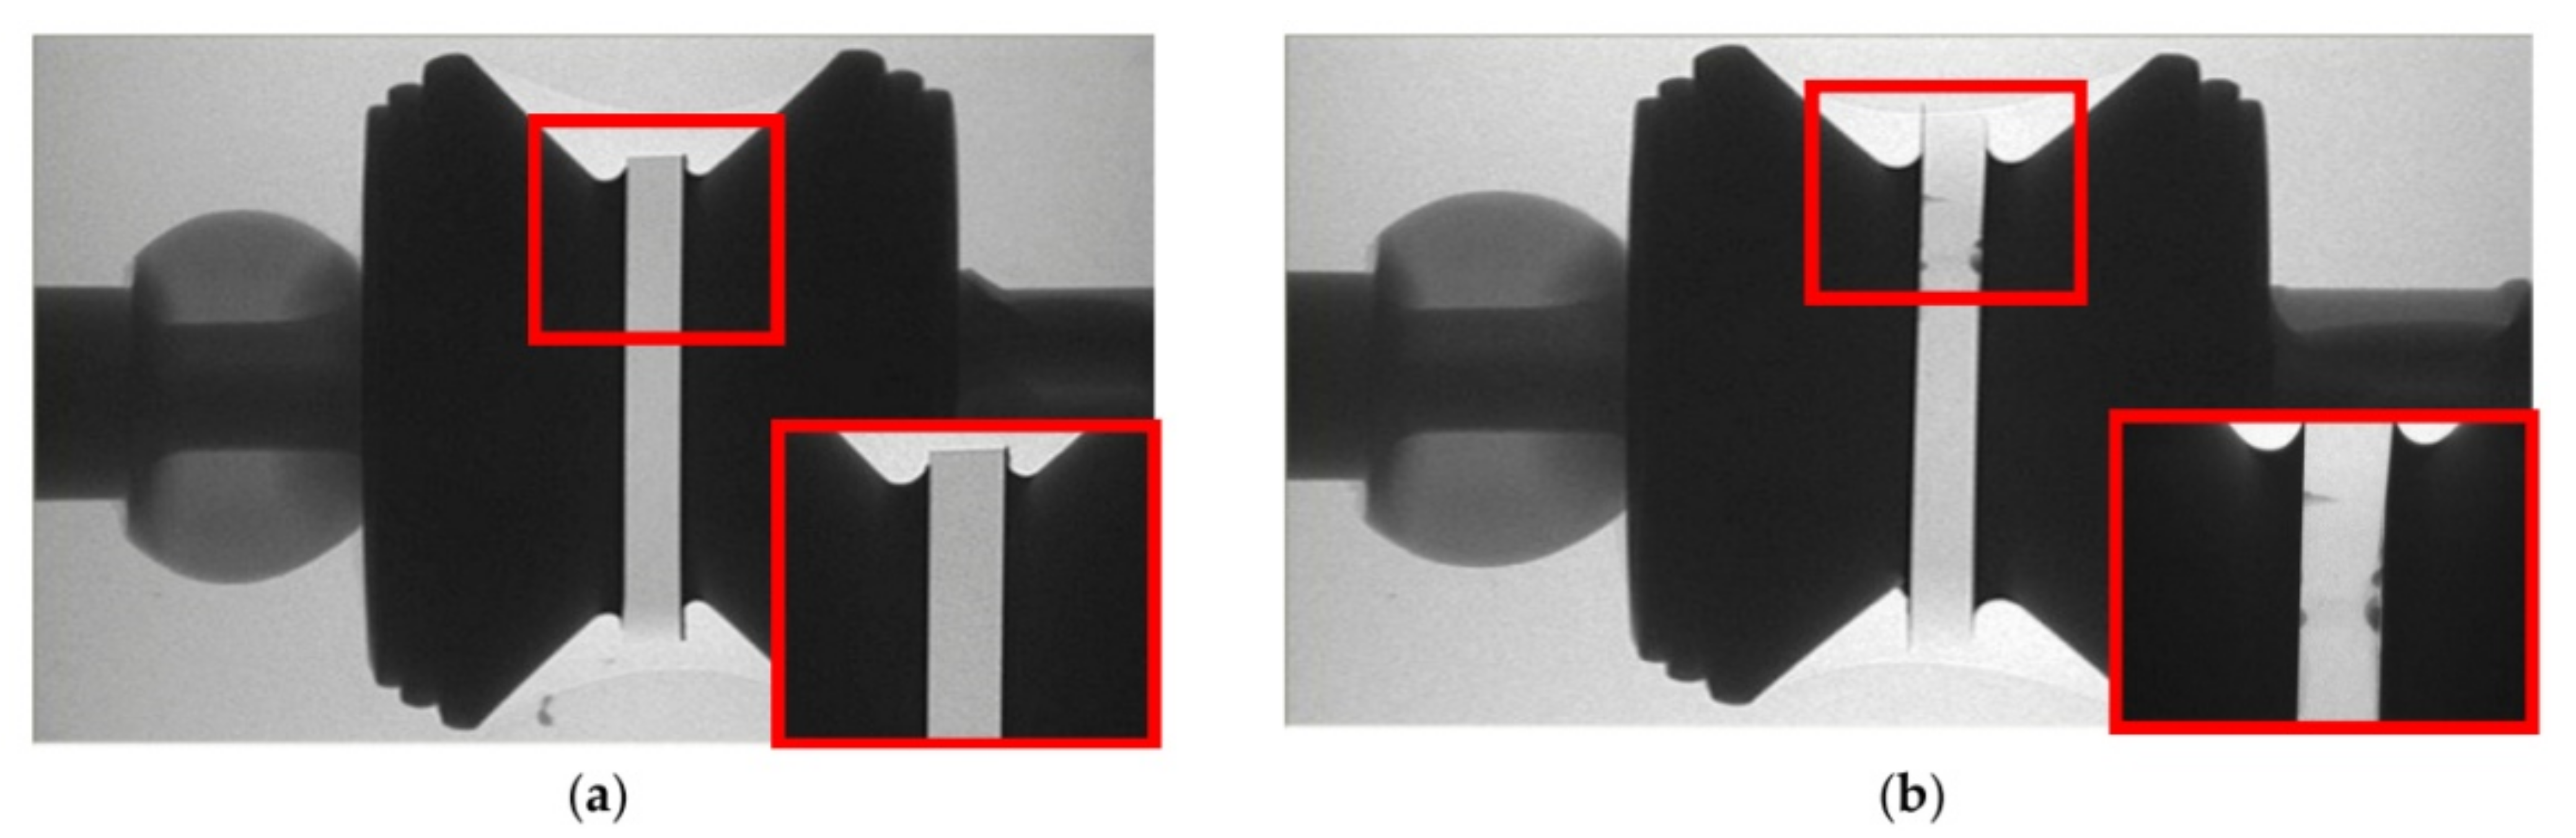
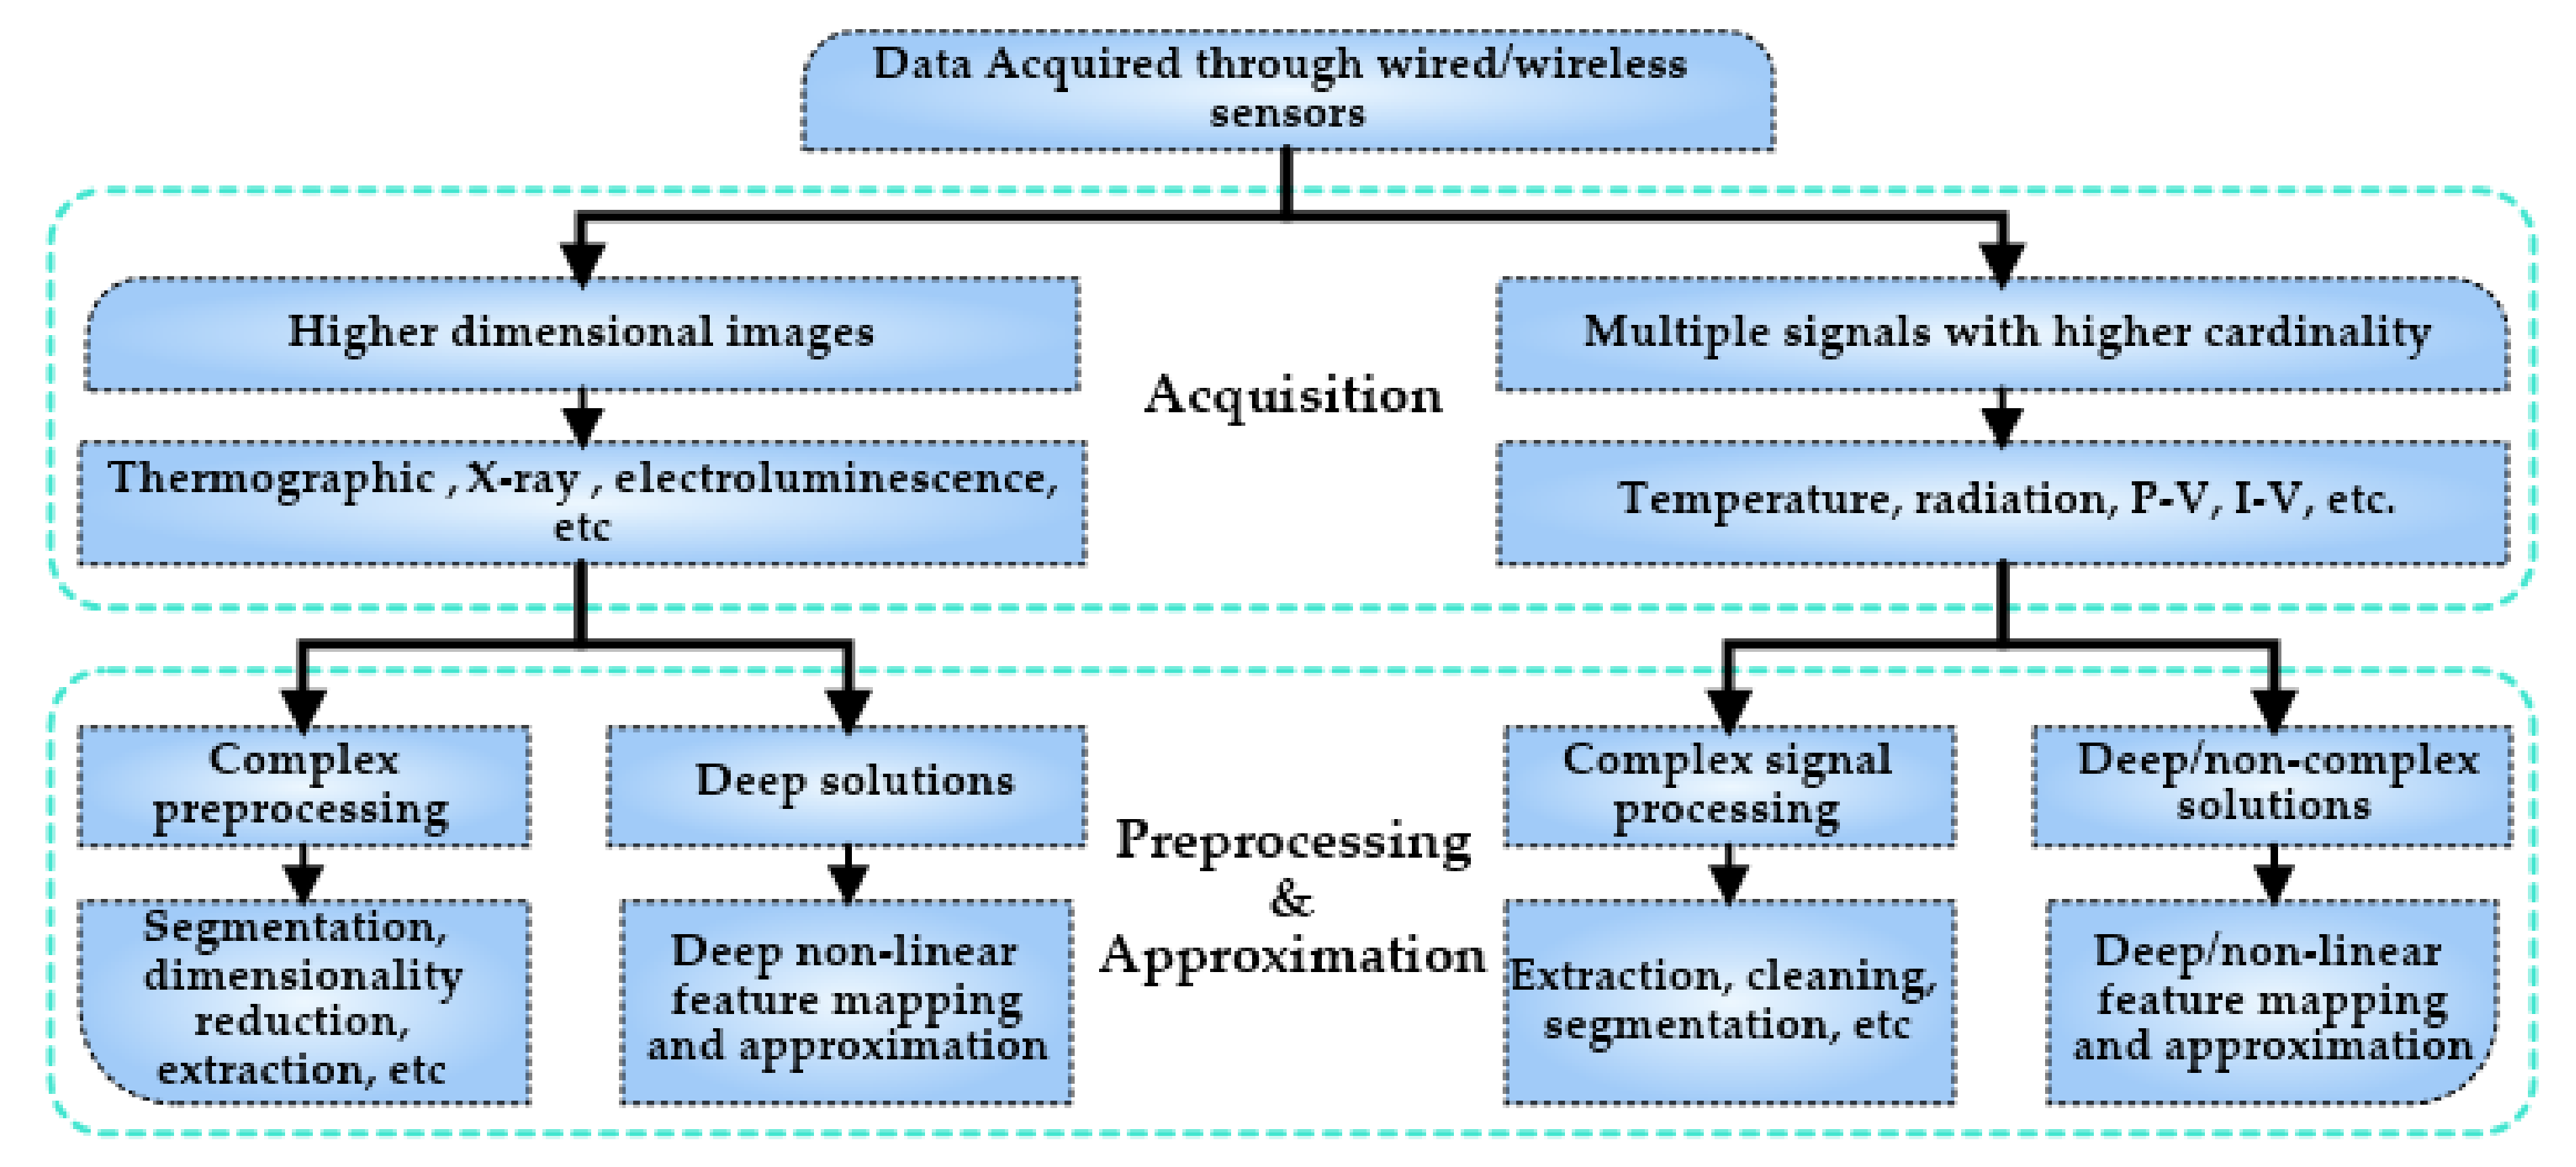
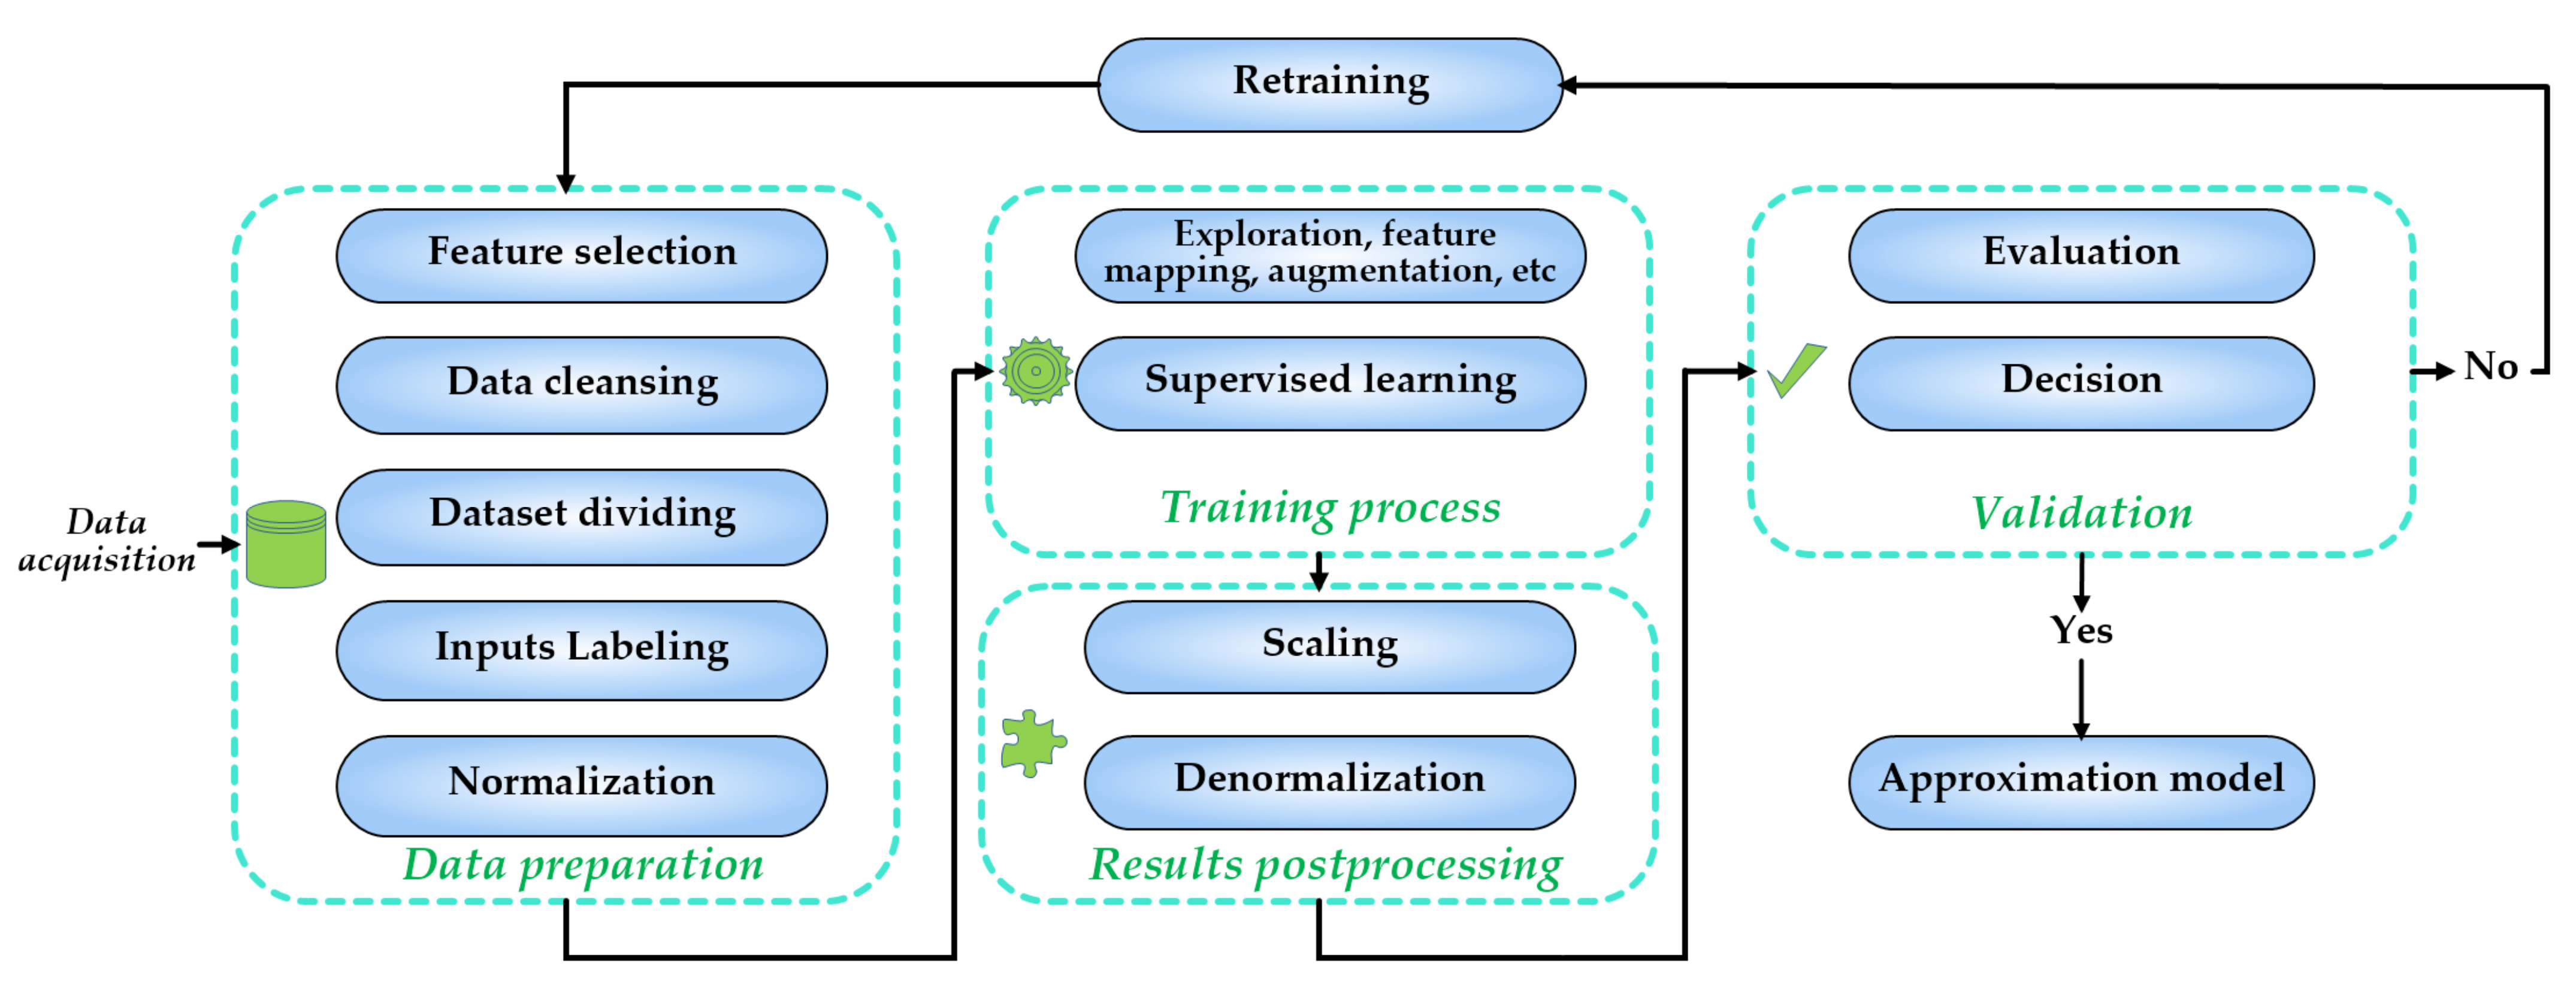
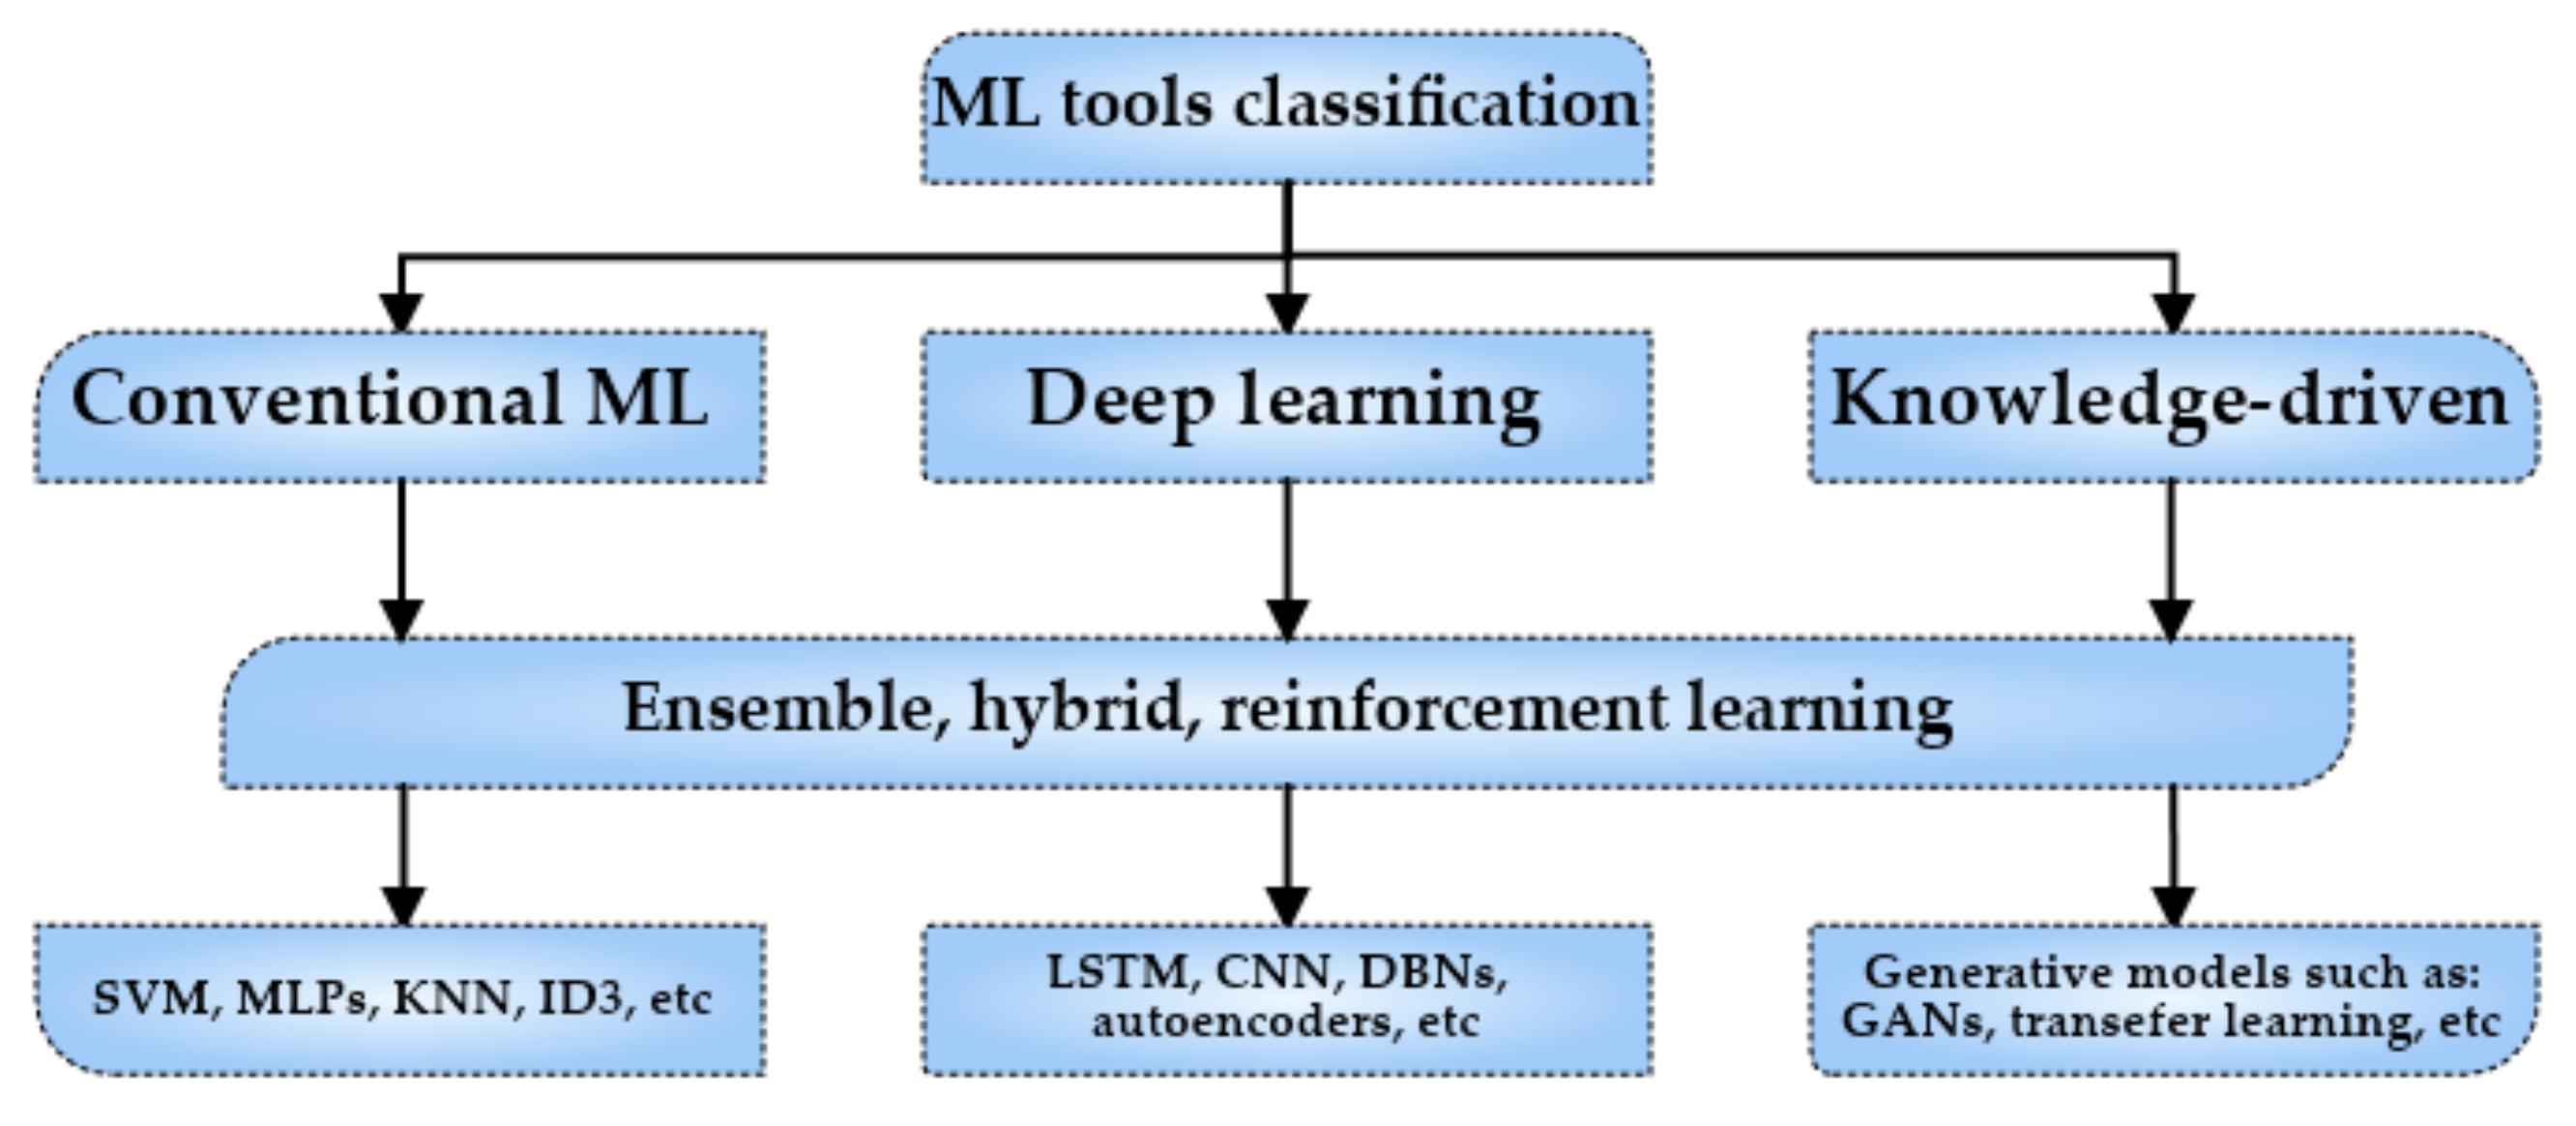
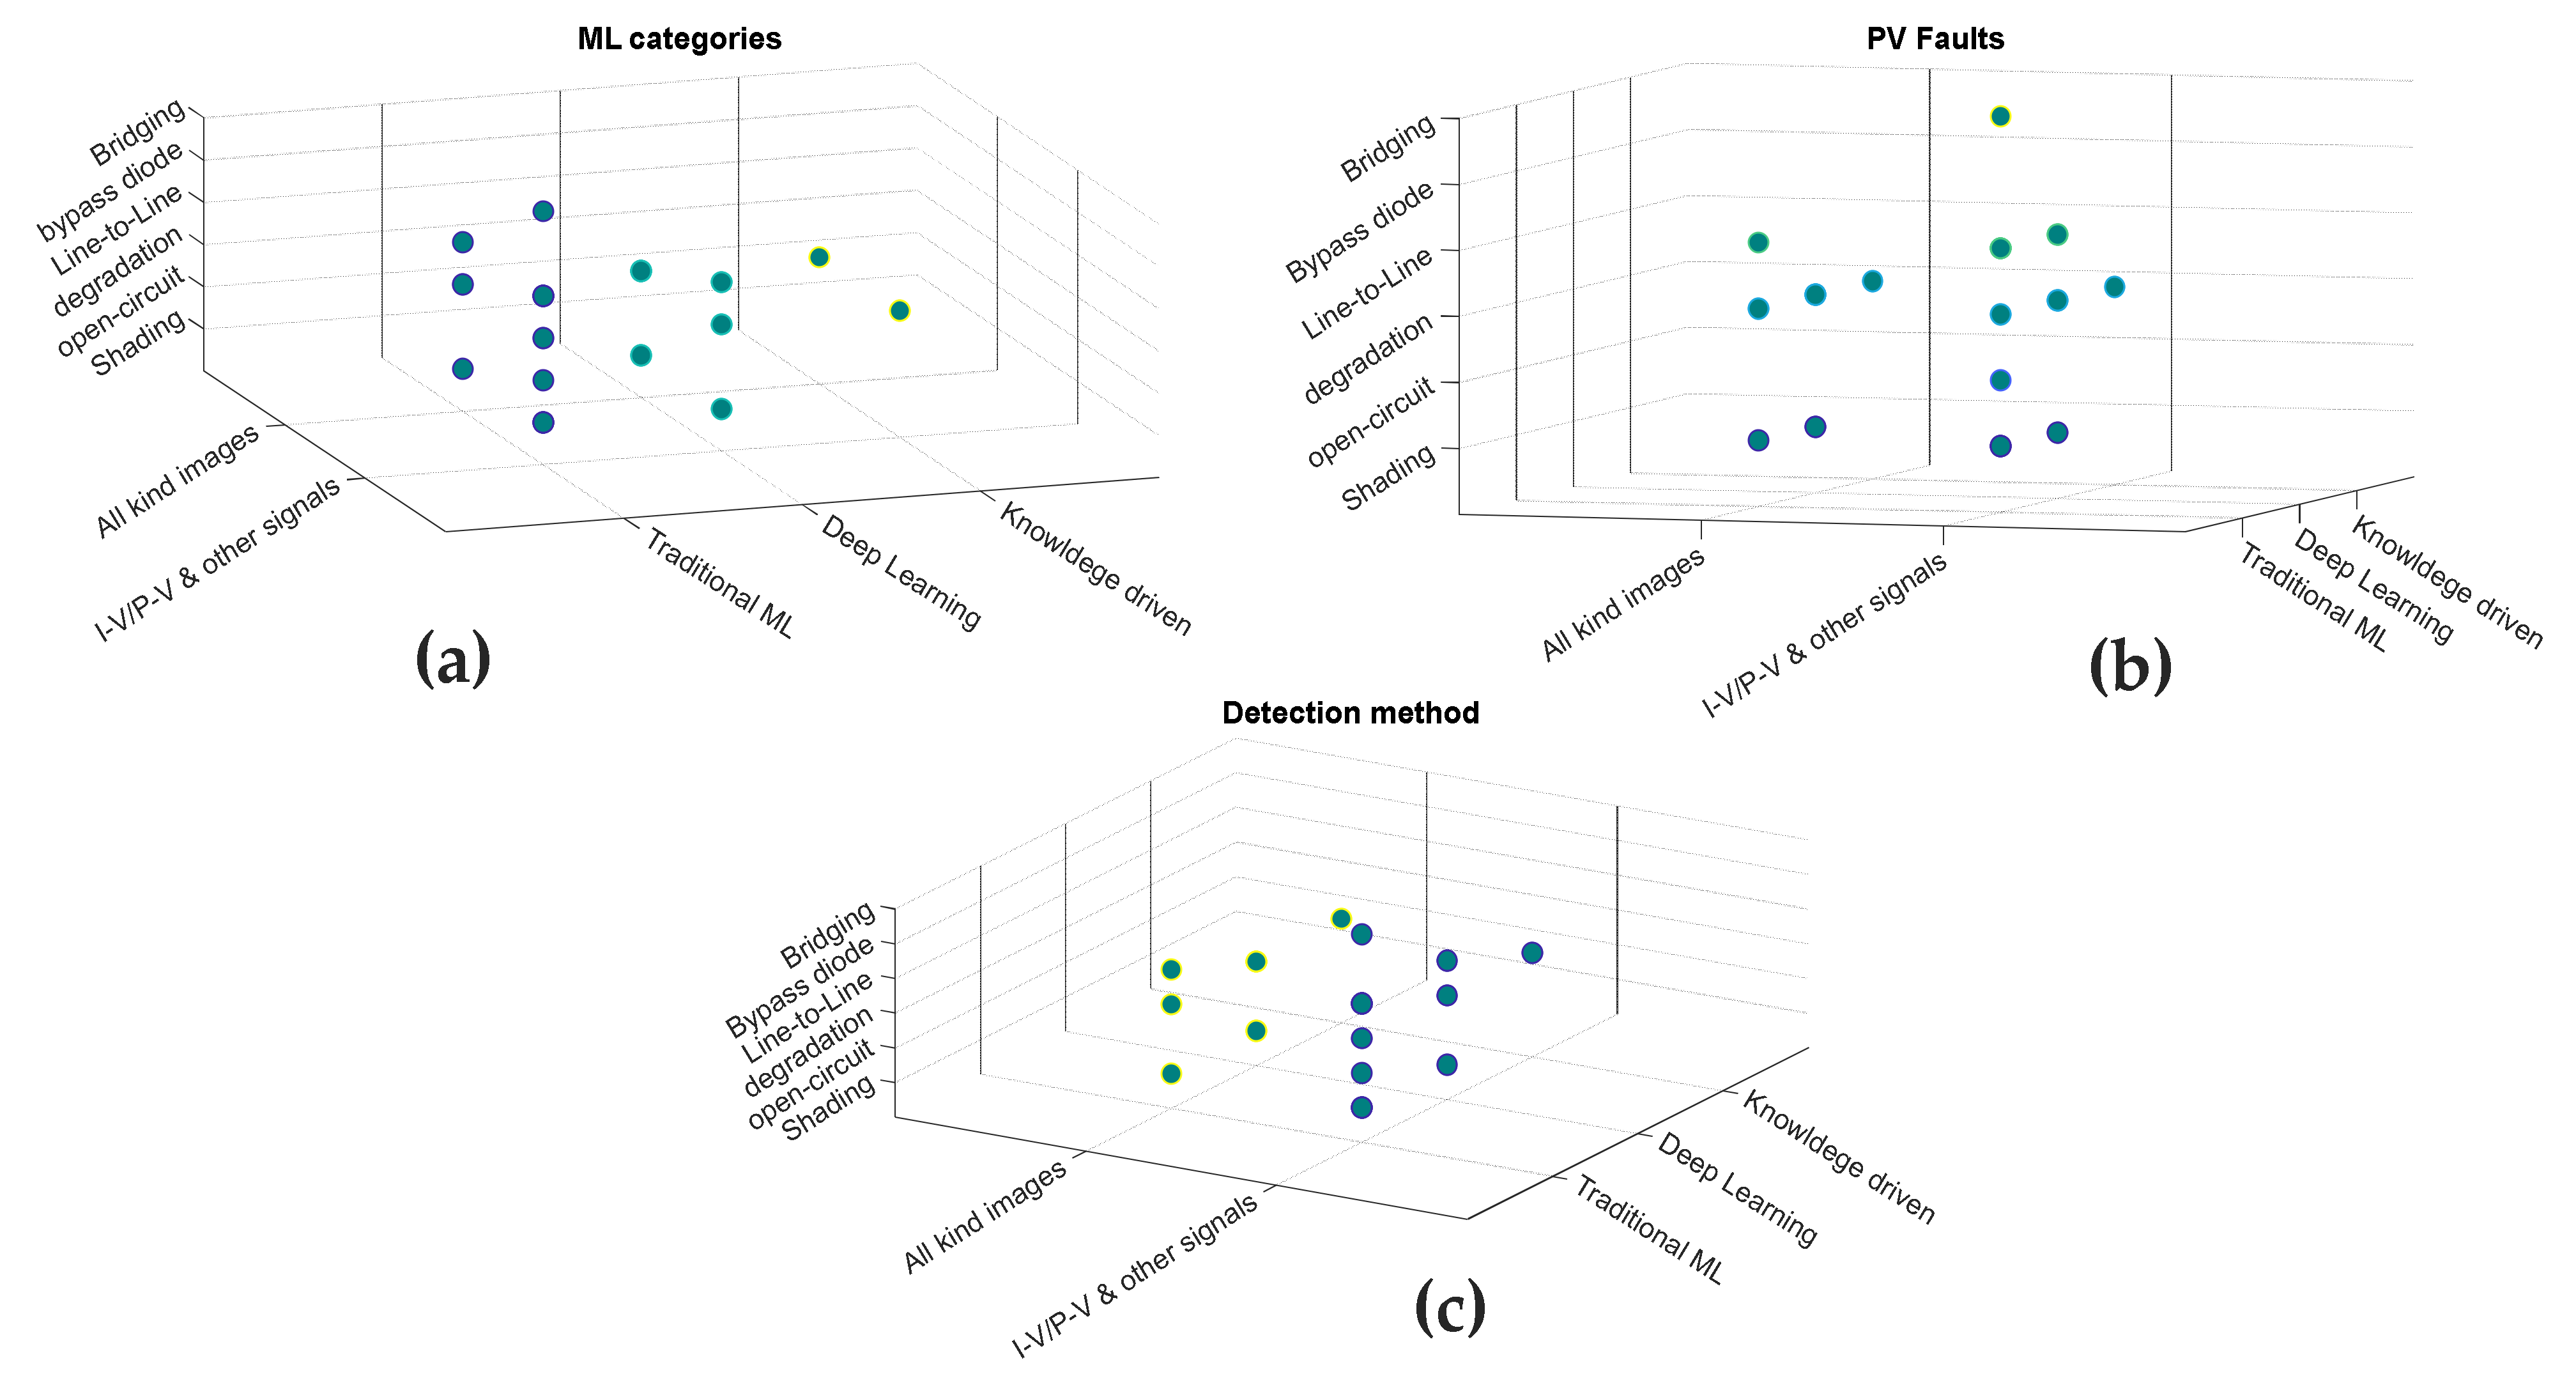
Table 1.
Conventional ML methods for CM of PV systems.
| Reference | ML Tools | Detection | Faults Number | Faults Categories | Learning Type | Open Source Data |
|---|---|---|---|---|---|---|
| Garoudja et al. [6] | PNN | I-V/P-V | 4 | Short-circuits | Ordinary | ----- |
| Bakdi et al. [18] | PCA, RSKD and KLD | I-V/P-V | 16 | Shading and open-circuit and controllers | Hybrid | Bakdi et al. [72] |
| Momeni et al. [60] | GBSSL | I-V/P-V | 2 | Line-to-line | Ordinary | ----- |
| Maaløe et al. [61] | BT | I-V/P-V | 10 | Shading | Ordinary | ----- |
| Lazzaretti et al. [62] | DARL | I-V/P-V | 4 | Line-to-line, degradation, and shading | Ordinary | Lazzaretti et al. [73] |
| Dhibi et al. [63] | RKRF, PCA and KNN | I-V/P-V | 5 | Open circuit, line-to-line, and shading | Hybrid | ----- |
| Huang et al. [64] | ELM and BC | I-V/P-V | 5 | Shading | Hybrid | ----- |
| Eskandari et al. [65] | KNN, SVM and NB | I-V/P-V | 2 | Line-to-line | Ensemble | ----- |
| Eskandari et al. [66] | SVM, NB and LR | I-V/P-V | 2 | Line-to-line | Ensemble | ----- |
| Edun et al. [67] | SVD | Reflection signatures | ----- | Line-to-line | Ordinary | ----- |
| Hajji et al. [68] | PCA and RF | I-V/P-V | 5 | Line-to-line and shading | Hybrid | ----- |
| Harrou et al. [69] | SVM, GPR and kernels | ----- | 6 | Bridging faults, partial shading, and PV modules short-circuited, module degradation, and line–line faults | Hybrid | ----- |
| Ali et al. [70] | SVM | Thermographic images | 2 | Shading and degradation | Ordinary | ----- |
| Dhimish [71] | DC | Thermographic images | 2 | Degradation | Ordinary | ----- |
Table 2.
Advanced DL methods for CM of PV systems.
| Reference | ML Tools | Detection | Faults Number | Faults Categories | Learning Type | Open Source Data |
|---|---|---|---|---|---|---|
| Deitsch et al. [51] | SVM, CNN | Electroluminescence images | ------- | Degradation | Ordinary | Brabec et al. [85] |
| Akram et al. [50] | CNN | Electroluminescence images | ------ | Degradation | Ordinary | Brabec et al. [85] |
| Rahman et al. [49] | Multi-Attention U-net | Electroluminescence images | 2 | Degradation | Hybrid | ----- |
| Appiah et al. [77] | LSTM | I-V/P-V | ----- | Line-to-line and degradation | Ordinary | ----- |
| Li et al. [79] | CNN | Thermographic images from UAVs | 5 | Degradation and shading | Ordinary | ----- |
| Li et al. [80] | CNN and SVM | Thermographic images from UAVs | 5 | Degradation and shading | Hybrid | ----- |
| Gao et al. [78] | CNN and Res-GRU | I-V/P-V, solar irradiance, temperature | 10 | Line-to-line, shading and degradation | Hybrid | Gao et al. [78] The dataset is available upon request |
| Pierdicca et al. [46] | Mask region-based CNN | Thermographic images from UAVs | 3 | Degradation | Hybrid | Pierdicca et al. [86] |
| Hwang et al. [81] | IGCF, CNN and XGBoost | Thermographic images from ground-installed cameras | ----- | Degradation | Hybrid | ----- |
| Venkatesh et al. [82] | CNN and VGG16 | Thermographic images from UAVs | 5 | Degradation | Hybrid | ----- |
| Moradi et al. [83] | CNN and encoder-decoder | Aerial images from multi-copters | 1 (birds drops) | Shading | Hybrid | ----- |
| Liu et al. [76] | SAE, t-SNE, FSFDP and MF | I-V/P-V | 11 | Shading, short-circuit and degradation | Hybrid | ----- |
| Manno et al. [84] | CNN | Thermographic images from ground-based and UAVs | 1 (hotspot) | Degradation | Ordinary | ----- |
Table 3.
Knowledge-guided methods for CM of PV systems.
| Reference | ML Tools | Detection | Faults Numbers | Faults Category | Learning Type | Open Source Data |
|---|---|---|---|---|---|---|
| Ahmed et al. [47] | CNN, TL | Thermographic Images | 1 | Degradation | Ordinary | Data is generated from software [103] using details in [104]. |
| Lu et al. [99] | CNN, GAN, and TL | I-V/P-V | 3 | Arc fault | Hybrid | ----- |
| Lu et al. [100] | CNN, GAN, and TL | I-V/P-V | ----- | Arc fault | Hybrid | ----- |
| Tang et al. [101] | CNN, GAN | Electroluminescence images | 5 | Degradation | Hybrid | Brabec et al. [85] |
| Akram et al. [102] | CNN, TL | Electroluminescence and infrared images | 8 | Degradation | Hybrid | Brabec et al. [85] |
Publisher’s Note: MDPI stays neutral with regard to jurisdictional claims in published maps and institutional affiliations. |
© 2021 by the authors. Licensee MDPI, Basel, Switzerland. This article is an open access article distributed under the terms and conditions of the Creative Commons Attribution (CC BY) license (https://creativecommons.org/licenses/by/4.0/).
Share and Cite
MDPI and ACS Style
Berghout, T.; Benbouzid, M.; Bentrcia, T.; Ma, X.; Djurović, S.; Mouss, L.-H. Machine Learning-Based Condition Monitoring for PV Systems: State of the Art and Future Prospects. Energies 2021, 14, 6316. https://doi.org/10.3390/en14196316
AMA Style
Berghout T, Benbouzid M, Bentrcia T, Ma X, Djurović S, Mouss L-H. Machine Learning-Based Condition Monitoring for PV Systems: State of the Art and Future Prospects. Energies. 2021; 14(19):6316. https://doi.org/10.3390/en14196316
Chicago/Turabian StyleBerghout, Tarek, Mohamed Benbouzid, Toufik Bentrcia, Xiandong Ma, Siniša Djurović, and Leïla-Hayet Mouss. 2021. "Machine Learning-Based Condition Monitoring for PV Systems: State of the Art and Future Prospects" Energies 14, no. 19: 6316. https://doi.org/10.3390/en14196316
Note that from the first issue of 2016, this journal uses article numbers instead of page numbers. See further details here.