
Comparative Analysis of Strength and Modal Characteristics of a Full Tubular Pump and an Axial Flow Pump Impellers Based on Fluid-Structure Interaction

Abstract
:1. Introduction
2. Numerical Method
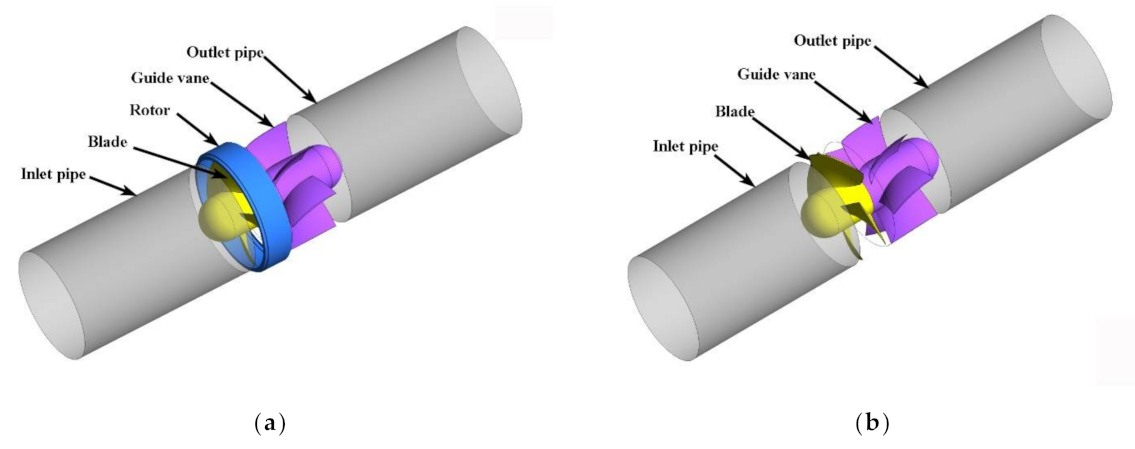
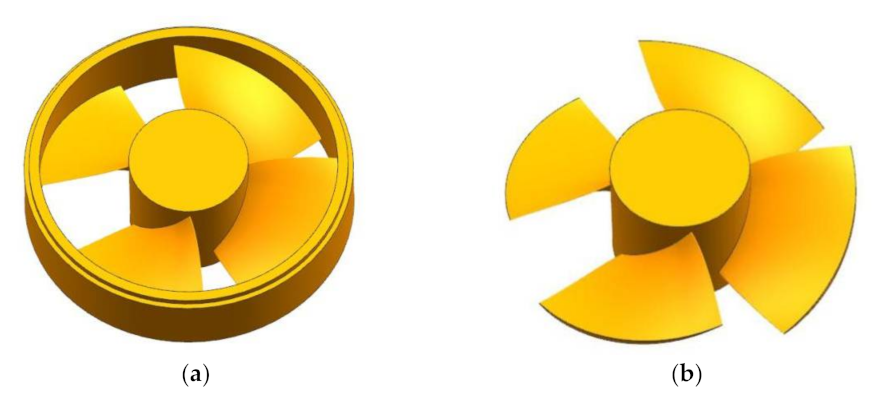
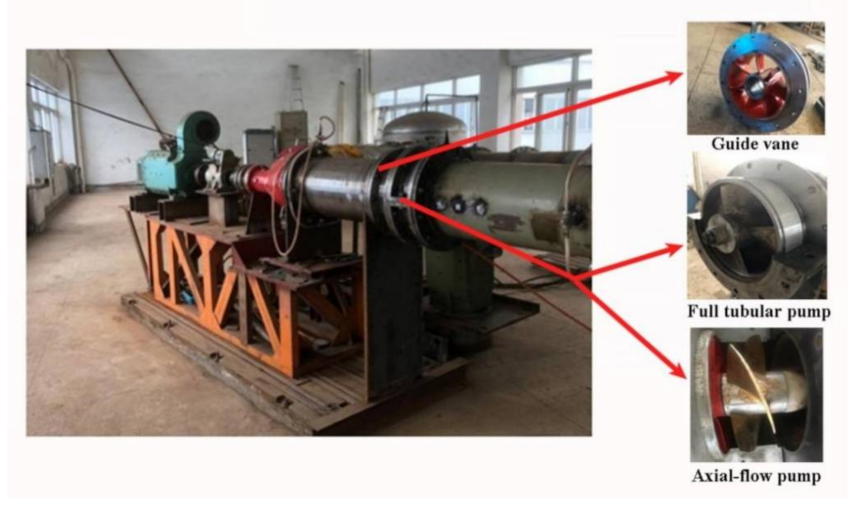
2.1. Object
2.2. Boundary Conditions and Turbulence Model
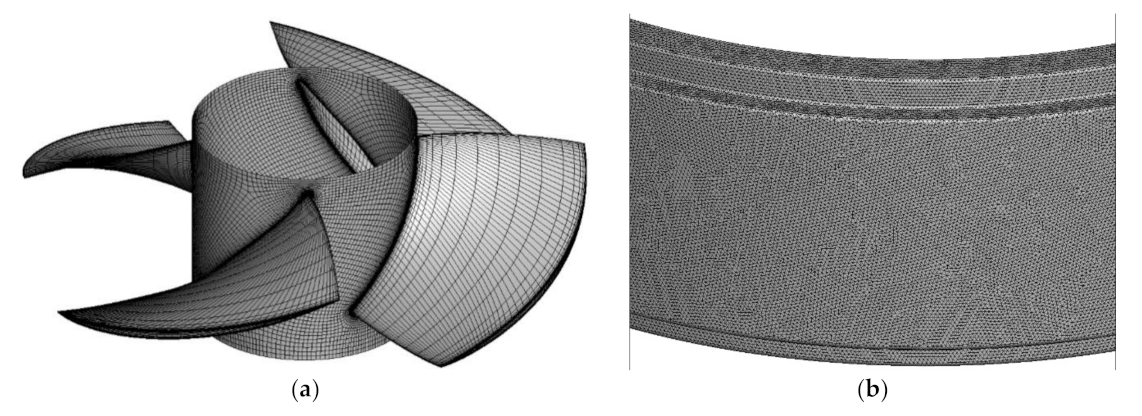
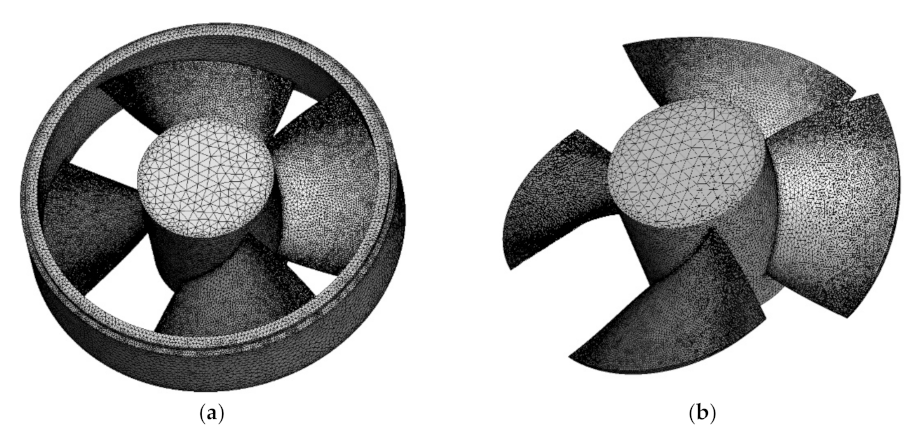
2.3. Grid
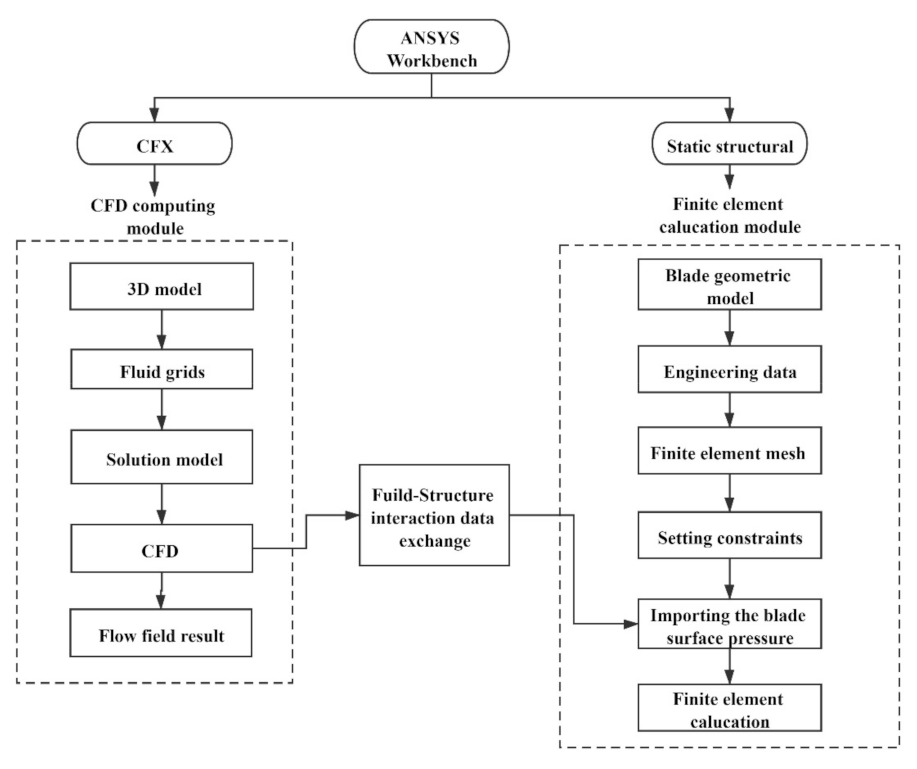
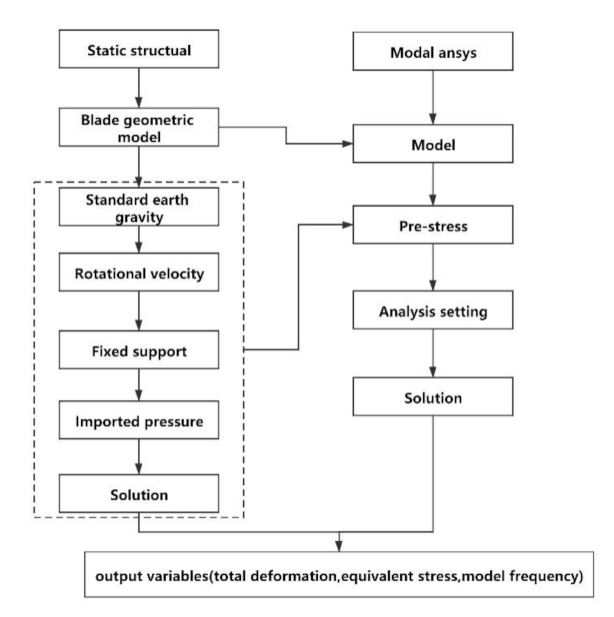
2.4. FSI Setting
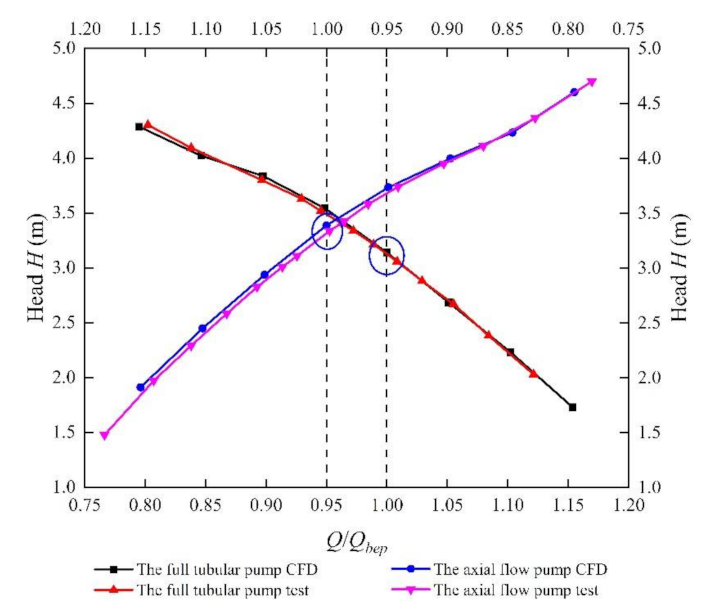
2.5. Model Experiment Verification
3. Results
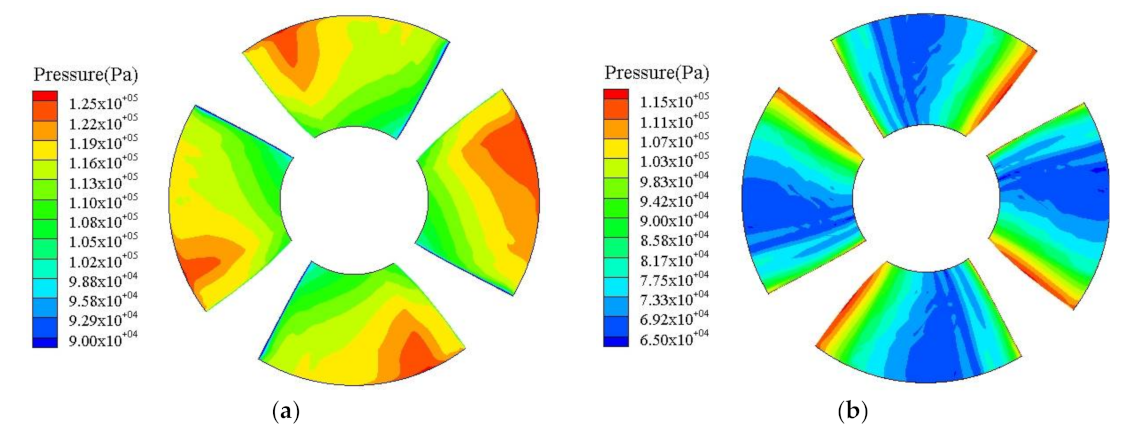
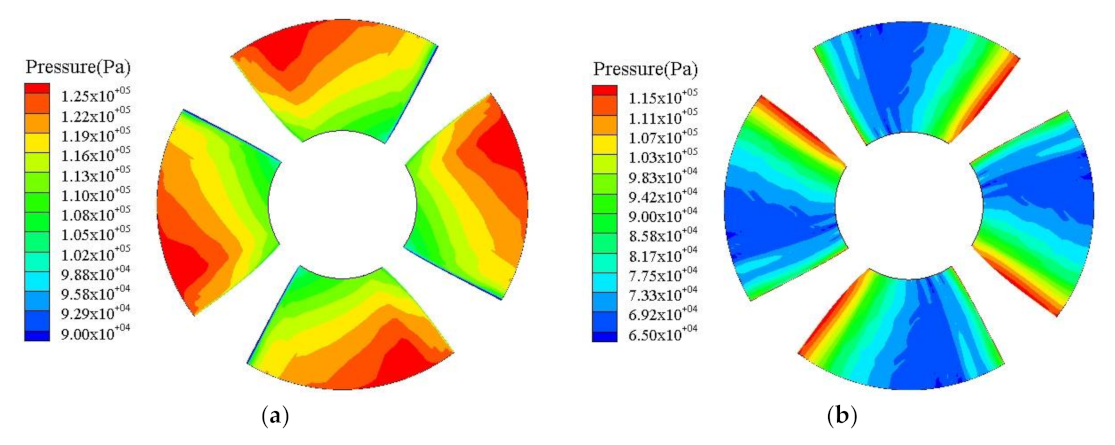
3.1. Flow Field Analysis
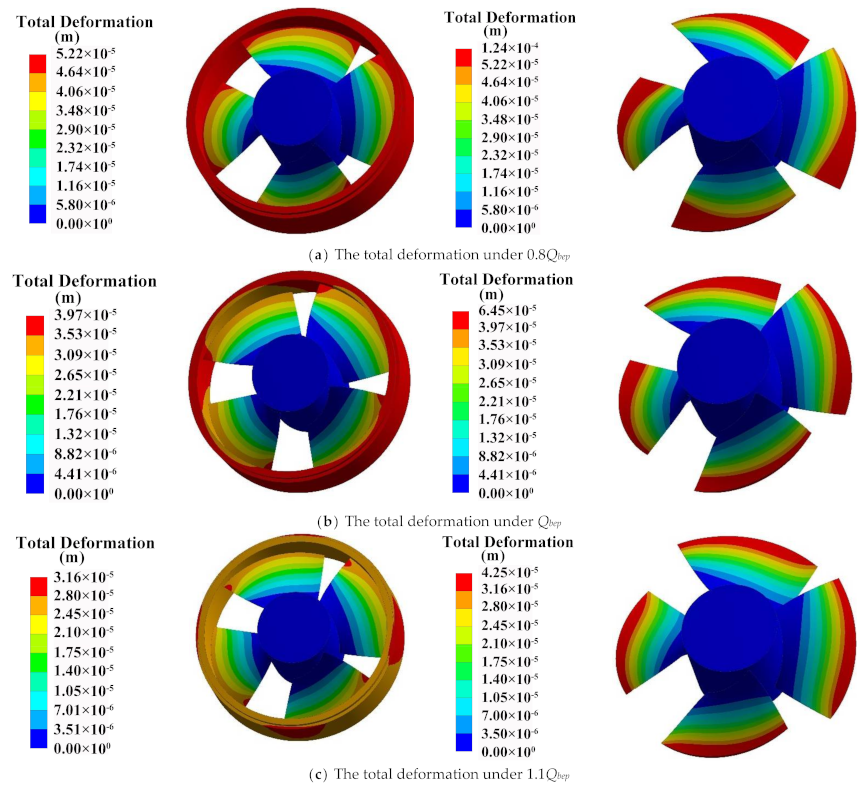
3.2. Structural Deformation Analysis
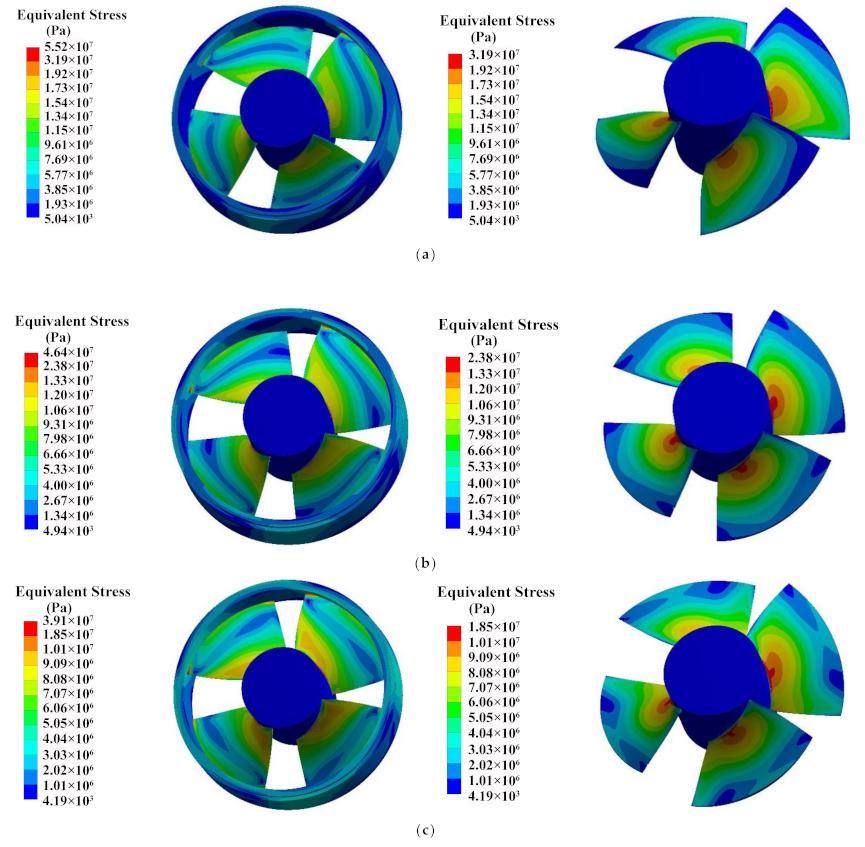
3.3. Structural Stress Analysis
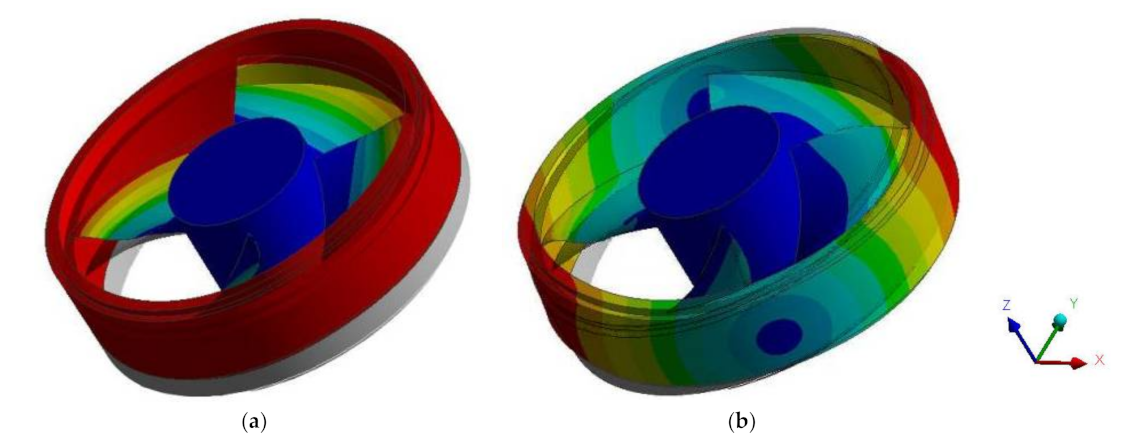
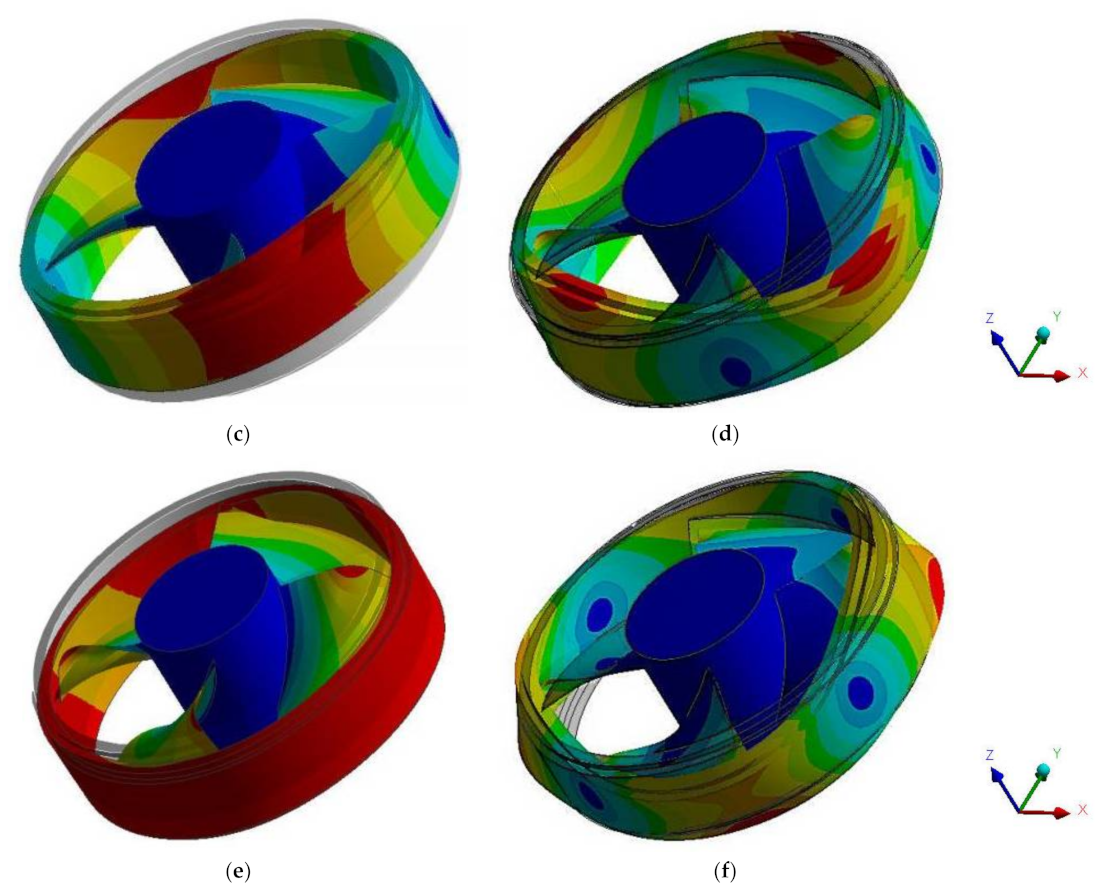
3.4. Modal Analysis
4. Conclusions
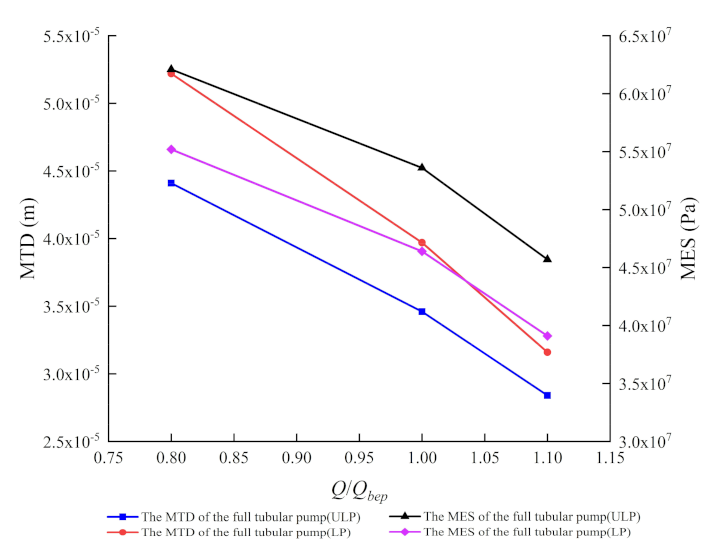
- The distribution trend of the blade deformation and equivalent stress of the full tubular pump is basically the same under various flow conditions, but its value gradually decreases with the increase of the flow. The deformation of the blade shows a trend of gradually increasing from the hub to the rim, and the deformation is larger at the outlet of the rim, while the MTD of the axial-flow pump is at the inlet of the blade. The MTD of the full tubular pump is less than that of the axial-flow pump.
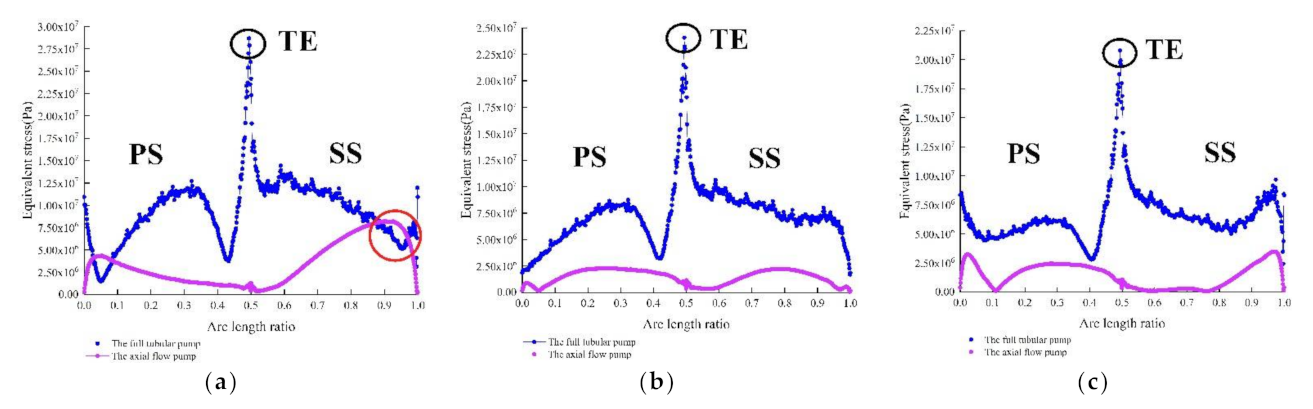
- The equivalent stress of the full tubular pump shows a trend of first decreasing and then increasing from the hub to the rim. There are two stress concentration areas primarily distributed in the outlet of the blade rim and the area of the hub. While the equivalent stress of the axial-flow pump is decreased from the hub to the rim, there is only one stress concentration area distributed in the center of the hub. The MES of the axial-flow pump is smaller than that of the full tubular pump under different flow conditions.
- The MES and MTD of the full tubular pump are located at the junction of the blade rim and the rotor. Clearance backflow and geometric shape are the main reasons for the difference in structural performance between the tubular flow pump and the axial-flow pump. It is very essential to pay attention to the rigidity of the full tubular pump rim.
- The natural frequency of each order modal for the full tubular pump is less than that of the axial-flow pump. The natural frequency of the first-order mode for the full tubular pump is 279.9 Hz. And the modal participation factor in the Z-axis is 3.0, which the absolute value is max in the Z-axis direction and represents the up and down swing along the Z-axis direction. The modal participation factor has certain reference significance for analyzing the vibration mode shape. The main vibration modes exhibited by each vibration frequency swings along the Z-axis and this direction exactly reflects the axial direction.
Author Contributions
Funding
Institutional Review Board Statement
Informed Consent Statement
Data Availability Statement
Conflicts of Interest
Nomenclature
| D | impeller diameter, mm |
| Q | flow, L/s |
| ρ | the density, kg/m3 |
| g | local acceleration of gravity, m/s2 |
| H | head, m |
| η | efficiency, % |
| n | rotation speed, r/min |
| bep | best efficiency point |
| FSI | fluid-structure interaction |
| MTD | the maximum total deformation, m |
| MES | the maximum equivalent stress, Pa |
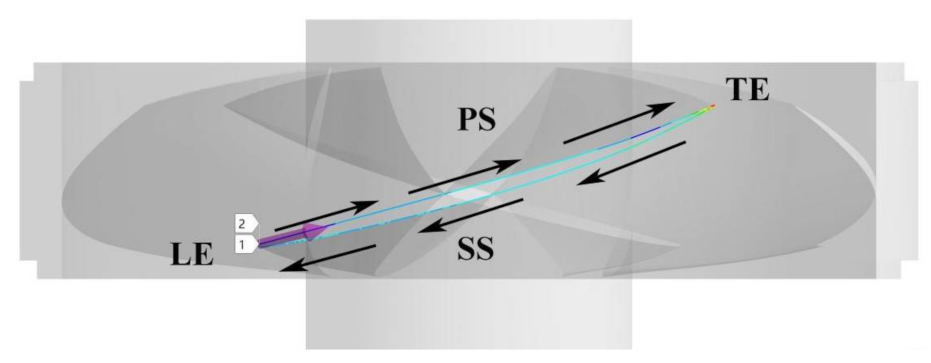
| PS | the pressure surface of blade |
| SS | the suction surface of blade |
| TE | the trailing edge of blade |
| LE | the leading edge of blade |
| ULP | the unloaded rotor surface pressure |
| LP | the loaded rotor surface pressure |
| BPF | the blade passing frequency, Hz |
| γi | the participation factor for the ith mode |
| ϕi | eigenvector representing the mode shape of the ith natural frequency |
| F | input force vector |
| [M] | the structural mass matrix |
| [C] | the structural damping matrix |
| [K] | the structural stiffness matrix |
| the structural velocity | |
| (x) | the structural displacement |
| the structural acceleration | |
| {F} | the flow field force of the structure under the FSI |
| E | Young modulus, MPa |
| Φ | Poisson ratio |
| σs | Yield strength, MPa |
| S | an invariant measure of the strain rate |
| y | the distance to the nearest wall |
| ν | the kinematic viscosity |
| k | turbulent energy, m2/s2 |
| Ω | turbulent eddy frequency, s−1 |
| i, j | the stands for the x, y, z direction |
| uj | stands for the velocity in different coordinate directions, m/s |
| xj | stands for the coordinate component, m |
| μ | the dynamic viscosity, Pa·s |
| μt | the turbulent viscosity, m2/s |
| Pk | the turbulence produced by viscous force |
| ε | the dissipation rate of turbulent kinetic energy |
| F1, F2 | blending or auxiliary fuctions in turbulence model |
| β′, β1, β2 | the constant parameters |
| α1, σk1, σk2, σω1, σω2 | the constant parameters |
References
- Liu, C. Researches and Developments of Axial-flow Pump System. Trans. Chin. Soc. Agric. Mach. 2015, 46, 49–59. [Google Scholar]
- Shi, L.J.; Jiao, H.F.; Gou, J.L.; Yuan, Y.; Tang, F.P.; Yang, F. Influence of backflow gap size on hydraulic performance of full-flow pump. Trans. Chin. Soc. Agric. Mach. 2020, 51, 139–146. [Google Scholar]
- Shi, L.J.; Yuan, Y.; Jiao, H.F.; Tang, F.P.; Cheng, L.; Yang, F.; Jin, Y.; Zhu, J. Numerical investigation and experiment on pressure pulsation characteristics in a full tubular pump. Renew. Energy 2021, 163, 987–1000. [Google Scholar] [CrossRef]
- Shi, L.J.; Zhang, W.P.; Jiao, H.F.; Tang, F.P.; Wang, L.; Sun, D.D.; Shi, W. Numerical simulation and experimental study on the comparison of the hydraulic characteristics of an axial-flow pump and a full tubular pump. Renew. Energy 2020, 153, 1455–1464. [Google Scholar] [CrossRef]
- Li, D.Y.; Yu, L.; Yan, X.Y.; Wang, H.J.; Shi, Q.; Wei, X.Z. Runner cone optimization to reduce vortex rope-induced pressure fluctuations in a Francis turbine. Sci. China Technol. Sci. 2021, 64, 1953–1970. [Google Scholar] [CrossRef]
- Li, D.Y.; Ren, Z.P.; Li, Y.; Miao, B.X.; Gong, R.Z.; Wang, H.J. Thermodynamic effects on pressure fluctuations of a liquid oxygen turbopump. J. Fluids Eng. Trans. ASME 2021, 143, 111401. [Google Scholar] [CrossRef]
- Chirag, T.; Michel, J.C. Fluid-structure interactions in Francis turbines: A perspective review. Renew. Sustain. Energy Rev. 2017, 68 Pt 1, 87–101. [Google Scholar]
- Dorji, U.; Ghomashchi, R. Hydro turbine failure mechanisms: An overview. Eng. Fail. Anal. 2014, 44, 136–147. [Google Scholar] [CrossRef]
- Zhou, L.J.; Wang, Z.W.; Xiao, R.F.; Luo, Y.Y. Analysis of dynamic stresses in Kaplan turbine blades. Eng. Comput. 2007, 24, 753–762. [Google Scholar] [CrossRef]
- Wu, G.K.; Luo, X.Q.; Feng, J.J.; Li, W.F. Cracking reason for Francis turbine blades based on transient fluid structure interaction. Trans. Chin. Soc. Agric. Mach. 2015, 31, 92–98. [Google Scholar]
- Fu, X.L.; Zuo, Z.G.; Chang, H.; Li, D.Y.; Wang, H.J.; Wei, X.Z. Mechanism of low frequency high amplitude pressure fluctuation in a pump-turbine during the load rejection process. J. Hydraul. Res. 2021, 59, 280–297. [Google Scholar] [CrossRef]
- Li, D.Y.; Chang, H.; Zuo, Z.G.; Wang, H.J.; Liu, S.H. Aerodynamic characteristics and mechanisms for bionic airfoils with different spacings. Phys. Fluids 2021, 33, 64101. [Google Scholar] [CrossRef]
- Kan, K.; Zheng, Y.; Fu, S.F.; Yang, C.X.; Zhang, X. Dynamic stress of impeller blade of shaft extension tubular pump device based on bidirectional fluid-structure interaction. J. Mech. Sci. Technol. 2017, 31, 1561–1568. [Google Scholar] [CrossRef]
- Kan, K.; Zheng, Y.; Chen, H.X. Study into the Improvement of Dynamic Stress Characteristics and Prototype Test of an Impeller Blade of an Axial-Flow Pump Based on Bidirectional Fluid–Structure Interaction. Appl. Sci. 2019, 9, 3601. [Google Scholar] [CrossRef] [Green Version]
- Schneider, A.; Will, B.; Böhle, M. Numerical Evaluation of Deformation and Stress in Impellers of Multistage Pumps by Means of Fluid Structure Interaction. In Proceedings of the ASME 2013 Fluids Engineering Division Summer Meeting, Incline Village, NV, USA, 7–11 July 2013; pp. 1–10. [Google Scholar]
- Pei, J.; Meng, F.; Li, Y.J.; Yuan, S.Q.; Chen, J. Fluid–structure coupling analysis of deformation and stress in impeller of an axial-flow pump with two-way passage. Adv. Mech. Eng. 2016, 8, 1–11. [Google Scholar] [CrossRef] [Green Version]
- Zhang, L.J.; Wang, S.; Yin, G.J.; Guan, C.N. Fluid–structure interaction analysis of fluid pressure pulsation and structural vibration features in a vertical axial pump. Adv. Mech. Eng. 2019, 11, 1687814019828585. [Google Scholar] [CrossRef] [Green Version]
- Li, W.; Yang, Y.F.; Shi, W.D.; Ji, L.L.; Jiang, X.P. Mechanical Properties of Mixed-flow Pump Impeller Based on Bidirectional Fluid-structure Interaction. Trans. Chin. Soc. Agric. Mach. 2015, 46, 82–88. [Google Scholar]
- Li, W.; Ji, L.L.; Shi, W.D.; Jiang, X.P.; Zhang, Y. Vibration characteristics of the impeller at multi-conditions in mixed-flow pump under the action of fluid-structure interaction. J. Vibroeng. 2016, 18, 3213–3224. [Google Scholar] [CrossRef]
- Li, C.Y.; Zheng, Y.; Zhang, Y.Q.; Kan, K.; Xue, X.Y.; Rodriguez, E.F. Stability Optimization and Analysis of a Bi-Directional Shaft Extension Pump. J. Fluids Eng. 2020, 142, 071203. [Google Scholar] [CrossRef]
- Deng, Z.P.; Hu, Q.H.; Dong, Y.F.; Li, Y. Comparison between one-way and two-way fluid-structure interaction simulations of a horizontal tidal current turbine. In Proceedings of the Second Conference of Global Chinese Scholars on Hydrodynamics, Wuxi, China, 11–14 November 2016; pp. 222–228. [Google Scholar]
- Benra, F.K.; Dohmen, H.J.; Pei, J.; Schuster, S.; Wan, B. A Comparison of One-Way and Two-Way Coupling Methods for Numerical Analysis of Fluid-Structure Interactions. J. Appl. Math. 2011, 2011, 853560. [Google Scholar] [CrossRef]
- Zhu, R.; Chen, D.D.; Wu, S.W. Unsteady Flow and Vibration Analysis of the Horizontal-Axis Wind Turbine Blade under the Fluid-Structure Interaction. Shock. Vib. 2019, 2019, 3050694. [Google Scholar] [CrossRef]
- Javanmardi, N.; Ghadimi, P. Hydroelastic analysis of surface-piercing propeller through one-way and two-way coupling approaches. Proc. Inst. Mech. Eng. Part M J. Eng. Marit. Environ. 2019, 233, 844–856. [Google Scholar] [CrossRef]
- Wijesooriya, K.; Mohotti, D.; Amin, A.; Chauhan, K. Comparison between an uncoupled one-way and two-way fluid structure interaction simulation on a super-tall slender structure. Eng. Struct. 2021, 229, 111636. [Google Scholar] [CrossRef]
- Shi, L.J.; Zhu, J.; Yuan, Y.; Tang, F.P.; Huang, P.L.; Zhang, W.P.; Liu, H.Y.; Zhang, X.W. Numerical Simulation and Experiment of the Effects of Blade Angle Deviation on the Hydraulic Characteristics and Pressure Pulsation of an Axial-Flow Pump. Shock. Vib. 2021, 2021, 6673002. [Google Scholar]
- Menter, F.R. Two-equation eddy-viscosity turbulence models for engineering applications. AIAA-J. 1994, 32, 1598–1605. [Google Scholar] [CrossRef] [Green Version]
- Li, D.E.; Song, Y.C.; Lin, S.; Wang, H.J.; Qin, Y.L.; Wei, X.Z. Effect mechanism of cavitation on the hump characteristic of a pump-turbine. Renew. Energy 2021, 167, 369–383. [Google Scholar] [CrossRef]
- Ji, L.L.; Li, W.; Shi, W.D.; Tian, F.; Agarwal, R. Diagnosis of internal energy characteristics of mixed-flow pump within stall region based on entropy production analysis model. Int. Commun. Heat Mass Transf. 2020, 117, 104784. [Google Scholar] [CrossRef]
- Shi, L.J.; Zhu, J.; Tang, F.P.; Wang, C. Multi-Disciplinary Optimization Design of Axial-Flow Pump Impellers Based on the Approximation Model. Energies 2020, 13, 779. [Google Scholar] [CrossRef] [Green Version]
- Kang, C.; Zhu, Y.; Li, Q. Effects of hydraulic loads and structure on operational stability of the rotor of a molten-salt pump. Eng. Fail. Anal. 2020, 117, 104821. [Google Scholar] [CrossRef]
- Peng, G.J.; Zhang, Z.R.; Bai, L. Wet Modal Analyses of Various Length Coaxial Sump Pump Rotors with Acoustic-Solid Coupling. Shock. Vib. 2021, 2021, 8823150. [Google Scholar]
- Qi, Y. Stress and Modal Analysis of Bi-Directional Pump Blades. Master’s Thesis, Yangzhou University, Yangzhou, China, 2015. [Google Scholar]


| Parameter | Impeller Diameter D (mm) | Rotation Speed n (r/min) | Design Flow Qbep (L/s) | Design Head H (m) | Blade Number | Guide Vane Number |
|---|---|---|---|---|---|---|
| Value | 350 | 950 | 390 | 3.2 | 4 | 7 |
| Parameter | Density ρ/(kg·m−3) | Young Modulus E/MPa | Poisson Ratio Φ | Yield Strength σs/MPa |
|---|---|---|---|---|
| Value | 7780 | 203 | 0.29 | 550 |
| Mode | First-Order Frequency/Hz | Second-Order Frequency/Hz | Third-Order Frequency/Hz | Fourth-Order Frequency/Hz | Fifth-Order Frequency/Hz | Sixth-Order Frequency/Hz |
|---|---|---|---|---|---|---|
| Full tubular pump | 279.9 | 580.6 | 580.7 | 881.1 | 884.4 | 984.4 |
| Axial-flow pump | 868.7 | 869.8 | 869.8 | 870.1 | 1655.8 | 1655.9 |
| Mode | Frequency/Hz | Participation Factor | |||||
|---|---|---|---|---|---|---|---|
| X | Y | Z | ROT.X | ROT.Y | ROT.Z | ||
| 1 | 279.9 | 0.18 × 10⁻⁴ | 0.92 × 10⁻⁴ | 3.0 | −0.15 × 10⁻⁴ | 0.23 × 10⁻⁴ | −0.47 |
| 2 | 580.6 | −0.058 | 0.39 | −0.14 × 10⁻³ | −0.34 | 0.38 | 0.39 × 10⁻⁴ |
| 3 | 580.7 | −0.39 | −0.058 | 0.25 × 10⁻⁴ | −0.38 | −0.34 | −0.16 × 10⁻⁴ |
| 4 | 881.1 | 0.23 × 10⁻³ | 0.41 × 10⁻³ | −0.28 × 10⁻² | 0.35 × 10⁻⁴ | −0.63 × 10⁻⁴ | −0.54 × 10⁻³ |
| 5 | 884.4 | 0.42 × 10⁻⁴ | 0.72 × 10⁻⁴ | −2.47 | −0.19 × 10⁻⁵ | 0.17 × 10⁻⁴ | −0.55 |
| 6 | 984.4 | 0.20 × 10⁻³ | 0.18 × 10⁻³ | 0.16 × 10⁻³ | 0.23 × 10⁻⁴ | −0.29 × 10⁻⁴ | 0.25 × 10⁻⁴ |
Publisher’s Note: MDPI stays neutral with regard to jurisdictional claims in published maps and institutional affiliations. |
© 2021 by the authors. Licensee MDPI, Basel, Switzerland. This article is an open access article distributed under the terms and conditions of the Creative Commons Attribution (CC BY) license (https://creativecommons.org/licenses/by/4.0/).
Share and Cite
Shi, L.; Zhu, J.; Wang, L.; Chu, S.; Tang, F.; Jin, Y. Comparative Analysis of Strength and Modal Characteristics of a Full Tubular Pump and an Axial Flow Pump Impellers Based on Fluid-Structure Interaction. Energies 2021, 14, 6395. https://doi.org/10.3390/en14196395
Shi L, Zhu J, Wang L, Chu S, Tang F, Jin Y. Comparative Analysis of Strength and Modal Characteristics of a Full Tubular Pump and an Axial Flow Pump Impellers Based on Fluid-Structure Interaction. Energies. 2021; 14(19):6395. https://doi.org/10.3390/en14196395
Chicago/Turabian StyleShi, Lijian, Jun Zhu, Li Wang, Shiji Chu, Fangping Tang, and Yan Jin. 2021. "Comparative Analysis of Strength and Modal Characteristics of a Full Tubular Pump and an Axial Flow Pump Impellers Based on Fluid-Structure Interaction" Energies 14, no. 19: 6395. https://doi.org/10.3390/en14196395