
How Long Will Combustion Vehicles Be Used? Polish Transport Sector on the Pathway to Climate Neutrality
by
 ,
,
Wojciech Rabiega
1, 
Artur Gorzałczyński
1,*,
Robert Jeszke
1,
Paweł Mzyk
1 and
Krystian Szczepański
2 1
National Centre for Emissions Management (KOBiZE), Chmielna 132/134, 00-805 Warsaw, Poland
2
Institute of Environmental Protection—National Research Institute (IEP-NRI), Krucza 5/11D, 00-548 Warsaw, Poland
*
Author to whom correspondence should be addressed.
Energies 2021, 14(23), 7871; https://doi.org/10.3390/en14237871
Submission received: 30 October 2021
/
Revised: 16 November 2021
/
Accepted: 18 November 2021
/
Published: 24 November 2021
(This article belongs to the Special Issue Trends in the Development of Electric Vehicle)
Abstract
:Transformation of road transport sector through replacing of internal combustion vehicles with zero-emission technologies is among key challenges to achievement of climate neutrality by 2050. In a constantly developing economy, the demand for transport services increases to ensure continuity in the supply chain and passenger mobility. Deployment of electric technologies in the road transport sector involves both businesses and households, its pace depends on the technological development of zero-emission vehicles, presence of necessary infrastructure and regulations on emission standards for new vehicles entering the market. Thus, this study attempts to estimate how long combustion vehicles will be in use and what the state of the fleet will be in 2050. For obtainment of results the TR3E partial equilibrium model was used. The study simulates the future fleet structure in passenger and freight transport. The results obtained for Poland for the climate neutrality (NEU) scenario show that in 2050 the share of vehicles using fossil fuels will be ca. 30% in both road passenger and freight transport. The consequence of shifts in the structure of the fleet is the reduction of CO2 emissions ca. 80% by 2050 and increase of the transport demand for electricity and hydrogen.
1. Introduction
The European Union has agreed to achieve climate neutrality by 2050. It requires a more rapid transformation in the road passenger and freight vehicle fleet than implied in the previously agreed Regulation (EU) 2019/1242 [1] and (EU) 2019/631 [2]. Currently, the member countries are considering a proposal to amend Regulation (EU) 2019/631 [3] on strengthening CO2 emission standards for new passenger cars and light duty vehicles (LDV’s).
The more one third of the final energy consumption in the EU27 in transport sector represents comes from fossil fuels (oil product). Moreover, the most used transport technologies rely on fossil fuel combustion, and current policies and measures up to 2050 will change it only in a limited manner.
The aim of this study is explore the potential pathway to climate neutrality, taking into account the specific characteristics of the Polish passenger and freight transport sector.
The current climate change situation requires concrete measures to reduce greenhouse gas emissions. The transport sector in Poland, which is responsible for a 20% of CO2 emissions in 2018 [4]. The presented study is in line of the discussion on the future of road transport and concerns the estimation of the number of vehicles in road transport in Poland by 2050. For this purposes the Transport European Emission Economic model (TR3E) was used, as a part of Life Climate CAKE PL [5].
Research focused on the potential of CO2 reduction in road transport is carried out around the world using various methods. For example, Barisa and Rosa [6] evaluated the potential for reduction of CO2 emissions in road transport sector applying DTReM-LV model (Dynamic TRansport emission Model for Latvia), Talbi [7] used VAR model to examine the same aspect in Tunisia. Research using the GEM-E3 (General Equilibrium Model for Economy, Energy and Environment) and PRIMES-TREMOVE models are important in the context of the European Union. They allow, among others simulations of CO2 emission, reductions in the transport sector in all member countries [8,9]. On the other hand, transport sector is necessary to ensure the security of the supply chain in the constantly developing world economy. For this reason, the relationship between development and CO2 emissions of the transport sector is also examined [10].
An important aspect in the context of the “green transformation” of transport is the conversion of the fleet from vehicles with internal combustion engines (ICEs) to zero-emission vehicles using electricity and/or hydrogen as a fuel. The use and development directions of zero-emission vehicles are the subject of recent studies. Many of them focus on aspects related to the degree of use of appropriate technological solutions and development of the relevant infrastructure (i.e., charging stations [11], ERS—electric road system [12,13] or hydrogen refueling stations [14,15]). The development of electromobility could be associated with increase in the demand for electricity [16,17,18] and hydrogen [19]. It is particularly important that this growing demand is met in a sustainable manner with energy generated from renewable sources [20,21,22]. An example of research on such aspects is the report “Potential Options and Technology Pathways for Delivering Zero-Carbon Freight in Poland” prepared by Cambridge Econometrics and Electric Vehicles Promotion Foundation (FPPE) [23]. This report explored the potential options and technology pathways for delivering zero-carbon freight transport in Poland. The study shows that a rapid transition to zero-emission (electric and hydrogen) road freight fleet can really reduce the CO2 emissions. Although the power sector of Poland currently is mainly based on coal, power sector will also decarbonize and freight CO2 emissions will indeed decrease.
Apart from technological challenges, regulations limiting the possibility of introducing new vehicles with internal combustion engines to the market are important. One of such instruments are the CO2 standards. The results of the analytical scenarios presented in the “Fit for 55” package (proposed by the European Commission) indicate that maintaining the CO2 emission standards of Regulation (EU) 2019/631 [2] will be insufficient to reduce emissions to levels consistent with the target of at least −55% for 2030 and climate neutrality targets for 2050. By this time the road transport emissions would have to be reduced by 19–21% till 2030 and by 90% by 2050 [3]. In the proposal amending Regulation (EU) 2019/631 [3], CO2 emission standards for new vehicles in 2030 compared to 2021 should be reduced by 55% for passenger cars and 50% for light duty vehicles (LDV’s). In 2035, it is assumed that the average level of emissions for new passenger cars and vans would reach zero. This means that only electric and hydrogen-powered vehicles would be available for purchase. Currently, many activities are being undertaken to prioritize zero-emission vehicles over combustion vehicles (e.g., green zones in large cities, free parking zones for BEV, the ability to move around the bus lane) [24]. These and other initiatives will influence the future decisions of consumers and companies in their choice of utilized transport types.
The climate neutrality transition in the transport sector requires time due to the need to implement appropriate solutions, both in terms of legislation and technology. There is therefore no doubt that vehicles with internal combustion engines will be phased out of the market. The question that arises at this stage is how long these vehicles will be in use. It should be remembered that ICE’s vehicles are still being produced and would be operational in several upcoming decades. Current prices for vehicles utilizing alternative technologies are not competitive to intensify their replacement.
Due to the fact that zero-emission technologies are at an early stage of development, various life time cycle analyses of vehicles are being undertaken. An example is Verma et al. [25] where the life cycle of electric vehicles has been compared with the life cycle of internal combustion vehicles. The assessment covered both the technical aspects and the environmental impact. A similar comparison was made by Bartolozzi et al. [26], in this case it was a comparison of the life cycle of two zero-emission technologies (hydrogen and electric vehicles). Zheng et al. [27] analyzed changes of survival rate of China passenger vehicles and implication to future energy consumption and CO2 emissions. On the other hand, Kegawa et al. [28] in a study for Japan found that extending, not shortening, the lifetime of a vehicle helps to reduce CO2 emissions throughout its life cycle.
The historical trend of CO2 emissions from the transport sector in Poland compared to the average of the European Union differs in 2005–2017 period. During this time the significant increase in emissions was observed in Poland (by 76%), while in the EU a 3% decrease in emissions occurred [4]. Under assumption that the emissions in transport will be growing in Poland in the nearly future, the possibility of CO2 emissions reduction may not be achieved [29]. The pace of transformation depends on the age of the vehicle fleet, the average lifetime and trends in the development of new technologies (i.e., EV battery life). Due to the previously mentioned specificity of road transport, taking up this topic is important in the process of climate neutrality achievement in Poland.
Sustainable transformation of transport requires consideration of many aspects. The pace of transition to zero-emission transport essential technological progress which translates to decrease of new vehicles purchase prices. The consumer’s decisions depends on these prices and relation between operation (variables) costs of ICEs and electric/hydrogen vehicles. The presented study analyzes these factors and points out to the life cycle of combustion vehicles. Our research examines the level of substitution ICEs by zero-emissions vehicles influenced by technological progress and consumer’s burden following CO2 emissions. All these factors are influencing the structure of the future vehicle fleet. The achievement of climate neutrality depends on how many combustion vehicles are still in use, which are the only source of CO2 emissions in transport sector. It is worth noting that in 2019 the Netherlands achieved the lowest average CO2 emissions from new vehicles—24 g CO2/km below the EU-27 average (122 g CO2/km). In Poland, this average was higher by 10 g CO2/km [30]. Therefore, the question arises, how should the sales structure be changed in order to achieve the goals for 2020 (95 g CO2/km)? The developed scenario NEU is in line with the agenda of current energy and climate policy (i.e., “fit for 55” package). The simulation results highlight an important aspect that should be taken into account in future legislation on the sale of new vehicles, phase out from sale ICEs and exploitation cost covering emission cost (carbon pricing).
2. Materials and Methods
2.1. Transport European Emission Economic Model—“TR3E”
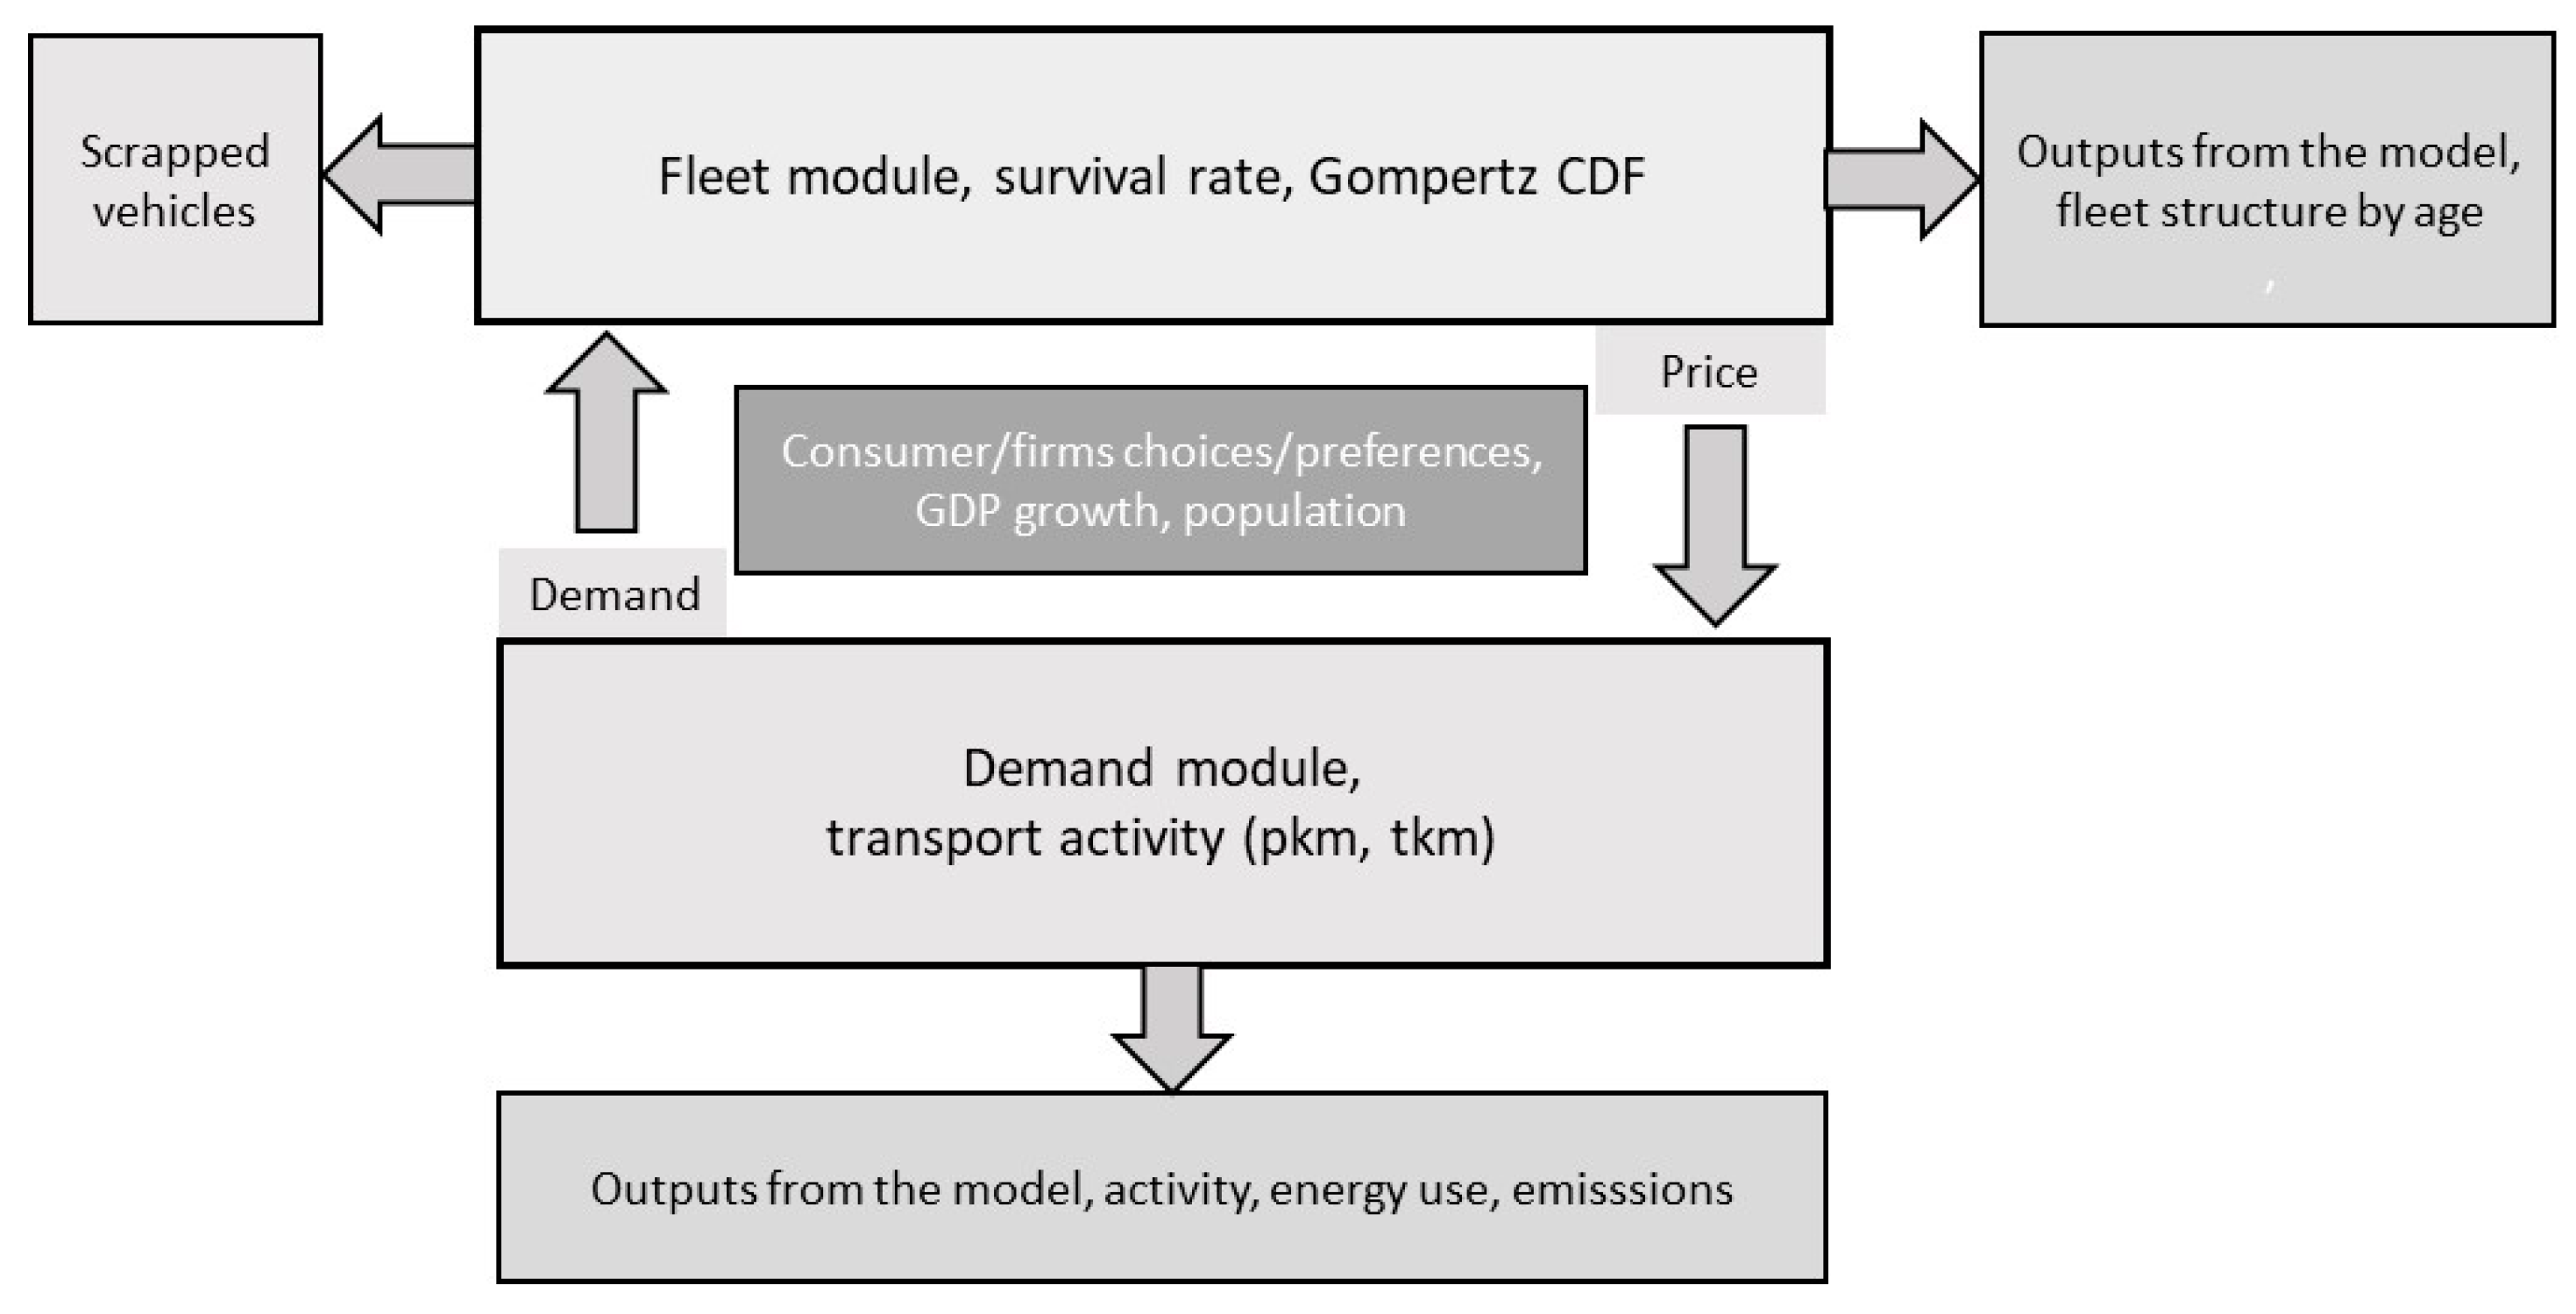
The TR3E transport sector model belongs to the class of partial equilibrium models (covering only a selected part of the market to achieve equilibrium state) [31]. In a model of this class, the clearing on the market of some specific goods is obtained independently from prices and quantities in other markets. It means that the prices of all factor (i.e., fuels, vehicles) and income levels of agents (consumers) are taken as given. This approach compared to a general equilibrium model is simpler and allow us more extensions. An additional module the TR3E is the anticipating of fleet structure. Prices adjust in the dynamic process until supply equals demand. It allows us to study efficiency and comparative statics.
The model consists of the transport demand allocation module and the technology choices module (see Figure 1). These modules are solved simultaneously and the flow of information takes place. The transport demand module simulates decision regarding allocation of transport activity to various modes (types) for both individuals (households) and businesses. The technology choice module determines the vehicle technologies (transport means) that will be used in order to satisfy transport demand. Both modules are dynamic over time at annual resolution with a time horizon until 2050.
The TR3E model was design for passenger and freight transport and covers 4 main modes: road, rail, aviation and water transport. Due to characteristics on engine types and technology options, up to 37 were means of transport distinguished. The historical data comes from JRC Integrated Database of the European Energy Sector (IDEES) database. This collection included the following: transport activity, energy consumption, demographic and climate data. For the level of stock data was updated from national statistics—Local Data Bank [32]. The prices of new vehicles for baseline year and modelled economic possibilities for reducing cost for specific technology were taken from the PRIMES-TREMOVE [33]. The fuel cost (oil products) was calculated based on World Energy Outlook [34].
To define the baseline scenario data from POTEnCIA [35] model was used. The POTEnCIA Central Scenario is also developed by JRC. European Commission applies results from these scenario in the areas of energy, transport and climate action. Policy-makers can analyze the long-term scenario concerning economic activity, energy mix and use also transport structure for the future legislation. Development of activity technologies (means of transport) were simulated based on the results of the POTEnCIA Central Scenario. Moreover, energy use (for new vehicles and the old one), carbon intensity of activity for different types of transport were calculated based on the same source.
TR3E covers all 28 EU countries, it is solved with a time horizon up to 2050 with an annual resolution. Model outputs include activity levels (passenger-km travelled or tonne-km carried), energy consumptions (oil products, electricity and hydrogen) and emission levels (CO2). The model has an extended fleet module for passenger car, light and heavy duty vehicles. The fleet module varies according to fuel and age of vehicles (up to 30 years old). For a detailed description of the TR3E model see Rabiega et al. [31].
2.2. Demand Module
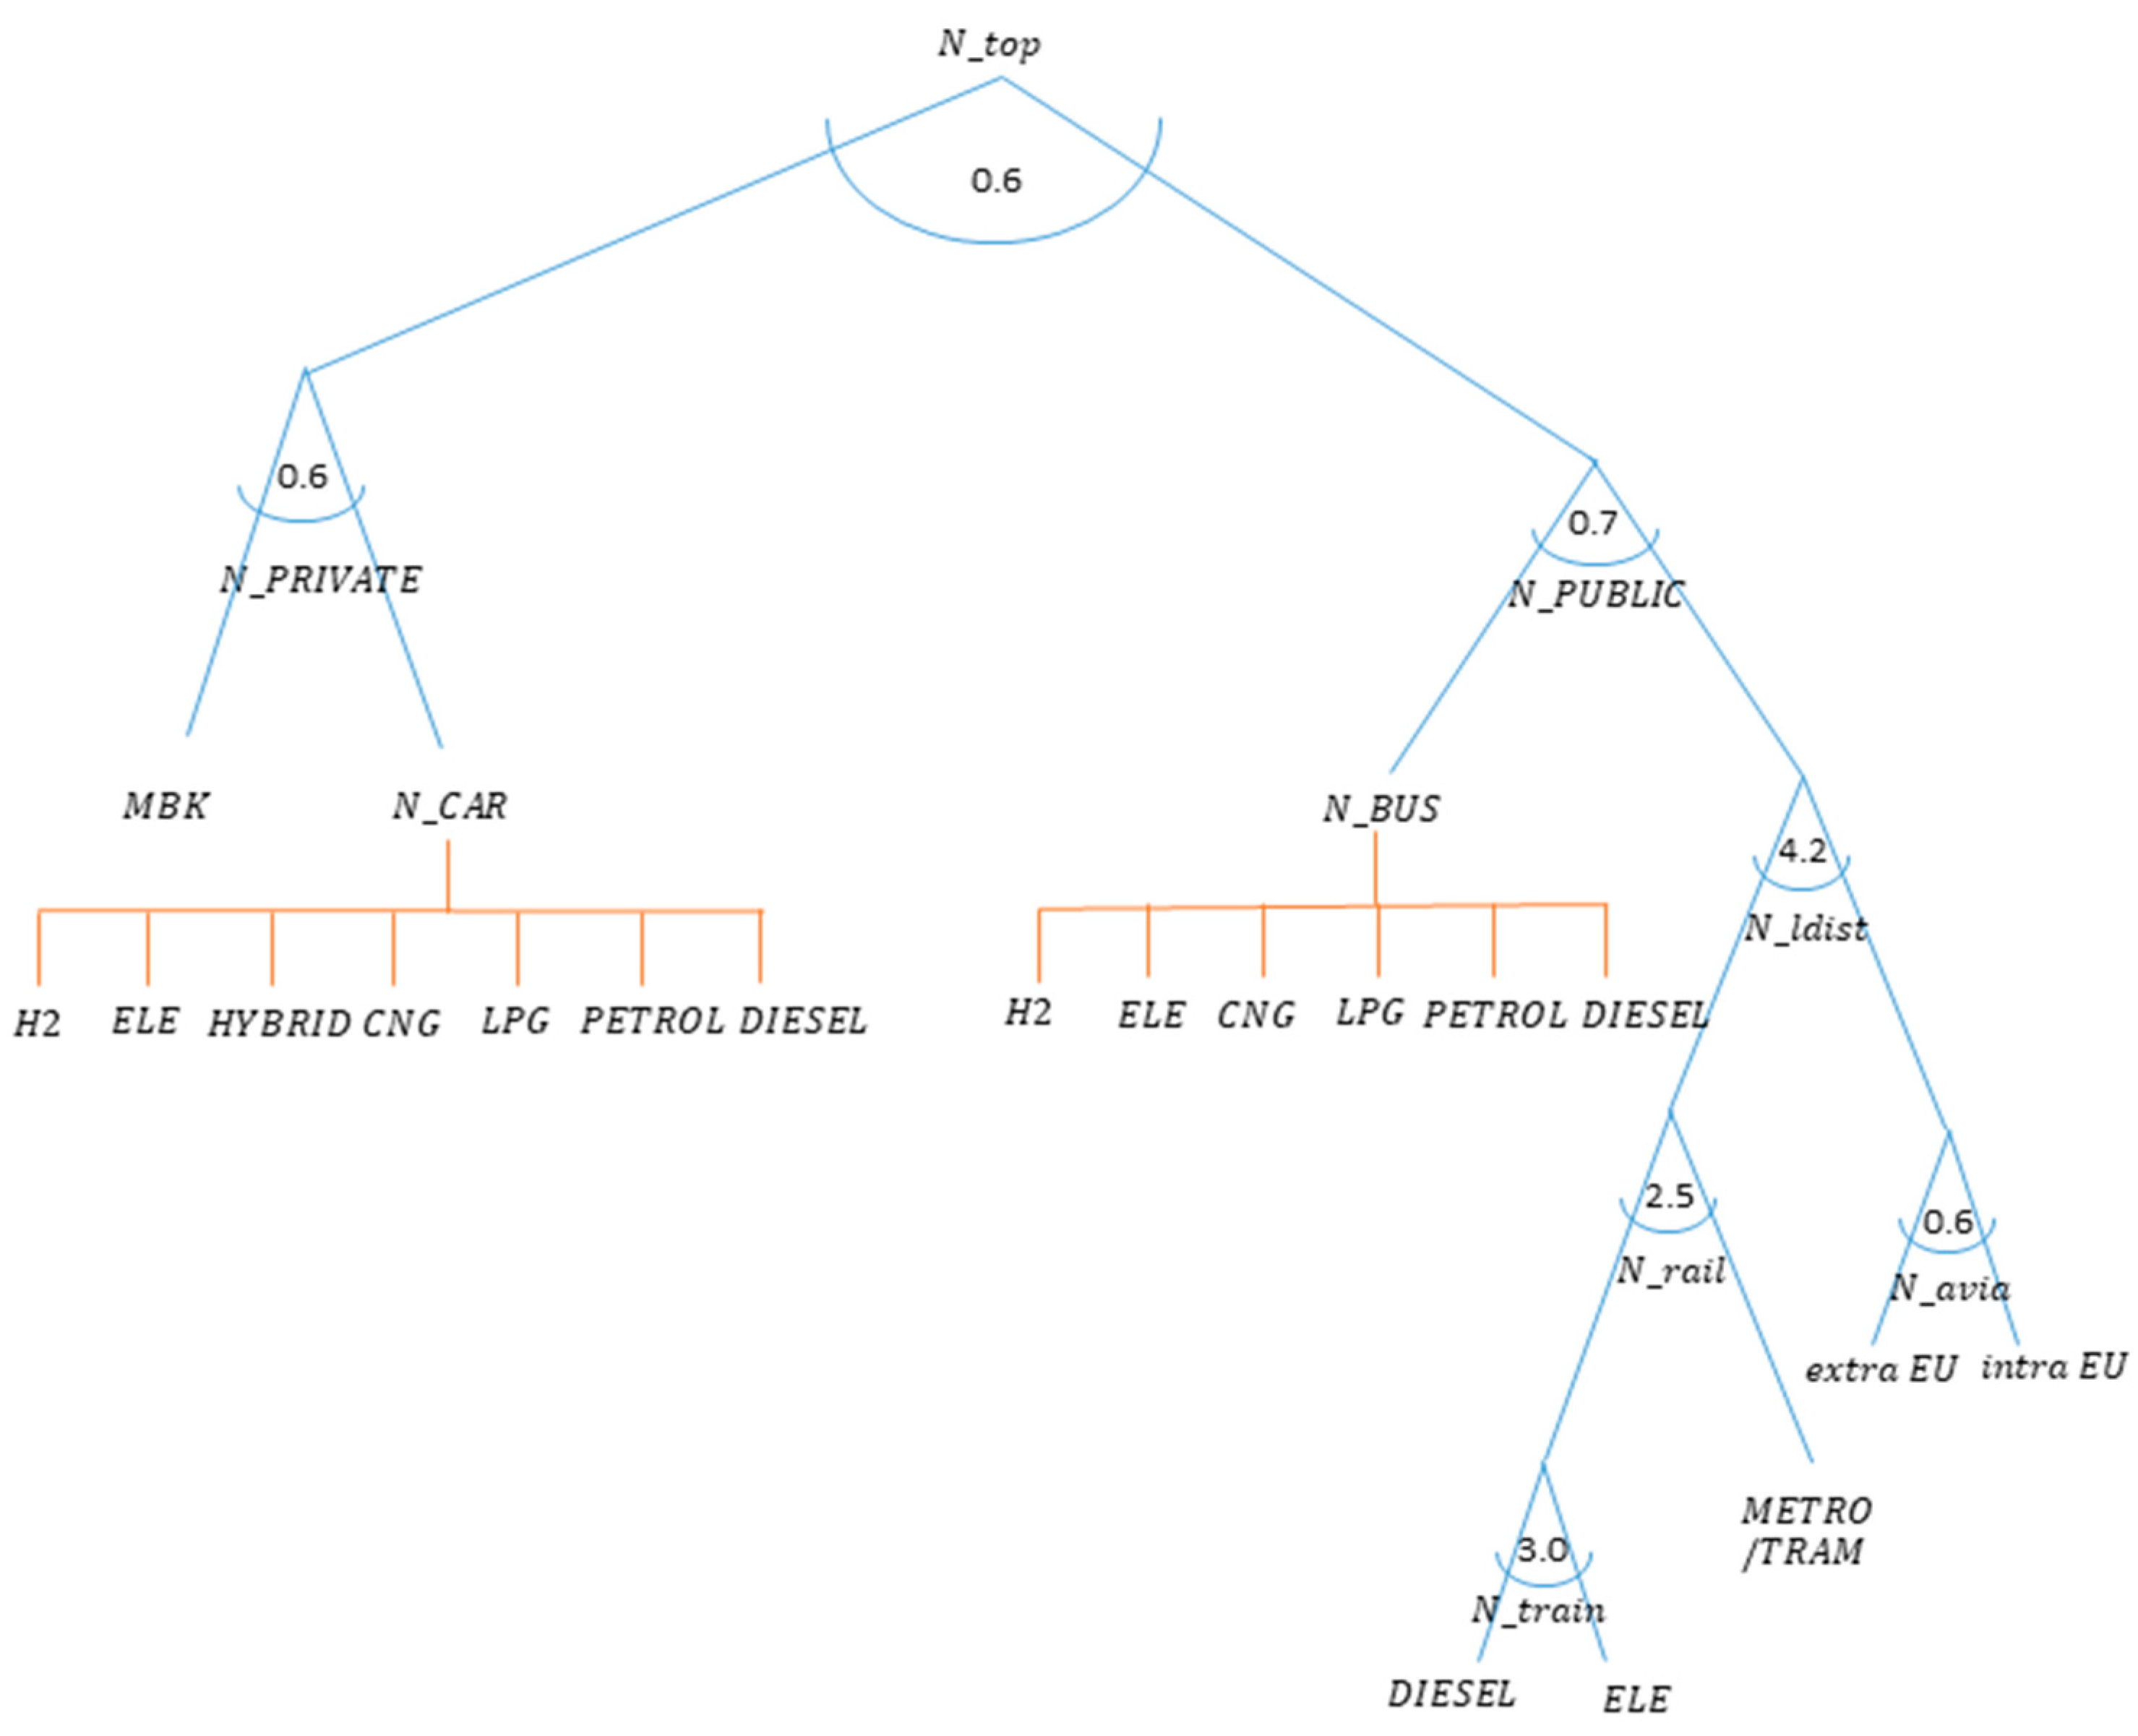
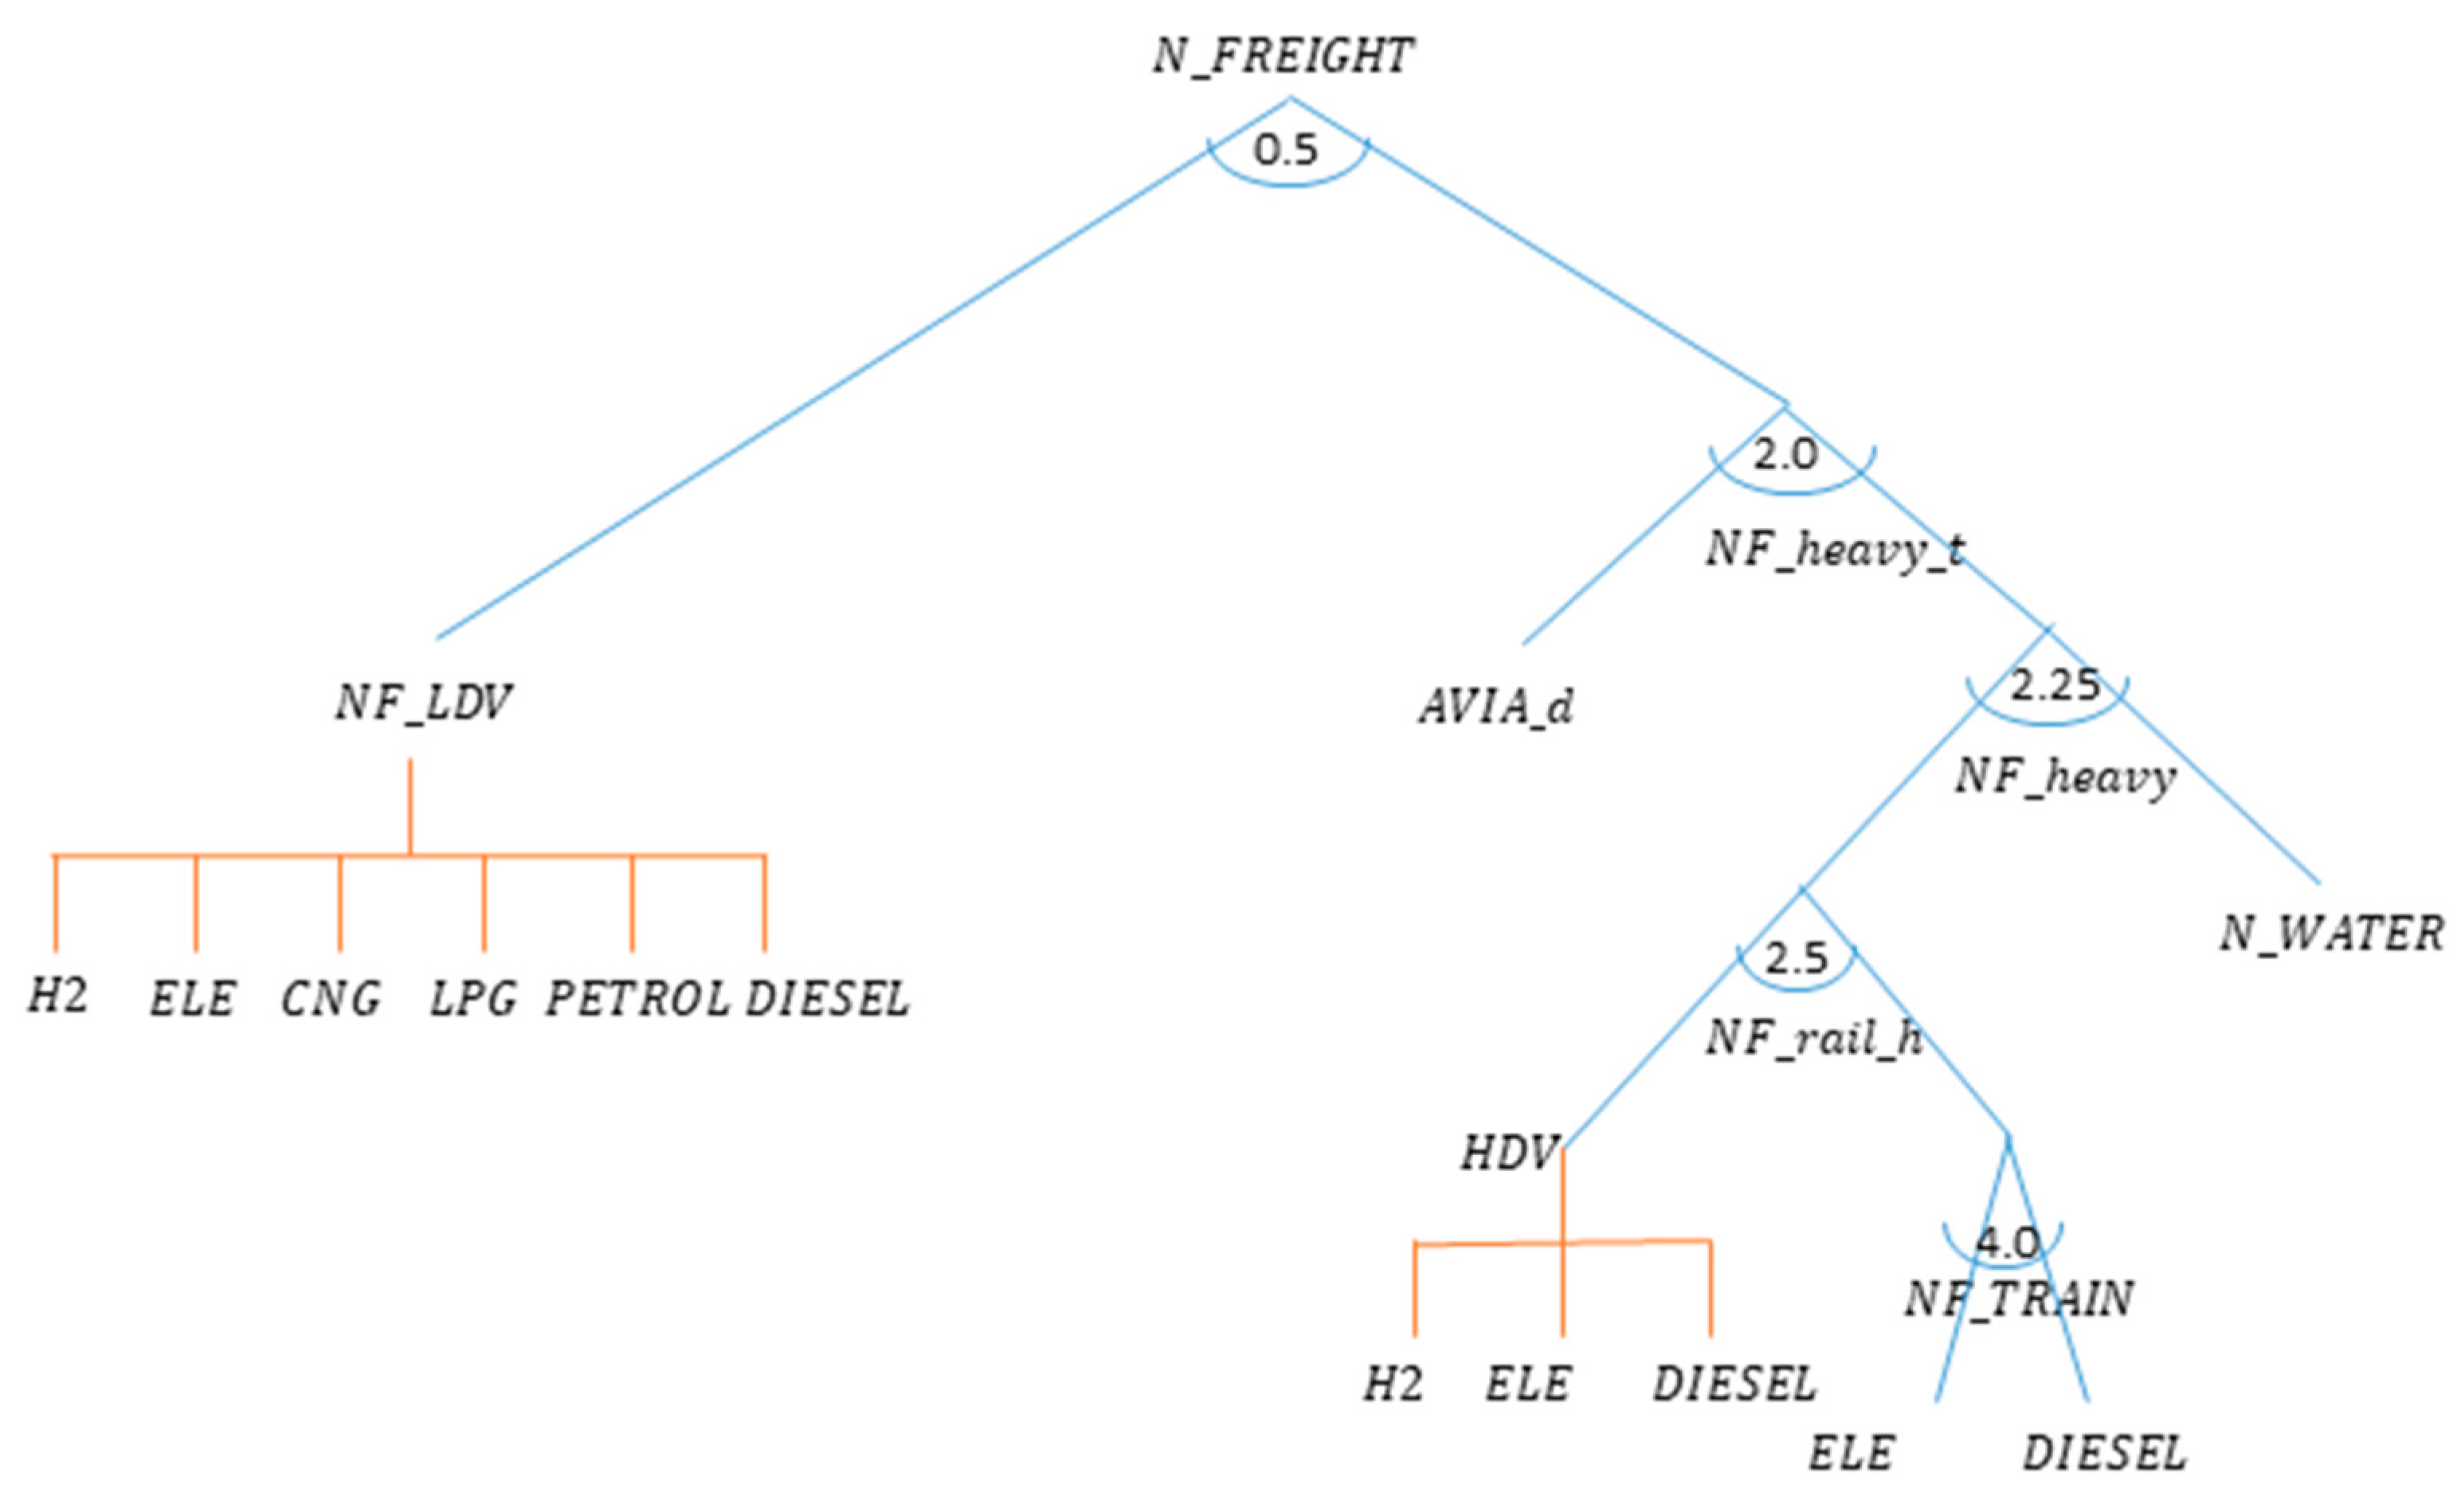
The demand part of model represents changes of volume and structure transport activity. These flows (decision process) depend on consumer preference and relation of prices transport services. The users of transport are selecting the volume of transport and preferred means. The choices are made by households and businesses separately. In TR3E the choice of transport mean using a nested way approach. The nested constant elasticity of substitution (CES) function [36,37] was applied during designing model structure. The nested CES utility function captures the preferences of households and firms. Using CES function determines the constant percentage change in the relation of factors (e.g., private cars and public transport) in quantity adequate to a percentage change in prices. The decision tree for passenger transport illustrates the Figure 2, freight transport decision tree was presented on Figure 3.
The nested CES utility (production) technology was mark with an arc mean. The decision on the choice of vehicle was applied using the standard multinomial discrete choice model and marked with Π on the graphs [38,39]. The CES demand function for activity by given vehicle type for cars, motorbikes, trains, buses was defined based on Rutherford [37]:
where:
denotes the demand for the “composite” in mode ,
is price for the transport activity in mode ,
denotes the demand for type of vehicle (fuel) in mode ,
is the price for technology in mode ,
and —are benchmark values for activities,
—is elasticity of substitution between the vehicle technologies.
2.3. Costs Module
In TR3E model the choice between the means of transport are based on demand functions, which includes response to level of transport costs. For each type of transport means the cost per mile was calculated. This cost per mile consists of three factors:
- cost of energy carrier per km travelled (petroleum, diesel, electricity, hydrogen, etc.),
- values of the repair and the insurance (maintenance) per vehicle,
- purchase price of new vehicle.
Formula shows this disaggregation of cost per mile:
In this case:
denotes the costs of energy carrier for technology and mode ,
is the annual value of repair and insurance of vehicle in technology , and
denotes purchase price of new vehicle [40].
indicates the total travelled distance by vehicles in given technology.
2.4. Survival/Scrappage Rate—Fleet Module
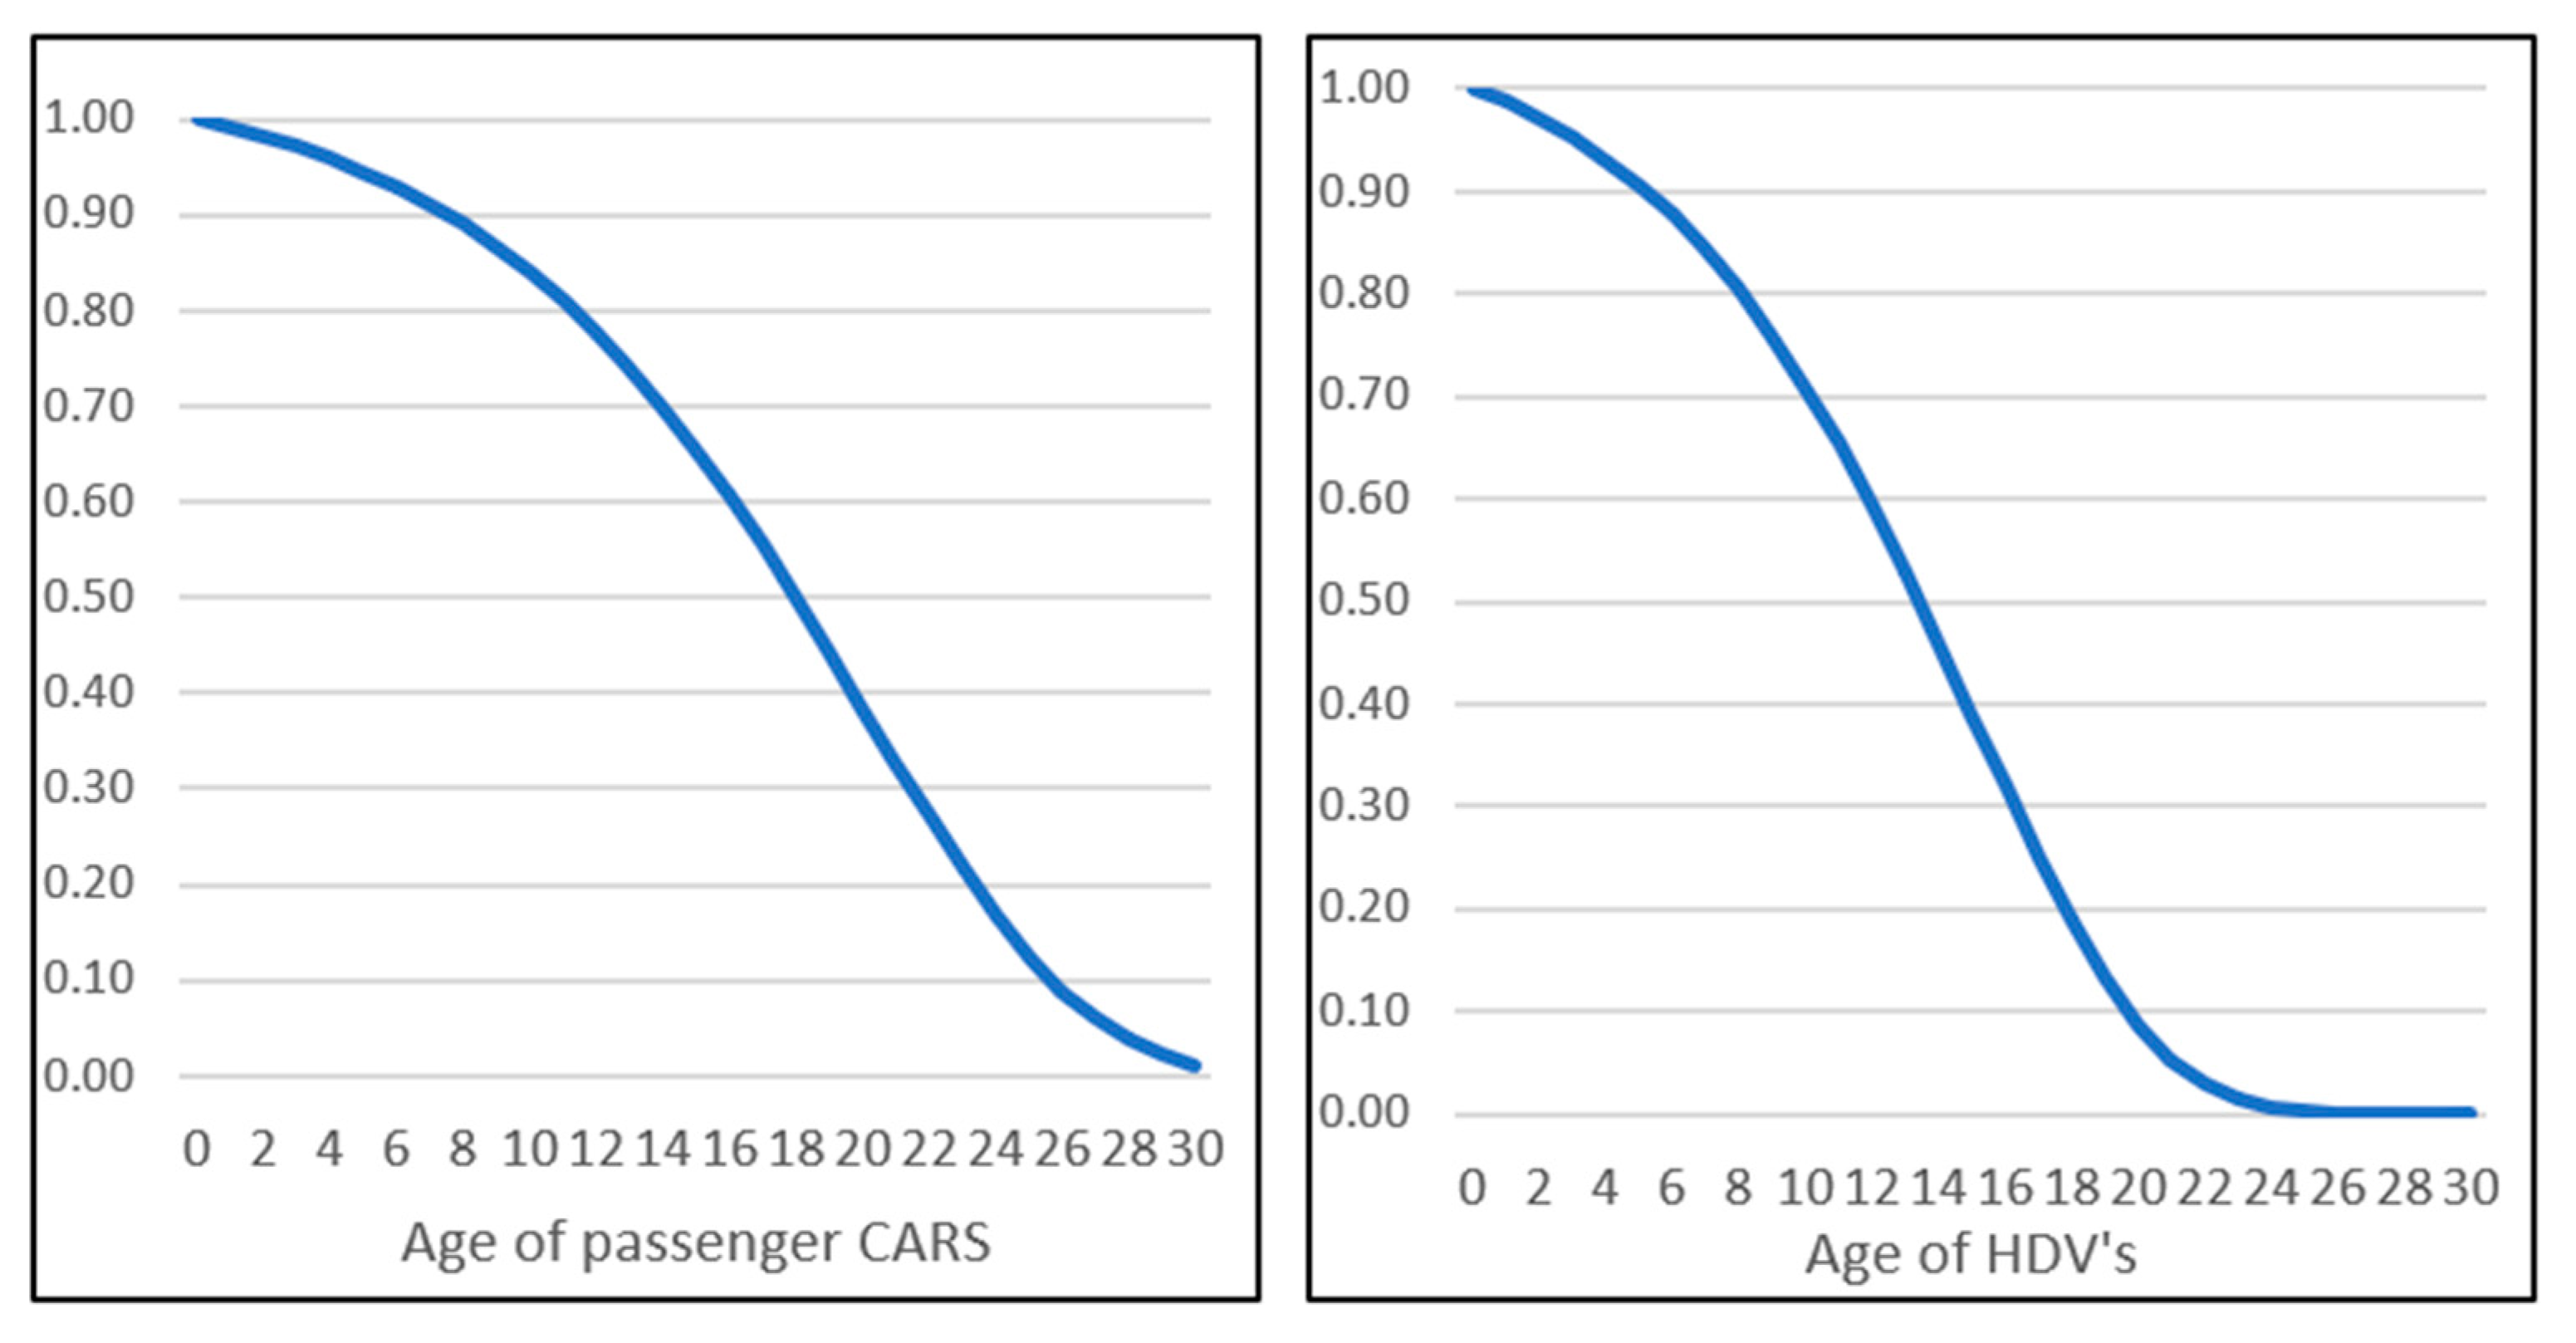
In TR3E model the fleet of the vehicles was modelled using survival rate based on probability density. For this purpose, cumulative distribution function (CDF) of the Gompertz distribution was used:
This function is a type of mathematical model—generalised logistic function. The Gompertz survival function corresponds to exponential mortality rate increases with time. The parameters in this distribution are:
—denotes the scale parameter;
—indicates the shape parameter (corresponding to scrappage rate).
All the parameters of the CDF (Gompertz’s) function were selected such that they properly reflect the vehicle structure by age of fleet [41,42,43]. For passenger cars, age of fleet was designed up to 30 years and for freight vehicle to 25 years old. The survival rates that were used in the fleet module of TR3E model are presented on Figure 4. The average age of the vehicles was calculated using IDEES dataset and corresponds to the average age of the vehicle from the theoretical distribution. In the fleet module, new cars replace the scrapped ones and come into use to meet the demand for additional transport services (activities).
2.5. Neutrality Scenario (NEU)
The climate neutrality scenario (NEU) was developed as part of the analysis prepared by the team of the Life Climate CAKE PL. In this scenario, the total reduction of GHG emissions results from the amended EU climate policy [44,45,46] and the assumed increase in the net reduction target for 2030 to at least 55% compared to the emissions from 1990 and the achievement of net zero emissions in 2050, i.e., taking into account removals from LULUCF (Land use, land-use change, and forestry) sector and using technologies to remove GHG emissions from the atmosphere. This level of GHG emission reduction by the EU meets the goal of the Paris Agreement, which is to reduce the global temperature change by 1.5 °C [47]. Following the new EU climate policy, it was assumed that in 2030 the non ETS sectors would reduce their emissions by 40% (based on Fit for 55 package), and in 2050 by 82% compared to the 2005 level). The burden sharing emission reduction efforts between EU member states in non-ETS was allocated using gross domestic product (GDP) per capita in 2018 [48]. For Poland, the target is set at the level of −18% in 2030 and in 2050 −62% compared to the emission in 2005. In neutrality scenario the scope of non-ETS sectors throughout the analyzed period of time do not change and stay as it is today.
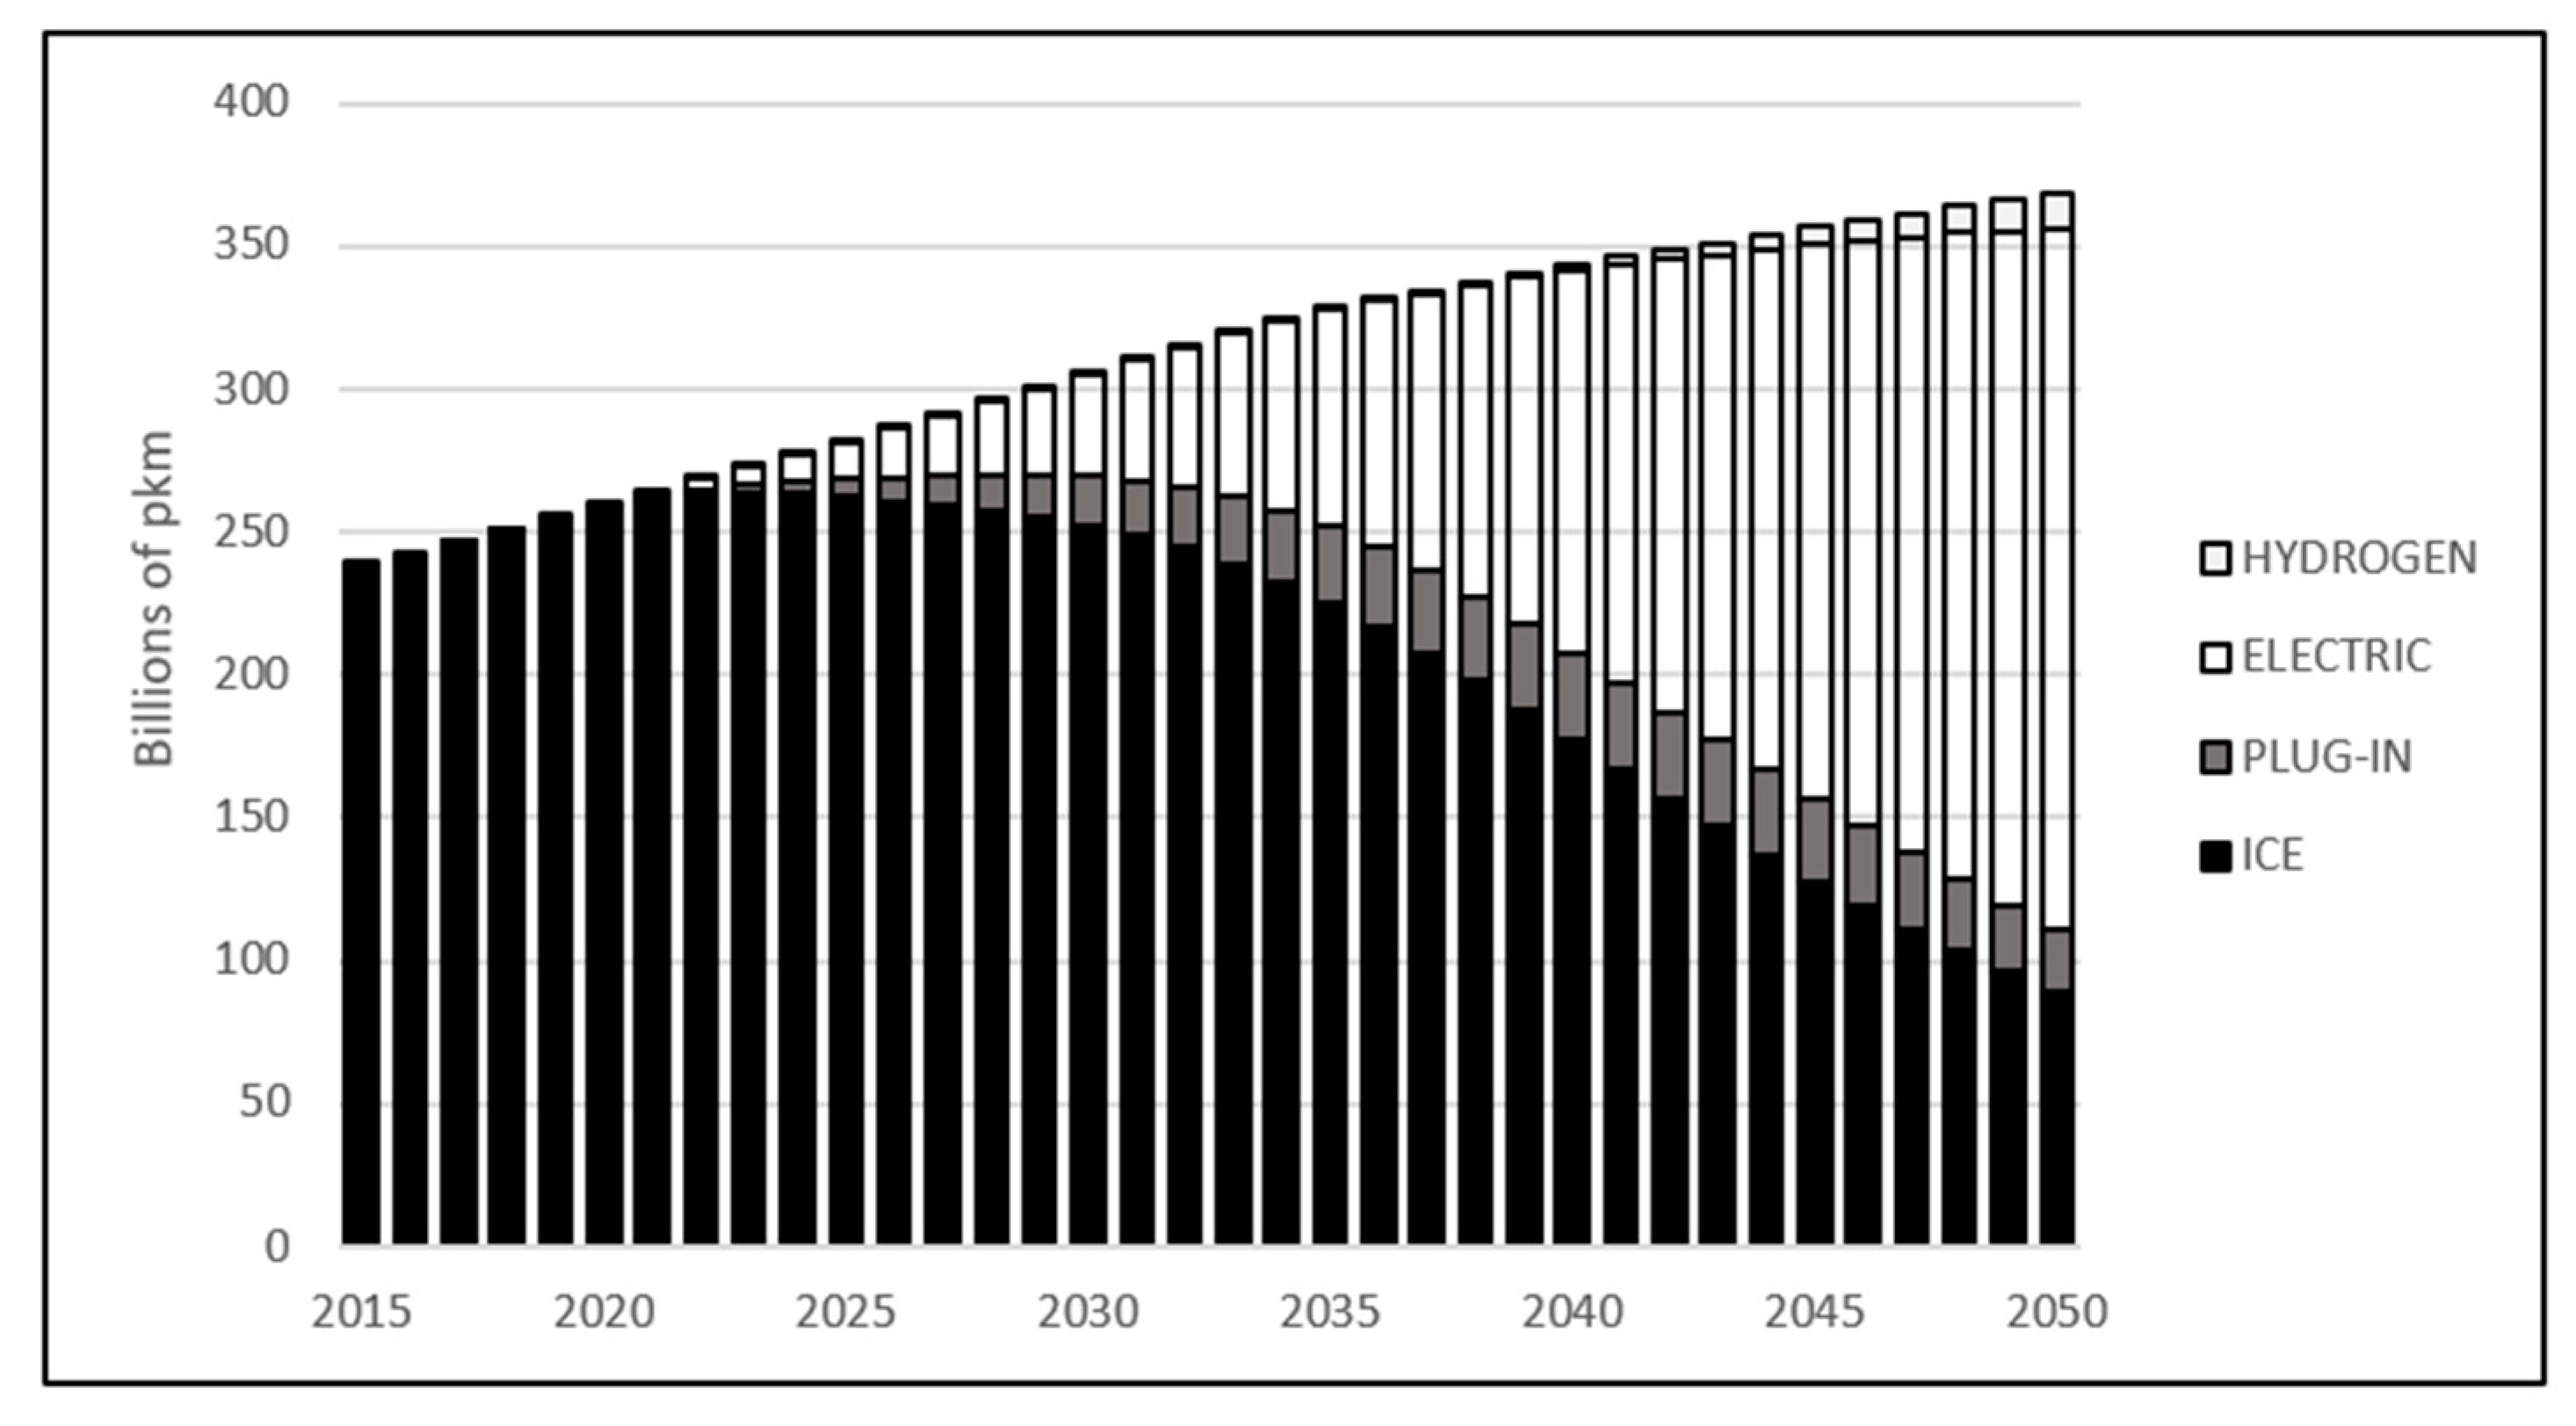
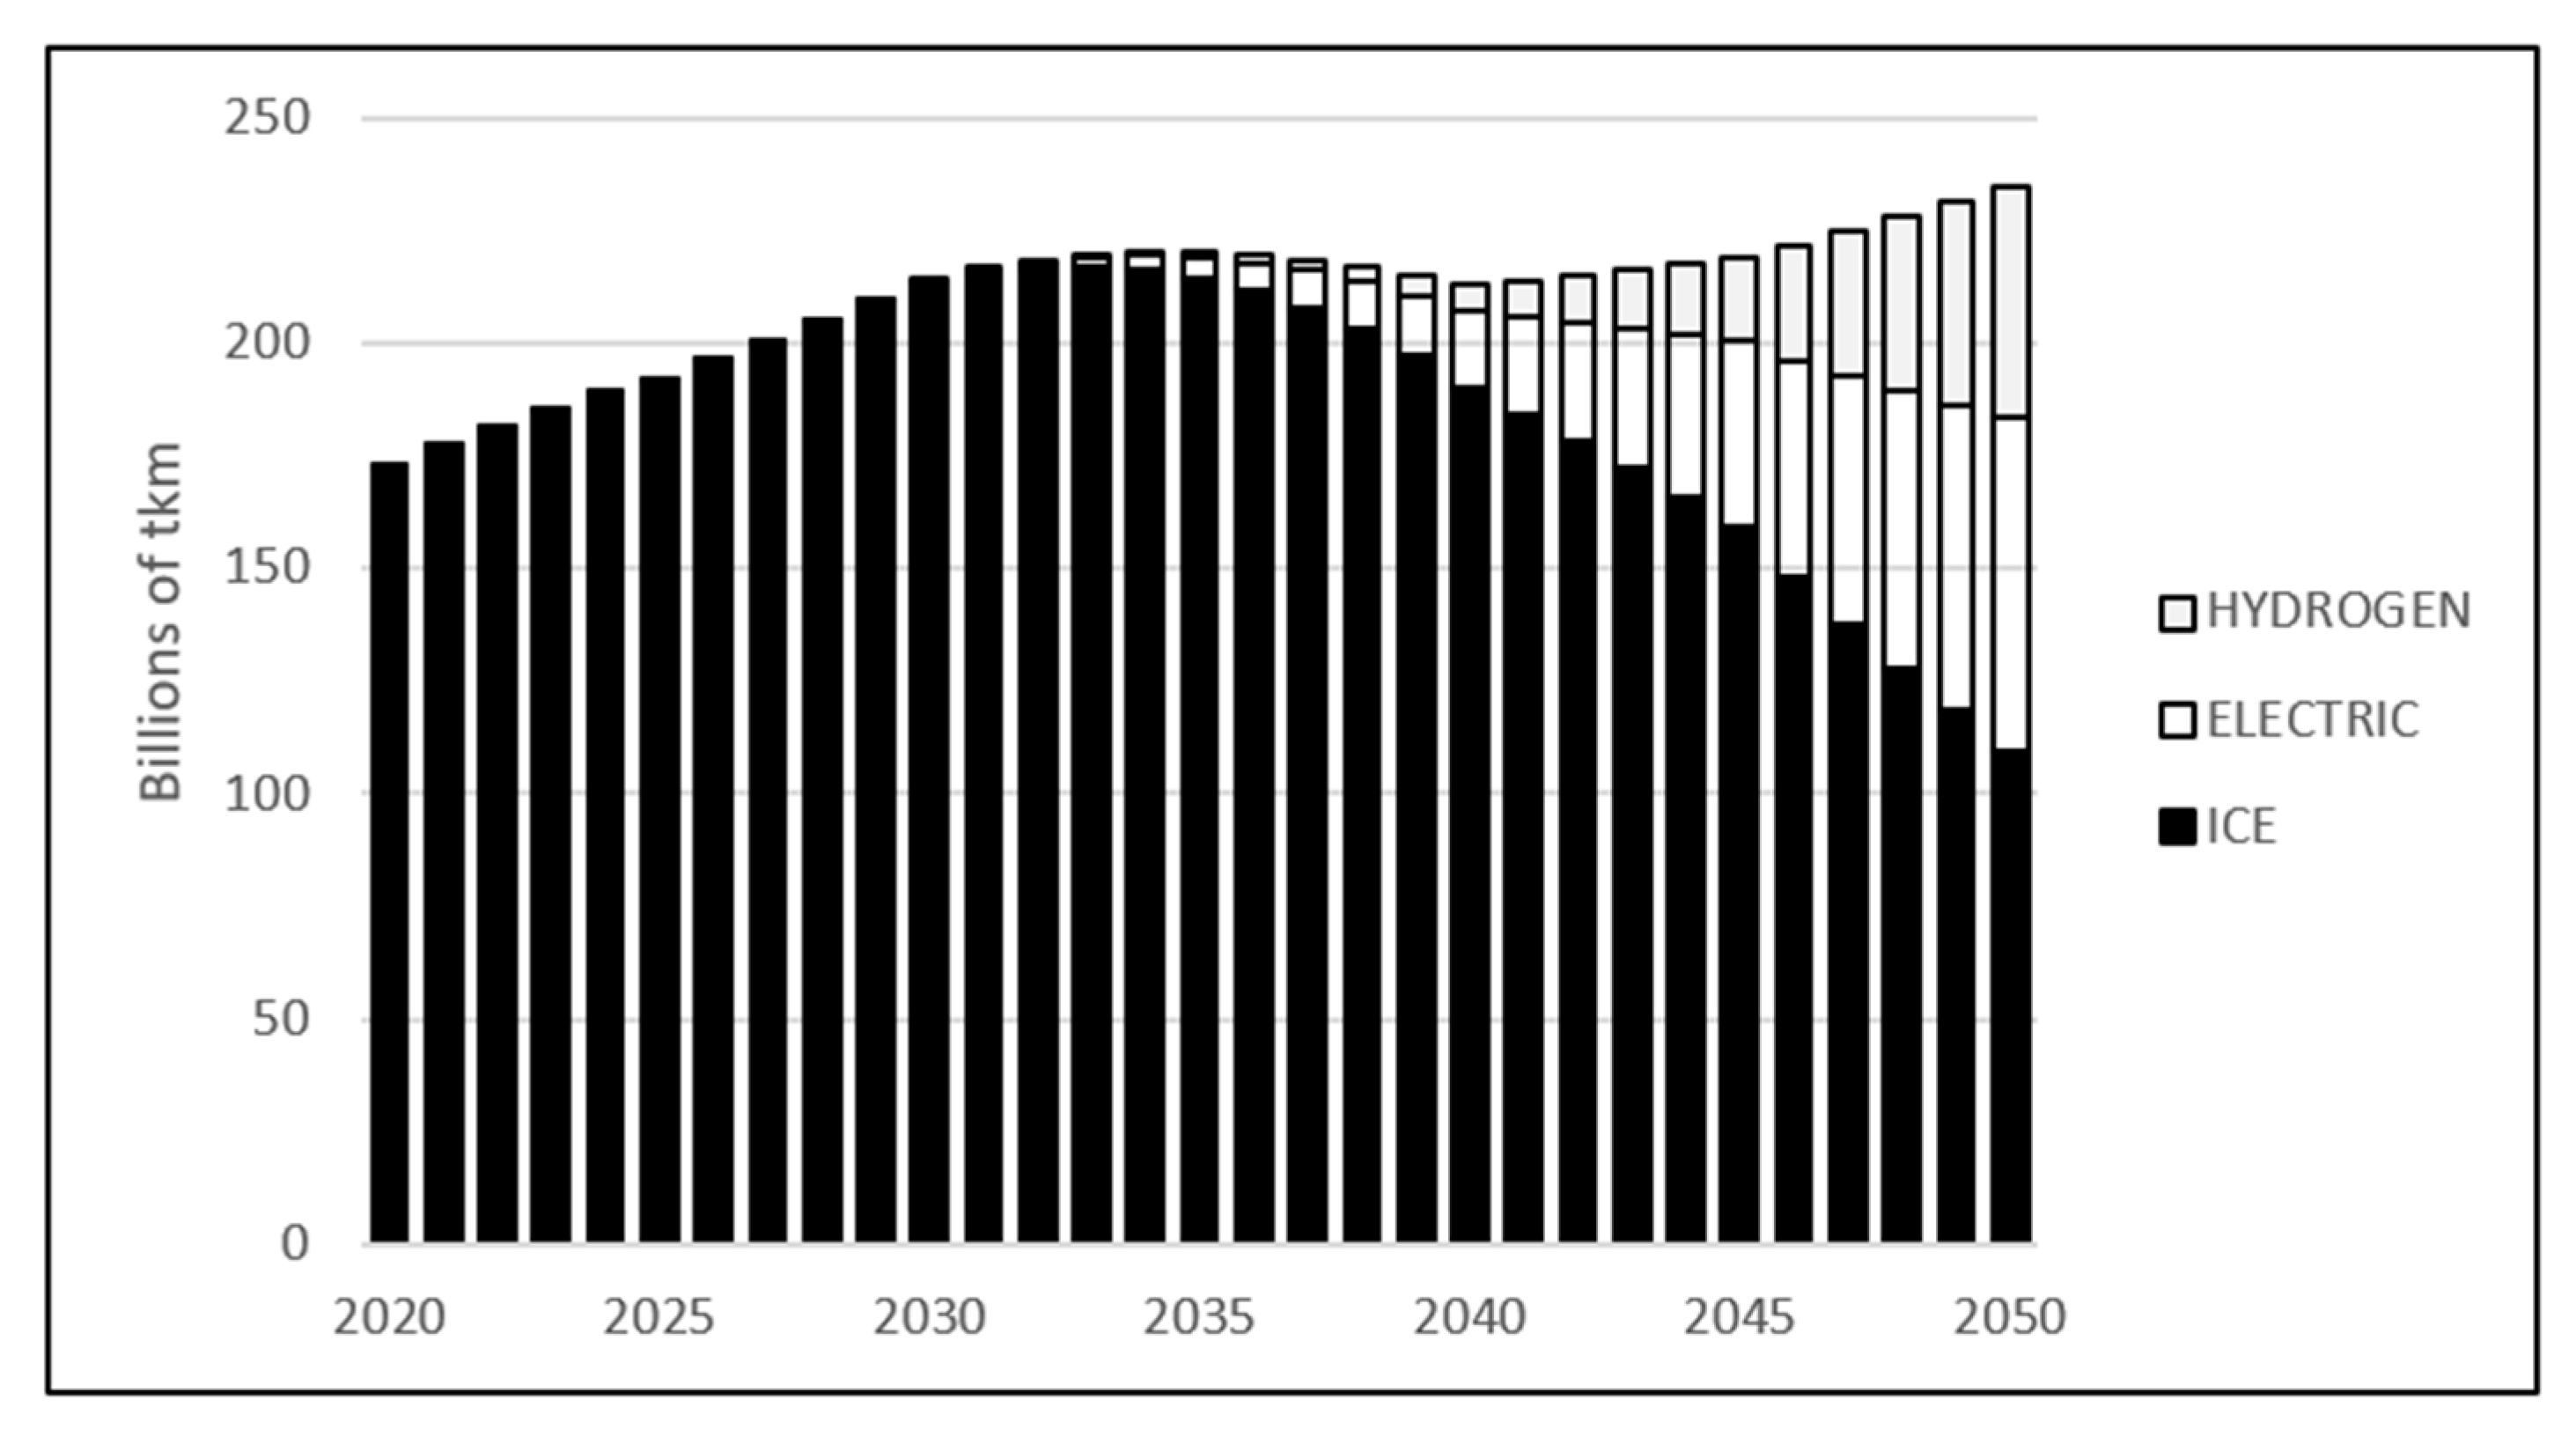
In the TR3E model, NEU scenario was designed taking into account the following aspects. First of all, in the TR3E model, transport activity is determined on the basis of GDP projections from d-PLACE [49]. The projection of GDP for the years 2020–2050 are received from d-PLACE model at 5-year intervals. Then, this projections are used to calculate activity growth. Consequently, obtained new activity levels which were converted into annual intervals, because of the TR3E model is resolved for each year. The charts below show the results for passenger and freight road transport activity in Poland for the NEU scenario. Projections of GDP from d-PLACE model indicate an almost double increase of GDP in the years 2020–2050. This phenomenon has significant impact on the growth of demand for transport services. In passenger transport (Figure 5), the increase in transport activity is approx. 42% between 2050 and 2020, which results, for instance, from rising mobility of employees. On the other hand, economic development requires securing the supply chain. For this reason, freight transport activity increases. In Poland in NEU scenario road freight transport activity increases by ca. 36% until 2050 (see Figure 6).
The second aspect is to assume the technological progress of new zero emission technologies such as the Battery Electric Vehicle (BEV) or the Fuel Cell Electric Vehicle (FCEV). In the TR3E model, this progress is seen as a decline in the prices of zero-emission vehicles according to the assumed trend for a given technology [50], which has a direct impact on the reduction of the total cost of ownership (TCO). Consequently, zero-emission vehicles are gradually replacing conventional vehicles.
Achieving climate neutrality will be associated with the costs of transformation. This translate to marginal abatement reduction cost (MAC) of CO2. The cost of reduction is expressed as the non-ETS price in EUR/tCO2. This price is provided from the d-PLACE model and then converted in the TR3E model into the emission cost based on the emission intensity of a given vehicle technology according to the formula:
where:
emiss_cost = nets_pem ⋅ emiss_int,
- emiss_cost—emission cost per 1 km,
- emiss_pem—non-ETS price (marginal abatement cost) from the d-Place model, [in EUR/tCO2],
- emiss_int—emission intensity of activity [in tCO2/km].
Then, the emiss_cost parameter is added to the fuel price, which increases the operating costs of vehicles using fossil fuels. In the case of Poland, the costs in the non-ETS sector obtained in the NEU scenario reach the level of approx. 120 EUR/tCO2 in 2030, while in 2050 they increase to approx. 1300 EUR/tCO2 [51]. The applied marginal cost of reduction should not be directly equated with the price of emission allowances (EUAs) in the EU ETS. Since no market model for the EU ETS was used to determine the marginal reduction cost. Therefore, it did not take into account, inter alia, surplus of EUA/EUAA allowances on the market, the functioning of the MSR (Market Stability Reserve) reserve and the possibility of banking allowances between subsequent years and EU ETS settlement periods. The possibility of buying allowances by enterprises to meet future needs was not taken into account, as well as the role of financial institutions, whose activity on the EU ETS market is now starting to grow.
The last aspect that plays a role in the NEU scenario is the prices of electricity and petroleum-derived fuels. Projections of these prices are generated in the MEESA [52] energy model and fed to the TR3E model via the d-PLACE model. The electricity price depends on energy generation mix structure, which is generating in MEESA model. Based on the data provided, the price growth paths for the years 2020–2050 were calculated [in the case of energy prices—separately for each EU country, while for petroleum-derived fuels—the average growth for the EU]. The TR3E model, on the other hand, provides the MEESA model with information about the transport demand for electricity and petroleum-derived fuels. The feedback between the TR3E and MEESA models to some extent reflects the possible directions of development both on the side of transport and the energy mix in the process of achieving the goal of climate neutrality.
3. Results
3.1. Changes in the Structure of Passenger and Freight Road Fleet
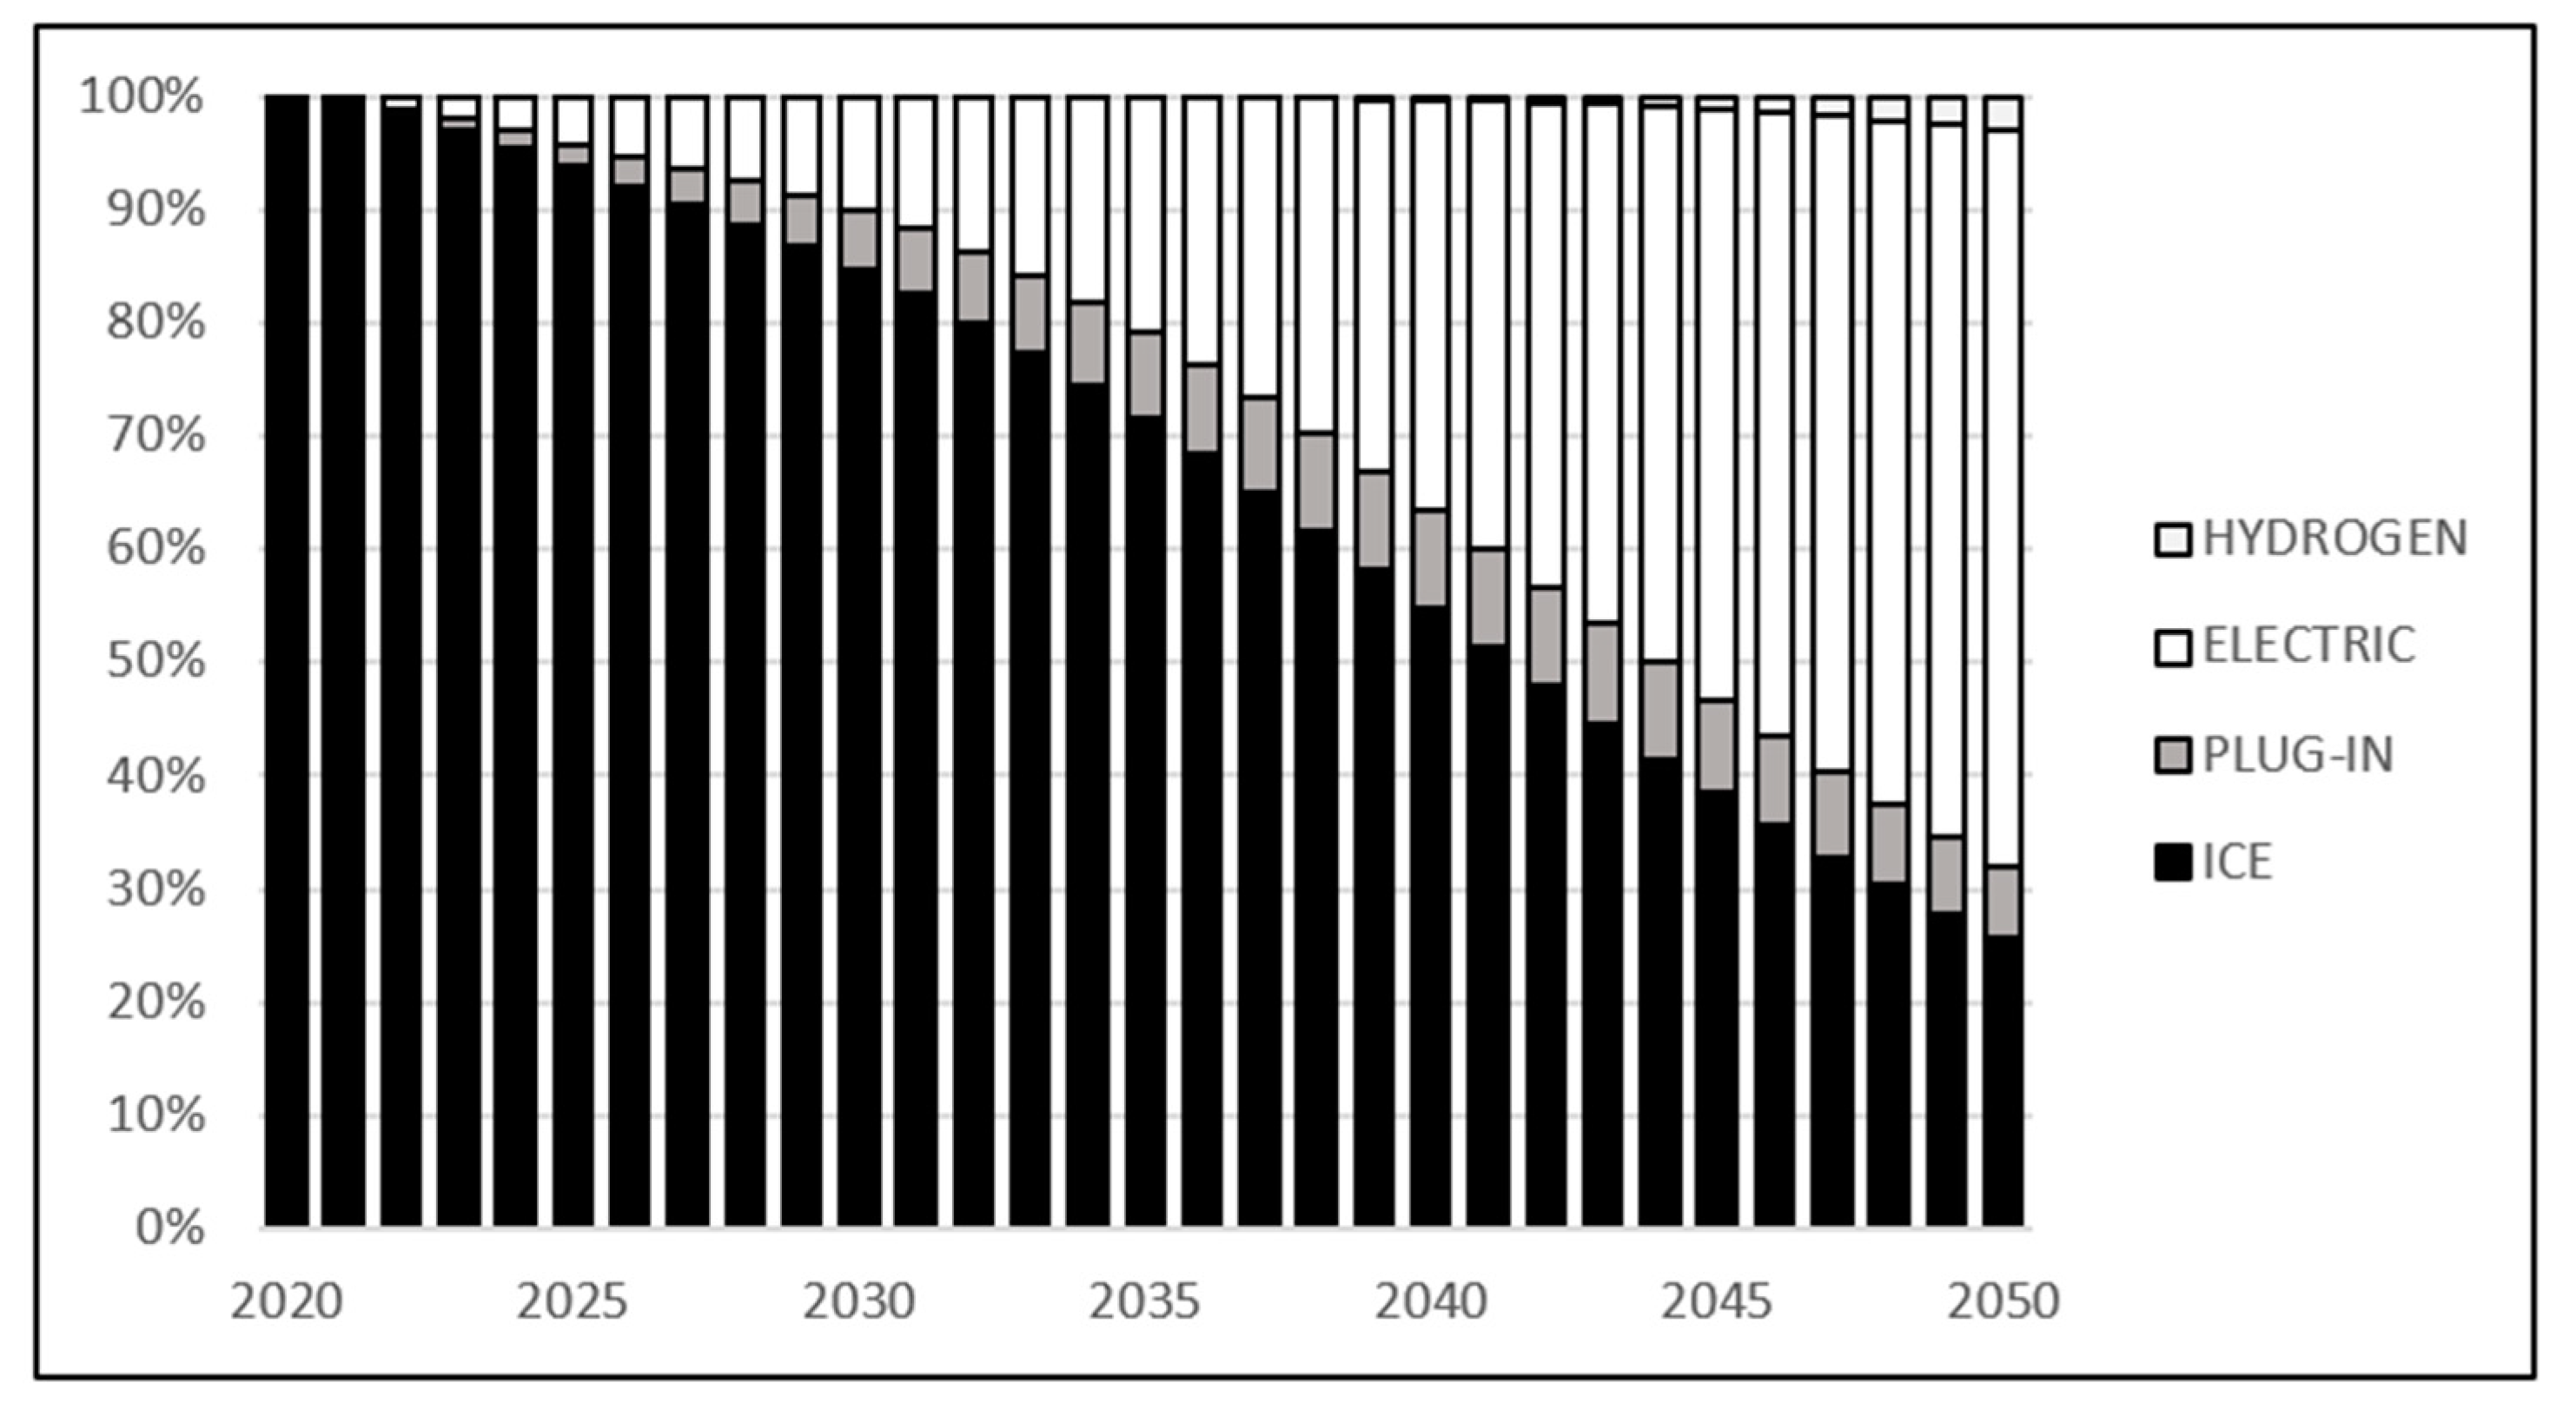
The results of the analysis show that in the climate neutrality (NEU) scenario, electric cars will be responsible for 50% of the activity of all passenger cars around 2045, and by 2050 they will account for about 65% of the passenger car fleet in Poland (Figure 7). At the same time, cars with ICE engines will reduce their share to ca. 26% by 2050, which translates into almost 5.5 million vehicles. Replacing combustion vehicles with electric ones results from lower total operating costs. The equalization of purchase prices for electric cars with internal combustion vehicles takes place between 2025 and 2030.
In case of public road transport (Figure 8), the share of buses using fossil fuels will amount to approx. 40% of the fleet in 2050. The rest of the activity will be replaced by electrification (approx. 50%) and the use of hydrogen (approx. 10%). Internal combustion engines will be more difficult to replace in long distance coaches. Electric buses will be used mainly in public transport and for shorter distances. The weight of the batteries for long-haul coaches is a significant obstacle to their use.
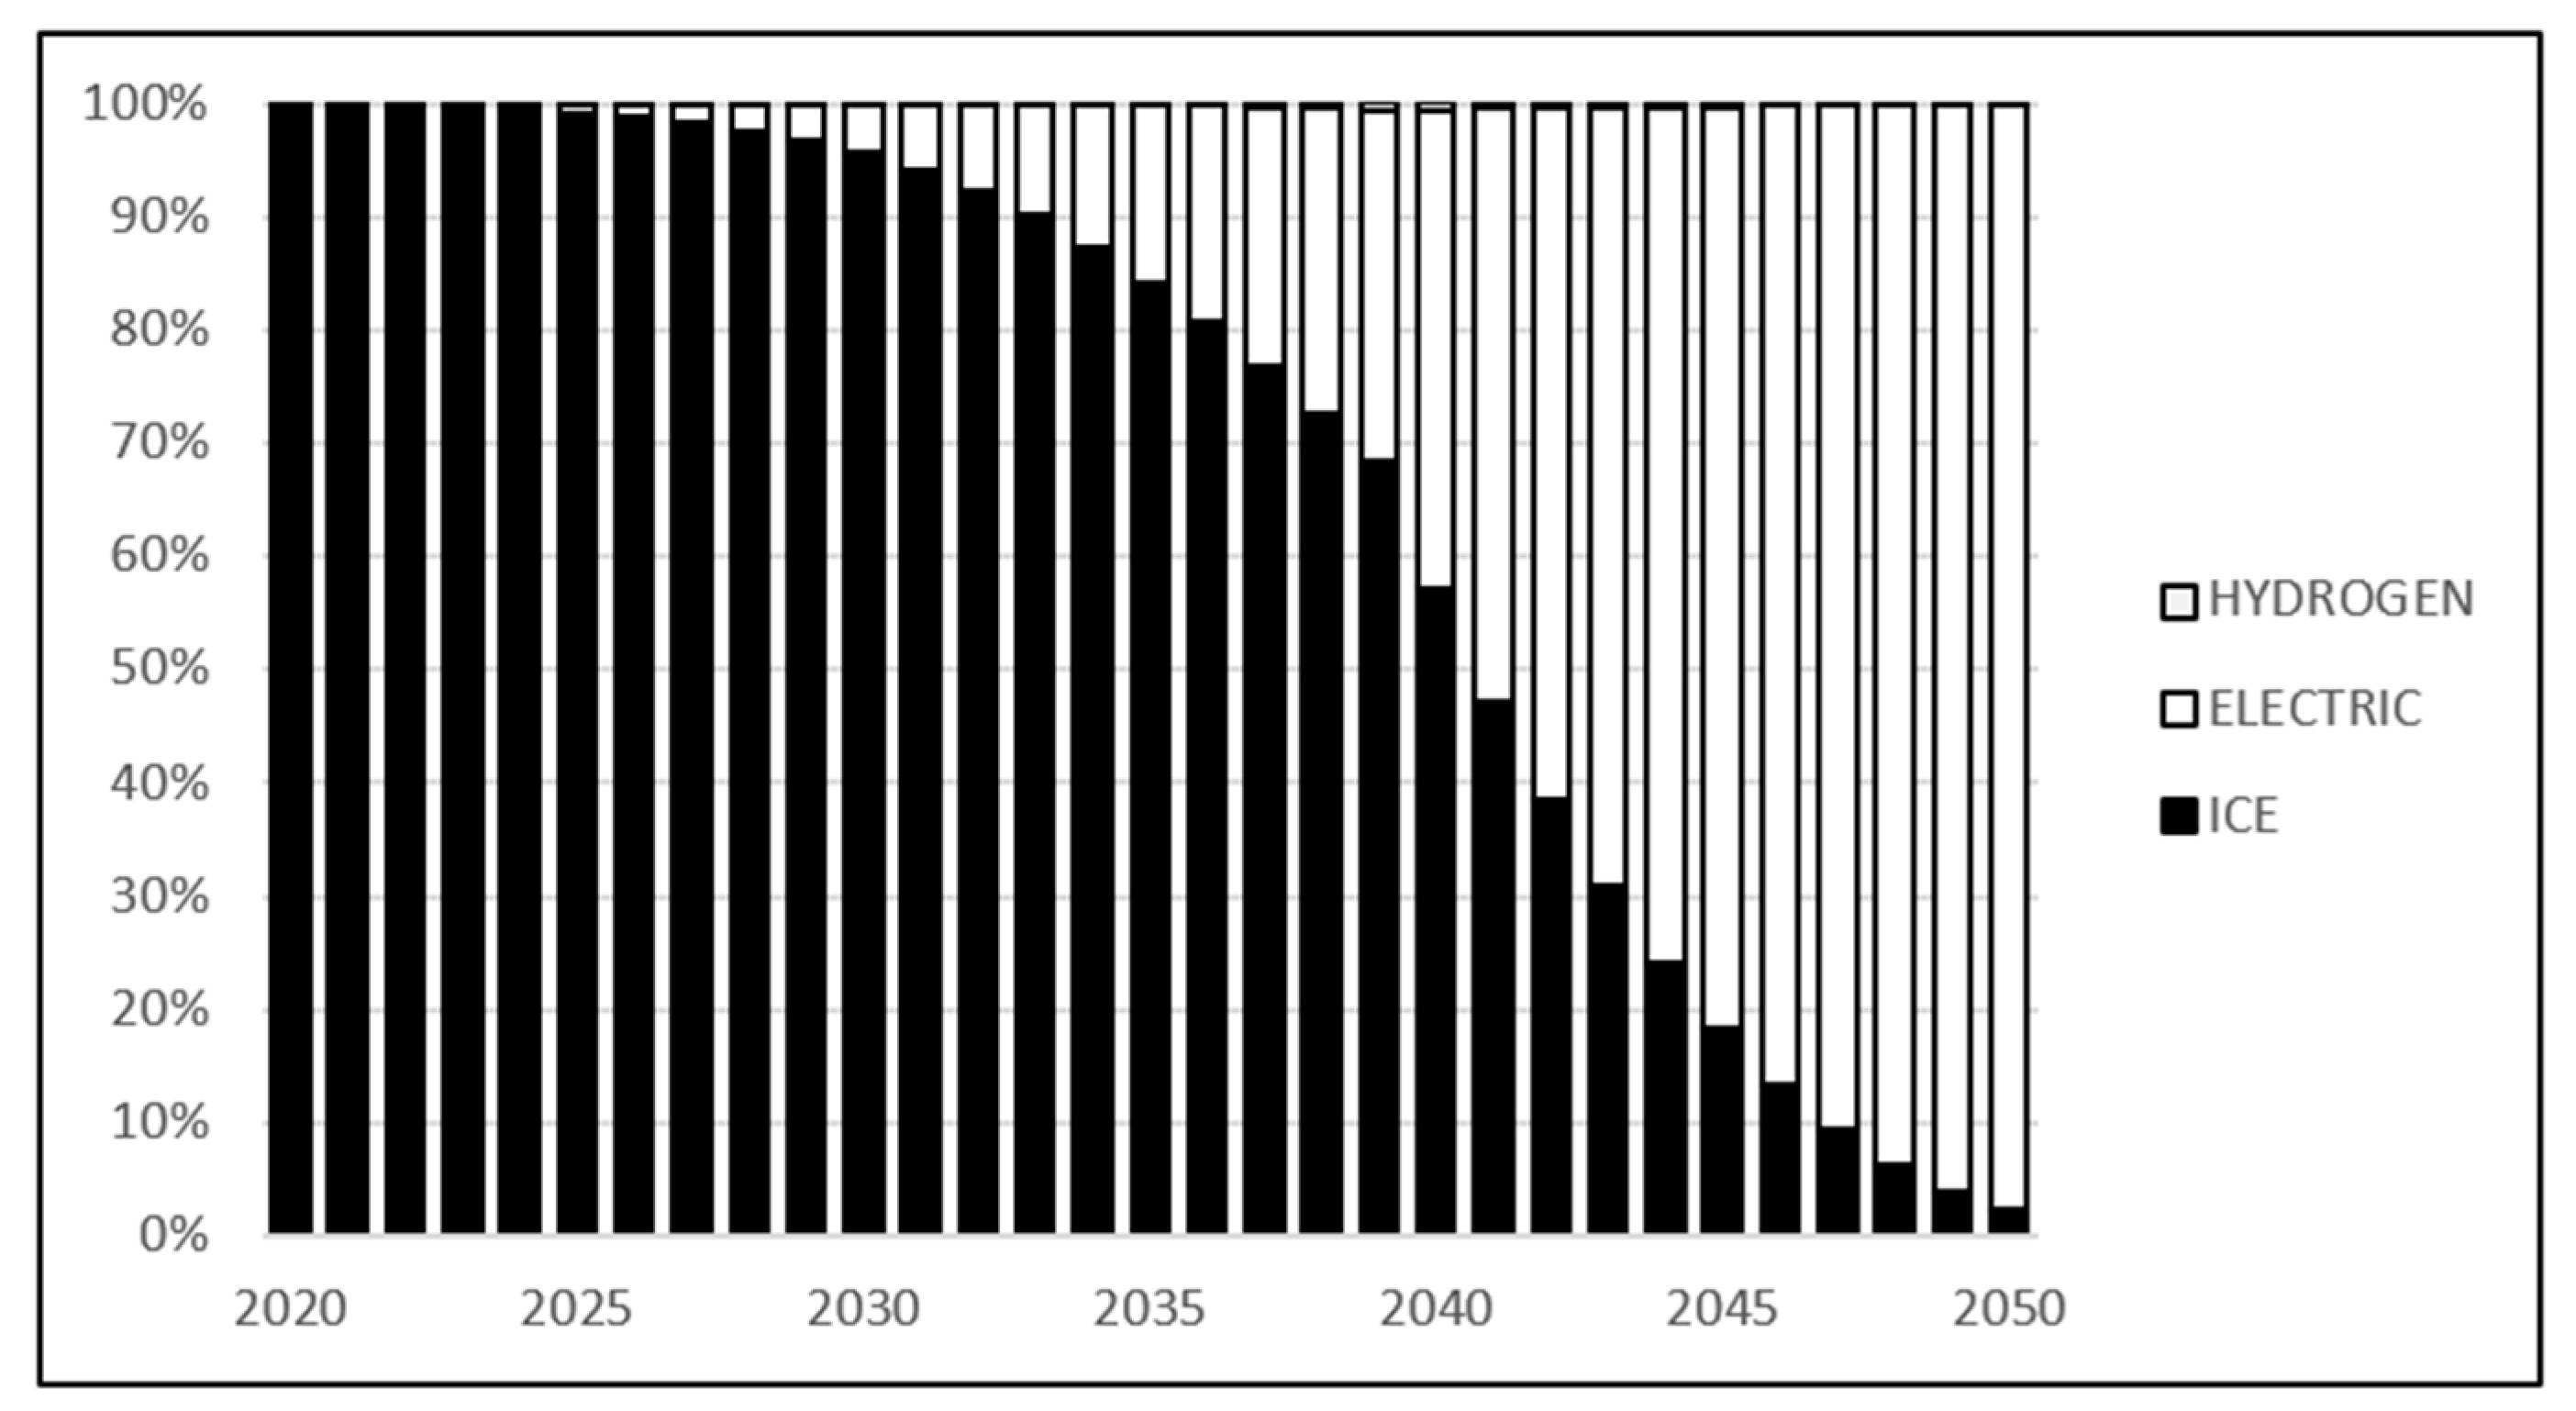
Figure 9 illustrates the transformation of the fleet of the light duty vehicles segment (up to 3.5 t of capacity). The number of delivery vehicles in 2050 increases by almost 90% compared to 2020 (from 2.5 million in 2030 to about 4.7 million in 2050) due to the growing demand for transport activities. The development of technology assumed in the TR3E model, which translates into a decrease in the purchase cost of electric vehicles. The growing costs related to the use of cars with ICE engines, mean that from 2030 electric vehicles begin to join the fleet of delivery vehicles. In 2040, these vehicles account for approx. 50% of light duty vehicles in Poland, and by 2050 they will fully replace vehicles with ICEs. Light duty vehicles can be fully electrified due to the specificity of their work (operation over short distances and frequent breaks at work).
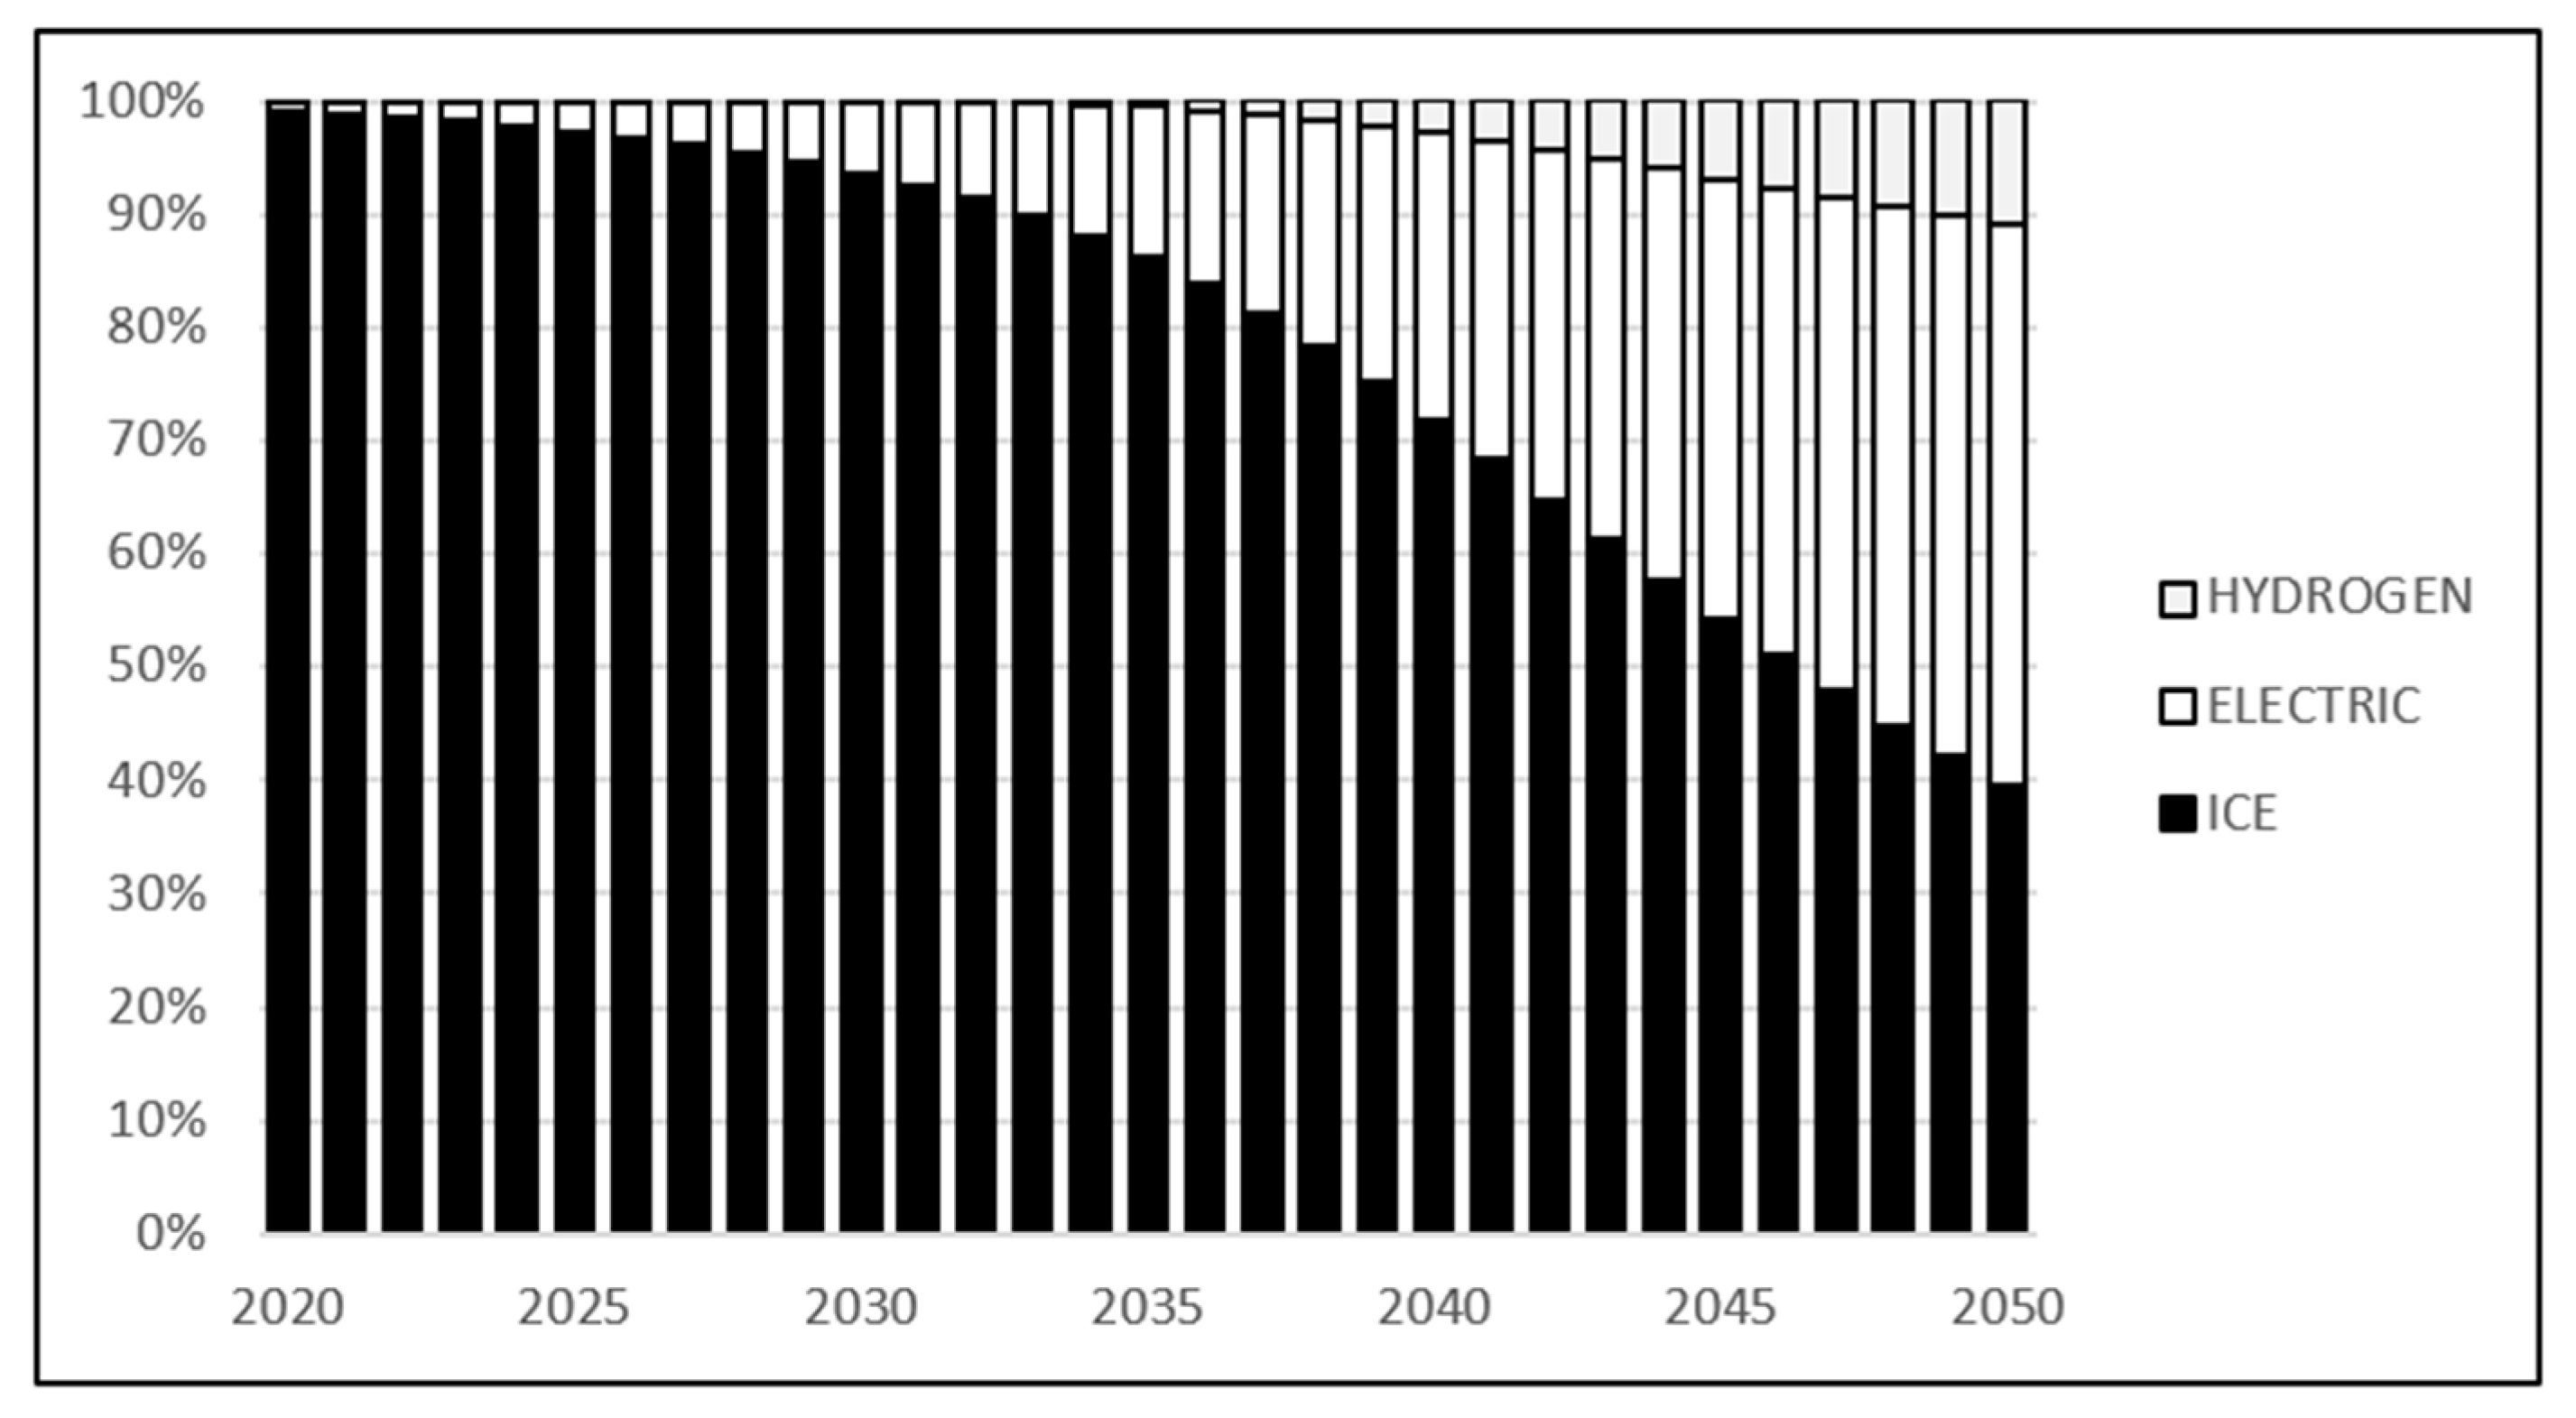
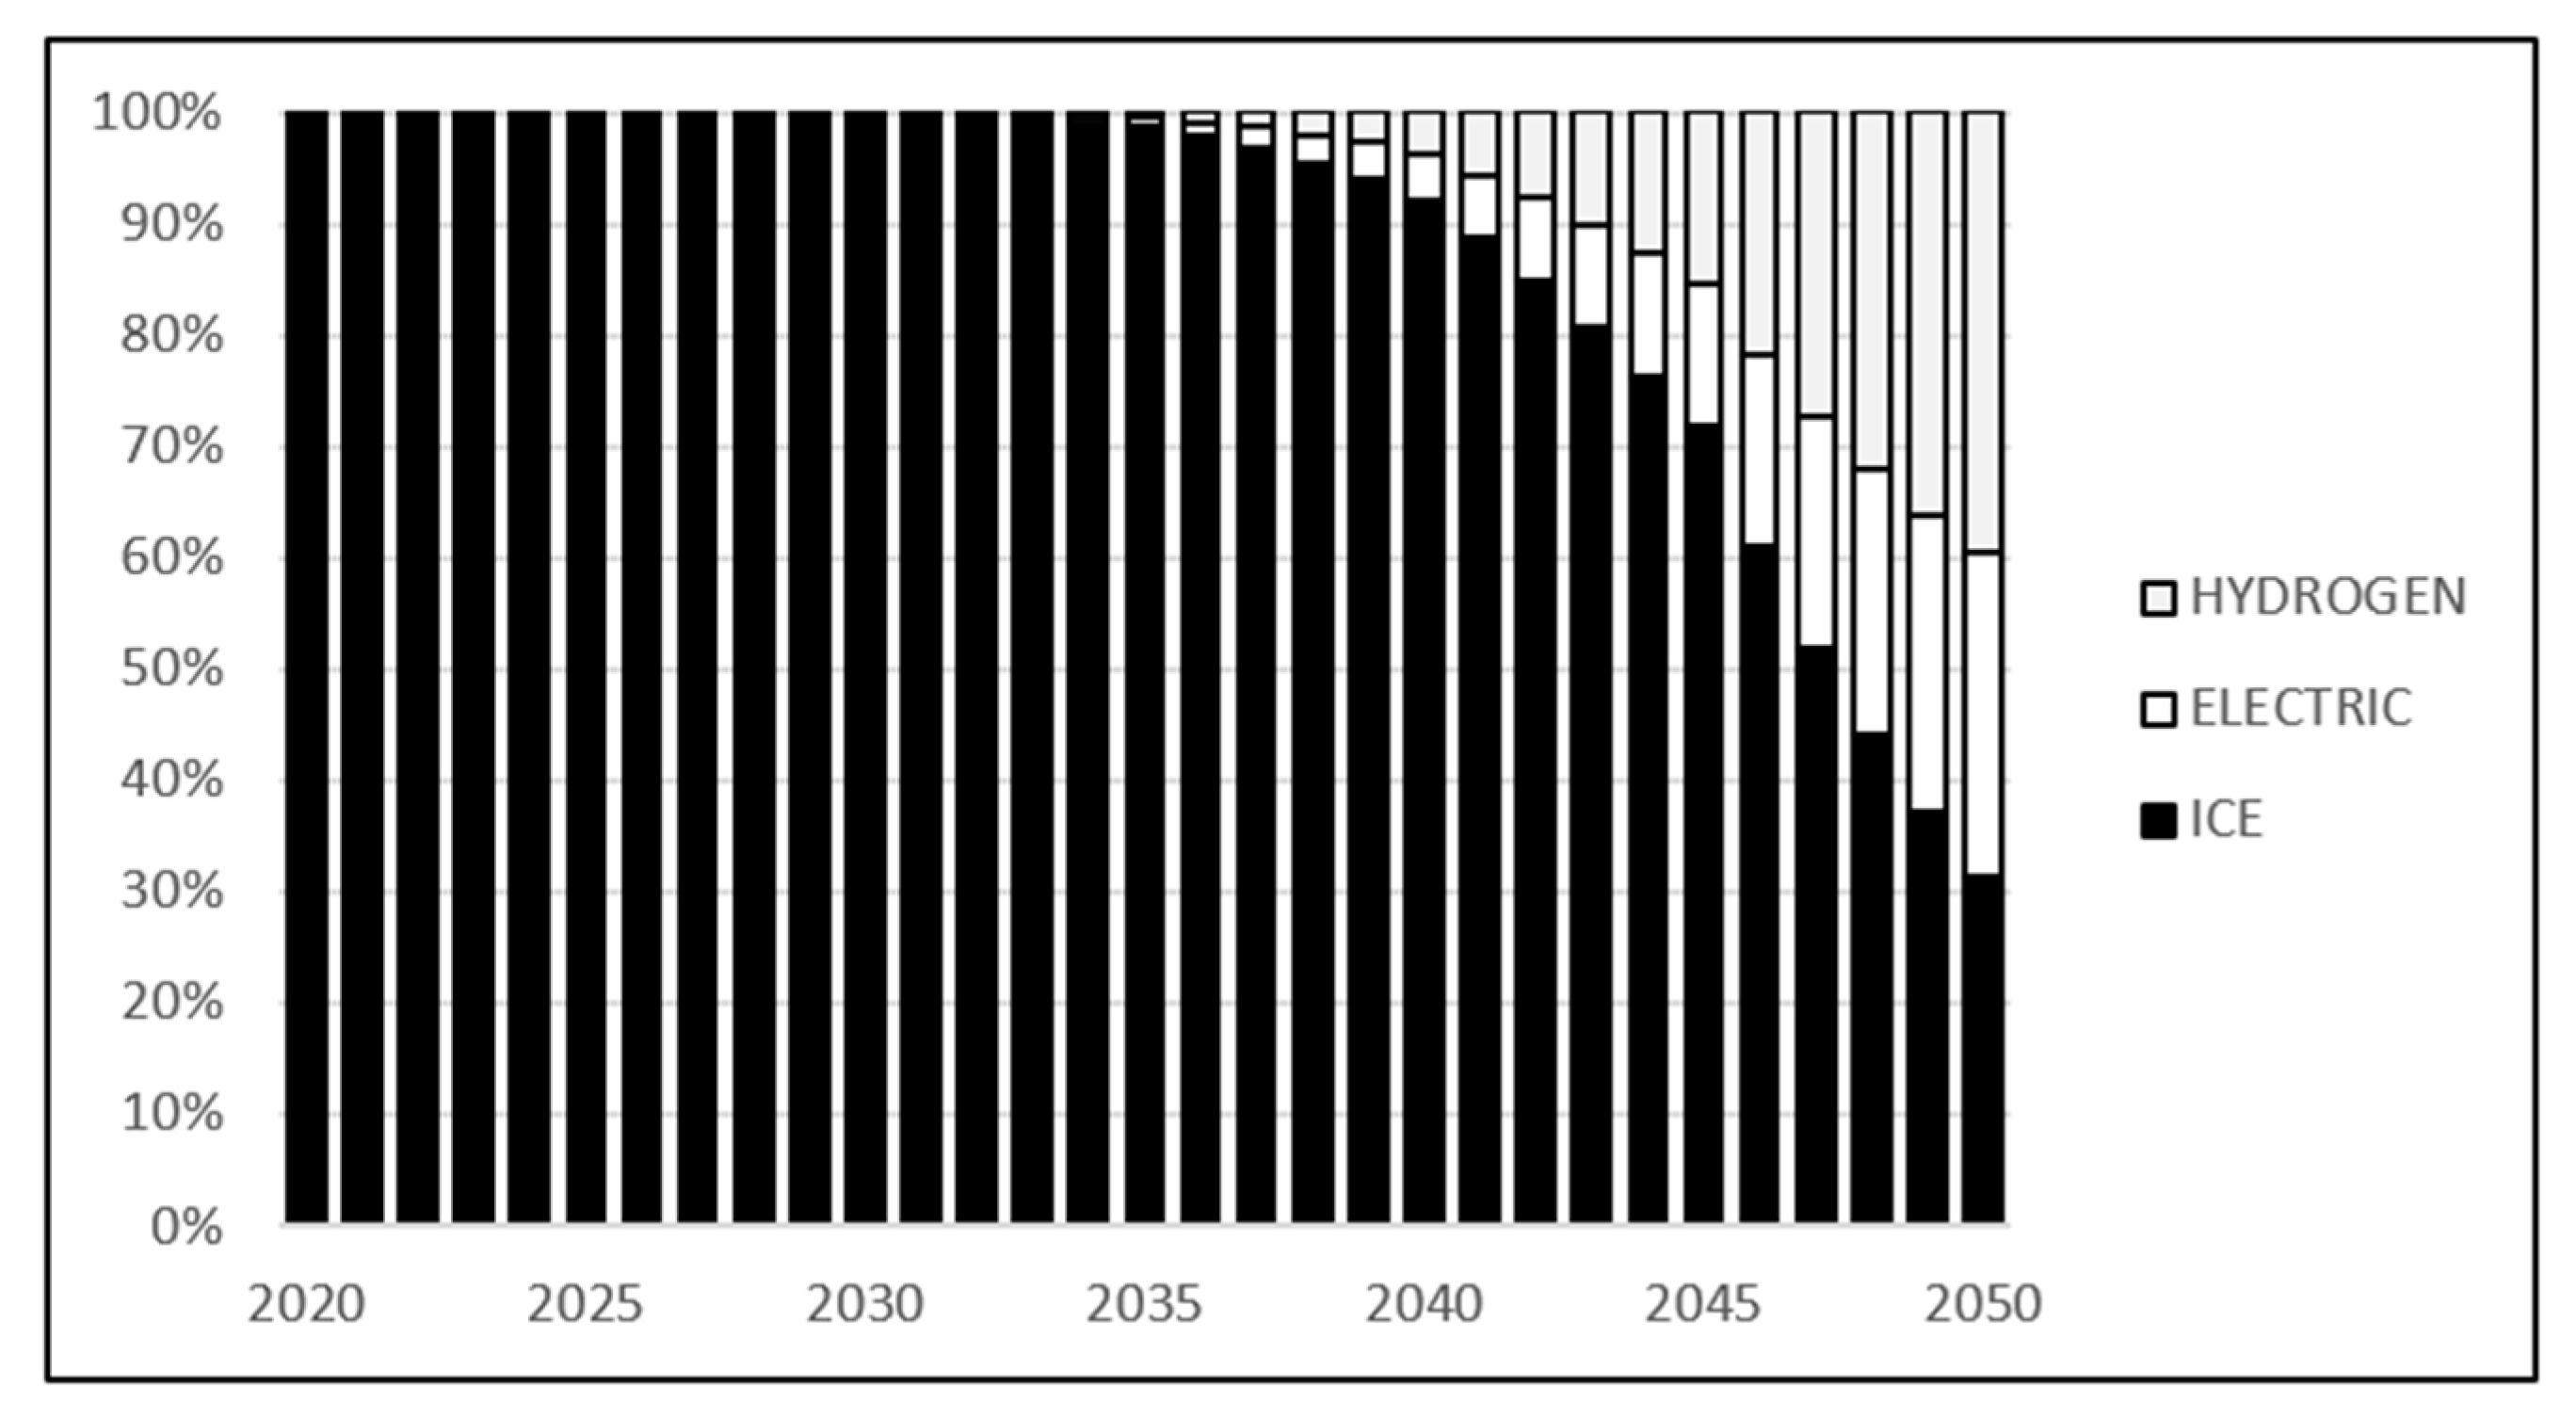
In the case of heavy duty vehicles (HDV’s), fleet changes are much slower than in the case of LDV’s. This is due to the significant costs of new technologies and the development of the necessary infrastructure, such as charging stations, ERS (Electric Road System) networks or hydrogen refuelling stations. In 2050, zero-emission heavy duty vehicles will constitute ca. 65% of the entire fleet, of which vehicles with engines using hydrogen will account for approx. 40%, which indicates a significant use of this type of fuel in this segment of the transport sector (Figure 10). Such a change in the structure of heavy duty vehicles leads to a reduction in their total CO2 emissions from approx. 17 Mt in 2020 to ca. 6 Mt in 2050 (in NEU scenario).
The introduce of scenario for delivering low-carbon freight transport in Poland is crucial as freight transport is responsible for ca. 50% CO2 emissions. Current legislation does not specify any requirements for reducing CO2 emissions for HDVs, it is therefore necessary to adopt specific measures for such vehicles without delay. This appears to be more difficult than for passenger cars due to insufficient development in the production of electric and hydrogen HDVs. Replacing heavy transport with zero-emissions technologies will be particularly hard for international transport due to long distances travelled by goods. Decarbonisation of this mean of transport requires an international agreement to invest in the necessary infrastructure (ERS network) that will enable green transport between EU countries.
3.2. The Environmental Benefits—Reduction of CO2 Emissions in Road Transport
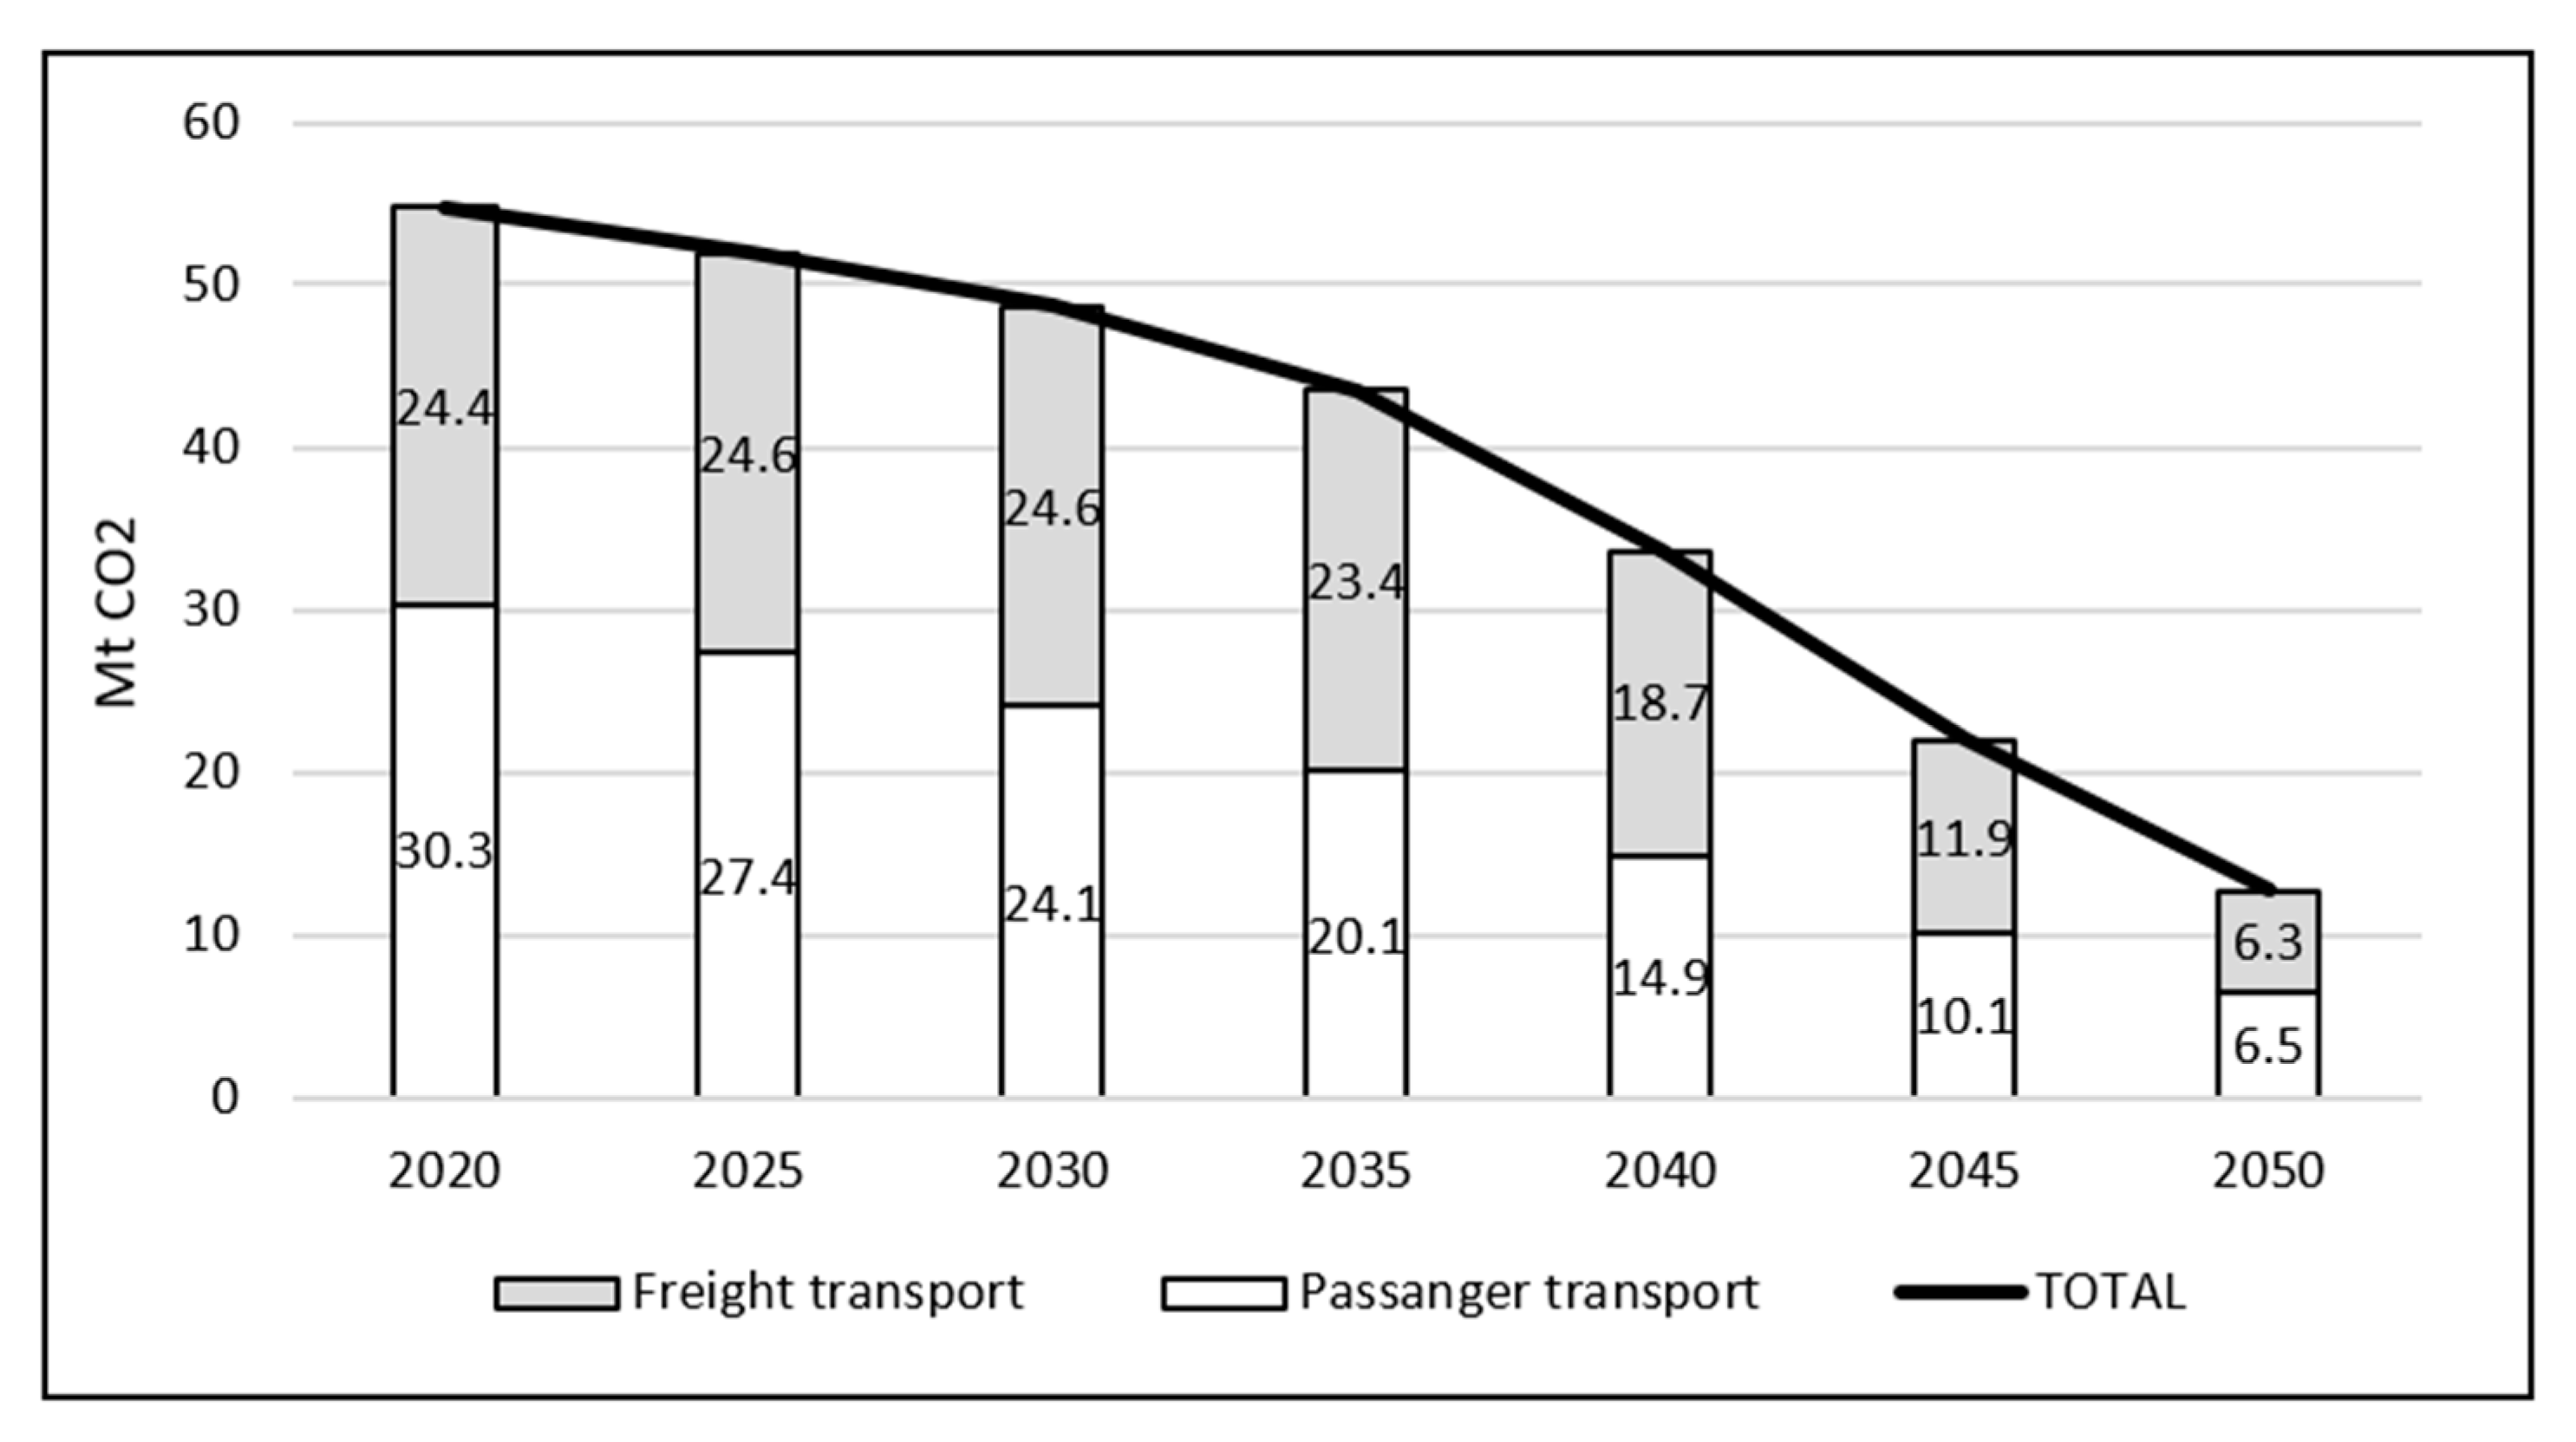
Research shows that road passenger transport emissions would reach level 5.5 Mt CO2 in 2050. The main driver to achieve this reduction of emissions is the electrification of the passenger car fleet. Emissions from buses would fall from 2.5 Mt CO2 in 2020 to 1 Mt CO2 in 2050 as consequences electrification and the substitution of public road transport by rail. On the other hand, freight transport activity in Poland and related emissions are particularly important compared to the activity in the EU. The share of goods transport sector in Poland accounts for 9% of the EU sector. In context of climate neutrality achievement by 2050, a significant transformation in the structure of vehicles utilised for transportation of goods is necessary. The light duty vehicles would be 100% electrified in the future. The heavy duty vehicle’s emissions would decrease 3 times by 2050 to a level of ca. 6 Mt CO2. Heavy duty trucks using diesel as a fuel will be replacing by HDVs powered electricity or hydrogen, due to the electrification and hydrogen use. As a consequence, emissions from road transport would be reduced by almost 80% in 2050 compared to 2020 (Figure 11).
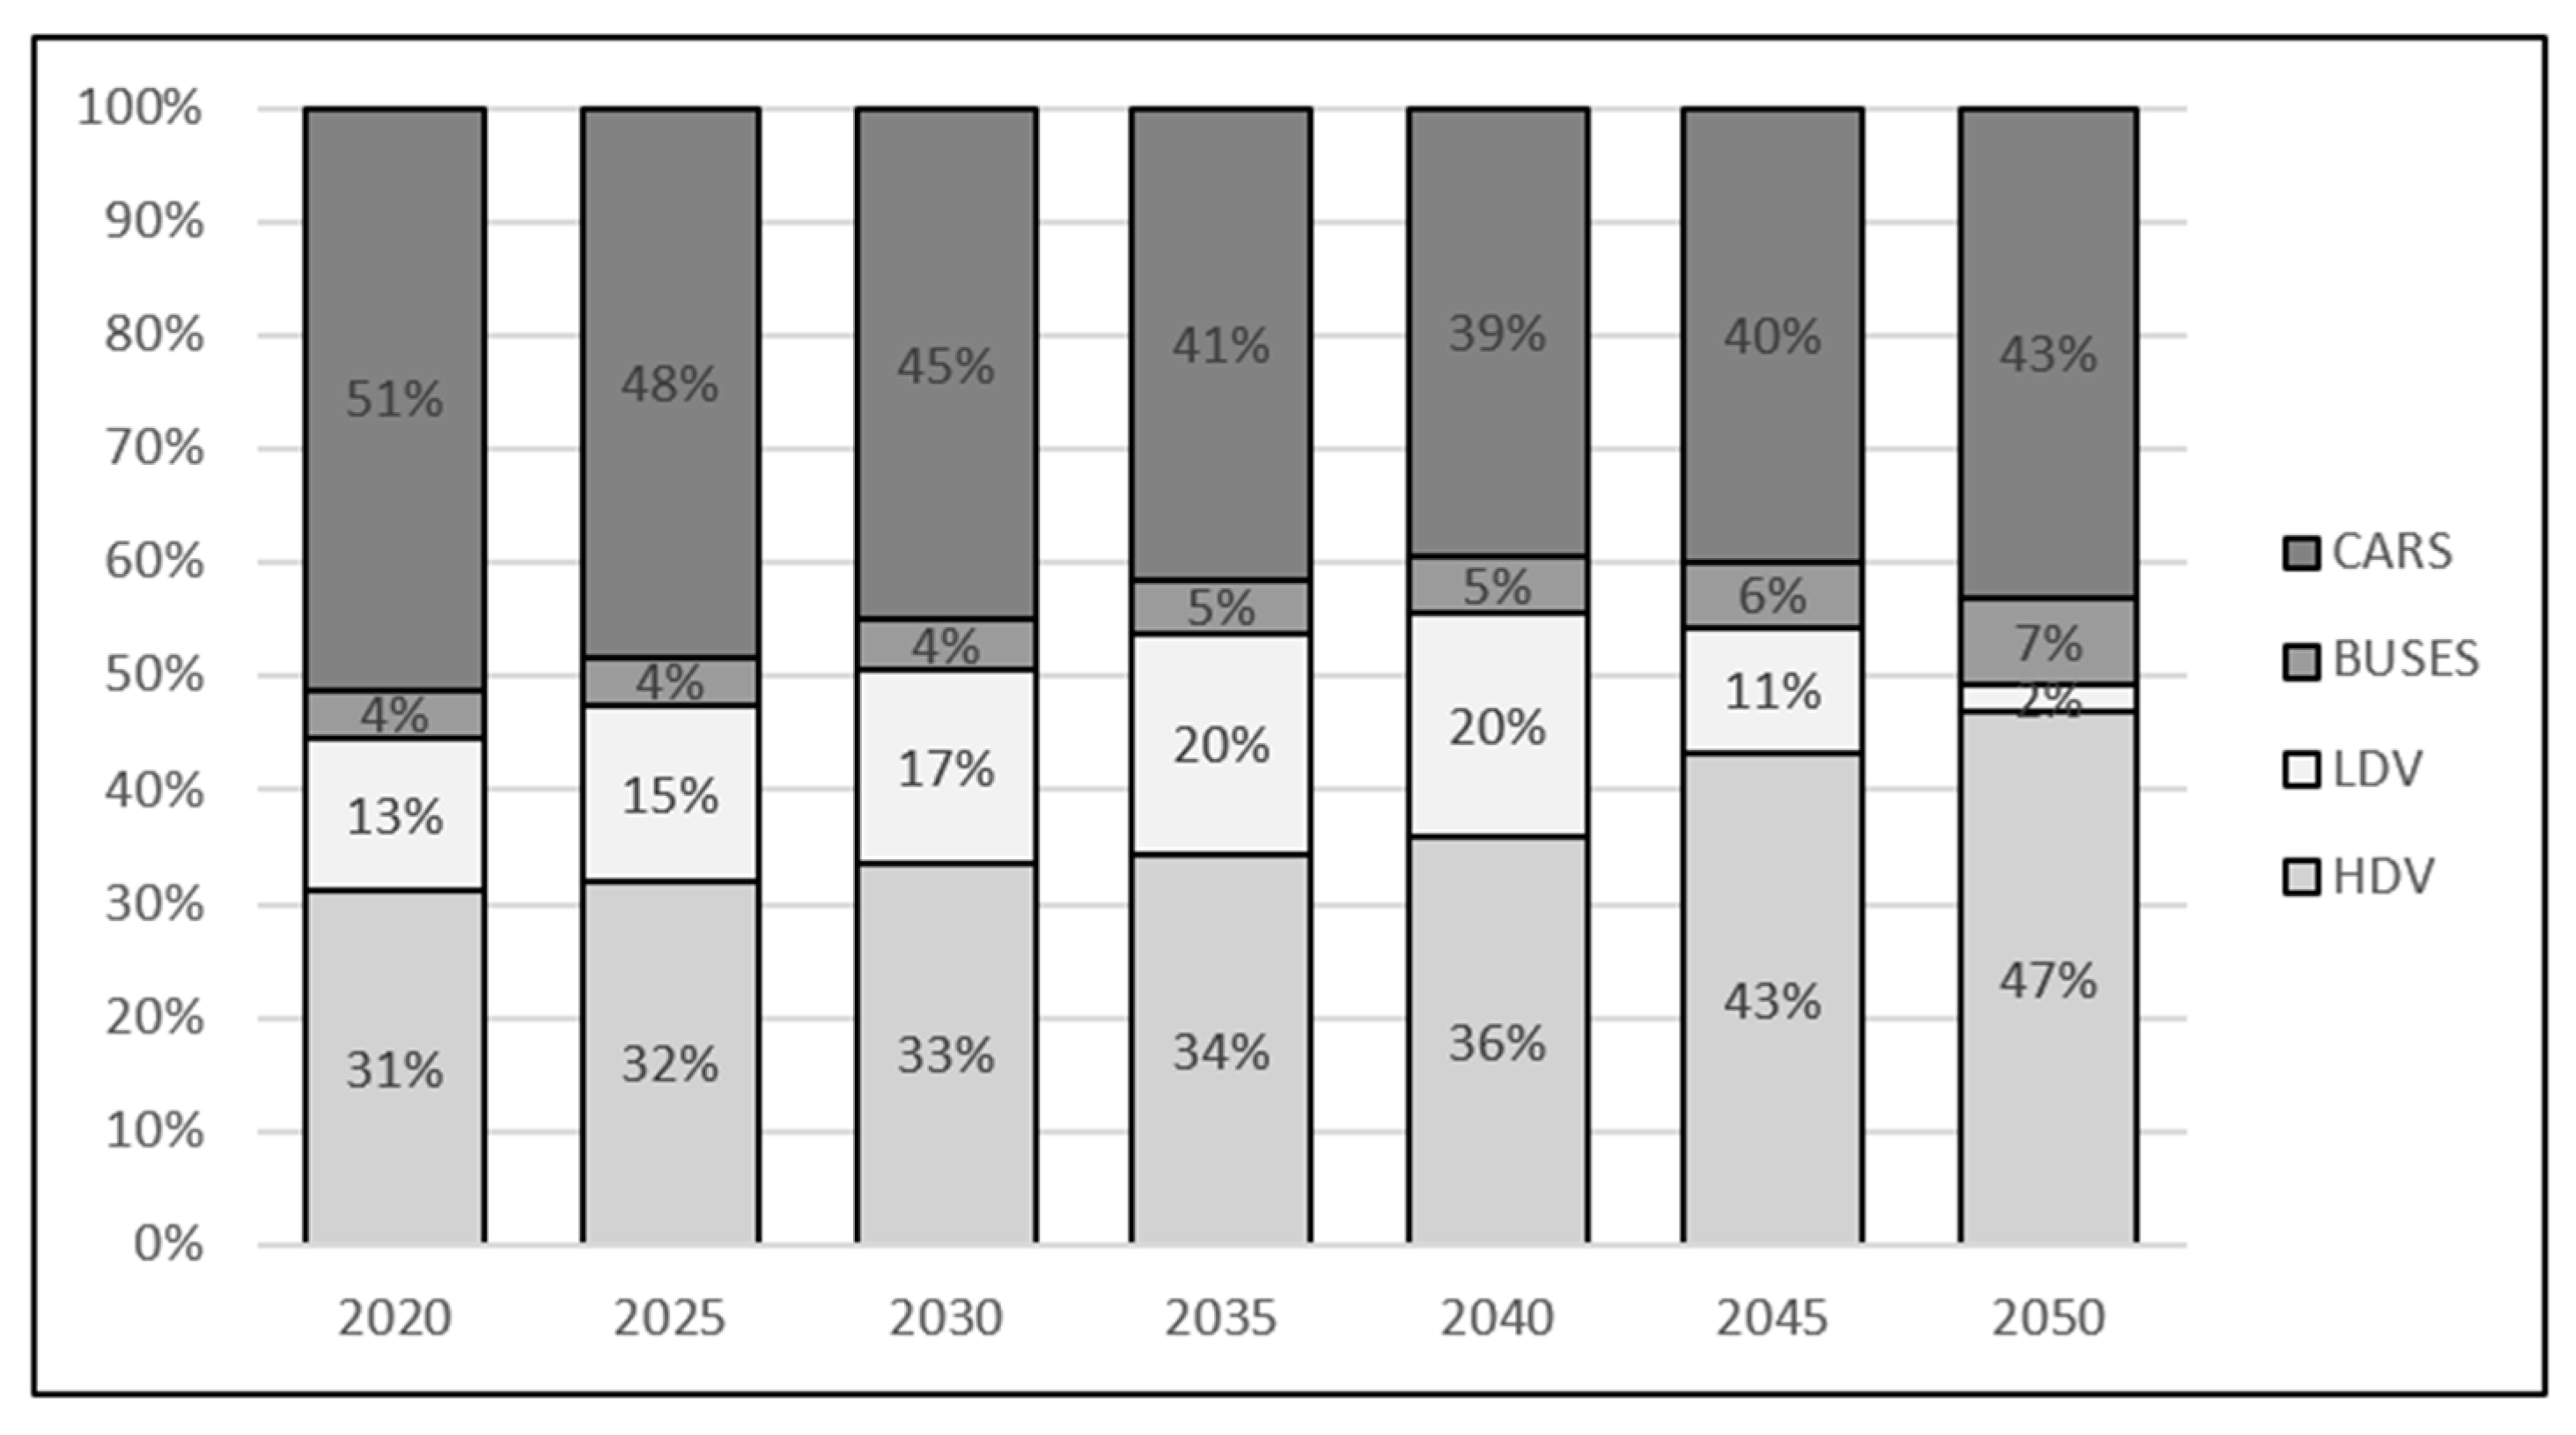
In 2050, passenger cars and heavy duty vehicles will be the main sources of CO2 emissions from road transport (see Figure 12). In the case of passenger cars, these are vehicles that will be sold before the ban on the sale of ICEs vehicles will introduced. In the case of heavy duty vehicles, zero-emission technologies are introduced around 2035 and by 2050 they account for approx. 70% of the fleet in Poland. Therefore, combustion HDV’s in 2050 will still to carry out part of the freight transport activity. Emissions from buses and light duty vehicles will account for less than 10% of emissions.
3.3. The Road Transport Demand for Electricity and Hydrogen
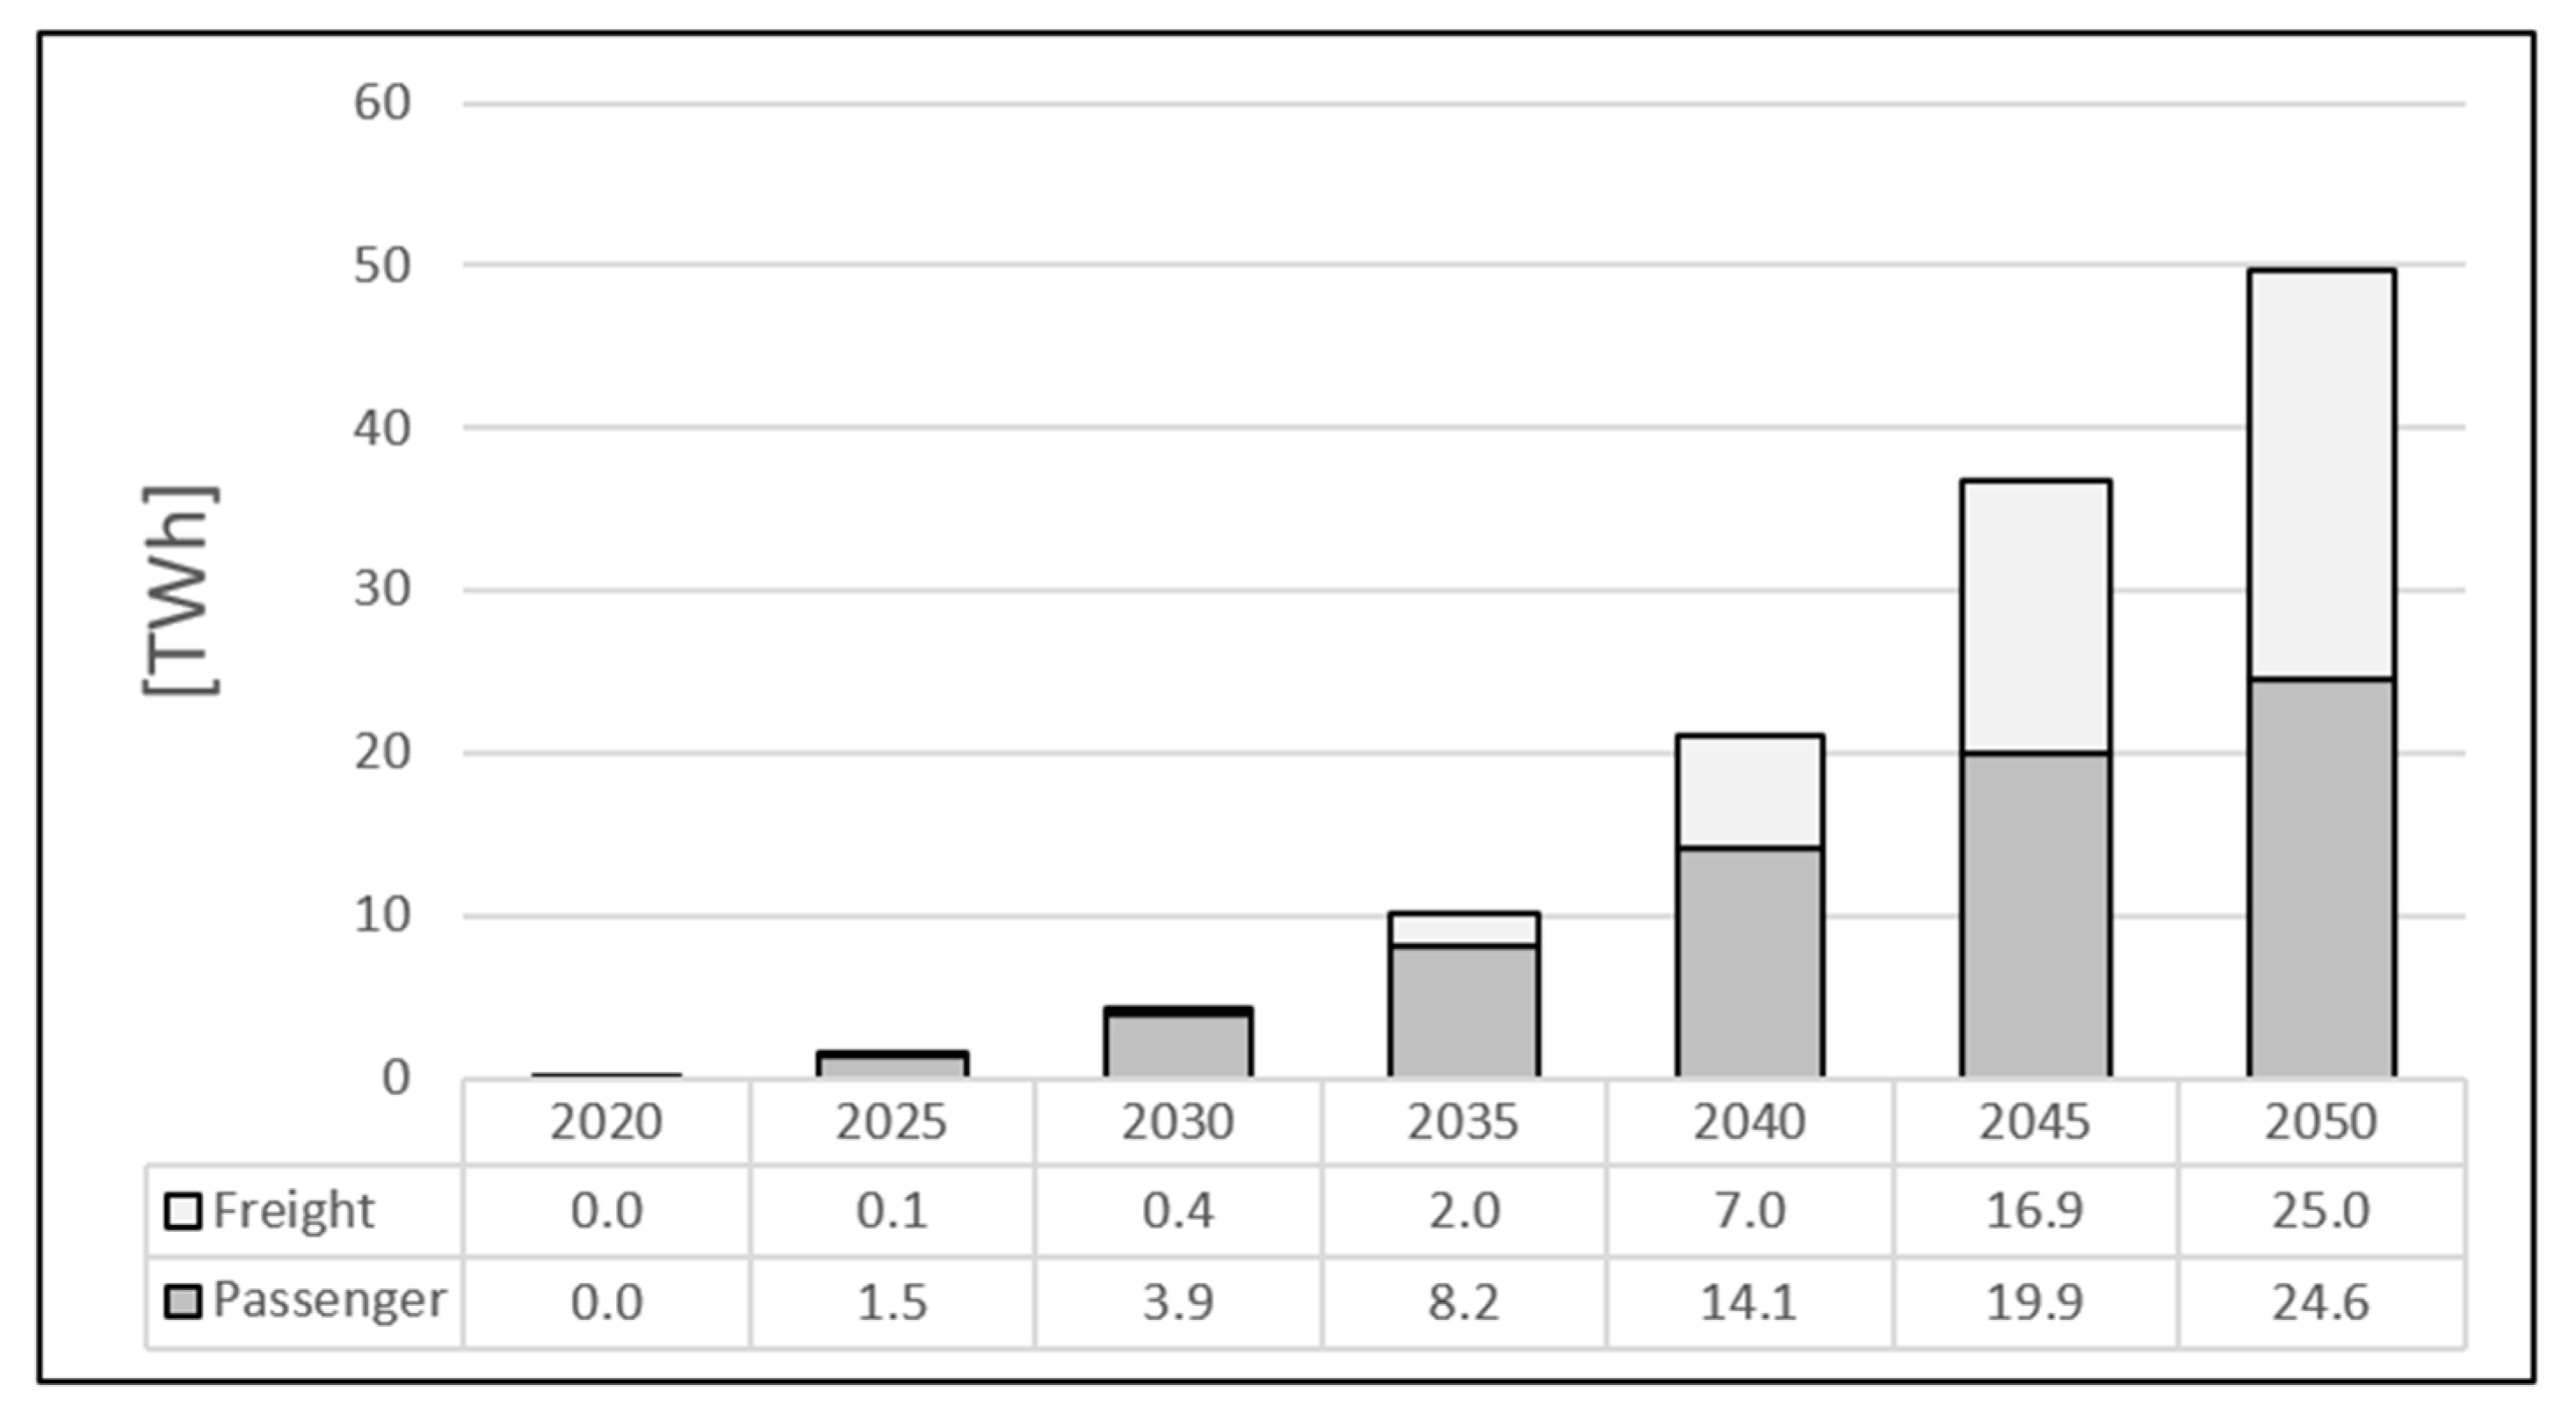
In the NEU scenario in 2035, the usage of electricity in the transport sector will be at the level of 10 TWh, in 2040 it will double, and then it will reach the value of almost 40 TWh in 2045 and about 50 TWh in 2050 (see Figure 13). A greater share of energy consumption will be observed for passenger transport than for freight by 2040, which results from the faster development of electric passenger cars than trucks. In 2050, the demand for electricity in passenger and freight transport will be at a similar level of 25 TWh.
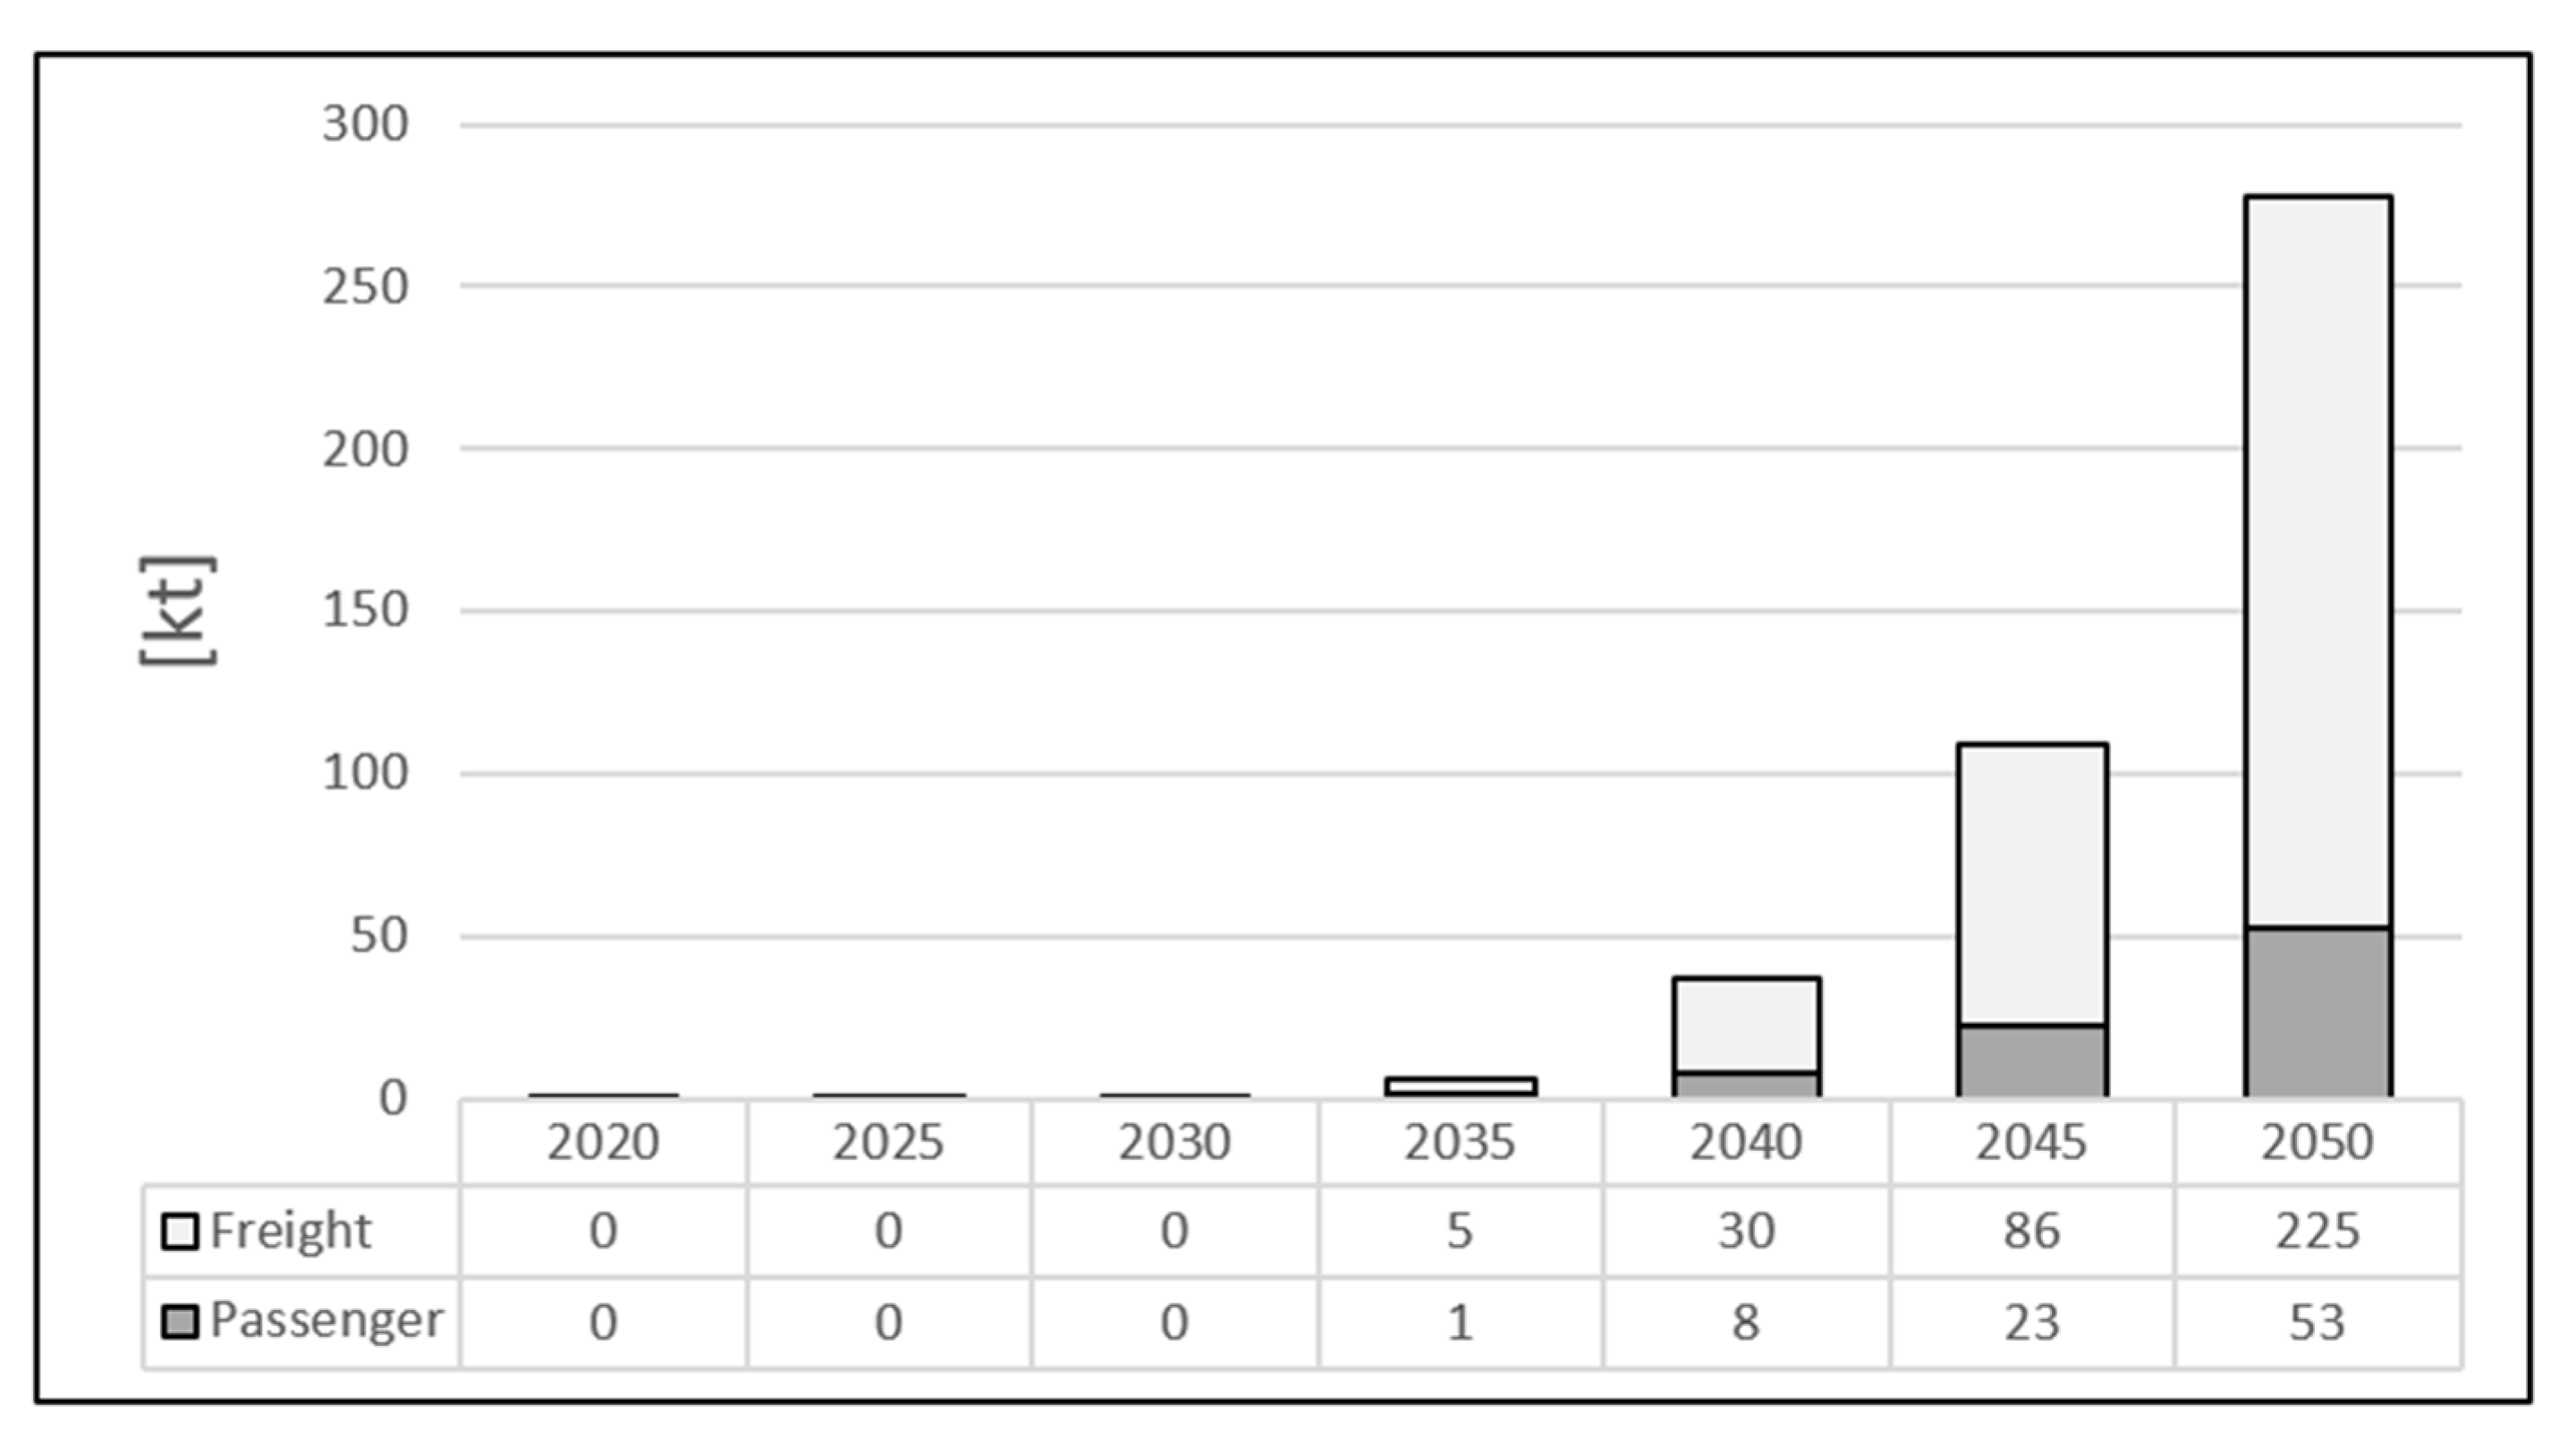
The development of the hydrogen-powered fleet will be used mainly in freight transport, where the share of heavy duty vehicle in the fleet of vehicles will be over 30% in 2050. The volume of hydrogen to use in freight transport will then amount to approx. 230 kt (see Figure 14). In passenger transport, hydrogen passenger cars will constitute approx. 3% of the total (in the NEU scenario in 2050), while hydrogen buses will slightly exceed 10%. Passenger transport will then use less than 20% of the total total hydrogen demand (i.e., around 50 kt). The total demand for hydrogen in road transport in Poland will be around 280 kt.
4. Discussion
The research is an attempt to present the pathway that Poland must follow to meet the emission targets requirements set by the European Commission. Our analysis takes into account a number of aspects like passenger/freight activity (depends on GDP and population), vehicles stock, technical parameters, i.e., vehicle mileage, scrappage rate, occupancy rate, fuel consumption, emission intensity etc. The prices of new vehicles with zero-emission technologies, oil and electricity prices and insufficiently developed subsidy systems in Poland play a core role when consumers make a decision to purchase a vehicle. These prices will be depend on development of technology and sustainability supply chain of vehicle’s equipment. The study does not descend to the supply chain level also for manufacturers (volume of freight transport for firms). Research in the field of freight transport and sustainable development has been the subject of many studies [53,54,55,56]. We also do not deal with the traffic/congestion, but only with the general demand for transport services (partial equilibrium model, demand on activities are modelled in CGE model).
The process of phase out from combustion vehicles (fueled with gasoline and diesel) is long, depending on the lifetime of ICEs vehicles, consumer preferences, legislation and the pace of purchasing zero-emissions vehicles (price competitiveness). The most important issue in this process, and thus the “beginning of the end” of the era of ICEs cars, is the moment when new ICEs vehicles will not be sold.
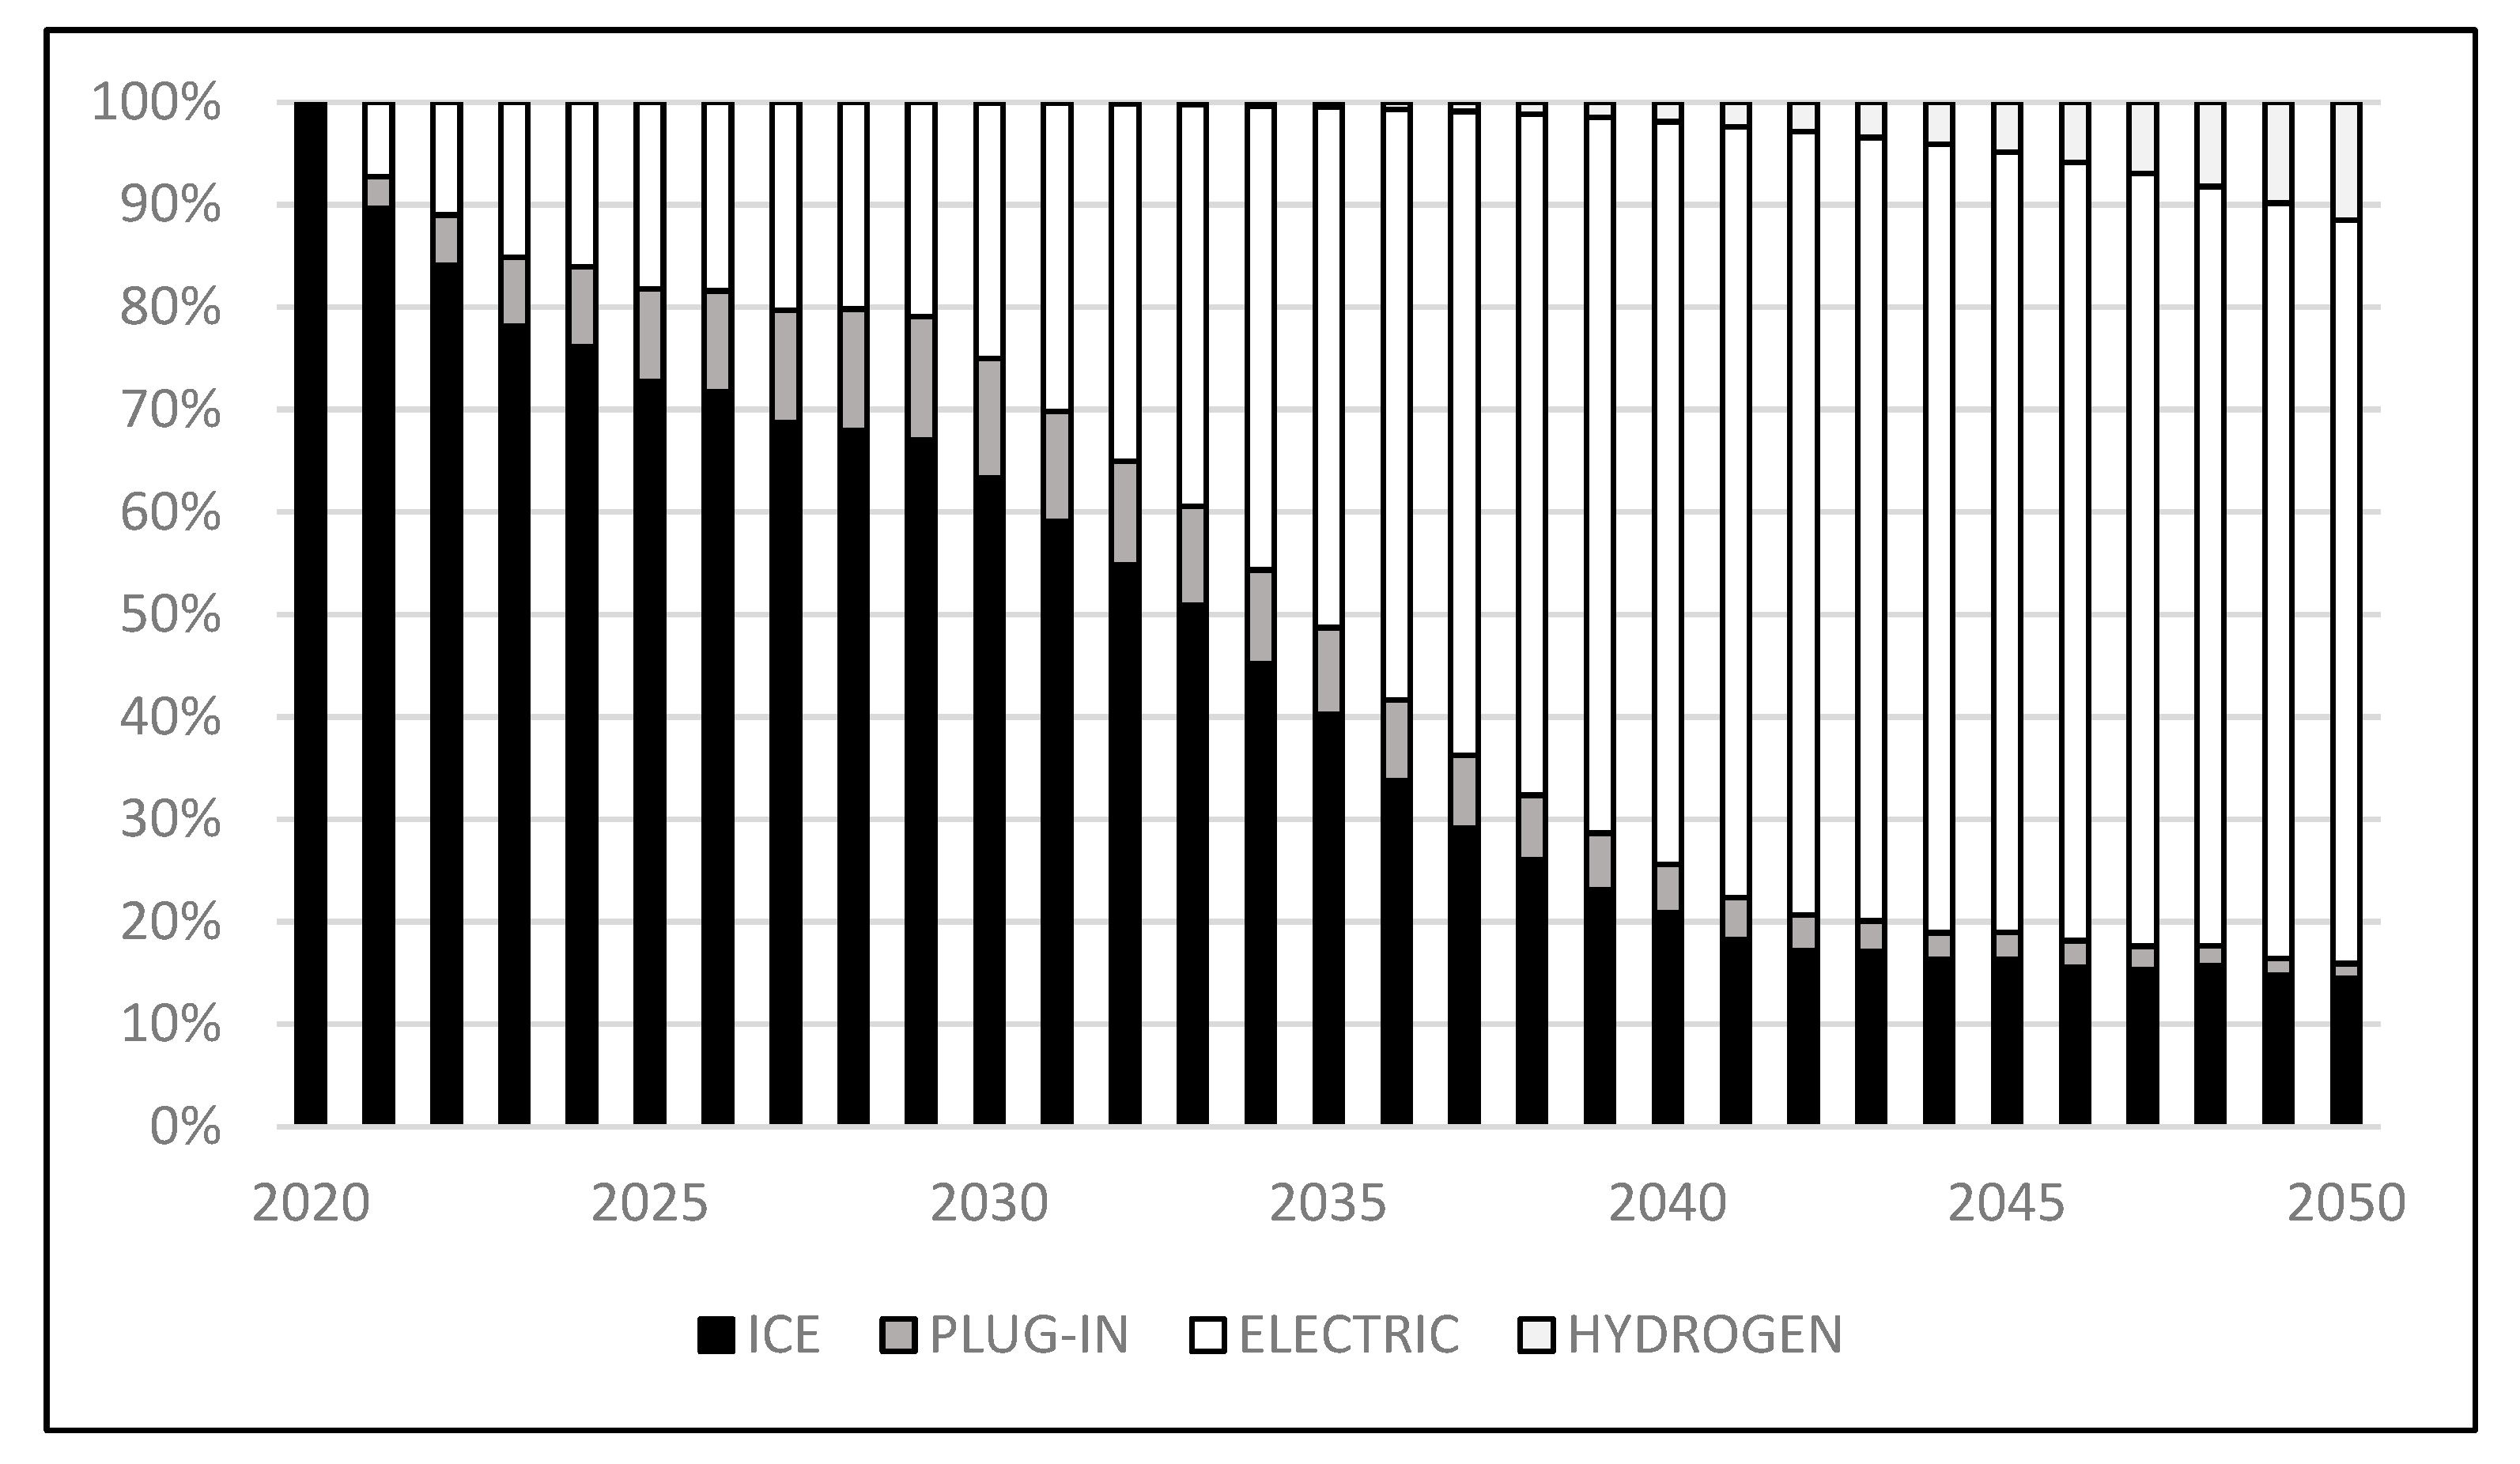
At the moment, there is no legislation specifying the date of the ban on the sale of new internal combustion cars. In the “Fit for 55” package [3], the most ambitious TL High scenario sets this moment at 2035 for passenger cars and LDV’s (for the EU27). In less ambitious scenarios, the share of new ICEs in total sales of new cars ranges from 50 to 60% (EU27). In the NEU scenario for Poland in 2035, the share of new combustion cars is 49% (Figure 15). The share of vehicles using electricity and hydrogen as a fuel in the fleet of new cars is the measure of the pace of change towards a zero-emission fleet.
Changes in the transport sector are a long process that covers both companies and households. Initially, the new legislation should be covering the fleet of entities/firms using vehicles to generate income, and further to the households. Reducing the cost of purchasing vehicles through a system of subsidies, lower operation costs or benefits such as clean transport zones will be an incentive to buy electric cars instead of combustion ones.
At the beginning, electric vehicles will go to households that are in the higher income quintiles. Over time, these vehicles will change owners to those of the lower income quintiles for which the real benefits will be most felt, ultimately displacing combustion cars that are emission-free and expensive to maintain and operate.
In the NEU scenario, light duty vehicles (vans) will be electrified by 2050. The benefits resulting from the operation of electric vans are enough impetus to change the fleet of vehicles to zero-emission vehicles. Furthermore, these vehicles travel mainly over short distances where a network of chargers will be built first.
The transformation of heavy transport (HDV’s) is a much greater challenge. In Poland, road freight transport activity accounts for a significant share and continues to grow. Moreover, zero-emission technologies are still being developed and unavailable for HDV’s users, unlike passenger cars and LDV’s. Hence, in the initial period of transformation, some activities should be replaced by rail.
Electrification of heavy freight transport is difficult due to the long distances covered by trucks, which requires costly investments in the ERS network or equipping vehicles with very large/heavy batteries. For this reason, there is a potential for increasing use of hydrogen in this segment of vehicles. Hydrogen trucks have a much longer range without refueling, so they will be able to compete with HDV’s with internal combustion engines
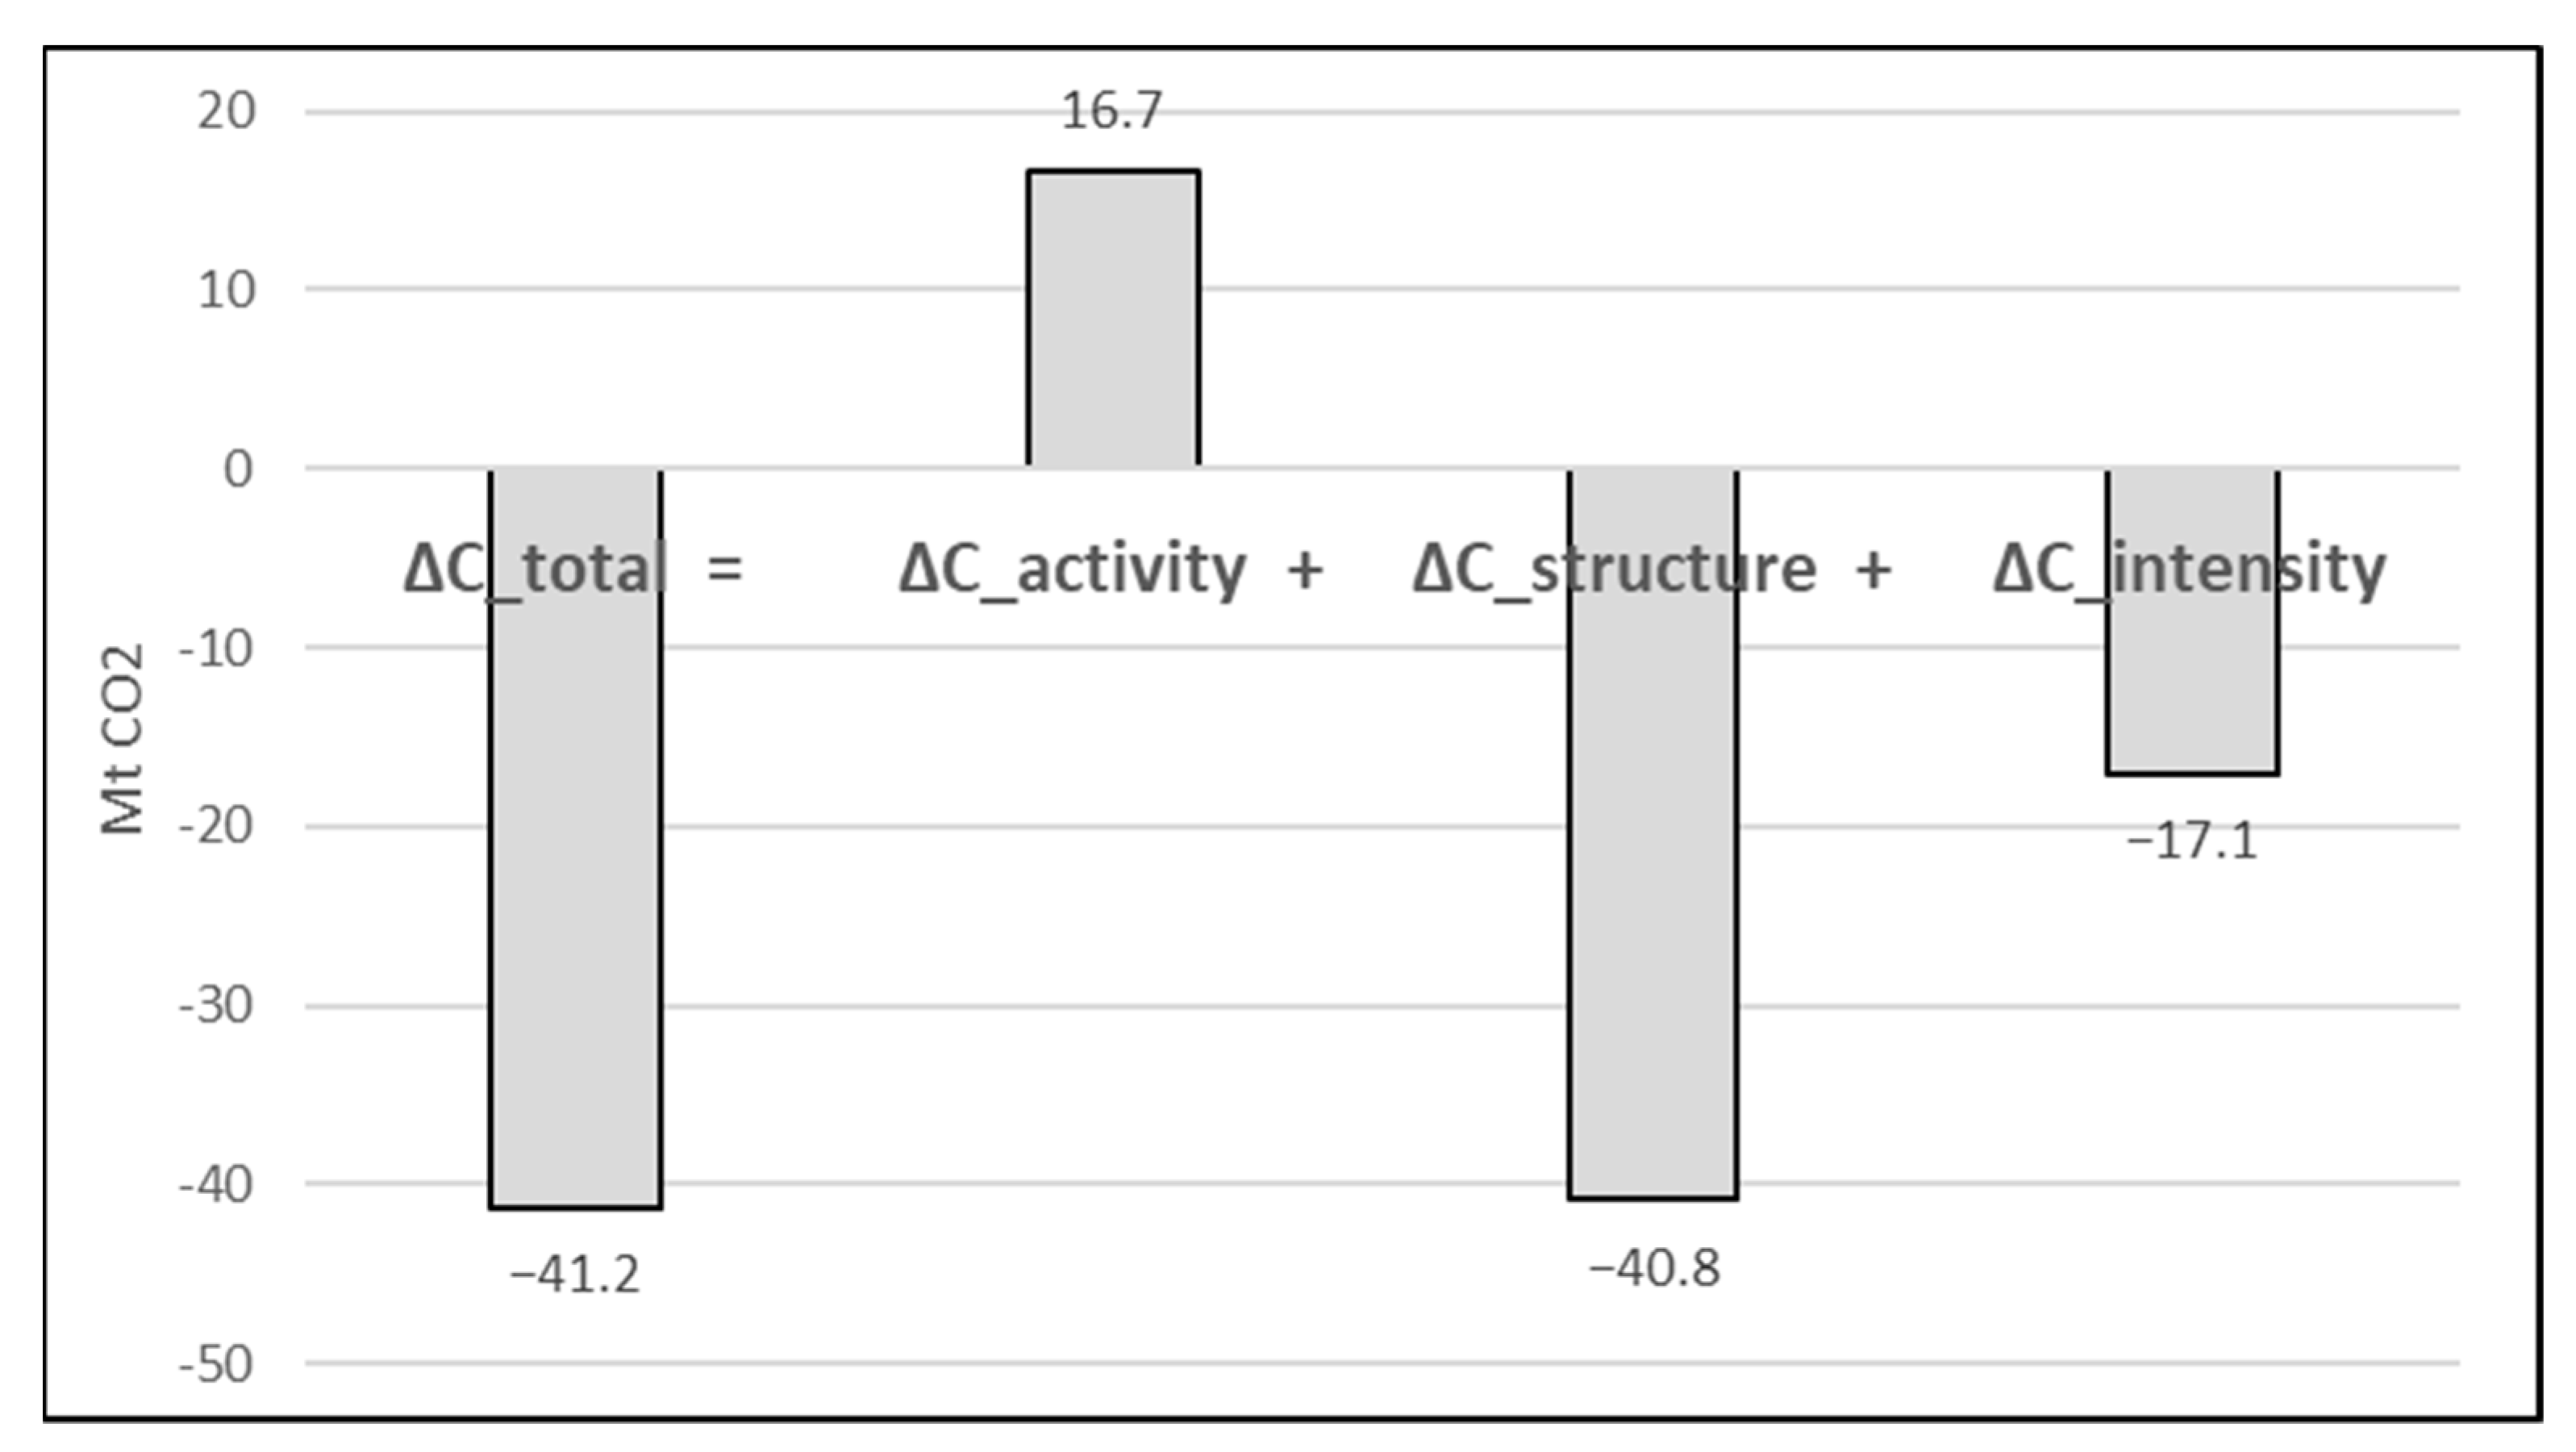
To clarified drivers of emissions reduction the emissions chances were decomposed into separate factors. Firstly, in order to simplify the discussion the Logarithmic Mean Divisia Index (LMDI) was calculated [57]. An additive decomposition scheme was applied as its more suitable to quantitative analysis [58]. Figure 16. shows results of decomposition of CO2 emissions into three factors:
- ΔC_activity—denotes the change of emissions levels according to growth of transport activity,
- ΔC_structure—denotes the change of emissions due to changes in structure energy mix in transport (zero emissions technologies—electricity and hydrogen),
- ΔC_intensity—is the change of emissions as the results of emissions intensity improvement (new emission ns standards for vehicles).
Results for Poland show the greatest impact on change of CO2 emissions caused by structure changes, −40.8 Mt emissions reduction. Structural changes mean the substitution of ICE vehicles of transport with zero-emission vehicles (electric and hydrogen). Changes (decrease) as a result of improved carbon intensity play important role in CO2 reduction (−17.1 Mt CO2), the changes in carbon intensity are due to more stringent exhaust emission standards for new vehicles. This solution will balance for the increase in emissions related to the rising demand for the transport of goods.
It is worth comparing the CO2 emission reductions achieved in the NEU scenario with the results of policy scenarios for implementing the European Green Deal [59]. The European Commission is considering three core scenarios (REG, MIX, MIX-CP). In REG scenario a strong intensification of energy and transport policy was assumed without carbon pricing in road transport and buildings. MIX scenario assumes both the extension of the EU ETS for road transport and buildings and a strong intensification of energy and transport policy. In MIX-CP scenario was assumed separate (“new ETS”) for transport and buildings. In the MIX and MIX-CP scenarios in 2030, the level of CO2 emissions from Polish transport is approx. 48 Mt. In the NEU scenario this level is higher and amounts 50.5 Mt CO2. It is possible that the lower emission reductions in the NEU scenario due to the lack of more rigorous emission standards for new vehicles (cars and LVDs). Moreover, carbon pricing in MIX and MIX-CP has an additional effect on reduction of emissions.
The current CO2 emission standards for vans (<3.5 t) are regulated by Regulation EU 2019/631 [2]. It assumes that the reductions from vans will amount to 15% in 2025 and 31% in 2030, compared to 2020, respectively. The new legislative proposals of the European Commission, presented on 14 July 2021 as part of the “Fit for 55” package [3], assume that the CO2 emission standards for new vans will be more restrictive. Raising the CO2 emission standards for new cars included in the fleet may, on the one hand, increase the share of cars with a smaller engine capacity, and, on the other hand, stimulate an increase in the share of zero-emission (electric and hydrogen) vehicles. The applicable CO2 emission standards refer to the average emissions of all cars sold in a given year.
5. Conclusions
Achievement of climate neutrality (NEU) scenario in Poland by 2050 should allow reaching the 65% share of electric cars in the set of passenger vehicles. Vehicles with internal combustion engines are to decline as low as to 26% by 2050, accounting to ca. 5.5 million vehicles. The pace of combustion vehicles replacement by electric is caused by differences in total operating costs and initial purchase prices. The equalization of purchase prices for electric and internal combustion vehicles is expected to occur in between 2025 and 2030.
Growth of demand for transport services will caused that the number of delivery (light duty) vehicles in 2050 increases by almost 90% compared to 2020 (to ca. 4.7 million units) and by this year they will fully replace vehicles with ICEs.
In case of heavy duty vehicles (HDV’s), the current ICE fleet would be replaced relatively later compared to the light duty vehicles, yet the pace of replacement would be considerably quicker (70% of ICE vehicles would be replaced by ones based on zero-emission technologies within the first 15 years). The main driver in transformation of HDV’s fleet would be the use of hydrogen technology, followed by fleet’s electrification. Thus, by 2050, zero-emission heavy duty vehicles will constitute ca. 65% of the entire fleet, of which the vehicles with engines using hydrogen would account for ca. 40%.
In terms of emission reductions in Poland’s road transport, it is expected they would decline to 5.5 Mt CO2 by 2050 in the passenger car fleet; emissions from buses would decrease from 2.5 Mt CO2 in 2020 to ca. Mt 1 CO2 in 2050 (due to both electrification and substitution of public road transport by rail). In the freight transport emissions from the heavy duty vehicles would reach ca. 6 Mt CO2. This reduction would be achieved due to the electrification and hydrogen use. Light duty vehicles will not generate CO2 emission because of full electrification. As an overall consequence, emissions from road transport would be reduced by nearly 80% in 2050 compared to 2020.
The NEU scenario that was created in the LIFE Climate CAKE PL project complies with the agenda proposed by the European Commission in the “Fit for 55” package [3]. The scenario assumes a phase out of the sale of vans after 2035, and an approx. 20% share of combustion passenger cars in the new passenger car fleet. The pace of transformation depends on the age of the vehicle fleet, the average lifetime and trends in the development of new technologies (i.e., EV battery life). It is possible that the proposed solutions in the “Fit For 55” package regarding emission standards for new passenger cars and vans will accelerate the conversion process of the entire fleet.
The results of the research provide the background for the creation of legislations and show how transport is to develop towards the low-emission transformation. The results of the research show the pace at which the structure of vehicles must change (transition from ICE to ZLEV) in order to achieve the target emission reduction. The transport sector in Poland has been developing dynamically in recent years (emissions doubled in 2004–2019, 5% annual growth), and transport activity will continue to grow. In the lack of structural changes and improvement in intensity, emissions in Poland would increase by approx. 17Mt CO2 to the level of approx. 80 Mt in 2050 (see Figure 16). To conclude, assuming discontinuation of sales of internal combustion vehicles would take place in the next 20 years, it can be expected that they would still be running the streets until the end of 6th decade of this century.
Author Contributions
Conceptualization W.R., A.G. and R.J.; methodology, W.R. and A.G.; writing—original draft preparation, W.R. and A.G.; writing—review and editing, W.R., A.G., R.J., K.S. and P.M.; visualization, W.R. and A.G.; supervision, W.R., A.G. and R.J. All authors have read and agreed to the published version of the manuscript.
Funding
This research has received funding from the European Union’s LIFE Programme and the National Fund for Environmental Protection and Water Management under grant LIFE16 GIC/PL/000031.
Data Availability Statement
The data presented in this study are available on request from the corresponding author.
Acknowledgments
The article was prepared within the Centre for Climate and Energy Analysis (CAKE) set up in the National Centre for Emission Management (KOBiZE), which is a part of the Institute of Environmental Protection—National Research Institute (IEP-NRI). It was prepared within the project: “The system of providing and exchanging information in order to strategically support implementation of the climate and energy policy (LIFE Climate CAKE PL)”—LIFE16 GIC/PL/000031, which is co-financed from the EU LIFE programme and from the funds of the Na-tional Fund for Environmental Protection and Water Management. More about the project at: http://climatecake.pl (accessed on 30 October 2021).
Conflicts of Interest
The authors declare no conflict of interest.
References
- Regulation (EU) 2019/1242 of the European Parliament and of the Council of 20 June 2019 Setting CO2 Emission Performance Standards for New Heavy-Duty Vehicles and Amending Regulations (EC) No 595/2009 and (EU) 2018/956 of the European Parliament and of the Council and Council Directive 96/53/EC. Available online: http://data.europa.eu/eli/reg/2019/1242/oj (accessed on 25 October 2021).
- Regulation (EU) 2019/631 of the European Parliament and of the Council of 17 April 2019 Setting CO2 Emission Performance Standards for New Passenger Cars and for New Light Commercial Vehicles, and Repealing Regulations (EC) No 443/2009 and (EU) No 510/2011. Available online: http://eur-lex.europa.eu/legal-content/EN/TXT/?uri=CELEX%3A32019R0631 (accessed on 25 October 2021).
- Proposal for a Regulation of the European Parliament and of the Council Amending Regulation (EU) 2019/631 as Regards Strengthening the CO2 Emission Performance Standards for New Passenger Cars and New Light Commercial Vehicles in Line with the Union’s Increased Climate Ambition COM/2021/556 Final. Available online: https://eur-lex.europa.eu/legal-content/en/TXT/?uri=CELEX%3A52021PC0556 (accessed on 25 October 2021).
- Eurostat. Air Pollutants by Source Sector (Source: EEA). Available online: https://appsso.eurostat.ec.europa.eu/nui/show.do?dataset=env_air_emis&lang=en (accessed on 19 October 2021).
- System of Providing and Disseminating Information in Order to Support the Strategic Implementation of Climate Policy (LIFE Climate CAKE PL) Project. Available online: http://climatecake.pl (accessed on 20 October 2021).
- Barisa, A.; Rosa, M. Scenario analysis of CO2 emission reduction potential in road transport sector in Latvia. Energy Procedia 2018, 147, 86–95. [Google Scholar] [CrossRef]
- Talbi, B. CO2 emissions reduction in road transport sector in Tunisia. Renew. Sustain. Energy Rev. 2017, 69, 232–238. [Google Scholar] [CrossRef]
- Karkatsoulis, P.; Siskos, P.; Paroussos, L.; Capros, P. Simulating deep CO2 emission reduction in transport in a general equilibrium framework: The GEM-E3T model. Transp. Res. Part D Transp. Environ. 2017, 55, 343–358. [Google Scholar] [CrossRef]
- Siskos, P.; Moysoglou, Y. Assessing the impacts of setting CO2 emission targets on truck manufacturers: A model implementation and application for the EU. Transp. Res. Part A Policy Pract. 2019, 125, 123–138. [Google Scholar] [CrossRef]
- Li, Y.; Du, Q.; Lu, X.; Wu, J.; Han, X. Relationship between the development and CO2 emissions of transport sector in China. Transp. Res. Part D Transp. Environ. 2019, 74, 1–14. [Google Scholar] [CrossRef]
- Schmidt, M.; Zmuda-Trzebiatowski, P.; Kiciński, M.; Sawicki, P.; Lasak, K. Multiple-Criteria-Based Electric Vehicle Charging Infrastructure Design Problem. Energies 2021, 14, 3214. [Google Scholar] [CrossRef]
- Jahangir Samet, M.; Liimatainen, H.; van Vliet, O.P.R.; Pöllänen, M. Road Freight Transport Electrification Potential by Using Battery Electric Trucks in Finland and Switzerland. Energies 2021, 14, 823. [Google Scholar] [CrossRef]
- Hacker, F.; Mottschall, M.; Jöhrens, J.; Helms, H.; Kräck, J.; Rücker, J. National and EU Freight Transport Strategies: Status Quo and Perspectives and Implications for the Introduction of Electric Road Systems (ERS). 2020. Available online: http://ri.diva-portal.org/smash/record.jsf?pid=diva2%3A1467128&dswid=5279 (accessed on 23 October 2021).
- Rose, P.K.; Neumann, F. Hydrogen refueling station networks for heavy-duty vehicles in future power systems. Transp. Res. Part D Transp. Environ. 2020, 83, 102358. [Google Scholar] [CrossRef]
- Agnolucci, P. Hydrogen infrastructure for the transport sector. Int. J. Hydrogen Energy 2007, 32, 3526–3544. [Google Scholar] [CrossRef]
- Jelica, D.; Taljegard, M.; Thorson, L.; Johnsson, F. Hourly electricity demand from an electric road system–A Swedish case study. Appl. Energy 2018, 228, 141–148. [Google Scholar] [CrossRef]
- Barton, J.; Huang, S.; Infield, D.; Leach, M.; Ogunkunle, D.; Torriti, J.; Thomson, M. The evolution of electricity demand and the role for demand side participation, in buildings and transport. Energy Policy 2013, 52, 85–102. [Google Scholar] [CrossRef] [Green Version]
- Navas-Anguita, Z.; García-Gusano, D.; Iribarren, D. Prospective Life Cycle Assessment of the Increased Electricity Demand Associated with the Penetration of Electric Vehicles in Spain. Energies 2018, 11, 1185. [Google Scholar] [CrossRef] [Green Version]
- Rahmouni, S.; Settou, N.; Negrou, B.; Gouareh, A. GIS-based method for future prospect of hydrogen demand in the Algerian road transport sector. Int. J. Hydrogen Energy 2016, 41, 2128–2143. [Google Scholar] [CrossRef]
- Lund, H.; Kempton, W. Integration of renewable energy into the transport and electricity sectors through V2G. Energy Policy 2008, 36, 3578–3587. [Google Scholar] [CrossRef]
- Oliveira, A.M.; Beswick, R.R.; Yan, Y. A green hydrogen economy for a renewable energy society. Curr. Opin. Chem. Eng. 2021, 33, 100701. [Google Scholar] [CrossRef]
- Michalski, J.; Poltrum, M.; Bünger, U. The role of renewable fuel supply in the transport sector in a future decarbonized energy system. Int. J. Hydrogen Energy 2019, 44, 12554–12565. [Google Scholar] [CrossRef]
- Caspani, M.; Hartving, A.; Stening, J. Potential Options and Technology Pathways for Delivering Zero-Carbon Freight in Poland. Available online: https://fppe.pl/perspektywy-elektryfikacji-samochodow-ciezarowych-i-dostawczych-w-polsce/ (accessed on 18 October 2021).
- Borowska-Stefańska, M.; Kowalski, M.; Kurzyk, P.; Mikušová, M.; Wiśniewski, S. Privileging Electric Vehicles as an Element of Promoting Sustainable Urban Mobility—Effects on the Local Transport System in a Large Metropolis in Poland. Energies 2021, 14, 3838. [Google Scholar] [CrossRef]
- Verma, S.; Dwivedi, G.; Verma, P. Life cycle assessment of electric vehicles in comparison to combustion engine vehicles: A review. Mater. Today Proc. 2021, in press. [Google Scholar] [CrossRef]
- Bartolozzi, I.; Rizzi, F.; Frey, M. Comparison between hydrogen and electric vehicles by life cycle assessment: A case study in Tuscany, Italy. Appl. Energy 2013, 101, 103–111. [Google Scholar] [CrossRef]
- Zheng, J.; Zhou, Y.; Yu, R.; Zhao, D.; Lu, Z.; Zhang, P. Survival rate of China passenger vehicles: A data-driven approach. Energy Policy 2019, 129, 587–597. [Google Scholar] [CrossRef]
- Kagawa, S.; Nansai, K.; Kondo, Y.; Hubacek, K.; Suh, S.; Minx, J.; Kudoh, Y.; Tasaki, T.; Nakamura, S. Role of Motor Vehicle Lifetime Extension in Climate Policy. Environ. Sci. Technol. 2011, 45, 1184–1191. [Google Scholar] [CrossRef] [PubMed]
- Rabiega, W.; Sikora, P. Ścieżki Redukcji Emisji CO2 w Sektorze Transportu w Polsce w Kontekście Europejskiego Zielonego Ładu; Institute of Environmental Protection—National Research Institute/National Centre for Emissions Management (KOBiZE): Warsaw, Poland, 2020; Available online: https://climatecake.ios.edu.pl/wp-content/uploads/2020/10/%C5%9Acie%C5%BCki-redukcji-emisji-CO2-w-sektorze-transportu-w-PL-w-kontek%C5%9Bcie-Europejskiego-Zielonego-%C5%81adu.pdf (accessed on 11 October 2021).
- Eurostat. Average CO2 Emissions per km from New Passenger Cars. Available online: https://ec.europa.eu/eurostat/databrowser/view/sdg_12_30/default/table?lang=en (accessed on 27 October 2021).
- Rabiega, W.; Sikora, P.; Gąska, J. The TR3E Model, Ver.1.0; Institute of Environmental Protection—National Research Institute/National Centre for Emissions Management (KOBiZE): Warsaw, Poland, 2020; Available online: https://climatecake.ios.edu.pl/wp-content/uploads/2020/05/CAKE_TR3E_documentation.pdf (accessed on 11 October 2021).
- Local Data Bank. Available online: www.bdl.stat.gov.pl (accessed on 30 October 2021).
- Techno-Economic Assumptions of the PRIMES-TREMOVE Transport Model. Available online: https://ec.europa.eu/energy/data-analysis/energy-modelling/eu-reference-scenario-2020_en (accessed on 30 October 2021).
- International Energy Agency. World Energy Outlook 2017, Paris. 2018. Available online: https://www.iea.org (accessed on 29 October 2021).
- Mantzos, L.; Wiesenthal, T.; Neuwahl, F.; Rózsai, M. (2019): POTEnCIA Central-2018 Scenario. European Commission, Joint Research Centre (JRC) [Dataset] PID. Available online: http://data.europa.eu/89h/3182c195-a1fc-46cf-8e7d-44063d9483d8 (accessed on 22 October 2021).
- Okagawa, A.; Ban, K. Estimation of Substitution Elasticities for CGE Models; Discussion Paper 08–16; Osaka University: Suita, Japan, 2008. [Google Scholar]
- Rutherford, T. Lecture Notes on Constant Elasticity Functions; University of Colorado: Boulder, CO, USA, 2002. [Google Scholar]
- Ben-Akiva, M.E.; Lerman, S.R. Discrete Choice Analysis: Theory and Application to Travel Demand; MIT Press: Cambridge, MA, USA, 1985; Volume 9. [Google Scholar]
- De Ceuster, G. Tremove–Final Report; Transport & Mobility Leuven: Leuven, Belgium, 2007. [Google Scholar]
- Barnes, G.; Langworthy, P. Per mile costs of operating automobiles and trucks. Transp. Res. Record 2004, 1864, 71–77. [Google Scholar] [CrossRef] [Green Version]
- El-Gohary, A.; Alshamrani, A.; Al-Otaibi, A.N. The generalized Gompertz distribution. Appl. Math. Model. 2013, 37, 13–24. [Google Scholar] [CrossRef] [Green Version]
- Wilson, D.L. The analysis of survival (mortality) data: Fitting Gompertz, Weibull, and logistic functions. Mech. Ageing Dev. 1994, 74, 15–33. [Google Scholar] [CrossRef]
- Dun, C.; Horton, G.; Kollamthodi, S. Improvements to the Definition of Lifetime Mileage of Light Duty Vehicles; Ricardo-AEA: London, UK, 2015. [Google Scholar]
- Communication from the Commission to the European Parliament, the European Council, the Council, the European Economic and Social Committee, the Committee of the Regions and the European Investment Bank a Clean Planet for all a European Strategic Long-Term Vision for a Prosperous, Modern, Competitive and Climate Neutral Economy. Available online: https://eur-lex.europa.eu/legal-content/EN/TXT/?uri=CELEX%3A52018DC0773 (accessed on 13 October 2021).
- Capros, P.; De Vita, A.; Tasios, N.; Siskos, P.; Kannavou, M.; Petropoulos, A.; Kesting, M. EU Reference Scenario 2016-Energy, Transport and GHG Emissions Trends to 2050. Available online: http://pure.iiasa.ac.at/13656 (accessed on 31 October 2021).
- Mantzos, L.; Wiesenthal, T.; Neuwahl, F.; Rozsai, M. The POTEnCIA Central Scenario: An EU Energy Outlook to 2050; JRC Working Papers JRC118353; Joint Research Centre (Seville Site): 2019. Available online: https://ideas.repec.org/p/ipt/iptwpa/jrc118353.html (accessed on 14 October 2021).
- Keramidas, K.; Fosse, F.; Diaz Vazquez, A.; Schade, B.; Tchung-Ming, S.; Weitzel, M.; Vandyck, T.; Wojtowicz, K. Global Energy and Climate Outlook 2020: A New Normal Beyond COVID-19, EUR 30558 EN; Publications Office of the European Union: Luxembourg, 2021; ISBN 978-92-76-28417-8. [Google Scholar] [CrossRef]
- Regulation (EU) 2018/842 of the European Parliament and of the Council of 30 May 2018 on Binding Annual Greenhouse Gas Emission Reductions by Member States from 2021 to 2030 Contributing to Climate Action to Meet Commitments under the Paris Agreement and Amending Regulation (EU) No 525/2013 (Text with EEA Relevance). Available online: http://data.europa.eu/eli/reg/2018/842/oj (accessed on 13 October 2021).
- Gąska, J.; Pyrka, M.; Rabiega, W.; Jeszke, R. The CGE Model d-PLACE, Ver.1.0; Institute of Environmental Protection—National Research Institute/National Centre for Emissions Management (KOBiZE): Warsaw, Poland, 2020; Available online: http://climatecake.pl/wp-content/uploads/2020/05/CAKE_d-PLACE_model_documentation-1.pdf (accessed on 14 October 2021).
- Papadimitriou, G. Transport Data Collection Supporting the Quantitative Analysis of Measures Relating to Transport and Climate Change (TRACCS); Final Report; December 2013. Available online: https://traccs.emisia.com/ (accessed on 20 October 2021).
- Pyrka, M.; Jeszke, R.; Boratyński, J.; Tatarewicz, I.; Witajewski-Baltvilks, J.; Rabiega, W.; Wąs, A.; Kobus, P.; Lewarski, M.; Skwierz, S.; et al. Mapa Drogowa Osiągnięcia Wspólnotowych Celów Polityki Klimatycznej dla Polski do 2050 r; Instytut Ochrony Środowiska—Państwowy Instytut Badawczy/Krajowy Ośrodek Bilansowania i Zarządzania Emisjami (KOBiZE): Warszawa, Poland, 2021; Available online: https://climatecake.ios.edu.pl/wp-content/uploads/2021/07/CAKE_Mapa-drogowa-net-zero-dla-PL.pdf (accessed on 12 October 2021).
- Tatarewicz, I.; Lewarski, M.; Skwierz, S. The Model for European Energy System Analysis—MEESA Ver. 1.0; Institute of Environmental Protection—National Research Institute/National Centre for Emissions Management (KOBiZE): Warsaw, Poland, 2020; Available online: https://climatecake.ios.edu.pl/wp-content/uploads/2020/05/CAKE_MEESA_energy-model_documentation.pdf (accessed on 14 October 2021).
- Goswami, M.; De, A.; Habibi, M.K.; Daultani, Y. Examining freight performance of third-party logistics providers within the automotive industry in India: An environmental sustainability perspective. Int. J. Prod. Res. 2020, 58, 7565–7592. [Google Scholar] [CrossRef]
- Choudhary, A.; De, A.; Ahmed, K.; Shankar, R. An integrated fuzzy intuitionistic sustainability assessment framework for manufacturing supply chain: A study of UK based firms. Ann. Oper. Res. 2021, 1–44. [Google Scholar] [CrossRef]
- Ray, A.; De, A.; Mondal, S.; Wang, J. Selection of best buyback strategy for original equipment manufacturer and independent remanufacturer–game theoretic approach. Int. J. Prod. Res. 2021, 59, 5495–5524. [Google Scholar] [CrossRef]
- Goswami, M.; Daultani, Y.; De, A. Decision modeling and analysis in new product development considering supply chain uncertainties: A multi-functional expert based approach. Expert Syst. Appl. 2021, 166, 114016. [Google Scholar] [CrossRef]
- Ang, B.W. Decomposition analysis for policymaking in energy: Which is the preferred method? Energy Policy 2004, 32, 1131–1139. [Google Scholar] [CrossRef]
- Ang, B.W. LMDI decomposition approach: A guide for implementation. Energy Policy 2015, 86, 233–238. [Google Scholar] [CrossRef]
- Technical Note Delivering the European Green Deal, Results of the “Fit for 55” Core Policy Scenarios for the EU Member States. Available online: https://ec.europa.eu/energy/sites/default/files/technical_note_on_the_ff55_core_policy_scenarios.pdf (accessed on 18 October 2021).
Figure 1.
Logic of the TR3E transport model. Source: own elaboration.

Figure 2.
Passenger transport decision tree. Source: Own elaboration see also [28].
Figure 2.
Passenger transport decision tree. Source: Own elaboration see also [28].

Figure 3.
Freight transport decision tree. Source: own elaboration see [28].
Figure 3.
Freight transport decision tree. Source: own elaboration see [28].

Figure 4.
Survival rates for passenger and freight transport (depending on the age of vehicles). Source: own calculations based on TR3E model results.
Figure 4.
Survival rates for passenger and freight transport (depending on the age of vehicles). Source: own calculations based on TR3E model results.

Figure 5.
Passenger road transport activity in Poland in the years 2020–2050 [in pkm]. Source: own calculations based on TR3E model results.
Figure 5.
Passenger road transport activity in Poland in the years 2020–2050 [in pkm]. Source: own calculations based on TR3E model results.

Figure 6.
Freight road transport activity in Poland in the years 2020–2050 [in tkm]. Source: own calculations based on TR3E model results.
Figure 6.
Freight road transport activity in Poland in the years 2020–2050 [in tkm]. Source: own calculations based on TR3E model results.

Figure 7.
Structure of passenger cars in Poland in the years 2020–2050 by engine type [NEU scenario]. Source: own calculations based on TR3E model results.
Figure 7.
Structure of passenger cars in Poland in the years 2020–2050 by engine type [NEU scenario]. Source: own calculations based on TR3E model results.

Figure 8.
Structure of buses in Poland in the years 2020–2050 by engine type [NEU scenario]. Source: own calculations based on TR3E model results.
Figure 8.
Structure of buses in Poland in the years 2020–2050 by engine type [NEU scenario]. Source: own calculations based on TR3E model results.

Figure 9.
Structure of light duty vehicles (LDV’s) in Poland in the years 2020–2050 by engine type [NEU scenario]. Source: own calculations based on TR3E model results.
Figure 9.
Structure of light duty vehicles (LDV’s) in Poland in the years 2020–2050 by engine type [NEU scenario]. Source: own calculations based on TR3E model results.

Figure 10.
Structure of heavy duty vehicles (HDV’s) in Poland in the years 2020–2050 by engine type [NEU scenario]. Source: own calculations based on TR3E model results.
Figure 10.
Structure of heavy duty vehicles (HDV’s) in Poland in the years 2020–2050 by engine type [NEU scenario]. Source: own calculations based on TR3E model results.

Figure 11.
Reduction of CO2 emissions in Polish road transport (passenger and freight) in the years 2020–2050 [Mt CO2] [NEU scenario]. Source: own calculations based on TR3E model results.
Figure 11.
Reduction of CO2 emissions in Polish road transport (passenger and freight) in the years 2020–2050 [Mt CO2] [NEU scenario]. Source: own calculations based on TR3E model results.

Figure 12.
Structure changes of CO2 emissions in Polish road transport in the years 2020–2050 [NEU scenario]. Source: own calculations based on TR3E model results.
Figure 12.
Structure changes of CO2 emissions in Polish road transport in the years 2020–2050 [NEU scenario]. Source: own calculations based on TR3E model results.

Figure 13.
Electricity demand in passenger transport (electric cars and buses) and in freight transport (LDV’s, HDV’s) [NEU scenario] [TWh]. Source: own calculations based on TR3E model results.
Figure 13.
Electricity demand in passenger transport (electric cars and buses) and in freight transport (LDV’s, HDV’s) [NEU scenario] [TWh]. Source: own calculations based on TR3E model results.

Figure 14.
Hydrogen demand in passenger transport (cars and buses) and in freight transport (HDV’s) [NEU scenario] [kt]. Source: own calculations based on TR3E model results.
Figure 14.
Hydrogen demand in passenger transport (cars and buses) and in freight transport (HDV’s) [NEU scenario] [kt]. Source: own calculations based on TR3E model results.

Figure 15.
New passenger cars fleet in Poland [NEU scenario]. Source: own calculations based on TR3E model results.
Figure 15.
New passenger cars fleet in Poland [NEU scenario]. Source: own calculations based on TR3E model results.

Figure 16.
Decomposition of CO2 emissions changes in Poland. Source: own calculations based on TR3E model results.
Figure 16.
Decomposition of CO2 emissions changes in Poland. Source: own calculations based on TR3E model results.

Publisher’s Note: MDPI stays neutral with regard to jurisdictional claims in published maps and institutional affiliations. |
© 2021 by the authors. Licensee MDPI, Basel, Switzerland. This article is an open access article distributed under the terms and conditions of the Creative Commons Attribution (CC BY) license (https://creativecommons.org/licenses/by/4.0/).
Share and Cite
MDPI and ACS Style
Rabiega, W.; Gorzałczyński, A.; Jeszke, R.; Mzyk, P.; Szczepański, K. How Long Will Combustion Vehicles Be Used? Polish Transport Sector on the Pathway to Climate Neutrality. Energies 2021, 14, 7871. https://doi.org/10.3390/en14237871
AMA Style
Rabiega W, Gorzałczyński A, Jeszke R, Mzyk P, Szczepański K. How Long Will Combustion Vehicles Be Used? Polish Transport Sector on the Pathway to Climate Neutrality. Energies. 2021; 14(23):7871. https://doi.org/10.3390/en14237871
Chicago/Turabian StyleRabiega, Wojciech, Artur Gorzałczyński, Robert Jeszke, Paweł Mzyk, and Krystian Szczepański. 2021. "How Long Will Combustion Vehicles Be Used? Polish Transport Sector on the Pathway to Climate Neutrality" Energies 14, no. 23: 7871. https://doi.org/10.3390/en14237871
Note that from the first issue of 2016, this journal uses article numbers instead of page numbers. See further details here.